diagnosing fixing mysql performance 100412151709 phpapp01
TRANSCRIPT

8/8/2019 Diagnosing Fixing Mysql Performance 100412151709 Phpapp01
http://slidepdf.com/reader/full/diagnosing-fixing-mysql-performance-100412151709-phpapp01 1/198
Diagnosing and Fixing
MySQL Performance Problems
Percona, Inc.
http://www.percona.com/
1
Monday, April 12, 2010
8/8/2019 Diagnosing Fixing Mysql Performance 100412151709 Phpapp01
http://slidepdf.com/reader/full/diagnosing-fixing-mysql-performance-100412151709-phpapp01 2/198
Table Of Contents
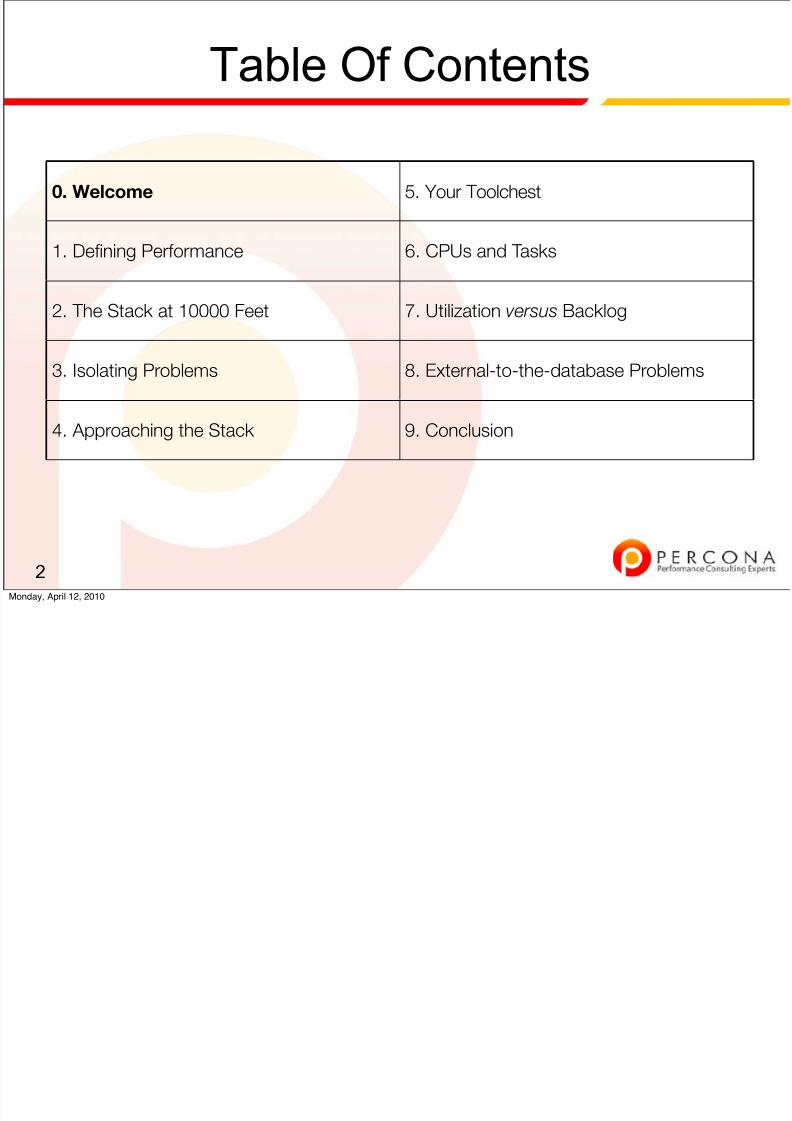
0. Welcome 5. Your Toolchest
1. Defining Performance 6. CPUs and Tasks
2. The Stack at 10000 Feet 7. Utilization versus Backlog
3. Isolating Problems 8. External-to-the-database Problems
4. Approaching the Stack 9. Conclusion
2Monday, April 12, 2010

8/8/2019 Diagnosing Fixing Mysql Performance 100412151709 Phpapp01
http://slidepdf.com/reader/full/diagnosing-fixing-mysql-performance-100412151709-phpapp01 3/198
Introduction
★ Welcome Everybody!
★ Your hosts for the next 3 1/2 hours are @xaprb and
@morgo from @percona.
3Monday, April 12, 2010

8/8/2019 Diagnosing Fixing Mysql Performance 100412151709 Phpapp01
http://slidepdf.com/reader/full/diagnosing-fixing-mysql-performance-100412151709-phpapp01 4/198
House Keeping
★ Restrooms? -> Leave if you need to.
★ Questions? -> Ask at any time.
★ Heckling? -> There will be a prize for the best heckle.
★ Lunch is at noon. We’ll also be planning on taking one
short break in between.
4Monday, April 12, 2010

8/8/2019 Diagnosing Fixing Mysql Performance 100412151709 Phpapp01
http://slidepdf.com/reader/full/diagnosing-fixing-mysql-performance-100412151709-phpapp01 5/198
Wifi / Power?!
★ Everyone connected, are the wifi instructions posted?
★ Be kind to your neighbour - share the power strips in the
room.
5Monday, April 12, 2010

8/8/2019 Diagnosing Fixing Mysql Performance 100412151709 Phpapp01
http://slidepdf.com/reader/full/diagnosing-fixing-mysql-performance-100412151709-phpapp01 6/198
Where does this talk come from?
★ If you’re curious - this presentation does not use the
same slide deck at our training.
★ We’ve prepared it fresh for this conference.
6Monday, April 12, 2010

8/8/2019 Diagnosing Fixing Mysql Performance 100412151709 Phpapp01
http://slidepdf.com/reader/full/diagnosing-fixing-mysql-performance-100412151709-phpapp01 7/198
Can we get a show of hands:
★ MySQL 5 / MySQL 5.1 / Something else?
★ Linux / Windows / Solaris / BSD / Something else?
★ Oracle / SQL Server experience?
★ What are you interested in knowing -✦ Problems you are currently having?✦ Weird things that happened you could never explain?✦
Something else?
7Monday, April 12, 2010

8/8/2019 Diagnosing Fixing Mysql Performance 100412151709 Phpapp01
http://slidepdf.com/reader/full/diagnosing-fixing-mysql-performance-100412151709-phpapp01 8/198
Can you have this slide deck?
★ We’ll give you the URL at the very end of the day.
★ Be careful to write it down!✦ O’Reilly doesn’t normally upload tutorial slides the same way
they do for conference sessions.
8Monday, April 12, 2010
8/8/2019 Diagnosing Fixing Mysql Performance 100412151709 Phpapp01
http://slidepdf.com/reader/full/diagnosing-fixing-mysql-performance-100412151709-phpapp01 9/198
Table Of Contents
9
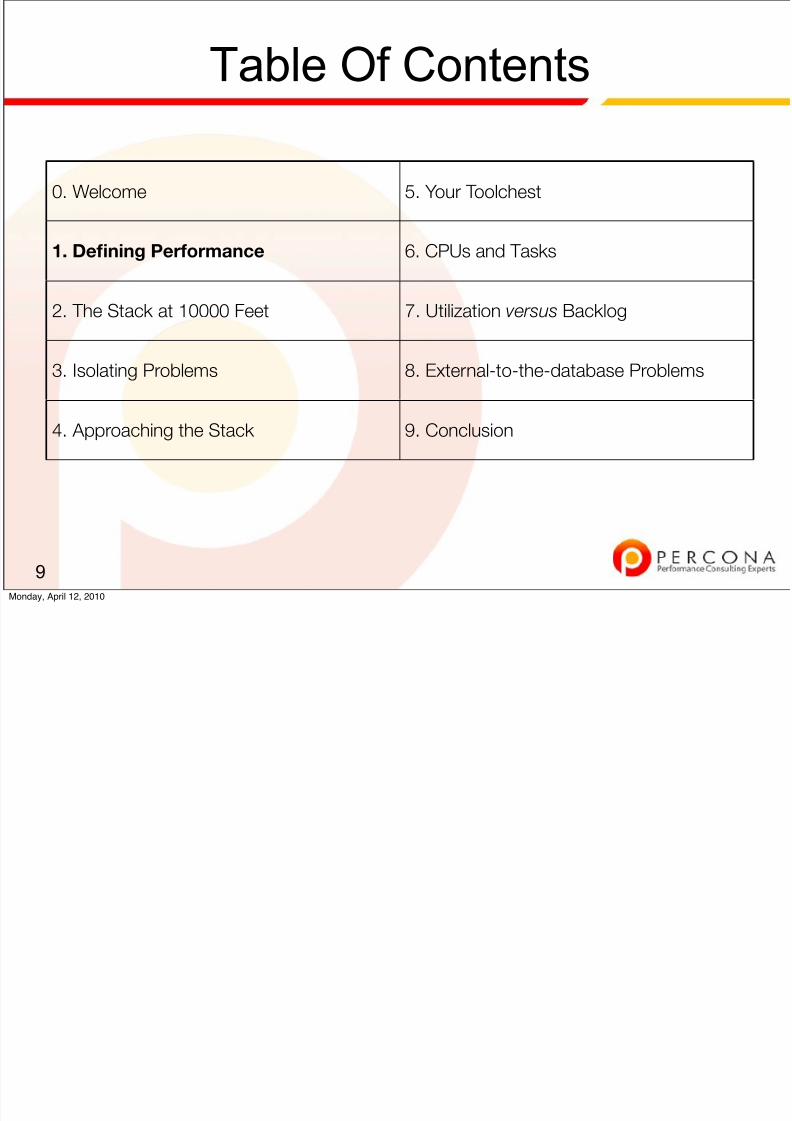
0. Welcome 5. Your Toolchest
1. Defining Performance 6. CPUs and Tasks
2. The Stack at 10000 Feet 7. Utilization versus Backlog
3. Isolating Problems 8. External-to-the-database Problems
4. Approaching the Stack 9. Conclusion
Monday, April 12, 2010

8/8/2019 Diagnosing Fixing Mysql Performance 100412151709 Phpapp01
http://slidepdf.com/reader/full/diagnosing-fixing-mysql-performance-100412151709-phpapp01 10/198
What about Performance?
★ Performance optimization should start with a goal.
★ That goal can be to -✦ Improve time for users?✦
Reduce load?✦ Grow the service?
10Monday, April 12, 2010

8/8/2019 Diagnosing Fixing Mysql Performance 100412151709 Phpapp01
http://slidepdf.com/reader/full/diagnosing-fixing-mysql-performance-100412151709-phpapp01 11/198
What performance is not:
★ CPU Usage
★ Memory Usage
★ Load Average
11Monday, April 12, 2010
8/8/2019 Diagnosing Fixing Mysql Performance 100412151709 Phpapp01
http://slidepdf.com/reader/full/diagnosing-fixing-mysql-performance-100412151709-phpapp01 12/198
Performance is best measured as:
★ The response (R) time for a user’s task.
★ What is a task?✦ a unit of work ✦
a business unit of work ✦ something a user wants to do✦ some function of the application
12Monday, April 12, 2010
8/8/2019 Diagnosing Fixing Mysql Performance 100412151709 Phpapp01
http://slidepdf.com/reader/full/diagnosing-fixing-mysql-performance-100412151709-phpapp01 13/198
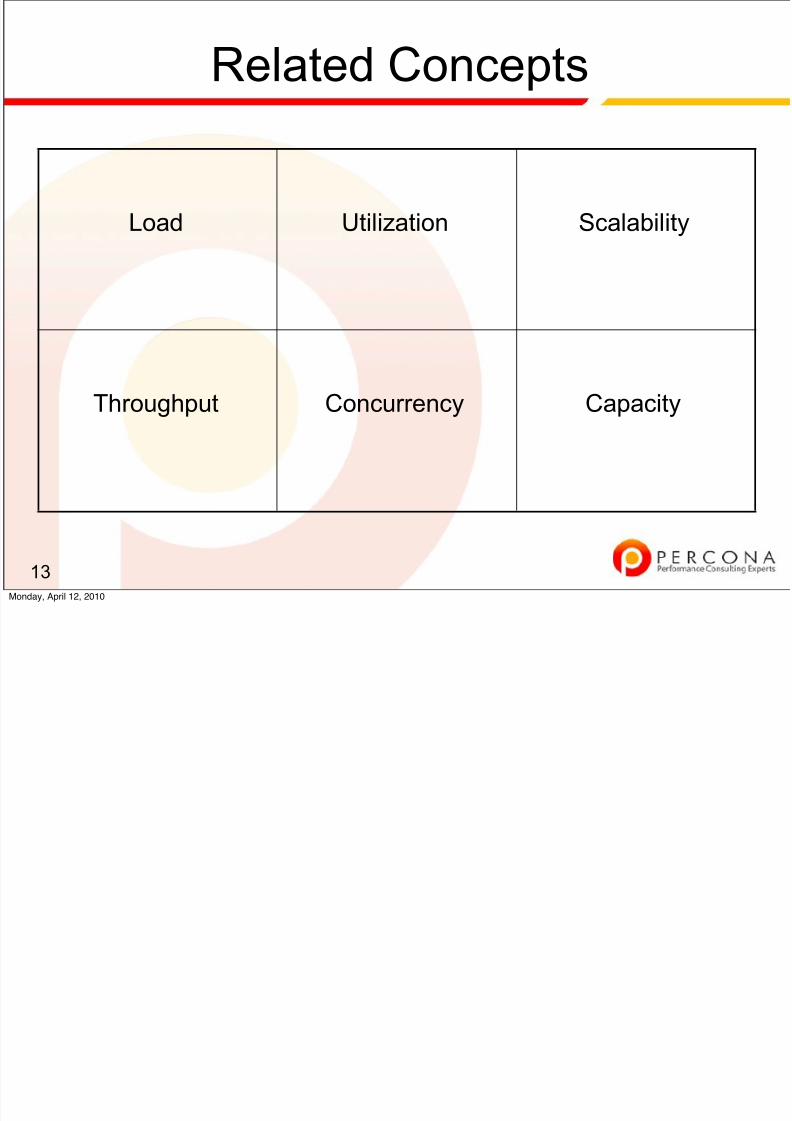
Related Concepts
13
Load Utilization Scalability
Throughput Concurrency Capacity
Monday, April 12, 2010
8/8/2019 Diagnosing Fixing Mysql Performance 100412151709 Phpapp01
http://slidepdf.com/reader/full/diagnosing-fixing-mysql-performance-100412151709-phpapp01 14/198
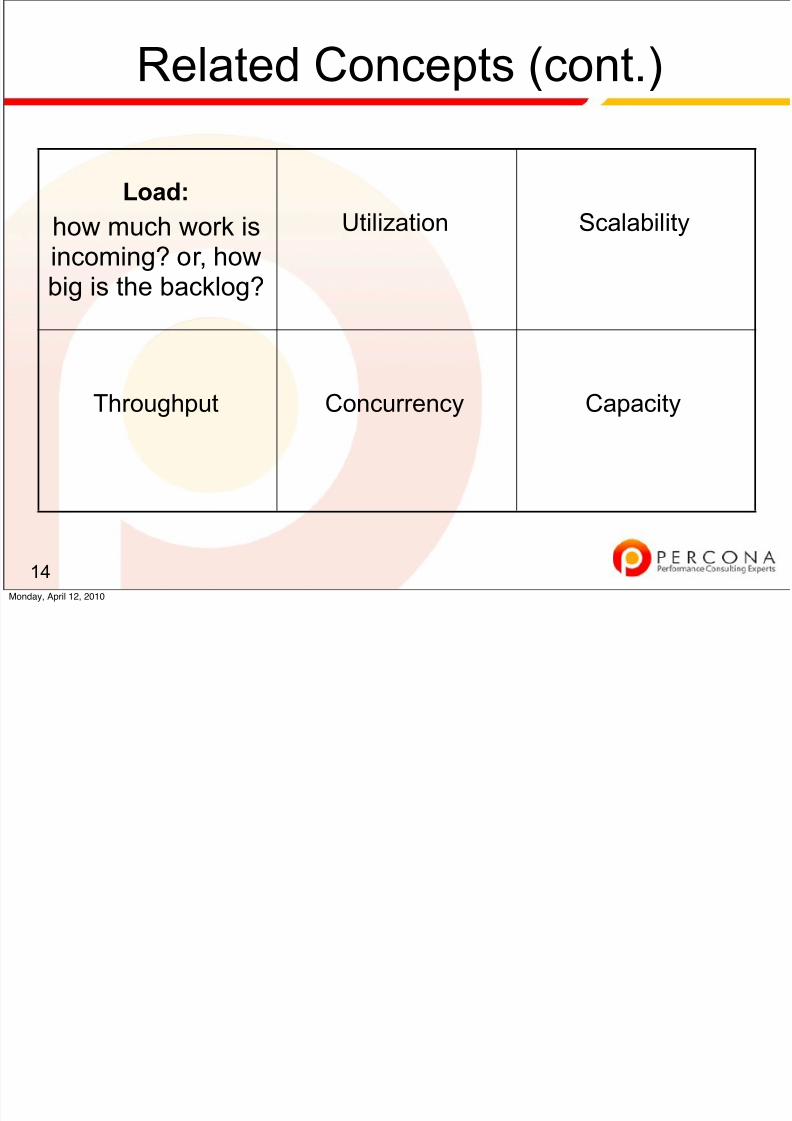
Related Concepts (cont.)
14
Load:
how much work isincoming? or, how
big is the backlog?
Utilization Scalability
Throughput Concurrency Capacity
Monday, April 12, 2010
8/8/2019 Diagnosing Fixing Mysql Performance 100412151709 Phpapp01
http://slidepdf.com/reader/full/diagnosing-fixing-mysql-performance-100412151709-phpapp01 15/198
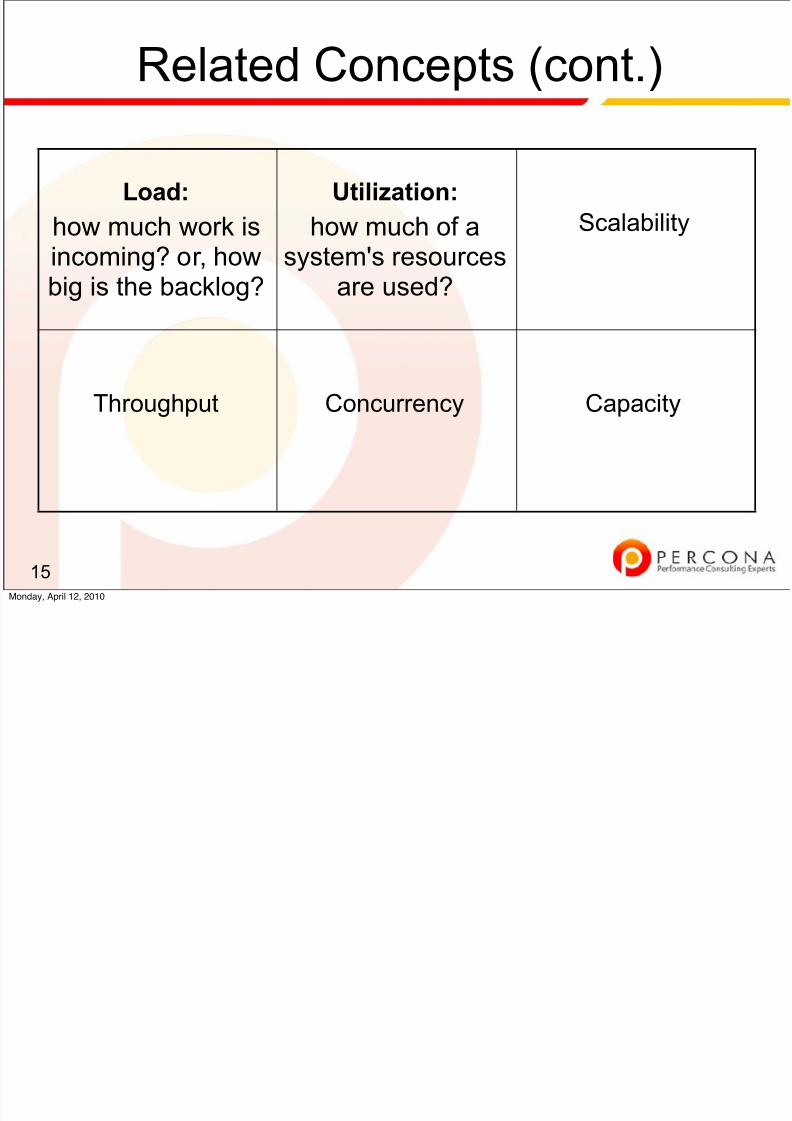
Related Concepts (cont.)
15
Load:
how much work isincoming? or, how
big is the backlog?
Utilization:
how much of asystem's resources
are used?
Scalability
Throughput Concurrency Capacity
Monday, April 12, 2010
8/8/2019 Diagnosing Fixing Mysql Performance 100412151709 Phpapp01
http://slidepdf.com/reader/full/diagnosing-fixing-mysql-performance-100412151709-phpapp01 16/198
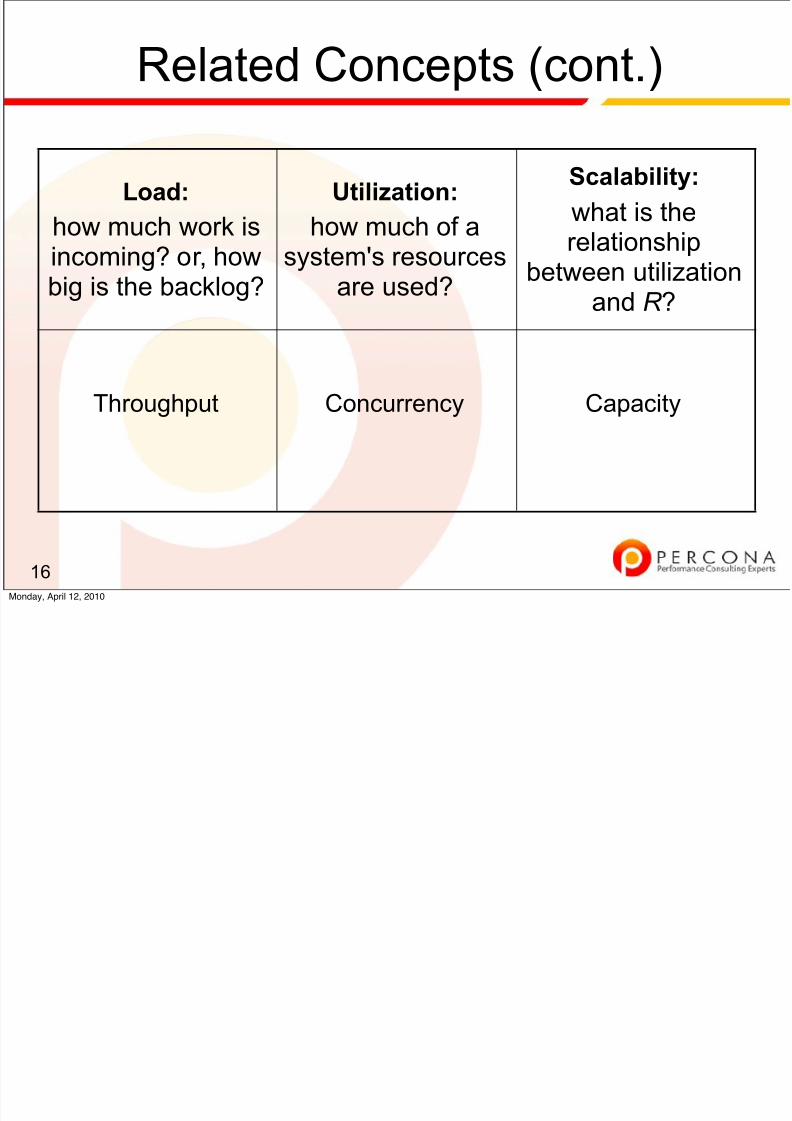
Related Concepts (cont.)
16
Load:
how much work isincoming? or, how
big is the backlog?
Utilization:
how much of asystem's resources
are used?
Scalability:
what is therelationship
between utilizationand R ?
Throughput Concurrency Capacity
Monday, April 12, 2010
8/8/2019 Diagnosing Fixing Mysql Performance 100412151709 Phpapp01
http://slidepdf.com/reader/full/diagnosing-fixing-mysql-performance-100412151709-phpapp01 17/198
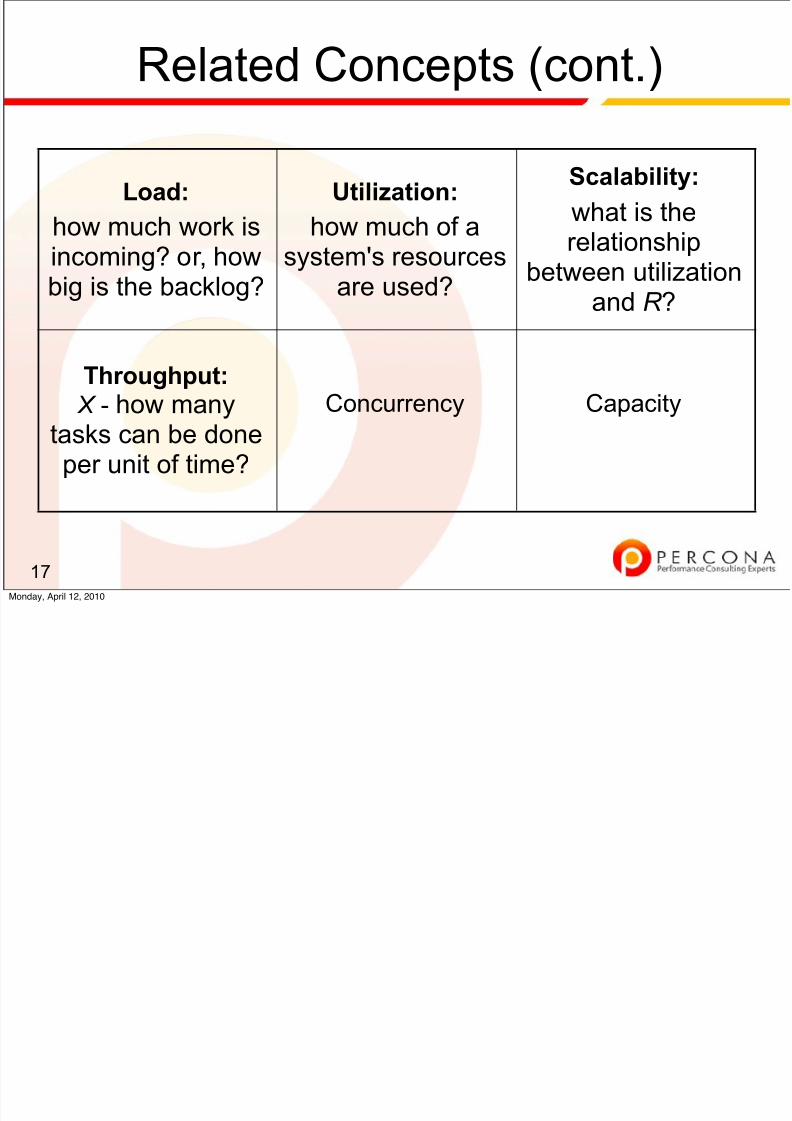
Related Concepts (cont.)
17
Load:
how much work isincoming? or, how
big is the backlog?
Utilization:
how much of asystem's resources
are used?
Scalability:
what is therelationship
between utilizationand R ?
Throughput:
X - how manytasks can be doneper unit of time?
Concurrency Capacity
Monday, April 12, 2010
8/8/2019 Diagnosing Fixing Mysql Performance 100412151709 Phpapp01
http://slidepdf.com/reader/full/diagnosing-fixing-mysql-performance-100412151709-phpapp01 18/198
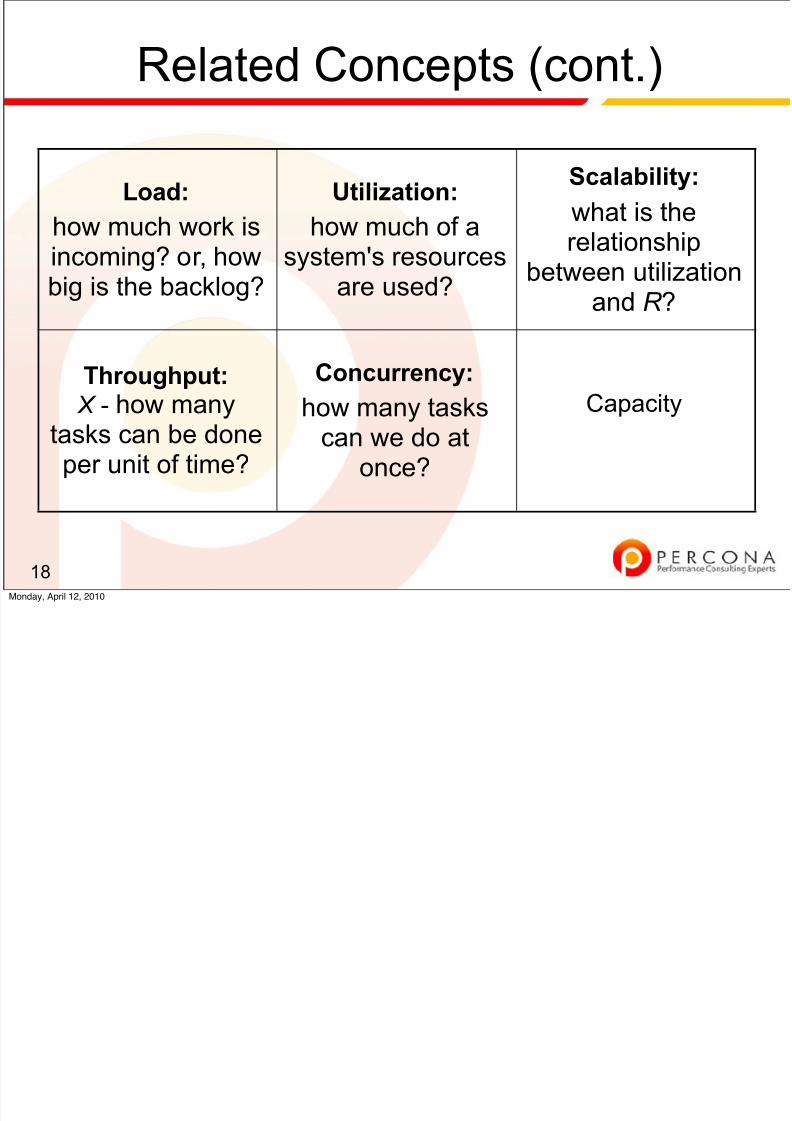
Related Concepts (cont.)
18
Load:
how much work isincoming? or, how
big is the backlog?
Utilization:
how much of asystem's resources
are used?
Scalability:
what is therelationship
between utilizationand R ?
Throughput:
X - how manytasks can be doneper unit of time?
Concurrency:
how many taskscan we do atonce?
Capacity
Monday, April 12, 2010
8/8/2019 Diagnosing Fixing Mysql Performance 100412151709 Phpapp01
http://slidepdf.com/reader/full/diagnosing-fixing-mysql-performance-100412151709-phpapp01 19/198
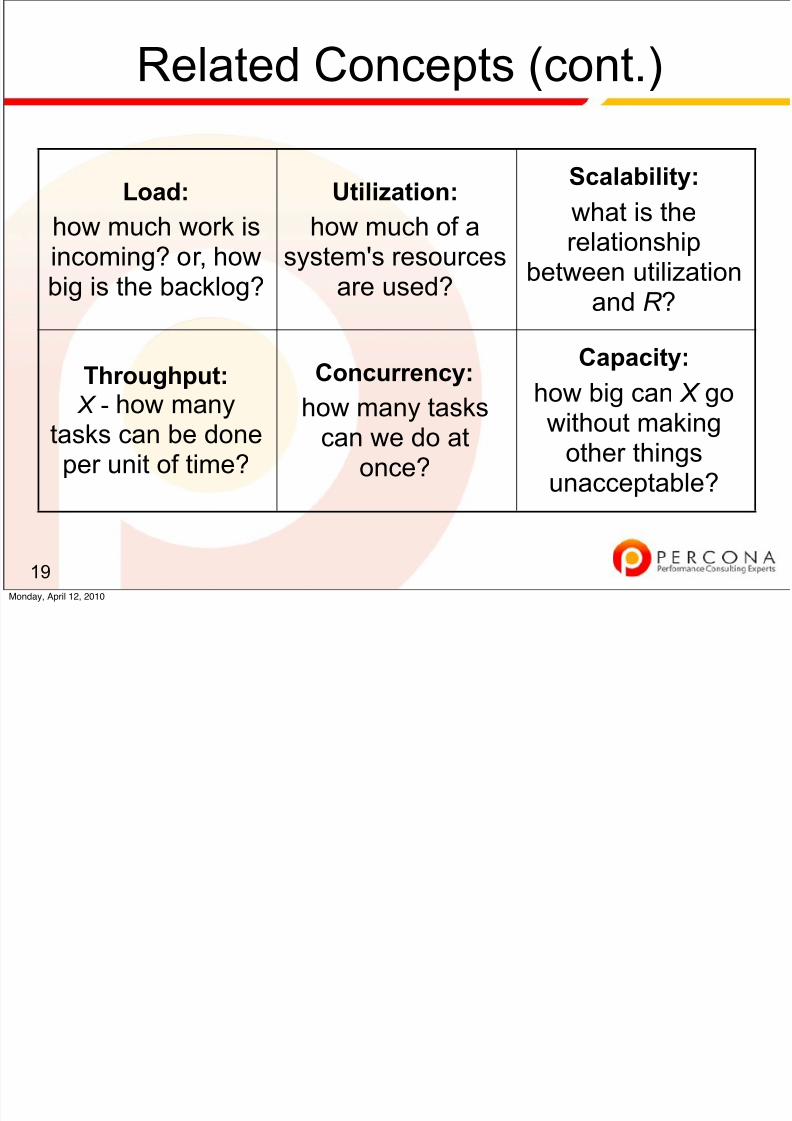
Related Concepts (cont.)
19
Load:
how much work isincoming? or, how
big is the backlog?
Utilization:
how much of asystem's resources
are used?
Scalability:
what is therelationship
between utilizationand R ?
Throughput:
X - how manytasks can be doneper unit of time?
Concurrency:
how many taskscan we do atonce?
Capacity:
how big can X go
without makingother things
unacceptable?
Monday, April 12, 2010

8/8/2019 Diagnosing Fixing Mysql Performance 100412151709 Phpapp01
http://slidepdf.com/reader/full/diagnosing-fixing-mysql-performance-100412151709-phpapp01 20/198
8/8/2019 Diagnosing Fixing Mysql Performance 100412151709 Phpapp01
http://slidepdf.com/reader/full/diagnosing-fixing-mysql-performance-100412151709-phpapp01 21/198
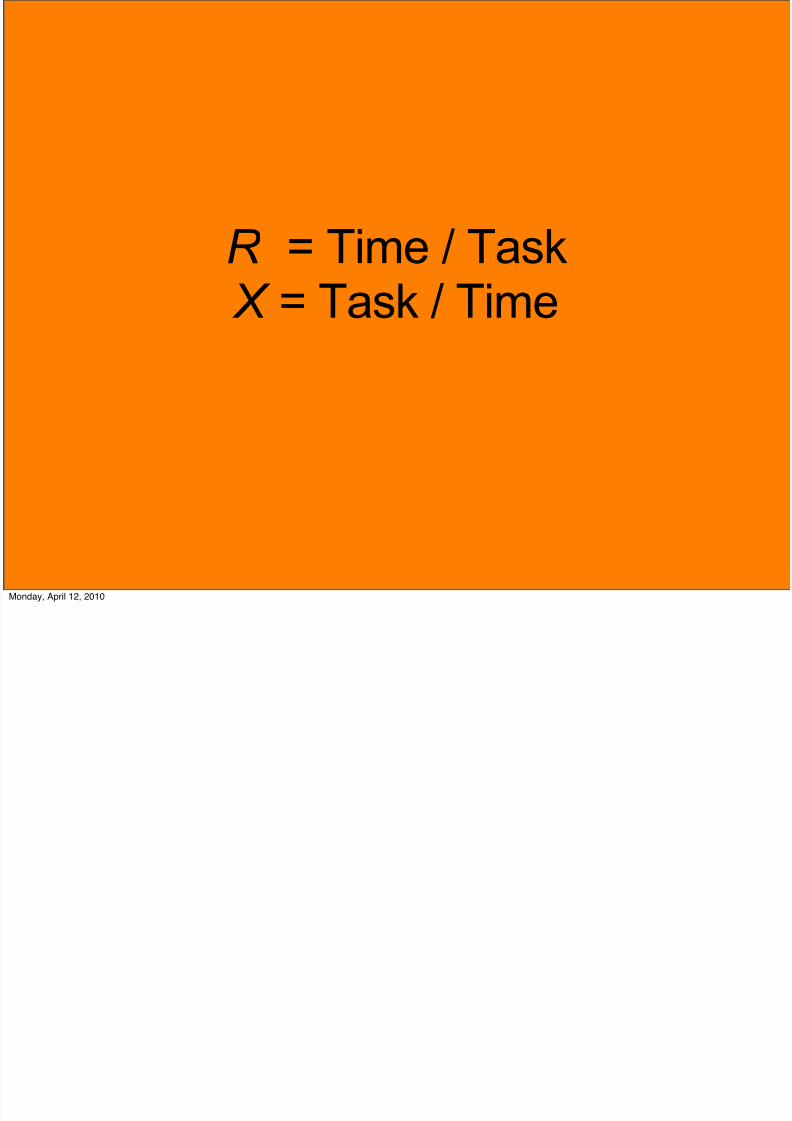
R = Time / Task X = Task / Time
Monday, April 12, 2010

8/8/2019 Diagnosing Fixing Mysql Performance 100412151709 Phpapp01
http://slidepdf.com/reader/full/diagnosing-fixing-mysql-performance-100412151709-phpapp01 22/198
Why Throughput != Performance
★ Big Niagara machines with many
cores, each of them very slow.✦ Also not reciprocal of performance,
because....
22
Sun T2000. Photo Credit:http://www.flickr.com/photos/clonedmilkmen/310565533/
Monday, April 12, 2010
8/8/2019 Diagnosing Fixing Mysql Performance 100412151709 Phpapp01
http://slidepdf.com/reader/full/diagnosing-fixing-mysql-performance-100412151709-phpapp01 23/198
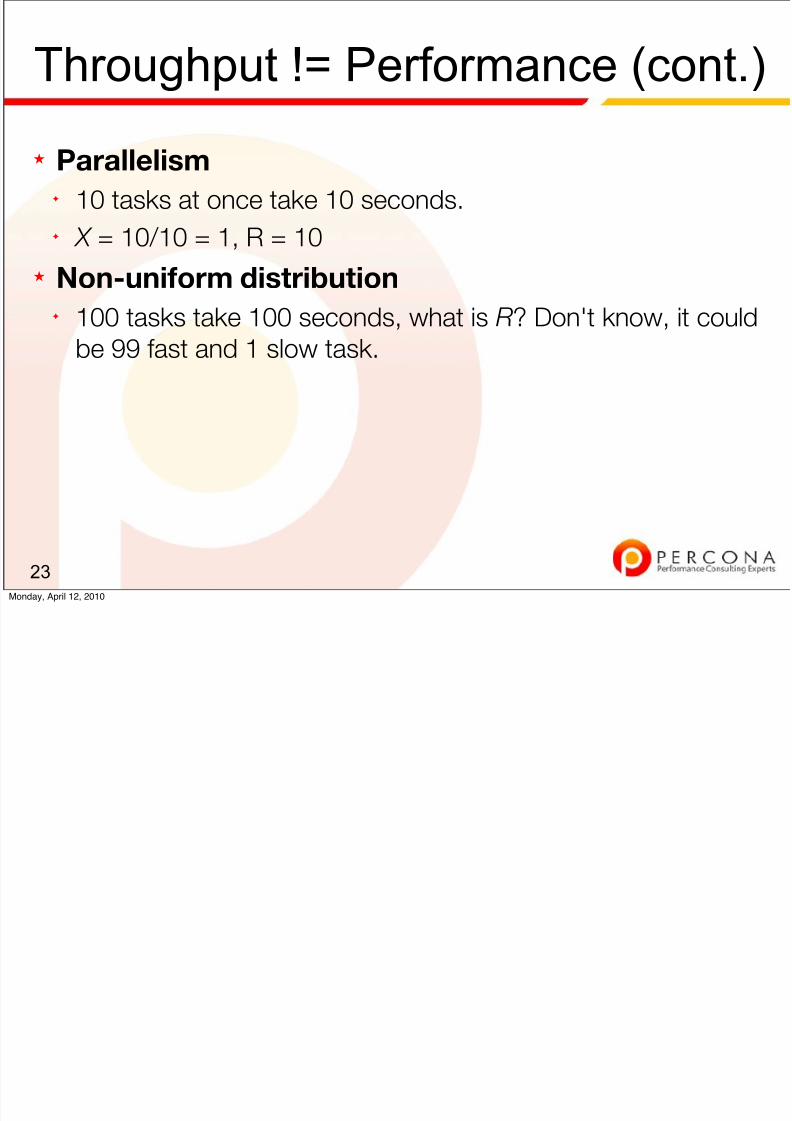
Throughput != Performance (cont.)
★ Parallelism✦ 10 tasks at once take 10 seconds.✦ X = 10/10 = 1, R = 10
★ Non-uniform distribution✦ 100 tasks take 100 seconds, what is R? Don't know, it could
be 99 fast and 1 slow task.
23Monday, April 12, 2010

8/8/2019 Diagnosing Fixing Mysql Performance 100412151709 Phpapp01
http://slidepdf.com/reader/full/diagnosing-fixing-mysql-performance-100412151709-phpapp01 24/198
What is important...
★ Is the relationship between throughput, utilization,
response time and capacity.
★ Queuing may occur:✦
R is the combination of service time and wait time.
24Monday, April 12, 2010

8/8/2019 Diagnosing Fixing Mysql Performance 100412151709 Phpapp01
http://slidepdf.com/reader/full/diagnosing-fixing-mysql-performance-100412151709-phpapp01 25/198
What to take away:
★ Above all, focus on time.✦ For performance optimization, reduce time spent waiting for
response.✦
For load reduction, reduce total time consumed by the task.
25Monday, April 12, 2010
8/8/2019 Diagnosing Fixing Mysql Performance 100412151709 Phpapp01
http://slidepdf.com/reader/full/diagnosing-fixing-mysql-performance-100412151709-phpapp01 26/198
Table Of Contents
26
0. Welcome 5. Your Toolchest
1. Defining Performance 6. CPUs and Tasks
2. The Stack at 10000 Feet 7. Utilization versus Backlog
3. Isolating Problems 8. External-to-the-database Problems
4. Approaching the Stack 9. Conclusion
Monday, April 12, 2010
8/8/2019 Diagnosing Fixing Mysql Performance 100412151709 Phpapp01
http://slidepdf.com/reader/full/diagnosing-fixing-mysql-performance-100412151709-phpapp01 27/198
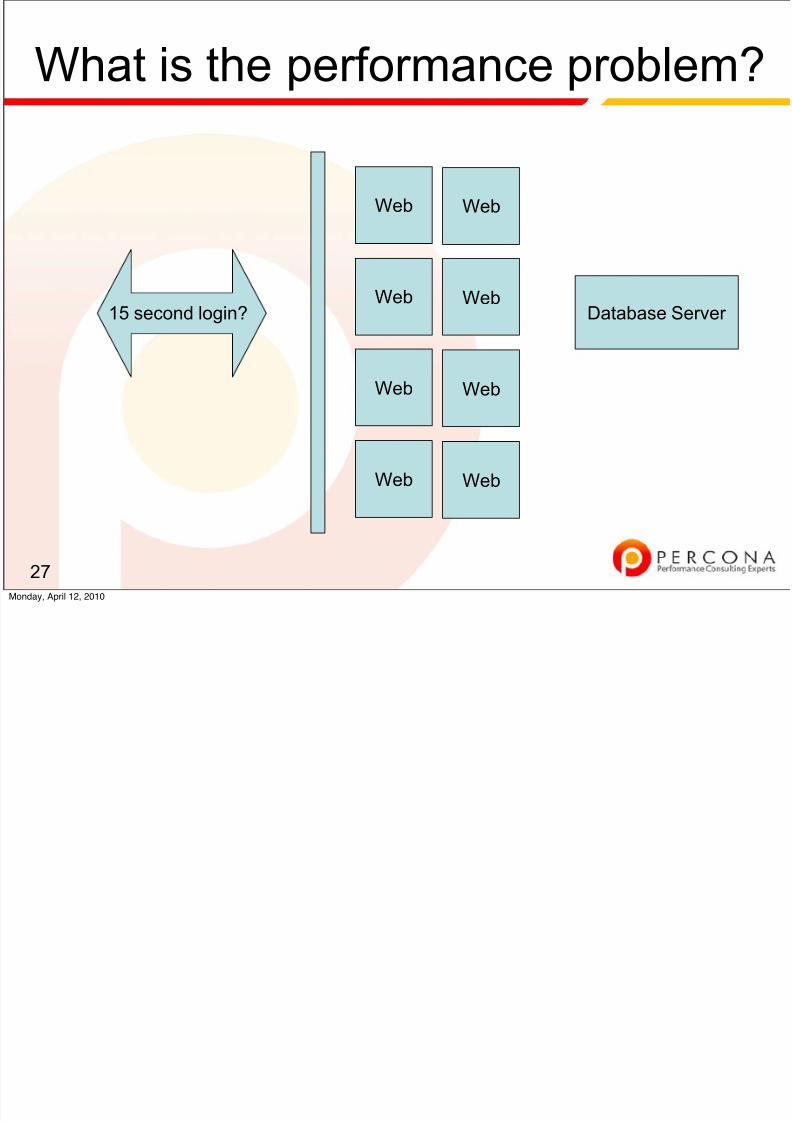
What is the performance problem?
27
Web
Web
Web
Database Server
Web
Web
Web
Web
Web
15 second login?
Monday, April 12, 2010

8/8/2019 Diagnosing Fixing Mysql Performance 100412151709 Phpapp01
http://slidepdf.com/reader/full/diagnosing-fixing-mysql-performance-100412151709-phpapp01 28/198
If you said that...
★ The Database✦ You’ll be right most of the time - but you’re not being 100%
honest with yourself.✦
The database has more scalability challenges than the othercomponents. For the most part we can just add webservers.
28Monday, April 12, 2010

8/8/2019 Diagnosing Fixing Mysql Performance 100412151709 Phpapp01
http://slidepdf.com/reader/full/diagnosing-fixing-mysql-performance-100412151709-phpapp01 29/198
However;
★ We can lead ourselves into a real trap by guessing
based on previous experience.
★ Proving is probably a lot more important than knowing.
29Monday, April 12, 2010

8/8/2019 Diagnosing Fixing Mysql Performance 100412151709 Phpapp01
http://slidepdf.com/reader/full/diagnosing-fixing-mysql-performance-100412151709-phpapp01 30/198
What’s interesting...
★ What’s more interesting than drawing the stack is
drawing the flow of information between each
component of the stack.
★
It’s important to be able to do this while users executetasks.
30Monday, April 12, 2010
8/8/2019 Diagnosing Fixing Mysql Performance 100412151709 Phpapp01
http://slidepdf.com/reader/full/diagnosing-fixing-mysql-performance-100412151709-phpapp01 31/198
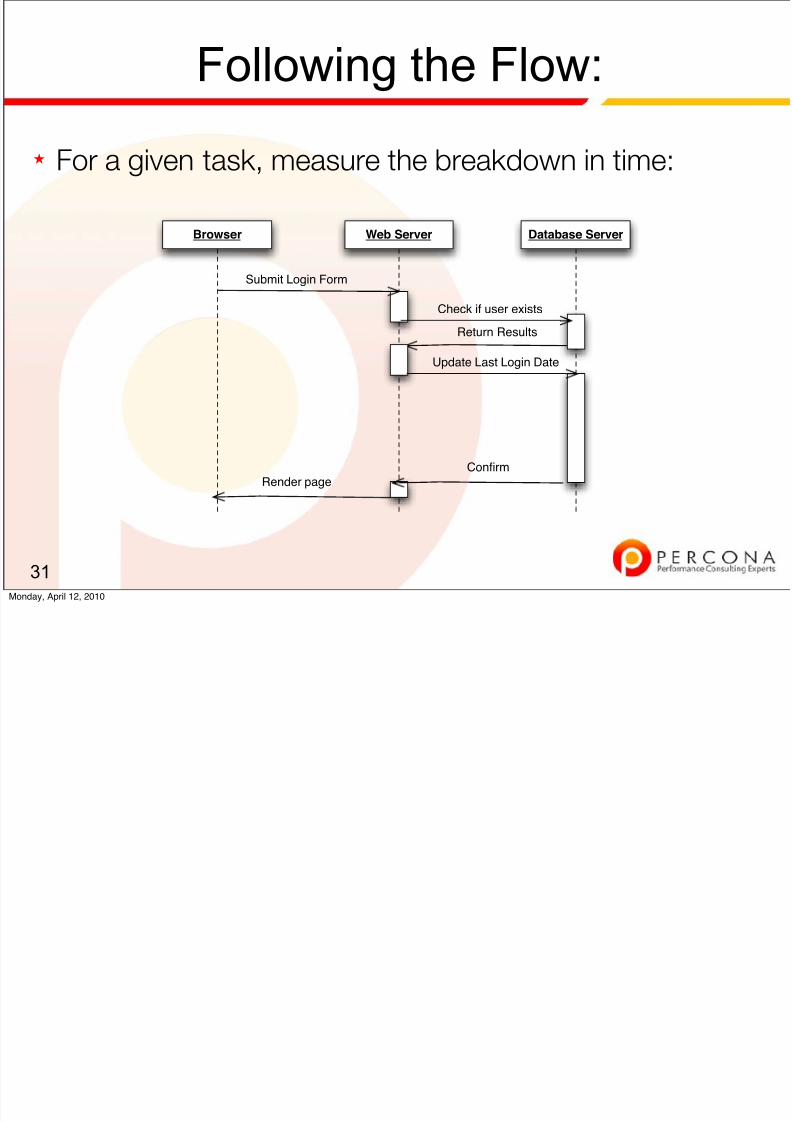
Following the Flow:
★ For a given task, measure the breakdown in time:
31
Submit Login Form
Web Server Database ServerBrowser
Check if user exists
Return Results
Render page
Update Last Login Date
Confirm
Monday, April 12, 2010

8/8/2019 Diagnosing Fixing Mysql Performance 100412151709 Phpapp01
http://slidepdf.com/reader/full/diagnosing-fixing-mysql-performance-100412151709-phpapp01 32/198
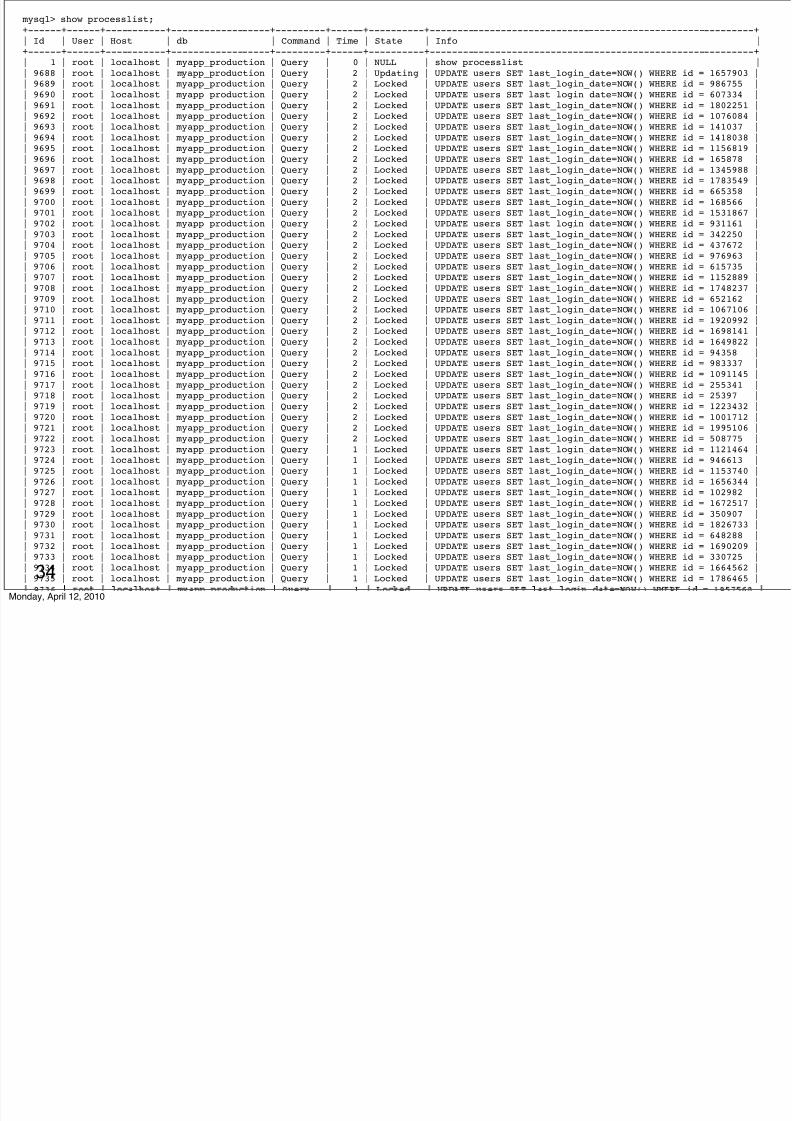
Wait, what.!?
★ Updating the last_login_date takes a sizeable amount
of time?
★ For the value that it provides, why are we spending so
long on that sub-task?
32Monday, April 12, 2010
8/8/2019 Diagnosing Fixing Mysql Performance 100412151709 Phpapp01
http://slidepdf.com/reader/full/diagnosing-fixing-mysql-performance-100412151709-phpapp01 33/198
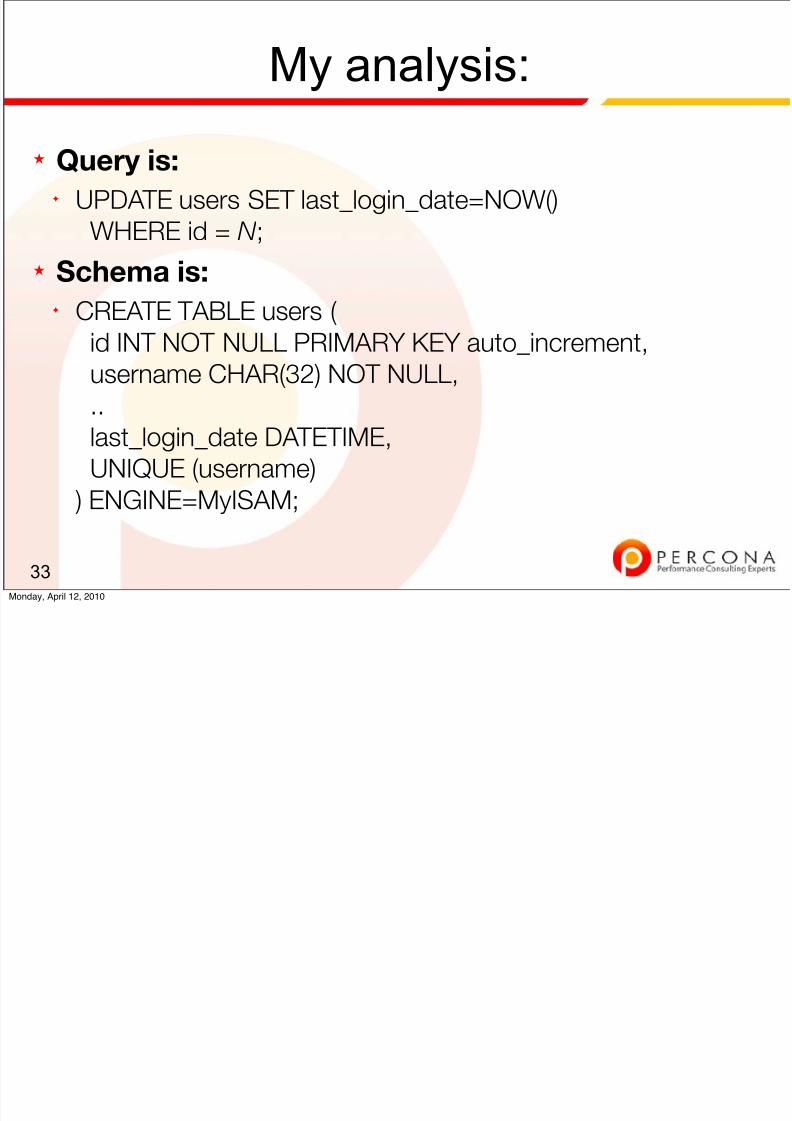
My analysis:
★ Query is:✦ UPDATE users SET last_login_date=NOW()
WHERE id = N ;
★
Schema is:✦ CREATE TABLE users (
id INT NOT NULL PRIMARY KEY auto_increment,username CHAR(32) NOT NULL,
..last_login_date DATETIME,UNIQUE (username)
) ENGINE=MyISAM;
33Monday, April 12, 2010
mysql> show processlist;
8/8/2019 Diagnosing Fixing Mysql Performance 100412151709 Phpapp01
http://slidepdf.com/reader/full/diagnosing-fixing-mysql-performance-100412151709-phpapp01 34/198
34
y q p+------+------+-----------+------------------+---------+------+----------+-----------------------------------------------------------+| Id | User | Host | db | Command | Time | State | Info |+------+------+-----------+------------------+---------+------+----------+-----------------------------------------------------------+| 1 | root | localhost | myapp_production | Query | 0 | NULL | show processlist || 9688 | root | localhost | myapp_production | Query | 2 | Updating | UPDATE users SET last_login_date=NOW() WHERE id = 1657903 || 9689 | root | localhost | myapp_production | Query | 2 | Locked | UPDATE users SET last_login_date=NOW() WHERE id = 986755 || 9690 | root | localhost | myapp_production | Query | 2 | Locked | UPDATE users SET last_login_date=NOW() WHERE id = 607334 || 9691 | root | localhost | myapp_production | Query | 2 | Locked | UPDATE users SET last_login_date=NOW() WHERE id = 1802251 || 9692 | root | localhost | myapp_production | Query | 2 | Locked | UPDATE users SET last_login_date=NOW() WHERE id = 1076084 || 9693 | root | localhost | myapp_production | Query | 2 | Locked | UPDATE users SET last_login_date=NOW() WHERE id = 141037 || 9694 | root | localhost | myapp_production | Query | 2 | Locked | UPDATE users SET last_login_date=NOW() WHERE id = 1418038 || 9695 | root | localhost | myapp_production | Query | 2 | Locked | UPDATE users SET last_login_date=NOW() WHERE id = 1156819 || 9696 | root | localhost | myapp_production | Query | 2 | Locked | UPDATE users SET last_login_date=NOW() WHERE id = 165878 || 9697 | root | localhost | myapp_production | Query | 2 | Locked | UPDATE users SET last_login_date=NOW() WHERE id = 1345988 || 9698 | root | localhost | myapp_production | Query | 2 | Locked | UPDATE users SET last_login_date=NOW() WHERE id = 1783549 || 9699 | root | localhost | myapp_production | Query | 2 | Locked | UPDATE users SET last_login_date=NOW() WHERE id = 665358 || 9700 | root | localhost | myapp_production | Query | 2 | Locked | UPDATE users SET last_login_date=NOW() WHERE id = 168566 || 9701 | root | localhost | myapp_production | Query | 2 | Locked | UPDATE users SET last_login_date=NOW() WHERE id = 1531867 || 9702 | root | localhost | myapp_production | Query | 2 | Locked | UPDATE users SET last_login_date=NOW() WHERE id = 931161 || 9703 | root | localhost | myapp_production | Query | 2 | Locked | UPDATE users SET last_login_date=NOW() WHERE id = 342250 || 9704 | root | localhost | myapp_production | Query | 2 | Locked | UPDATE users SET last_login_date=NOW() WHERE id = 437672 || 9705 | root | localhost | myapp_production | Query | 2 | Locked | UPDATE users SET last_login_date=NOW() WHERE id = 976963 || 9706 | root | localhost | myapp_production | Query | 2 | Locked | UPDATE users SET last_login_date=NOW() WHERE id = 615735 |
| 9707 | root | localhost | myapp_production | Query | 2 | Locked | UPDATE users SET last_login_date=NOW() WHERE id = 1152889 || 9708 | root | localhost | myapp_production | Query | 2 | Locked | UPDATE users SET last_login_date=NOW() WHERE id = 1748237 || 9709 | root | localhost | myapp_production | Query | 2 | Locked | UPDATE users SET last_login_date=NOW() WHERE id = 652162 || 9710 | root | localhost | myapp_production | Query | 2 | Locked | UPDATE users SET last_login_date=NOW() WHERE id = 1067106 || 9711 | root | localhost | myapp_production | Query | 2 | Locked | UPDATE users SET last_login_date=NOW() WHERE id = 1920992 || 9712 | root | localhost | myapp_production | Query | 2 | Locked | UPDATE users SET last_login_date=NOW() WHERE id = 1698141 || 9713 | root | localhost | myapp_production | Query | 2 | Locked | UPDATE users SET last_login_date=NOW() WHERE id = 1649822 || 9714 | root | localhost | myapp_production | Query | 2 | Locked | UPDATE users SET last_login_date=NOW() WHERE id = 94358 || 9715 | root | localhost | myapp_production | Query | 2 | Locked | UPDATE users SET last_login_date=NOW() WHERE id = 983337 || 9716 | root | localhost | myapp_production | Query | 2 | Locked | UPDATE users SET last_login_date=NOW() WHERE id = 1091145 || 9717 | root | localhost | myapp_production | Query | 2 | Locked | UPDATE users SET last_login_date=NOW() WHERE id = 255341 || 9718 | root | localhost | myapp_production | Query | 2 | Locked | UPDATE users SET last_login_date=NOW() WHERE id = 25397 || 9719 | root | localhost | myapp_production | Query | 2 | Locked | UPDATE users SET last_login_date=NOW() WHERE id = 1223432 |
| 9720 | root | localhost | myapp_production | Query | 2 | Locked | UPDATE users SET last_login_date=NOW() WHERE id = 1001712 || 9721 | root | localhost | myapp_production | Query | 2 | Locked | UPDATE users SET last_login_date=NOW() WHERE id = 1995106 || 9722 | root | localhost | myapp_production | Query | 2 | Locked | UPDATE users SET last_login_date=NOW() WHERE id = 508775 || 9723 | root | localhost | myapp_production | Query | 1 | Locked | UPDATE users SET last_login_date=NOW() WHERE id = 1121464 || 9724 | root | localhost | myapp_production | Query | 1 | Locked | UPDATE users SET last_login_date=NOW() WHERE id = 946613 || 9725 | root | localhost | myapp_production | Query | 1 | Locked | UPDATE users SET last_login_date=NOW() WHERE id = 1153740 || 9726 | root | localhost | myapp_production | Query | 1 | Locked | UPDATE users SET last_login_date=NOW() WHERE id = 1656344 || 9727 | root | localhost | myapp_production | Query | 1 | Locked | UPDATE users SET last_login_date=NOW() WHERE id = 102982 || 9728 | root | localhost | myapp_production | Query | 1 | Locked | UPDATE users SET last_login_date=NOW() WHERE id = 1672517 || 9729 | root | localhost | myapp_production | Query | 1 | Locked | UPDATE users SET last_login_date=NOW() WHERE id = 350907 || 9730 | root | localhost | myapp_production | Query | 1 | Locked | UPDATE users SET last_login_date=NOW() WHERE id = 1826733 || 9731 | root | localhost | myapp_production | Query | 1 | Locked | UPDATE users SET last_login_date=NOW() WHERE id = 648288 || 9732 | root | localhost | myapp_production | Query | 1 | Locked | UPDATE users SET last_login_date=NOW() WHERE id = 1690209 |
| 9733 | root | localhost | myapp_production | Query | 1 | Locked | UPDATE users SET last_login_date=NOW() WHERE id = 330725 || 9734 | root | localhost | myapp_production | Query | 1 | Locked | UPDATE users SET last_login_date=NOW() WHERE id = 1664562 || 9735 | root | localhost | myapp_production | Query | 1 | Locked | UPDATE users SET last_login_date=NOW() WHERE id = 1786465 |
= =Monday, April 12, 2010

8/8/2019 Diagnosing Fixing Mysql Performance 100412151709 Phpapp01
http://slidepdf.com/reader/full/diagnosing-fixing-mysql-performance-100412151709-phpapp01 35/198
Morgan-Tockers-MacBook-Pro:~ morgo$ uptime15:00 up 11 days, 16:58, 5 users, load averages: 0.88 0.61 0.44
35Monday, April 12, 2010

8/8/2019 Diagnosing Fixing Mysql Performance 100412151709 Phpapp01
http://slidepdf.com/reader/full/diagnosing-fixing-mysql-performance-100412151709-phpapp01 36/198
Morgan-Tockers-MacBook-Pro:~ morgo$ uptime15:00 up 11 days, 16:58, 5 users, load averages: 0.88 0.61 0.44
mysql> show global status like 'slow_queries%';
+---------------+-------+| Variable_name | Value |+---------------+-------+| Slow_queries | 3 |+---------------+-------+1 row in set (0.00 sec)
36Monday, April 12, 2010
8/8/2019 Diagnosing Fixing Mysql Performance 100412151709 Phpapp01
http://slidepdf.com/reader/full/diagnosing-fixing-mysql-performance-100412151709-phpapp01 37/198
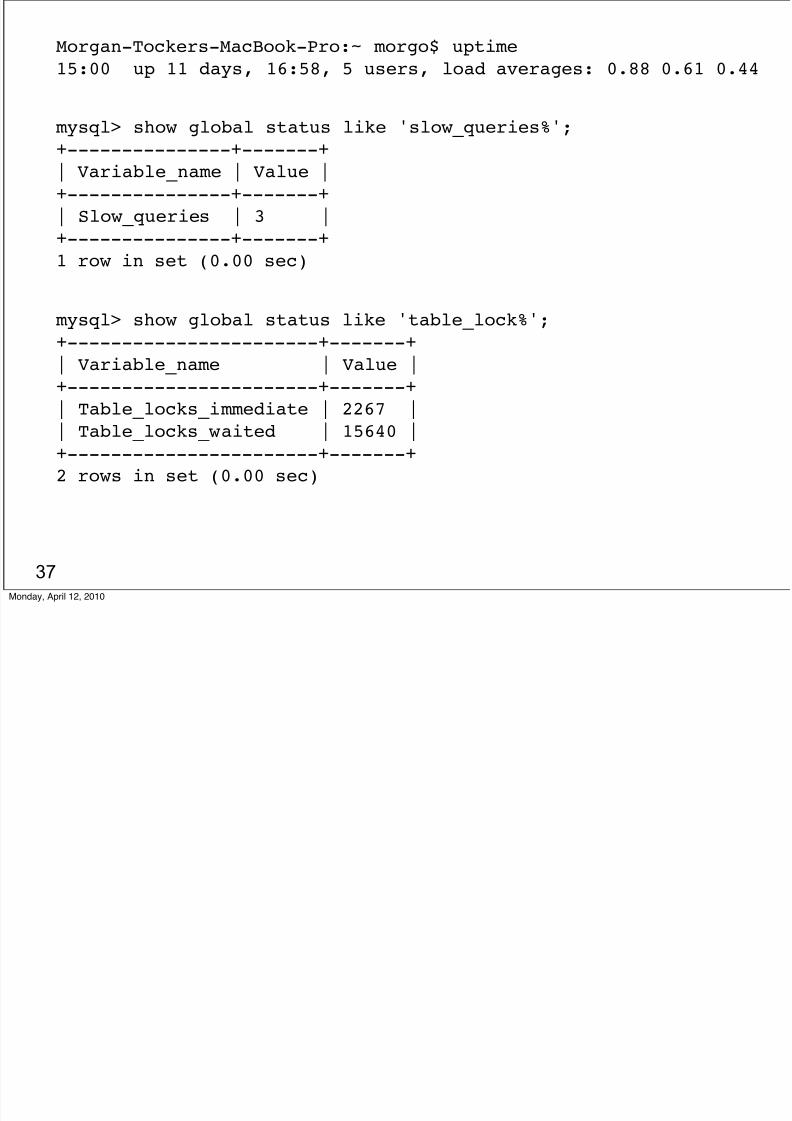
Morgan-Tockers-MacBook-Pro:~ morgo$ uptime15:00 up 11 days, 16:58, 5 users, load averages: 0.88 0.61 0.44
mysql> show global status like 'slow_queries%';
+---------------+-------+| Variable_name | Value |+---------------+-------+| Slow_queries | 3 |+---------------+-------+1 row in set (0.00 sec)
mysql> show global status like 'table_lock%';+-----------------------+-------+| Variable_name | Value |+-----------------------+-------+| Table_locks_immediate | 2267 || Table_locks_waited | 15640 |+-----------------------+-------+2 rows in set (0.00 sec)
37Monday, April 12, 2010

8/8/2019 Diagnosing Fixing Mysql Performance 100412151709 Phpapp01
http://slidepdf.com/reader/full/diagnosing-fixing-mysql-performance-100412151709-phpapp01 38/198
Why do I show you this example?
★ A lock is a form of queue.✦ R = Queue + Service Time
★ Some queuing shows up as “Load”.✦
CPUs have a run queue.✦ IO requests are queued before execution.
38Monday, April 12, 2010
8/8/2019 Diagnosing Fixing Mysql Performance 100412151709 Phpapp01
http://slidepdf.com/reader/full/diagnosing-fixing-mysql-performance-100412151709-phpapp01 39/198
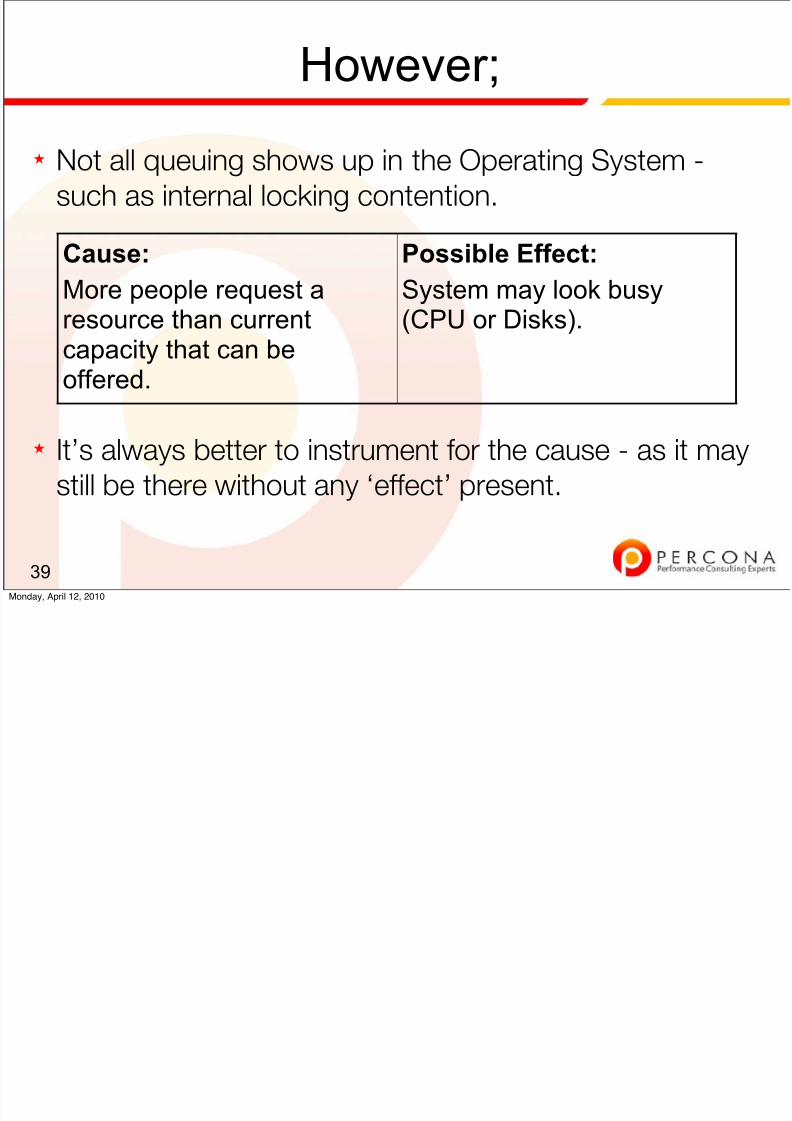
However;
★ Not all queuing shows up in the Operating System -
such as internal locking contention.
★ It’s always better to instrument for the cause - as it may
still be there without any ‘effect’ present.
39
Cause:
More people request aresource than currentcapacity that can beoffered.
Possible Effect:
System may look busy(CPU or Disks).
Monday, April 12, 2010

8/8/2019 Diagnosing Fixing Mysql Performance 100412151709 Phpapp01
http://slidepdf.com/reader/full/diagnosing-fixing-mysql-performance-100412151709-phpapp01 40/198
Back to the Sequence Diagram
★ You want to find what doesn’t look right . Then take
those quick wins.
★ This sounds trivial - but without instrumentation your
guesses are often not correct.
40Monday, April 12, 2010
8/8/2019 Diagnosing Fixing Mysql Performance 100412151709 Phpapp01
http://slidepdf.com/reader/full/diagnosing-fixing-mysql-performance-100412151709-phpapp01 41/198
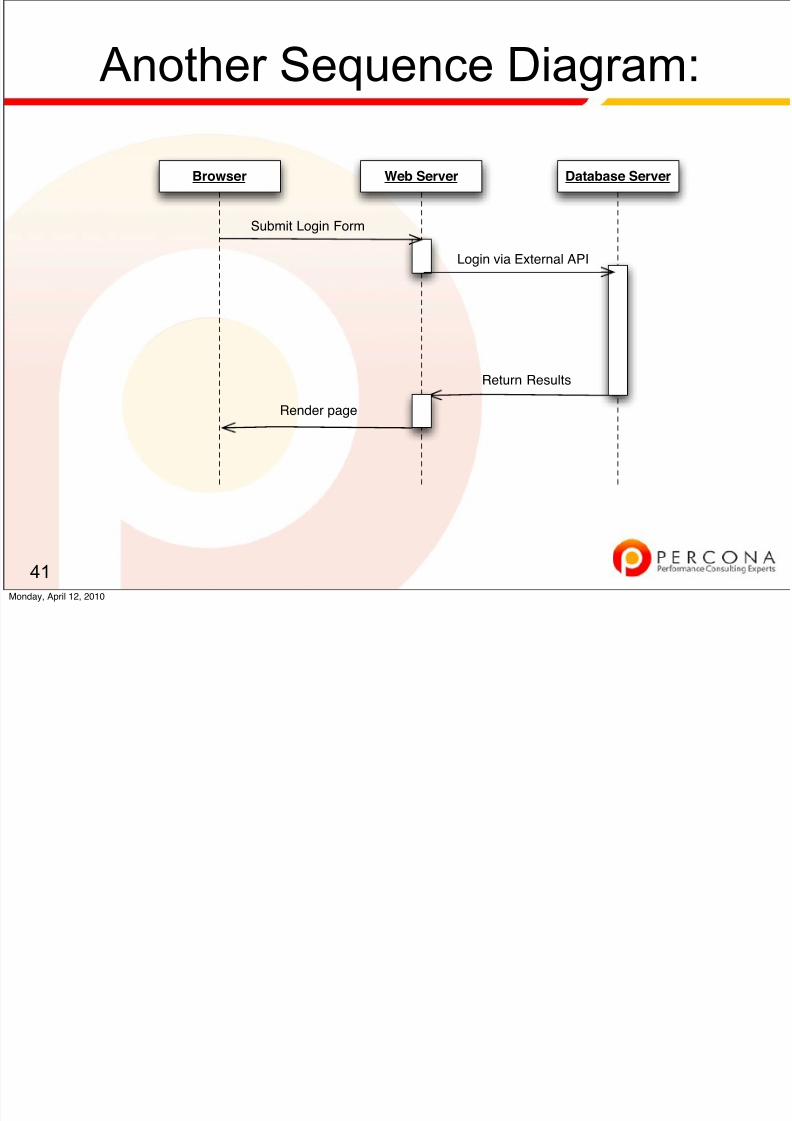
Another Sequence Diagram:
41
Submit Login Form
Web Server Database ServerBrowser
Login via External API
Return Results
Render page
Monday, April 12, 2010

8/8/2019 Diagnosing Fixing Mysql Performance 100412151709 Phpapp01
http://slidepdf.com/reader/full/diagnosing-fixing-mysql-performance-100412151709-phpapp01 42/198
The Lesson
★ In this case, the external API looks like a great piece to
attack first.
★ How do we improve it?✦
Maybe a developer can help here..✦ Can we cache the credentials?
42Monday, April 12, 2010

8/8/2019 Diagnosing Fixing Mysql Performance 100412151709 Phpapp01
http://slidepdf.com/reader/full/diagnosing-fixing-mysql-performance-100412151709-phpapp01 43/198
The Important Lesson (cont.)
43Monday, April 12, 2010

8/8/2019 Diagnosing Fixing Mysql Performance 100412151709 Phpapp01
http://slidepdf.com/reader/full/diagnosing-fixing-mysql-performance-100412151709-phpapp01 44/198
The Important Lesson (cont.)
★ We had a customer exactly like this:
43Monday, April 12, 2010

8/8/2019 Diagnosing Fixing Mysql Performance 100412151709 Phpapp01
http://slidepdf.com/reader/full/diagnosing-fixing-mysql-performance-100412151709-phpapp01 45/198
The Important Lesson (cont.)
★ We had a customer exactly like this:✦ They looked at their webservers.
43Monday, April 12, 2010

8/8/2019 Diagnosing Fixing Mysql Performance 100412151709 Phpapp01
http://slidepdf.com/reader/full/diagnosing-fixing-mysql-performance-100412151709-phpapp01 46/198
The Important Lesson (cont.)
★ We had a customer exactly like this:✦ They looked at their webservers.✦ They weren’t loaded.
43Monday, April 12, 2010

8/8/2019 Diagnosing Fixing Mysql Performance 100412151709 Phpapp01
http://slidepdf.com/reader/full/diagnosing-fixing-mysql-performance-100412151709-phpapp01 47/198
The Important Lesson (cont.)
★ We had a customer exactly like this:✦ They looked at their webservers.✦ They weren’t loaded.✦
They looked at their database servers.
43Monday, April 12, 2010

8/8/2019 Diagnosing Fixing Mysql Performance 100412151709 Phpapp01
http://slidepdf.com/reader/full/diagnosing-fixing-mysql-performance-100412151709-phpapp01 48/198
The Important Lesson (cont.)
★ We had a customer exactly like this:✦ They looked at their webservers.✦ They weren’t loaded.✦
They looked at their database servers.✦ They weren’t loaded either.
43Monday, April 12, 2010
8/8/2019 Diagnosing Fixing Mysql Performance 100412151709 Phpapp01
http://slidepdf.com/reader/full/diagnosing-fixing-mysql-performance-100412151709-phpapp01 49/198
The Important Lesson (cont.)
★ We had a customer exactly like this:✦ They looked at their webservers.✦ They weren’t loaded.✦
They looked at their database servers.✦ They weren’t loaded either.✦ The tried to optimize their database servers because ‘it was a
database problem last time’.
43Monday, April 12, 2010
8/8/2019 Diagnosing Fixing Mysql Performance 100412151709 Phpapp01
http://slidepdf.com/reader/full/diagnosing-fixing-mysql-performance-100412151709-phpapp01 50/198
The Important Lesson (cont.)
★ We had a customer exactly like this:✦ They looked at their webservers.✦ They weren’t loaded.✦
They looked at their database servers.✦ They weren’t loaded either.✦ The tried to optimize their database servers because ‘it was a
database problem last time’.✦
Performance wasn’t much better.
43Monday, April 12, 2010

8/8/2019 Diagnosing Fixing Mysql Performance 100412151709 Phpapp01
http://slidepdf.com/reader/full/diagnosing-fixing-mysql-performance-100412151709-phpapp01 51/198
Why do we set different goals for
each task?
Monday, April 12, 2010
8/8/2019 Diagnosing Fixing Mysql Performance 100412151709 Phpapp01
http://slidepdf.com/reader/full/diagnosing-fixing-mysql-performance-100412151709-phpapp01 52/198
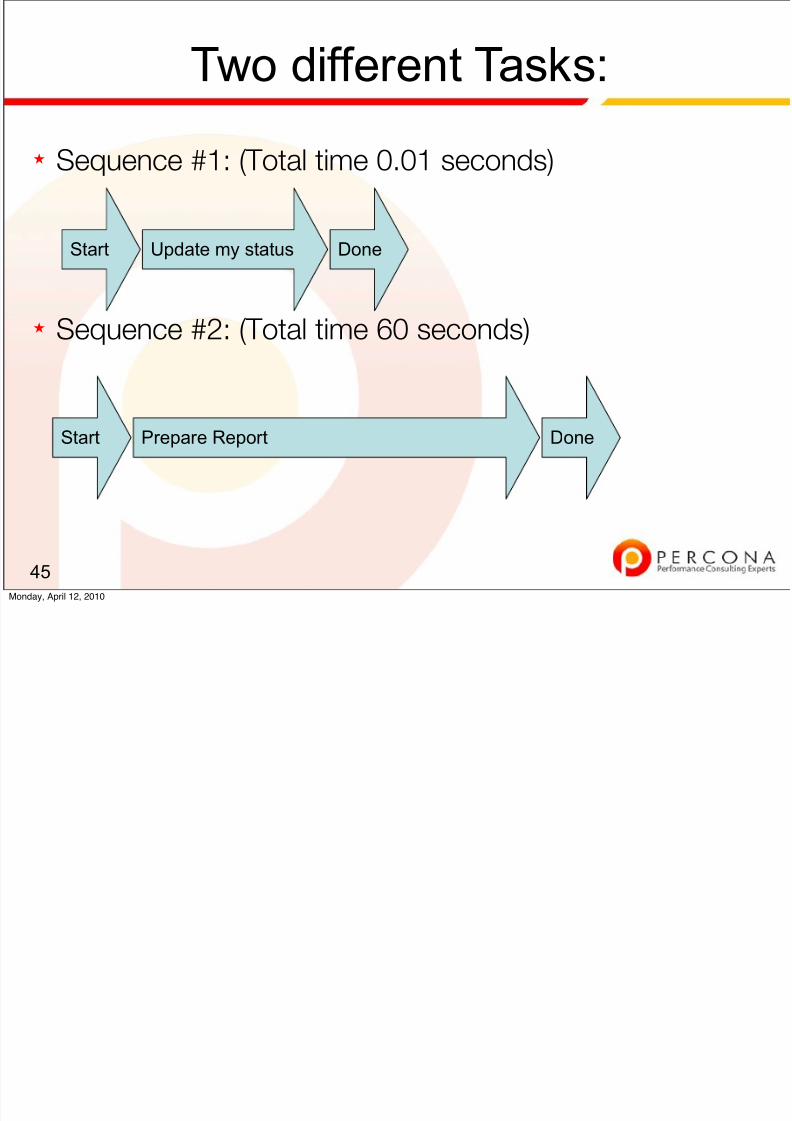
Two different Tasks:
★ Sequence #1: (Total time 0.01 seconds)
★ Sequence #2: (Total time 60 seconds)
45
Start Prepare Report Done
Start Update my status Done
Monday, April 12, 2010

8/8/2019 Diagnosing Fixing Mysql Performance 100412151709 Phpapp01
http://slidepdf.com/reader/full/diagnosing-fixing-mysql-performance-100412151709-phpapp01 53/198
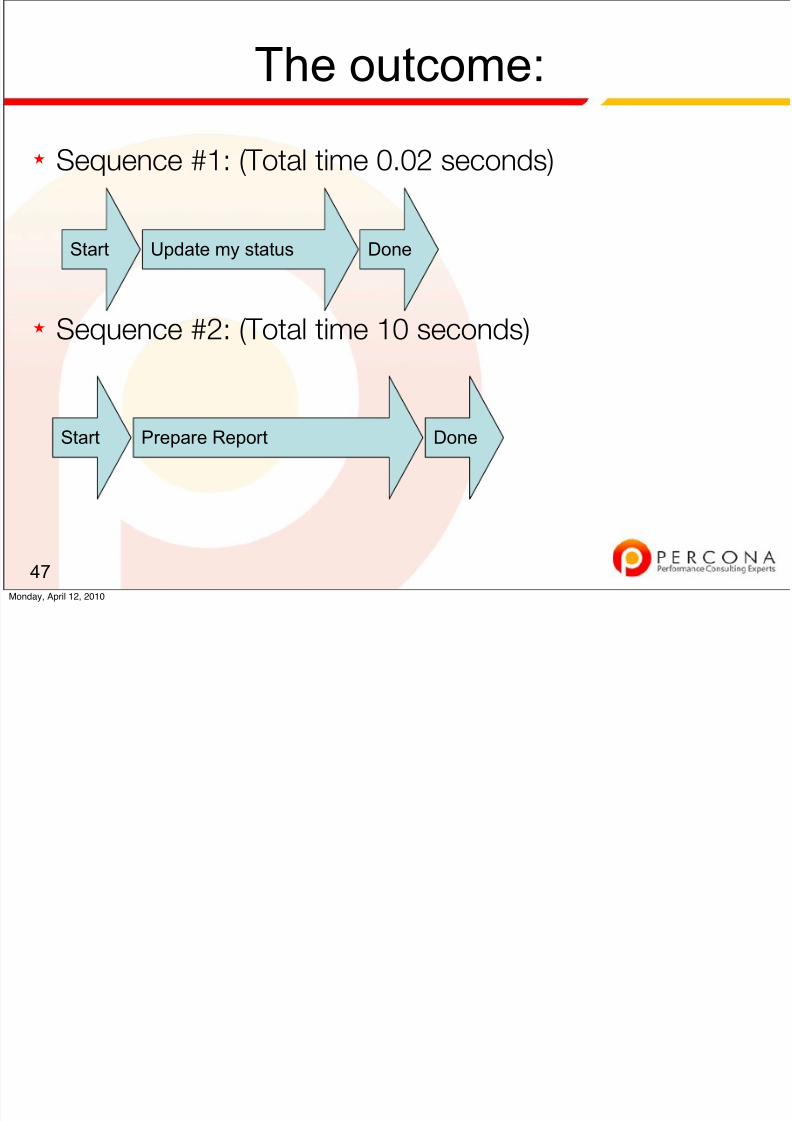
The “Optimization”
★ The customer was worried about a 60 second long
query that ran at 3am every night.
★ Oh no, let’s optimize it by adding an index!
46Monday, April 12, 2010
8/8/2019 Diagnosing Fixing Mysql Performance 100412151709 Phpapp01
http://slidepdf.com/reader/full/diagnosing-fixing-mysql-performance-100412151709-phpapp01 54/198
The outcome:
★ Sequence #1: (Total time 0.02 seconds)
★ Sequence #2: (Total time 10 seconds)
47
Start Prepare Report Done
Start Update my status Done
Monday, April 12, 2010

8/8/2019 Diagnosing Fixing Mysql Performance 100412151709 Phpapp01
http://slidepdf.com/reader/full/diagnosing-fixing-mysql-performance-100412151709-phpapp01 55/198
Look at:
★ The (ideally user facing) tasks that matter.
★ Write instrumentation so that you can think like a
sequence diagram does.
48Monday, April 12, 2010

8/8/2019 Diagnosing Fixing Mysql Performance 100412151709 Phpapp01
http://slidepdf.com/reader/full/diagnosing-fixing-mysql-performance-100412151709-phpapp01 56/198
Limits of Sequence Diagrams:
★ Why you might not see everyone using a sequence
diagram in production -✦ It breaks down when there’s too many sub-tasks involved in
execution.
49Monday, April 12, 2010
8/8/2019 Diagnosing Fixing Mysql Performance 100412151709 Phpapp01
http://slidepdf.com/reader/full/diagnosing-fixing-mysql-performance-100412151709-phpapp01 57/198
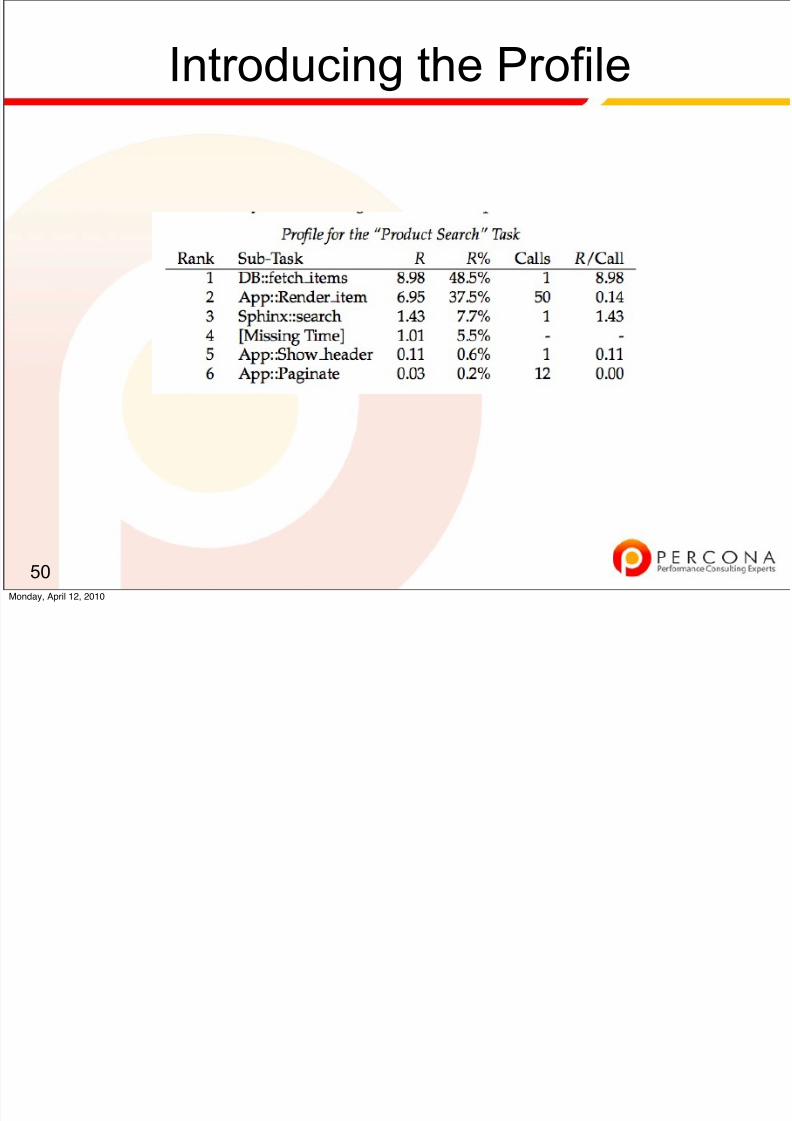
Introducing the Profile
50Monday, April 12, 2010

8/8/2019 Diagnosing Fixing Mysql Performance 100412151709 Phpapp01
http://slidepdf.com/reader/full/diagnosing-fixing-mysql-performance-100412151709-phpapp01 58/198
Introducing the Profile (cont.)
★ The profile is related to the sequence diagram;✦ What we do in a profile is aggregate similar sub-tasks into
one entry.✦ Then we order the profile from total R of a given task.
51Monday, April 12, 2010
8/8/2019 Diagnosing Fixing Mysql Performance 100412151709 Phpapp01
http://slidepdf.com/reader/full/diagnosing-fixing-mysql-performance-100412151709-phpapp01 59/198
Table Of Contents
52
0. Welcome 5. Your Toolchest
1. Defining Performance 6. CPUs and Tasks
2. The Stack at 10000 Feet 7. Utilization versus Backlog
3. Isolating Problems 8. External-to-the-database Problems
4. Approaching the Stack 9. Conclusion
Monday, April 12, 2010

8/8/2019 Diagnosing Fixing Mysql Performance 100412151709 Phpapp01
http://slidepdf.com/reader/full/diagnosing-fixing-mysql-performance-100412151709-phpapp01 60/198
The Method for Isolation
★ In general:✦ Start at the user, measure time taken from the front to the
backend.
★
The absolutely certain method:✦ Plod through the sequence diagram, measure each step.
53Monday, April 12, 2010

8/8/2019 Diagnosing Fixing Mysql Performance 100412151709 Phpapp01
http://slidepdf.com/reader/full/diagnosing-fixing-mysql-performance-100412151709-phpapp01 61/198
The sequence diagram
★ Advantage:✦ You will inevitably find the solution and be able to prove it.
★ Disadvantages:✦
might take too much time✦ things might be too hard or impossible to measure✦ there might be too much information
54Monday, April 12, 2010

8/8/2019 Diagnosing Fixing Mysql Performance 100412151709 Phpapp01
http://slidepdf.com/reader/full/diagnosing-fixing-mysql-performance-100412151709-phpapp01 62/198
Method for Isolation (cont.)
★ Slightly more practical preferred way:✦ 1. Use a tool that makes it easy✦ 2. If that's not possible, guess and measure.✦
3. If you can't measure anything, reason from logic.
55Monday, April 12, 2010

8/8/2019 Diagnosing Fixing Mysql Performance 100412151709 Phpapp01
http://slidepdf.com/reader/full/diagnosing-fixing-mysql-performance-100412151709-phpapp01 63/198
Method #1: Instrument by time
★ Our favourite - and where you should start.
★ Only Con:✦ Not always that easy to do in a complicated system.✦
May not always be feasible to install instrumentation
56Monday, April 12, 2010
# G

8/8/2019 Diagnosing Fixing Mysql Performance 100412151709 Phpapp01
http://slidepdf.com/reader/full/diagnosing-fixing-mysql-performance-100412151709-phpapp01 64/198
Method #2: Guess and Measure
★ Look for a part of the system that “looks bad”
★ How much time does it consume?
★ Example: If logging in takes 2.1 seconds and DNS takes
2 seconds, you found the problem.
57Monday, April 12, 2010
M h d #3 R f L i

8/8/2019 Diagnosing Fixing Mysql Performance 100412151709 Phpapp01
http://slidepdf.com/reader/full/diagnosing-fixing-mysql-performance-100412151709-phpapp01 65/198
Method #3 - Reason from Logic
★ Really hard, really slow.
★ If you can't do any of those, you can✦ ask for help✦
trial-and-error (more on this later)★ We suggest asking for help.
58Monday, April 12, 2010

8/8/2019 Diagnosing Fixing Mysql Performance 100412151709 Phpapp01
http://slidepdf.com/reader/full/diagnosing-fixing-mysql-performance-100412151709-phpapp01 66/198
What not to do.
Monday, April 12, 2010
W k U i t t Thi

8/8/2019 Diagnosing Fixing Mysql Performance 100412151709 Phpapp01
http://slidepdf.com/reader/full/diagnosing-fixing-mysql-performance-100412151709-phpapp01 67/198
Work on Unimportant Things
★ [DO] Apply Amdahl's Law: a 5% time consumer can't
benefit you more than 5%.
★ [DON’T] Apply "best practices"✦
These can have unexpected side effects.✦ Example: I see many sort_merge_passes, maybe I need to
increase sort_buffer_size.✦ Example: I've heard that I should put the logs and data on
different disks.
60Monday, April 12, 2010
G d d 't

8/8/2019 Diagnosing Fixing Mysql Performance 100412151709 Phpapp01
http://slidepdf.com/reader/full/diagnosing-fixing-mysql-performance-100412151709-phpapp01 68/198
Guess-and-don't-measure
★ If you skip measuring, then you cause problems.✦ This is also known as trial-and-error.
★ This method has 3 interesting properties:✦
It sometimes works.✦ It often wastes a lot of time and makes things worse.✦ It can cost you your job.
61Monday, April 12, 2010
G d F l G d M

8/8/2019 Diagnosing Fixing Mysql Performance 100412151709 Phpapp01
http://slidepdf.com/reader/full/diagnosing-fixing-mysql-performance-100412151709-phpapp01 69/198
Guess and Feel-Good-Measure
★ Apply BS-Benchmarks:✦ Time how long it takes to create 10,000 tables and conclude
InnoDB is slower.✦ Write an application benchmark that doesn’t mimic that of
your application (not enough data, single threaded only).
62Monday, April 12, 2010

8/8/2019 Diagnosing Fixing Mysql Performance 100412151709 Phpapp01
http://slidepdf.com/reader/full/diagnosing-fixing-mysql-performance-100412151709-phpapp01 70/198
The best tool to make things easy
is a profiler.
Monday, April 12, 2010
S t id
8/8/2019 Diagnosing Fixing Mysql Performance 100412151709 Phpapp01
http://slidepdf.com/reader/full/diagnosing-fixing-mysql-performance-100412151709-phpapp01 71/198
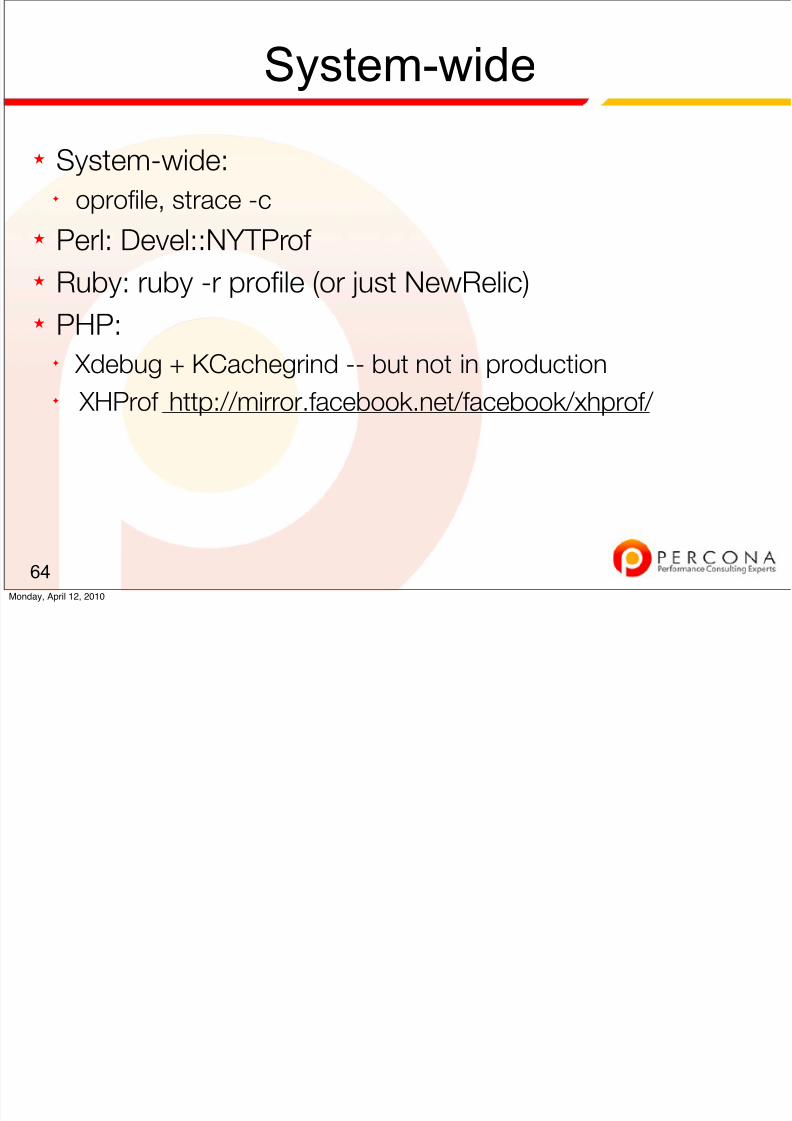
System-wide
★ System-wide:✦ oprofile, strace -c
★ Perl: Devel::NYTProf
★
Ruby: ruby -r profile (or just NewRelic)★ PHP:
✦ Xdebug + KCachegrind -- but not in production✦ XHProf http://mirror.facebook.net/facebook/xhprof/
64Monday, April 12, 2010
XHP f D

8/8/2019 Diagnosing Fixing Mysql Performance 100412151709 Phpapp01
http://slidepdf.com/reader/full/diagnosing-fixing-mysql-performance-100412151709-phpapp01 72/198
XHProf Demo
★ We’ve got it running here:✦ http://184.73.91.208/test.php✦ http://184.73.91.208/runs.php
65Monday, April 12, 2010
T bl Of C t t
8/8/2019 Diagnosing Fixing Mysql Performance 100412151709 Phpapp01
http://slidepdf.com/reader/full/diagnosing-fixing-mysql-performance-100412151709-phpapp01 73/198
Table Of Contents
66
0. Welcome 5. Your Toolchest
1. Defining Performance 6. CPUs and Tasks
2. The Stack at 10000 Feet 7. Utilization versus Backlog
3. Isolating Problems 8. External-to-the-database Problems
4. Approaching the Stack 9. Conclusion
Monday, April 12, 2010
R l Lif

8/8/2019 Diagnosing Fixing Mysql Performance 100412151709 Phpapp01
http://slidepdf.com/reader/full/diagnosing-fixing-mysql-performance-100412151709-phpapp01 74/198
Real Life.
★ Custom written profiling code from boardreader.com.✦ Works similar to what you can achieve with NewRelic and
XHProf.
67Monday, April 12, 2010
A S h t

8/8/2019 Diagnosing Fixing Mysql Performance 100412151709 Phpapp01
http://slidepdf.com/reader/full/diagnosing-fixing-mysql-performance-100412151709-phpapp01 75/198
A Screenshot:
68Monday, April 12, 2010
A th S h t

8/8/2019 Diagnosing Fixing Mysql Performance 100412151709 Phpapp01
http://slidepdf.com/reader/full/diagnosing-fixing-mysql-performance-100412151709-phpapp01 76/198
Another Screenshot:
69Monday, April 12, 2010
Another Screenshot:

8/8/2019 Diagnosing Fixing Mysql Performance 100412151709 Phpapp01
http://slidepdf.com/reader/full/diagnosing-fixing-mysql-performance-100412151709-phpapp01 77/198
Another Screenshot:
70Monday, April 12, 2010
User Tasks

8/8/2019 Diagnosing Fixing Mysql Performance 100412151709 Phpapp01
http://slidepdf.com/reader/full/diagnosing-fixing-mysql-performance-100412151709-phpapp01 78/198
User Tasks
★ If I had to guess it - I would say that they have a fewdifferent tasks that people do:✦ Loading Static Pages (like the home page)✦ Browse by a popular topic.✦ Returning results for a custom search.
71Monday, April 12, 2010
Task Goals

8/8/2019 Diagnosing Fixing Mysql Performance 100412151709 Phpapp01
http://slidepdf.com/reader/full/diagnosing-fixing-mysql-performance-100412151709-phpapp01 79/198
Task Goals
★ Each of these items (in my mind) has a differentresponse time goal. Let's make some up for context:✦ Loading the homepage 100ms.✦ Browsing by a popular topic 500ms✦ Search requests 2000ms (2 seconds)
72Monday, April 12, 2010
Measuring Goals
8/8/2019 Diagnosing Fixing Mysql Performance 100412151709 Phpapp01
http://slidepdf.com/reader/full/diagnosing-fixing-mysql-performance-100412151709-phpapp01 80/198
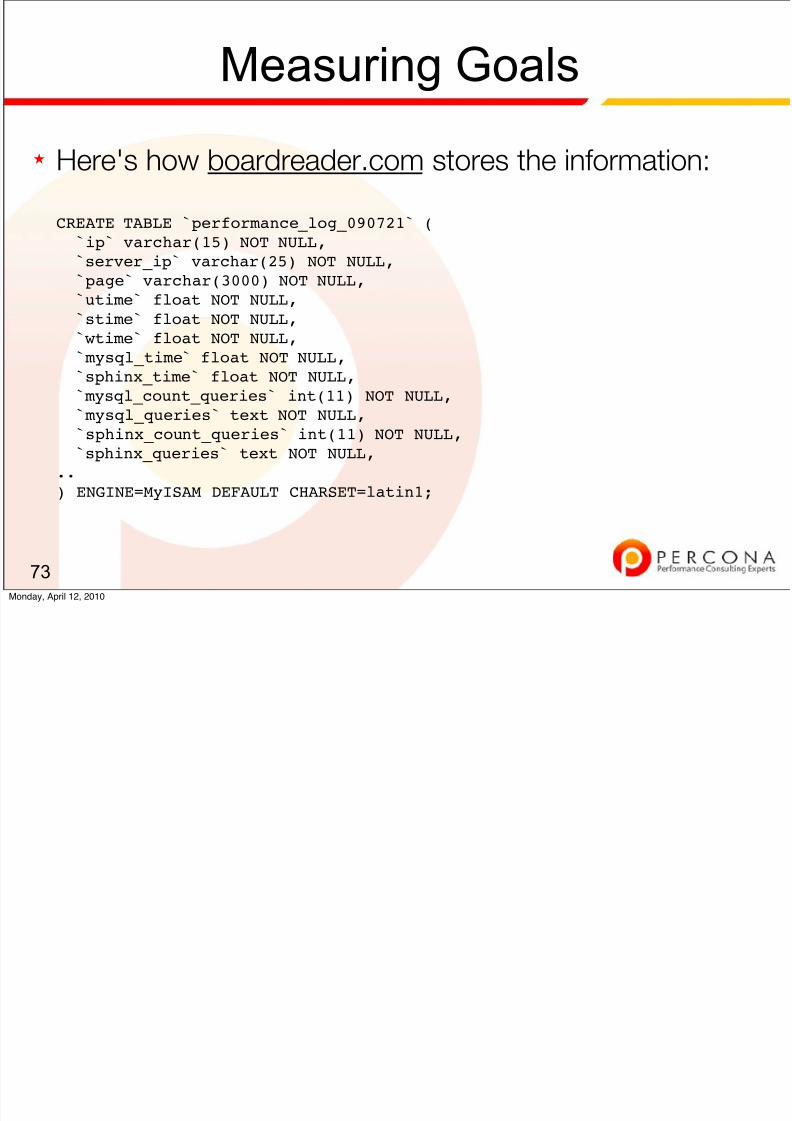
Measuring Goals
★ Here's how boardreader.com stores the information:
CREATE TABLE `performance_log_090721` (`ip` varchar(15) NOT NULL,`server_ip` varchar(25) NOT NULL,`page` varchar(3000) NOT NULL,`utime` float NOT NULL,`stime` float NOT NULL,`wtime` float NOT NULL,`mysql_time` float NOT NULL,`sphinx_time` float NOT NULL,`mysql_count_queries` int(11) NOT NULL,`mysql_queries` text NOT NULL,`sphinx_count_queries` int(11) NOT NULL,`sphinx_queries` text NOT NULL,
..) ENGINE=MyISAM DEFAULT CHARSET=latin1;
73Monday, April 12, 2010
Measuring Goals (cont )
8/8/2019 Diagnosing Fixing Mysql Performance 100412151709 Phpapp01
http://slidepdf.com/reader/full/diagnosing-fixing-mysql-performance-100412151709-phpapp01 81/198
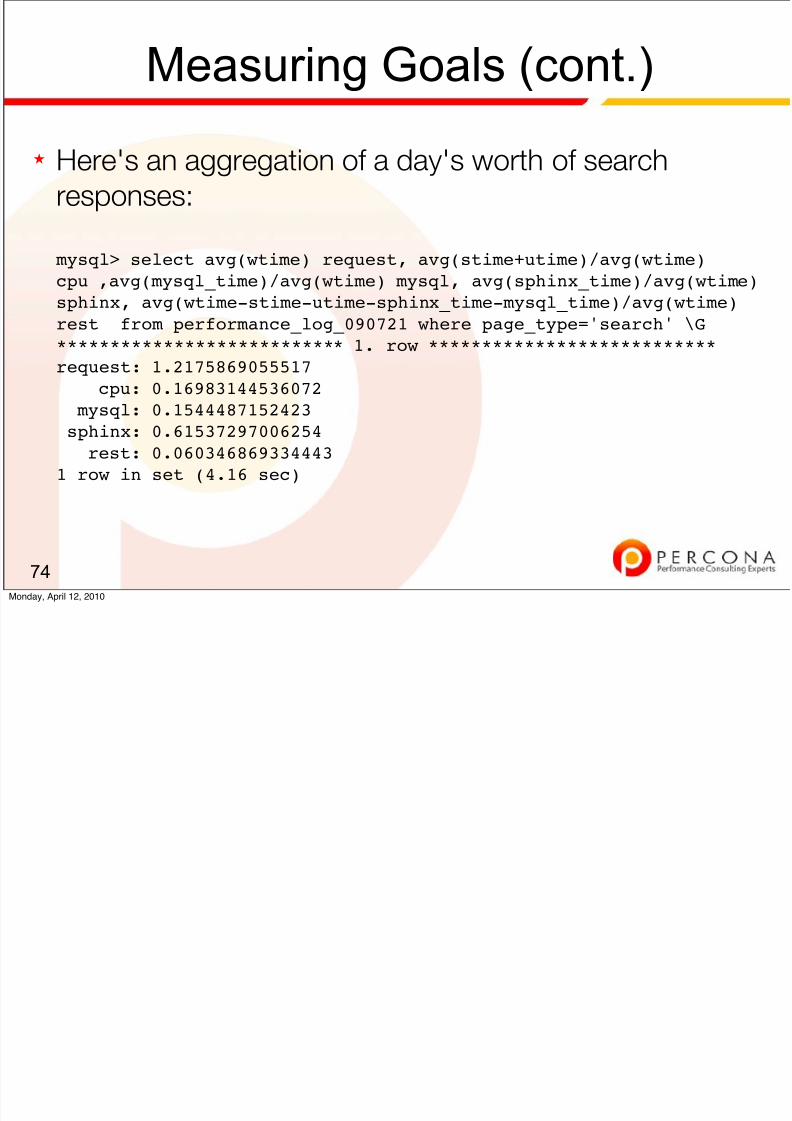
Measuring Goals (cont.)
★ Here's an aggregation of a day's worth of searchresponses:
mysql> select avg(wtime) request, avg(stime+utime)/avg(wtime)
cpu ,avg(mysql_time)/avg(wtime) mysql, avg(sphinx_time)/avg(wtime)sphinx, avg(wtime-stime-utime-sphinx_time-mysql_time)/avg(wtime)rest from performance_log_090721 where page_type='search' \G*************************** 1. row ***************************request: 1.2175869055517
cpu: 0.16983144536072mysql: 0.1544487152423
sphinx: 0.61537297006254rest: 0.060346869334443
1 row in set (4.16 sec)
74Monday, April 12, 2010
Measuring Goals (cont )
8/8/2019 Diagnosing Fixing Mysql Performance 100412151709 Phpapp01
http://slidepdf.com/reader/full/diagnosing-fixing-mysql-performance-100412151709-phpapp01 82/198
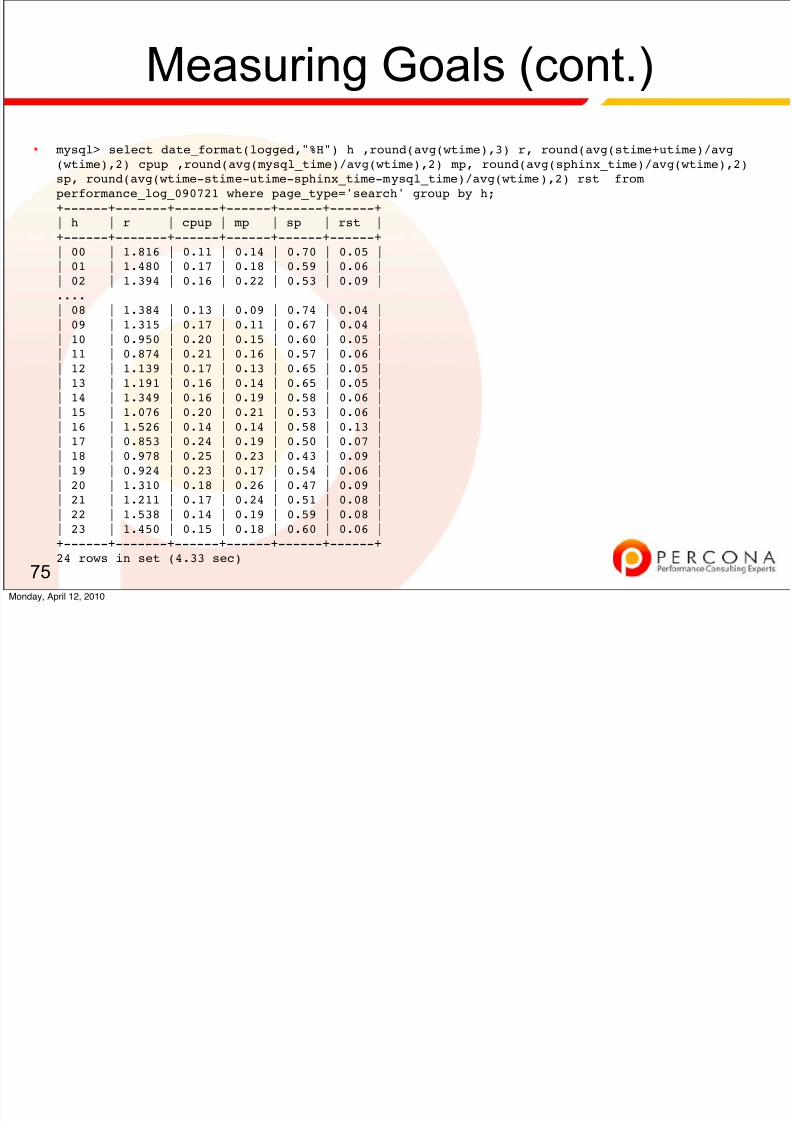
Measuring Goals (cont.)
★
mysql> select date_format(logged,"%H") h ,round(avg(wtime),3) r, round(avg(stime+utime)/avg(wtime),2) cpup ,round(avg(mysql_time)/avg(wtime),2) mp, round(avg(sphinx_time)/avg(wtime),2)sp, round(avg(wtime-stime-utime-sphinx_time-mysql_time)/avg(wtime),2) rst from performance_log_090721 where page_type='search' group by h;+------+-------+------+------+------+------+| h | r | cpup | mp | sp | rst |+------+-------+------+------+------+------+| 00 | 1.816 | 0.11 | 0.14 | 0.70 | 0.05 || 01 | 1.480 | 0.17 | 0.18 | 0.59 | 0.06 || 02 | 1.394 | 0.16 | 0.22 | 0.53 | 0.09 |....| 08 | 1.384 | 0.13 | 0.09 | 0.74 | 0.04 || 09 | 1.315 | 0.17 | 0.11 | 0.67 | 0.04 || 10 | 0.950 | 0.20 | 0.15 | 0.60 | 0.05 || 11 | 0.874 | 0.21 | 0.16 | 0.57 | 0.06 || 12 | 1.139 | 0.17 | 0.13 | 0.65 | 0.05 || 13 | 1.191 | 0.16 | 0.14 | 0.65 | 0.05 || 14 | 1.349 | 0.16 | 0.19 | 0.58 | 0.06 || 15 | 1.076 | 0.20 | 0.21 | 0.53 | 0.06 |
| 16 | 1.526 | 0.14 | 0.14 | 0.58 | 0.13 || 17 | 0.853 | 0.24 | 0.19 | 0.50 | 0.07 || 18 | 0.978 | 0.25 | 0.23 | 0.43 | 0.09 || 19 | 0.924 | 0.23 | 0.17 | 0.54 | 0.06 || 20 | 1.310 | 0.18 | 0.26 | 0.47 | 0.09 || 21 | 1.211 | 0.17 | 0.24 | 0.51 | 0.08 || 22 | 1.538 | 0.14 | 0.19 | 0.59 | 0.08 || 23 | 1.450 | 0.15 | 0.18 | 0.60 | 0.06 |+------+-------+------+------+------+------+24 rows in set (4.33 sec)
75Monday, April 12, 2010
Interpreting Results

8/8/2019 Diagnosing Fixing Mysql Performance 100412151709 Phpapp01
http://slidepdf.com/reader/full/diagnosing-fixing-mysql-performance-100412151709-phpapp01 83/198
Interpreting Results
★ Always interesting to see the difference in timing on aproduction system with real load!
★ 1 hour as I've got on my slides is probably not the best
aggregate - some ‘blips’ in service may not show up.
76Monday, April 12, 2010
Interpreting Results (cont )

8/8/2019 Diagnosing Fixing Mysql Performance 100412151709 Phpapp01
http://slidepdf.com/reader/full/diagnosing-fixing-mysql-performance-100412151709-phpapp01 84/198
Interpreting Results (cont.)
★ Average (mean) is easy to do in MySQL - but 95thpercentile is probably better.
★ What is the problem with min/max/mean?
77Monday, April 12, 2010
Actioning Results

8/8/2019 Diagnosing Fixing Mysql Performance 100412151709 Phpapp01
http://slidepdf.com/reader/full/diagnosing-fixing-mysql-performance-100412151709-phpapp01 85/198
Actioning Results
★ It is only when you've got these metrics in place that youcan start to look at where to fix the problem.
★ This is where the toolchest comes in.
78Monday, April 12, 2010
Table Of Contents
8/8/2019 Diagnosing Fixing Mysql Performance 100412151709 Phpapp01
http://slidepdf.com/reader/full/diagnosing-fixing-mysql-performance-100412151709-phpapp01 86/198
Table Of Contents
79
0. Welcome 5. Your Toolchest
1. Defining Performance 6. CPUs and Tasks
2. The Stack at 10000 Feet 7. Utilization versus Backlog
3. Isolating Problems 8. External-to-the-database Problems
4. Approaching the Stack 9. Conclusion
Monday, April 12, 2010

8/8/2019 Diagnosing Fixing Mysql Performance 100412151709 Phpapp01
http://slidepdf.com/reader/full/diagnosing-fixing-mysql-performance-100412151709-phpapp01 87/198
Quick Glossary of Tools
Monday, April 12, 2010
Top

8/8/2019 Diagnosing Fixing Mysql Performance 100412151709 Phpapp01
http://slidepdf.com/reader/full/diagnosing-fixing-mysql-performance-100412151709-phpapp01 88/198
Top
★ Best use it to confirm what is really running.✦ On a DB server mysqld should be at the top.✦ Most of the time there should only be one mysqld process.
★
Example usage:✦ top -bn1
81Monday, April 12, 2010
ps

8/8/2019 Diagnosing Fixing Mysql Performance 100412151709 Phpapp01
http://slidepdf.com/reader/full/diagnosing-fixing-mysql-performance-100412151709-phpapp01 89/198
ps
★ Quick Trick - verify that the sum of VSZ adds up toroughly the amount of memory used by the system:✦ ps -e -o vsz | awk '{size += $1}END{print(size)}'
★
Check for all running servers:✦ ps aux | grep mysqld
82Monday, April 12, 2010
free
8/8/2019 Diagnosing Fixing Mysql Performance 100412151709 Phpapp01
http://slidepdf.com/reader/full/diagnosing-fixing-mysql-performance-100412151709-phpapp01 90/198
free
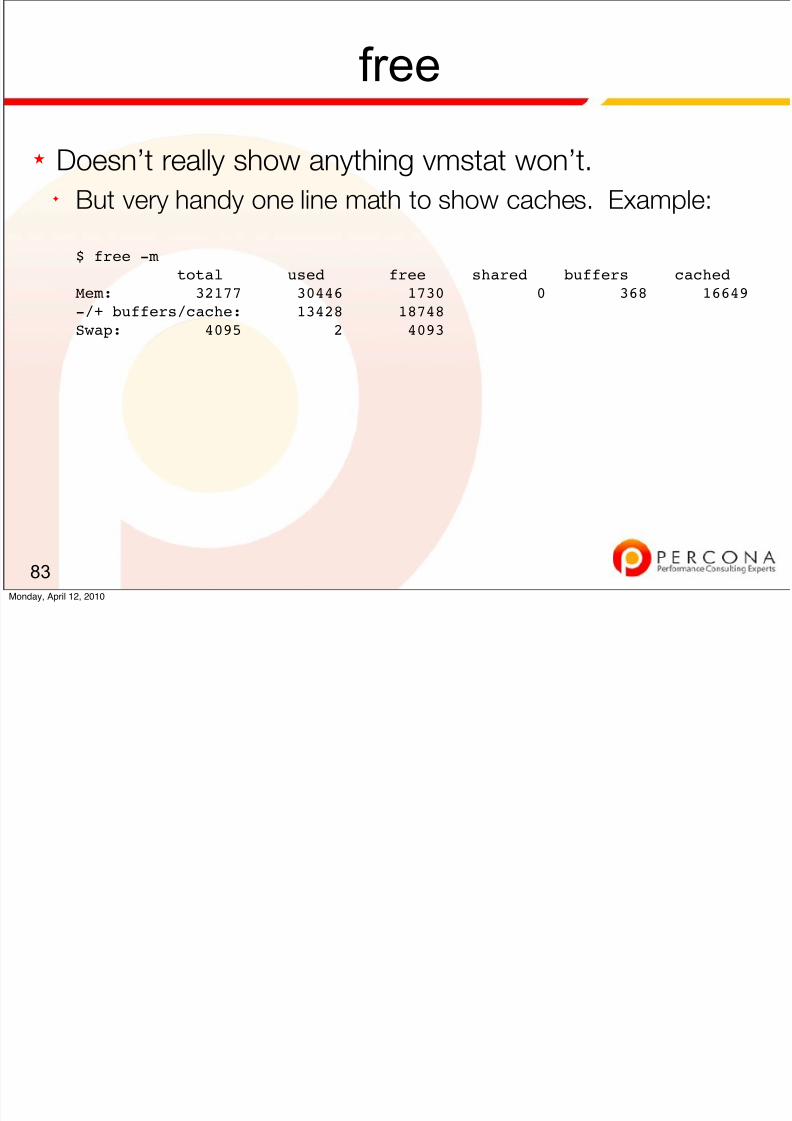
★ Doesn’t really show anything vmstat won’t.✦ But very handy one line math to show caches. Example:
$ free -m total used free shared buffers cached
Mem: 32177 30446 1730 0 368 16649-/+ buffers/cache: 13428 18748Swap: 4095 2 4093
83Monday, April 12, 2010
vmstat

8/8/2019 Diagnosing Fixing Mysql Performance 100412151709 Phpapp01
http://slidepdf.com/reader/full/diagnosing-fixing-mysql-performance-100412151709-phpapp01 91/198
vmstat
★ Best run when server is busy. You can watch what ishappening right now. Example:✦ vmstat 5
★
General-purpose, but a good way to sense what thesystem as a whole is doing.
84Monday, April 12, 2010
vmstat (cont )

8/8/2019 Diagnosing Fixing Mysql Performance 100412151709 Phpapp01
http://slidepdf.com/reader/full/diagnosing-fixing-mysql-performance-100412151709-phpapp01 92/198
vmstat (cont.)
★ Most important bits:✦ si/so should be zero✦ bi/bo are blocks read and written, so you can see IO✦ What does 12% cpu usage mean?
85Monday, April 12, 2010
mpstat

8/8/2019 Diagnosing Fixing Mysql Performance 100412151709 Phpapp01
http://slidepdf.com/reader/full/diagnosing-fixing-mysql-performance-100412151709-phpapp01 93/198
mpstat
★ Installed as part of sysstat.★ More useful than vmstat because it shows individual
CPUs. Example:✦
mpstat -P ALL 5
86Monday, April 12, 2010
netstat

8/8/2019 Diagnosing Fixing Mysql Performance 100412151709 Phpapp01
http://slidepdf.com/reader/full/diagnosing-fixing-mysql-performance-100412151709-phpapp01 94/198
netstat
★ netstat -antp✦ "ss -ant" works acceptably as well.
87Monday, April 12, 2010
netstat (cont )

8/8/2019 Diagnosing Fixing Mysql Performance 100412151709 Phpapp01
http://slidepdf.com/reader/full/diagnosing-fixing-mysql-performance-100412151709-phpapp01 95/198
netstat (cont.)
★ Show count of states:✦ netstat -antp | awk '{print $6}' | sort | uniq -c | sort -rn
★ Show count of peers:✦
netstat -antp | awk '{print $5}' | cut -d: -f1 | sort | uniq -c |sort -rn
88Monday, April 12, 2010
netstat (cont )
8/8/2019 Diagnosing Fixing Mysql Performance 100412151709 Phpapp01
http://slidepdf.com/reader/full/diagnosing-fixing-mysql-performance-100412151709-phpapp01 96/198
netstat (cont.)
★ Things to inspect:✦ Are there a lot of sockets in TIME_WAIT?✦ A lot going to port 53 (DNS) ?✦ Who's connecting to mysqld?
★ You need to know the TCP handshake process:✦ SYN, SYN-ACK, ACK, ESTABLISHED.
89Monday, April 12, 2010
ping

8/8/2019 Diagnosing Fixing Mysql Performance 100412151709 Phpapp01
http://slidepdf.com/reader/full/diagnosing-fixing-mysql-performance-100412151709-phpapp01 97/198
ping
★ useful for checking for packet loss.★ let it run, watch the rtt, cancel,
★ look for missing packets.
90Monday, April 12, 2010
iostat
8/8/2019 Diagnosing Fixing Mysql Performance 100412151709 Phpapp01
http://slidepdf.com/reader/full/diagnosing-fixing-mysql-performance-100412151709-phpapp01 98/198
iostat
★ Much better IO statistics than what vmstat provides.Example usage:✦ iostat -dx 5 (need x for extended statistics)✦ iostat -kx 5 (show CPU stats at the same time)
★ Main problem is that it lumps reads and writes together.✦ Look for what the disks are doing and ask if this is
reasonable.
91Monday, April 12, 2010
iostat (cont )

8/8/2019 Diagnosing Fixing Mysql Performance 100412151709 Phpapp01
http://slidepdf.com/reader/full/diagnosing-fixing-mysql-performance-100412151709-phpapp01 99/198
iostat (cont.)
★ Main items to look at:✦ What is the queue length?✦ How much is being read and written?✦ What is the average wait, and what is the service time?
92Monday, April 12, 2010

8/8/2019 Diagnosing Fixing Mysql Performance 100412151709 Phpapp01
http://slidepdf.com/reader/full/diagnosing-fixing-mysql-performance-100412151709-phpapp01 100/198
Case Study #1
Monday, April 12, 2010
Scope of Problem:
8/8/2019 Diagnosing Fixing Mysql Performance 100412151709 Phpapp01
http://slidepdf.com/reader/full/diagnosing-fixing-mysql-performance-100412151709-phpapp01 101/198
Scope of Problem:
★ Overnight the query performance went from <1ms to50x worse.
★ Nothing changed in terms of server configuration,
schema, etc.
★ Tried throttling the server to 1/2 of its workload✦ from 20k QPS to 10k QPS✦ no improvement.
94Monday, April 12, 2010
Train of thought
8/8/2019 Diagnosing Fixing Mysql Performance 100412151709 Phpapp01
http://slidepdf.com/reader/full/diagnosing-fixing-mysql-performance-100412151709-phpapp01 102/198
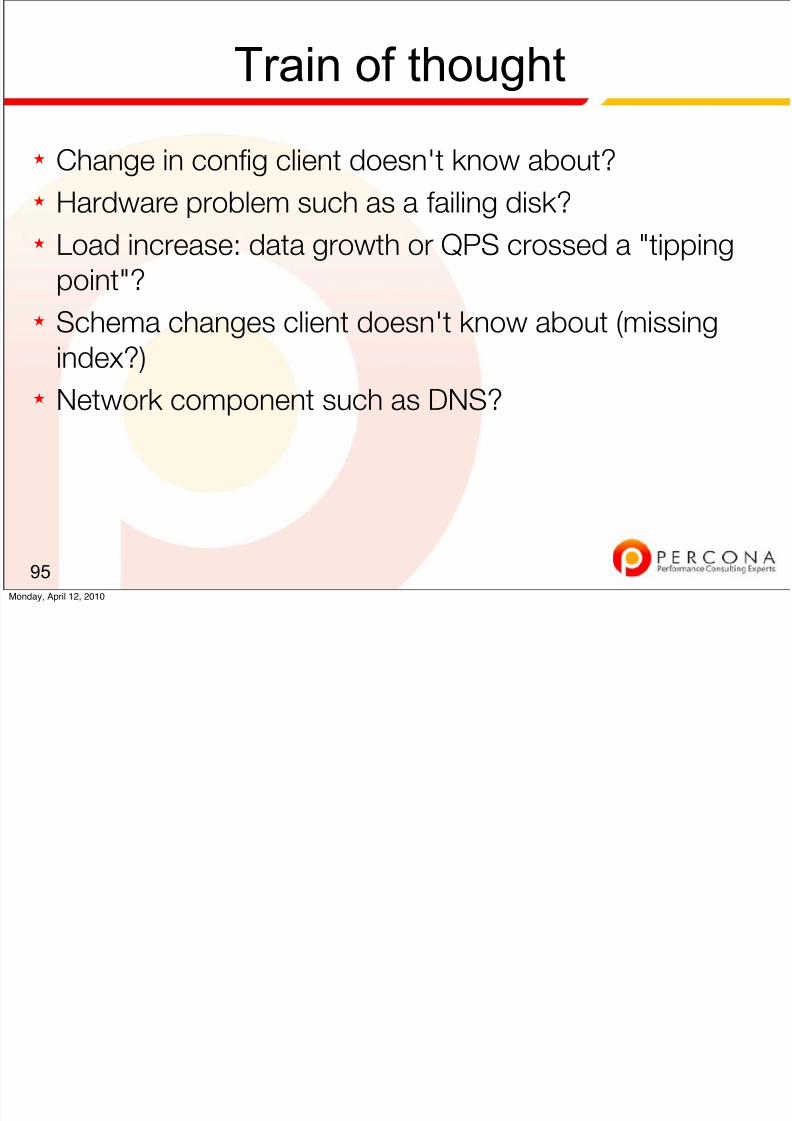
Train of thought
★ Change in config client doesn't know about?★ Hardware problem such as a failing disk?
★ Load increase: data growth or QPS crossed a "tipping
point"?★ Schema changes client doesn't know about (missing
index?)
★ Network component such as DNS?
95Monday, April 12, 2010
Elimination of easy possibilities:

8/8/2019 Diagnosing Fixing Mysql Performance 100412151709 Phpapp01
http://slidepdf.com/reader/full/diagnosing-fixing-mysql-performance-100412151709-phpapp01 103/198
Elimination of easy possibilities:
★ ALL queries are found to be slower in slow-query-log✦ eliminates DNS as a possibility.
★ Queries are slow when run via Unix socket✦
eliminates network.★ No errors in dmesg or RAID controller
✦ suggests (doesn't eliminate) that hardware is not theproblem.
96Monday, April 12, 2010
Easy Elimination (cont.)

8/8/2019 Diagnosing Fixing Mysql Performance 100412151709 Phpapp01
http://slidepdf.com/reader/full/diagnosing-fixing-mysql-performance-100412151709-phpapp01 104/198
Easy Elimination (cont.)
★ Detailed historical metrics show no change in Handler_graphs✦ suggests (doesn't eliminate) that indexing is not the problem.✦ Also, combined with the fact that ALL queries are 50x slower,
very strong reason to believe indexing is not the problem.
97Monday, April 12, 2010
Investigation of the obvious:

8/8/2019 Diagnosing Fixing Mysql Performance 100412151709 Phpapp01
http://slidepdf.com/reader/full/diagnosing-fixing-mysql-performance-100412151709-phpapp01 105/198
Investigation of the obvious:
★ Aggregation of SHOW PROCESSLIST shows queriesare not in Locked status.
★ Investigating SHOW INNODB STATUS shows no
problems with semaphores, transaction states such as
"commit", main thread, or other likely culprits.
98Monday, April 12, 2010
Investigation (cont.)
8/8/2019 Diagnosing Fixing Mysql Performance 100412151709 Phpapp01
http://slidepdf.com/reader/full/diagnosing-fixing-mysql-performance-100412151709-phpapp01 106/198
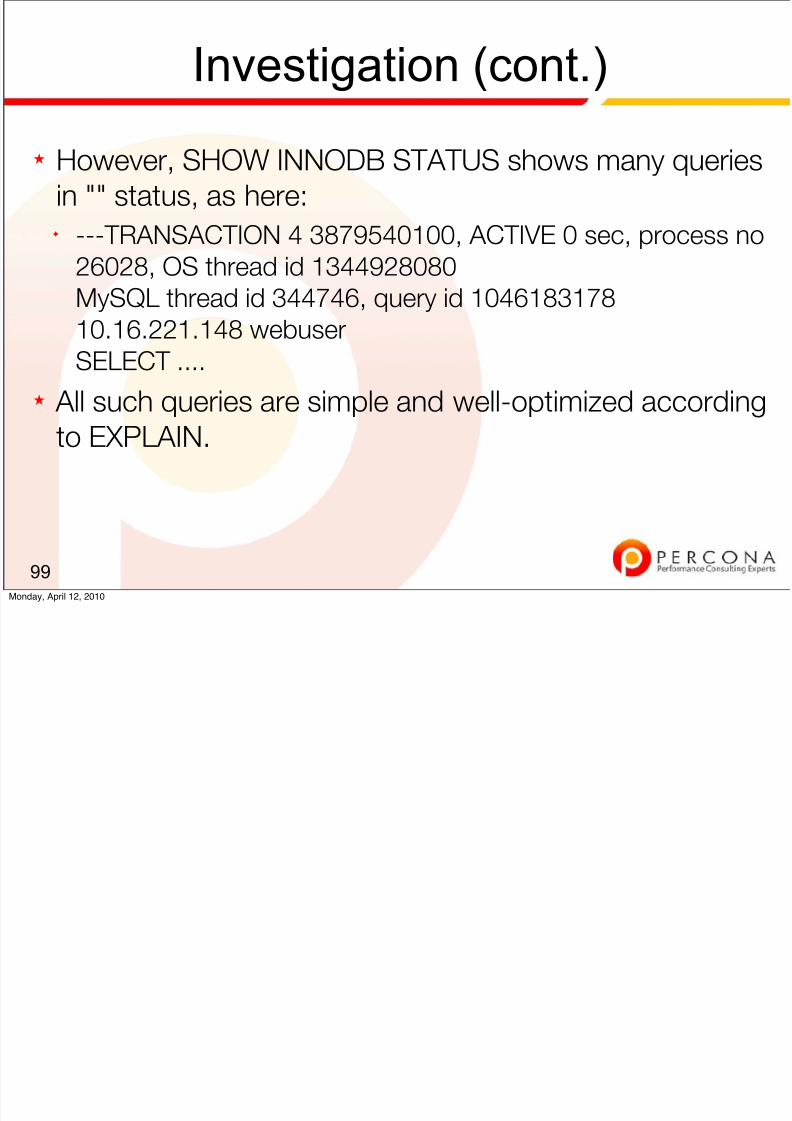
Investigation (cont.)
★ However, SHOW INNODB STATUS shows many queriesin "" status, as here:✦ ---TRANSACTION 4 3879540100, ACTIVE 0 sec, process no
26028, OS thread id 1344928080
MySQL thread id 344746, query id 104618317810.16.221.148 webuserSELECT ....
★ All such queries are simple and well-optimized according
to EXPLAIN.
99Monday, April 12, 2010
Investigation (cont.)

8/8/2019 Diagnosing Fixing Mysql Performance 100412151709 Phpapp01
http://slidepdf.com/reader/full/diagnosing-fixing-mysql-performance-100412151709-phpapp01 107/198
Investigation (cont.)
★ The system has 8 CPUs, Intel(R) Xeon(R) CPUE5450 @ 3.00GHz
★ The system has a RAID controller with 8 Intel XE-25
SSD drives behind it, with BBU and WriteBack caching.
100Monday, April 12, 2010
vmstat 5

8/8/2019 Diagnosing Fixing Mysql Performance 100412151709 Phpapp01
http://slidepdf.com/reader/full/diagnosing-fixing-mysql-performance-100412151709-phpapp01 108/198
vmstat 5
101
r b swpd free buff cache si so bi bo in cs us sy id wa4 0 875356 1052616 372540 8784584 0 0 13 3320 13162 49545 18 7 75 04 0 875356 1070604 372540 8785072 0 0 29 4145 12995 47492 18 7 75 03 0 875356 1051384 372544 8785652 0 0 38 5011 13612 55506 22 7 71 0
Monday, April 12, 2010
iostat -dx 5
8/8/2019 Diagnosing Fixing Mysql Performance 100412151709 Phpapp01
http://slidepdf.com/reader/full/diagnosing-fixing-mysql-performance-100412151709-phpapp01 109/198
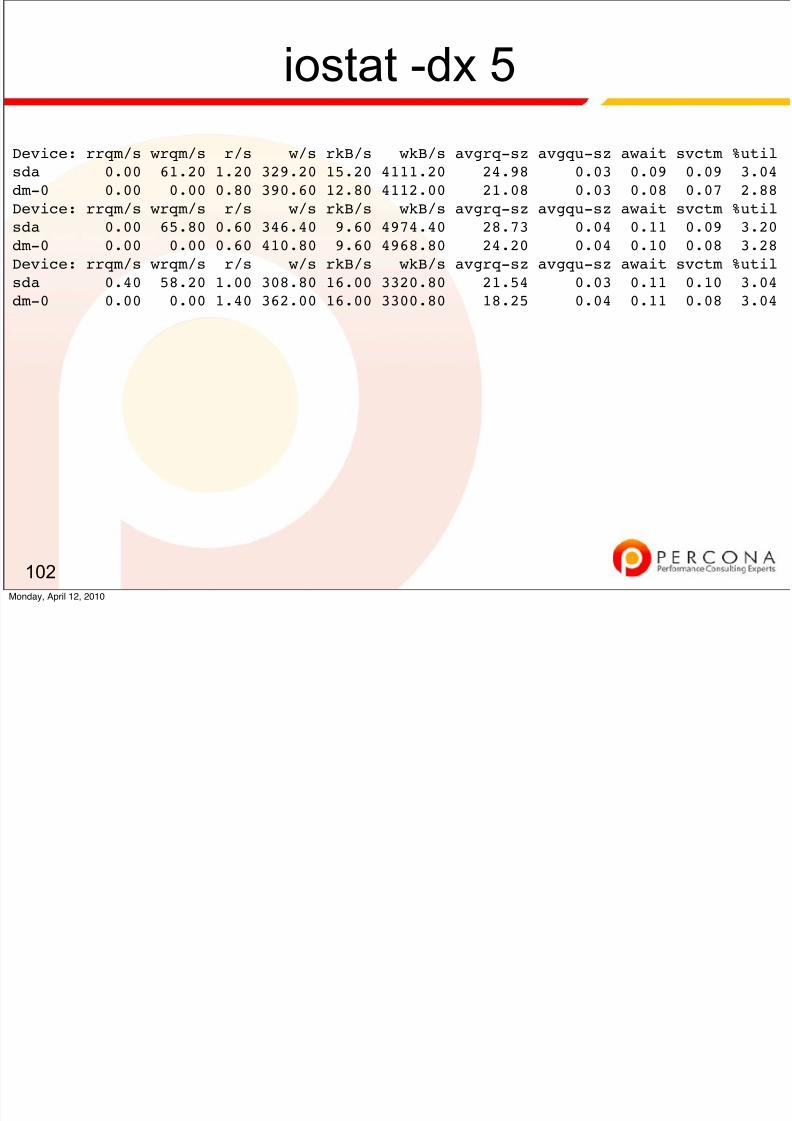
iostat dx 5
102
Device: rrqm/s wrqm/s r/s w/s rkB/s wkB/s avgrq-sz avgqu-sz await svctm %utilsda 0.00 61.20 1.20 329.20 15.20 4111.20 24.98 0.03 0.09 0.09 3.04dm-0 0.00 0.00 0.80 390.60 12.80 4112.00 21.08 0.03 0.08 0.07 2.88Device: rrqm/s wrqm/s r/s w/s rkB/s wkB/s avgrq-sz avgqu-sz await svctm %utilsda 0.00 65.80 0.60 346.40 9.60 4974.40 28.73 0.04 0.11 0.09 3.20dm-0 0.00 0.00 0.60 410.80 9.60 4968.80 24.20 0.04 0.10 0.08 3.28Device: rrqm/s wrqm/s r/s w/s rkB/s wkB/s avgrq-sz avgqu-sz await svctm %utilsda 0.40 58.20 1.00 308.80 16.00 3320.80 21.54 0.03 0.11 0.10 3.04dm-0 0.00 0.00 1.40 362.00 16.00 3300.80 18.25 0.04 0.11 0.08 3.04
Monday, April 12, 2010
mpstat 5
8/8/2019 Diagnosing Fixing Mysql Performance 100412151709 Phpapp01
http://slidepdf.com/reader/full/diagnosing-fixing-mysql-performance-100412151709-phpapp01 110/198
p
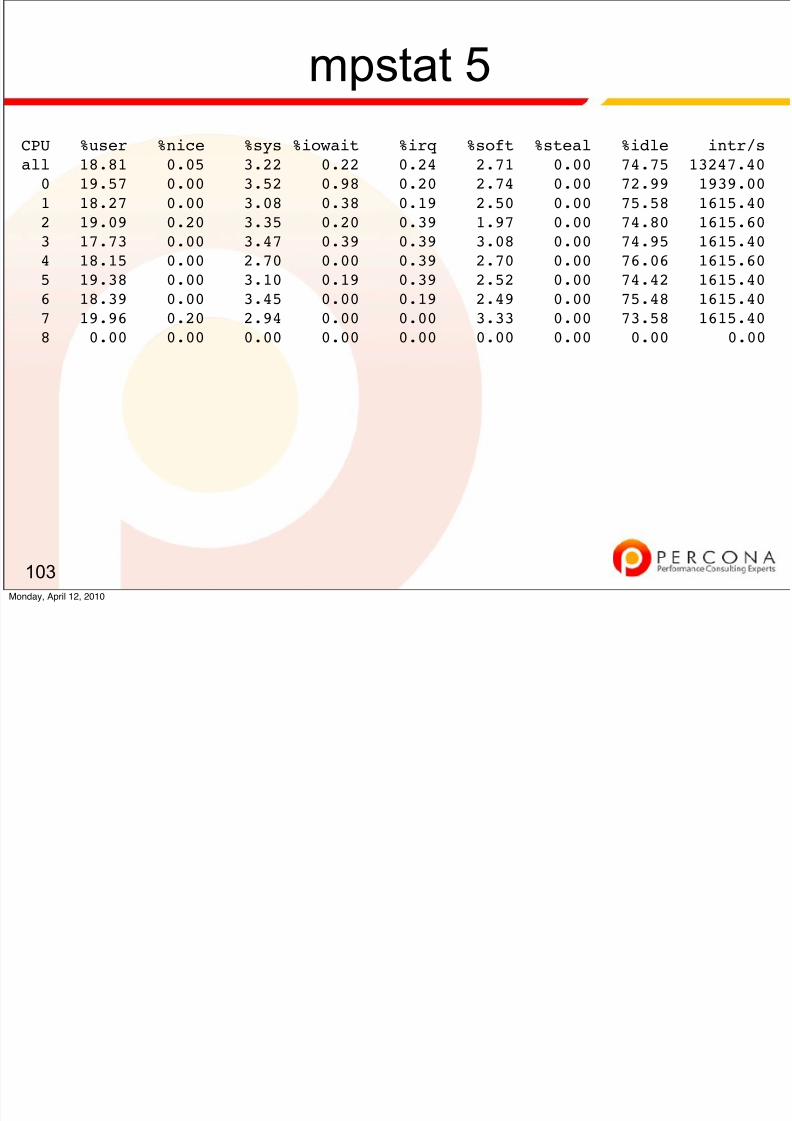
103
CPU %user %nice %sys %iowait %irq %soft %steal %idle intr/sall 18.81 0.05 3.22 0.22 0.24 2.71 0.00 74.75 13247.400 19.57 0.00 3.52 0.98 0.20 2.74 0.00 72.99 1939.001 18.27 0.00 3.08 0.38 0.19 2.50 0.00 75.58 1615.402 19.09 0.20 3.35 0.20 0.39 1.97 0.00 74.80 1615.603 17.73 0.00 3.47 0.39 0.39 3.08 0.00 74.95 1615.404 18.15 0.00 2.70 0.00 0.39 2.70 0.00 76.06 1615.605 19.38 0.00 3.10 0.19 0.39 2.52 0.00 74.42 1615.40
6 18.39 0.00 3.45 0.00 0.19 2.49 0.00 75.48 1615.407 19.96 0.20 2.94 0.00 0.00 3.33 0.00 73.58 1615.408 0.00 0.00 0.00 0.00 0.00 0.00 0.00 0.00 0.00
Monday, April 12, 2010
Premature Conclusion

8/8/2019 Diagnosing Fixing Mysql Performance 100412151709 Phpapp01
http://slidepdf.com/reader/full/diagnosing-fixing-mysql-performance-100412151709-phpapp01 111/198
★ As a result of all the above, I conclude that✦ nothing external to the database is obviously the problem✦ The system is not virtualized✦ I expect the database to be able to perform normally.
★ What to do next?
104Monday, April 12, 2010
What next?

8/8/2019 Diagnosing Fixing Mysql Performance 100412151709 Phpapp01
http://slidepdf.com/reader/full/diagnosing-fixing-mysql-performance-100412151709-phpapp01 112/198
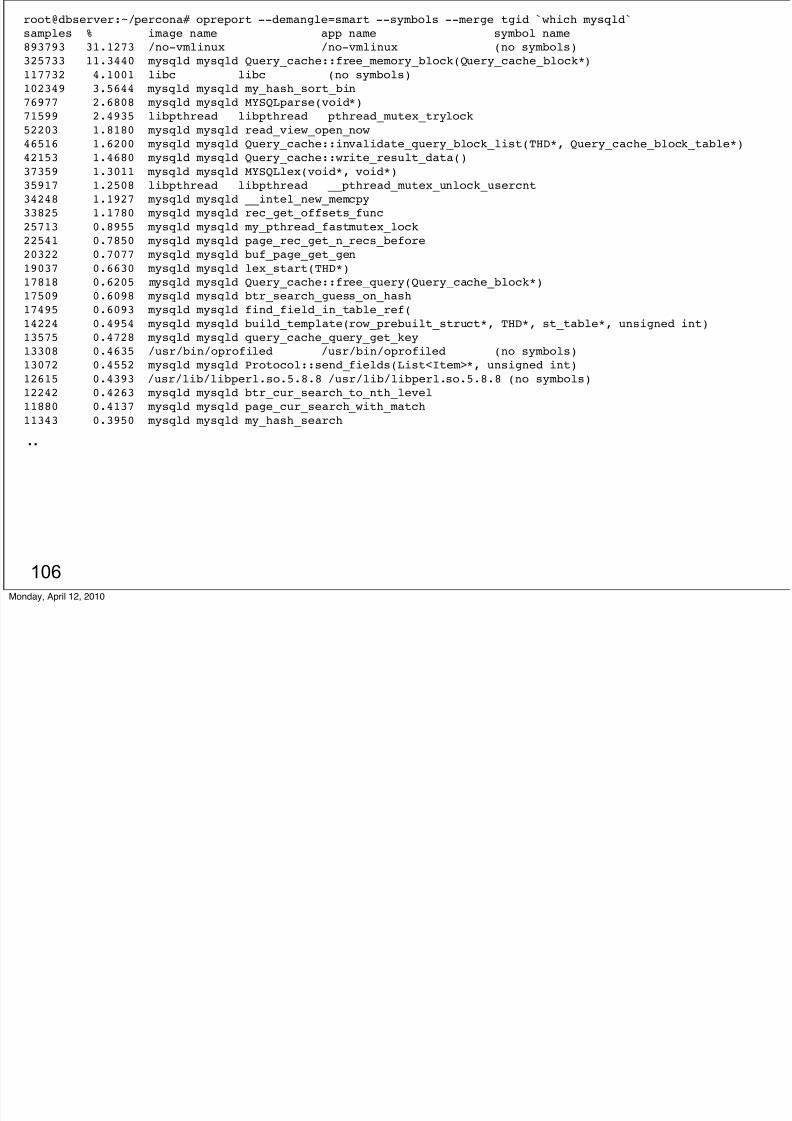
★ Try to use a tool to make things easy.★ Solution:
✦ use oprofile.
105Monday, April 12, 2010
root@dbserver:~/percona# opreport --demangle=smart --symbols --merge tgid `which mysqld`samples % image name app name symbol name893793 31.1273 /no-vmlinux /no-vmlinux (no symbols)325733 11.3440 mysqld mysqld Query_cache::free_memory_block(Query_cache_block*)117732 4.1001 libc libc (no symbols)
8/8/2019 Diagnosing Fixing Mysql Performance 100412151709 Phpapp01
http://slidepdf.com/reader/full/diagnosing-fixing-mysql-performance-100412151709-phpapp01 113/198
106
102349 3.5644 mysqld mysqld my_hash_sort_bin76977 2.6808 mysqld mysqld MYSQLparse(void*)71599 2.4935 libpthread libpthread pthread_mutex_trylock52203 1.8180 mysqld mysqld read_view_open_now46516 1.6200 mysqld mysqld Query_cache::invalidate_query_block_list(THD*, Query_cache_block_table*)
42153 1.4680 mysqld mysqld Query_cache::write_result_data()37359 1.3011 mysqld mysqld MYSQLlex(void*, void*)35917 1.2508 libpthread libpthread __pthread_mutex_unlock_usercnt34248 1.1927 mysqld mysqld __intel_new_memcpy33825 1.1780 mysqld mysqld rec_get_offsets_func25713 0.8955 mysqld mysqld my_pthread_fastmutex_lock22541 0.7850 mysqld mysqld page_rec_get_n_recs_before20322 0.7077 mysqld mysqld buf_page_get_gen19037 0.6630 mysqld mysqld lex_start(THD*)17818 0.6205 mysqld mysqld Query_cache::free_query(Query_cache_block*)
17509 0.6098 mysqld mysqld btr_search_guess_on_hash17495 0.6093 mysqld mysqld find_field_in_table_ref(14224 0.4954 mysqld mysqld build_template(row_prebuilt_struct*, THD*, st_table*, unsigned int)13575 0.4728 mysqld mysqld query_cache_query_get_key13308 0.4635 /usr/bin/oprofiled /usr/bin/oprofiled (no symbols)13072 0.4552 mysqld mysqld Protocol::send_fields(List<Item>*, unsigned int)12615 0.4393 /usr/lib/libperl.so.5.8.8 /usr/lib/libperl.so.5.8.8 (no symbols)12242 0.4263 mysqld mysqld btr_cur_search_to_nth_level11880 0.4137 mysqld mysqld page_cur_search_with_match11343 0.3950 mysqld mysqld my_hash_search
..
Monday, April 12, 2010
Solution:

8/8/2019 Diagnosing Fixing Mysql Performance 100412151709 Phpapp01
http://slidepdf.com/reader/full/diagnosing-fixing-mysql-performance-100412151709-phpapp01 114/198
★ Start innotop (just to have a realtime monitor)★ Disable query cache.
★ Watch QPS change in innotop.
107Monday, April 12, 2010
Additional Confirmation
8/8/2019 Diagnosing Fixing Mysql Performance 100412151709 Phpapp01
http://slidepdf.com/reader/full/diagnosing-fixing-mysql-performance-100412151709-phpapp01 115/198
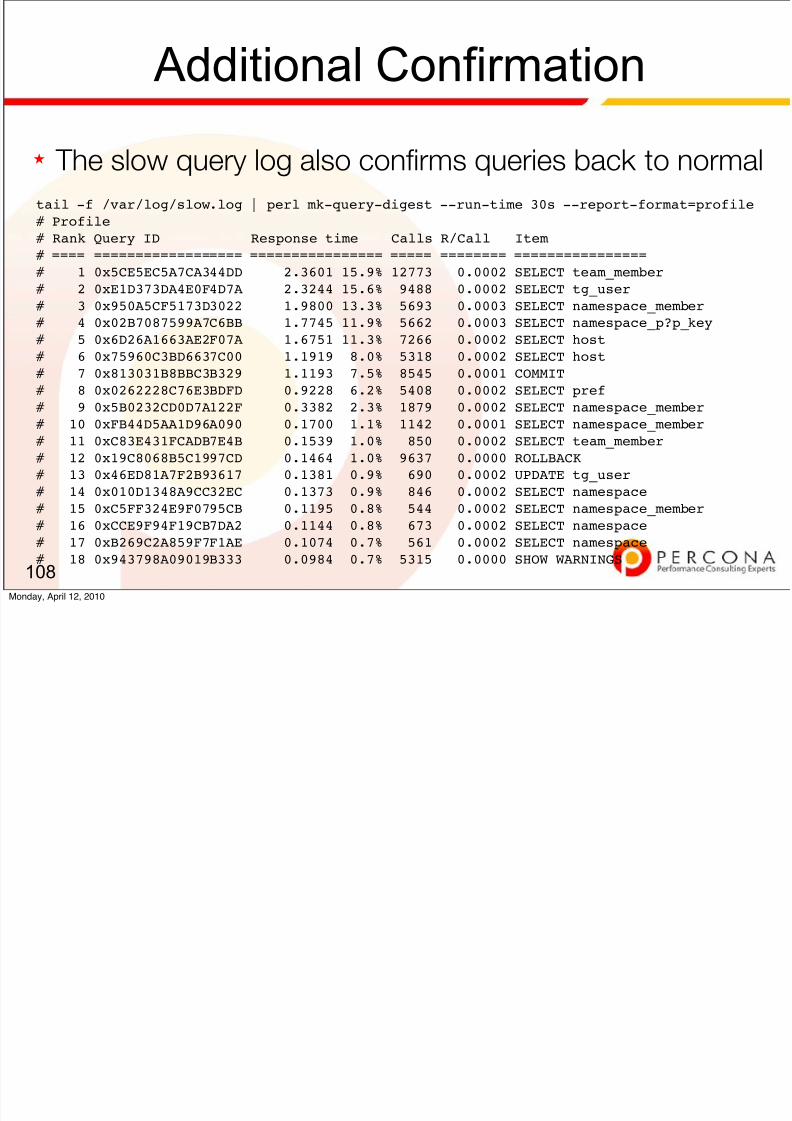
★ The slow query log also confirms queries back to normal
108
tail -f /var/log/slow.log | perl mk-query-digest --run-time 30s --report-format=profile# Profile# Rank Query ID Response time Calls R/Call Item # ==== ================== ================ ===== ======== ================# 1 0x5CE5EC5A7CA344DD 2.3601 15.9% 12773 0.0002 SELECT team_member
# 2 0xE1D373DA4E0F4D7A 2.3244 15.6% 9488 0.0002 SELECT tg_user# 3 0x950A5CF5173D3022 1.9800 13.3% 5693 0.0003 SELECT namespace_member# 4 0x02B7087599A7C6BB 1.7745 11.9% 5662 0.0003 SELECT namespace_p?p_key# 5 0x6D26A1663AE2F07A 1.6751 11.3% 7266 0.0002 SELECT host# 6 0x75960C3BD6637C00 1.1919 8.0% 5318 0.0002 SELECT host# 7 0x813031B8BBC3B329 1.1193 7.5% 8545 0.0001 COMMIT# 8 0x0262228C76E3BDFD 0.9228 6.2% 5408 0.0002 SELECT pref# 9 0x5B0232CD0D7A122F 0.3382 2.3% 1879 0.0002 SELECT namespace_member# 10 0xFB44D5AA1D96A090 0.1700 1.1% 1142 0.0001 SELECT namespace_member# 11 0xC83E431FCADB7E4B 0.1539 1.0% 850 0.0002 SELECT team_member# 12 0x19C8068B5C1997CD 0.1464 1.0% 9637 0.0000 ROLLBACK# 13 0x46ED81A7F2B93617 0.1381 0.9% 690 0.0002 UPDATE tg_user# 14 0x010D1348A9CC32EC 0.1373 0.9% 846 0.0002 SELECT namespace# 15 0xC5FF324E9F0795CB 0.1195 0.8% 544 0.0002 SELECT namespace_member# 16 0xCCE9F94F19CB7DA2 0.1144 0.8% 673 0.0002 SELECT namespace# 17 0xB269C2A859F7F1AE 0.1074 0.7% 561 0.0002 SELECT namespace# 18 0x943798A09019B333 0.0984 0.7% 5315 0.0000 SHOW WARNINGS
Monday, April 12, 2010

8/8/2019 Diagnosing Fixing Mysql Performance 100412151709 Phpapp01
http://slidepdf.com/reader/full/diagnosing-fixing-mysql-performance-100412151709-phpapp01 116/198
Case Study #2
Monday, April 12, 2010
Information Provided
8/8/2019 Diagnosing Fixing Mysql Performance 100412151709 Phpapp01
http://slidepdf.com/reader/full/diagnosing-fixing-mysql-performance-100412151709-phpapp01 117/198
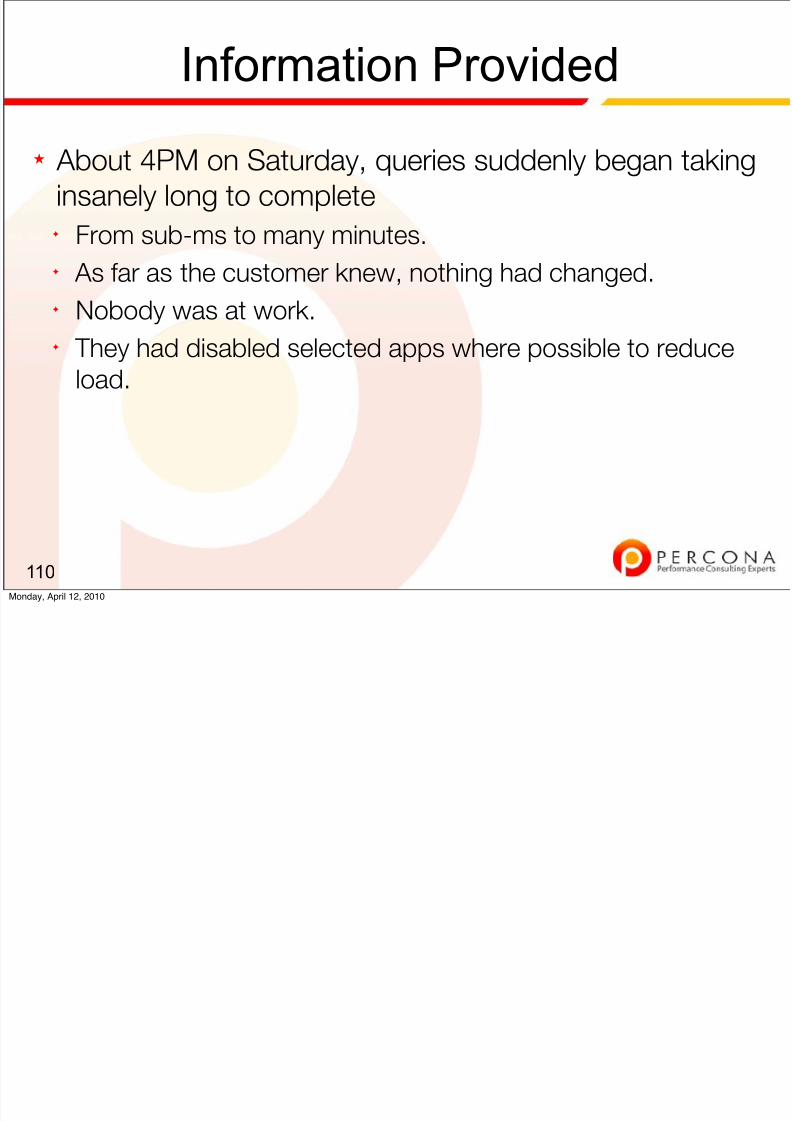
★ About 4PM on Saturday, queries suddenly began takinginsanely long to complete✦ From sub-ms to many minutes.✦ As far as the customer knew, nothing had changed.✦ Nobody was at work.✦ They had disabled selected apps where possible to reduce
load.
110Monday, April 12, 2010
Overview
8/8/2019 Diagnosing Fixing Mysql Performance 100412151709 Phpapp01
http://slidepdf.com/reader/full/diagnosing-fixing-mysql-performance-100412151709-phpapp01 118/198
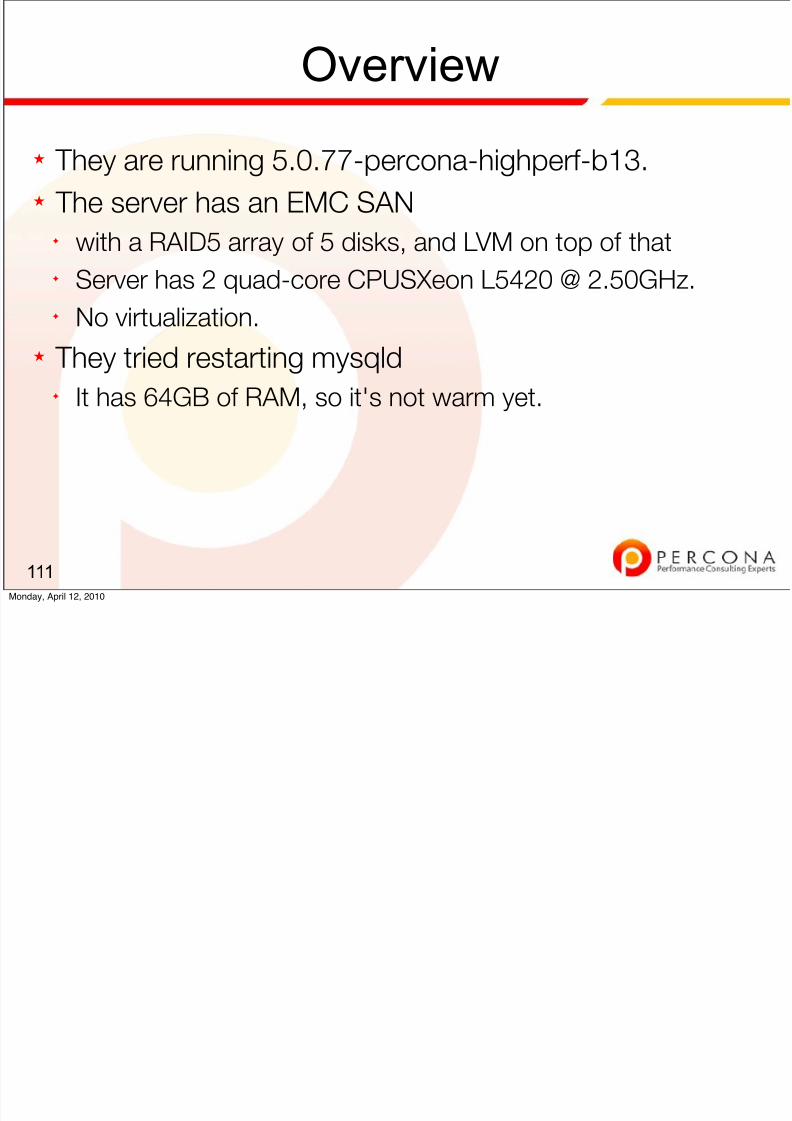
★ They are running 5.0.77-percona-highperf-b13.★ The server has an EMC SAN
✦ with a RAID5 array of 5 disks, and LVM on top of that✦ Server has 2 quad-core CPUSXeon L5420 @ 2.50GHz.✦ No virtualization.
★ They tried restarting mysqld✦ It has 64GB of RAM, so it's not warm yet.
111Monday, April 12, 2010
Train of thought

8/8/2019 Diagnosing Fixing Mysql Performance 100412151709 Phpapp01
http://slidepdf.com/reader/full/diagnosing-fixing-mysql-performance-100412151709-phpapp01 119/198
g
★ The performance drop is way too sudden and large.✦ On a weekend, when no one is working on the system.✦ Something is seriously wrong.✦ Look for things wrong first.
112Monday, April 12, 2010
Elimination of easy possibilities:

8/8/2019 Diagnosing Fixing Mysql Performance 100412151709 Phpapp01
http://slidepdf.com/reader/full/diagnosing-fixing-mysql-performance-100412151709-phpapp01 120/198
y p
★ First, confirm that queries are actually taking a long timeto complete.✦ They all are, as seen in processlist.
★ Check the SAN status.✦ They checked and reported that it's not showing any errors
or failed disks.
113Monday, April 12, 2010
Investigation of the obvious:
8/8/2019 Diagnosing Fixing Mysql Performance 100412151709 Phpapp01
http://slidepdf.com/reader/full/diagnosing-fixing-mysql-performance-100412151709-phpapp01 121/198
g
★ Server's incremental status variables don't look amiss★ 150+ queries in commit status.
★ Many transactions are waiting for locks inside InnoDB✦
But no semaphore waits, and main thread seems OK.★ iostat and vmstat at 5-second intervals:
✦ Suspicious IO performance and a lot of iowait✦ But virtually no work being done.
114Monday, April 12, 2010
iostat
8/8/2019 Diagnosing Fixing Mysql Performance 100412151709 Phpapp01
http://slidepdf.com/reader/full/diagnosing-fixing-mysql-performance-100412151709-phpapp01 122/198
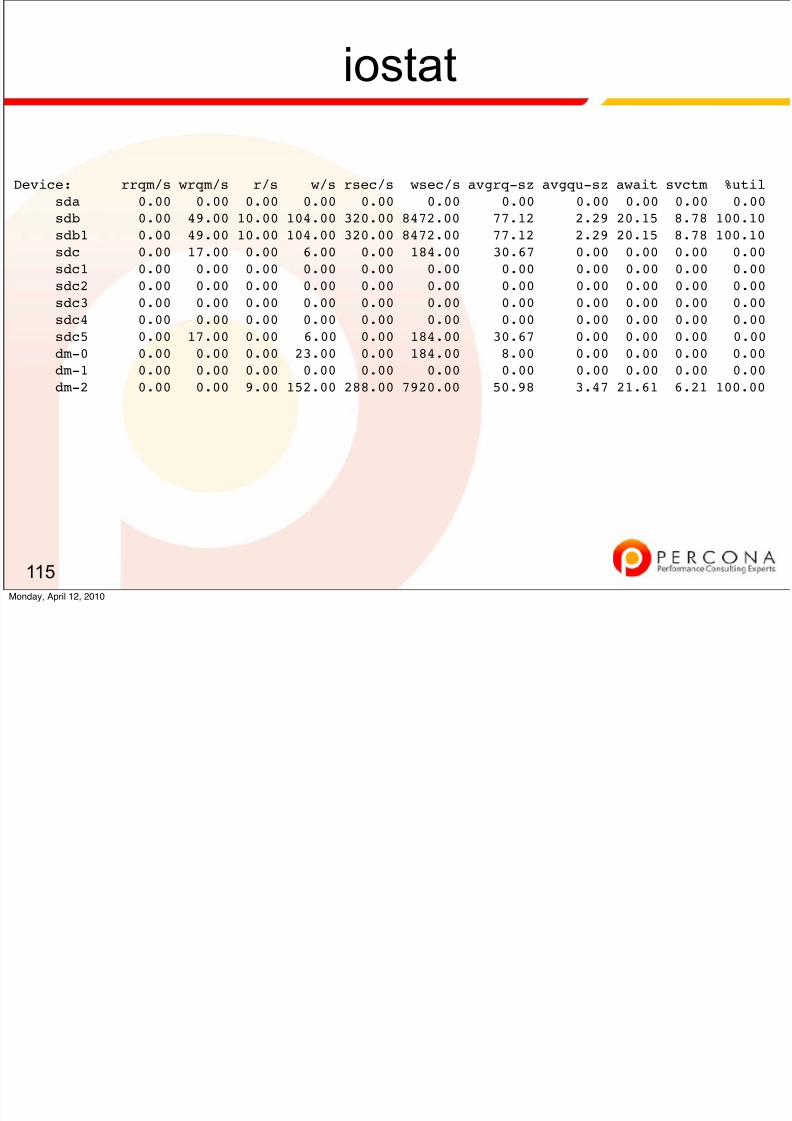
115
Device: rrqm/s wrqm/s r/s w/s rsec/s wsec/s avgrq-sz avgqu-sz await svctm %utilsda 0.00 0.00 0.00 0.00 0.00 0.00 0.00 0.00 0.00 0.00 0.00sdb 0.00 49.00 10.00 104.00 320.00 8472.00 77.12 2.29 20.15 8.78 100.10sdb1 0.00 49.00 10.00 104.00 320.00 8472.00 77.12 2.29 20.15 8.78 100.10sdc 0.00 17.00 0.00 6.00 0.00 184.00 30.67 0.00 0.00 0.00 0.00sdc1 0.00 0.00 0.00 0.00 0.00 0.00 0.00 0.00 0.00 0.00 0.00sdc2 0.00 0.00 0.00 0.00 0.00 0.00 0.00 0.00 0.00 0.00 0.00sdc3 0.00 0.00 0.00 0.00 0.00 0.00 0.00 0.00 0.00 0.00 0.00sdc4 0.00 0.00 0.00 0.00 0.00 0.00 0.00 0.00 0.00 0.00 0.00sdc5 0.00 17.00 0.00 6.00 0.00 184.00 30.67 0.00 0.00 0.00 0.00dm-0 0.00 0.00 0.00 23.00 0.00 184.00 8.00 0.00 0.00 0.00 0.00dm-1 0.00 0.00 0.00 0.00 0.00 0.00 0.00 0.00 0.00 0.00 0.00dm-2 0.00 0.00 9.00 152.00 288.00 7920.00 50.98 3.47 21.61 6.21 100.00
Monday, April 12, 2010
vmstat
8/8/2019 Diagnosing Fixing Mysql Performance 100412151709 Phpapp01
http://slidepdf.com/reader/full/diagnosing-fixing-mysql-performance-100412151709-phpapp01 123/198
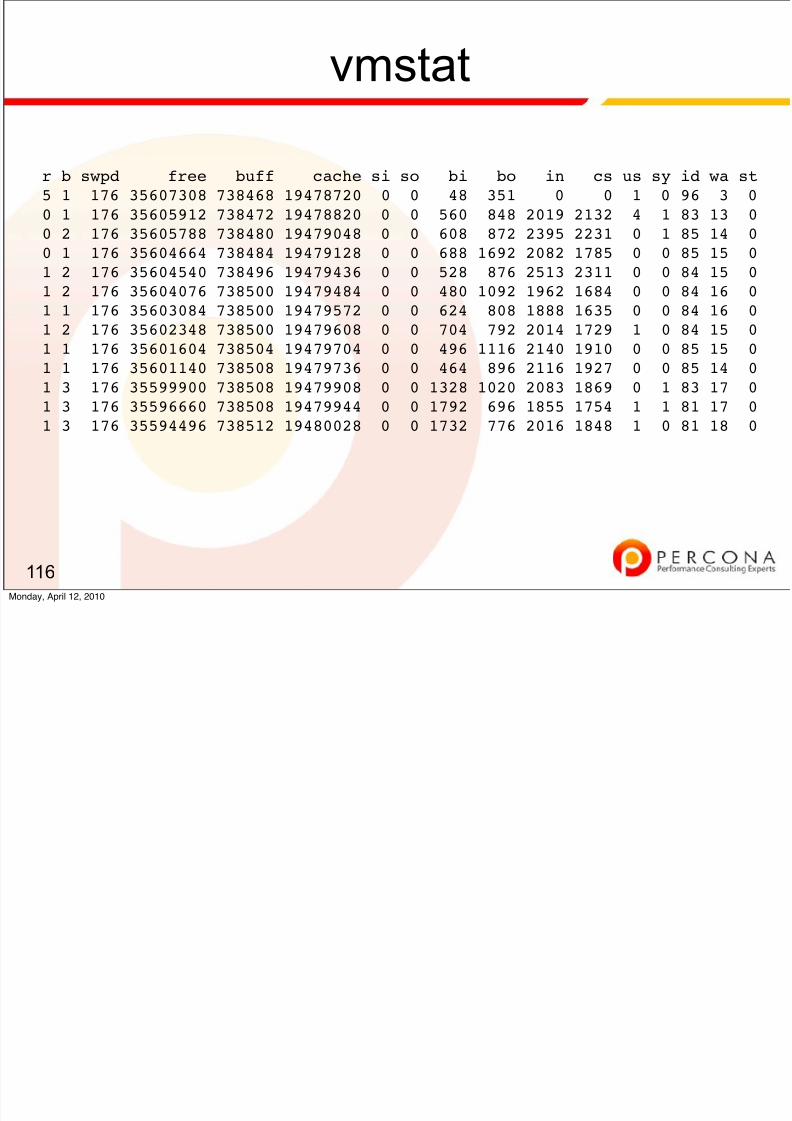
116
r b swpd free buff cache si so bi bo in cs us sy id wa st5 1 176 35607308 738468 19478720 0 0 48 351 0 0 1 0 96 3 00 1 176 35605912 738472 19478820 0 0 560 848 2019 2132 4 1 83 13 00 2 176 35605788 738480 19479048 0 0 608 872 2395 2231 0 1 85 14 00 1 176 35604664 738484 19479128 0 0 688 1692 2082 1785 0 0 85 15 01 2 176 35604540 738496 19479436 0 0 528 876 2513 2311 0 0 84 15 0
1 2 176 35604076 738500 19479484 0 0 480 1092 1962 1684 0 0 84 16 01 1 176 35603084 738500 19479572 0 0 624 808 1888 1635 0 0 84 16 01 2 176 35602348 738500 19479608 0 0 704 792 2014 1729 1 0 84 15 01 1 176 35601604 738504 19479704 0 0 496 1116 2140 1910 0 0 85 15 01 1 176 35601140 738508 19479736 0 0 464 896 2116 1927 0 0 85 14 01 3 176 35599900 738508 19479908 0 0 1328 1020 2083 1869 0 1 83 17 01 3 176 35596660 738508 19479944 0 0 1792 696 1855 1754 1 1 81 17 01 3 176 35594496 738512 19480028 0 0 1732 776 2016 1848 1 0 81 18 0
Monday, April 12, 2010
From vmstat/iostat:

8/8/2019 Diagnosing Fixing Mysql Performance 100412151709 Phpapp01
http://slidepdf.com/reader/full/diagnosing-fixing-mysql-performance-100412151709-phpapp01 124/198
★ It looks like something is blocking commits★ Likely to be either a serious bug (a transaction that has
gotten the commit mutex and is hung?) or a hardware
problem.
★ IO unreasonably slow, so that is probably the problem.
117Monday, April 12, 2010
Analysis
8/8/2019 Diagnosing Fixing Mysql Performance 100412151709 Phpapp01
http://slidepdf.com/reader/full/diagnosing-fixing-mysql-performance-100412151709-phpapp01 125/198
★ Because the system is not "doing anything,"✦ profiling where CPU time is spent is probably useless.✦ We already know that it's spent waiting on mutexes in the
commit problem, so oprofile will probably show nothing.✦ Other options that come to mind:
• profile IO calls with strace -c
• benchmark the IO system, since it seems to be suspicious.
★ But first, a bit more investigation.
118Monday, April 12, 2010
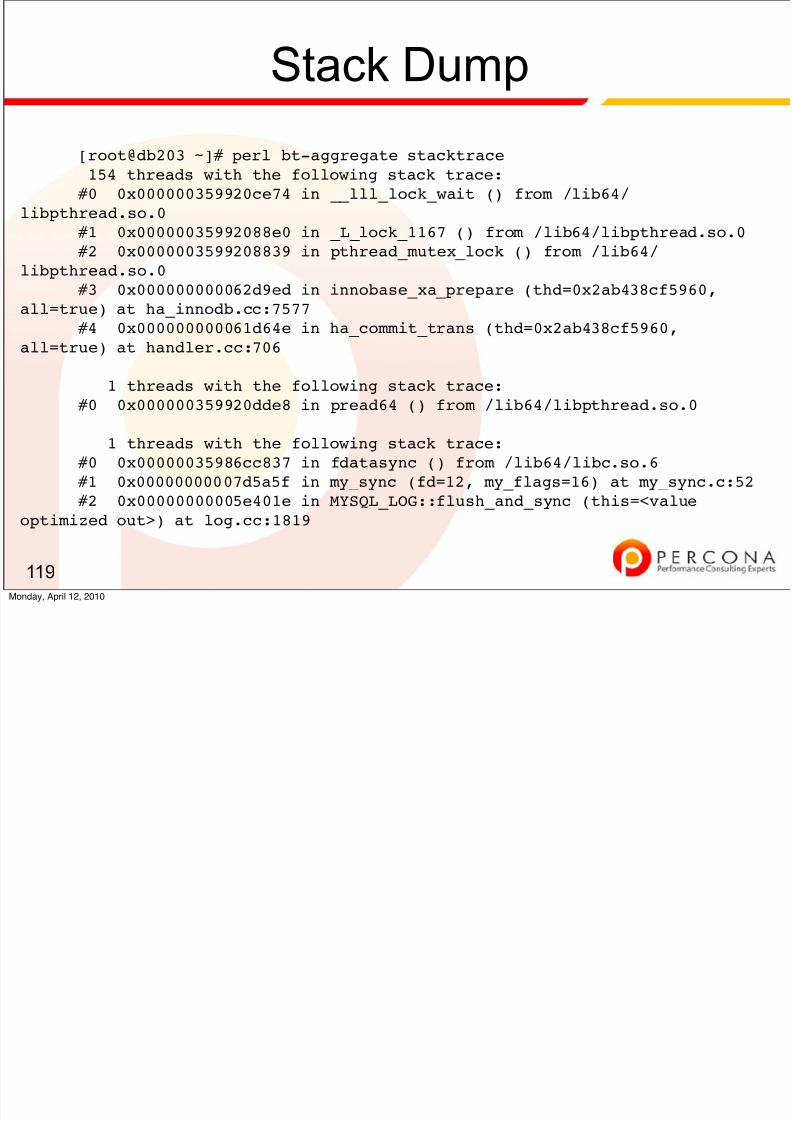
Stack Dump
8/8/2019 Diagnosing Fixing Mysql Performance 100412151709 Phpapp01
http://slidepdf.com/reader/full/diagnosing-fixing-mysql-performance-100412151709-phpapp01 126/198
119
[root@db203 ~]# perl bt-aggregate stacktrace154 threads with the following stack trace:#0 0x000000359920ce74 in __lll_lock_wait () from /lib64/
libpthread.so.0#1 0x00000035992088e0 in _L_lock_1167 () from /lib64/libpthread.so.0#2 0x0000003599208839 in pthread_mutex_lock () from /lib64/
libpthread.so.0
#3 0x000000000062d9ed in innobase_xa_prepare (thd=0x2ab438cf5960,all=true) at ha_innodb.cc:7577#4 0x000000000061d64e in ha_commit_trans (thd=0x2ab438cf5960,
all=true) at handler.cc:706
1 threads with the following stack trace:#0 0x000000359920dde8 in pread64 () from /lib64/libpthread.so.0
1 threads with the following stack trace:#0 0x00000035986cc837 in fdatasync () from /lib64/libc.so.6#1 0x00000000007d5a5f in my_sync (fd=12, my_flags=16) at my_sync.c:52#2 0x00000000005e401e in MYSQL_LOG::flush_and_sync (this=<value
optimized out>) at log.cc:1819
Monday, April 12, 2010
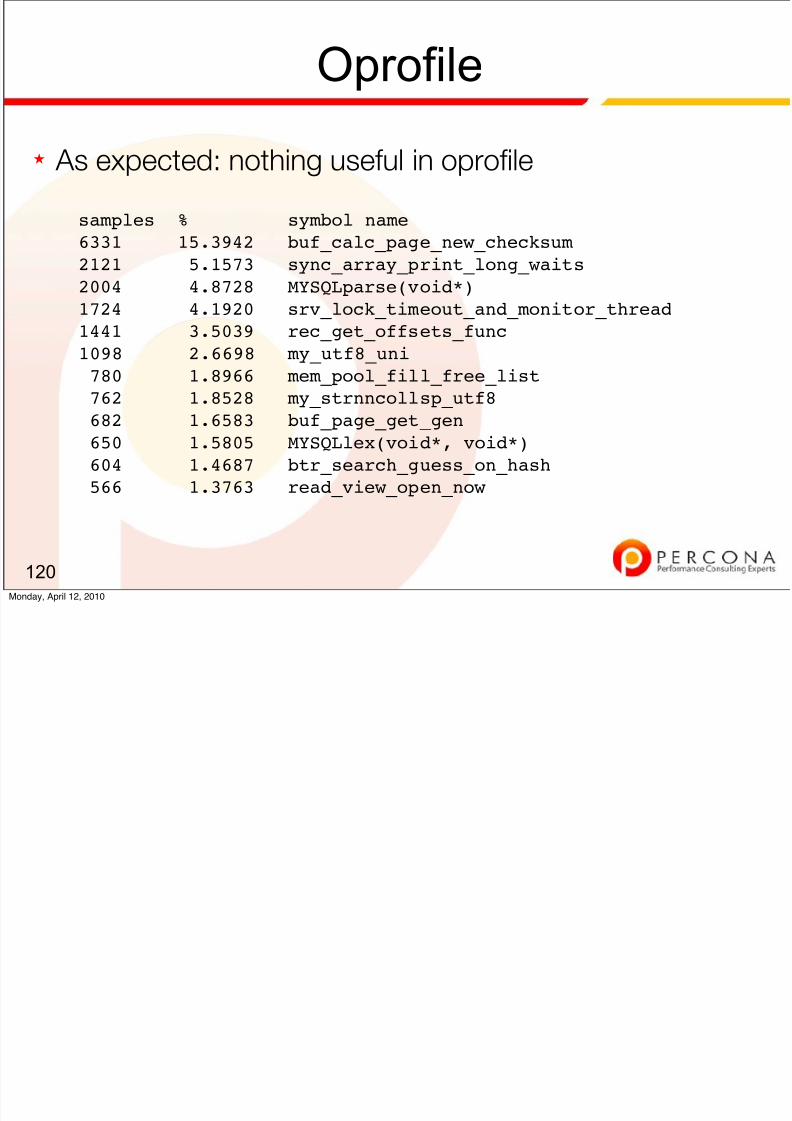
Oprofile
8/8/2019 Diagnosing Fixing Mysql Performance 100412151709 Phpapp01
http://slidepdf.com/reader/full/diagnosing-fixing-mysql-performance-100412151709-phpapp01 127/198
★ As expected: nothing useful in oprofile
120
samples % symbol name6331 15.3942 buf_calc_page_new_checksum 2121 5.1573 sync_array_print_long_waits2004 4.8728 MYSQLparse(void*)1724 4.1920 srv_lock_timeout_and_monitor_thread1441 3.5039 rec_get_offsets_func1098 2.6698 my_utf8_uni780 1.8966 mem_pool_fill_free_list762 1.8528 my_strnncollsp_utf8682 1.6583 buf_page_get_gen
650 1.5805 MYSQLlex(void*, void*)604 1.4687 btr_search_guess_on_hash566 1.3763 read_view_open_now
Monday, April 12, 2010
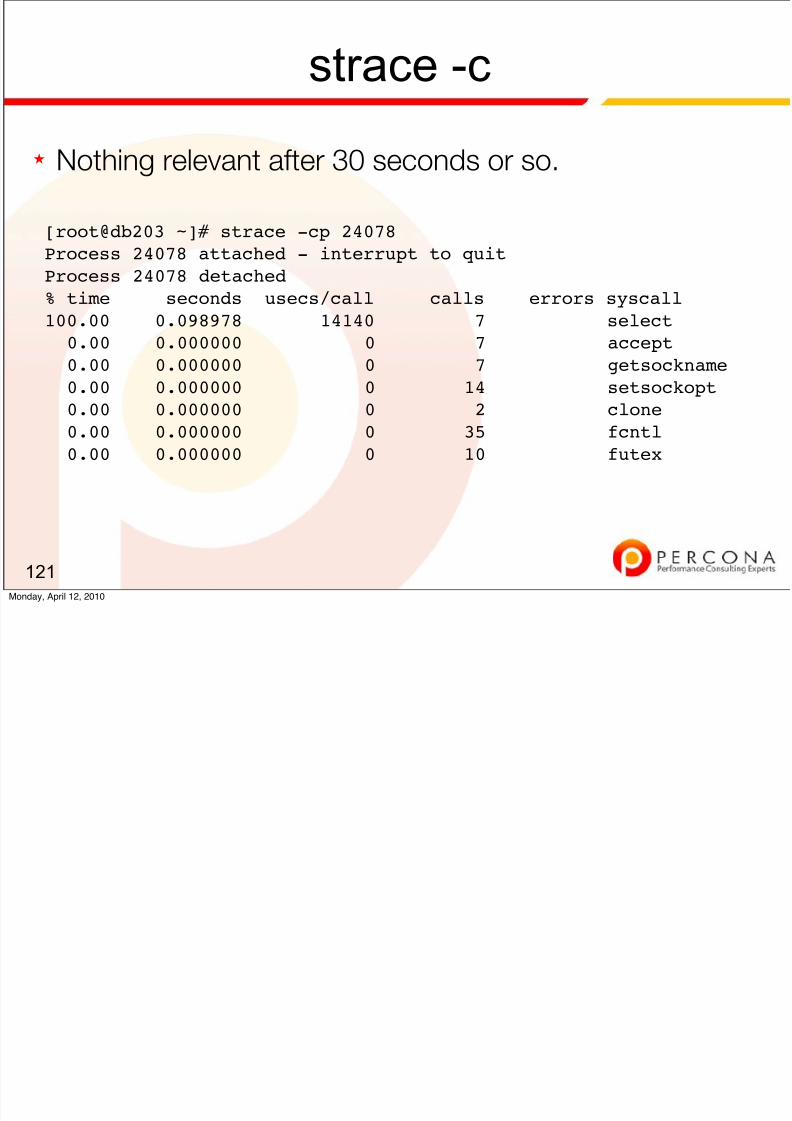
strace -c
8/8/2019 Diagnosing Fixing Mysql Performance 100412151709 Phpapp01
http://slidepdf.com/reader/full/diagnosing-fixing-mysql-performance-100412151709-phpapp01 128/198
★ Nothing relevant after 30 seconds or so.
121
[root@db203 ~]# strace -cp 24078Process 24078 attached - interrupt to quitProcess 24078 detached
% time seconds usecs/call calls errors syscall100.00 0.098978 14140 7 select0.00 0.000000 0 7 accept0.00 0.000000 0 7 getsockname0.00 0.000000 0 14 setsockopt0.00 0.000000 0 2 clone
0.00 0.000000 0 35 fcntl0.00 0.000000 0 10 futex
Monday, April 12, 2010
Examine history

8/8/2019 Diagnosing Fixing Mysql Performance 100412151709 Phpapp01
http://slidepdf.com/reader/full/diagnosing-fixing-mysql-performance-100412151709-phpapp01 129/198
★ Look at 'sar' for historical reference.★ Ask the client to look at their graphs to see if there are
obvious changes around 4PM.
122Monday, April 12, 2010
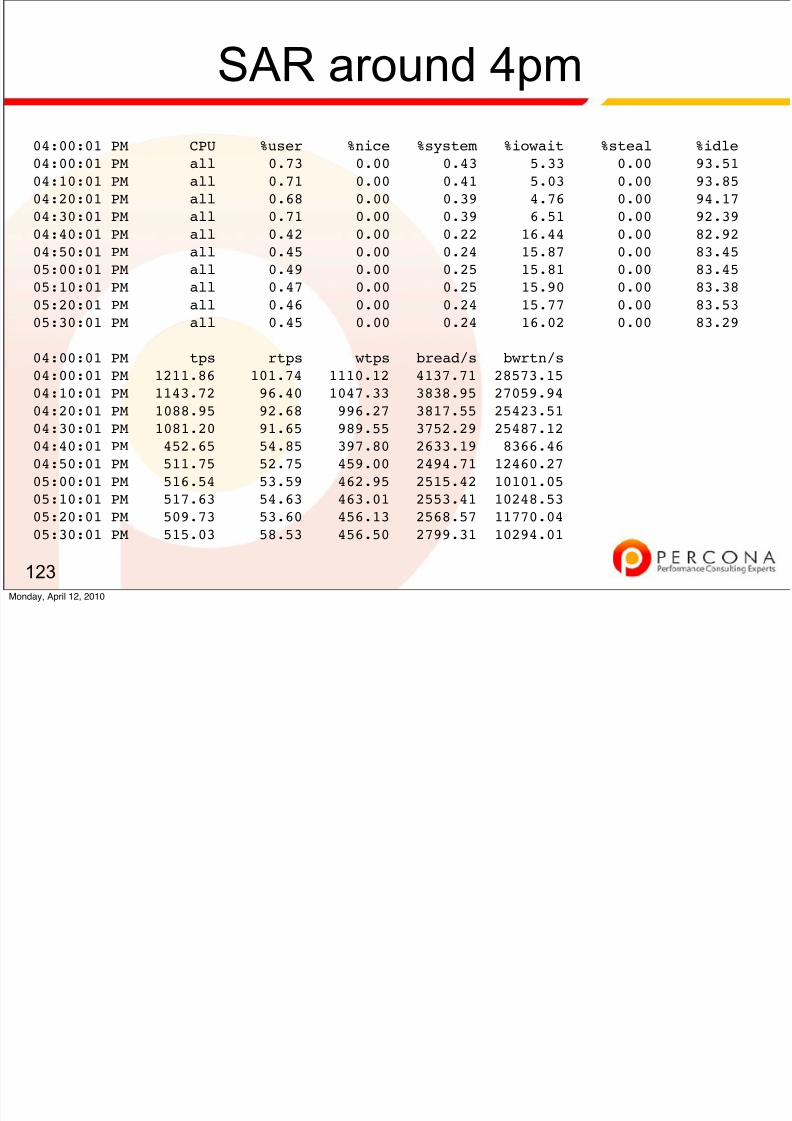
SAR around 4pm
8/8/2019 Diagnosing Fixing Mysql Performance 100412151709 Phpapp01
http://slidepdf.com/reader/full/diagnosing-fixing-mysql-performance-100412151709-phpapp01 130/198
123
04:00:01 PM CPU %user %nice %system %iowait %steal %idle
04:00:01 PM all 0.73 0.00 0.43 5.33 0.00 93.5104:10:01 PM all 0.71 0.00 0.41 5.03 0.00 93.8504:20:01 PM all 0.68 0.00 0.39 4.76 0.00 94.1704:30:01 PM all 0.71 0.00 0.39 6.51 0.00 92.3904:40:01 PM all 0.42 0.00 0.22 16.44 0.00 82.9204:50:01 PM all 0.45 0.00 0.24 15.87 0.00 83.4505:00:01 PM all 0.49 0.00 0.25 15.81 0.00 83.4505:10:01 PM all 0.47 0.00 0.25 15.90 0.00 83.3805:20:01 PM all 0.46 0.00 0.24 15.77 0.00 83.5305:30:01 PM all 0.45 0.00 0.24 16.02 0.00 83.29
04:00:01 PM tps rtps wtps bread/s bwrtn/s04:00:01 PM 1211.86 101.74 1110.12 4137.71 28573.1504:10:01 PM 1143.72 96.40 1047.33 3838.95 27059.9404:20:01 PM 1088.95 92.68 996.27 3817.55 25423.51
04:30:01 PM 1081.20 91.65 989.55 3752.29 25487.1204:40:01 PM 452.65 54.85 397.80 2633.19 8366.4604:50:01 PM 511.75 52.75 459.00 2494.71 12460.2705:00:01 PM 516.54 53.59 462.95 2515.42 10101.0505:10:01 PM 517.63 54.63 463.01 2553.41 10248.5305:20:01 PM 509.73 53.60 456.13 2568.57 11770.0405:30:01 PM 515.03 58.53 456.50 2799.31 10294.01
Monday, April 12, 2010
Observations
8/8/2019 Diagnosing Fixing Mysql Performance 100412151709 Phpapp01
http://slidepdf.com/reader/full/diagnosing-fixing-mysql-performance-100412151709-phpapp01 131/198
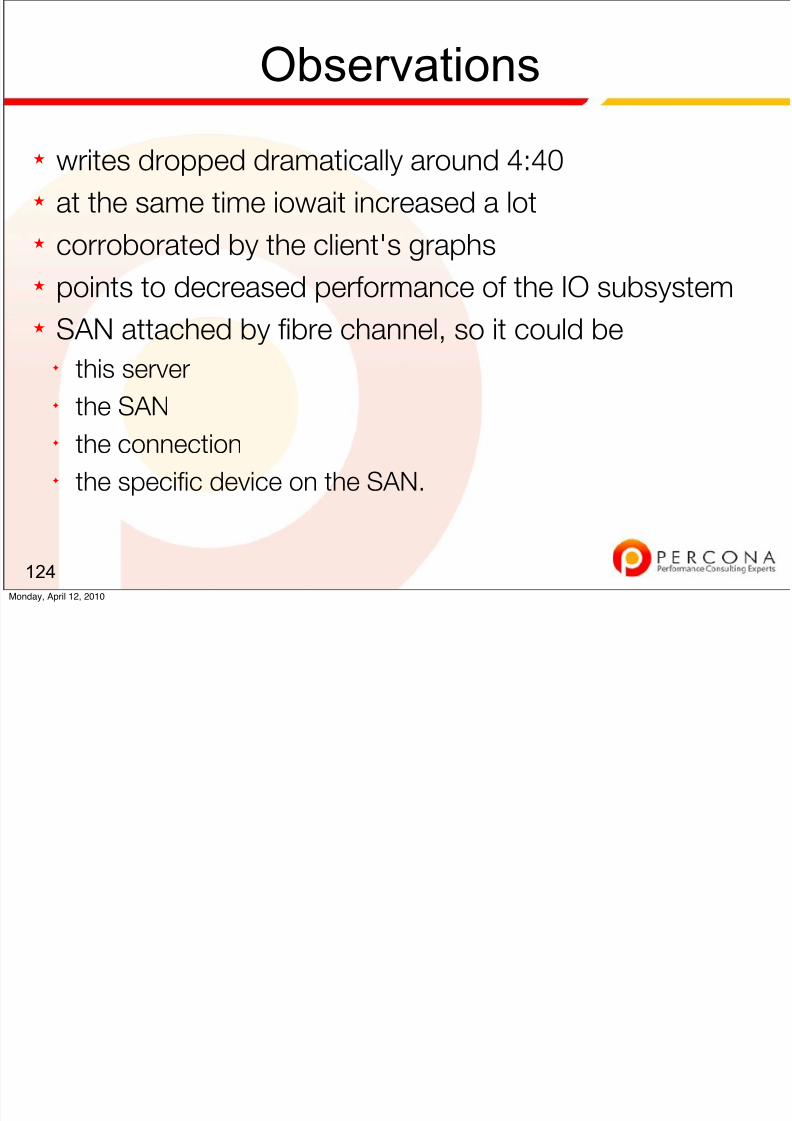
★ writes dropped dramatically around 4:40★ at the same time iowait increased a lot
★ corroborated by the client's graphs
★
points to decreased performance of the IO subsystem★ SAN attached by fibre channel, so it could be
✦ this server✦ the SAN✦ the connection✦ the specific device on the SAN.
124Monday, April 12, 2010
Elimination of Options:
8/8/2019 Diagnosing Fixing Mysql Performance 100412151709 Phpapp01
http://slidepdf.com/reader/full/diagnosing-fixing-mysql-performance-100412151709-phpapp01 132/198
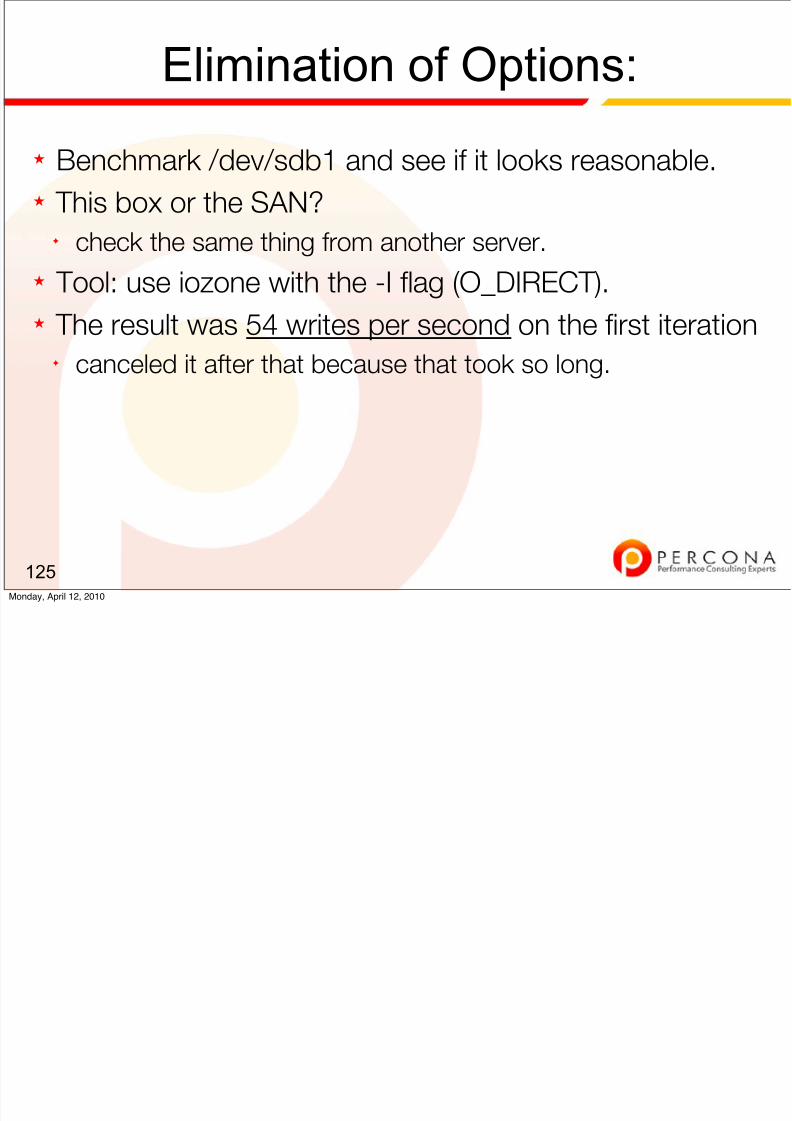
★ Benchmark /dev/sdb1 and see if it looks reasonable.★ This box or the SAN?
✦ check the same thing from another server.
★ Tool: use iozone with the -I flag (O_DIRECT).
★ The result was 54 writes per second on the first iteration✦ canceled it after that because that took so long.
125Monday, April 12, 2010
Pay Dirt!

8/8/2019 Diagnosing Fixing Mysql Performance 100412151709 Phpapp01
http://slidepdf.com/reader/full/diagnosing-fixing-mysql-performance-100412151709-phpapp01 133/198
★ Before I could repeat, customer said RAID failed after all★ Moral of the story: information != facts
★ Customer’s web browser had cached SAN status page!
126Monday, April 12, 2010

8/8/2019 Diagnosing Fixing Mysql Performance 100412151709 Phpapp01
http://slidepdf.com/reader/full/diagnosing-fixing-mysql-performance-100412151709-phpapp01 134/198
Case Study #3
Monday, April 12, 2010
Information from the start:
8/8/2019 Diagnosing Fixing Mysql Performance 100412151709 Phpapp01
http://slidepdf.com/reader/full/diagnosing-fixing-mysql-performance-100412151709-phpapp01 135/198
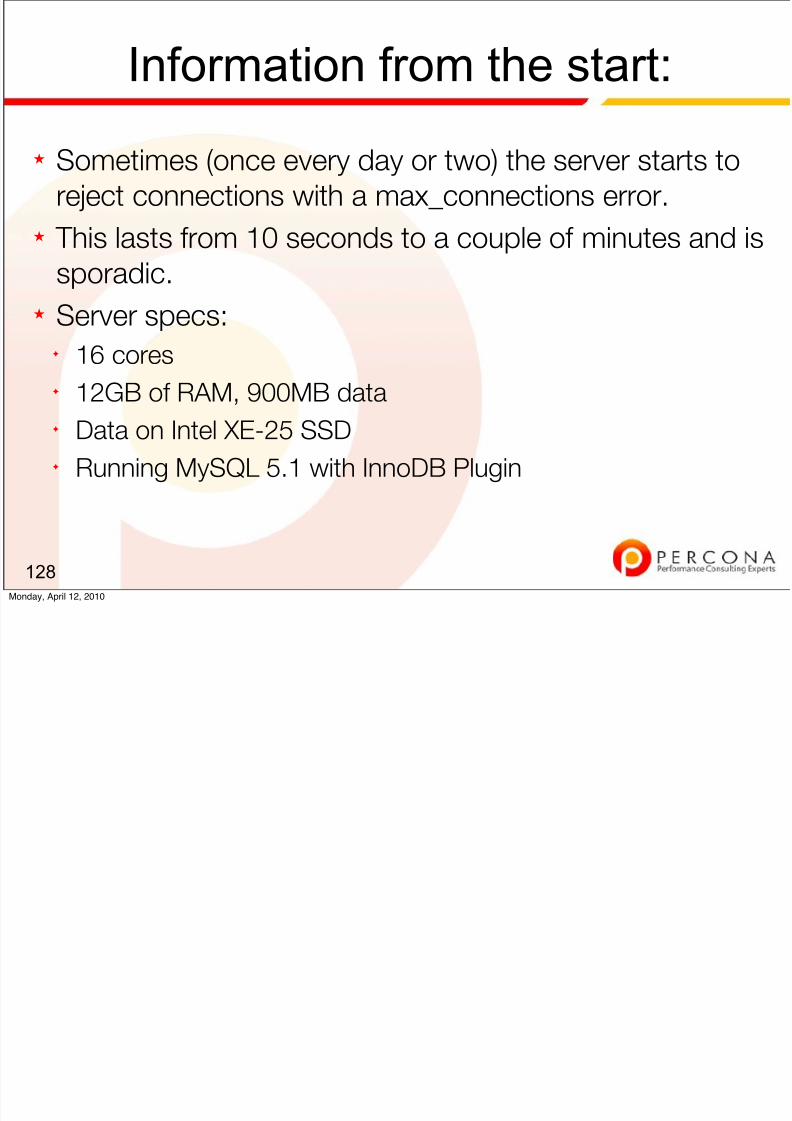
★ Sometimes (once every day or two) the server starts toreject connections with a max_connections error.
★ This lasts from 10 seconds to a couple of minutes and is
sporadic.
★ Server specs:✦ 16 cores✦ 12GB of RAM, 900MB data✦
Data on Intel XE-25 SSD✦ Running MySQL 5.1 with InnoDB Plugin
128Monday, April 12, 2010
Train of Thought

8/8/2019 Diagnosing Fixing Mysql Performance 100412151709 Phpapp01
http://slidepdf.com/reader/full/diagnosing-fixing-mysql-performance-100412151709-phpapp01 136/198
★ Pile-ups cause long queue waits?✦ thus incoming new connections exceed max_connections?
★ Pile-ups can be✦ the query cache✦ InnoDB mutexes✦ et cetera...
129Monday, April 12, 2010
Elimination

8/8/2019 Diagnosing Fixing Mysql Performance 100412151709 Phpapp01
http://slidepdf.com/reader/full/diagnosing-fixing-mysql-performance-100412151709-phpapp01 137/198
★ There are no easy possibilities.★ We'd previously worked with this client and the DB
wasn't the problem then.
★ Queries aren't perfect, but are still running in less than
10ms normally.
130Monday, April 12, 2010
Investigation

8/8/2019 Diagnosing Fixing Mysql Performance 100412151709 Phpapp01
http://slidepdf.com/reader/full/diagnosing-fixing-mysql-performance-100412151709-phpapp01 138/198
★ Nothing is obviously wrong.★ Server looks fine in normal circumstances.
131Monday, April 12, 2010
Analysis

8/8/2019 Diagnosing Fixing Mysql Performance 100412151709 Phpapp01
http://slidepdf.com/reader/full/diagnosing-fixing-mysql-performance-100412151709-phpapp01 139/198
★ We are going to have to capture server activity when theproblem happens.
★ We can't do anything without good diagnostic data.
★ Decision: install 'collect' (from Aspersa) and wait.
132Monday, April 12, 2010
Analysis (cont.)

8/8/2019 Diagnosing Fixing Mysql Performance 100412151709 Phpapp01
http://slidepdf.com/reader/full/diagnosing-fixing-mysql-performance-100412151709-phpapp01 140/198
★ After several pile-ups nothing very helpful was gathered✦ But then we got a good one✦ This took days/a week
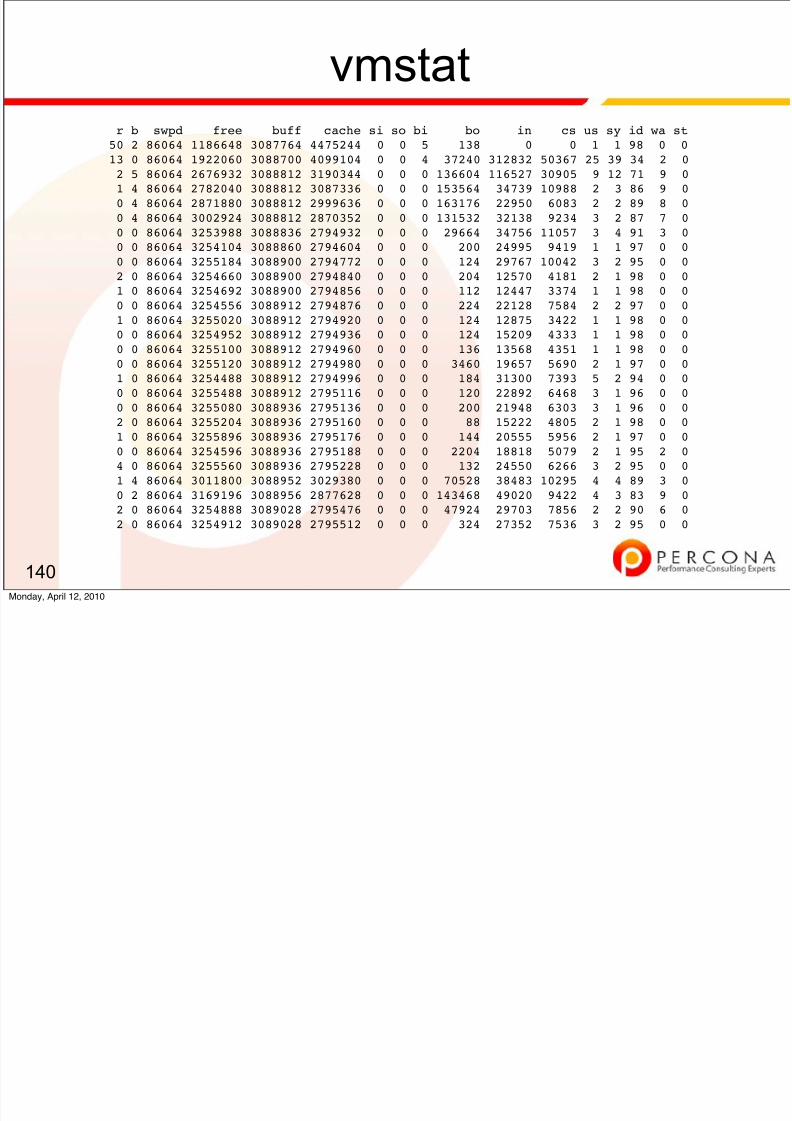
★ Result of diagnostics data: too much information!
133Monday, April 12, 2010
During the Freeze
8/8/2019 Diagnosing Fixing Mysql Performance 100412151709 Phpapp01
http://slidepdf.com/reader/full/diagnosing-fixing-mysql-performance-100412151709-phpapp01 141/198
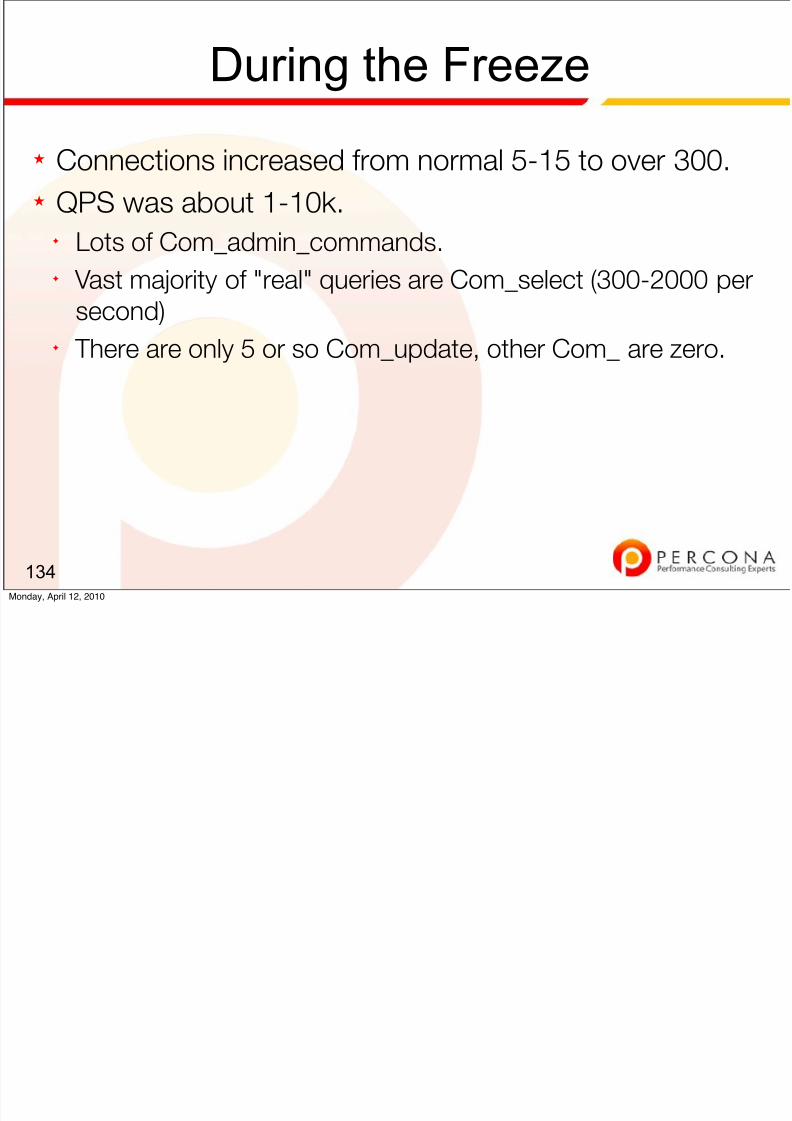
★ Connections increased from normal 5-15 to over 300.★ QPS was about 1-10k.
✦ Lots of Com_admin_commands.✦ Vast majority of "real" queries are Com_select (300-2000 per
second)✦ There are only 5 or so Com_update, other Com_ are zero.
134Monday, April 12, 2010
During the Freeze (cont.)

8/8/2019 Diagnosing Fixing Mysql Performance 100412151709 Phpapp01
http://slidepdf.com/reader/full/diagnosing-fixing-mysql-performance-100412151709-phpapp01 142/198
★ No table locking.★ Lots of query cache activity, but normal-looking.
✦ no lowmem_prunes.
★ 20 to 100 sorts per second✦ between 1k and 12k rows sorted per second.
135Monday, April 12, 2010
During the Freeze (cont.)
8/8/2019 Diagnosing Fixing Mysql Performance 100412151709 Phpapp01
http://slidepdf.com/reader/full/diagnosing-fixing-mysql-performance-100412151709-phpapp01 143/198
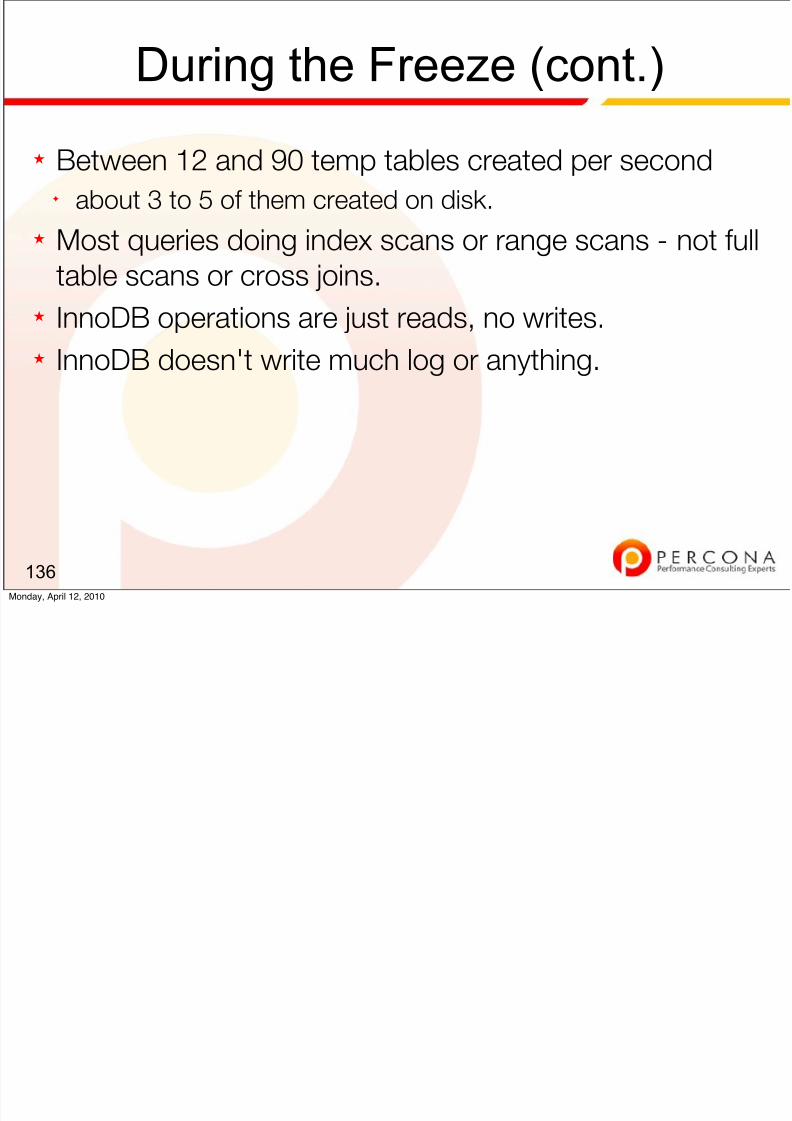
★ Between 12 and 90 temp tables created per second✦ about 3 to 5 of them created on disk.
★ Most queries doing index scans or range scans - not full
table scans or cross joins.
★ InnoDB operations are just reads, no writes.
★ InnoDB doesn't write much log or anything.
136Monday, April 12, 2010
During the Freeze (cont.)
8/8/2019 Diagnosing Fixing Mysql Performance 100412151709 Phpapp01
http://slidepdf.com/reader/full/diagnosing-fixing-mysql-performance-100412151709-phpapp01 144/198
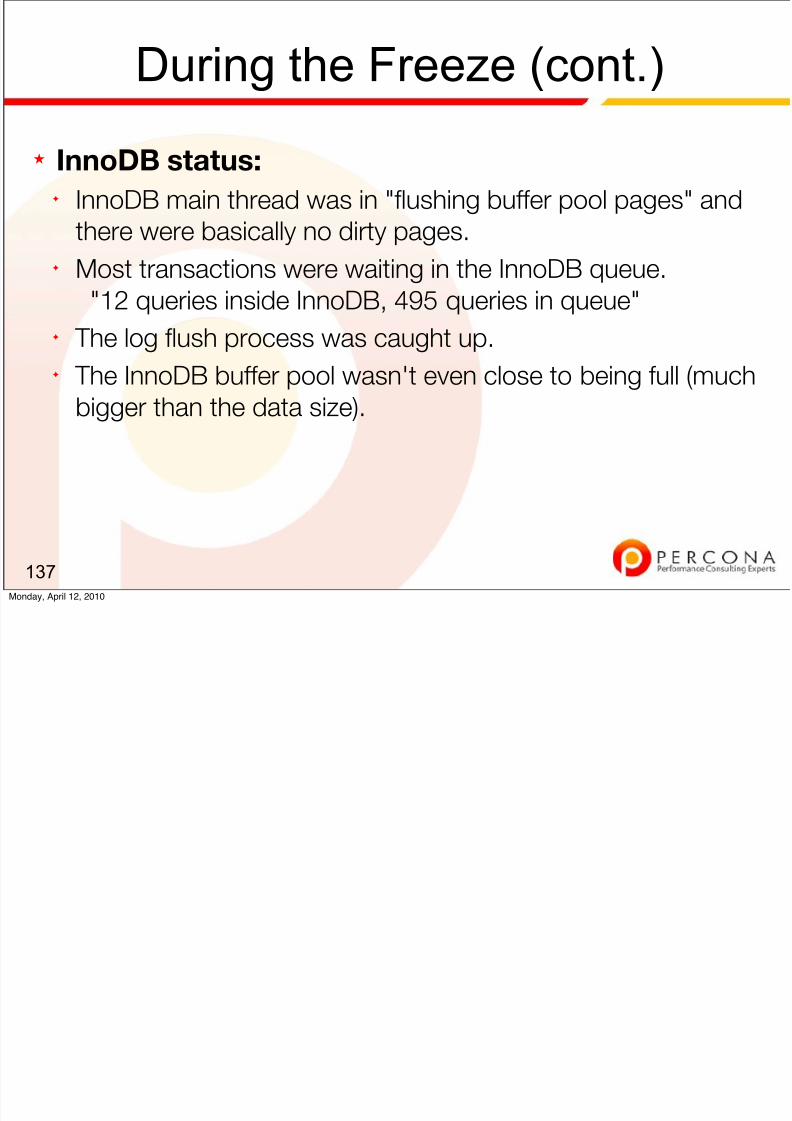
★ InnoDB status:✦ InnoDB main thread was in "flushing buffer pool pages" and
there were basically no dirty pages.✦ Most transactions were waiting in the InnoDB queue.
"12 queries inside InnoDB, 495 queries in queue"✦ The log flush process was caught up.✦ The InnoDB buffer pool wasn't even close to being full (much
bigger than the data size).
137Monday, April 12, 2010
8/8/2019 Diagnosing Fixing Mysql Performance 100412151709 Phpapp01
http://slidepdf.com/reader/full/diagnosing-fixing-mysql-performance-100412151709-phpapp01 145/198
iostat
8/8/2019 Diagnosing Fixing Mysql Performance 100412151709 Phpapp01
http://slidepdf.com/reader/full/diagnosing-fixing-mysql-performance-100412151709-phpapp01 146/198
139
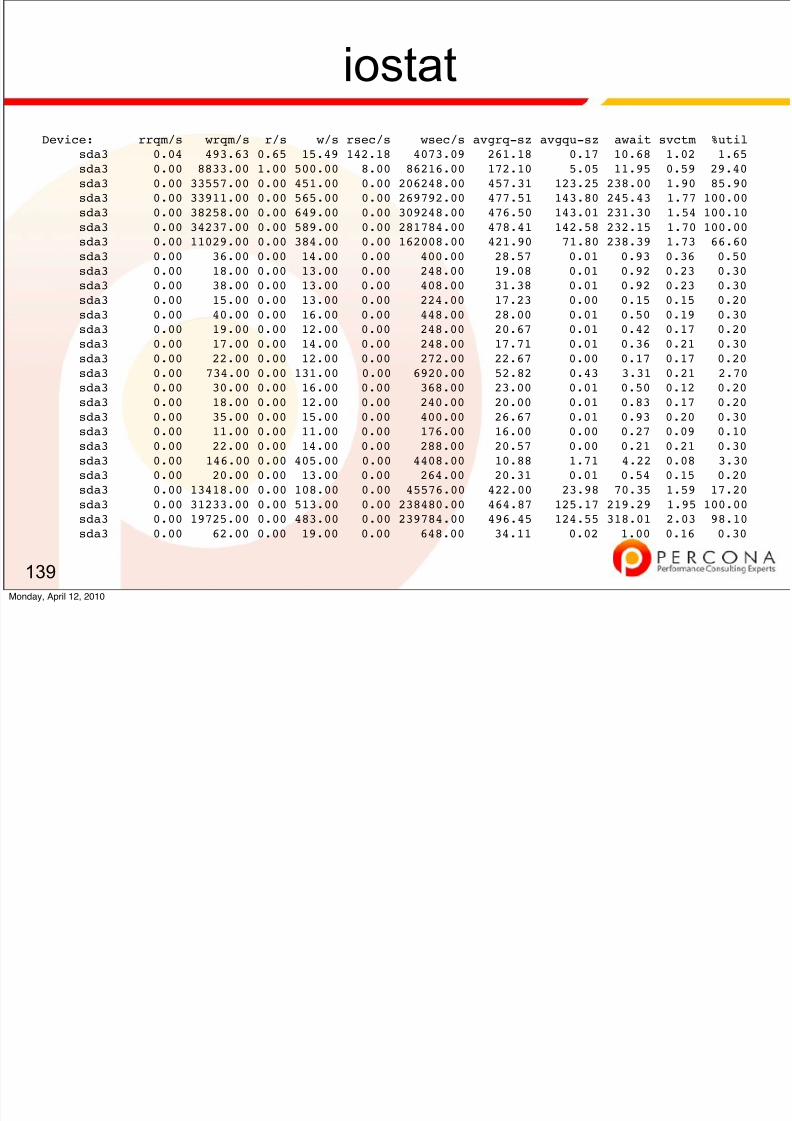
Device: rrqm/s wrqm/s r/s w/s rsec/s wsec/s avgrq-sz avgqu-sz await svctm %utilsda3 0.04 493.63 0.65 15.49 142.18 4073.09 261.18 0.17 10.68 1.02 1.65sda3 0.00 8833.00 1.00 500.00 8.00 86216.00 172.10 5.05 11.95 0.59 29.40sda3 0.00 33557.00 0.00 451.00 0.00 206248.00 457.31 123.25 238.00 1.90 85.90sda3 0.00 33911.00 0.00 565.00 0.00 269792.00 477.51 143.80 245.43 1.77 100.00sda3 0.00 38258.00 0.00 649.00 0.00 309248.00 476.50 143.01 231.30 1.54 100.10sda3 0.00 34237.00 0.00 589.00 0.00 281784.00 478.41 142.58 232.15 1.70 100.00sda3 0.00 11029.00 0.00 384.00 0.00 162008.00 421.90 71.80 238.39 1.73 66.60sda3 0.00 36.00 0.00 14.00 0.00 400.00 28.57 0.01 0.93 0.36 0.50sda3 0.00 18.00 0.00 13.00 0.00 248.00 19.08 0.01 0.92 0.23 0.30sda3 0.00 38.00 0.00 13.00 0.00 408.00 31.38 0.01 0.92 0.23 0.30
sda3 0.00 15.00 0.00 13.00 0.00 224.00 17.23 0.00 0.15 0.15 0.20sda3 0.00 40.00 0.00 16.00 0.00 448.00 28.00 0.01 0.50 0.19 0.30sda3 0.00 19.00 0.00 12.00 0.00 248.00 20.67 0.01 0.42 0.17 0.20sda3 0.00 17.00 0.00 14.00 0.00 248.00 17.71 0.01 0.36 0.21 0.30sda3 0.00 22.00 0.00 12.00 0.00 272.00 22.67 0.00 0.17 0.17 0.20sda3 0.00 734.00 0.00 131.00 0.00 6920.00 52.82 0.43 3.31 0.21 2.70sda3 0.00 30.00 0.00 16.00 0.00 368.00 23.00 0.01 0.50 0.12 0.20sda3 0.00 18.00 0.00 12.00 0.00 240.00 20.00 0.01 0.83 0.17 0.20sda3 0.00 35.00 0.00 15.00 0.00 400.00 26.67 0.01 0.93 0.20 0.30sda3 0.00 11.00 0.00 11.00 0.00 176.00 16.00 0.00 0.27 0.09 0.10sda3 0.00 22.00 0.00 14.00 0.00 288.00 20.57 0.00 0.21 0.21 0.30sda3 0.00 146.00 0.00 405.00 0.00 4408.00 10.88 1.71 4.22 0.08 3.30sda3 0.00 20.00 0.00 13.00 0.00 264.00 20.31 0.01 0.54 0.15 0.20sda3 0.00 13418.00 0.00 108.00 0.00 45576.00 422.00 23.98 70.35 1.59 17.20sda3 0.00 31233.00 0.00 513.00 0.00 238480.00 464.87 125.17 219.29 1.95 100.00sda3 0.00 19725.00 0.00 483.00 0.00 239784.00 496.45 124.55 318.01 2.03 98.10sda3 0.00 62.00 0.00 19.00 0.00 648.00 34.11 0.02 1.00 0.16 0.30
Monday, April 12, 2010
vmstat
8/8/2019 Diagnosing Fixing Mysql Performance 100412151709 Phpapp01
http://slidepdf.com/reader/full/diagnosing-fixing-mysql-performance-100412151709-phpapp01 147/198
140
r b swpd free buff cache si so bi bo in cs us sy id wa st50 2 86064 1186648 3087764 4475244 0 0 5 138 0 0 1 1 98 0 0
13 0 86064 1922060 3088700 4099104 0 0 4 37240 312832 50367 25 39 34 2 02 5 86064 2676932 3088812 3190344 0 0 0 136604 116527 30905 9 12 71 9 01 4 86064 2782040 3088812 3087336 0 0 0 153564 34739 10988 2 3 86 9 00 4 86064 2871880 3088812 2999636 0 0 0 163176 22950 6083 2 2 89 8 00 4 86064 3002924 3088812 2870352 0 0 0 131532 32138 9234 3 2 87 7 00 0 86064 3253988 3088836 2794932 0 0 0 29664 34756 11057 3 4 91 3 00 0 86064 3254104 3088860 2794604 0 0 0 200 24995 9419 1 1 97 0 00 0 86064 3255184 3088900 2794772 0 0 0 124 29767 10042 3 2 95 0 02 0 86064 3254660 3088900 2794840 0 0 0 204 12570 4181 2 1 98 0 01 0 86064 3254692 3088900 2794856 0 0 0 112 12447 3374 1 1 98 0 0
0 0 86064 3254556 3088912 2794876 0 0 0 224 22128 7584 2 2 97 0 01 0 86064 3255020 3088912 2794920 0 0 0 124 12875 3422 1 1 98 0 00 0 86064 3254952 3088912 2794936 0 0 0 124 15209 4333 1 1 98 0 00 0 86064 3255100 3088912 2794960 0 0 0 136 13568 4351 1 1 98 0 00 0 86064 3255120 3088912 2794980 0 0 0 3460 19657 5690 2 1 97 0 01 0 86064 3254488 3088912 2794996 0 0 0 184 31300 7393 5 2 94 0 00 0 86064 3255488 3088912 2795116 0 0 0 120 22892 6468 3 1 96 0 00 0 86064 3255080 3088936 2795136 0 0 0 200 21948 6303 3 1 96 0 02 0 86064 3255204 3088936 2795160 0 0 0 88 15222 4805 2 1 98 0 0
1 0 86064 3255896 3088936 2795176 0 0 0 144 20555 5956 2 1 97 0 00 0 86064 3254596 3088936 2795188 0 0 0 2204 18818 5079 2 1 95 2 04 0 86064 3255560 3088936 2795228 0 0 0 132 24550 6266 3 2 95 0 01 4 86064 3011800 3088952 3029380 0 0 0 70528 38483 10295 4 4 89 3 00 2 86064 3169196 3088956 2877628 0 0 0 143468 49020 9422 4 3 83 9 02 0 86064 3254888 3089028 2795476 0 0 0 47924 29703 7856 2 2 90 6 02 0 86064 3254912 3089028 2795512 0 0 0 324 27352 7536 3 2 95 0 0
Monday, April 12, 2010
Iostats, formatted incrementally:
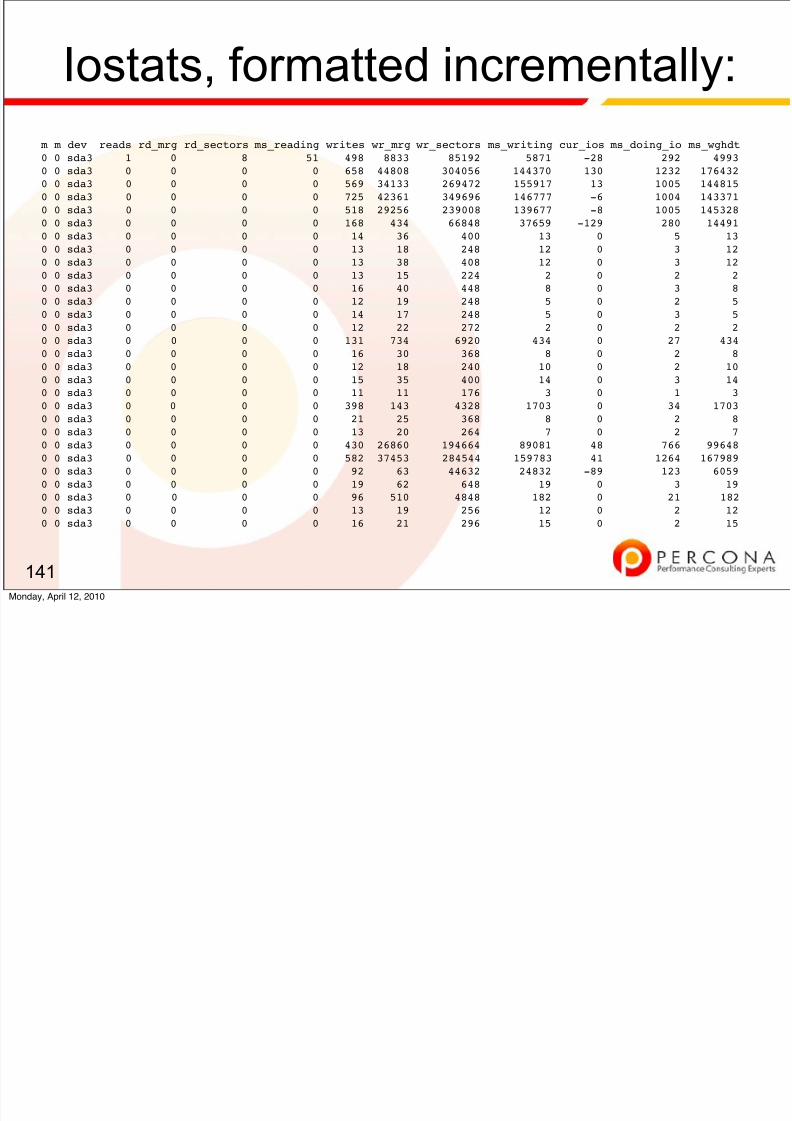
8/8/2019 Diagnosing Fixing Mysql Performance 100412151709 Phpapp01
http://slidepdf.com/reader/full/diagnosing-fixing-mysql-performance-100412151709-phpapp01 148/198
141
m m dev reads rd_mrg rd_sectors ms_reading writes wr_mrg wr_sectors ms_writing cur_ios ms_doing_io ms_wghdt
0 0 sda3 1 0 8 51 498 8833 85192 5871 -28 292 49930 0 sda3 0 0 0 0 658 44808 304056 144370 130 1232 1764320 0 sda3 0 0 0 0 569 34133 269472 155917 13 1005 1448150 0 sda3 0 0 0 0 725 42361 349696 146777 -6 1004 1433710 0 sda3 0 0 0 0 518 29256 239008 139677 -8 1005 1453280 0 sda3 0 0 0 0 168 434 66848 37659 -129 280 144910 0 sda3 0 0 0 0 14 36 400 13 0 5 130 0 sda3 0 0 0 0 13 18 248 12 0 3 120 0 sda3 0 0 0 0 13 38 408 12 0 3 120 0 sda3 0 0 0 0 13 15 224 2 0 2 20 0 sda3 0 0 0 0 16 40 448 8 0 3 8
0 0 sda3 0 0 0 0 12 19 248 5 0 2 50 0 sda3 0 0 0 0 14 17 248 5 0 3 50 0 sda3 0 0 0 0 12 22 272 2 0 2 20 0 sda3 0 0 0 0 131 734 6920 434 0 27 4340 0 sda3 0 0 0 0 16 30 368 8 0 2 80 0 sda3 0 0 0 0 12 18 240 10 0 2 100 0 sda3 0 0 0 0 15 35 400 14 0 3 140 0 sda3 0 0 0 0 11 11 176 3 0 1 30 0 sda3 0 0 0 0 398 143 4328 1703 0 34 17030 0 sda3 0 0 0 0 21 25 368 8 0 2 80 0 sda3 0 0 0 0 13 20 264 7 0 2 70 0 sda3 0 0 0 0 430 26860 194664 89081 48 766 996480 0 sda3 0 0 0 0 582 37453 284544 159783 41 1264 1679890 0 sda3 0 0 0 0 92 63 44632 24832 -89 123 60590 0 sda3 0 0 0 0 19 62 648 19 0 3 190 0 sda3 0 0 0 0 96 510 4848 182 0 21 1820 0 sda3 0 0 0 0 13 19 256 12 0 2 120 0 sda3 0 0 0 0 16 21 296 15 0 2 15
Monday, April 12, 2010
Oprofile

8/8/2019 Diagnosing Fixing Mysql Performance 100412151709 Phpapp01
http://slidepdf.com/reader/full/diagnosing-fixing-mysql-performance-100412151709-phpapp01 149/198
142
samples % image name app name symbol name
473653 63.5323 no-vmlinux no-vmlinux /no-vmlinux95164 12.7646 mysqld mysqld /usr/libexec/mysqld53107 7.1234 libc-2.10.1.so libc-2.10.1.so memcpy13698 1.8373 ha_innodb.so ha_innodb.so build_template()13059 1.7516 ha_innodb.so ha_innodb.so btr_search_guess_on_hash11724 1.5726 ha_innodb.so ha_innodb.so row_sel_store_mysql_rec8872 1.1900 ha_innodb.so ha_innodb.so rec_init_offsets_comp_ordinary7577 1.0163 ha_innodb.so ha_innodb.so row_search_for_mysql6030 0.8088 ha_innodb.so ha_innodb.so rec_get_offsets_func5268 0.7066 ha_innodb.so ha_innodb.so cmp_dtuple_rec_with_match
Monday, April 12, 2010
Analysis:
8/8/2019 Diagnosing Fixing Mysql Performance 100412151709 Phpapp01
http://slidepdf.com/reader/full/diagnosing-fixing-mysql-performance-100412151709-phpapp01 150/198
★ There is a lot of data here★ most of it points to nothing in particular except "need
more research."✦ For example, in oprofile, what does build_template() do in
InnoDB?✦ Why is memcpy() such a big consumer of time?✦ Wat is hidden within the 'mysqld' image/symbol?
★
We could spend a lot of time on these things.
143Monday, April 12, 2010
Analysis (cont.)
8/8/2019 Diagnosing Fixing Mysql Performance 100412151709 Phpapp01
http://slidepdf.com/reader/full/diagnosing-fixing-mysql-performance-100412151709-phpapp01 151/198
★
In looking for things that just don't make sense, theiostat data is very strange.
★ We can see hundreds of MB per second written to disk
for sustained periods
★ but there isn't even that much data in the whole
database.
★ So clearly this can't simply be InnoDB's "furious
flushing" problem★ mysqladmin status confirms that.
144Monday, April 12, 2010
Analysis (cont.)
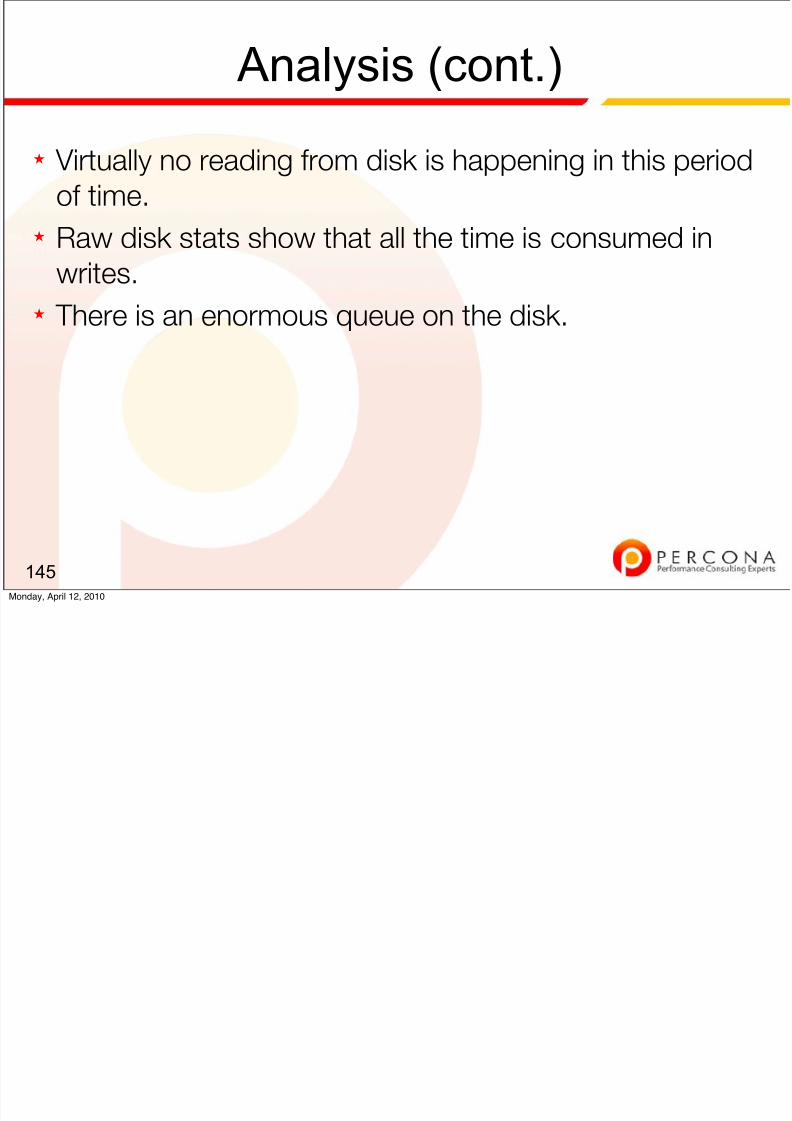
8/8/2019 Diagnosing Fixing Mysql Performance 100412151709 Phpapp01
http://slidepdf.com/reader/full/diagnosing-fixing-mysql-performance-100412151709-phpapp01 152/198
★
Virtually no reading from disk is happening in this periodof time.
★ Raw disk stats show that all the time is consumed in
writes.
★ There is an enormous queue on the disk.
145Monday, April 12, 2010
Analysis (cont.)
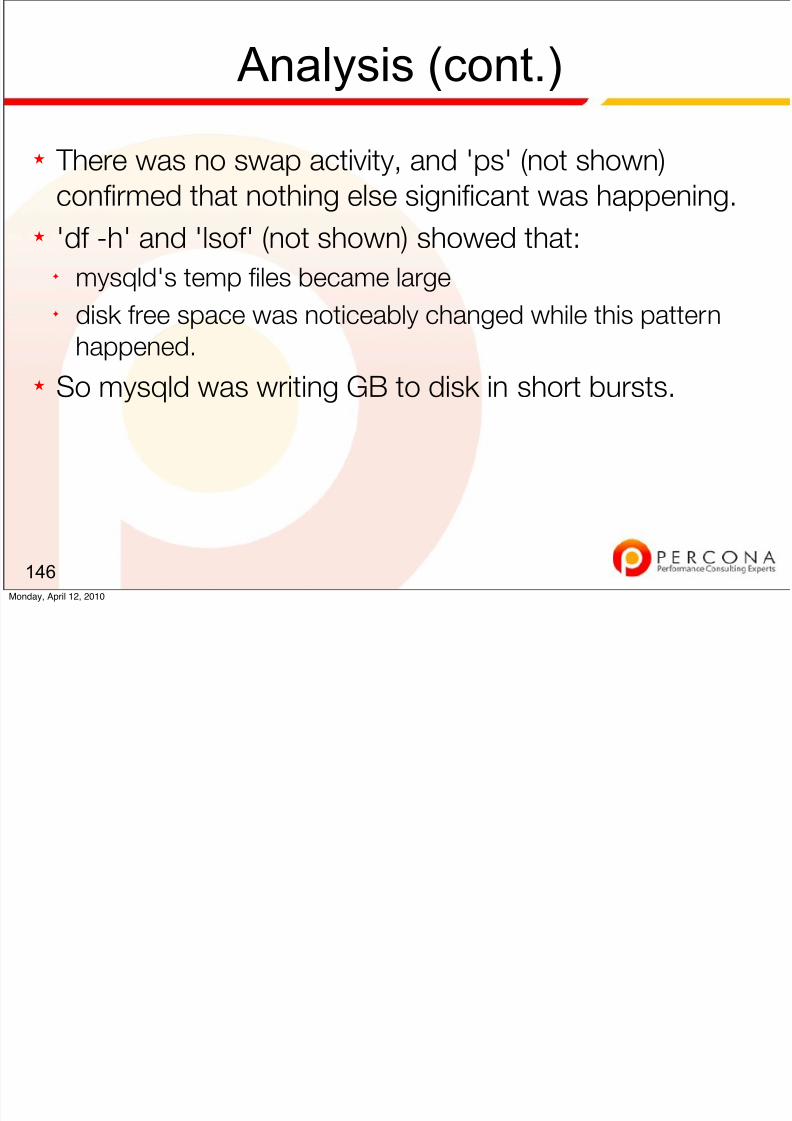
8/8/2019 Diagnosing Fixing Mysql Performance 100412151709 Phpapp01
http://slidepdf.com/reader/full/diagnosing-fixing-mysql-performance-100412151709-phpapp01 153/198
★
There was no swap activity, and 'ps' (not shown)confirmed that nothing else significant was happening.
★ 'df -h' and 'lsof' (not shown) showed that:✦ mysqld's temp files became large✦ disk free space was noticeably changed while this pattern
happened.
★ So mysqld was writing GB to disk in short bursts.
146Monday, April 12, 2010
Analysis (cont.)
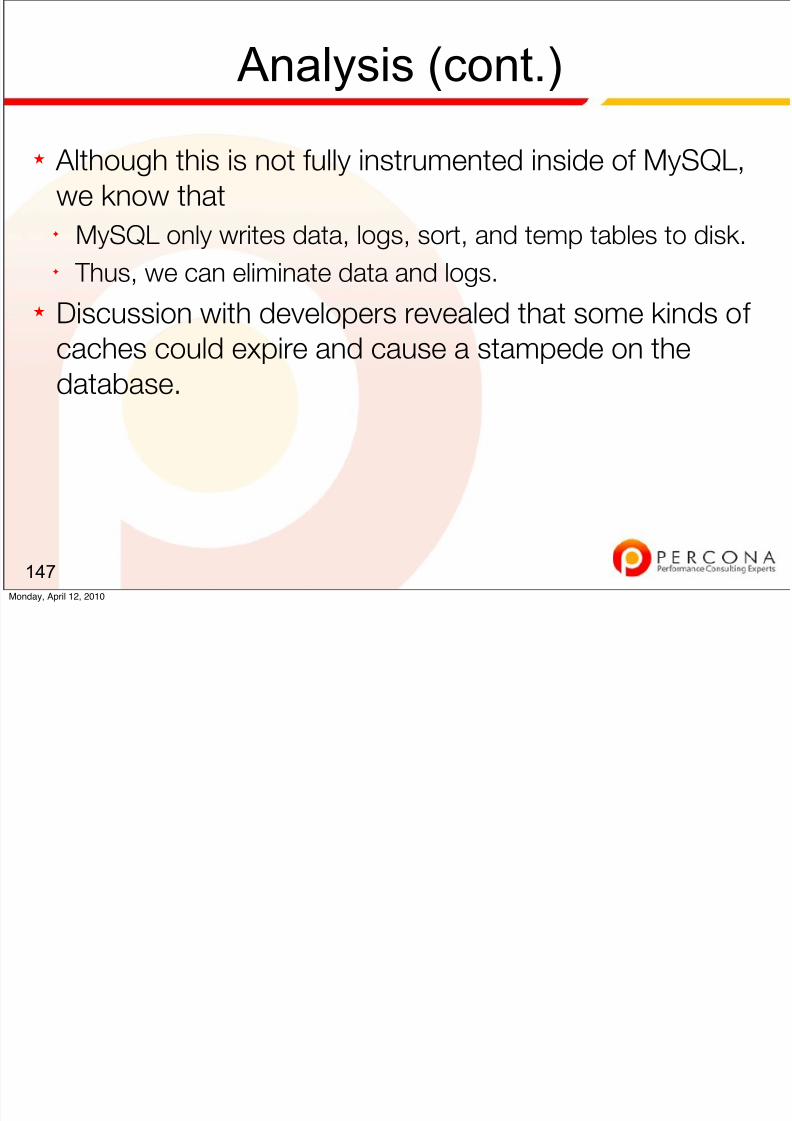
8/8/2019 Diagnosing Fixing Mysql Performance 100412151709 Phpapp01
http://slidepdf.com/reader/full/diagnosing-fixing-mysql-performance-100412151709-phpapp01 154/198
★
Although this is not fully instrumented inside of MySQL,we know that✦ MySQL only writes data, logs, sort, and temp tables to disk.✦ Thus, we can eliminate data and logs.
★ Discussion with developers revealed that some kinds of
caches could expire and cause a stampede on the
database.
147Monday, April 12, 2010
Conclusion
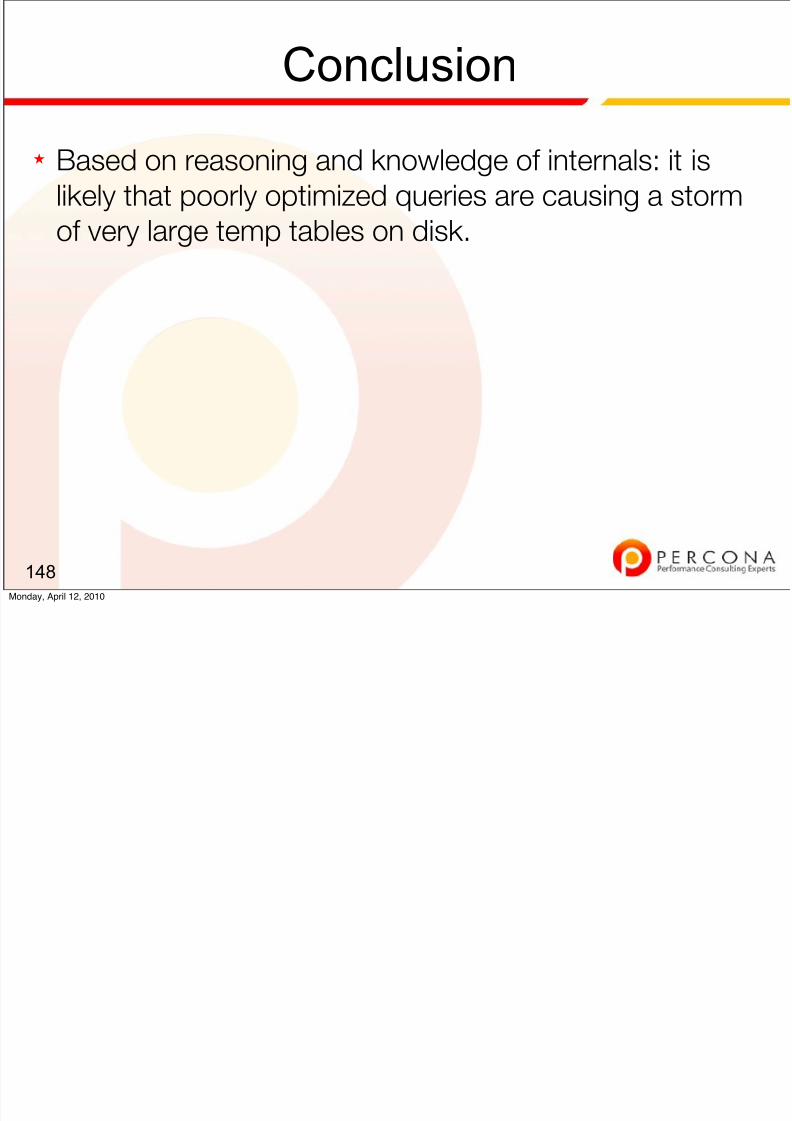
8/8/2019 Diagnosing Fixing Mysql Performance 100412151709 Phpapp01
http://slidepdf.com/reader/full/diagnosing-fixing-mysql-performance-100412151709-phpapp01 155/198
★
Based on reasoning and knowledge of internals: it islikely that poorly optimized queries are causing a storm
of very large temp tables on disk.
148Monday, April 12, 2010
Plan of Attack

8/8/2019 Diagnosing Fixing Mysql Performance 100412151709 Phpapp01
http://slidepdf.com/reader/full/diagnosing-fixing-mysql-performance-100412151709-phpapp01 156/198
★
Optimize the 2 major kinds of queries found in SHOWPROCESSLIST so they don't use temp tables on disk.
★ These queries are fine in isolation, but when there is a
rush on the database, can pile up.
★ So far, results are very encouraging.
149Monday, April 12, 2010
Table Of Contents
8/8/2019 Diagnosing Fixing Mysql Performance 100412151709 Phpapp01
http://slidepdf.com/reader/full/diagnosing-fixing-mysql-performance-100412151709-phpapp01 157/198
150
0. Welcome 5. Your Toolchest
1. Defining Performance 6. CPUs and Tasks
2. The Stack at 10000 Feet 7. Utilization versus Backlog
3. Isolating Problems 8. External-to-the-database Problems
4. Approaching the Stack 9. Conclusion
Monday, April 12, 2010
CPU Scalability
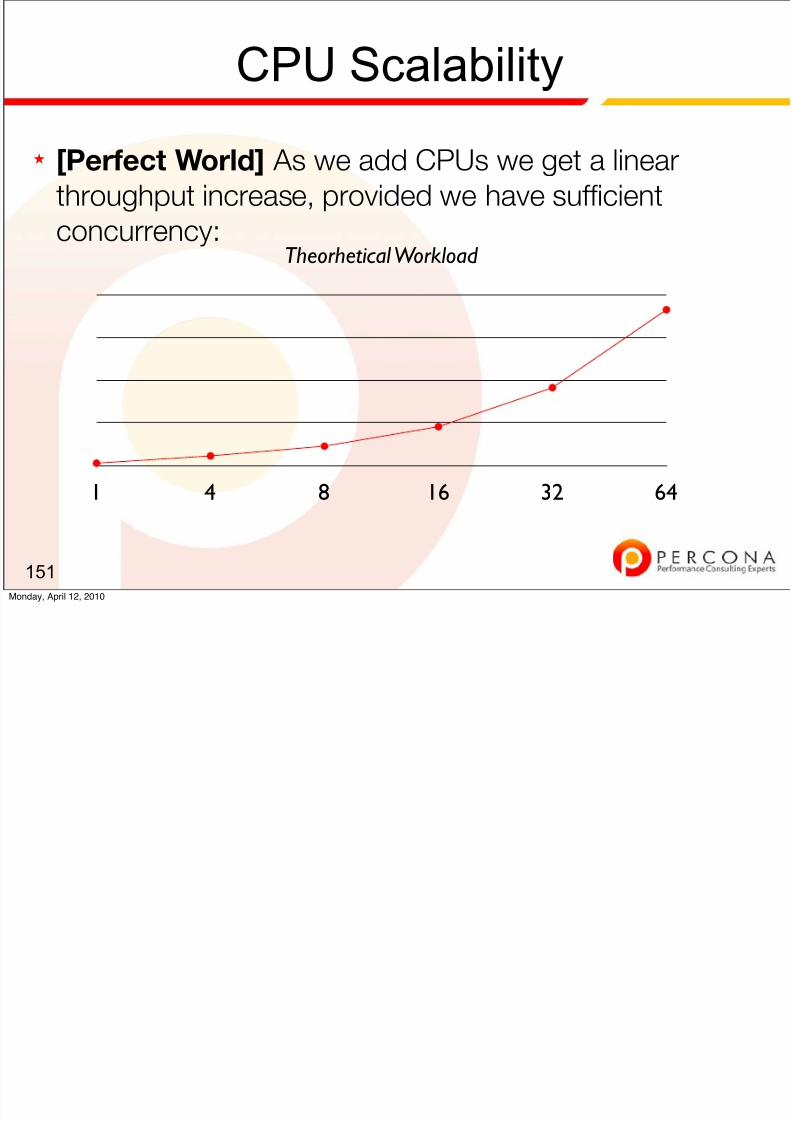
8/8/2019 Diagnosing Fixing Mysql Performance 100412151709 Phpapp01
http://slidepdf.com/reader/full/diagnosing-fixing-mysql-performance-100412151709-phpapp01 158/198
★
[Perfect World] As we add CPUs we get a linearthroughput increase, provided we have sufficient
concurrency:
151
1 4 8 16 32 64
Theorhetical Workload
Monday, April 12, 2010
CPU Scalability
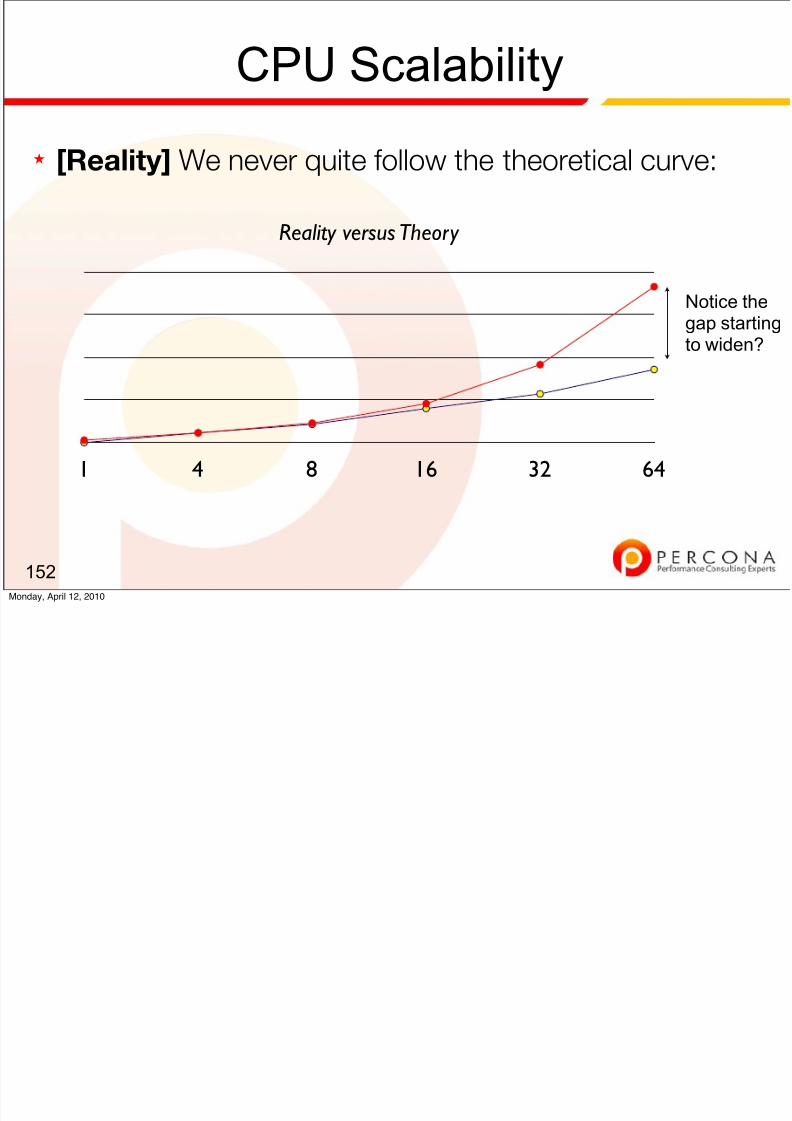
8/8/2019 Diagnosing Fixing Mysql Performance 100412151709 Phpapp01
http://slidepdf.com/reader/full/diagnosing-fixing-mysql-performance-100412151709-phpapp01 159/198
★
[Reality] We never quite follow the theoretical curve:
152
1 4 8 16 32 64
Reality versus Theory
Notice thegap startingto widen?
Monday, April 12, 2010

8/8/2019 Diagnosing Fixing Mysql Performance 100412151709 Phpapp01
http://slidepdf.com/reader/full/diagnosing-fixing-mysql-performance-100412151709-phpapp01 160/198
Mutex Contention.
This is the most likely reason.
Monday, April 12, 2010
What’s a Mutex?
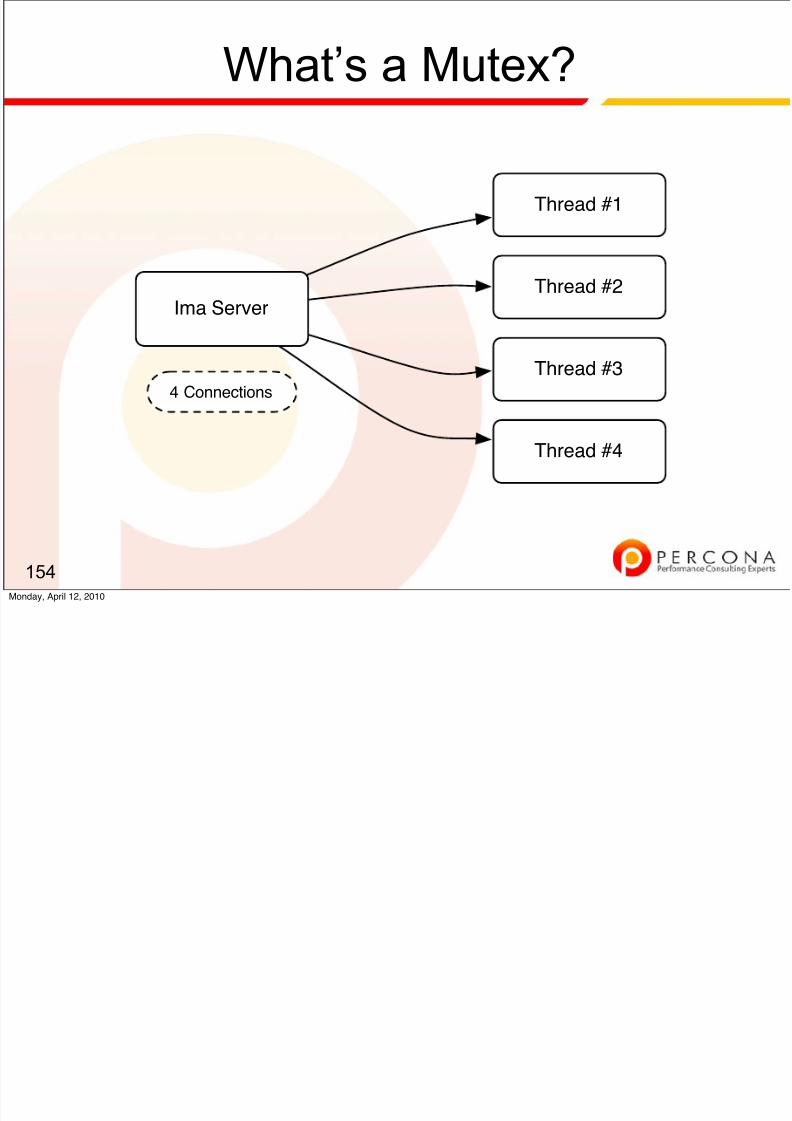
8/8/2019 Diagnosing Fixing Mysql Performance 100412151709 Phpapp01
http://slidepdf.com/reader/full/diagnosing-fixing-mysql-performance-100412151709-phpapp01 161/198
154
Ima Server
Thread #1
Thread #2
Thread #3
Thread #4
4 Connections
Monday, April 12, 2010
What’s a Mutex? (cont.)
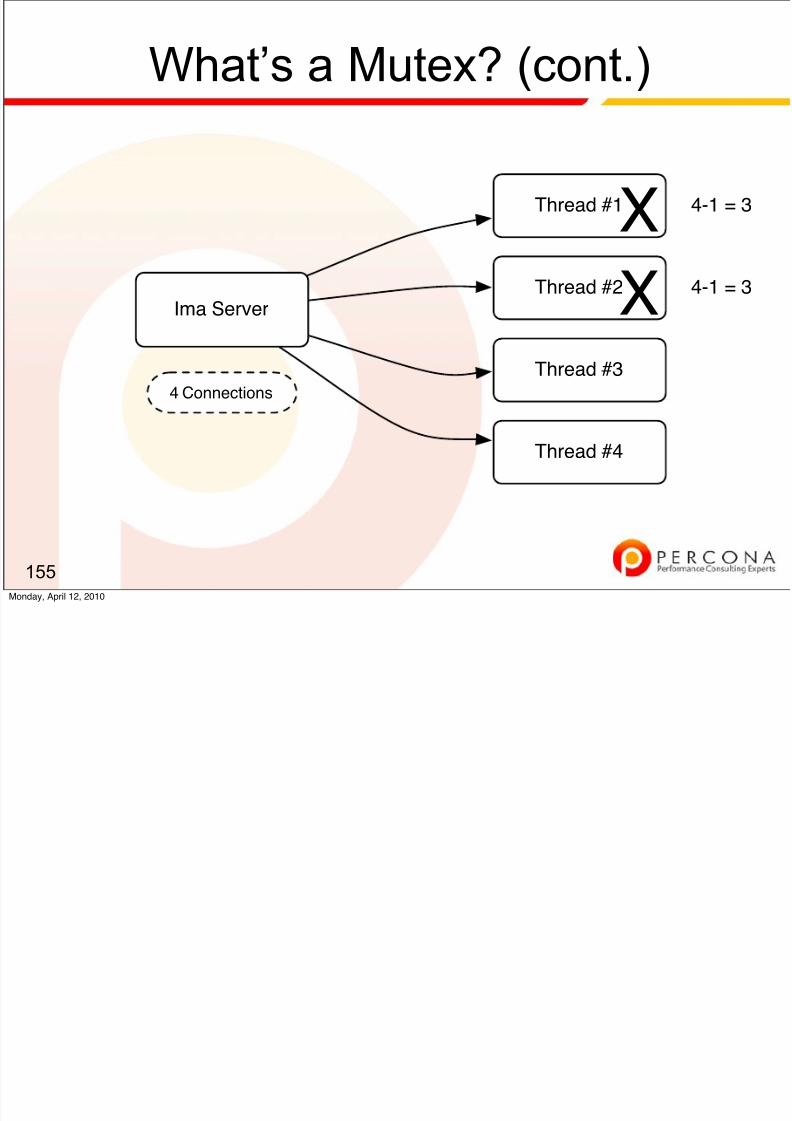
8/8/2019 Diagnosing Fixing Mysql Performance 100412151709 Phpapp01
http://slidepdf.com/reader/full/diagnosing-fixing-mysql-performance-100412151709-phpapp01 162/198
155
Ima Server
Thread #1
Thread #2
Thread #3
Thread #4
4 Connections
4-1 = 3
4-1 = 3
X
X
Monday, April 12, 2010
What’s a Mutex? (cont.)
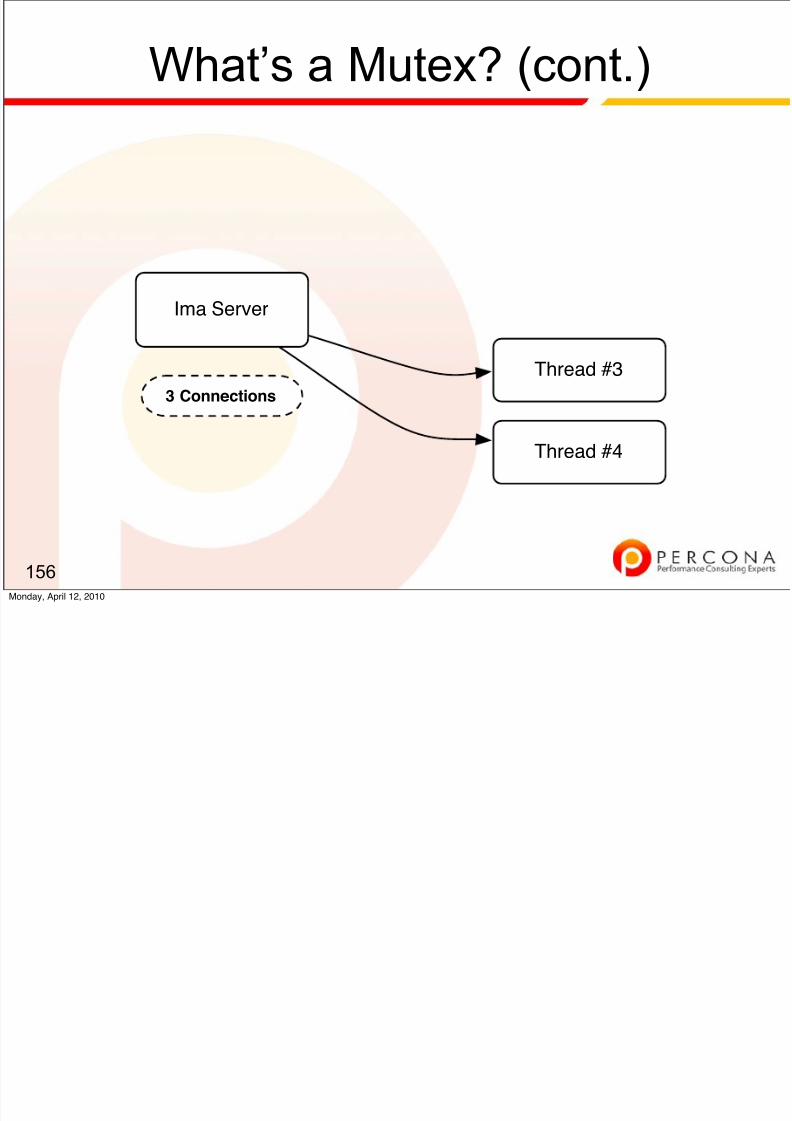
8/8/2019 Diagnosing Fixing Mysql Performance 100412151709 Phpapp01
http://slidepdf.com/reader/full/diagnosing-fixing-mysql-performance-100412151709-phpapp01 163/198
156
Ima Server
Thread #3
Thread #4
3 Connections
Monday, April 12, 2010
Mutexes become hotspots
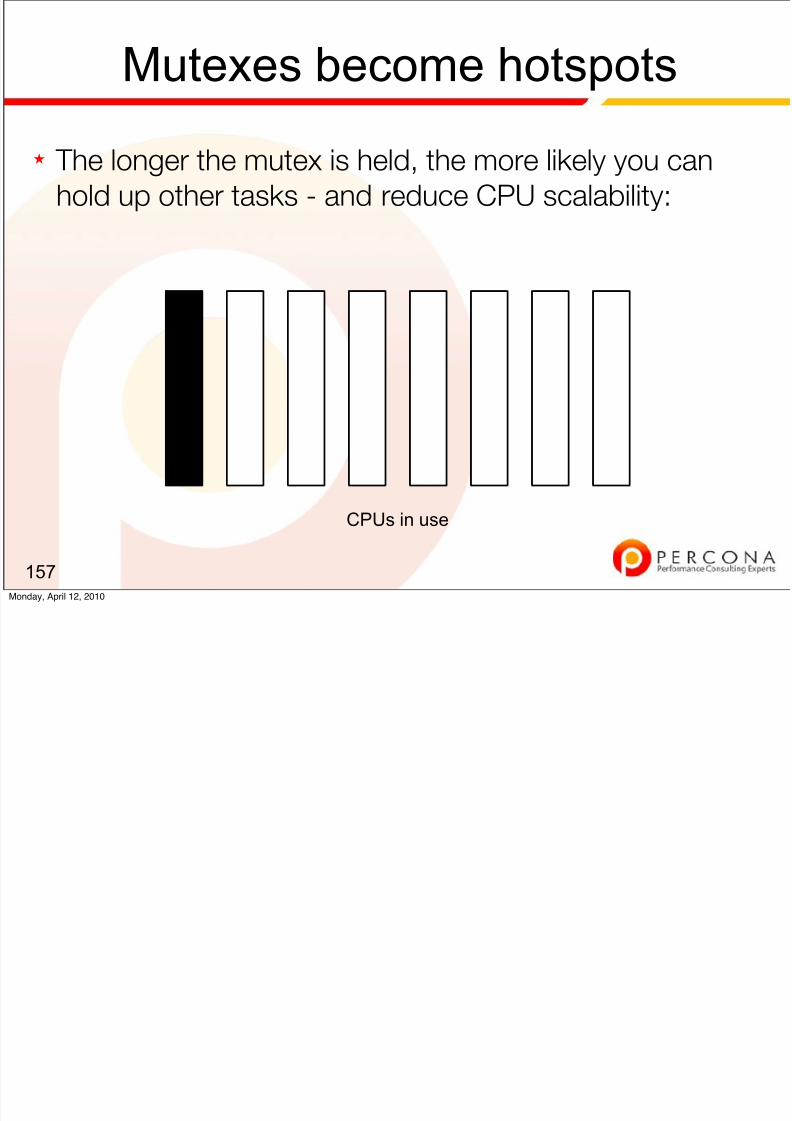
8/8/2019 Diagnosing Fixing Mysql Performance 100412151709 Phpapp01
http://slidepdf.com/reader/full/diagnosing-fixing-mysql-performance-100412151709-phpapp01 164/198
★
The longer the mutex is held, the more likely you canhold up other tasks - and reduce CPU scalability:
157
CPUs in use
Monday, April 12, 2010
Mutex contention might look like:
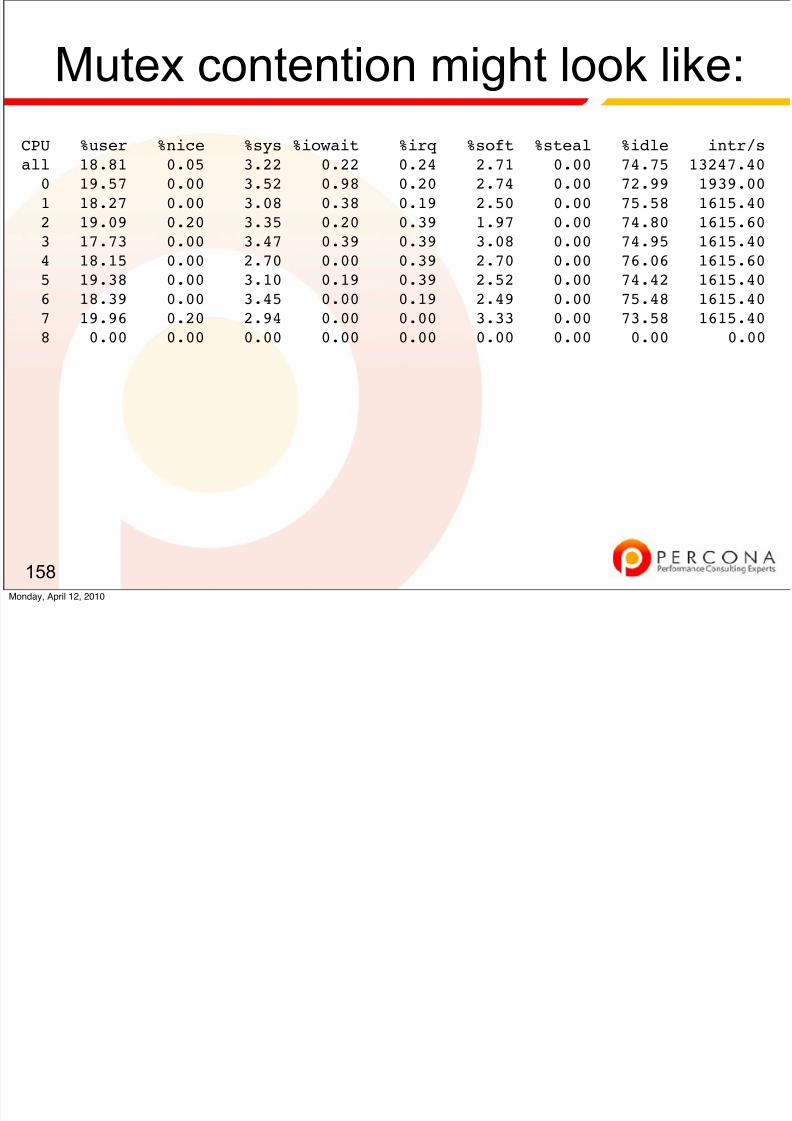
8/8/2019 Diagnosing Fixing Mysql Performance 100412151709 Phpapp01
http://slidepdf.com/reader/full/diagnosing-fixing-mysql-performance-100412151709-phpapp01 165/198
158
CPU %user %nice %sys %iowait %irq %soft %steal %idle intr/s
all 18.81 0.05 3.22 0.22 0.24 2.71 0.00 74.75 13247.400 19.57 0.00 3.52 0.98 0.20 2.74 0.00 72.99 1939.001 18.27 0.00 3.08 0.38 0.19 2.50 0.00 75.58 1615.402 19.09 0.20 3.35 0.20 0.39 1.97 0.00 74.80 1615.603 17.73 0.00 3.47 0.39 0.39 3.08 0.00 74.95 1615.404 18.15 0.00 2.70 0.00 0.39 2.70 0.00 76.06 1615.605 19.38 0.00 3.10 0.19 0.39 2.52 0.00 74.42 1615.40
6 18.39 0.00 3.45 0.00 0.19 2.49 0.00 75.48 1615.407 19.96 0.20 2.94 0.00 0.00 3.33 0.00 73.58 1615.408 0.00 0.00 0.00 0.00 0.00 0.00 0.00 0.00 0.00
Monday, April 12, 2010
Second thing to know about tasks:

8/8/2019 Diagnosing Fixing Mysql Performance 100412151709 Phpapp01
http://slidepdf.com/reader/full/diagnosing-fixing-mysql-performance-100412151709-phpapp01 166/198
★
Not all tasks arrive on time. Take the following exampleof a manufacturing process:
159Monday, April 12, 2010
Second thing to know about tasks:

8/8/2019 Diagnosing Fixing Mysql Performance 100412151709 Phpapp01
http://slidepdf.com/reader/full/diagnosing-fixing-mysql-performance-100412151709-phpapp01 167/198
★
Not all tasks arrive on time. Take the following exampleof a manufacturing process:
159Monday, April 12, 2010

8/8/2019 Diagnosing Fixing Mysql Performance 100412151709 Phpapp01
http://slidepdf.com/reader/full/diagnosing-fixing-mysql-performance-100412151709-phpapp01 168/198
Second thing to know about tasks:
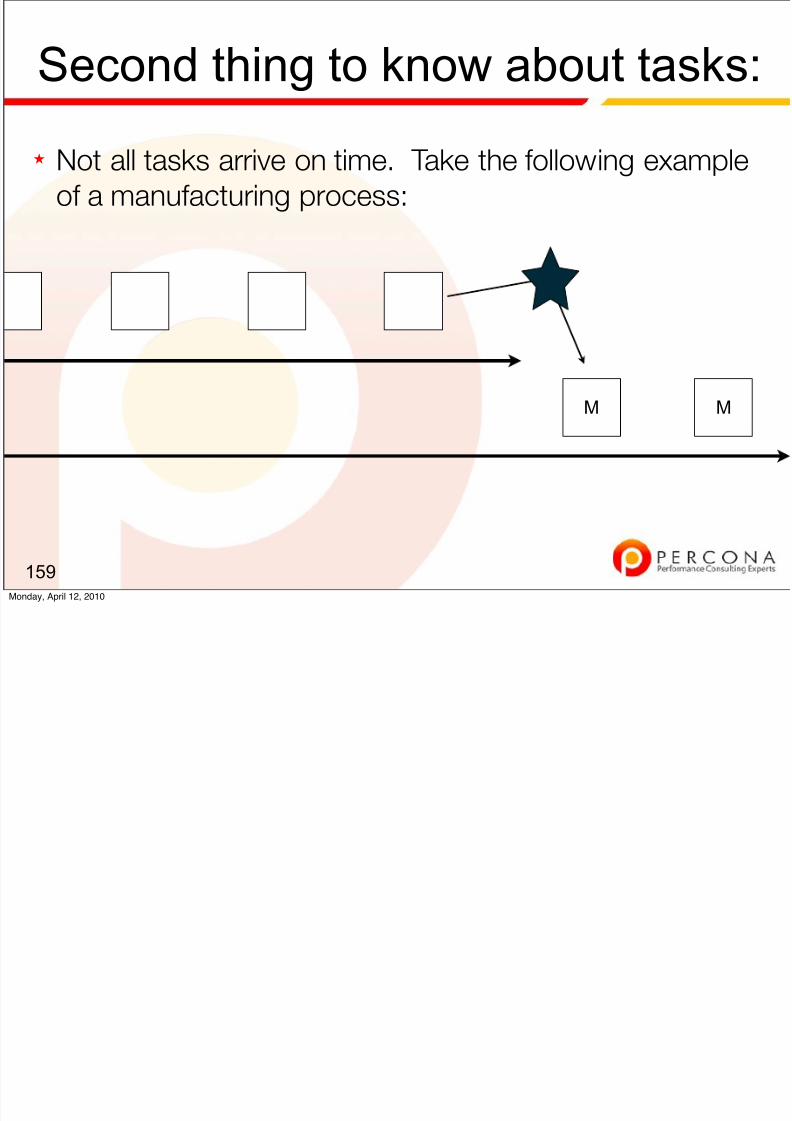
8/8/2019 Diagnosing Fixing Mysql Performance 100412151709 Phpapp01
http://slidepdf.com/reader/full/diagnosing-fixing-mysql-performance-100412151709-phpapp01 169/198
★
Not all tasks arrive on time. Take the following exampleof a manufacturing process:
159
MM
Monday, April 12, 2010
Second thing to know about tasks:
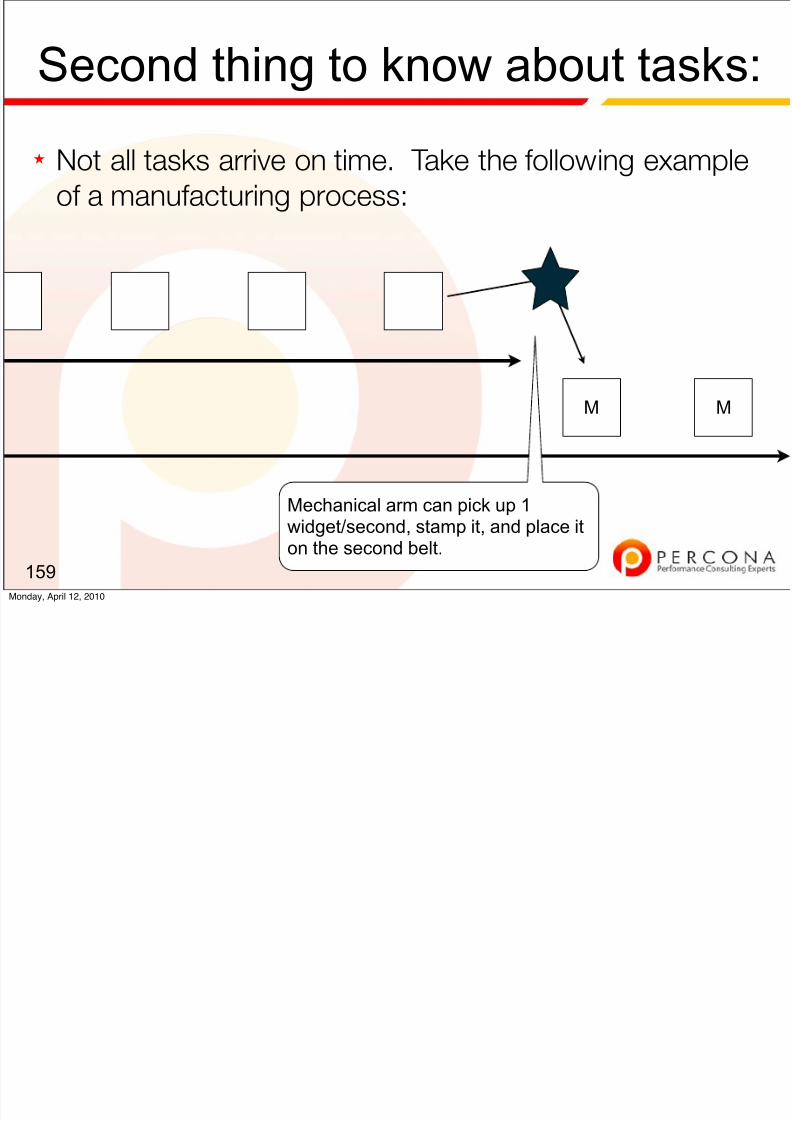
8/8/2019 Diagnosing Fixing Mysql Performance 100412151709 Phpapp01
http://slidepdf.com/reader/full/diagnosing-fixing-mysql-performance-100412151709-phpapp01 170/198
★
Not all tasks arrive on time. Take the following exampleof a manufacturing process:
159
MM
Mechanical arm can pick up 1widget/second, stamp it, and place iton the second belt.
Monday, April 12, 2010
Second thing to know about tasks:
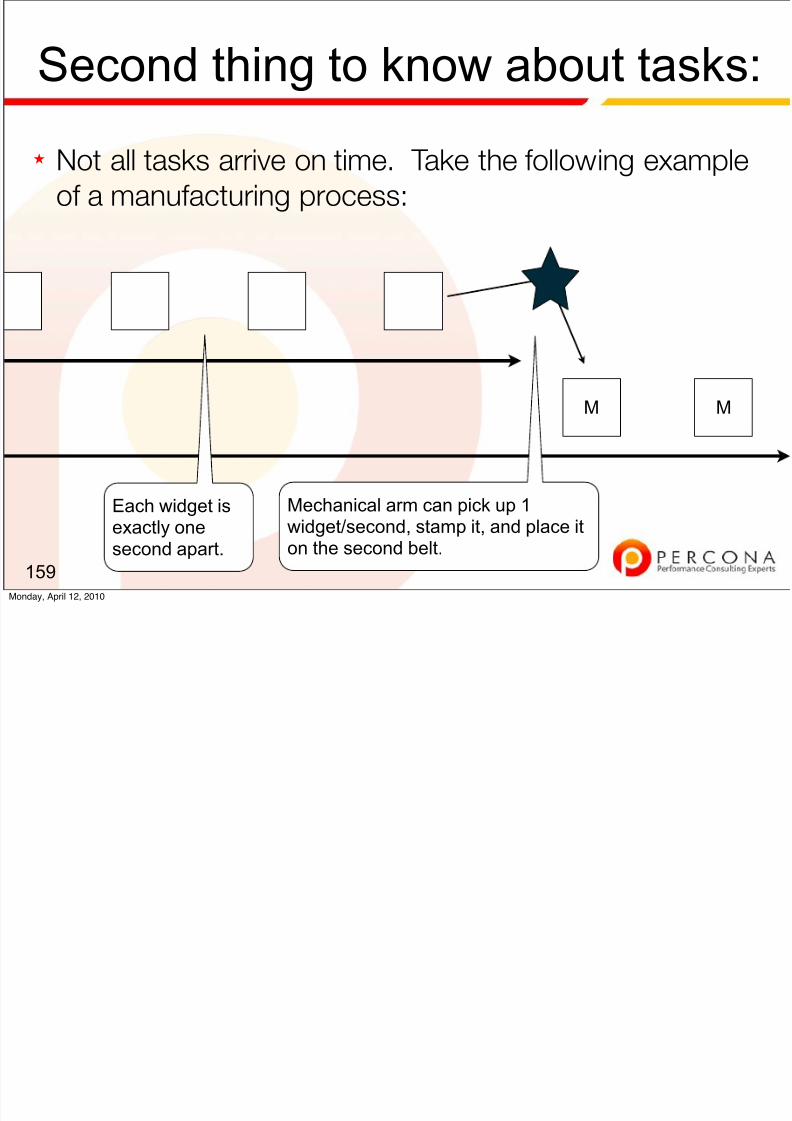
8/8/2019 Diagnosing Fixing Mysql Performance 100412151709 Phpapp01
http://slidepdf.com/reader/full/diagnosing-fixing-mysql-performance-100412151709-phpapp01 171/198
★
Not all tasks arrive on time. Take the following exampleof a manufacturing process:
159
MM
Mechanical arm can pick up 1widget/second, stamp it, and place iton the second belt.
Each widget isexactly onesecond apart.
Monday, April 12, 2010
Throughput Question:
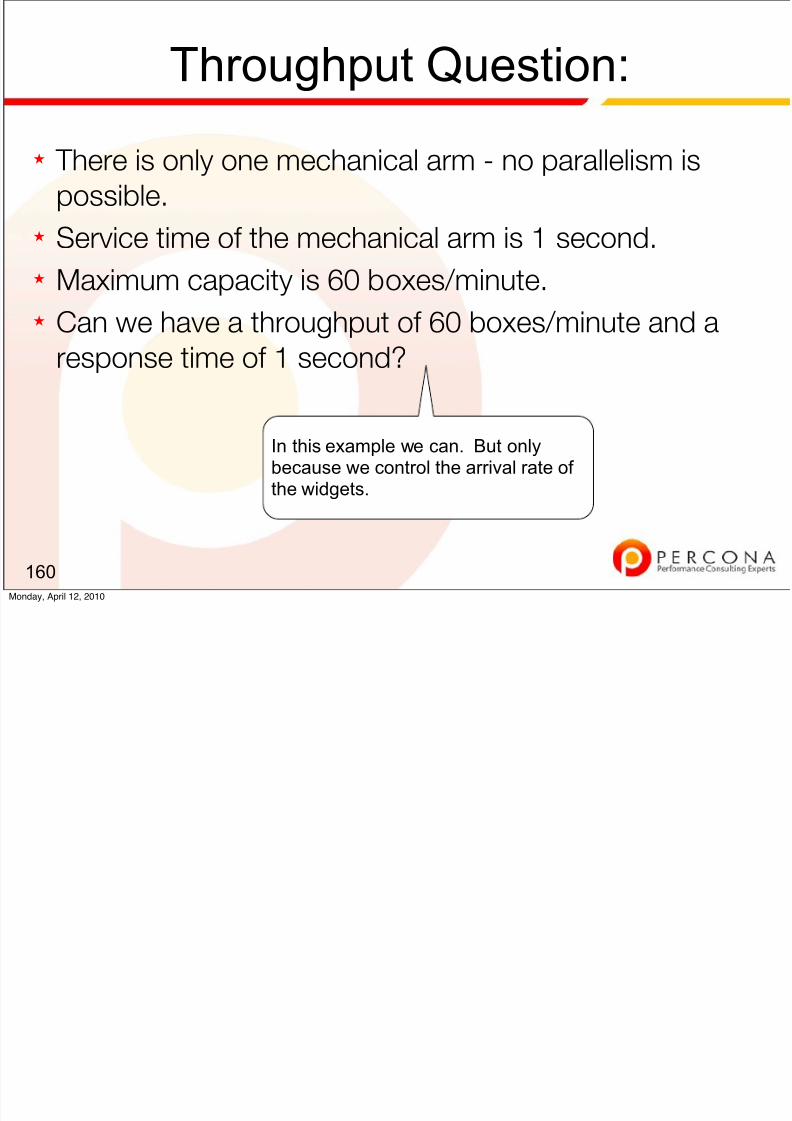
8/8/2019 Diagnosing Fixing Mysql Performance 100412151709 Phpapp01
http://slidepdf.com/reader/full/diagnosing-fixing-mysql-performance-100412151709-phpapp01 172/198
★
There is only one mechanical arm - no parallelism ispossible.
★ Service time of the mechanical arm is 1 second.
★ Maximum capacity is 60 boxes/minute.
★ Can we have a throughput of 60 boxes/minute and a
response time of 1 second?
160
In this example we can. But onlybecause we control the arrival rate of the widgets.
Monday, April 12, 2010
Important Real-Life Difference
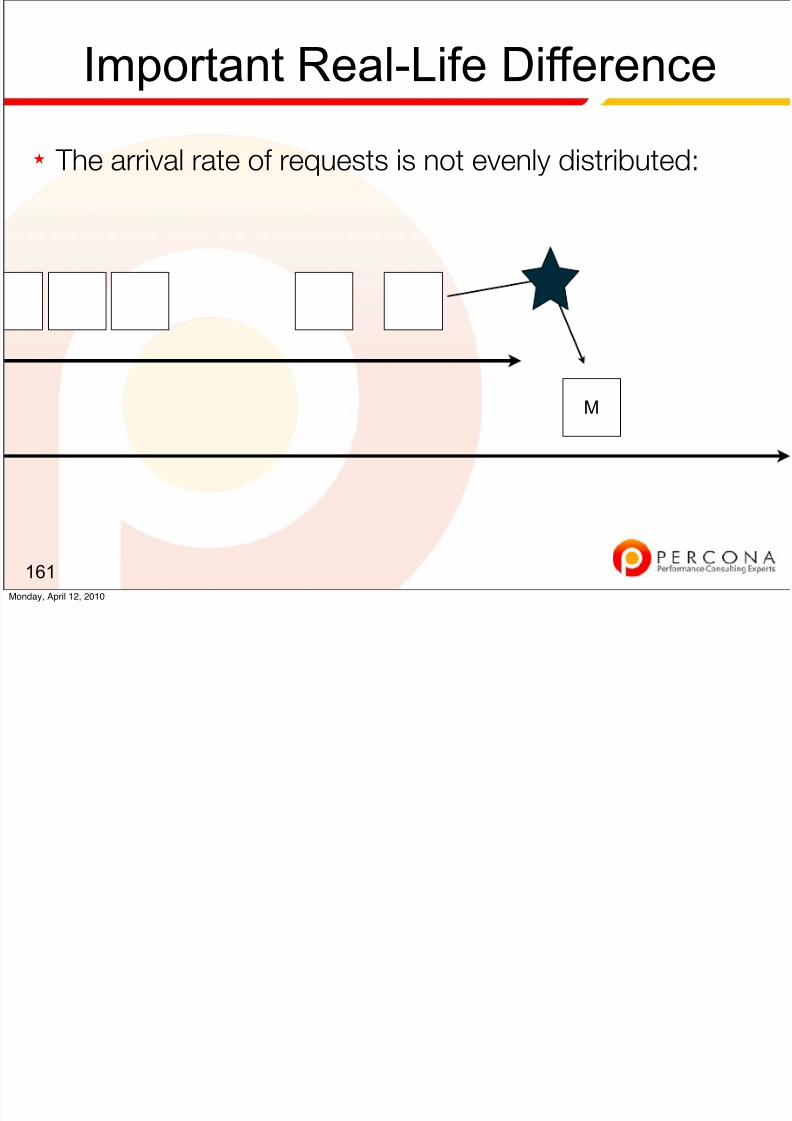
8/8/2019 Diagnosing Fixing Mysql Performance 100412151709 Phpapp01
http://slidepdf.com/reader/full/diagnosing-fixing-mysql-performance-100412151709-phpapp01 173/198
★
The arrival rate of requests is not evenly distributed:
161
M
Monday, April 12, 2010
Important Real-Life Difference
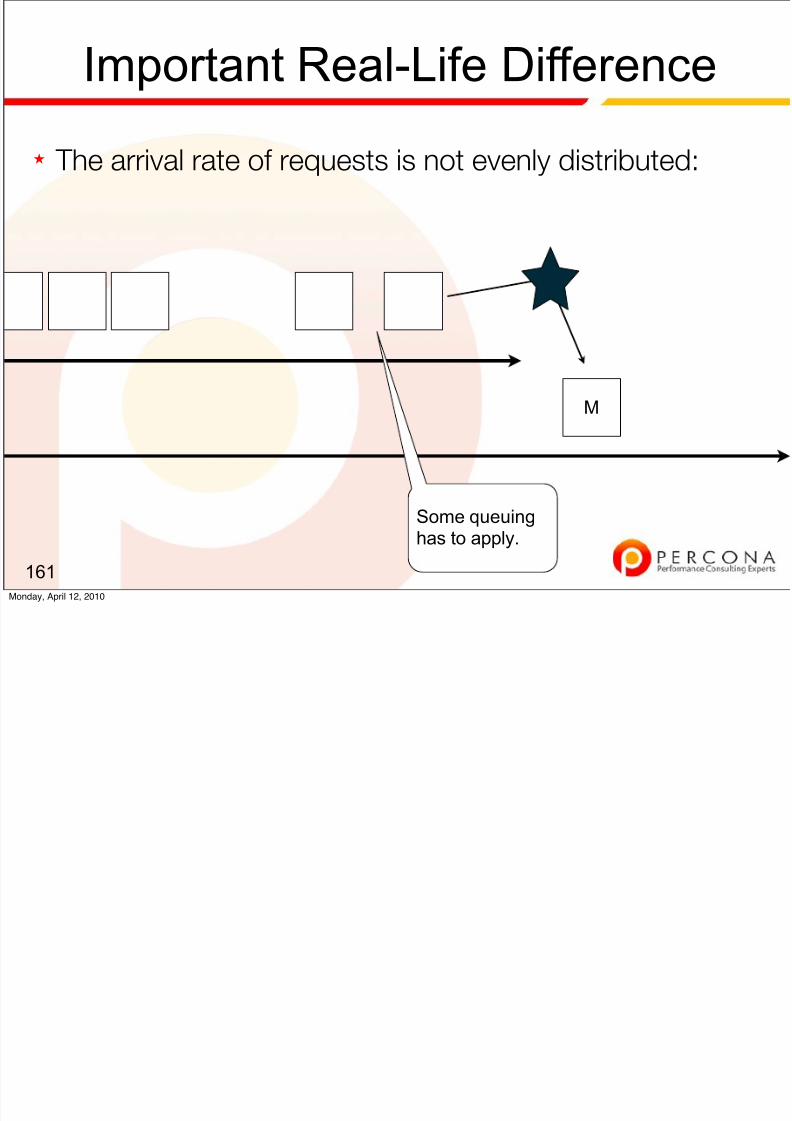
8/8/2019 Diagnosing Fixing Mysql Performance 100412151709 Phpapp01
http://slidepdf.com/reader/full/diagnosing-fixing-mysql-performance-100412151709-phpapp01 174/198
★
The arrival rate of requests is not evenly distributed:
161
M
Some queuinghas to apply.
Monday, April 12, 2010
Important Real-Life Difference
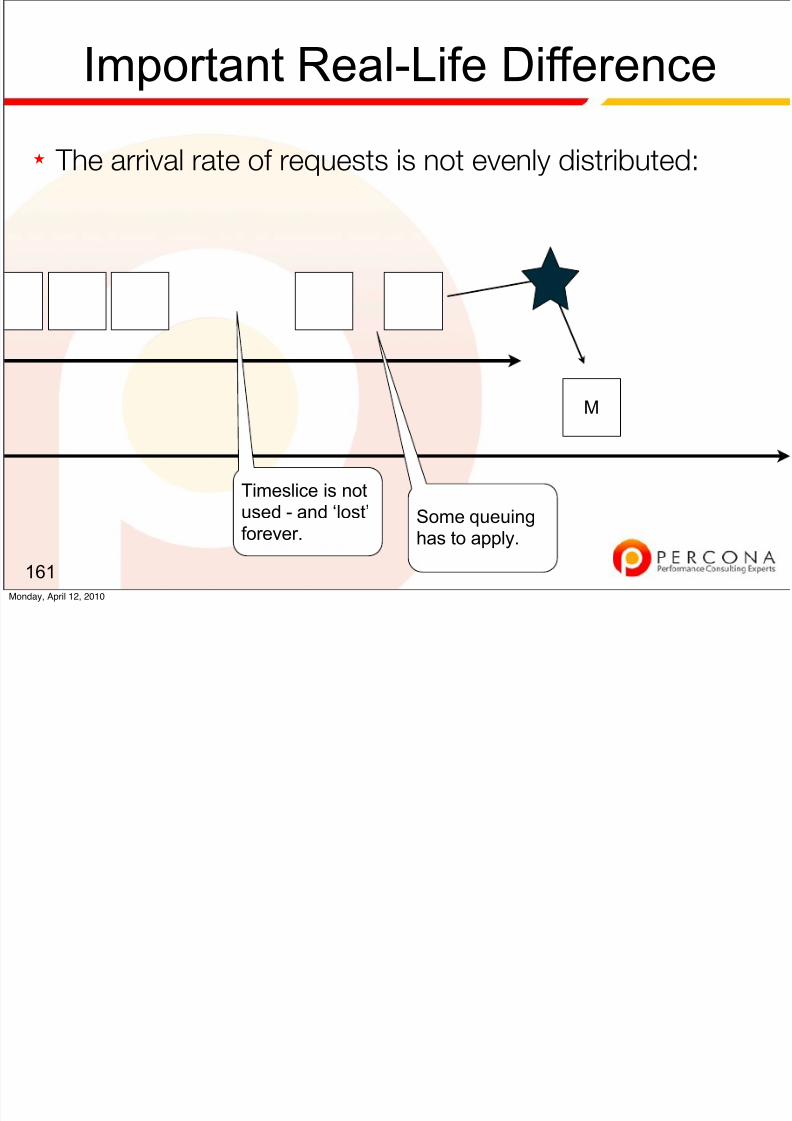
8/8/2019 Diagnosing Fixing Mysql Performance 100412151709 Phpapp01
http://slidepdf.com/reader/full/diagnosing-fixing-mysql-performance-100412151709-phpapp01 175/198
★
The arrival rate of requests is not evenly distributed:
161
M
Some queuinghas to apply.
Timeslice is notused - and ‘lost’forever.
Monday, April 12, 2010
Important Real-Life Difference
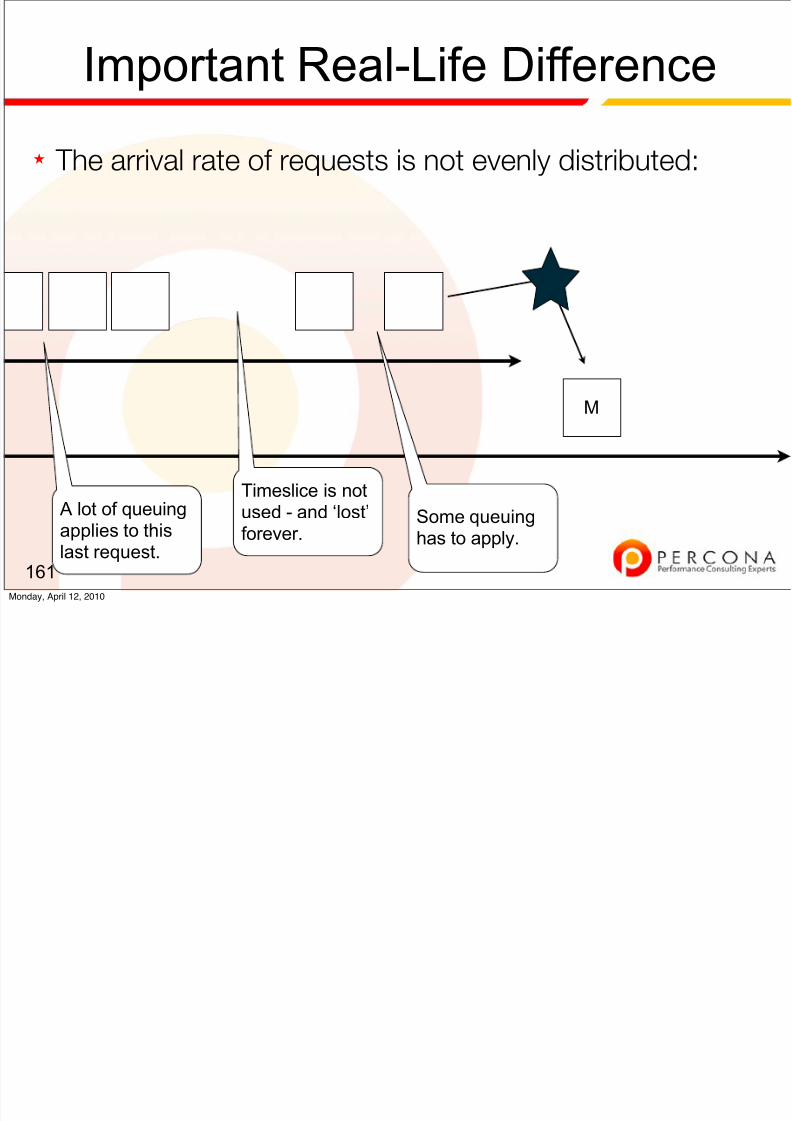
8/8/2019 Diagnosing Fixing Mysql Performance 100412151709 Phpapp01
http://slidepdf.com/reader/full/diagnosing-fixing-mysql-performance-100412151709-phpapp01 176/198
★
The arrival rate of requests is not evenly distributed:
161
M
Some queuinghas to apply.
A lot of queuingapplies to thislast request.
Timeslice is notused - and ‘lost’forever.
Monday, April 12, 2010
So there are some lessons:
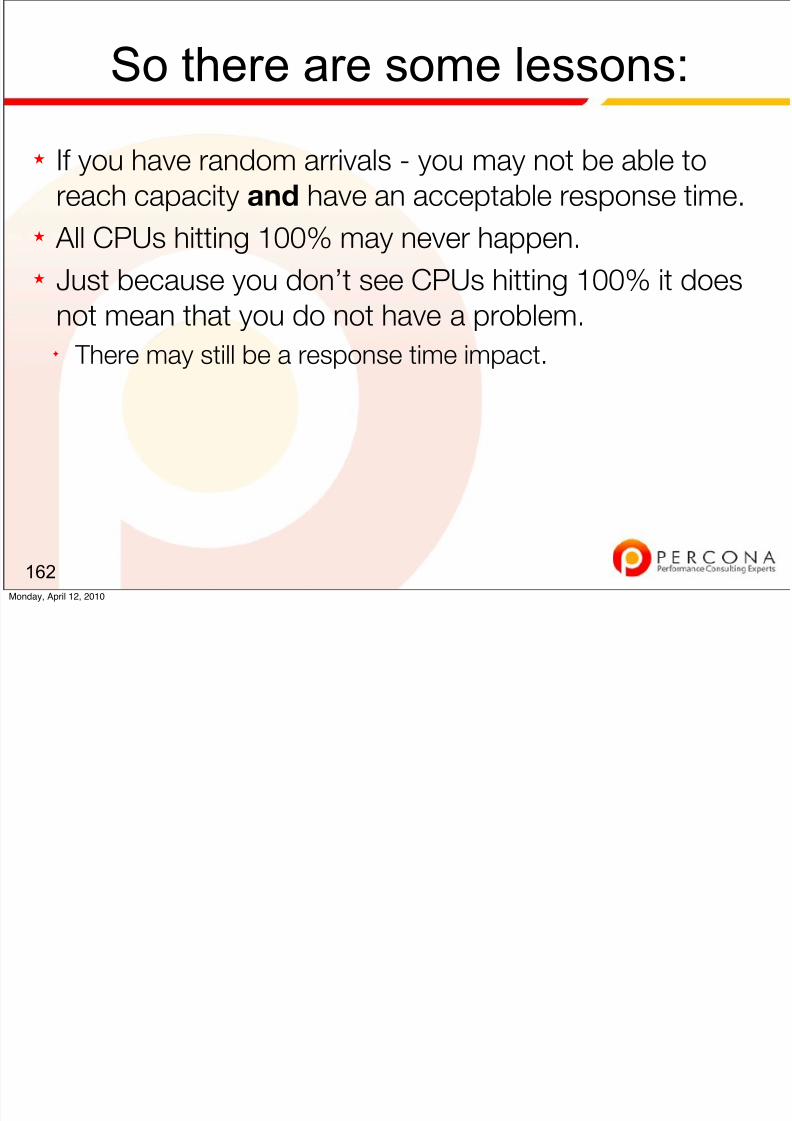
8/8/2019 Diagnosing Fixing Mysql Performance 100412151709 Phpapp01
http://slidepdf.com/reader/full/diagnosing-fixing-mysql-performance-100412151709-phpapp01 177/198
★
If you have random arrivals - you may not be able toreach capacity and have an acceptable response time.
★ All CPUs hitting 100% may never happen.
★ Just because you don’t see CPUs hitting 100% it does
not mean that you do not have a problem.✦ There may still be a response time impact.
162Monday, April 12, 2010
Tip: Never max out

8/8/2019 Diagnosing Fixing Mysql Performance 100412151709 Phpapp01
http://slidepdf.com/reader/full/diagnosing-fixing-mysql-performance-100412151709-phpapp01 178/198
★
Keep some capacity free.★ Our experience:
✦ You’ll have trouble exceeding ~75% of CPU usage andgetting respectable response.
163Monday, April 12, 2010
Table Of Contents
8/8/2019 Diagnosing Fixing Mysql Performance 100412151709 Phpapp01
http://slidepdf.com/reader/full/diagnosing-fixing-mysql-performance-100412151709-phpapp01 179/198
164
0. Welcome 5. Your Toolchest
1. Defining Performance 6. CPUs and Tasks
2. The Stack at 10000 Feet 7. Utilization versus Backlog
3. Isolating Problems 8. External-to-the-database Problems
4. Approaching the Stack 9. Conclusion
Monday, April 12, 2010
Utilization

8/8/2019 Diagnosing Fixing Mysql Performance 100412151709 Phpapp01
http://slidepdf.com/reader/full/diagnosing-fixing-mysql-performance-100412151709-phpapp01 180/198
★
Utilization means how much of the time the resource isbusy - it has a ceiling of 100%.
165Monday, April 12, 2010

8/8/2019 Diagnosing Fixing Mysql Performance 100412151709 Phpapp01
http://slidepdf.com/reader/full/diagnosing-fixing-mysql-performance-100412151709-phpapp01 181/198
Let me repeat again:
Utilization has a ceiling of 100%.
Monday, April 12, 2010
Utilization (cont.)

8/8/2019 Diagnosing Fixing Mysql Performance 100412151709 Phpapp01
http://slidepdf.com/reader/full/diagnosing-fixing-mysql-performance-100412151709-phpapp01 182/198
★
This makes it unreliable to evaluate demands on asystem - because load can increase to infinity -
utilization is fixed at 100%.
★ When utilization is at 100%, a backlog is started.
167Monday, April 12, 2010
Load avg

8/8/2019 Diagnosing Fixing Mysql Performance 100412151709 Phpapp01
http://slidepdf.com/reader/full/diagnosing-fixing-mysql-performance-100412151709-phpapp01 183/198
★
Unix load average is an example of a backlog:✦ shell> uptime✦ 17:22 up 11 days, 19:20, 6 users, load averages: 0.31 0.32
0.33
★ The value here is simply the number of runnable tasksthat are waiting to be serviced. It's a weighted moving
average. It can go to infinity.
168Monday, April 12, 2010
iostat

8/8/2019 Diagnosing Fixing Mysql Performance 100412151709 Phpapp01
http://slidepdf.com/reader/full/diagnosing-fixing-mysql-performance-100412151709-phpapp01 184/198
★
Has both utilization and average queue length.★ The queue length is an interesting measurement of
backlog.
★ It’s normally perfectly safe if we have 100% utilization.✦ A large backlog is a different question.
169Monday, April 12, 2010
Backlog implies queuing

8/8/2019 Diagnosing Fixing Mysql Performance 100412151709 Phpapp01
http://slidepdf.com/reader/full/diagnosing-fixing-mysql-performance-100412151709-phpapp01 185/198
★
Which means that it has a measurable effect onresponse time.
170Monday, April 12, 2010
Table Of Contents
8/8/2019 Diagnosing Fixing Mysql Performance 100412151709 Phpapp01
http://slidepdf.com/reader/full/diagnosing-fixing-mysql-performance-100412151709-phpapp01 186/198
171
0. Welcome 5. Your Toolchest
1. Defining Performance 6. CPUs and Tasks
2. The Stack at 10000 Feet 7. Utilization versus Backlog
3. Isolating Problems 8. External-to-the-database Problems
4. Approaching the Stack 9. Conclusion
Monday, April 12, 2010
Resources that matter:

8/8/2019 Diagnosing Fixing Mysql Performance 100412151709 Phpapp01
http://slidepdf.com/reader/full/diagnosing-fixing-mysql-performance-100412151709-phpapp01 187/198
★
Network, storage, cpu, memory, load balancer,connection pool.
★ In all cases, think about whether the resource is
dedicated or shared/virtualized.
172Monday, April 12, 2010
Network

8/8/2019 Diagnosing Fixing Mysql Performance 100412151709 Phpapp01
http://slidepdf.com/reader/full/diagnosing-fixing-mysql-performance-100412151709-phpapp01 188/198
★
Packet loss.★ Faulty device (shows up in ifconfig).
★ Poor bandwidth.
★ High latency.
★ Congestion.
173Monday, April 12, 2010
Filesystem

8/8/2019 Diagnosing Fixing Mysql Performance 100412151709 Phpapp01
http://slidepdf.com/reader/full/diagnosing-fixing-mysql-performance-100412151709-phpapp01 189/198
★
Serialization.★ Maintenance Operations (fsck speed?)
★ Mount options.
174Monday, April 12, 2010
Disks & Raid

8/8/2019 Diagnosing Fixing Mysql Performance 100412151709 Phpapp01
http://slidepdf.com/reader/full/diagnosing-fixing-mysql-performance-100412151709-phpapp01 190/198
★
Speed, size: how fast should this disk be able to work?★ Configuration: RAID5, RAID10?
★ Raid controller: BBU? WriteBack policy? Good quality,
or generic 3ware junk?
175Monday, April 12, 2010
SAN and NFS

8/8/2019 Diagnosing Fixing Mysql Performance 100412151709 Phpapp01
http://slidepdf.com/reader/full/diagnosing-fixing-mysql-performance-100412151709-phpapp01 191/198
★
SAN: over NFS? Benchmark with iozone -I to measurereal performance, don't be surprised to see terrible
random-read performance.
★ Is the NFS over a dedicated network?
★ SSD: not a magic bullet.
176Monday, April 12, 2010
CPUs

8/8/2019 Diagnosing Fixing Mysql Performance 100412151709 Phpapp01
http://slidepdf.com/reader/full/diagnosing-fixing-mysql-performance-100412151709-phpapp01 192/198
★
What model? How fast should it be? Generally if theCPU has any problem, *nothing* works, I've never seen
a running system with a bad CPU.
★ New server slower than the old server?✦
Check cache size and cache alignment (/proc/cpuinfo).
177Monday, April 12, 2010
CPUs (cont.)

8/8/2019 Diagnosing Fixing Mysql Performance 100412151709 Phpapp01
http://slidepdf.com/reader/full/diagnosing-fixing-mysql-performance-100412151709-phpapp01 193/198
★
Performance is unpredictable?✦ We’ve found most virtualized technologies have high
burstable speed, and many people under-provision notunderstanding the unpredictable minimums.
178Monday, April 12, 2010
Memory

8/8/2019 Diagnosing Fixing Mysql Performance 100412151709 Phpapp01
http://slidepdf.com/reader/full/diagnosing-fixing-mysql-performance-100412151709-phpapp01 194/198
★
Can use memtest86+ to test and benchmark it.★ Easy to misconfigure what your vendor needs you to do
for best performance.✦ Best to test before production.
179Monday, April 12, 2010
Load Balancer

8/8/2019 Diagnosing Fixing Mysql Performance 100412151709 Phpapp01
http://slidepdf.com/reader/full/diagnosing-fixing-mysql-performance-100412151709-phpapp01 195/198
★
It adds more latency, measure with tcpdump on bothsides of the load balancer to see if there is a difference.✦ how does the app use it? could it be misconfigured, holding
connections open for too long?
180Monday, April 12, 2010
Table Of Contents
8/8/2019 Diagnosing Fixing Mysql Performance 100412151709 Phpapp01
http://slidepdf.com/reader/full/diagnosing-fixing-mysql-performance-100412151709-phpapp01 196/198
181
0. Welcome 5. Your Toolchest
1. Defining Performance 6. CPUs and Tasks
2. The Stack at 10000 Feet 7. Utilization versus Backlog
3. Isolating Problems 8. External-to-the-database Problems
4. Approaching the Stack 9. Conclusion
Monday, April 12, 2010
Topics we didn’t cover (andshamelessplugs)

8/8/2019 Diagnosing Fixing Mysql Performance 100412151709 Phpapp01
http://slidepdf.com/reader/full/diagnosing-fixing-mysql-performance-100412151709-phpapp01 197/198
★
MySQL Graphing and Trending with Cacti✦ Baron @11:55 AM Thursday in Ballroom B
★ Understanding the Role of IO as a Bottleneck ✦ Morgan @11:55 AM Thursday in Ballroom F
182Monday, April 12, 2010
The End

8/8/2019 Diagnosing Fixing Mysql Performance 100412151709 Phpapp01
http://slidepdf.com/reader/full/diagnosing-fixing-mysql-performance-100412151709-phpapp01 198/198
★
Here is the URL for our slides:✦ http://slideshare.net/morgo
★ Our details again are:✦ Baron Schwartz <[email protected]>✦ Morgan Tocker <[email protected]>
★ Stop by booth 308 this week to say hello :)