diagnosis and planning wheat management …libcatalog.cimmyt.org/download/cim/64223.pdf · pages...
TRANSCRIPT

DIAGNOSIS AND PLANNING
"WHEAT MANAGEMENT PRINCIPLES"
CENTRO INTERNACIONAL DE MEJORAMIENTO DE MAIZ Y TRIGO INTERNATIONAL MAIZE AND WHEAT IMPROVEMENT CENTER Lisboa 27 Apartado Postal 6-641 06600 Mexico, D.F . Mexico

DIAGNOSIS AND PLANNING
"WHEAT MANAGEMENT PRINCIPLES"

COURSE MAP OF DIAGNOSIS AND PLANNING
/ /
/ /
~ /
DIAGNOSIS AND PLANNING
"WHEAT MANAGEMENT PRINCIPLES"
Contents
Modules
WMP-1 "IDENTIFY PLANT PARTS" •......•.••...••..........•.••.....•.. 1
WMP-2 "ESTIMATE THEORETICAL GENETIC YIELD POTENTIAL
FROM YIELD COMPONENT MEASUREMENTS" ••••••••••••.••••••• 14
WMP-3 "RELATE YIELD COMPONENT PRODUCTION TO
WHEAT GROWTH STAGES II •••••••••••••••••••••••••••••••••• 2 9
WMP-4 "ORGANIZE PRODUCTIVITY ANALYSIS FACTORS" ••••••••••••••••••. 64
WMP-5 "SURVEY PLANT DENSITY PROBLEMS" •••••••••••••...••••••••.•.• 83

"WHEAT MANAGEMENT PRlNCIPLES"
INTRODUCTION
The wheat plant is a complex "factory" that uses the sun's rays to
transform raw materials such as water, nutrients, carbon dioxide and
oxygen into energy. What the plant produces is organic matter
containing, among other things, carbohydrates, proteins, minerals and
oils.
The wheat plant is continuously integrating numerous interacting
genetic, environmental and management factors. From germination to the
production of a new generation of seed, a wheat crop passes through an
orderly sequence of developmental stages.
A crop is a community of plants (including sometimes weeds) that is
constantly competing for light, nutrients and water. Yield is the
summation of this process. As agronomists you want maximum yield
efficiency (quality and quantity) within economic realities. Therefore,
it is important to be able to diagnose the factors that limit yield at
each stage of development and, if necessary, to propose corrective
action.
This series of lessons on wheat management principles are designed
to help you:
1. Recognize the internal and external parts of
the wheat plant.
2. Demonstrate the value and worth of production research by
estimating "genetic yield potential" from "yield component
analysis".
3. Identify the critical phases of production of the
components of potentially harvestable yield.
4. Organize your knowledge of productivity-limiting factors
in order to facilitate identifying, defining, and analyzing
information (as part of our problem-solving strategy).

IDENTIFY PLANT PARTS
1

IDENTIFY PLANT PARTS
OBJECTIVE:
Given dissecting tools, a dissecting microscope, and samples .•
of wheat plants at different growth stages, or pictures and
drawings of wheat plants, identify the various external and
internal parts.
CRITERION TEST:
Given live plant samples and/or pictures or drawings of wheat
plants at different growth stages, identify the following plant
parts.
tiller crown roots spike coleoptile
seminal roots spikelet lamina growing point
floret initium shoot apex auricle
glume head (ear) node main stem (or shoot)
primordium joint ligule meristem tissue
leaf blade leaf sheath leaf axil flag leaf
2

ADDITIONAL RESOURCES:
Cereal Development Guide, PBI Cereal Unit.
Pages 7-12 & 31-45
Understanding Crop Production, Stoskopf, N. )
Chapter 2, pages 28-32
3

INTRODUCTION
In order to understand the following lessons on wheat growth and
development it is very important that you first become familiar with the
names of the various parts, i.e. the morphology of a wheat plant. Below
is a list of some of the plant parts that are important for you to be ·'
able to identify:
tiller crown roots spike coleoptile
seminal roots spike let lamina growing point
floret initium shoot apex auricle
glume head (ear) node main stem (or shoot)
primordium joint ligule meristem tissue
leaf blade leaf sheath leaf axil flag leaf
Your instructor will provide you with several resources to help you
become familiar with the various plant parts. Some of these parts can
be seen easily on the growing plant - external parts. Some are located
inside the plant and can only be seen by dissection - internal parts.
Some parts can only be seen on plants at specific times during the crop
cycle.
THE EXTERNAL PLANT PARTS
To begin to familiarize yourself with the external plant parts,
first read pages 28-32 in Chapter 2 of Understanding Cereal Production,
especially the figure on page 31. The following figures may also help.
4

VI
Growing Point
Ear-Bearing Tiller

THE INTERNAL PLANT PARTS
Notice in Figure 1 an arrow labelled growing point points to an
area low on the main stem. To see this small structure and learn it's
parts you will have to dissect a plant and observe the structure under a
dissecting microscope. You have available the necessary tools to do ~
such a dissection.
WHAT TO DO:
First, read pages 7-12 on dissection technique in the PBI
publication, Cereal Development Guide. In the classroom you will have
available a number of live wheat plants at various stages of
development. Choose a plant, and using the following worksheets as a
guide, note the required external observations. When you have completed
your external examination, follow the dissection instructions and expose
the growing point of the plant. When you have successfully exposed the
growing point, look at the structure under a microscope and compare it
with the pictures found on pages 31-45 in the Cereal Development Guide.
On your worksheet, check the parts you are able to identify. If you
have any questions or need assistance ask your friends or an instructor.
Hints:
1. A fully expanded leaf is a leaf with a visible ligule.
2. The growing point of a wheat plant (later, the developing ear)
will always be found just above the topmost node on the stem.
6

WORKSHEET II 1
External
Number of leaves (on the main shoot) ••••••••• . • ---
-fully expanded (ligule visible) ••••••••••• ----still emerging .••.•••••...•..•••••.•....•• ---
Number of tillers ..•.....•..••••...••••..•••. ----alive . ................................... . ----dead (or dying) .•....••..........•........ ---
Number of nodes visible (on the main shoot) •• ---Head visible or not. Where?
Flag leaf visible or not.
Internal
visible not visible number
Shoot apical meristem ••••••••••••••••
Spike .................•..............
Spikelets . .......................... .
Vegetative (leaf) initials •••••••••••
Reproductive (floral) initials •••••••
Florets ••••••••••••••••••••••••••••••
Glumes • .••••••••.••••••••••••••••••••
Terminal spikelet ••••••••••••••••••••
7

WORKSHEET 112
External
Number of leaves (on the main shoot) •••••••••
-fully expanded (ligule visible) •••••••••••
-still emerging •......••..••••...•••.••.••.
Number of tillers ... ........................ .
-alive ... ~ ................................ .
-dead (or dying) .......................... .
Number of nodes visible (on the main shoot) ••
Head visible or not. Where?
Flag leaf visible or not.
Internal
Shoot apical meristem ••••••.•••••••••
Spike . .............................. .
Spikelets ••••••••••••••••••.•••••••••
Vegetative (leaf) initials •••••••••••
Reproductive (floral) initials •••••••
Florets ....... ...................... .
Glumes . .•••••.••..••••..••....••.••..
Terminal spikelet ••••••••••••••••••••
8
visible
-----
-----
-----
-----
-----
-----
-----
not visible number

WO~SHEET 113
External
Number of leaves (on the main shoot) ••••••••• . • ----
-fully expanded (ligule visible) ••••••••••• -----still emerging .•••••••.•••.•••••..••••••.• -----
Number of tillers .•••••••••..•••••••....••••. -----alive . ................................... . ------dead (or dying) ..••••.•..•..•..•••.••..•.. ----
Number of nodes visible (on the main shoot) •• ----Head visible or not. Where?
Flag leaf visible or not.
Internal
visible not visible number
Shoot apical meristem ••••••••••••••••
$pike •...............................
Spikelets .•••••.•••••••••••••••••••••
Vegetative (leaf) initials •••••••••••
Reproductive (floral) initials •••••••
Florets ••••••••••••••••••••••••••••••
Glumes • •.•....•••••••••••••.•••.•.••.
Terminal spike let ••••••••••••• ·• ••••••
9

WORKSHEET 114
External
Number of leaves (on the main shoot) ••••••••• .. -----fully expanded (ligule visible) ••••••••••• -----still emerging ...•••..••.••..••...•.•..•.• ----
Number of tillers .••.•.••••••••••••..•••.•.•• -----alive .................................... . -----dead (or dying) .......................... . ----
Number of nodes visible (on the main shoot) •• ----Head visible or not. Where?
Flag leaf visible or not.
Internal
visible not visible number
Shoot apical meristem ••••••••••••••••
Spike . .......•.•....•..•..•......•...
Spike lets . .......................... .
Vegetative (leaf) initials •••••••••••
Reproductive (floral) initials •••••••
Florets ••••••••••••••••••••••••••••••
Glumes • ••..••..••.•.••.••••.••..••...
Terminal spikelet ••••••••••••••••••••
IO

WORKSHEET 115
Pot II ( ) ____________ _
External
Number of leaves (on the main shoot) ••••••••• -----fully expanded (ligule visible)···········~~-
-still emerging •••.••••••••.••••.•.•••••..• ___ _
Number of tillers .••.•.••.......••••••••.••.• -----alive . .................................... ___ _
-dead (or dying) ................•.......... ----Number of nodes visible (on the main shoot) •• ----Head visible or not. Where?
Flag leaf visible or not.
Internal
visible not visible number
Shoot apical meristem ••••••••••••••••
Spike . .............................. .
Spikelets . .......................... .
Vegetative (leaf) initials •••••••••••
Reproductive (floral) initials •••••••
Florets ••••••••••••••••••••••••••••••
Glumes • ••••••••••••••••••••••••••••••
Terminal spikelet ••••••••••••••••••••
11

.•
12
GUIDED PRACTICE
See how many of the
external and internal parts
of the wheat plant you can
correctly identify in the
following drawings and
pictures.

lemma. floret 1 I of terminal
--.P.....--t-- lower glume apikelet Answers to Guided Practice
Ear-Beari.ng1-------11 Tiller
13

IDENTIFY PLANT PARTS
CRITERION TEST
You will be shown a number of slides showing various internal and
external parts of a wheat plant. Identify below the structures
indicated by the arrow on the slide.
13. __________ _
15. __________ _
.•

ESTIMATE THEORETICAL GENETIC YIELD POTENTIAL
FROM YIELD COMPONENT MEASUREMENTS
14

OBJECTIVE: ·'
ESTIMATE THEORETICAL GENETIC YIELD POTENTIAL
FROM YIELD COMPONENT MEASUREMENTS
Estimate the theoretical yield potential of wheat from observed
values for the various yield components.
SAMPLE TEST ITEM:
Shoots/m 2 1,600
Spikelets/shoot 20
Florets/spikelet 10
Grains/m 2 320,000
Wt of 1000 grains 70 grams
POTENTIAL YIELD~~-?_?_??_.?_?_?~k-g~/_h_a_
15

ADDITIONAL RESOURCES:
16

INTRODUCTION
The most common measurement of agricultural productivity is yield,
measured by grain weight per unit area (for example tons per hectare).
In this module we will be learning to estimate theoretical wheat yields; ·'
yield estimates that do not consider soil productivity, damage from
diseases and pests, inferior crop management, etc.
What is the value of briefly looking at theoretical wheat yield
potential? It is to emphasize the point that current genetic potential
has been estimated at several times today's best yields. The challenge
for researchers and farmers should be thought of as preserving as much
of the potential genetic yield as is possible within economic realities.
YIELD COMPONENTS
If you analyze wheat yield closely, you will find that the
theoretical value of wheat yield it can be described by a simple
mathematical relationship as follows (and in Figure 1):
YIELD c~:r'~· # p~ants x # spikes x # spikelets x # florets x # kernels x grams
m plants spike spikelet floret kernel
17

r-i >t Q) u > IU Q) Jo.I
r-i ::s u
Jo.I u Cl> IU
~~ r-i 0
Figure 1.
Level of Accuracy
(1)
(2)
(3)
(4)
(5)
COMPONENTS OF YIELD
a) Total Dry Matter Yield (grams/m2)
I 2 .• b) L Yield~s/m )
:,;;f" ~ c) Grains~ d) Kernel Weight (mg.)
/ ~ (1000 grain weight)
r 2 --=-::::::::::: e) Spikes/m
2 f) Grains/Spike
(shoots/m ) ~ ~ :;,.;;""" ~
g) Fertile Spikelets/Spike h) Grains/Spikelet (spikelets/shoot) (florets/spiket) ~ '\. ? "-~ ~ ~ ~
i) Total j) Sterile k) Total 1) Sterile Spikelets Spikelets Florets Florets
*Measured components: a,b,d,e,g,i. *Measurment of k) and i) is very difficult and hardly ever done.
Formulae 1. 2.
3.
4. 5.
b = c x d c = e x g x h
= e x f = b/(d x 10)
f = h x g = c/e
h = f/g Harvest index % = b/a x 100
Conversion Factors
1 kilogram (kg) = 1000 grams (g)
1 hectare (ha) = 10,000 square meters (m2)
1 metric ton (t) = 1000 kilograms (kg)
18

Although it is impossible to make exact measurements of the
theoretical yield potential, it can be estimated from values observed
for each separate component of yield. For example, using the following
values:
II 2 average plants/m =
average II spikes/plant =
average II spikelets/spike =
average II florets/spikelet =
average It kernels/floret
average II grams/kernel
The yield can be estimated as follows:
YIELD (g/m2) = 250 x 2 x 15 x 2 x 1 x 0.04
2 = 600 g/m
= 6 tons per hectare (t/ha)
19
=
=
l50
2
15
2
1
0.04 g

YIELD POTENTIAL
Obviously, the most accurate way to measure yield is to weigh the
harvested grain per area. However, for the purpose of this module, you
will be asked to estimate a theoretical yield potential by counting or
measuring the maximum number of initiated (potential) yield components .•
and computing the yield by the mathematical relationship given.
To get started, first consider the following data from CIMMYT
research plots in Sonora, Mexico. The following measurements of
potential (initiated) yield components were observed and recorded:
Shoots/m 2 1,600
Spikelets/shoot 20
Florets/spikelet 10
Grains/m 2 320,000
* Wt of 1000 grains 70 grams
POTENTIAL YIELD 224,000 kg/ha
* weight of 1000 of the heaviest grains
20

WHAT TO DO:
Using the formulae found on the bottom of page 4, and the following
values, compute the theoretical yield. The first example is done for
you.
·'
Example 1.
Shoots/m 2 1,000
Spikelets/shoot 20
Florets/spikelet 10
Grains/m 2 200,000
Wt of 1000 grains 50 grams
POTENTIAL YIELD ?????? ~~~~~~~~~
Using formula 1. c x d = b:
200,000 grains
2 m
x 50 grams
1000 grains
= 10,000 grams
2 m
As you are asked to give your answer in kilograms per hectare you must
use the conversion factors given below the diagram on page 4. The
computation is as follows.
10,000 grams
2 m
x 1 kilogram
1000 grams
x 10,000 m2 =
100,000 kilograms
hectare hectare
= POTENTIAL YIELD
21

* Example 2.
*
2 Plants/m 250
Shoots/plant 6
Spikelets/shoot 20
Florets/spikelet 10
Grains/m 2 ?????
Wt of 1000 grains 50 grams
POTENTIAL YIELD ?????? ~~~~~~~~-
(Hint - you will have to use more than 1 formula to do this example.)
22

Example 3.
Plants/m 2 300
Shoots/plant 4
Spikelets/shoot 15
Florets/spikelet 8
Grains/m 2 144,000
Wt of 1000 grains 40 grams
POTENTIAL YIELD ?????? ~~~~~~~~-
23

Example 4.
Shoots/m 2 1,300
Spikelets/shoot 20
Florets/spikelet 10
Grains/m 2 ?????
Wt of 1000 grains 50 grams
POTENTIAL YIELD ?????? ~~~~~~~~
24

Answers to Excercises on next page •••••••••••••••••••••
25

Answers to Examples
Example 2.
Using formula 2. c = e x g x h:
·'
then if we
then using
c = 300000 florets
2 m
assume that all florets are fertilized
300000 florets 300000 grains =
2 2 m m
formula 1. b = c x d
Theoretical yield potential = 150,000 kg/ha
Example 3.
and none abort:
Using formula 1. b = c x d and the conversion factors:
Theoretical yield potential= 57,600 kg/ha
Example 4.
Theoretical yield potential = 130,000 kg/ha
26

You should have recognized that the values that you obtained for
theoretical yields were extremely high. Many factors affect the ability
of a wheat crop to produce. What happens, for example, if tillers d~
not grow to produce a spike? What happens if a spikelet, floret, or
kernel of grain aborts before it matures? The answer is that for every
kernel of grain that aborts as a floret or does not grow, the yield .•
potential of the crop is reduced. "By how much?" you might ask. To get
an idea of how much potential yield can be reduced, consider the
following example from CIMMYT research plots that were planted in
Sonora, Mexico. The following measurements of "initiated" and "mature"
components of yield were recorded:
Potential (initiated)
Shoots/m2 1,600
Spikelets/shoot 20
Florets/spikelet 10 (8-13)
Grains/m2 320,000
Wt of lOOO·grains 70 grams
POTENTIAL YIELD _ __.;2~2_4~,_0_00_k~g~/_h_a_
Actual (matured)
2 Spikes/m 450
Grain bearing spikelets/spike 18
Grains/spikelet 1.5 (1-4)
2 Grains/m 12,150
Wt of 1000 grains 40 grams
ACTUAL YIELD __ .___;4...:.'..;;...86..;;...0___;k.;..i.g~/...;;.h_a
Note the large differece between the potential yield and the actual
yield. What occured during the development of the crop that limited the
yield so far below the theoretical potential? More importantly, can
anything be done about it? These questions will be considered in the
following lessons. For now, you should be ready for the criterion test
27

which will ask you to estimate a theoretical yield potential using
values for yield components you, yourself, observed and recorded in the
preceding module.
28

ESTIMATE THEORETICAL GENETIC YIELD POTENTIAL
FROM YIELD COMPONENT MEASUREMENTS
CRITERION TEST:
In the preceeding lesson on dissection and identification of plant
parts you made internal and external obsevations of a number of wheat
plants. These included observations of such yield components as number
of tillers per plant, number of spikelets per spike, and number of
florets per spikelet. Using this information, the formulae and
conversion factors given on page 3, and assuming a plant population of
200 plants per square meter and a 1000 grain weight of 50 grams,
calculate the theoretical yield for each of the worksheets you
completed.
14

RELATE YIELD COMPONENT PRODUCTION TO WHEAT GROWTH STAGES
29

RELATE YIELD COMPONENT PRODUCTION TO WHEAT GROWTH STAGES
OBJECTIVE:
Given a diagramatic guide, relate observed growth stages (or
spike developmental stages) of a wheat plant to phases of , yield component production, such as:
a) leaf and tiller bud production
b) tiller production and abortion
c) spikelet production
d) floret production and abortion
e) grain set and filling
for any field of wheat.
CRITERION TEST:
Using the diagrammatic guide included in this lesson, go to a
wheat field indicated by your instructor and recognize and
identify the critical phases of production of the components
of potentially harvestable yield.
30

ADDITIONAL RESOURCES:
Crop Physiology - Some Case Histories, Evans, L.T.,
I.F. Wardlaw, and R.A. Fischer, Cambridge University
Press (1975), Chapter 5, pp. 101-149
An Explanation of the Decimal Code for the Growth Stages of
Cereals, Tottman, D.R. and R.J. Makepeace, Annals of
Applied Biology (1979), Vol. 93, pp. 221-234
Regional Workshop on Cereal Diseases Methodology,
Organized jointly by: The Royal Government of the
Netherlands and CIMMYT, (1983), pp. 6-12
Cereals: Crop Development from Germination to Harvest,
Farmers Weekly Supplement, Dec. 29, 1978
Cereal Development Guide, PB! Cereal Unit
A decimal code for the growth stages of cereals.
J.C. Zadoks. 1974. Weed Research 14. pp.415-421
(Shows the relationship between Feekes' Scale
and Zadoks' scale).
Understanding Crop Production, Stoskopf, N.
Chapter 5 on Net Assimilation Rate, pages 193-198 on Plant
Competition.
31

INTRODUCTION
The ability to estimate yield by measuring yield components is not
nearly as important as the ability to recognize at what point during the
cropping cycle the development of each component occurs. This module
will describe how a wheat crop passes through an orderly sequence of .•
developmental phases from seeding to harvest. First, leaves are formed,
then the spike initiates with spiklets, then with florets and finally
the grain sets and grows. When the crop matures, grain yield is the
product of these predetermined developmental events interacting with the
environment and management. The number of grains, for example, which is
a major factor affecting yield, depends on how many tillers and florets
are formed and survive to set grain. Like all Gramineae species, the
only ~ way to identify the stages of development in wheat is by
examining the shoot apex or developing spike of the plant directly. Your
ability to recognize and identify the stages of wheat development is
important for the following reasons:
1. To correctly schedule management operations such as fertilizer
and herbicide applications, etc. for minimizing the loss of
potential yield.
2. To predict the effects of environmental stress factors during
the crop cycle.
3. To judge how well a variety "fits" into a given cropping
environment or system.
32

GROWTH VERSUS DEVELOPMENT
Growth is defined as the irreversible increase in the weight or
volume of an organism, organ or cell. Development is the differentiation
of cells into forms that have new and distinct organs.
Some examples of growth are the increase in the number of tillers, .•
spikelets and florets and the increase in grain weight during grain
filling.
Some examples of development are the change from the production of
leaves to the production of spikelets and the differentiation of
florets.
KEY POINT:
EACH PLANT ORGAN, WHETHER IT IS A ROOT, LEAF, TILLER, SPIKELET, FLORET
OR KERNEL OF GRA~N, FOLLOWS AN IDENTICAL PATTERN OF DEVELOPMENT: THIS
PATTERN IS DIVIDED INTO 4 DISTINCT STAGES: INITIATIONIP-- GROWTH
MATURITY -- SENECENCE.
For example, a leaf is initiated (by the shoot apical meristem), it
grows (increases in weight and volume), it matures and it seneces. A
tiller, for example, is initiated (as a tiller bud), it grows, it
matures to produce a spike and it ages and dies.
KEY POINT:
FOR EACH COMPONENT OF YIELD, THE INITIATION AND GROWTH (INCREASE IN
NUMBER OR WEIGHT) AND ABORTION (DECREASE IN NUMBER OR WEIGHT) OCCURS IN
AN ORDERLY SEQUENCE AND AT DISTINCT TIMES DURING THE CROP CYCLE.
33

A CLOSER LOOK:
In the last two lessons you saw that the only sure way to identify
the stages of development of the wheat plant (Gramineae spp.) is by
observing the shoot apex or developing spike of the plant directly.
The following pages contain labelled drawings illustrating .•
the critical morphological stages of a developing wheat plant and its
spike. In reviewing this material, there are three points to keep in
mind:
1. "Vegetative organs" include all the leaves (lamina and sheath) and
the corresponding nodes where the leaves are attached.
2. With time (in spring wheats - often as soon as 2 to 3 weeks),
growth activity shifts to the production and differentiation of
"reproductive organs" (the spikelets and florets.) This shift is
called floral initiation and is one of the major events in the life
of a plant.
3. The growth cycle of wheat, a determinate crop, can be
divided into two periods of about equal length. The vegetative
growth period begins at germination and continues until
fertilization. During this period the roots, leaves, stems and
number of reproductive organs (yield potential) are developed.
After fertilization, vegetative growth stops and the reproductive
period begins and continues until the plant reaches maturity. All
wheat plants follow this same pattern of development.
34

Variations around the basic pattern of development illustrated in this
lesson are explained in the paper by Evans, et.al. that is available as
an additional resource. However, before you look at variations, you have
to be able to relate the different observed stages of plant development
to phases of yield component production. )
To begin, read through the next 8 pages and any part of the
additional resources listed below:
I. Cereal Development Guide, and
2. Cereals - Farmers' Weekly Supplement, Dec. 1978
Plant specimens and slides that show developmental stages are also
available from your instructor.
35

WHEAT GROWTH AND DEVELOPMENT
Germination to Anthesis
36

. Figure 1. ·:I .. '. . . ,,.
.. .. •.
Figure 2.
First 'true' Leaf
Coleoptile
So~~!_ ' \~ .. ~------· .. . . "\ . . . .,,, ... ' '• . ... -• Jf/,{ '• • \' ' .... t .}' • ', •: I - ._ - • " • I ~ ... ..,,, ....... ~z .. ,. __ ... ~---. :-:- ............
.. ..., ...._, •. ~r;~~~ .... . ·• -$.: i ~. . ~.;·!.'.::-. . ·'~:-• 4'~·'. \ .... ~ • ·~"'Y.; ... . . l .·'f,. ;i. ~ .· ·f.. ... :•-il'. .. . .\"$'~ .: ( ;._:. :.::.,:~ ~ .. :1~1(-'~:'.:!.j,:_. ~~·-t. • . ·f:'~':!. ~s..;·.'(~· --~.: . - >1.:-tt·t·~~~~~.· ~ ... ~-- .. _:;t -~:; , -·~- ' • . I t . ~ i/:'- .•. • :-·.'I.I .• ,. ....._ - f4-. . ~- -, • • ' t-:!ro, • • •. • • · :r9'-.-fo· · ··
• ,,... : • .. • ••• ~ • ' ~·.. ~ .. ·.. •• • ..,"!. ~.:. •
37

GERMINATION AND EMERGENCE
To the left are two illustrations. Figure 1. shows a seed in the > •·
process of germination. The embryo, which is dormant inside the dry
seed, resumes its growth when it is supplied with sufficient water,
oxygen, and adequate temperature. During germination, the embryo swells
and ruptures the pericarp. From this rupture, the radicle (roots) and
the plumule (coleoptile and shoot) grow.
Figure 2. shows the coleoptile of the young plant breaking through
the soil surface - emergence.
38

Figure 3.
Leef3
Figure 4.
39

VEGETATIVE SEEDLING
Figure 3. to the left shows a plant with three leaves visible. At , •·
this stage the first leaf (1) is fully expanded and mature (the
coleoptile is already senecent), the second leaf (2) has just expanded,
and the third (3) is still emerging from the leaf sheath. The fourth
leaf is not yet visible.
Below the illustration of the plant is a line drawing of the
growing point of the vegetative seeding (Figure 4.). To see the growing
point it is necessary to dissect the plant at the crown, located just
below the soil surface, and examine the structure under a microscope.
The drawing shows this structure, also known as the shoot apical
meristem, in the process of produci~g leaf initials around its edge.
Two leaf primordia are visible in this case. With each leaf primordium
initiated, an associated tiller bud is formed in the leaf axil but these
are concealed by the young developing leaf.
40

Figure 5.
Figure 6.
41

FLORAL INITIATION
The exact time of floral initiation is dependent on genotype and
the plant's interaction with its environment (e.g. vernalization and
photoperiod responses). It may occur at the 3, 4, 5, or 6 leaf stage.
Figure 5. on the left represents a plant with four leaves visible (3 + 1 .•
leaf stage) - 3 leaves fully expanded and the fourth still emerging.
The first tiller is also apparent.
In the drawing of the growing point of a plant during floral
initiation below this, one can see initials that have been produced.
These initials, which are being produced very quickly during this stage,
approximatly 3 times faster than before, are piling up. Some of these
new initials are not foliar but are floral, and will eventually develop
into spikelets. The first definite indication that floral initiation
has occured is when the shoot apex attains the so called "double ridge
stage". At this stage the initials appear as double "bumps" - ridges on
the flanks of the apex. The upper ridge represents a spikelet
primordium and the lower ridge a leaf primordium. It is unclear which
of the primordia will become the last leaf. Early lines begin floral
initiation sooner than late lines and will produce fewer leaves. Some
early lines may produce only 7 or 8 leaves while late ones can produce
11 or 12. For a specific genotype in a specific environment with almost
the same planting date, the pattern of floral initiation is usually the
same.
The shoot apex continues to form spikelet primordia until
eventually a stage is reached when maximum spikelet number is achieved.

Figure 7.
l7
Figure 8.
~---- floret 4
43

SPIKE AT 1 CENTIMETER - FIRST NODE DETECTABLE
The growing point itself eventually develops into a spikelet
primordium and ends its production of spikelet initials, a process known .•
as "terminal spikelet initiation". This stage is difficult to pinpoint
exactly without dissecting the plant and observing the shoot apex.
However, you can determine fairly accurately when this stage has occured
just through observation of the plant in the field. When a slight
swelling (node) can be detected on the main shoot just above ground
level you know this stage has been reached. At this point the plant has
stopped tillering and stem extension has begun.
The growing point may be examined by dissecting the plant and
observing ·the spike located about 1 to 2 centimeters above the soil
surface. Figure 8. to the left depicts the terminal spikelet at the tip
of the spike (shaded portion), and in this case, four florets have
already been formed. Stem elongation (internode extension) coincides
with the end of tillering, and occurs soon after terminal spikelet
initiation.
Realize that at this stage the maximum number of spikelets are
present on the spike. The spike cannot initiate any additional
spikelets. However, floret production does continue beyond this point.
44

~ 1.11
Figure 9.
Figure 10.
.. .
floret 8
"""" .P 1 ~stamen ~ Lemma floret 5
Supernumerary "\ apikelet
=-+R.dM•
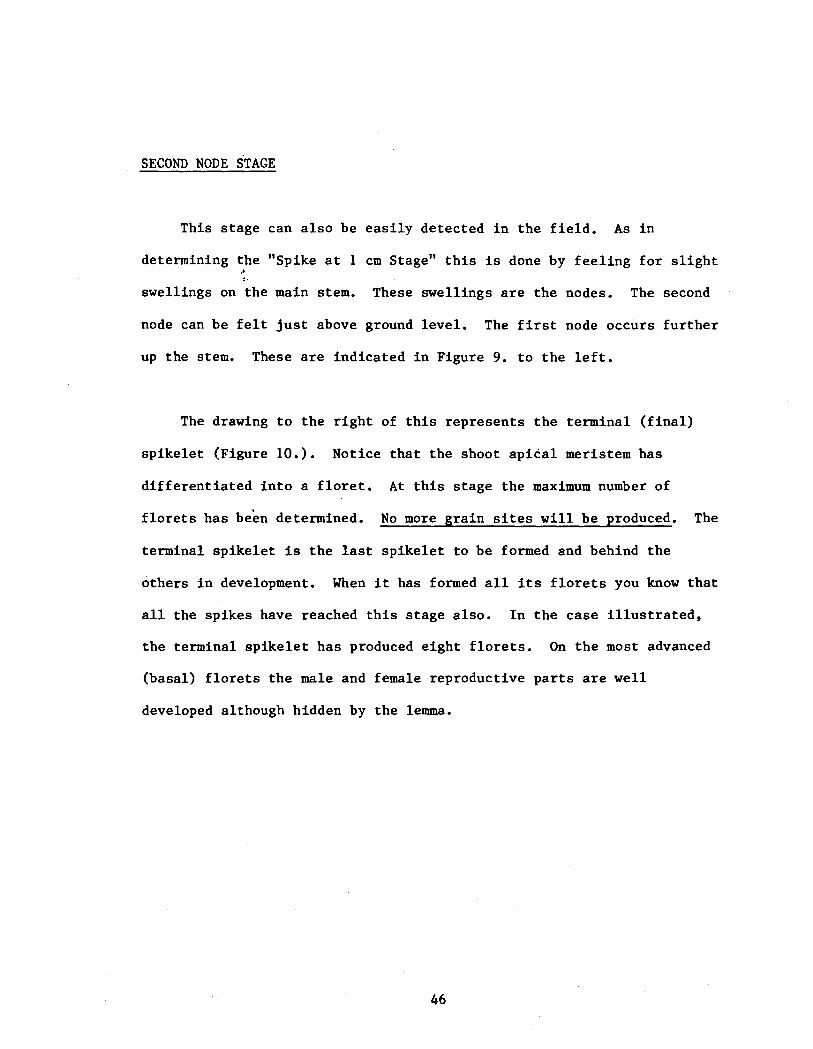
SECOND NODE STAGE
This stage can also be easily detected in the field. As in
determining the "Spike at 1 cm Stage" this is done by feeling for slight .. ,. swellings on the main stem. These swellings are the nodes. The second
node can be felt just above ground level. The first node occurs further
up the stem. These are indicated in Figure 9. to the left.
The drawing to the right of this represents the terminal (final)
spikelet (Figure 10.). Notice that the shoot apical meristem has
differentiated into a floret. At this stage the maximum number of
florets has been determined. No more grain sites will be produced. The
terminal spikelet is the last spikelet to be formed and behind the
others in development. When it has formed all its florets you know that
all the spikes have reached this stage also. In the case illustrated,
the terminal spikelet has produced eight florets. On the most advanced
(basal) florets the male and female reproductive parts are well
developed although hidden by the lemma.
46

Figure 11.
Figure 12.
"BOOTING"
47

FLAG LEAF STAGE
Flag leaf stage is attained with the appearence of the final (flag)
leaf on the main stem (see Figure 11.). Soon after the flag leaf is .•
fully emerged the ear can be found within the flag leaf sheath , known
also as "booting stage", Figure 12. labeled "Booting" to the left. The
number of florets has declined since the 2nd node stage and floret
abortion (death of florets) continues, mainly due to internal
competition for metabolites (carbohydrates, minerals, water, etc.).
48

Figure 13.
Figure 14.
49

HEADING STAGE
At heading, the flag leaf sheath splits exposing the ear (head). ~
The head then emerges and is ready to begin flowering. At the time of
its passage upwards - during stem extension, the spike will usually have
aborted more than one-half of the grain sites (florets) than were
originally initiated.
In the illustration of the plant the first spikelet is just visible
above the flag leaf auricle (Figure 13.). Figure 14 (a and b) shows the
sequence of the head emerging from the leaf sheath. Heading stage is
determined when 50% of the spikes in the field are above the flag leaf
auricle •
50

Figure 15.
Figure 16.
51

FLOWERING STAGE (Anthesis)
, •·
During flowering, the male parts of the flower (anthers) release
pollen. In an individual spike, pollen release takes only a few hours.
For the whole crop, flowering may take a week or more if the spikes are
at different levels of maturity. Figure 16 shows ears in various stages
of flowering.
52

HERE IS WHAT TO DO NOW:
Before continuing with the lesson, read pages 64 through 70 from
the Cereal Development Guide prepared by the Plant Breeding Institute,
England for an excellent summary of spikelet and floret development and >
grain growth (see list of references.) After you have read this material
continue with the next section of this module.
53

A DIAGRAMATIC IDENTIFICATION GUIDE OF DEVELOPMENT
The following is a diagramatic presentation of the different stages
of development for a wheat plant. The diagram shows the sequence and
stages of development of the components of yield. You can use this
diagram as a guide to help you visualize how a wheat crop develops from ~
seeding to harvest.
KEY POINT:
NO CALENDAR DATES ARE GIVEN SHOWING WHEN THE VARIOUS STAGES ARE
REACHED BECAUSE SEASON, VARIETY, DATE OF SEEDING, AND EVEN SEEDING
DEPTH AND DENSITY AFFECT THE RATE OF DEVELOPMENT. IF THIS WERE NOT
SO, THERE WOULD BE LITTLE NEED FOR DEVELOPING THE SKILL TO IDENTIFY
DEVELOPMENTAL PHASES.
It will be explained in more detail in the next lesson that the
potential leaf number, tillering capacity, spike size and grain size are
an expression of the rate and duration of the growth phases for each
yield component. This is genetically controlled but is also influenced
by the environment. The result is that the same variety in one
environment may, for example, develop 9 leaves and 2 tillers while in
another environment 11 leaves and 3 tillers. Conversely, in the ~
environment, one variety may produce 8 leaves and another variety may
produce 10 leaves.
There are, however, no exceptions to the sequence of development of
the components of yield and their relationship to certain crop stages,
e.g. the beginning of stem elongation signifies the end of tillering ami
spikelet initiation.
54

PRACTICE:
USING THE DIAGRAMATIC GUIDE
The following practice will help you to use the diagramatic guide
for identifying the critical phases of production of the components of
yield. The first column lists a few important growth stages that are
easy to observe during the crop growing season. The next column lists
the different components of yield. You can refer to any part of this or
the previous two "Growth and Development" lessons or any of the
additional resources to help you relate growth stages of a wheat plant
to phases of yield component production from initiation to senesence.
This practice askes that you check the box or boxes that most
closely describe the phases of growth of each yield component listed in
the "Yield Component" column at the observed crop growth stage in the
"Growth Stage" column.
To get you started on the practice, the first series is answered
for you. When you have completed the practice, check your answers on the
next page. If you feel comfortable with your answers, go to the next
section of the lesson: "Staging a Crop in the Field."
55

GUIDED PRACTICE
GROWTH STAGE YIELD NOT YET INITIATING INCREASE MAXIMUM DECREASE COMPONENT INITIATED IN II OR POTENTIAL IN II OR
WEIGHT WEIGHT WEIGHT GROWING MATURE SENECENT
1. Spike at lcm a. Plants/m 2 v b. tillers/plant I/ c. # Spikes/plant ,,,..-d. florets/spikelet v ,,..,.... e. II ·kernels/ spike v f. kernel/weight v
2. Floral 2 a. Plants/m initiation b. tillers/plant
c. # Spikes/plant d. florets/spikelet e. # kernels/spike f. kernel/weight
3. Emergence 2 a. Plants/m b. tillers/plant c. # Spikes/plant d. florets/spikelet e. # kernels/spike f. kernel/weight
4. Flag leaf 2 a. Plants/m b. tillers/plant c. H Spikes/plant d. florets/spikelet e. II kernels/ spike f. kernel/weight
2 5. Flowering a. Plants/m b. tillers/plant c. # Spikes/plant d. florets/spikelet e. II kernels/spike f. kernel/weight
6~ Heading 2 a. Plants/m b. tillers/plant c. II Spikes/plant d. florets/spikelet e. I kernels/spike f. kernel/weight
56

FEEDBACK TO GUIDED PRACTICE
GROWTH STAGE YIELD NOT YET INITIATING INCREASE MAXIMUM DECREASE I
COMPONENT INITIATED IN II OR POTENTIAI IN II OR WEIGHT WEIGHT WEIGHT GROWING MATURE SENECENT
1. Spike at lcm 2 ,,.._.--a. Plants/m b. tillers/plant ~
c. II Spikes/plant ,,.,.,..-d. florets/spikelet v ........... e. II kernels/spike v f. kernel/weight v I
2 v 2. Floral a. Plants/m initiation b. tillers/plant ,,,.,- v
c. II Spikes/plant ,,,.,- ,_ d. florets/spikelet v e. II kernels/spike v f. kernel/weight ,,_,,,..,.
3. Emergence 2 ,,..,... a. Plants/m b. tillers/plant a--c. II Spikes/plant ,,,.... d. florets/spikelet ....,-e. I kernels/spike ~
f. kernel/weight ........
4. Flag leaf 2 Ve:! ~ ,,,,,,.
a. Plants/m b. tillers/plant ,,...... c. II Spikes/plant ...... d. florets/sDikelet ....... e. II kernels/spike .,,,,, f. kernel/weight ,,,,,,..
5. Flowering 2 Vo W1 v a. Plants/m b. tillers/plant v c. # Spikes/plant V' d. florets/spikelet L./
e. I kernels/spike .....-f. kernel/weight V"'
6. Heading 2 V( 1/l. .,.....
a. Plants/m b. tillers/plant V'" c. I Spikes/plant v d. florets/spikelet V' e. I kernels/spike ~ £. kernel/weia.ht V"'
57

* STAGING A CROP IN THE FIELD
(How to objectively determine the growth stage of a field of wheat.)
This method for determining growth stages is based on counting the
leaves and nodes on the main stem of plants. The number of leaves can
vary significantly from plant to plant. A leaf is judged to be unfolded .•
when the ligules appear at the base of the leaf. This usually occurs
shortly after the next leaf has started to appear. Only the leaves and
nodes on the main stem of the plant should be counted. Ignore the
tillers.
Sowing depth can cause much variation. Seeds sown at 10 cm. may
have a main shoot with four leaves but no tillers. A seed sown at 2 mm
in the same crop, may have as many as nine tillers and five leaves
unfolded on the main stem.
Plant population may also affect the number of leaves. A plant with
more space around it may be more advanced.
Walking non-seed "alleys" in the fields is an easy way to cover a
field. But plants taken from the row on either side of these alleys may
benefit from the space left by the crop-free row and may also be more
advanced than the rest of the crop.
58

PROCEDURE
1. The best way to walk a crop is to choose typical areas of growth and
work diagonally across the field or to walk in a "W" -shaped path across
the field.
.•
2. Stop about 6 times and take 10 or iz plants at each stop. In cold or
wet weather - often when plants are young - you can dig the plants, put
them in a labelled plastic bag, and take them to a warm place to count
the leaves.
3. Do not take smaples from wet patches, stony areas, or outcrops of
lighter soils. Drill coulters may have ridden out of the soil or dropped
deeper than in the rest of the field.
4. Do not take samples from sparsely sown areas or from overlaps of the
drill.
5. Wait until about 75% of the plants are at the recommended stage
before treatment.
* Excerpted from: Cereals: "Crop Development from Germination to
Harvest"
59

SCALES FOR STAGING WHEAT
There are standard scales commonly used by researchers to record
the different growth stages. For most purposes use the Zadoks scale (see
the additional resource list). This scale is a decimal scale from 0-99
and is particularly suitable for computer analysis. Try not to use >
Feekes' Scale.
For your own work it is sufficient to note in your fieldbook the
following crop growth stages which correlate with critical developmental
phases of the components of yield.
1. Seeding
2. Emergence
3. Beginning of tillering
4. Spike at 1-2 cm (end of tillering, beginning of stem
elongation).
5. Heading or Flowering
6. Physiological Maturity
CRITERION TEST:
You should now be ready for the criterion test. The test asks you
to relate observed growth stages to the critical phases of production of
the components of potentially harvestable yield. You should use the
diagramatic guide in this lesson. You may be required to do this for any
plant samples or field you see. For now, however, ask the instructor
which field or plant samples you will use for your criterion test.
60

~
-:;:i CP )-
e -CP 0 C.t! 0 c:
!I OU •..! u .... c:CP 0
~I U>.c
0.
No. of Plants/ m2 E'·'··-·.·.·.··1 I 1. f::::::::::::_
3.
:·:···· · · · · ··· f :~1Jtf :~~~Mf~~:n1 No. of Splkel)1ts/Splke
b. f :}~:?~:t~/J?I??~:I No.of Ftorets/Spikelet
c. U::::::::::::::::::::::::::::::::::::I No. of Spikes/ Plant
Appendix 1
No. of Leaves
No. of Kernals/ Spike
(::::::::::::::::::::::::::::1 Kernal Weight
4. IC
~ § -g • ~
E • & ~ I Tiller Abortion I , ,5eedl°' Tlllerinq I Elonqantlon
/Leaf and I Spikelet Development/ Tiller bud
Initiation /Floret Development/ I Floret I Abortion
I Flowering I Groin Fillinq I Pollination/
c; u
i>--+-oa:: ·- :t .... >-Cl f:::1
-~------Vegetative Stage ------..i•li.-4---Reproductive Stage---<".rl
t r t f f f l l ·~I# d: e~ ./~~ ~ ~" ;! .'! ~" ~ # ... t) ~
(:5 "V ~ ~ '"*' ~ ~ ~
A diagranatic presentation of the different developtent stages of a wheat plant and crop showing the sequence and develcpnent phases of the catpCl1ellts of yield. At the bottan is shown the pages for referring to the illustratioos in the nodule. Total yield is the product of 1 x 2 x 3 x 4.
61
't i .. a
% I

+c: 0
a:: ........ .... ~ e ::. z +-0 0 .c (/)
Appendix 2
c: 0 +-0 Cl c: 0
w
! (/)
't 0 .c (/)
c
1-t-------- :i
.. 9 e ::J z
leaf Initiation
Spike Growth 8 Floret Death
Grain Filling
------------- 140
+• Rfd en c: a ~
C>
.... 0
~~~~--~~----+-50 t .... 0
Max. Floret
Fertile Floret
--
---N1o. _____ 1No. -G~l~i_n ________ 18 _
______ Ii~ o lttz - - ---------------0-
Collar Terminal Initiation Spikelet (
Flog' (H~ad\ Pollination leaf/ \ mo/
Main Shoot Ontogenetic Stage Time-----.
Maturity
lL
After Gallaaher. 1979 Croo Phvsioloav and Cereal Breedina

RElATE YIELD a::MPCNFNr PRmU::I'IOO TO mFAT raGlIH ST.AGES
Criteriro Test
.The criterion test for this lesson is similar to the guided practice that you coopleted earlier. The 03.in difference is that you \rill visit a mmber of wheat fields at different stages of develoµrent and be asked to determine the growth stage of each f ield yourself. You \rill then be asked to identify the ccqxments of yield that are being set up for the observed growth stage by checking the box or boxes that 11Ds t closely describe the p~ of growth of each yield carponent listed in the ''yield carponent" colu:m.
GRaIDI STAGE YIELD m YEr ~ ThCREASE a.\.XD!LN Dff:RFASE _Ol1KNENf INITIATir IN 1.1 OR PO'IThTIAL IN f; OR
\.."EIGIT \,IlQIT 'l..'EIQIT GRo;..rm:; M.lffi,'RE - " ~ " ~ '11
: ! !
Field 1. a. Plants/m2
b. tillers/ pla.."1t ! I I i c. IJ Spikes/2J..2nt I I I I !
I
d. flor ets/soikelet i I e. ;f kernels/ sp:iJce 1 ! I '
f. kernel/v.>eight I I ! : '
2 I i l Field 2. a. Plants/m I i I
b. t iller s/eJ...cnt I I I I ' ! I
f.! S2ikes/pla:"'.t I
c. I I
d. florets/ spi.~elet i I i I I
e. If kemels/soike I I i f. kernel /weight i I i
' I I
Field 3. a. Plants/m I ' I ;
b. tillers/ El.ant I I I I
c. ;/ Suikes~lant I d. flo~ets/::=ikelet I I
2
e. II kernels/ spi ke , ! I I I
f. kernel/weight i I I I
2 I
! Field 4. a. Plants/m ! b. tillers/p1.ant I I c. if Snikes/plant J !
d. florets/spikelet I I ' e. II kernels/ soike I i : f. kemel/weis?:ht I I I
' I I
2 j
I I Field 5. a. Plants/m I b. tillers/plant I I !
c. f.I Spikes/plant I I I i i I
d. florets/soikelet ! i
e. II kernels/soike I I I i f. kemel/"'1eight I I I I
2 I
Field 6. a. Plants/m I
b. tillers/ plant I I I
c. II Spikes/plant I I d. florets/ spikelet e. Ii kernels/ soike f. kernel/weight

ORGANIZE PRODUCTIVITY ANALYSIS FACTORS
64

ORGANIZE PRODUCTIVITY ANALYSIS FACTORS
OBJECTIVE:
Given an extensive list of factors associated with defining
and analyzing productivity problems, reorganize the factors
under the headings shown below: ..
General Heading Yield Component(s)
Specific Factors Crop Growth Stage(s) Genetic Env Mgmnt
1. Getting the Population
2. Building the Yield
3. Protecting the Yield
SAMPLE TEST ITEM: LIST (SAMPLE):
General Heading
1. Getting the population
Crop Growth Stage(s)
emergence
- Seed rate - II plants/m2 - Getting the population - Crusting - Emergence - Seed depth - etc •••
Yield Component(s)
2 llplants/m
65
Specific Factors
Genetic Env Mgmnt
seed rate crusting seed depth

ADDITIONAL RESOURCES:
66

ORGANIZE PRODUCTIVITY ANALYSIS FACTORS
INTRODUCTION
There are many factors that affect the growth, development and
final yield of a wheat crop. Factors such as seeding date are easy to
manage; others, such as seasonal temperature, are not. Before you test ~
and propose alternative technologies for farmers, it is important to
have a strategy to ensure that you identify all the important elements
that can affect productivity. This is the function of a "productivity
analysis." Productivity analysis refers to the techniques used to help
identify, define and analyze all the important factors affecting final
productivity.
What is the value of performing such an analysis of productivity?
Because productivity is the result of so many integrated factors, it's
easy to overlook the obvious or not look deep enough into the real
causes of productivity problems. In lesson WMP-3 ("Relate Yield
Component Production to Wheat Growth Stages"), you began breaking down
harvestable yield into discrete components and learned to recognize at
what point during the cropping cycle the development of each component
occurs. In this lesson, you will begin to reorganize your knowledge of
productivity-limiting factors to facilitate classifying information. It
is all part of the problem-solving strategy: identifying, defining and
analyzing productivity problems.
67

NET CARBON ASSIMILATION - The Basis for All Yield
How does 100 kg of wheat seed planted on a hectare of land become
10,000 kg of dry matter that includes 4,000 kg of grain? It is a result
of photosynthesis; the process of capturing carbon dioxide, water and
solar radiat~pn and converting them into carbohydrates. A reverse
process, common to all plants including wheat is called respiration.
Respiration results in the loss of carbohydrates into carbon dioxide,
water and chemical energy. The accumulation of dry matter depends on the
rate of photosynthesis minus the rate of respiration. The difference
between the rate of photosynthesis and the rate of respiration is called
the net carbon assimilation, and is the basis for all yield. But be
careful. We are not saying photosynthesis - respiration = wheat yield.
If this were true, there would be no need for expensive field trials.
You could simply measure rates of photosynthesis and respiration.
However, without a high accumulation of carbon, high yields are
less likely. As production specialists, you should recognize the factors
that tend to control the rates of photosynthesis of a crop.
FACTORS THAT CONTROL THE RATES OF PHOTOSYNTHESIS AND RESPIRATION
Light:
Photosynthesis occurs only when solar radiation falls on healthy
plant parts - leaves, stems, awns, etc. For the most part, plants do not
photosynthesize when it is dark or when they are shaded. However, during
68

dark periods and when shaded, plants do continue to respire. In addition
some plants -- including wheat -- also respire in full sunlight.
KEY POINT #1:
OTHER THINGS BEING EQUAL, THE NET ACCUMULATION OF CARBON IS GREATER
THE MORE LIGHT AND THE LESS DARK THERE IS, IE. LONGER DAYS, SHORTER .•
NIGHTS AND LESS SHADING.
Example:
Examine the table below showing the maximum duration of sunlight
for a location on the equator and a location at 28° north latitude (such
as Cd. Obregon, Mexico or Dehli, India.) All other factors being equal,
which conditions would be most favorable for the net accumulation of
carbon?
June December % Difference
---- Sunlight Hours ----
Equator 363.6 374.4 + 3 %
28° North 417.6 324.0 - 29 %
% Difference + 14% - 14%
69

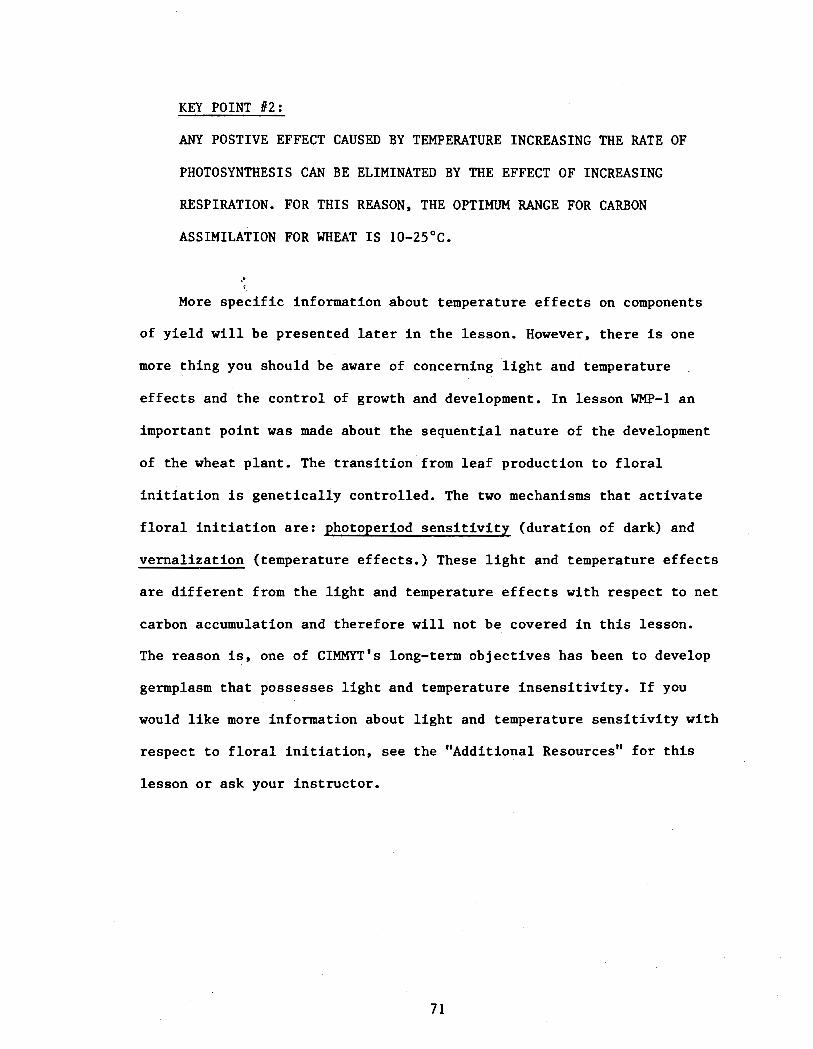
Temperature:
The rate of photosynthesis and the rate of respiration increase
with temperature from near 0° up to a lethal temperature of about 45°C.
Unfortunately, carbon losses increase faster than carbon gains. That is,
the optimum temperature for photosynthesis is distinctly lower than for .•
respiration, as shown in the following graph:
RESPIRATION
PHOTOSYNTHESIS
-10 0 10 20 30 40 50 60
LEAF TEMPERATURE •c
A generalized graph of temperature effect upon rates of photosynthesis and respiration showing the differences in three cardinal points of high, low and optimum temperatures. (From: CRC Handbook of Agricultural Productivity)
In addition, high night temperatures drastically increase normal
respiration (more losses).
70
KEY POINT 112:
ANY POSTIVE EFFECT CAUSED BY TEMPERATURE INCREASING THE RATE OF
PHOTOSYNTHESIS CAN BE ELIMINATED BY THE EFFECT OF INCREASING
RESPIRATION. FOR THIS REASON, THE OPTIMUM RANGE FOR CARBON
ASSIMILATION FOR WHEAT IS 10-25°C.
" More specific information about temperature effects on components
of yield will be presented later in the lesson. However, there is one
more thing you should be aware of concerning light and temperature
effects and the control of growth and development. In lesson WMP-1 an
important point was made about the sequential nature of the development
of the wheat plant. The transition from leaf production to floral
initiation is genetically controlled. The two mechanisms that activate
floral initiation are: photoperiod sensitivity (duration of dark) and
vernalization (temperature effects.) These light and temperature effects
are different from the light and temperature effects with respect to net
carbon accumulation and therefore will not be covered in this lesson.
The reason is, one of CIMMYT's long-term objectives has been to develop
germplasm that possesses light and temperature insensitivity. If you
would like more information about light and temperature sensitivity with
respect to floral initiation, see the "Additional Resources" for this
lesson or ask your instructor.
71

COMPETITION:
"It is a surprising thought that, in the production of a
successful and "healthy" field crop, such intense competition
is developed that in quantitative terms, the individual plants
are markedly subnormal. It is the community of suppressed
plants which gives the greatest yield." .•
C.M. Donald. "Competition Among Crop and
Pasture Plants," Advances in Agronomy
(15: 1-18) pg. 5.
The above quotation can be summerized by: A little plant
competition in a crop is a good thing. Too much, however, is not good.
Plants respond to competition in three ways:
1) density-dependent mortality
2) hierarchy of exploitation
3) plastic response
Don't let the above terms scare you. The words themselves are not
particularly important. What is important is the concepts they
repres~nt. Even if you can't remember the terms, be sure that you grasp
the concepts below:
Density-dependent mortality: If a crop is so dense that there is not
enough water, nutrients or light to go around, then some tillers or even
whole plants may die. Competition can come from weeds, from excessive
seeding rates or simply from a lack of soil nutrients and water.
72

Example:
A study was done by the CIMMYT wheat production training group in
Jalisco, Mexico. In 21 farmers' fields, the number of spikes per square
2 meter at flowering averaged only 59% of the average number of plants/m
at emergence. The problem was identified as density-dependent mortality.
Hierarchy of exploitation: If there is not enough water, light,
nutrients, etc. to go around, the earliest emerged plants, the earliest
initiated tillers, spikelets, florets, and kernels will get their share
of resources. The smallest and slowest growing plants, tillers,
spikelets, florets and kernels suffer the most.
Plastic response: If a stress occurs that affects the growth of one
of the components of yield, relieving of the stress during the growth of
a later-developing component will sometimes result in smaller losses of
yield. The most common example is probably low plants per square meter
being offset by more tillers per plant. Sometimes when a stress (such as
too much or too little moisture) that reduces tillering is relieved, the
result is fewer sterile florets per spikelet.
KEY POINT #3:
COMPENSATION AND PLANT RESPONSES TO COMPETITION ARE NEVER PERFECT.
MAXIMUM GRAIN YIELD PER UNIT AREA REQUIRES MINIMIZING LOSSES DUE TO
COMPETITION, NOT MINIMIZING COMPETITION.
73

THE CONTRIBUTIONS FROM ROOTS AND STEMS
So far, we have discussed some of the the major contributions to
yield made by the above-ground parts of the wheat plant (either
photosynthesizing tissue or the components of yield.) Let's now consider
the root sys~.em.
First, there are two distinct root systems on a wheat plant: crown
roots and seminal roots. These are il1lustrated below:
Seminal roots:
1. Are fixed in number at the time of seed
development.
2. Have a maximum potential of up to 10.
3. Usually only 3-5 develop from heavy, plump,
young seed.
4. Normally grow straight down and deep. Primary ( . l
t · seminal roo 5. Have the advantage in dense monoculture with
little stress.
Crown roots:
1. Are physiologically associated with tillers.
2. Are produced in no fixed number - they are
associated with tiller growth.
(crown) 3. Are not as thin, not as branched and do not
grow as deep as seminal roots.
4. Have an advantage in competitive situations
and under a variable environment.

KEY POINT #4:
THE WHEAT PLANT WORKS TO OPTIMIZE THE CONTRIBUTIONS FROM ROOTS
AND STEMS •. THIS INTERDEPENDENCE IS ULTIMATELY UNDER GENETIC
CONTROL.
Although the rate and duration of root growth is basically under ~
genetic control, the expression of the growth potential can definitly be
modified by environmental and crop management factors. Such factors that
affect the rate of root growth are:
· 1. Soil mineral nutrition (Fig. A)
2. Soil water-aeration (Fig.B)
3. Soil temperature
4. Plant spacing
5. Soil compaction
6. Stem and root interrelationships, e.g. grazing
75

Figure A: Effect of a localized supply of nitrate on root growth in barley. (Drew & Starker 1975)
.·
76
Ill ,·in
Figure B: Influence of moisture depth upon horizontal and vertical root growth of winter wheat. Annual precipitation: I. 730 mm; II. 570 nun;
.. III. 440 nm. Plant height: I. 100 cm; II. 94 cm; III. 64 cm. (after Weaver, cit. Kutschera 1960)

Notice how some of the above factors might relate to management
practices, for example: drainage, tillage, irrigation, etc.
The duration of root growth is almost entirely genetically
controlled. Net root growth stops at flowering and, except for a
maintenance supply, all root and stem assimilates (carbon dioxide, ~
water, and nutrients) go to grain filling.
The contribution of roots to yield may not be immediately obvious.
Since the interrelationship between roots and stems is genetically
fixed, any factor that limits or restricts root growth also limits and
restricts stem growth. Therefore, an unfavorable root environment can
cause drastic reductions in yield.
THE COMPONENTS OF YIELD - INITIATION AND RATE AND DURATION OF GROWTH
The initiation and growth of the components of yield occur in a
fixed sequence that is genetically controlled. The rate and duration of
the growth period is also genetically controlled but is also strongly
influenced by the environment and how the crop is managed. In this part
of the lesson, two general factors that control growth will be outlined.
Temperature:
In an earlier section of this lesson, we discussed the effect of
light and temperature on carbon accumulation. Temperature also directly
affects the rate and duration of growth of each of the components of
yield.
77

KEY POINT #5:
HIGH TEMPERATURE AND LONG DAYS PROVIDE A SLIGHTLY HIGHER RATE OF
PRODUCTION OF THE YIELD COMPONENTS BUT A SIGNIFICANTLY SHORTER
DURATION OF PRODUCTION.
What this means is that the development sequence of initiation,
growth, maturity and senescence is considerably shorter at high
temperatures. The result is the formation of fewer leaves, tiller buds,
tillers, spikelets and florets and smaller kernels.
Starvation:
The second general factor that controls the rate and duration of
growth of the components of yield is starvation. Starvation results from
excessive competition for light, moisture and nutrients. It occurs
because of the root system's limited capacity to supply the essentials.
The results are death of seedlings, tillers, spikelets and florets.
Farmers and production specialists alike do not have direct control
over light, temperature, and moisture (excluding irrigation). The choice
of variety, seeding date and timely land management operations can help.
You have much more control over growth and survival of the yield
components.
78

EXERCISE:
To help you get started on the criterion test for this lesson,
write the answers to the following three review questions:
1. It is impossible to overemphasize the importance of starting
out the season with the right plant population. Which crop
growth stage(s) and what component(s) of yield should be
observed?
2. Building the yield requires managing the crop to obtain the
optimum combination of yield components. Which crop growth
stage(s) should be observed and what component(s) of yield are
important?
3. Protecting the yield potential that has been created is the
third objective of a wheat producer. What crop growth stage(s)
are critical?
79

1.
ANSWERS TO QUESTIONS:
2 Seeding/emergence - #plants/m
The first key to high productivity in a wheat field is to establish
the right plant population. A poor stand puts heavy pressure on
each individual plant (compensation). A very high plant population .. leads to too much competition. Generally, you must accept the
climatic conditions but you must understand that they have
considerable influence over the plant population.
2. Beginning of tillering/spike at 1-2 cm (end of tillering) /heading/
grain filling. #spikes/plant, #kernels/spike (#spikelets/spike and
#florets/spikelet) and kernel weight. Building the yield requires
managing the tiller number, maintaining spike size and filling the
grain. This has explained that the initiation, and rate and
duration of growth is 1) genetically controlled, .2) inf~uenced by
"non-manageable" environmental factors and 3) influenced by
manageable factors.
3. Heading to maturity (harvest.) The greatest yield reducer is the
weather. But most of the other yield reducers can and should be
managed to minimize reductions of the yield potential already
achieved. This is done by proper disease and pest (plant
protection) management.
80

WHAT TO DO:
For the criterion test, you will be given a list of factors
associated with defining and analyzing productivity problems in wheat.
Although most of the factors on the list were not covered directly in
this lesson, as crop production specialists you should have little ~
difficulty recognizing them. Our objective for this lesson is for you to
reorganize the list under the following headings:
General Heading Crop Growth Stage(s)
WHY ARE YOU BEING ASKED TO DO THIS?
Yield Component(s)
Specific Factors genetic env mgmnt
The reason for this exercise is to organize the large number of
factors that potentially affect productivity into a logical scheme so .
that you can efficiently collect the information necessary to identify,
define and analyze problems related to productivity. Such a strategy
will allow you to test appropriate, researchable alternative
technologies.
When you feel you are ready, ask your instructor for the criterion
test form. You are encouraged to work with or check your list with your
friends.
81

ORG\NIZE PROaJC'l'IVI'lY ANALYSIS FPCl'ORS
Criterion Test Fo:an
Attached is a long list of factors associated with defining and
analyzing prcxiuctivity prcblems in wheat. For the criterion test, you
nust organize the factors listed under the appropriate headings on each
of the three criterion test worksheets.
18

.AN INVENIORY OF FACI'ORS AFFECTING WHEAT YIEIDS
Seeding rate Seed treatrcent Poor application of
treatrcents Specific ion toxicity Bird damage !rt:>isture Alternative hosts Variety Spikes at lan Pathogens Harvest/storage loss Salinity Weed Canpetition Plants/m2 Insects Rotation Erosion Spacing Plant errergence Crop density
carpetition Major nutrients Alkalinity Te.rrperature Drought Timing of weed
control operations Variety Saving 'llie Yield Rotation Herbicide technology Stoniness !-t>isture Seeding depth Salinity Rate of fertilizer
application Root diseases Rotation Soil depth Nematodes Getting the
Population
Soil nutrient fixation Seeding rrethod Liming Tillers/plants
donnancy/age Rotation Floral Initiation Seeding date .Animal damage Soil depth Soil pan Variety Seed source and
quality f spikes/plant Infiltration Emergence Birds Phytotoxicity
(herbicides) Crop density
ccnpetition Pesticide/fungicide
use Run-off Plant population Irrigation rrethod
timing Heading 1'Echanical damage Erosion pH Weed canpetition Insects Micro-nutrients tkernals/spike Seeding date Crusting Seed treatrrent Weed control Seeding date Rodents Land/seedbed
preparation
19
Drainage Flag leaf catpaction Building the
Yield Salinity Poor application
of treatnents FlONering Florets/spikelet Timing of
fertilization SUb-soil
penreability Variety Teltperature Crop residues I.Ddging Excess noisture/
aeration catpaction Type/timing of
land prep. Soil Fertility/
Pn:xluctivity Seeding date Weed c::arpetition Diseases and
Pests Soil Prod./
noisture Land prep.
sequence timing equiprent
Inefficient irrigation
Seeding depth Seeding date Kernal/weight Diseases Tenperature Cc4lpaction/aeration

CRITERICN TEST IDRKSHEEI' 1
GF.NERAL HEADING CROP GIOml YIEr.D
Getting the Pqlulation
STAGE(S) ~ genetic
20
AFFa:TING FAC'IDRS
env. ngmnt.

GENERAL HEAD~ CROP GRCWJlI YIErD
Building the Yield
S'mGE(S) ~S genetic
21
AFFECT~ FICIDRS
env. rcgmnt.

CRITERION TEST WORKSHIBI' 3
GENERAL HEADING CROP GIDmI YIEW
Protecting the Yield
STAGE (S) Cil1PCmNTS genetic
22
AFFECTING FACroRS
env. m:JilUlt.

SURVEY PLANT DENSITY PROBLEMS
83

SURVEY PLANT DENSITY PROBLEMS
OBJECTIVE: Using a farmer's stated population goal, or assuming a . . 2
hypothetical plant population goal of 300 seedlings/m ,
determine if the actual population in a farmer's field is
within + 10% of the goal. Begin to analyze any descrepancy .. by eliminating factors from the list you reorganized under
the heading "Getting the Population" for the competency test
in the module "Organizing Productivity Analysis Factors".
COMPETENCY TEST:
You will be assigned a field or fields by the instructor
that have,
1. an assumed plant population goal of 300
2 seedlings/m , or
2. a population goal stated by the farmer.
Determine if there is a descrepency of more than + 10%. If
there is, begin to analyze the problem. Do this by
eliminating factors from the list you reorganized under the
heading "Getting the Population" for the competency test in
the module "Organizing Productivity Analysis Factors".
84,

ADDITIONAL RESOURCES:
85

SURVEY PLANT DENSITY PROBLEMS
Introduction
In the module "Organize Productivity Analysis Factors" the
importance of starting the season with the right plant population was
emphasized. A poor stand puts heavy pressure on each individual plant ·'
to perform to its maximum potential. On the other hand, an excessive
number of plants per square meter results in losses due to within crop
competition.
IDENTIFYING, DEFINING AND ANALYZING PLANT POPULATION PROBLEMS
Researchers and farmers should have a plant population "goal" in
mind. If observation and research have determined that the optimum
2 plant population should be about 300 plants/m , then how the farmer
chooses his technology to arrive at that goal is more his concern than
the researchers' concern. Knowing the "target" plant population, a
farmer can make numerous adjustments for seed source, soil problems,
equipment limitations, etc.
KEY POINT: IT IS THE RESPONSIBILITY OF THE RESEARCHER TO ESTABLISH THE
PLANT POPULATION "GOAL" EITHER THROUGH OBSERVATION OR
RESEARCH.
86

Once the goal is established, it is a simple matter to identify whether
the farmers are "getting the population". The usual problem is that the
farmers cannot consistently, year in and year out, meet the goal.
To begin analyzing any problem, start with the list you reorganized
under the heading "Getting the Population" in the module on "Organizing
Productivity Analysis Factors". Using the information about the area .•
sampled, eliminate factors for which you have evidence cannot be a cause
of the problem. It is this final list which will guide you to research
opportunities.
At this point you may want to review the competency test page you
completed under the heading "Getting the Population" in the module on
"Organizing Productivity Analysis Factors".
STEP I. INFORMATION ABOUT THE AREA SAMPLED
For correct interpretation of observations of plant populations,
certain information about the area sampled is required. Only when you
have full and correct information, and when the fields are truly
representative of the farming practices, will your diagnosis be of any
real value. The following list is an example of information you may
include on your list. Not all of the following information will be
necessary; remember that no standard information form exists. However,
if you are interested in identifying, defining, and analyzing plant
population problems, it is not a question of "if" or "when" you should
gather this type of information, but rather "how much" of it can be
used.
87

- What is the top yield reported by the farmer?
- Location?
- Irrigated or non-irrigated?
- How large an area does the sample represent?
- What type (texture) of soil?
What is the annual rainfall?
- What is the distribution of rainfall?
- What ace the temperatures like?
- Is the soil sodic (alkaline) or saline?
- To what extent has erosion occurred in the area sampled?
- Deposition?
- How is the infiltration rate? Drainage?
- How do the crop yields compare with current typical yields?
- How is the condition of the seedbed? Level? Rocks and gravel?
Clods? Crust? Plant residues?
- What equipment is used for land and seedbed preparation, and what
are the timings of the operations?
What is approximate tillage depth?
- What is the variety and source of seed?
- How is the seed distributed and incorporated?
- Is the seed treated?
- Was the field seeded "dry" or "wet"?
- Were pre-emergence or early post-emergence chemicals used? In
past years?
- What was the seed rate and date?
What is the farmer's "goal" for his plant population or doesn't
he have one?
- What was the rate of fertilizer?
- How was it applied? Fertilizer "burn"?
As you work and gain experience in your research area, you will add
items and eliminate items from this list.
88

STEP II. MEASURING THE NUMBER OF PLANTS/METER2
The most satisfactory TIME to collect data on plant stand
establishment is after all the plants have emerged but before tillering.
It is too easy to mistake tillers for individual plants. Seedling stage
is the best sampling time.
The most satisfactory METHOD for measuring the number of
2 plants/meter depends a bit upon the method of seeding. In fields that
are broadcast seeded, a simple square (quadrate) made from a 6-10 mm
diameter round metal bar, 50 cm on a side, works well. The sampling
frame is randomly placed in the field and the number of seedlings inside
2 the 0.25 m frame are counted.
For fields that are line sown, a satisfactory method is to
determine the average row spacing and then count the number of plants in
a linear meter. For example, given a 15 cm average row spacing and an
average of 45 seedlings/meter:
45 seedlings = 300 seedlings/m2
0.15 m x 1 m
89

STEP III. "WALKING THE CROP"
The best way to "walk a crop" is to choose typical areas of growth
and walk diagonally across the field or to walk in a "W"- shaped path
across the field as illustrated in Figure 1.
Figure 1.
.•
FIELD CROP AREA
.... ~.,~,, .. H••"•••,, ..... ,,.,,,., .. '"''''• ,., f\, "'I,,,, ..... ,.,•••..: ,, l ""-·
/(, V\
•I I•'\
1. Stop about 5 times in the sampling unit and drop the sampling
frame or measure a linear meter as discussed above. If there is much
variation in the sampling area do 5 more counts.
2. Do not sample obvious unrepresentative areas like wet patches,
stony areas, or outcrops of lighter soils. If a seed drill was used for
planting, drill coulters may have ridden out of the soil in such spots.
3. Do not sample areas that are "overlaps", or where seed "spills"
may have occurred.
4. Do not sample borders of the field or alleys.
90

STEP IV. CHECKING SEEDING DEPTH
If the farmer is planting, you can get a good idea of the seeding
depth by looking at the coulter depth on the drill in the soil, or the
discs of the disc harrow in the soil if the seed is broadcast.
For fields that have at least some plants emerged, the following
method is suggested:
Look at a field and decide if the emergence is fairly even or
variable. If fairly even, then select a number of sites at random
depending on field size - e.g. for small fields of 0.5 ha, two sites
should be sufficient; for fields about 1 ha, four sites will be more
representative. If significant parts of a field differ from other . parts, then a sample should be taken from such areas as well, with a
note on the differences.
At each site, dig a slit with a flat spade, about 25 cm deep and
with a vertical face about 50 cm long. Then by carefully paring away
the soil surface with the spade or a knife, seedlings can be
sequentially exposed.
~-lJJJ C\.tT 8AC..t{ ~ 5URFAC.E O'f" Sl-\1
-------c.'50cn1-------
scecl coa.t/ s'u:u-t oF ~~'U\\n<lL roc5\:;S
t:st;mate these. d.\ sto.n.cc..s
II
91

For each seedling you encounter (whether emerged or not!) estimate the
distance from the seed coat or start of seminal roots, to the soil
surface (to the nearest cm) and record it. Continue to do this until
you have es~imated the depth of at least 10 (but not more than 25)
seedlings at each selected site. Also note the number of seedlings that
failed to reach the surface because they were planted too deep, and the "
number that reached the surface soil layer but could not break through
because of crusting. Please put the soil back into the slits when
finished.
STEP V. SEEDBOX SURVEY
If seeding is in progress, it is often valuable to obtain a small
sample of seed (50 grams or one small handful) from the farmer's
seedbox. If you plan to take the sample for a germination test, be sure
to label the seed packet with the farmer's name, variety, and date.
With or without a germination test, the following observations can be
made on the seed:
- shrivelled or plump seed
- broken seed
- weed seeds, including mixtures of other cereals
- diseased or insect-infested seed
- treated or not treated
- dirt, chaff, etc.
92

WHAT TO DO NOW
For you to demonstrate competency in identifying, defining and
analyzing plant population problems, the instructor will supply you with
the necessary equipment:
- measuring frame (quadrate)
- tape measure or meter stick
- shovel
- knife, and
- a field or plot to sample.
You should supply a list for gathering information about the area
sampled.
If you would like some practice before the test, your instructor
will designate a practice field and play the role of a farmer.
93

SURVEY PLANT POPULATION PROBLEMS
Competency Test and Evaluation Form
Directions: 1. Using the plant population goal stated· by the farmer, or
2 2. assuming a population goal of 300 seedlings/m ,
determine if there is a descrepency of more than + 10%. If there is, begin to analyze the problem by eliminating · factors from the list you reorganized under the heading "Getting the Population" for the competency test in the module "Organize Productivity Analysis Factors".
You should sample the following fields: {l)~~~~~~~~~~~~~~~~~~~ (2)~~~~~~~~~~~~~~~~~~~~-(3) (4)~~~~~~~~~~~~~~~~~~~~-
(5)~~~~~~~~~~~~~~~~~~~~-
The course instructor will indicate your level of competence by placing an X in .the appropriate box under the LEVEL OF PERFORMANCE heading. If, because of special circumstances, a performance component is not applicable,. or impossible to do; an X will be placed in the N/A box.
LEVEL OF COMPETENCE: All items must receive COMPETENT or N/A responses. If any item receives a NONE or POOR response, the course instructor and individual should meet to determine what additional activities need to be completed in order to reach competency in the weak area(s). -----------------------------------~------~------------~----------------
1. Prepared a list of information to be collected •••••••••••••••••••••• [ ]
2. Collected full and correct information about the area to be sampled .••••••.•••••••••••••••• [. 1
3. Measured the number 2 of plants/m
(a) stopped 6 - 10 times randomly in the sampling unit •••••••••••• [ 1
(b) did not sample obviously unrepresentative areas lLke wet patches, stony areas, or outcrops of lighter soils ••••••• [ 1
(c) did not sample areas of "overlaps" or "seed spills" ••••• [ ]
(d) did not sample borders •••••••••• [ 1 .· :
LEVEL OF PERFORMANCE
NONE
[ ]
[ 1
[ 1
[ 1
[ ] .
[ 1
POOR
[ 1
[ ]
[ ]
[ 1
[ 1
[ 1
COMPETENT
[ 1
[ 1
[ ]
[ 1
[ 1
[ 1

LEVEL OF PERFORMANCE
N/A NONE POOR COMPETENT
4. Measured the seeding de·pth
(a) stopped. 2 - 4 times randomly in the sampling unit •••••••••••• [ ] [ ] [ ] [ ]
(b) did not sample obviously unrepresentative areas like wet patches, stony areas, or putcrops of lighter soils •••• · ••• [ ] [ ] [ ] [ ]
(c) did not sample areas of "overlaps" or "seed spills" ••••• [ ] [ ] [ ]
(d) did not sample borders •••••••• ;. [ ] [ ] [ ] [ ]
5. Performed a seedbox survey
(a) correctly labeled the seed packet for the germination test. · [ ] [ ] [ ] [ ]
(b) noted the "quality" of the seed, e. g·. shrivelled, broken, etc •••• [ ] [ ] [ ] [ ]
6 • . Began to "analyze ~he problem":
eliminated.only those factors (from the list of factors under the heading "Getting the Population") for which there was evidence that they were not the problem ••••••• [ ] [ ] [• ] [ ]
