diagnosis of pediatric infectious diseases
TRANSCRIPT

Susanna EspositoPediatric Highly Intensive Care Unit
Fondazione IRCCS Ca’ Granda Ospedale Maggiore Policlinico, Università di Milano
Milano
DIAGNOSIS OF PEDIATRIC INFECTIOUS DISEASES

Laboratory diagnosis in pediatric CAP: diffliculties in everyday practice
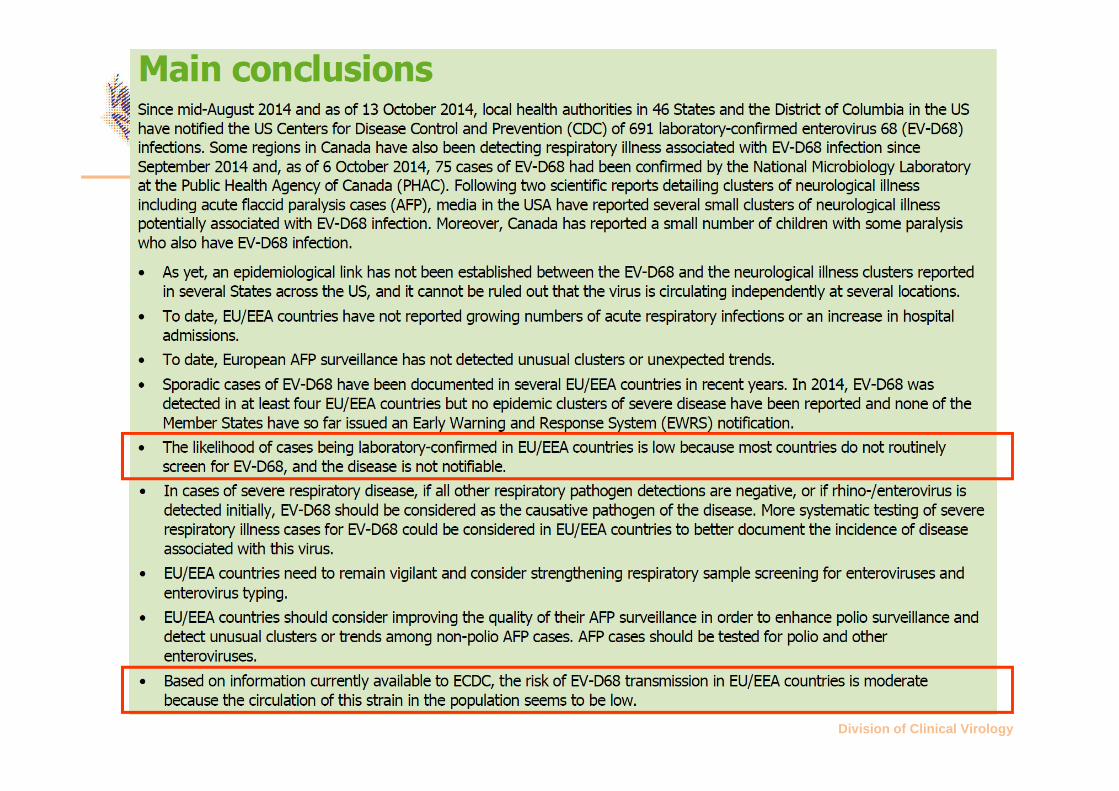
Enterovirus D68: importance of surveillance
Measles: importance of prevention
AGENDA

ETIOLOGY OF COMMUNITY-ACQUIRED PNEUMONIA IN HOSPITALIZED CHILDREN
AGE
(Years)
N° VIRAL ETIOLOGY
BACTERIAL ETIOLOGY
MIXED ETIOLOGY
ALL*
<2 108 80 47 34 93
2-5 84 58 56 33 81
>5 62 37 58 19 76
TOTAL 254 62 53 30 85
*Total with detected etiology. Results expressed as percentages of patients. Adapted from Juven et al. Pediatr Infect Dis J 2000
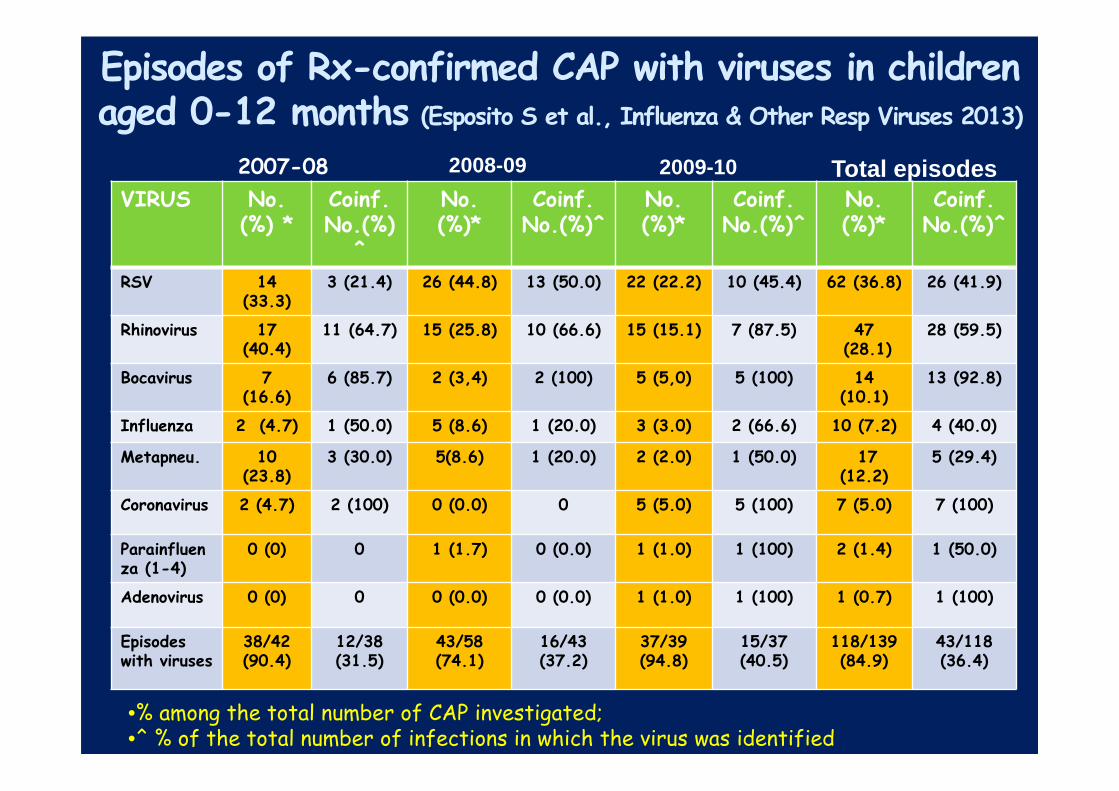
Episodes of Rx-confirmed CAP with viruses in childrenaged 0-12 months (Esposito S et al., Influenza & Other Resp Viruses 2013)
VIRUS No.(%) *
Coinf.No.(%)
^
No. (%)*
Coinf. No.(%)^
No. (%)*
Coinf.No.(%)^
No. (%)*
Coinf.No.(%)^
RSV 14 (33.3)
3 (21.4) 26 (44.8) 13 (50.0) 22 (22.2) 10 (45.4) 62 (36.8) 26 (41.9)
Rhinovirus 17 (40.4)
11 (64.7) 15 (25.8) 10 (66.6) 15 (15.1) 7 (87.5) 47(28.1)
28 (59.5)
Bocavirus 7 (16.6)
6 (85.7) 2 (3,4) 2 (100) 5 (5,0) 5 (100) 14 (10.1)
13 (92.8)
Influenza 2 (4.7) 1 (50.0) 5 (8.6) 1 (20.0) 3 (3.0) 2 (66.6) 10 (7.2) 4 (40.0)
Metapneu. 10 (23.8)
3 (30.0) 5(8.6) 1 (20.0) 2 (2.0) 1 (50.0) 17 (12.2)
5 (29.4)
Coronavirus 2 (4.7) 2 (100) 0 (0.0) 0 5 (5.0) 5 (100) 7 (5.0) 7 (100)
Parainfluenza (1-4)
0 (0) 0 1 (1.7) 0 (0.0) 1 (1.0) 1 (100) 2 (1.4) 1 (50.0)
Adenovirus 0 (0) 0 0 (0.0) 0 (0.0) 1 (1.0) 1 (100) 1 (0.7) 1 (100)
Episodes with viruses
38/42(90.4)
12/38 (31.5)
43/58 (74.1)
16/43 (37.2)
37/39(94.8)
15/37 (40.5)
118/139(84.9)
43/118 (36.4)
•% among the total number of CAP investigated; •^ % of the total number of infections in which the virus was identified
2007-08 2008-09 2009-10 Total episodes
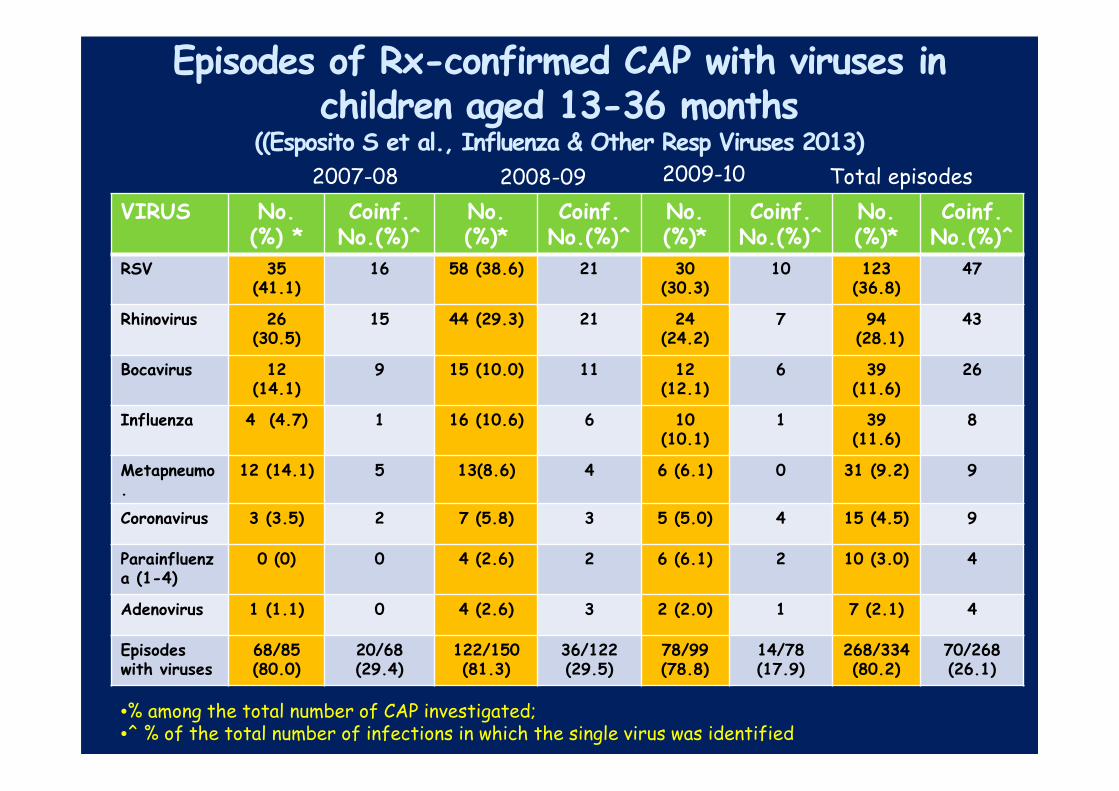
Episodes of Rx-confirmed CAP with viruses in children aged 13-36 months
((Esposito S et al., Influenza & Other Resp Viruses 2013)
VIRUS No.(%) *
Coinf.No.(%)^
No. (%)*
Coinf. No.(%)^
No. (%)*
Coinf.No.(%)^
No. (%)*
Coinf.No.(%)^
RSV 35 (41.1)
16 58 (38.6) 21 30 (30.3)
10 123 (36.8)
47
Rhinovirus 26 (30.5)
15 44 (29.3) 21 24 (24.2)
7 94(28.1)
43
Bocavirus 12 (14.1)
9 15 (10.0) 11 12 (12.1)
6 39 (11.6)
26
Influenza 4 (4.7) 1 16 (10.6) 6 10 (10.1)
1 39 (11.6)
8
Metapneumo.
12 (14.1) 5 13(8.6) 4 6 (6.1) 0 31 (9.2) 9
Coronavirus 3 (3.5) 2 7 (5.8) 3 5 (5.0) 4 15 (4.5) 9
Parainfluenza (1-4)
0 (0) 0 4 (2.6) 2 6 (6.1) 2 10 (3.0) 4
Adenovirus 1 (1.1) 0 4 (2.6) 3 2 (2.0) 1 7 (2.1) 4
Episodes with viruses
68/85(80.0)
20/68 (29.4)
122/150 (81.3)
36/122 (29.5)
78/99(78.8)
14/78 (17.9)
268/334(80.2)
70/268 (26.1)
2007-08 2008-09 Total episodes2009-10
•% among the total number of CAP investigated; •^ % of the total number of infections in which the single virus was identified

• Blood cultures should be obtained in children requiring
hospitalization for presumed bacterial CAP that is
moderate to severe, particularly those with complicated
pneumonia (strong recommendation; low-quality
evidence)
• In improving patients who otherwise meet criteria for
discharge, a positive blood culture with identification or
susceptibility results pending should not routinely
preclude discharge of that patient with appropriate oral
or intravenous antimicrobial therapy. The patient can be
discharged if close follow-up is assured (weak
recommendation; low-quality evidence)
Blood Cultures: Inpatient
IDSA guidelines; CID 2011. Kindly provided by Prof. Greenberg

Blood culture and RT-PCR for the diagnosis of pneumococcal bacteremic CAP
(From Esposito et al., Pediatr Infect Dis J 2012)
� Radiographically confirmed CAP: 510
� Cases associated to S. pneumoniae infection: 73 (14.3%)
� RT-PCR positive: 67 (91.8%)
Blood culture positive: 1 (1.4)
RT-PCR and blood culture positive: 5 (6.8%)

PNEUMOCOCCAL SEROTYPES IN CHILDREN WITH CAP AGED <5 YRS BEFORE THE USE OF PCV-13
(From Esposito S et al., Pediatr Infect Dis 2012 )
4; 2.0%
14; 18.0%
5; 0%
19F; 2.0%
23F; 2.0%
3; 4.0%
6A; 2.0%
9V; 2.0%
18C; 0%
1; 2.0%
7F; 6.0%
6B; 2.0%
Not Typeable;
26.0 %
19A; 32.0%
COVERAGEPCV-7 : 28%PCV-10: 36%PCV-13: 74%

• Sputum samples for culture and Gram stain should be
obtained in hospitalized children who can produce sputum
(weak recommendation; low-quality evidence)
• Urinary antigen detection tests are not recommended for
the diagnosis of pneumococcal pneumonia in children;
false-positive tests are common (strong recommendation;
high quality evidence)
IDSA guidelines; CID 2011. Kindly provided by Prof. Greenberg

NASOPHARYNGEAL COLONIZATION (%)
IN PNEUMONIA VS HEALTHY CHILDREN
0
5
10
15
20
25
30
S.pneumoniae H.influenzae M.catarrhalis
Healthy Pneumonia
From Nohynek et al., Pediatr Infect Dis J 1995

THE PROPORTION OF BACTERIAL ISOLATES USING NPS AND NTA APPROACHES IN ALRI AND CONTROL CHILDREN
(From Zhang T et al. PLoS One 2010)

URINARY RAPID TEST BINAX NOW FOR PNEUMOCOCCAL DETECTION
Population Binax NOW positive (%)
Binax NOW positive and NP colonization (%)
Binax NOW positive and no NP colonization (%)
Children with IPD
5/5 (100.0)* 2/2 (100.0)* 3/3 (100.0)*
Children with fever but no IPD
29/150 (19.3) 16/28 (57.1)° 13/122 (10.7)
Healthycontrols
35/200 (17.5) 26/53 (49.1)° 9/147 (6.1)
*p<0.05 vs no IPD and controls
°p<0.0001 vs no IPD and controls with no NP colonization
From Esposito S et al. Pediatr Infect Dis J 2004

PNEUMOCOCCAL COLONIZATION IN CAP: ROLE OF BACTERIAL LOAD (From Esposito S et al., PIDJ 2013)
)
1-Number of positive sample with CAP to17 viruses
n°=309/386(80%)
n°=77/386(20%)
2-Number of positive sample with CAP to Sp
n°=209/386(54.1%)
n°=177/386(45.9%)
3-Differences between positivity for Sp on alveolar CAP vs non alveolar CAP cases
n°=148/ 250 (59.2%)
n°=61/ 136 (44.8%)
4-Differences between Sp bacterial load on alveolar CAP vs non alveolar CAP cases
P=0.025
4.13 ± 1.41
3.63 ±1.55
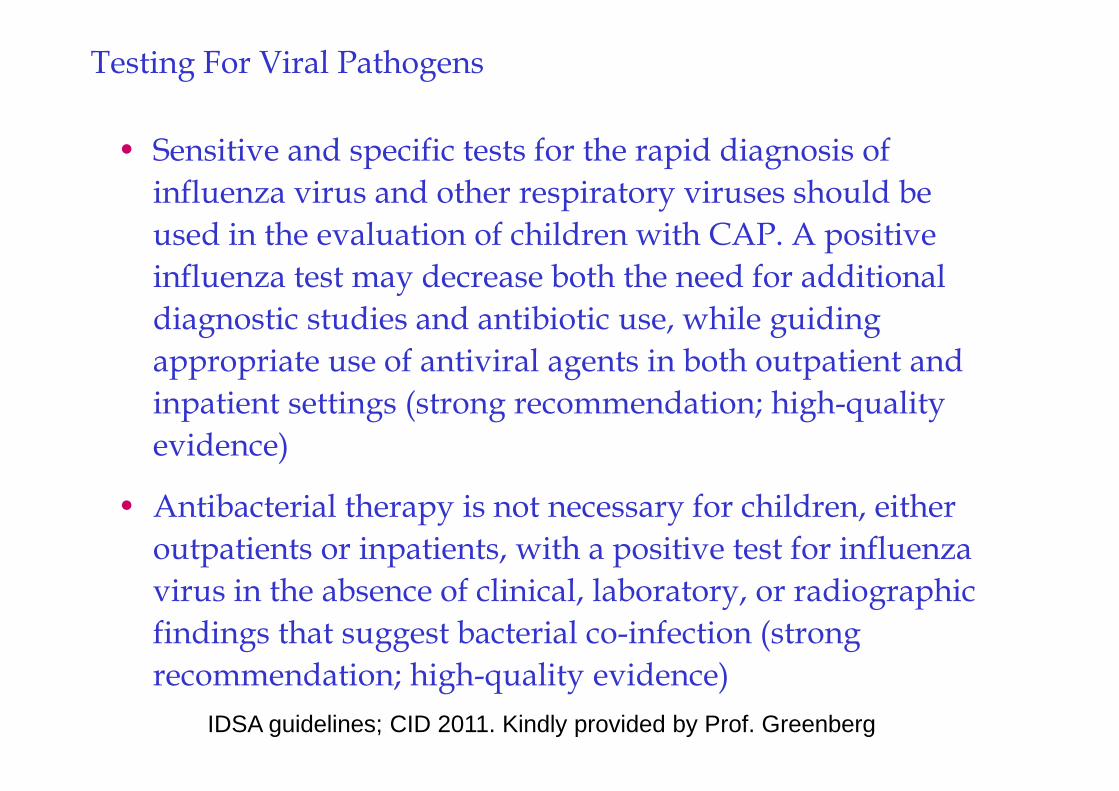
• Sensitive and specific tests for the rapid diagnosis of
influenza virus and other respiratory viruses should be
used in the evaluation of children with CAP. A positive
influenza test may decrease both the need for additional
diagnostic studies and antibiotic use, while guiding
appropriate use of antiviral agents in both outpatient and
inpatient settings (strong recommendation; high-quality
evidence)
• Antibacterial therapy is not necessary for children, either
outpatients or inpatients, with a positive test for influenza
virus in the absence of clinical, laboratory, or radiographic
findings that suggest bacterial co-infection (strong
recommendation; high-quality evidence)
Testing For Viral Pathogens
IDSA guidelines; CID 2011. Kindly provided by Prof. Greenberg
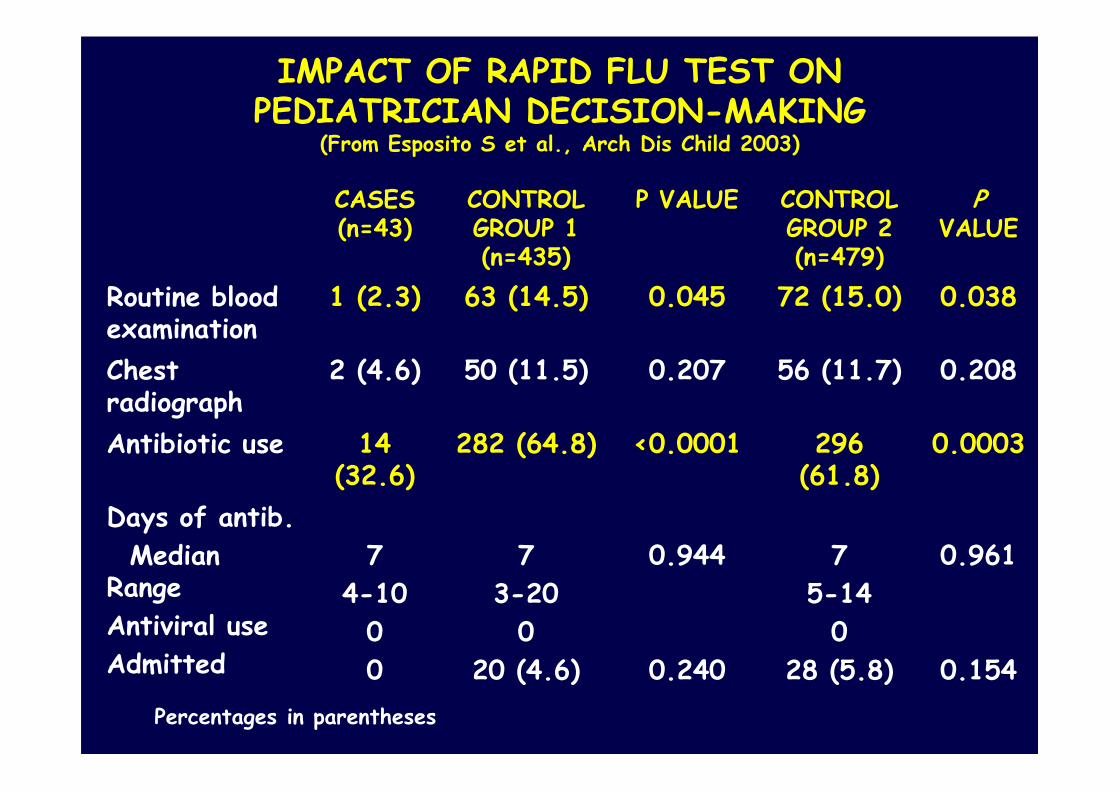
IMPACT OF RAPID FLU TEST ON PEDIATRICIAN DECISION-MAKING
(From Esposito S et al., Arch Dis Child 2003)
CASES (n=43)
CONTROL GROUP 1 (n=435)
P VALUE CONTROL GROUP 2 (n=479)
PVALUE
Routine blood examination
1 (2.3) 63 (14.5) 0.045 72 (15.0) 0.038
Chest radiograph
2 (4.6) 50 (11.5) 0.207 56 (11.7) 0.208
Antibiotic use 14 (32.6)
282 (64.8) <0.0001 296 (61.8)
0.0003
Days of antib.
Median Range
Antiviral use
Admitted
7
4-10
0
0
7
3-20
0
20 (4.6)
0.944
0.240
7
5-14
0
28 (5.8)
0.961
0.154
Percentages in parentheses
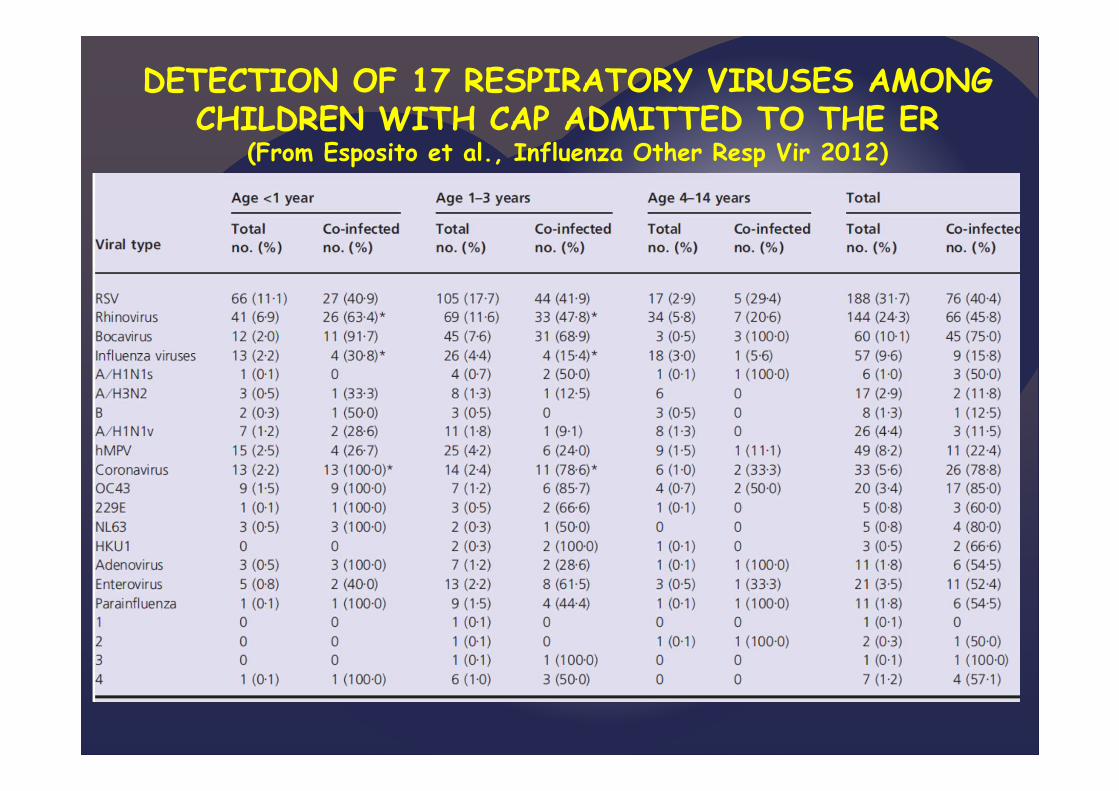
DETECTION OF 17 RESPIRATORY VIRUSES AMONG CHILDREN WITH CAP ADMITTED TO THE ER
(From Esposito et al., Influenza Other Resp Vir 2012)

BACTERIA CULTURED IN CHILDREN DIED DURING INFLUENZA PANDEMIC IN 1918-1919
(From Morens DM et al., J Infect Dis 2008)
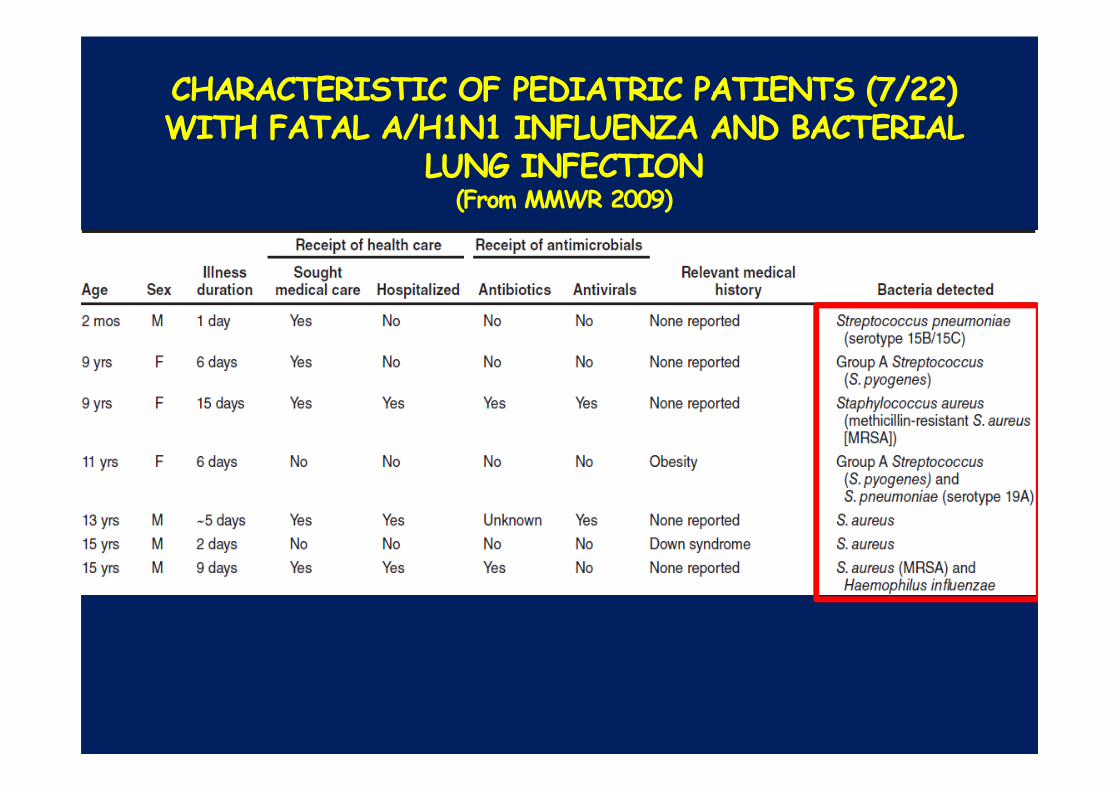
CHARACTERISTIC OF PEDIATRIC PATIENTS (7/22) WITH FATAL A/H1N1 INFLUENZA AND BACTERIAL
LUNG INFECTION (From MMWR 2009)
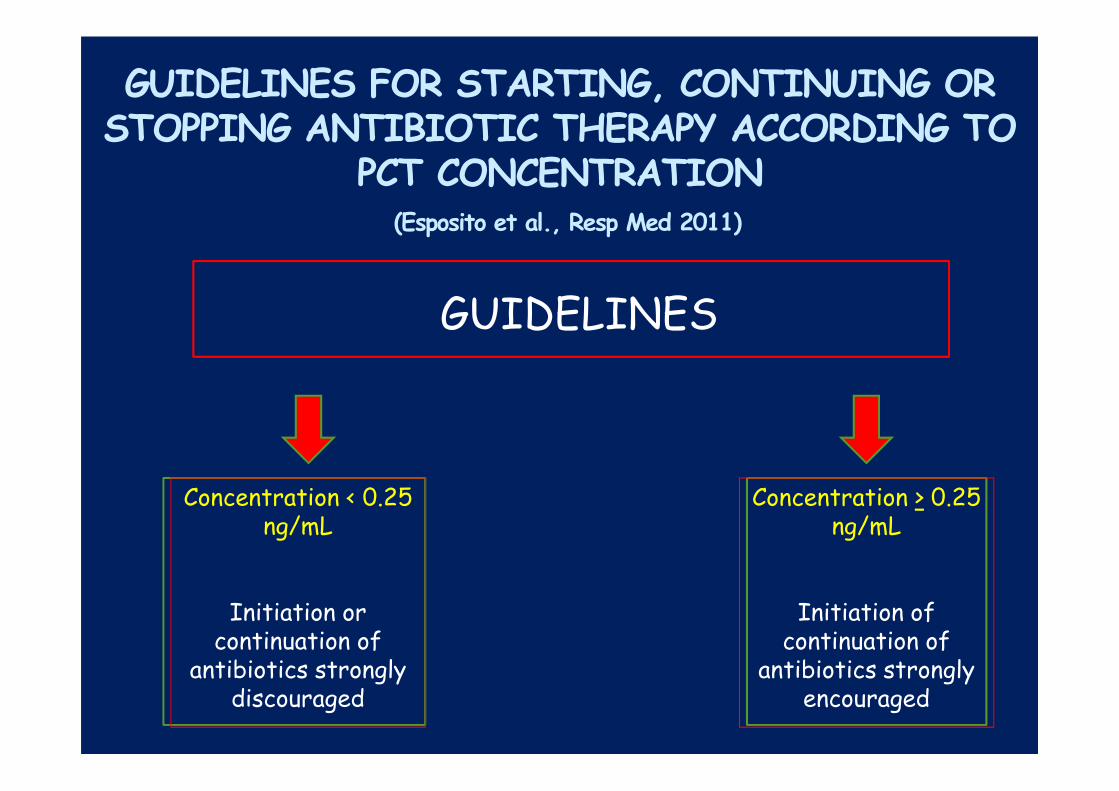
GUIDELINES FOR STARTING, CONTINUING OR STOPPING ANTIBIOTIC THERAPY ACCORDING TO
PCT CONCENTRATION(Esposito et al., Resp Med 2011)
GUIDELINES
Concentration < 0.25 ng/mL
Initiation or continuation of
antibiotics strongly discouraged
Concentration > 0.25 ng/mL
Initiation of continuation of
antibiotics strongly encouraged

CLINICAL, LABORATORY AND RADIOGRAPHIC FINDINGS OF THE STUDY CHILDREN AT
ADMISSION (Esposito et al., Resp Med 2011)
PCT Group (n=155) Controls (n=155)
Clinical findings, mean value + SDAxill. Temp. Peak day value (°C)SpO2 in room air, (%)
38.8 + 0.8591 + 4
38.6 + 0.9692 + 5
Laboratory data, mean value + SDCRP, mg/dLWBC, cell/µLNeutrophils, %
PCT, ng/L
8.8 + 4.716,300 + 4,250
76 + 141.82 + 1.76
7.1 + 3.915,155 + 6,140
67 + 191.79 + 1.88
Positive blood cultures, no. (%) 2 (1.3) 1 (0.6)
Radiographic findings, no. (%)Reticulo-nodular infiltrateSegmental or lobar consolidationBilateral consolidation
55 (35.5)61 (39.3)39 (25.2)
60 (38.7)58 (37.4)37 (23.9)
No significant differences between the groups

ANTIBIOTIC EXPOSURE,
MEAN DAYS ± SD (Esposito et al., Resp Med 2011)
02468
10121416
Mild
CAP (
PCT)
Severe
CAP
(PCT)
Mild
CAP (
CRL)
Severe
CAP
(CRL)
day
s
^p<0.05 vs mild CAP in control group (CRL); °p<0.05 vs severe CAP in control group (CRL).
^°
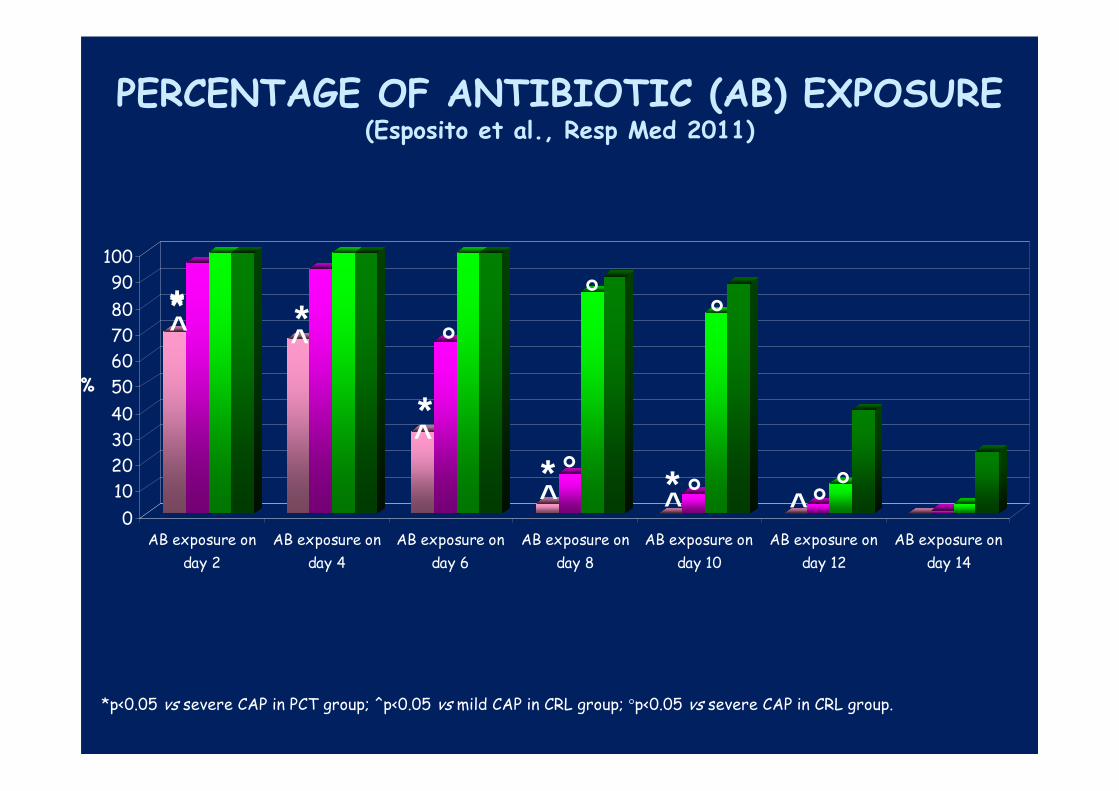
PERCENTAGE OF ANTIBIOTIC (AB) EXPOSURE (Esposito et al., Resp Med 2011)
0
10
20
30
40
50
60
70
80
90
100
%
AB exposure on
day 2
AB exposure on
day 4
AB exposure on
day 6
AB exposure on
day 8
AB exposure on
day 10
AB exposure on
day 12
AB exposure on
day 14
*p<0.05 vs severe CAP in PCT group; ^p<0.05 vs mild CAP in CRL group; °p<0.05 vs severe CAP in CRL group.
*̂* *̂
*^
^ ^ ^* *
°
°°
°
°
°
°

• Children with signs and symptoms suspicious for
Mycoplasma pneumoniae should be tested to help guide
antibiotic selection (weak recommendation; moderate-
quality evidence)
• Diagnostic testing for Chlamydophila pneumoniae is not
recommended as reliable and readily available diagnostic
tests do not currently exist. (strong recommendation; high-
quality evidence)
Testing for Atypical Bacteria
IDSA guidelines; CID 2011. Kindly provided by Prof. Greenberg

DIAGNOSTIC TESTS FOR M. PNEUMONIAE AND C. PNEUMONIAE
TEST SPECIMEN COMMENTS
CULTURE Throat or NP swab, Requires tissue culture; notsputum, bronchial routinely available; requireswashing, tissue several days of incubation
PCR Throat or NP swab, No FDA-approved kits; availablesputum, bronchial from research laboratories;washing, tissue potential for rapid diagnosis
SEROLOGY Serum Paired acute-convalescentsera preferred; IgM may take up to 4-6 weeks to appear(therefore retrospective)

CAP AND ATYPICAL BACTERIA IN 418 CHILDREN
0
10
20
30
40
50
60
70
80
2-4 years 5-7 years > 7 years All
M.p.
C.p.
M.p.+C.p.
All
(From Principi et al., Clin Infect Dis 2001)
%

Clinical characteristics of the study population at enrollment (Esposito S et al. CID 2002)
CharacteristicsMalesMean age ± SD, yrsOnset
GradualAcute
Similar illness within
the familyCoughTachypneaFeverRalesWheezesDays of hosp. ± SD
S. pneumoniaeinfection (%)
(N=48)25 (52.1)
3.66 ± 0.899
23 (47.9)25 (52.1)
6 (12.5)31 (64.5)12 (25.0)42 (91.3)45 (93.7)6 (12.5)
6.857 ± 3.52312.325 ± 6.065
Atypical bacteriainfection (%)
(N=46)22 (47.8)
3.75 ± 1.030
26 (56.5)20 (43.5)
9 (19.5)33 (71.7)11 (23.9)39 (84.7)41 (89.1)7 (15.2)
6.744 ± 2.67213.307±5.089
Mixed S. pneum.-atypical bacteria
infection (%) (N=16)8 (50.0)
3.76 ± 1.030
8 (50.0)8 (50.0)
3 (18.7)11 (68.7)4 (25.0)14 (87.5)15 (93.7)2 (12.5)
7.110 ± 2.37013.714±5.517
No significant differences were observed
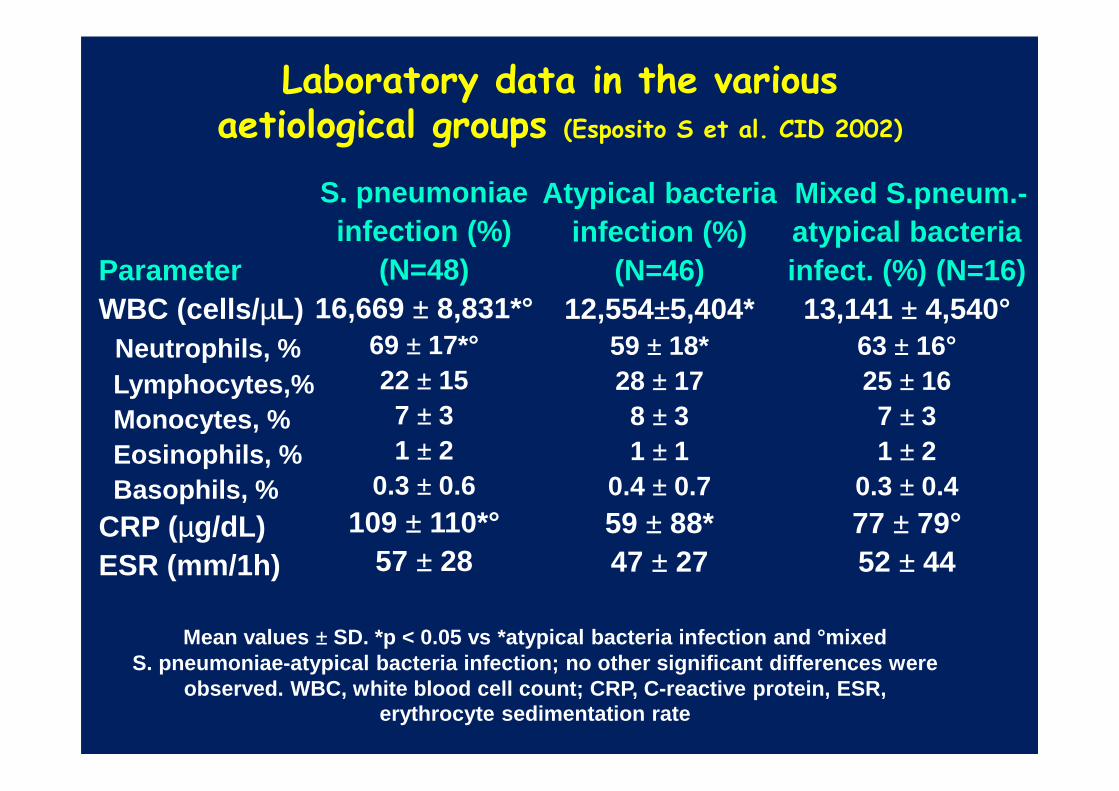
Laboratory data in the various aetiological groups (Esposito S et al. CID 2002)
ParameterWBC (cells/ µL)
Neutrophils, %Lymphocytes,%Monocytes, %Eosinophils, %Basophils, %
CRP (µg/dL)ESR (mm/1h)
S. pneumoniaeinfection (%)
(N=48)16,669 ± 8,831*°
69 ± 17*°22 ± 15
7 ± 31 ± 2
0.3 ± 0.6109 ± 110*°
57 ± 28
Atypical bacteriainfection (%)
(N=46)12,554±5,404*
59 ± 18*28 ± 17
8 ± 31 ± 1
0.4 ± 0.759 ± 88*47 ± 27
Mixed S.pneum.-atypical bacteria infect. (%) (N=16)13,141 ± 4,540°
63 ± 16°25 ± 16
7 ± 31 ± 2
0.3 ± 0.477 ± 79°52 ± 44
Mean values ± SD. *p < 0.05 vs *atypical bacteria infection and ° mixed S. pneumoniae -atypical bacteria infection; no other significant differences were
observed. WBC, white blood cell count; CRP, C-react ive protein, ESR, erythrocyte sedimentation rate


CHARACTERI-SATION OF
NOVELENTEROVIRUSES
(From Piralla A et al., PLoS One 2013)

Division of Clinical Virology
What is enterovirus D68
• Isolated in 1962• Respiratory samples• Children with bronchiolitis-type illness• Between 1970 and 2005, 26 cases reported

Division of Clinical Virology
Before 2010
• 2005 to 2010 reports from France, Philippines, USA, UK, Netherlands, Japan…
• Mostly respiratory problems, bronchiolitis type illness• Summer and early fall

Division of Clinical Virology
2010 Groningen
• Bronchiolitis-type illness• Some severe cases requiring
intensive care treatment• Many patients had underlying
condition
Division of Clinical Virology
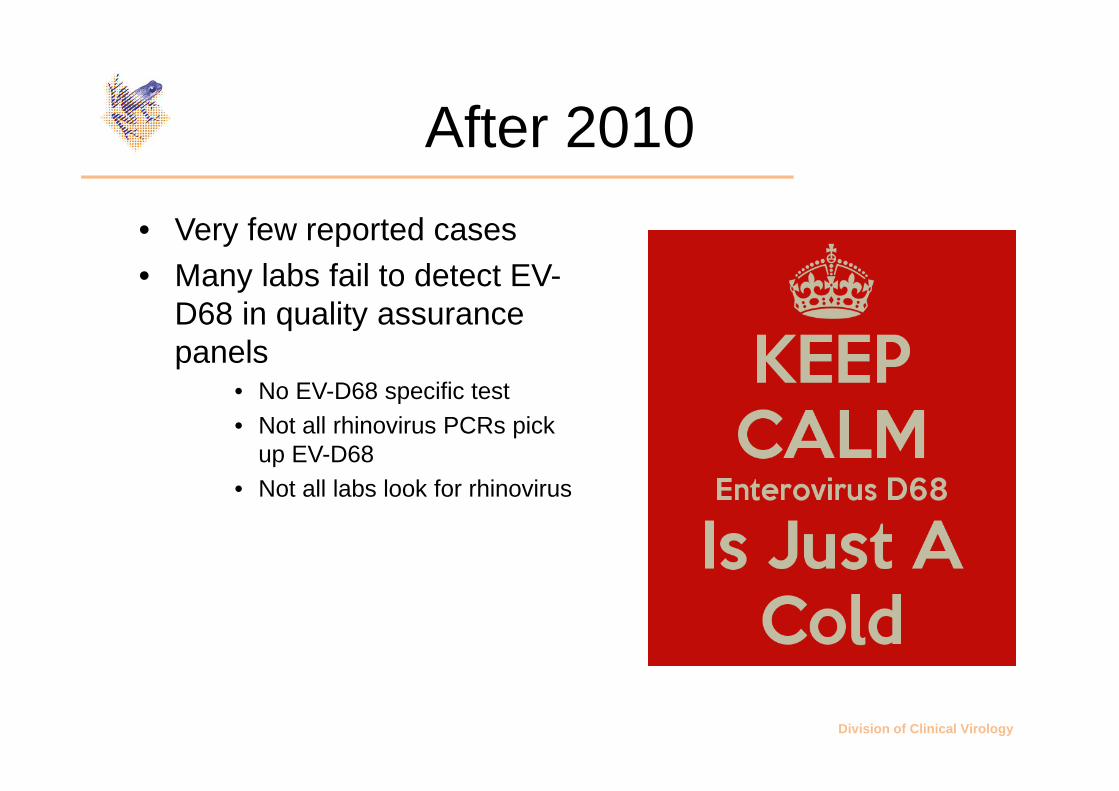
After 2010
• Very few reported cases• Many labs fail to detect EV-
D68 in quality assurance panels
• No EV-D68 specific test• Not all rhinovirus PCRs pick
up EV-D68• Not all labs look for rhinovirus
Division of Clinical Virology
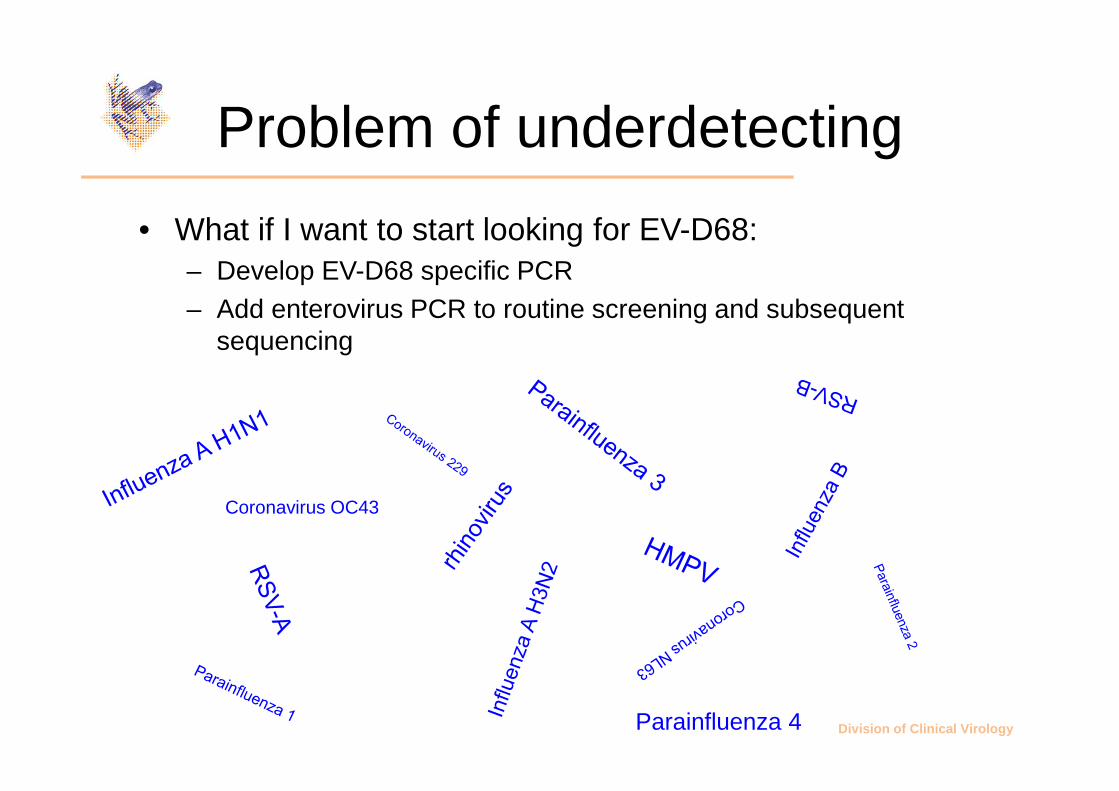
Problem of underdetecting
• What if I want to start looking for EV-D68:– Develop EV-D68 specific PCR– Add enterovirus PCR to routine screening and subsequent
sequencing
Parainfluenza 4
Coronavirus OC43
Division of Clinical Virology
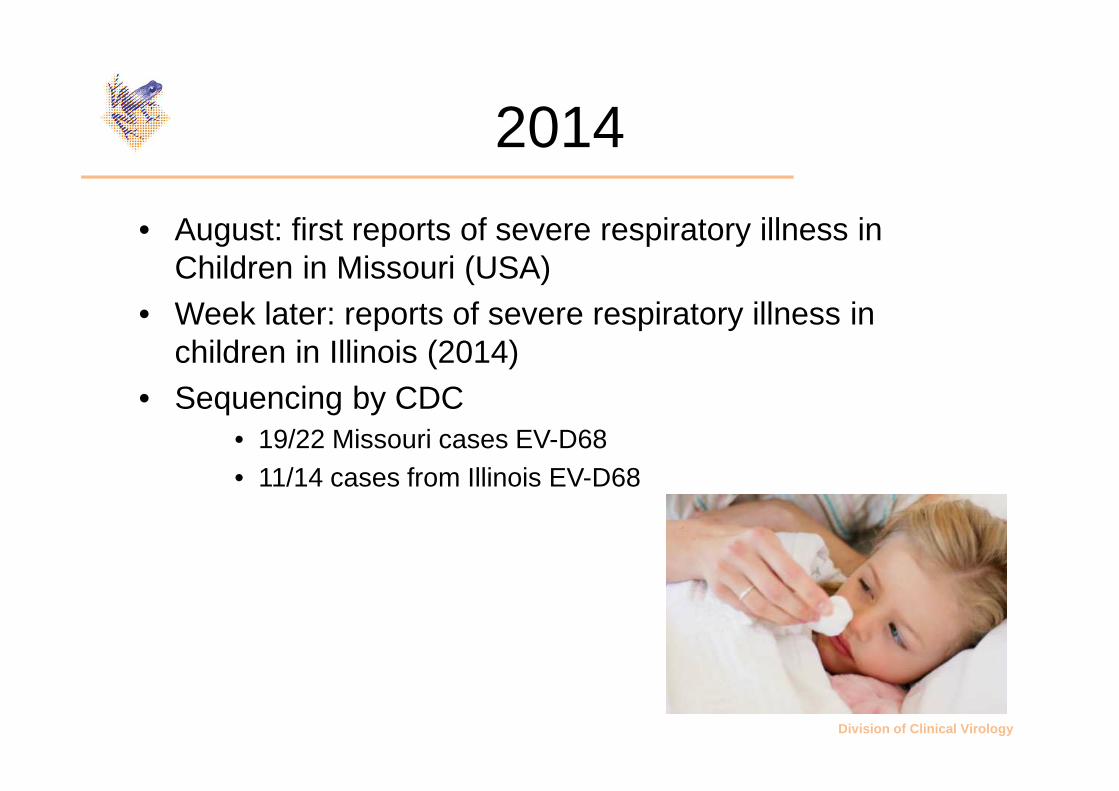
2014
• August: first reports of severe respiratory illness in Children in Missouri (USA)
• Week later: reports of severe respiratory illness in children in Illinois (2014)
• Sequencing by CDC • 19/22 Missouri cases EV-D68• 11/14 cases from Illinois EV-D68

Division of Clinical Virology
Enterovirus D68 outbreak
• Children (<16 years)• 68% had prior history of wheezing• Nearly all patients required intensive care treament• Many reports from other states and Canada• Testing (sequencing) at CDC: only severe cases
Division of Clinical Virology

Division of Clinical Virology
What’s up
• Several labs have started looking for EV-D68• Sequencing gives most info (a lot of work)• 2 new targeted PCRs available

Niesters et al., unpublished data
patient Sex age date symptoms ICU/days Underlying conditon
1 F 1y/ 11m Feb 2014 Moderate bronchilitis-type respiratory illness
no none
2 F 1y/ 7m May 2014 Severe respiratory illness, intubaton, mechanical ventilation
Yes/4 none
3 F 6m June 2014 Mild cold symptoms no Congenital heart disease
4 M 3y/ 9m June 2014 Severe respiratory illness, intubation, mechanical ventilation
Yes/8 Sickle cell anemia
5 M 65y July 2014 Moderate wheezing and cough
no Lung transplantation
6 M 1 y July 2014 Severe respiratory illness, intubation, mechanical ventilation
Yes/5 none
7 F 6w July 2014 Feeding problem no Gastro-esophageal reflux
8 M 3y/ 10m July 2014 Severe respiratory illness, intubation, mechanical ventilation
Yes/1 Ex-premature
9 M 6m Aug 2014 Mild cold symptoms * Congenital heart disease
10 M 14y Aug 2014 Mild cold symptoms * Traumatic brain injury
11 F 1y/ 6m Aug 2014 Mild cold symptoms no epilepsy
12 M 1m Aug 2014 Severe respiratory illness, intubation, mechanical ventilation
Yes/1 Ex-premature
13 F 22y Aug 2014 Cough, SOB, fatigue No Heart transplantation
14 F 44y Aug 2014 Cough, SOB No COPD
15 M 1y/ 5m Sep 2014 Moderate wheezing, cough No Tracheomalacia, heart disease
16 F 63y Sep 2014 Asthma exacerbation no asthma
17 F 53y Sep 2014 Wheezing, pneumonia no Renal transplantation
* These children were admitted to ICU for other reasonsSOB=shortness of breath
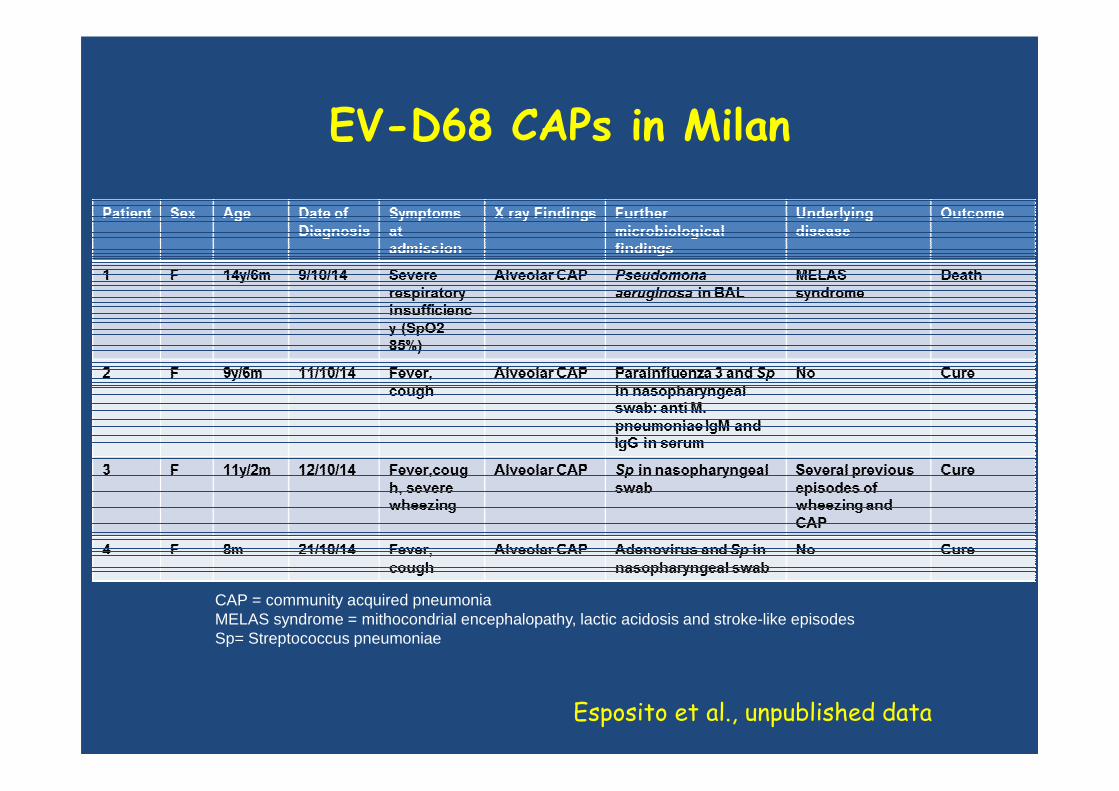
EV-D68 CAPs in Milan
CAP = community acquired pneumoniaMELAS syndrome = mithocondrial encephalopathy, lactic acidosis and stroke-like episodes Sp= Streptococcus pneumoniae
Esposito et al., unpublished data


Measles Case Distribution by Month and WHO Regions, 2008-2014
This is surveillance data, hence for the last month, the data may be incomplete. SEAR India is not included in this graph.As of 27 May 2013, South Sudan has been reassigned to the Africa region (AFR) from the Eastern Mediterranean region (EMR).
Data source: surveillance DEF fileData in HQ as of 19 January 2015
0
5000
10000
15000
20000
25000
30000
35000
40000
45000
gen
2008
Apr Jul Oct gen
2009
Apr Jul Oct gen
2010
Apr Jul Oct gen
2011
Apr Jul Oct gen
2012
Apr Jul Oct gen
2013
Apr Jul Oct gen
2014
Apr Jul Oct
AFR SEAR AMR EMR EUR WPR

Reported Measles Incidence Rate*,Dec 2013 to Nov 2014 (12M period)
*Rate per 1'000'000 population
Data source: surveillance DEF fileData in HQ as of 19 January 2015
The boundaries and names shown and the designations used on this map do not imply the expression of any opinion whatsoever on the part of the World Health Organization concerning the legal status of any country, territory, city or area or of its authorities, or concerning the delimitation of its frontiers or boundaries. Dotted lines on maps represent approximate border lines for which there may not yet be full agreement. ©WHO 2015. All rights reserved.
<1 (77 countries or 40%)
≥1 - <5 (32 countries or 16%)
≥5 - <10 (16 countries or 8%)
≥10 - <50 (40 countries or 21%)
≥50 (15 countries or 8%)
No data reported to WHO HQ
(14 countries or 7%)
Not applicable

Number of Reported Measles Cases with onset date from Jun 2014 to Nov 2014 (6M period)
Data source: surveillance DEF fileData in HQ as of 19 January 2015
The boundaries and names shown and the designations used on this map do not imply the expression of any opinion whatsoever on the part of the World Health Organization concerning the legal status of any country, territory, city or area or of its authorities, or concerning the delimitation of its frontiers or boundaries. Dotted lines on maps represent approximate border lines for which there may not yet be full agreement. ©WHO 2015. All rights reserved.
0 (64 countries or 33%)
1 - 9 (33 countries or 17%)
10 - 99 (42 countries or 22%)
100 - 999 (28 countries or 15%)
≥1000 (7 countries or 4%)
No data reported to WHO HQ
(20 countries or 10%)
Not applicable

Distribution of measles genotypesfrom Dec-2013 to Nov-2014 (12M period)
Data source: MeaNS Database; 20 January 2015Updated on 20 January 2015
The boundaries and names shown and the designations used on this map do not imply the expression of any opinion whatsoever on the part of the World Health Organization concerning the legal status of any country, territory, city or area or of its authorities, or concerning the delimitation of its frontiers or boundaries. Dotted lines on maps represent approximate border lines for which there may not yet be full agreement. ©WHO 2014. All rights reserved.
Countries with Genotype data available

Measles in the USA

Measles vaccination coverage in Europe(2 doses, 2012-2013)
(From ECDC, 2015)
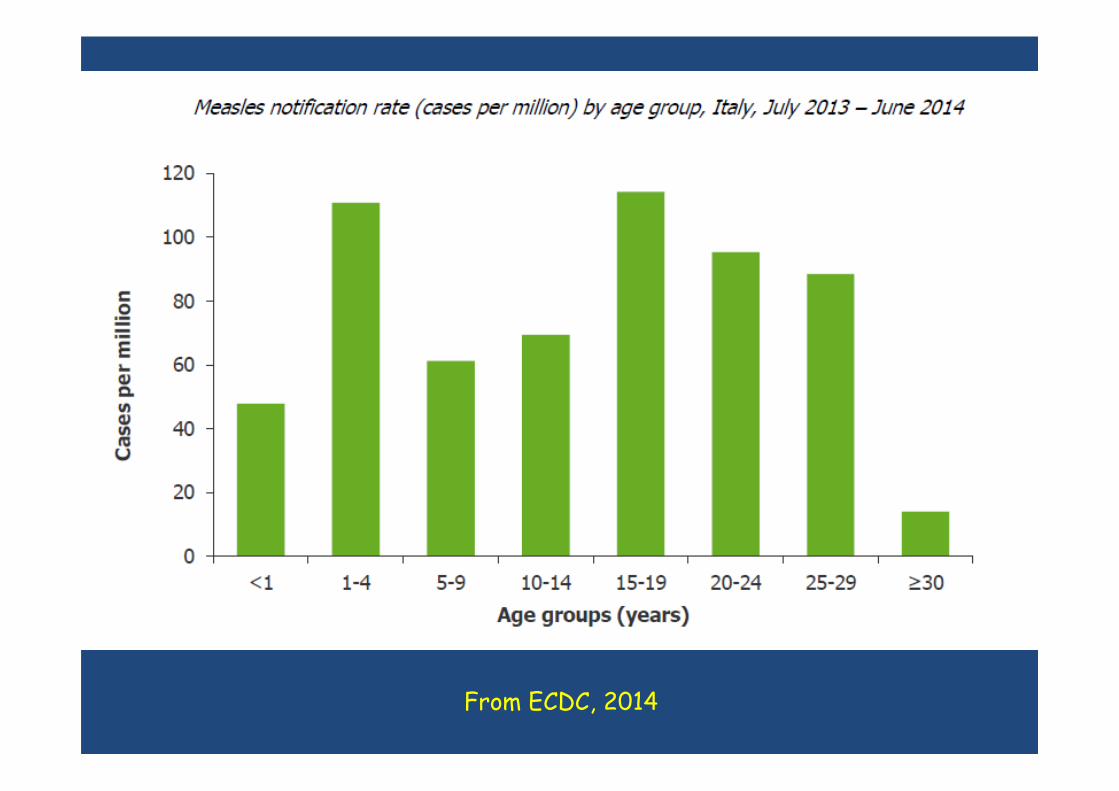
From ECDC, 2014

From ECDC, 2014

February 2014 – Italian newspapersA measles outbreak was declared on 27 February 2014 on the Costa Pacifica ship cruising in the west Mediterranean sea. The index case was a crew member who sought medical care off the ship for fever and rash on 22 February and was laboratory confirmed to have measles on 27 February. As for 27 March, 37 cases of measles have been reported 36 from Italy and one from Austria: 21 cases were among the crew members, 7 among passengers and 9 are passengers contacts. More than 800 crew members were vaccinated in response to the outbreak.
March 2014 – Corriere della Sera

From ECDC, 2014

Status of measles and rubella elimination verification process WHO European Region*
50established National Verification
Committees 3 pending46 Annual Status Reports (2013)
MEASLES 22 interrupted
transmission
RUBELLA 24 interrupted
transmissionAndorra, Armenia, Azerbaijan, Belarus, Bulgaria, Cyprus, Czech Republic, Estonia, Finland, Hungary, Israel, Latvia, Luxembourg, Malta, Norway, Republic of Moldova, Portugal, Slovakia, Slovenia, Sweden, Tajikistan, Turkmenistan
Andorra, Armenia, Azerbaijan, Belarus, Cyprus, Czech Republic, Estonia, Finland, Hungary, Ireland, Israel, Latvia, Luxembourg, Malta, Netherlands, Norway, Republic of Moldova, Portugal, Slovakia, Slovenia, Spain, Tajikistan, Turkmenistan, United Kingdom
52
* Based on 2013 Annual Status Updates as of Nov 2014

Status reports have not been submitted* from:
53
Albania, Andorra, Bosnia and Herzegovina, Denmark, Hungary, Italy,
Monaco, Romania, San Marino, Slovenia, Turkey, Ukraine
* As of 5 March 2014

CONCLUSIONS
• Need of advanced appropriatelyinterpretated laboratory tests for common pediatric infecious diseases
• Role of surveillance in monitoringinfection outbreaks
• Impact of high vaccination coverage on vaccine-preventable diseases
54