diagnostic and evolution of bushfire drivers in the climate system
TRANSCRIPT

Diagnostics and Evolution of Bushfire Drivers in the Climate System in Victoria, Australia
Daniel Pazmiño (PhD student)
Alexandre Pezza (Supervisor)
David Karoly (Co-supervisor)
Taken from: http://www.boston.com/bigpicture/2009/02/bushfires_in_victoria_australi.html

Outline• Introduction/background • Research gaps and scientific
questions
• Research strategy
• Results (so far….)
• Work ahead
• Summary

Introduction/Background

Bushfireoccurrence
Weather conditions
Fuel loads
Ignition sources
WindRainfall
Air temperature
Relative humidity
Vegetation
Lightning
Anthropogenic
Bushfire weather
Williams et al. (2012)

Why to investigate bushfires in Victoria?
FuturePast
• Catastrophic bushfires(e.g. “Black Friday” 1939, “Ash Wednesday” 1983, “Black Saturday” 2009)
• Fire danger risk will increase
(Clarke et al., 2011; Hasson et al., 2009; Lucas
et al., 2007)
• High vulnerability50% of economic impact in 150
years.(Luke and McArthur, 1978)

Bushfire Synoptic Pattern in Victoria
Historic Chart Analysis at 11am EDT on "Ash Wednesday", Wed 16th February 1983 showing areas with extreme fire weather. Source: Bureau of Meteorology

McArthur Forest Fire Danger Index (Australian)
Noble et al. (1980)
Fire danger Rating RangeLow 0-5
Moderate 5-12High 12-24
Very high 24-50Extreme 50+

Research Gaps and
Scientific Questions

Identified gaps in bushfire research
1. Large scale circulation patterns & bushfire weather.
2. Seasonal bushfire index development.
3. Heat-waves vs. Bushfires patterns.

Forecasting bushfire potential with a seasonal perspective?
Modes of climate variability (ENSO, SAM, IOD)?
Seasonal bushfire potential variability in the 20th century?
Heat-waves and bushfire daily and seasonal patterns?
Future behavior of significant bushfire seasons?

Research Strategy

Source: PerilAUS database developed by RiskFrontiers (Natural Hazard Research Center). SOI values taken from the Bureau of
Meteorology web page
Bushfire events/reports database (PerilAUS)

Gridded datasets
Twentieth Century Reanalysis Project (20CRV2)
• Yields atmospheric fields (past/present climate data) for the period 1871-2008 with a 2o resolution.
• It will be used to understand large-scale circulation patterns associated with bushfires and heat-waves.
• Seasonal bushfire potential in the 20th century will be explored with these data.
Coupled Model Intercomparison Project Phase 5 (CMIP5)
• CMIP5 provides climate simulations (future climate data).
• Coordinates the efforts of 20 modeling groups with approximately 50 models.
• Seasonal bushfire potential in the 21th century will be explored with these data.

Phases of the Project
Phase I• Understanding bushfire and heat-wave synoptics
and dynamics.
Phase II• Construction and validation of the Victorian
Seasonal Bushfire Index (VSBI).
Phase III
• Projection of the VSBI with modelled outputs for the future.
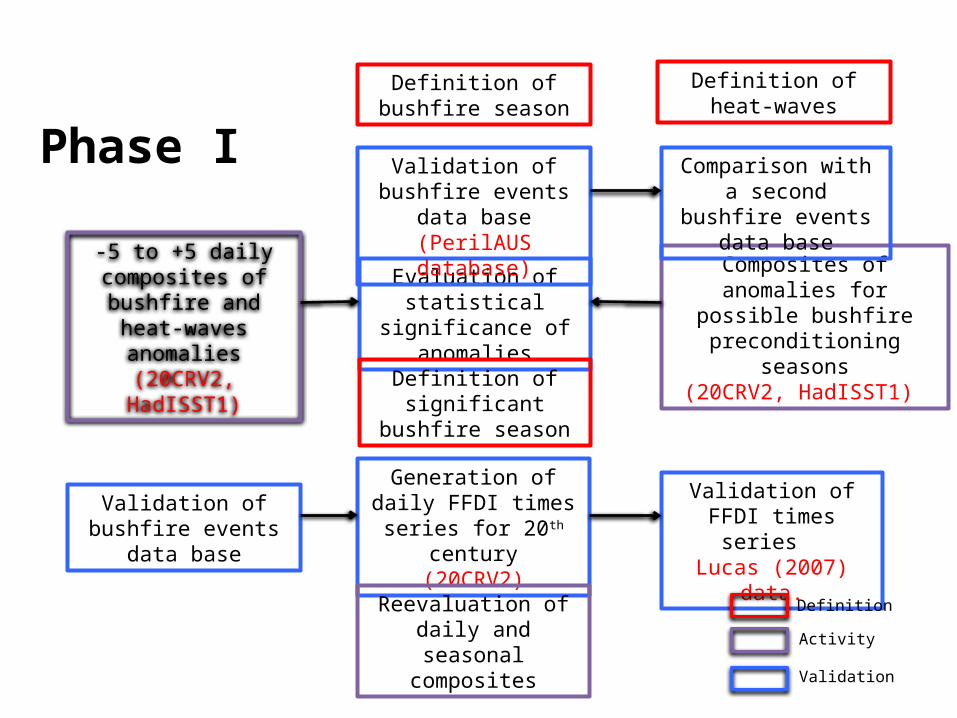
-5 to +5 daily composites of
bushfire and heat-waves anomalies
(20CRV2, HadISST1)
Evaluation of statistical
significance of anomalies
Composites of anomalies for possible bushfire
preconditioning seasons(20CRV2, HadISST1)
Validation of bushfire events
data base(PerilAUS database)
Definition of bushfire season
Definition of significant bushfire
season
Generation of daily FFDI times series for 20th century
(20CRV2)
Comparison with a second bushfire
events data base
Validation of FFDI times series
Lucas (2007) data.Validation of
bushfire events data base
Phase IDefinition of heat-
waves
DefinitionActivity
Validation
Reevaluation of daily and seasonal
composites

Validation of VSBI
Phase IISelection of variables
Selection of preconditioning
season
Selection of geographical
regions
Generation of normalized time
series of the anomalies of each
variable (sub-indices)
Correlation of VSBI with soil moisture
content(AWAP)
Correlation with seasons with at
least one day FFDI >75
VSBI (attempt 1) = Aggregation of sub-
indices
Investigation of modes of climate
variability and VSBI
Correlation between modes of climate variability indices and VSBI
DefinitionActivity
Validation

Phase III Definition of criteria to select climate model outputs
Review of literature of models
performance in Australia (CMIP5)
Review of literature of
selected models
Projection of VSBI with selected
model outputs and emissions scenarios
Evaluation of results
DefinitionActivity
Validation
Evaluation of climate model simulations to
reproduce FFDI and VSBI

RESULTSSo far…..

Day -1 Day 0 Day +1
Bush
fires
Hea
t-w
aves
Air temperature anomalies composites at 1000 hPa level for day -1 to day +1 of 144 bushfire and 95 heat-wave events in Victoria (periods 1900-2010 and 1903-2010)
Source: 20th Century Reanalysis Project, Peril AUS database and Sadler (2012)

Day -1 Day 0 Day +1
Bush
fires
Hea
t-w
aves
Relative humidity anomalies composites at 1000 hPa level for day -1 to day +1 of 144 bushfire and 95 heat-wave events in Victoria (periods 1900-2010 and 1903-2010)
Source: 20th Century Reanalysis Project, Peril AUS database and Sadler (2012)

Day -1 Day 0 Day +1
Bush
fires
Hea
t-w
aves
Geopotential height anomalies composites at 500 hPa level for day -1 to day +1 of 144 bushfire and 95 heat-wave events in Victoria (periods 1900-2010 and 1903-2010)
Source: 20th Century Reanalysis Project, Peril AUS database and Sadler (2012)
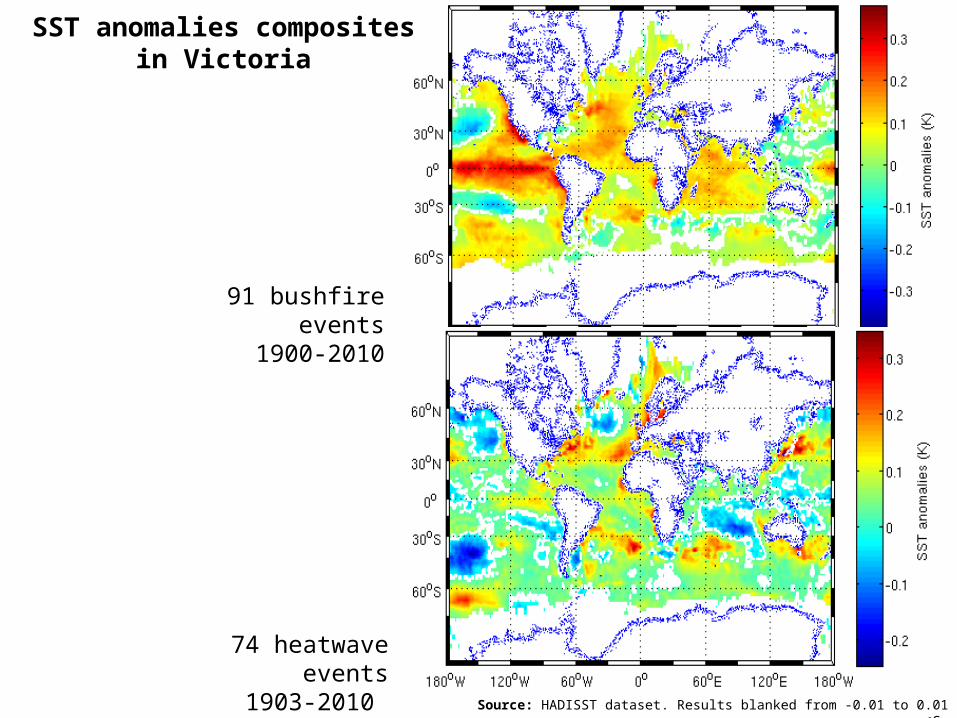
Source: HADISST dataset. Results blanked from -0.01 to 0.01 oC.
SST anomalies composites in Victoria
91 bushfire events1900-2010
74 heatwave events
1903-2010

Composites for seasonal (Sep-Oct-Nov)
anomalies in Victoria (59 bushfire seasons
considered in the period 1900–2010)
1000 hPa level air temperature
300 hPa level u wind
1000 hPa level relative humidity
Source: 20th Century Reanalysis Project and Peril AUS database

Source: Daily FFDI data obtained from Lucas (2010).
1972-1973
1974-1975
1976-1977
1978-1979
1980-1981
1982-1983
1984-1985
1986-1987
1988-1989
1990-1991
1992-1993
1994-1995
1996-1997
1998-1999
2000-2001
2002-2003
2004-2005
2006-2007
2008-20090
200
400
600
800
1000
1200
1400
1600
1800
Seasonal FFDI at Melbourne Airport Station 1972-2010
Seasonal FFDI-Sum (DJF)Seasonal FFDI-Sum (SON)
Bushfire seasons
FFD
I

Work aheadShort term
• Calculation and validation of daily FFDI data for the 20th century with reanalysis data.
• Validation of bushfire events database using calculated FFDI values.
• Reevaluation of daily and seasonal anomalies using the concept of significant bushfire season.
• Generation of time series of the average anomalies for the selected variables and execution of “attempt 1” for the construction of the VSBI.
Long term
• Exploration of new variables for subsequent attempts (e.g. precipitation anomalies).
• Validation of VSBI.
• Investigation of relationship between VSBI and climate modes of variability.
• Projection of the VSBI into de future using CMIP5 models.

Summary
A better understanding of synoptic
and large-scale
circulation patterns will help predict significant bushfires seasons better
The VSBI will be developed incorporating
this better understandin
g
The impact of climate
change in the frequency of significant bushfires
seasons will be explored
with the VSBI

Acknowledgements
• The National Secretary of Higher Education, Science, Technology and Innovation of Ecuador, SENESCYT.
• Mathew Mason and Katherine Haynes (Risk Frontiers-Macquarie University)
• Gil Compo (National Ocean and Atmospheric Administration).
• Christopher Lucas (Bureau of Meteorology).• Katherine Sadler, Linden Ashcroft and Mitchell Black
(The University of Melbourne).

References• Clarke, H. G., Smith, P. L., & Pitman, r. J. (2011). Regional signatures of future fire
weather over eastern Australia from global climate models. International Journal of Wildland Fire, 20(4), 550-562.
• Compo, G. P., Whitaker, J. S., Sardeshmukh, P. D., Matsui, N., Allan, R., Yin, X., Gleason, B., Vose, R., Rutledge, G., & Bessemoulin, P. (2011). The twentieth century reanalysis project. Quarterly Journal of the Royal Meteorological Society, 137(654), 1–28.
• Hasson, A., Mills, G., Timbal, B., & Walsh, K. (2009). Assessing the impact of climate change on extreme fire weather events over southeastern Australia. Climate Research, 39(2), 159.
• Lucas, C. (2010). On developing a historical fire weather data-set for Australia. Australian Meteorological and Oceanographic Journal, 60(1), 1.
• Luke, R. H., & McArthur, A. G. (1978). Bush fires in Australia. Bush Fires in Australia.
• Noble, R., Bary, G. A. V., & Gill, A. M. (1980). McArthur's fire danger meters expresed as equations. Australian Journal of Ecology, 5, pp. 201-203.
• Sadler, K. (2012). Connections between heat waves in Melbourne and rainfall along the Queensland coast and the influence of Tasman Sea blocking and sea surface temperatures. (M.Sc.), University of Melbourne, Melbourne.
• Williams, Gill, M., & Bradstock, R. (2012). Flammable Australia : Fire Regimes, Biodiversity and Ecosystems in a Changing World: CSIRO Publishing.