diagnostic classification of the instantaneous wave-free ... · pdf filecardiac imaging...
TRANSCRIPT
Journal of the American College of Cardiology Vol. 61, No. 13, 2013© 2013 by the American College of Cardiology Foundation ISSN 0735-1097/$36.00
Cardiac Imaging
Diagnostic Classification of the InstantaneousWave-Free Ratio Is Equivalent to Fractional Flow Reserveand Is Not Improved With Adenosine AdministrationResults of CLARIFY (Classification Accuracy of Pressure-Only RatiosAgainst Indices Using Flow Study)
Sayan Sen, MBBS,* Kaleab N. Asrress, MA, BM, BCH,† Sukhjinder Nijjer, MB CHB,*Ricardo Petraco, MD,* Iqbal S. Malik, MBBS, PHD,*‡ Rodney A. Foale, MD,*Ghada W. Mikhail, MBBS, MD,*‡ Nicolas Foin, PHD,* Christopher Broyd, MBBS,*Nearchos Hadjiloizou, MBBS, PHD,*‡ Amarjit Sethi, MBBS, PHD,‡ Mahmud Al-Bustami, MD,‡David Hackett, MD,‡ Masood A. Khan, MB, BCHIR, MA,‡ Muhammed Z. Khawaja, MBBS,†Christopher S. Baker, MBBS, PHD,‡ Michael Bellamy, MBBS, MD,‡ Kim H. Parker, PHD,§Alun D. Hughes, MBBS, PHD,* Darrel P. Francis, MB, BCHIR, MA,*Jamil Mayet, MBCHB, MD, MBA,* Carlo Di Mario, MD, PHD,§ Javier Escaned, MD, PHD,�Simon Redwood, MD,† Justin E. Davies, MBBS, PHD*
London, United Kingdom; and Madrid, Spain
Objectives This study sought to determine if adenosine administration is required for the pressure-only assessment of coro-nary stenoses.
Background The instantaneous wave-free ratio (iFR) is a vasodilator-free pressure-only measure of the hemodynamic severityof a coronary stenosis comparable to fractional flow reserve (FFR) in diagnostic categorization. In this study, weused hyperemic stenosis resistance (HSR), a combined pressure-and-flow index, as an arbiter to determine wheniFR and FFR disagree which index is most representative of the hemodynamic significance of the stenosis. Wethen test whether administering adenosine significantly improves diagnostic performance of iFR.
Methods In 51 vessels, intracoronary pressure and flow velocity was measured distal to the stenosis at rest and duringadenosine-mediated hyperemia. The iFR (at rest and during adenosine administration [iFRa]), FFR, HSR, base-line, and hyperemic microvascular resistance were calculated using automated algorithms.
Results When iFR and FFR disagreed (4 cases, or 7.7% of the study population), HSR agreed with iFR in 50% of casesand with FFR in 50% of cases. Differences in magnitude of microvascular resistance did not influence diagnosticcategorization; iFR, iFRa, and FFR had equally good diagnostic agreement with HSR (receiver-operating charac-teristic area under the curve 0.93 iFR vs. 0.94 iFRa and 0.96 FFR, p � 0.48).
Conclusions iFR and FFR had equivalent agreement with classification of coronary stenosis severity by HSR. Further reduc-tion in resistance by the administration of adenosine did not improve diagnostic categorization, indicating thatiFR can be used as an adenosine-free alternative to FFR. (Classification Accuracy of Pressure-Only Ratios AgainstIndices Using Flow Study [CLARIFY]; NCT01118481) (J Am Coll Cardiol 2013;61:1409–20) © 2013 by theAmerican College of Cardiology Foundation
Published by Elsevier Inc. http://dx.doi.org/10.1016/j.jacc.2013.01.034
the Coronary Flow Trust. Dr. Sen (G1000357) and Dr. Nijjer (G110043) are MedicalResearch Council Fellows. Dr. Davies (FS/05/006), Dr. Francis (FS 10/038), Dr. Petraco(FS/11/46/28861), Dr. Asrress (FS/11/43/28760), and Dr. Khawaja (FS/12/15/29380)are British Heart Foundation Fellows. This study was supported by Volcano Corporation.Dr. Davies and Dr. Mayet hold patents pertaining to this technology. All authorsacknowledge the support of the NIHR Biomedical Research Centre funding scheme.
From the *International Centre for Circulatory Health, National Heart and LungInstitute, London, United Kingdom; †British Heart Foundation Centre of ResearchExcellence, Cardiovascular Division, Rayne Institute, St Thomas’ Hospital, King’sCollege London, London, United Kingdom; ‡Imperial College Healthcare NHS Trust,Hammersmith Hospital, London, United Kingdom; §National Institute for HealthResearch, Cardiovascular Research Unit, Royal Brompton and Harefield NHS Trust,
London, United Kingdom; and the �Cardiovascular Institute, Hospital Clı́nico SanCarlos, Madrid, Spain. This study was funded by the Biomedical Research Council andManuscript received July 25, 2012; revised manuscript received December 5, 2012,accepted January 8, 2013.
n
1410 Sen et al. JACC Vol. 61, No. 13, 2013Instantaneous Wave-Free Ratio and FFR Are Equivalent April 2, 2013:1409–20
Use of intracoronary physiologi-cal indices to guide revasculariza-tion improves clinical outcomesand reduces procedural costs(1,2). Because of the simplicity ofmeasuring intracoronary pressureand the wealth of outcome data,fractional flow reserve (FFR) isthe most frequently used measureof stenosis severity. However, in-tracoronary pressure distal to astenosis reflects not only the se-verity of the stenosis but alsopressure generated from the mi-crocirculation (3). FFR is calcu-lated as a ratio of mean distal to
aortic coronary pressures over the entire cardiac cycle. Toseparate the hemodynamics of the stenosis from that of themicrocirculation, FFR is calculated under conditions ofconstant (and minimal) microvascular resistance (4). This isachieved with the administration of vasodilators, such asadenosine (5).
See page 1436
The instantaneous wave-free ratio (iFR) is a pressure-only index that takes an alternative approach to theisolation of the hemodynamics of a stenosis from themicrocirculation (6). It does not use vasodilators; instead,it samples intracoronary pressure during the diastolic“wave-free” period—a period in the cardiac cycle whenintrabeat microvascular resistance is inherently stable andminimized. This wave-free window provides a phase inwhich microvascular resistance is significantly lower thanthat over the whole cardiac cycle, and coronary hemody-namics are most suited for assessment of the hemody-namic effects of a stenosis (6,7). However, it is possiblethat microvascular resistance during the wave-free periodcan be lowered even further with the administration ofadenosine, and it has been suggested that calculating iFRduring adenosine administration may improve its abilityto accurately discriminate flow-limiting stenoses (8).
In the ADVISE (Adenosine Vasodilator IndependentStenosis Evaluation) study, the classification of stenosisseverity was good between iFR and FFR, but in theabsence of a true gold standard, where differences inclassification occurred, it was difficult to know whichindex was correct.
The absence of a true ischemic gold standard hashampered the development of new indices in the past.Previously, noninvasive imaging modalities have beenused to further evaluate new intracoronary physiologicaltools. However, these techniques have limitations inmultivessel disease and can only isolate ischemia at the
Abbreviationsand Acronyms
AUC � area under thecurve
FFR � fractional flowreserve
HSR � hyperemic stenosisresistance
iFR � instantaneous wave-free ratio
iFRa � instantaneouswave-free ratio duringadenosine
ROC � receiver-operatingcharacteristic
level of a territory rather than a specific vessel (9). a
Therefore, in this study, we use the hyperemic stenosisresistance (HSR) index, an invasive pressure- and flow-based index, as the reference standard to determine whichof the pressure-based indices most accurately representsthe hemodynamic severity of the stenosis. HSR falls backto the fundamental importance of simultaneously mea-suring pressure and flow as first described by Gould (7),and in doing so, circumvents many of the limitations of apressure-only index. It is recognized to be more stenosisspecific, and less dependent on adenosine-mediated hy-peremia than pressure-only indices (10 –14).
In the first part of this study, we compared the diagnosticclassification of iFR, iFRa, and FFR to HSR. We thenassessed the changes in resistance that occur during the 3pressure-derived indices to determine how adenosine ad-ministration influences diagnostic categorization.
Methods
Study population. This study included 51 stenoses (sub-jects 66.2 � 9.2 years of age; 82.4% male) (Table 1)scheduled for coronary angiography or percutaneous coro-nary intervention at Guys and St. Thomas’ NHS Trust orImperial College London, UK. In addition to new data,patients were included from part 1 of the ADVISE study(6). Exclusion criteria were limited to significant valvularpathology, previous coronary artery bypass surgery, andweight �200 kg. All subjects gave written informed consentin accordance with the protocol approved by the local ethicscommittee (NRES 09/H0712/102; NCT01118481).Study protocol. Pressure and flow velocity recordings weremade distal to the target vessel coronary stenosis in 51vessels at rest and during adenosine-induced hyperemia(76.5% intravenous [140 �g/kg/min] and 23.5% intracoro-
ary [120 �g]).Cardiac catheterization. Cardiac catheterization was un-dertaken through the femoral approach. After diagnosticangiography, a 0.014-inch pressure and Doppler sensor-
DemographicsTable 1 Demographics
Stenoses, n (%)
Male 42 (82.4)
Age, yrs 66.2 � 9.2
Risk factors
Smoker 15 (29.4)
Diabetic 14 (27.4)
Hypertension 18 (35.2)
Family history of ischemic heart disease 13 (25.5)
Vessel
LAD 28 (54.9)
Cx 12 (23.5)
RCA 11 (21.6)
Adenosine route
IV 39 (76.5)
IC 12 (23.5)
Cx � circumflex; HSR � hyperemic stenosis resistance; IC � intracoronary; IV � intravenous; LAD � leftnterior descending artery; RCA � right coronary artery.
ntp
1411JACC Vol. 61, No. 13, 2013 Sen et al.April 2, 2013:1409–20 Instantaneous Wave-Free Ratio and FFR Are Equivalent
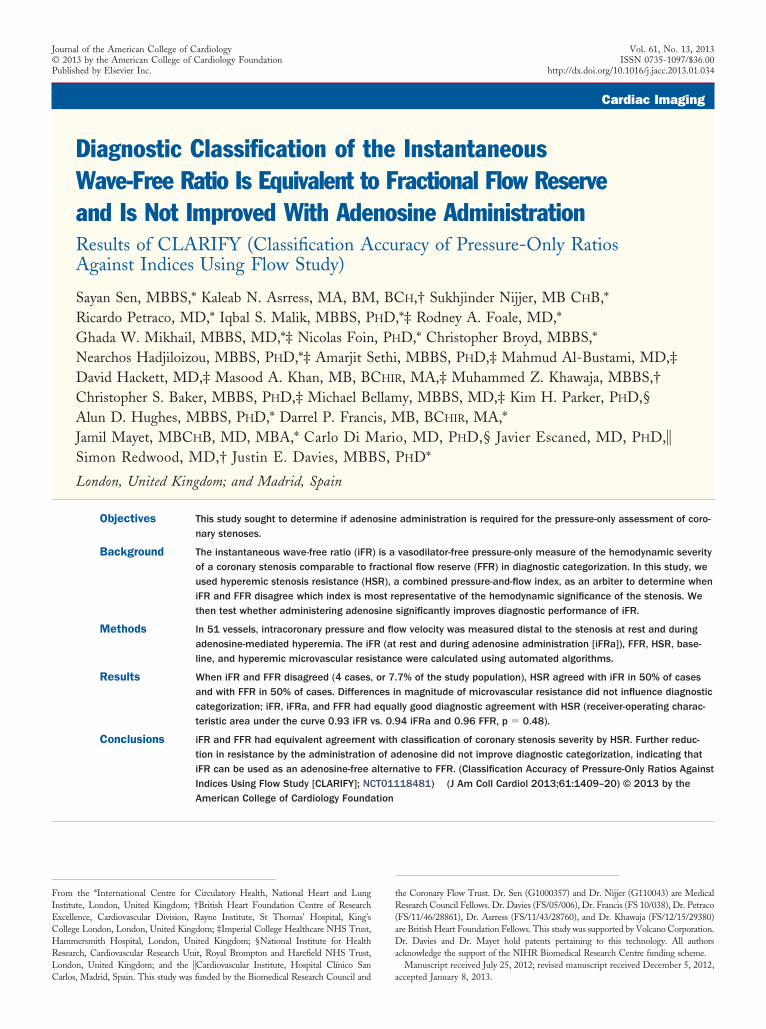
tipped wire (ComboWire XT, Volcano Corporation, SanDiego, California) was passed into the target vessel througha guiding catheter. Pressure equalization was performed atthe tip of the catheter prior to its advancement into thedistal vessel. Unfractionated intravenous heparin, 5,000 IU,was given at the start of the procedure with 300 �gintracoronary glyceryltrinitrate.Hemodynamic recordings. The electrocardiogram, pres-sures, and flow velocity signals were directly extracted fromthe digital archive of the device console (ComboMap,Volcano Corporation). At the end of each recording, thepressure sensor was returned to the catheter tip to ensurethere was no pressure drift. Where drift was identified,the measurements were repeated. An adequate flow enve-lope was obtained in all patients, permitting the calculationof flow-based indices. Data were analyzed off-line, using acustom software package designed with Matlab (Math-works, Natick, Massachusetts).Data analysis. Processing of digital data (pressure, flowvelocity, electrocardiogram) for the calculation of the vari-ous indices was performed at a workstation using Matlab(Mathworks). iFR was calculated as the ratio of distal toproximal pressures over the diastolic wave-free period usinga fully automated pressure-only algorithm, as previouslydescribed (6). This period corresponds to a time in thecardiac cycle when waves are absent from the coronary artery(6) (Fig. 1). An instantaneous wave-free ratio during aden-osine administration (iFRa) was also calculated using thesame algorithm. FFR, HSR, and basal and hyperemic
Proximal-originating compression wave
Microcirculatory-originating decompression wave
Time (ms)
Pre
ssur
e (m
mH
g)
Wav
e-in
tens
ity
(Wx1
0-5 m
-2s-
2 )
DIASTOLE WAVE-FREE
PERIOD
100%
75%
Figure 1 Wave Intensity Duringthe Diastolic Wave-Free Period
Representative traces showing coronary artery wave intensity (upper panel)and corresponding pressure waveform (lower panel). The duration of diastoleand the diastolic wave-free period are indicated with dashed vertical lines. Theportion of the pressure waveform used to calculate the instantaneous wave-free ratio (iFR) in this study is highlighted in blue.
microvascular resistance were calculated in all patients, aspreviously described (14,15,16).
Definition of flow-based intracoronary indices was as follows:
HSR �Pa � Pd
v
Hyperemic microvascular resistance (HMR) �Pd
v
Basal microvascular resistance (BMR) �Pdb
vb
Wave-free microvascular resistance (wfMVR) �Pdwfp
vwfp
Where Pa � mean aortic pressure; Pd � mean intracoro-ary pressure distal to stenosis; v � mean flow velocity distalo stenosis during hyperemia; Pdb � mean intracoronaryressure distal to stenosis at baseline; vb � mean flow
velocity distal to stenosis at baseline; and Pdwfp/vwfp � distalpressure over the wave-free period/flow velocity over thewave-free period.Statistical analysis. All data are expressed as mean � SDor median (25th and 75th quartiles), as appropriate.Receiver-operating characteristic curves (ROC) were con-structed for each index, and the agreement in diagnosticcategorization was compared between the indices by com-paring the areas under the ROC using the roccomp com-mand in STATA, version 11 (StataCorp, College Station,Texas) based on DeLong et al. (17). The optimal cut-off foreach of the pressure only indices of iFR, iFRa, and FFRwere selected to be that which maximized the sum ofsensitivity and specificity, using HSR as the referencestandard. The comparison of FFR to HSR was performed atthe 0.75 and 0.8 FFR cut-off.
We determined the sample variance (probability distri-bution) of the observed microvascular resistance values, ofeach index, as an estimate of true variance of the entirepatient population (STATA). The variance of the reductionin resistance for each of the 3 indices was compared usingthe F test. A value of p � 0.05 was deemed significant.Changes in microvascular resistance for each index arecompared to cycle averaged resting resistance.
Results
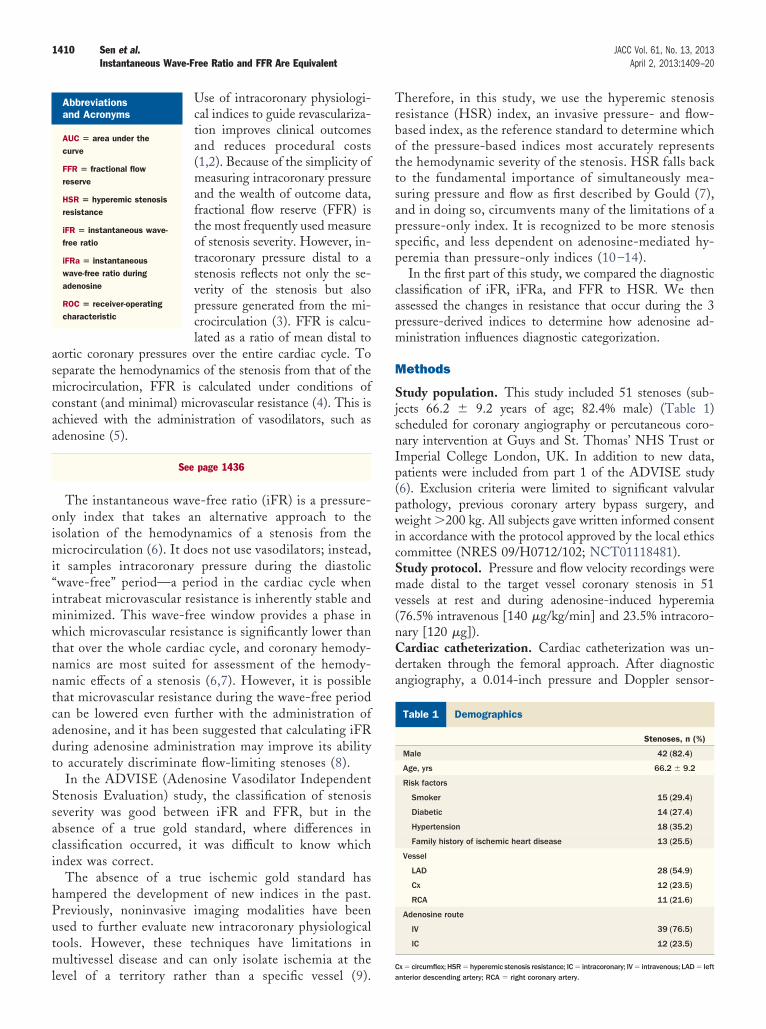
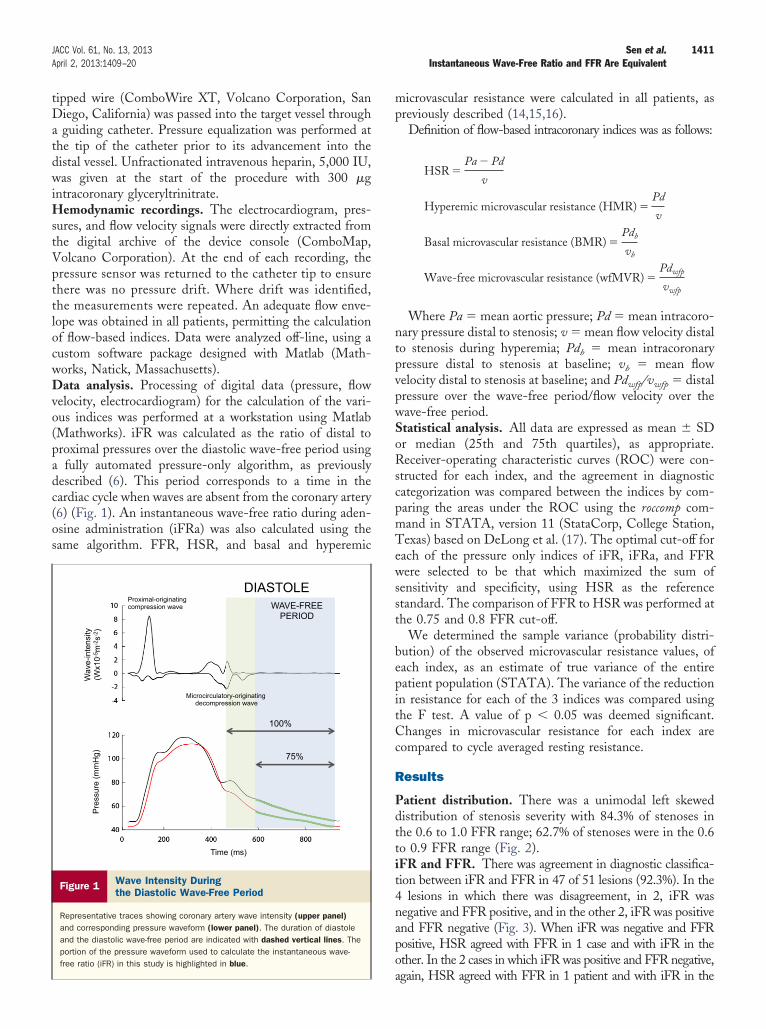
Patient distribution. There was a unimodal left skeweddistribution of stenosis severity with 84.3% of stenoses inthe 0.6 to 1.0 FFR range; 62.7% of stenoses were in the 0.6to 0.9 FFR range (Fig. 2).iFR and FFR. There was agreement in diagnostic classifica-tion between iFR and FFR in 47 of 51 lesions (92.3%). In the4 lesions in which there was disagreement, in 2, iFR wasnegative and FFR positive, and in the other 2, iFR was positiveand FFR negative (Fig. 3). When iFR was negative and FFRpositive, HSR agreed with FFR in 1 case and with iFR in theother. In the 2 cases in which iFR was positive and FFR negative,
again, HSR agreed with FFR in 1 patient and with iFR in the
aiRw
c(teHFoHeH
o0avTsn
a9Cfi0t0v
(af0atw
FcMerwctH
ccpa
1412 Sen et al. JACC Vol. 61, No. 13, 2013Instantaneous Wave-Free Ratio and FFR Are Equivalent April 2, 2013:1409–20
other. In both these cases, microvascular resistance during iFR waslower than that during adenosine-meditated FFR.
iFRa had significantly lower values than FFR and iFR(median iFRa 0.74 [0.58, 0.85] versus median FFR 0.84[0.70, 0.89] and median iFR 0.93 [0.83, 0.98], p � 0.001for both). Furthermore, this was true for both intracoronarynd intravenous adenosine administration. Despite numer-cal differences, there was no significance difference in theOC area under the curve (AUC) for either iFR or iFRahen compared to FFR (p � 0.15).Of the adenosine-based indices, iFRa provided signifi-
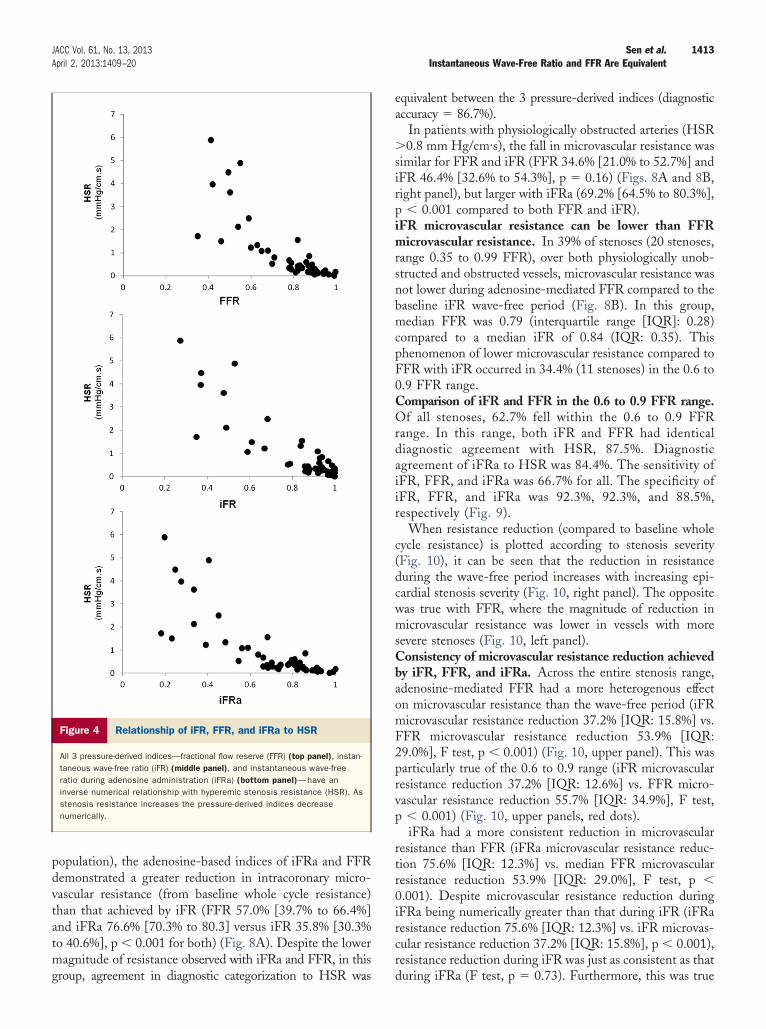
antly greater trans-stenotic pressure gradients than FFRiFRa 19.4 mm Hg [11.2 to 39.2] versus 12.2 mm Hg [7.2o 27.9], p � 0.001). However, iFR produced statisticallyquivalent trans-stenotic pressure gradients to FFR (iFR 8.2 mmg [3.1 to 21.6] versus 12.2 mm Hg [7.2 to 27.9], p � 0.48).FR, iFR, and iFRa compared to HSR. The relationshipf iFR, FFR, and iFRa to HSR was similar (Fig. 4). MedianSR was 0.35 (0.19, 1.08) mm Hg/cm·s. Using the
stablished ischemic cut-off point of �0.8 mm Hg/cm·s for
Figure 2 Frequency Distribution of FFR Values in Study
The severity of the range of stenoses was calculated using fractional flowreserve (FFR), and the frequency plotted for each range. This distribution is typ-ical for a clinical population, where a significant proportion (62.7%) of the FFRvalues fall between the 0.6 to 0.9 range.
SR (9), a 0.75 cut-off point for FFR was found to have the
ptimal diagnostic efficiency (ROC AUC) of 0.96 (95% CI:.89 to 1.00) with a sensitivity of 0.86, a specificity of 0.95,nd in this population, a positive and negative predictivealue of 0.86 and 0.95, respectively (Fig. 5, right panel).his compared to the 0.8 FFR cut-off point, which had a
ensitivity of 0.87, a specificity of 0.84, and positive andegative predictive value of 0.68 and 0.94, respectively.IFRa had an equivalent diagnostic performance to FFR,
gainst HSR as the reference standard (ROC AUC 0.94,5% CI: 0.85 to 1.00, p � 0.45 vs. FFR) (Fig. 5).orresponding to its numerically smaller values, the classi-cation cutpoint for iFRa was also lower, with a cutpoint of.66 found to have the highest diagnostic efficiency. Withhis cutpoint, iFRa had a sensitivity of 0.86, specificity of.92, and in this population, positive and negative predictivealues of 0.8 and 0.94, respectively.
iFR without adenosine had a diagnostic performanceROC AUC) of 0.93 (95% CI: 0.85 to 1.00) against HSRs the reference standard. An iFR cutpoint of 0.86 wasound to be equivalent of HSR 0.8. iFR had a sensitivity of.86, specificity of 0.95, and in this population, positivend negative predictive values of 0.86 and 0.95, respec-ively (Fig. 4). The relationship of iFR to FFR and HSRas independent of heart rate (Fig. 6).There was no significant difference among iFR, iFRa, and
FR in terms of agreement with HSR-guided treatmentlassification (p � 0.48) (Fig. 5).
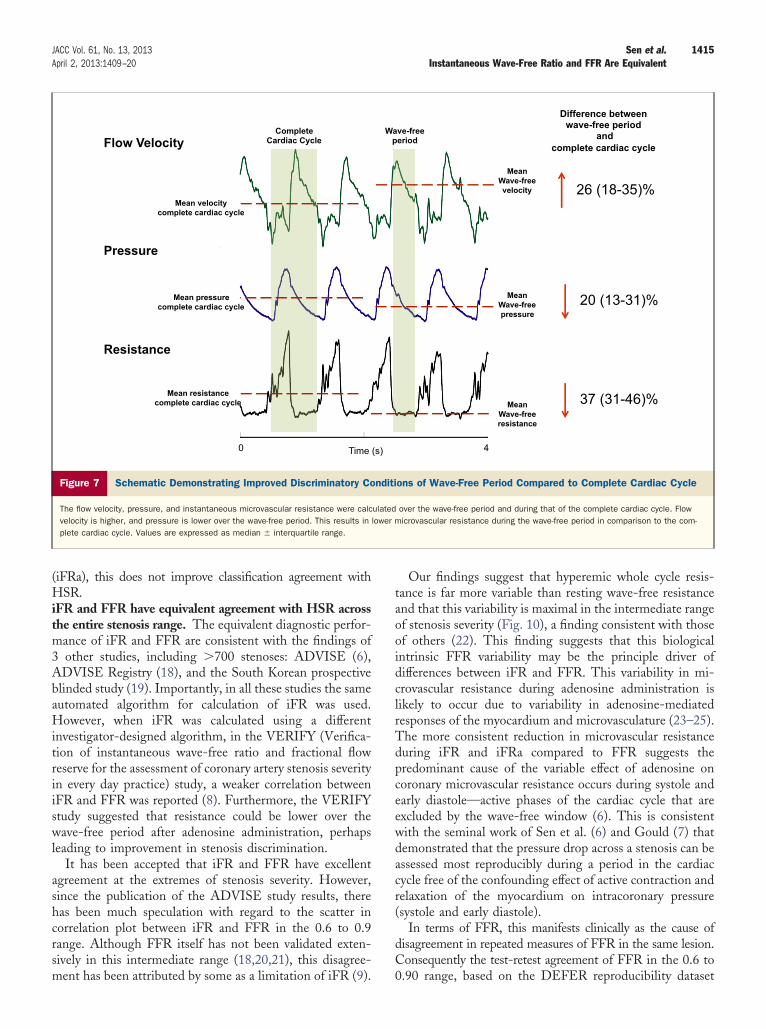
agnitude of microvascular resistance reduction according topicardial stenosis severity. Intracoronary microvascularesistance was significantly lower during the diastolicave-free period than averaged values over the whole
ardiac cycle at rest (microvascular resistance 3.30 (2.07o 4.38) mm Hg/cm·s vs. 5.30 (3.68 to 7.04) mm
g/cm·s, p � 0.001) (Fig. 7).The relationship between resting diastolic wave-free mi-
rovascular resistance and hyperemic whole cycle microvas-ular resistance varied according to stenosis severity. Inatients with physiologically unobstructed arteries, defineds HSR �0.8 mm Hg/cm.s (36 stenoses, 70.6% of the study
Figure 3 Disagreements of iFR and FFR
Instantaneous wave-free ratio (iFR) and fractional flow reserve (FFR) disagreedin 4 stenoses in terms of treatment categorization. When this occurred, hyper-emic stenosis resistance (HSR) agreed with iFR in 50% of cases and FFR in50% of cases.
m
1413JACC Vol. 61, No. 13, 2013 Sen et al.April 2, 2013:1409–20 Instantaneous Wave-Free Ratio and FFR Are Equivalent
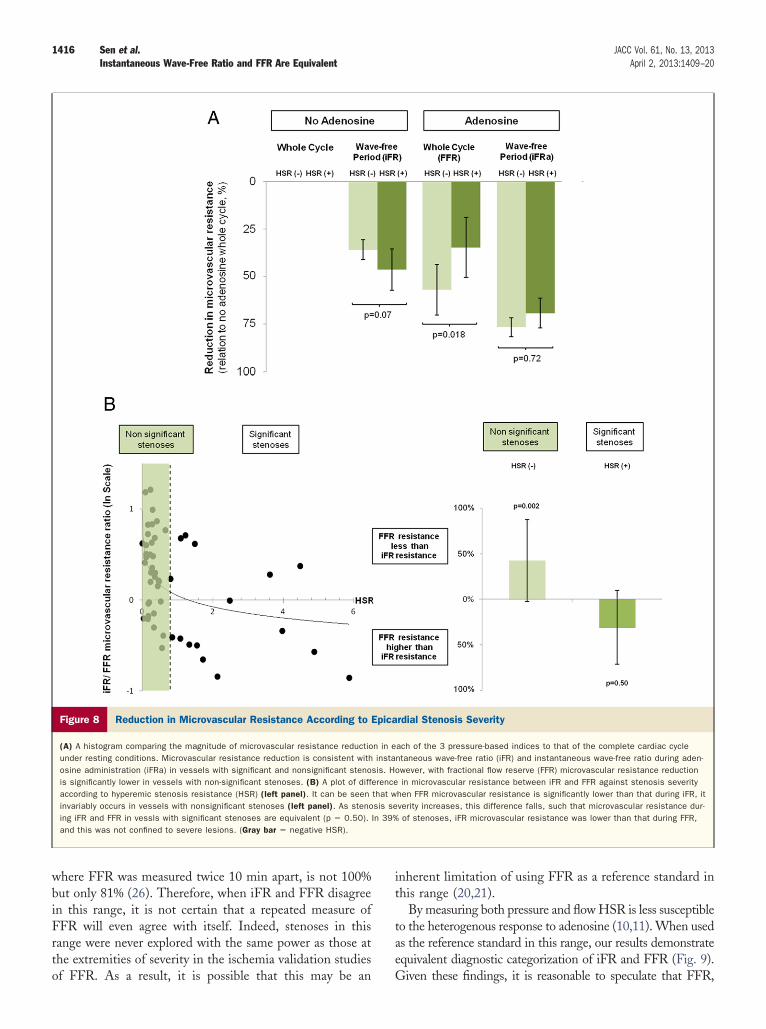
population), the adenosine-based indices of iFRa and FFRdemonstrated a greater reduction in intracoronary micro-vascular resistance (from baseline whole cycle resistance)than that achieved by iFR (FFR 57.0% [39.7% to 66.4%]and iFRa 76.6% [70.3% to 80.3] versus iFR 35.8% [30.3%to 40.6%], p � 0.001 for both) (Fig. 8A). Despite the lower
agnitude of resistance observed with iFRa and FFR, in this
Figure 4 Relationship of iFR, FFR, and iFRa to HSR
All 3 pressure-derived indices—fractional flow reserve (FFR) (top panel), instan-taneous wave-free ratio (iFR) (middle panel), and instantaneous wave-freeratio during adenosine administration (iFRa) (bottom panel)—have aninverse numerical relationship with hyperemic stenosis resistance (HSR). Asstenosis resistance increases the pressure-derived indices decreasenumerically.
group, agreement in diagnostic categorization to HSR was
equivalent between the 3 pressure-derived indices (diagnosticaccuracy � 86.7%).
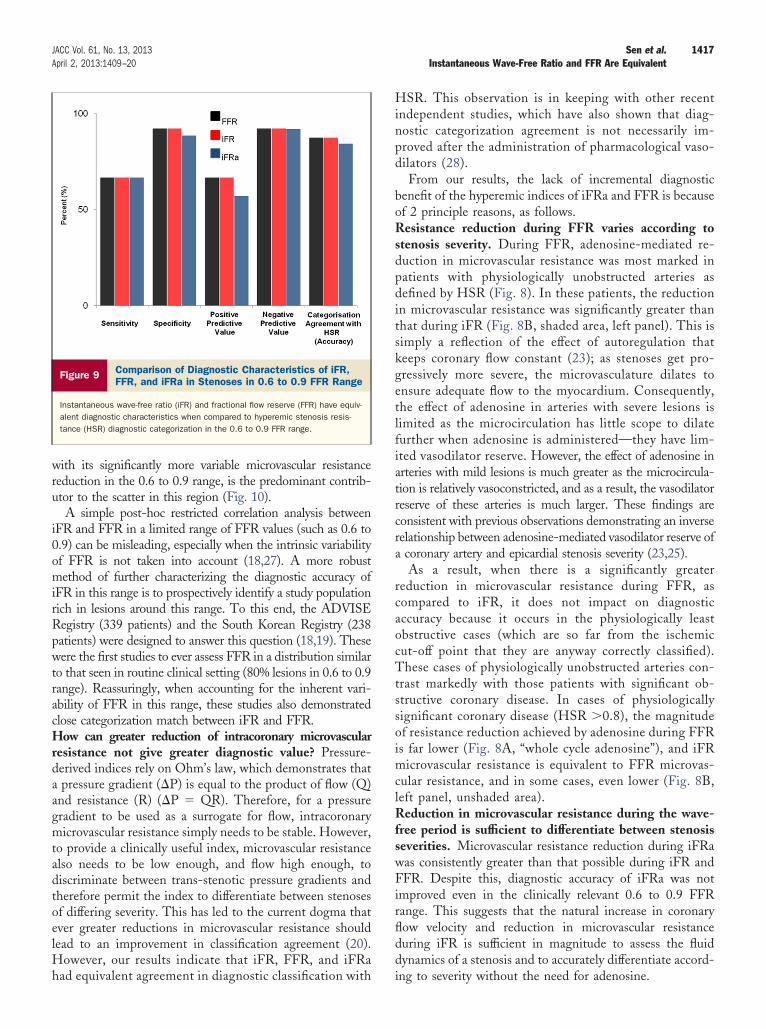
In patients with physiologically obstructed arteries (HSR�0.8 mm Hg/cm·s), the fall in microvascular resistance wassimilar for FFR and iFR (FFR 34.6% [21.0% to 52.7%] andiFR 46.4% [32.6% to 54.3%], p � 0.16) (Figs. 8A and 8B,right panel), but larger with iFRa (69.2% [64.5% to 80.3%],p � 0.001 compared to both FFR and iFR).iFR microvascular resistance can be lower than FFRmicrovascular resistance. In 39% of stenoses (20 stenoses,range 0.35 to 0.99 FFR), over both physiologically unob-structed and obstructed vessels, microvascular resistance wasnot lower during adenosine-mediated FFR compared to thebaseline iFR wave-free period (Fig. 8B). In this group,median FFR was 0.79 (interquartile range [IQR]: 0.28)compared to a median iFR of 0.84 (IQR: 0.35). Thisphenomenon of lower microvascular resistance compared toFFR with iFR occurred in 34.4% (11 stenoses) in the 0.6 to0.9 FFR range.Comparison of iFR and FFR in the 0.6 to 0.9 FFR range.Of all stenoses, 62.7% fell within the 0.6 to 0.9 FFRrange. In this range, both iFR and FFR had identicaldiagnostic agreement with HSR, 87.5%. Diagnosticagreement of iFRa to HSR was 84.4%. The sensitivity ofiFR, FFR, and iFRa was 66.7% for all. The specificity ofiFR, FFR, and iFRa was 92.3%, 92.3%, and 88.5%,respectively (Fig. 9).
When resistance reduction (compared to baseline wholecycle resistance) is plotted according to stenosis severity(Fig. 10), it can be seen that the reduction in resistanceduring the wave-free period increases with increasing epi-cardial stenosis severity (Fig. 10, right panel). The oppositewas true with FFR, where the magnitude of reduction inmicrovascular resistance was lower in vessels with moresevere stenoses (Fig. 10, left panel).Consistency of microvascular resistance reduction achievedby iFR, FFR, and iFRa. Across the entire stenosis range,adenosine-mediated FFR had a more heterogenous effecton microvascular resistance than the wave-free period (iFRmicrovascular resistance reduction 37.2% [IQR: 15.8%] vs.FFR microvascular resistance reduction 53.9% [IQR:29.0%], F test, p � 0.001) (Fig. 10, upper panel). This wasparticularly true of the 0.6 to 0.9 range (iFR microvascularresistance reduction 37.2% [IQR: 12.6%] vs. FFR micro-vascular resistance reduction 55.7% [IQR: 34.9%], F test,p � 0.001) (Fig. 10, upper panels, red dots).
iFRa had a more consistent reduction in microvascularresistance than FFR (iFRa microvascular resistance reduc-tion 75.6% [IQR: 12.3%] vs. median FFR microvascularresistance reduction 53.9% [IQR: 29.0%], F test, p �0.001). Despite microvascular resistance reduction duringiFRa being numerically greater than that during iFR (iFRaresistance reduction 75.6% [IQR: 12.3%] vs. iFR microvas-cular resistance reduction 37.2% [IQR: 15.8%], p � 0.001),resistance reduction during iFR was just as consistent as that
during iFRa (F test, p � 0.73). Furthermore, this was true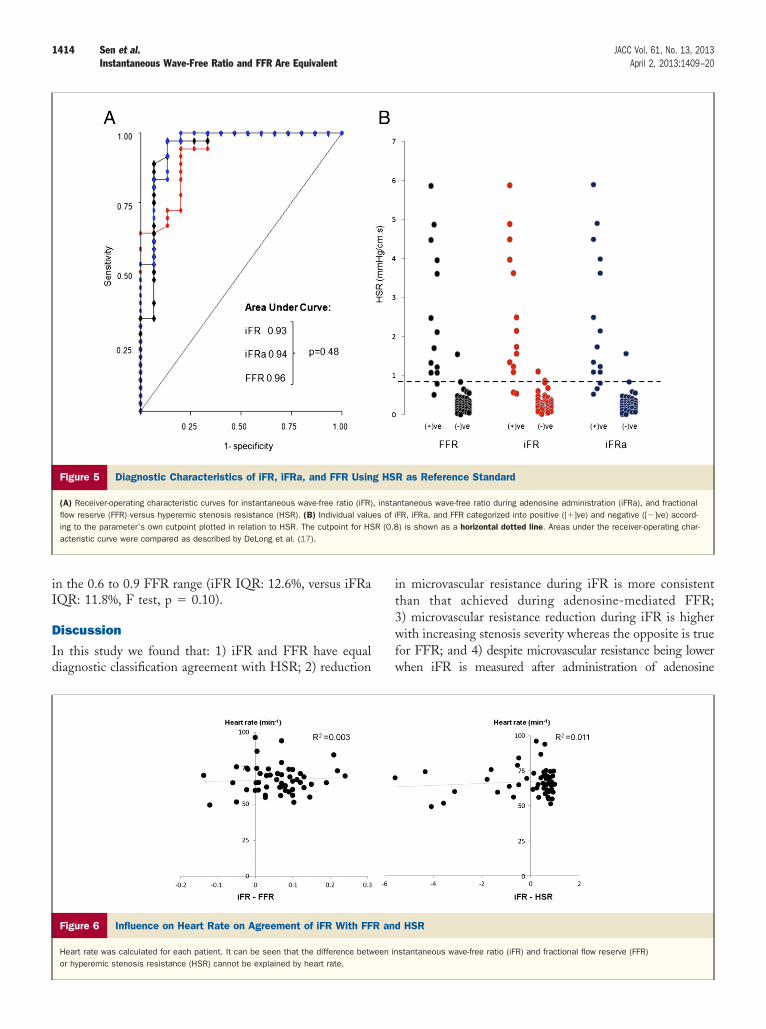
D
Id
1414 Sen et al. JACC Vol. 61, No. 13, 2013Instantaneous Wave-Free Ratio and FFR Are Equivalent April 2, 2013:1409–20
in the 0.6 to 0.9 FFR range (iFR IQR: 12.6%, versus iFRaIQR: 11.8%, F test, p � 0.10).
iscussion
n this study we found that: 1) iFR and FFR have equaliagnostic classification agreement with HSR; 2) reduction
Figure 5 Diagnostic Characteristics of iFR, iFRa, and FFR Usin
(A) Receiver-operating characteristic curves for instantaneous wave-free ratio (iFR)flow reserve (FFR) versus hyperemic stenosis resistance (HSR). (B) Individual valuing to the parameter’s own cutpoint plotted in relation to HSR. The cutpoint for HSacteristic curve were compared as described by DeLong et al. (17).
Figure 6 Influence on Heart Rate on Agreement of iFR With FF
Heart rate was calculated for each patient. It can be seen that the difference betwor hyperemic stenosis resistance (HSR) cannot be explained by heart rate.
in microvascular resistance during iFR is more consistentthan that achieved during adenosine-mediated FFR;3) microvascular resistance reduction during iFR is higherwith increasing stenosis severity whereas the opposite is truefor FFR; and 4) despite microvascular resistance being lowerwhen iFR is measured after administration of adenosine
R as Reference Standard
ntaneous wave-free ratio during adenosine administration (iFRa), and fractionalFR, iFRa, and FFR categorized into positive ([�]ve) and negative ([�]ve) accord-) is shown as a horizontal dotted line. Areas under the receiver-operating char-
HSR
stantaneous wave-free ratio (iFR) and fractional flow reserve (FFR)
g HS
, instaes of iR (0.8
R and
een in
m3
1415JACC Vol. 61, No. 13, 2013 Sen et al.April 2, 2013:1409–20 Instantaneous Wave-Free Ratio and FFR Are Equivalent
(iFRa), this does not improve classification agreement withHSR.iFR and FFR have equivalent agreement with HSR acrossthe entire stenosis range. The equivalent diagnostic perfor-
ance of iFR and FFR are consistent with the findings ofother studies, including �700 stenoses: ADVISE (6),
ADVISE Registry (18), and the South Korean prospectiveblinded study (19). Importantly, in all these studies the sameautomated algorithm for calculation of iFR was used.However, when iFR was calculated using a differentinvestigator-designed algorithm, in the VERIFY (Verifica-tion of instantaneous wave-free ratio and fractional flowreserve for the assessment of coronary artery stenosis severityin every day practice) study, a weaker correlation betweeniFR and FFR was reported (8). Furthermore, the VERIFYstudy suggested that resistance could be lower over thewave-free period after adenosine administration, perhapsleading to improvement in stenosis discrimination.
It has been accepted that iFR and FFR have excellentagreement at the extremes of stenosis severity. However,since the publication of the ADVISE study results, therehas been much speculation with regard to the scatter incorrelation plot between iFR and FFR in the 0.6 to 0.9range. Although FFR itself has not been validated exten-sively in this intermediate range (18,20,21), this disagree-
Complete Cardiac Cycle Flow Velocity
Pressure
Resistance
Time 0
Mean velocity complete cardiac cycle
Mean pressure complete cardiac cycle
Mean resistance complete cardiac cycle
Figure 7 Schematic Demonstrating Improved Discriminatory Co
The flow velocity, pressure, and instantaneous microvascular resistance were calcvelocity is higher, and pressure is lower over the wave-free period. This results inplete cardiac cycle. Values are expressed as median � interquartile range.
ment has been attributed by some as a limitation of iFR (9).
Our findings suggest that hyperemic whole cycle resis-tance is far more variable than resting wave-free resistanceand that this variability is maximal in the intermediate rangeof stenosis severity (Fig. 10), a finding consistent with thoseof others (22). This finding suggests that this biologicalintrinsic FFR variability may be the principle driver ofdifferences between iFR and FFR. This variability in mi-crovascular resistance during adenosine administration islikely to occur due to variability in adenosine-mediatedresponses of the myocardium and microvasculature (23–25).The more consistent reduction in microvascular resistanceduring iFR and iFRa compared to FFR suggests thepredominant cause of the variable effect of adenosine oncoronary microvascular resistance occurs during systole andearly diastole—active phases of the cardiac cycle that areexcluded by the wave-free window (6). This is consistentwith the seminal work of Sen et al. (6) and Gould (7) thatdemonstrated that the pressure drop across a stenosis can beassessed most reproducibly during a period in the cardiaccycle free of the confounding effect of active contraction andrelaxation of the myocardium on intracoronary pressure(systole and early diastole).
In terms of FFR, this manifests clinically as the cause ofdisagreement in repeated measures of FFR in the same lesion.Consequently the test-retest agreement of FFR in the 0.6 to
26 (18-35)%
ve-free eriod
37 (31-46)%
20 (13-31)%
Difference between wave-free period
and complete cardiac cycle
4
Mean Wave-free velocity
Mean Wave-free pressure
Mean Wave-free resistance
ons of Wave-Free Period Compared to Complete Cardiac Cycle
over the wave-free period and during that of the complete cardiac cycle. Flowicrovascular resistance during the wave-free period in comparison to the com-
Wap
(s)
nditi
ulatedlower m
0.90 range, based on the DEFER reproducibility dataset
1416 Sen et al. JACC Vol. 61, No. 13, 2013Instantaneous Wave-Free Ratio and FFR Are Equivalent April 2, 2013:1409–20
where FFR was measured twice 10 min apart, is not 100%but only 81% (26). Therefore, when iFR and FFR disagreein this range, it is not certain that a repeated measure ofFFR will even agree with itself. Indeed, stenoses in thisrange were never explored with the same power as those atthe extremities of severity in the ischemia validation studies
Figure 8 Reduction in Microvascular Resistance According to
(A) A histogram comparing the magnitude of microvascular resistance reductiounder resting conditions. Microvascular resistance reduction is consistent withosine administration (iFRa) in vessels with significant and nonsignificant stenois significantly lower in vessels with non-significant stenoses. (B) A plot of diffaccording to hyperemic stenosis resistance (HSR) (left panel). It can be seeninvariably occurs in vessels with nonsignificant stenoses (left panel). As stenoing iFR and FFR in vessls with significant stenoses are equivalent (p � 0.50).and this was not confined to severe lesions. (Gray bar � negative HSR).
of FFR. As a result, it is possible that this may be an
inherent limitation of using FFR as a reference standard inthis range (20,21).
By measuring both pressure and flow HSR is less susceptibleto the heterogenous response to adenosine (10,11). When usedas the reference standard in this range, our results demonstrateequivalent diagnostic categorization of iFR and FFR (Fig. 9).
rdial Stenosis Severity
ach of the 3 pressure-based indices to that of the complete cardiac cyclentaneous wave-free ratio (iFR) and instantaneous wave-free ratio during aden-owever, with fractional flow reserve (FFR) microvascular resistance reduction
in microvascular resistance between iFR and FFR against stenosis severityhen FFR microvascular resistance is significantly lower than that during iFR, itverity increases, this difference falls, such that microvascular resistance dur-of stenoses, iFR microvascular resistance was lower than that during FFR,
Epica
n in einsta
sis. Herencethat wsis seIn 39%
Given these findings, it is reasonable to speculate that FFR,
gmtadtoelHh
1417JACC Vol. 61, No. 13, 2013 Sen et al.April 2, 2013:1409–20 Instantaneous Wave-Free Ratio and FFR Are Equivalent
with its significantly more variable microvascular resistancereduction in the 0.6 to 0.9 range, is the predominant contrib-utor to the scatter in this region (Fig. 10).
A simple post-hoc restricted correlation analysis betweeniFR and FFR in a limited range of FFR values (such as 0.6 to0.9) can be misleading, especially when the intrinsic variabilityof FFR is not taken into account (18,27). A more robustmethod of further characterizing the diagnostic accuracy ofiFR in this range is to prospectively identify a study populationrich in lesions around this range. To this end, the ADVISERegistry (339 patients) and the South Korean Registry (238patients) were designed to answer this question (18,19). Thesewere the first studies to ever assess FFR in a distribution similarto that seen in routine clinical setting (80% lesions in 0.6 to 0.9range). Reassuringly, when accounting for the inherent vari-ability of FFR in this range, these studies also demonstratedclose categorization match between iFR and FFR.How can greater reduction of intracoronary microvascularresistance not give greater diagnostic value? Pressure-derived indices rely on Ohm’s law, which demonstrates thata pressure gradient (�P) is equal to the product of flow (Q)and resistance (R) (�P � QR). Therefore, for a pressureradient to be used as a surrogate for flow, intracoronaryicrovascular resistance simply needs to be stable. However,
o provide a clinically useful index, microvascular resistancelso needs to be low enough, and flow high enough, toiscriminate between trans-stenotic pressure gradients andherefore permit the index to differentiate between stenosesf differing severity. This has led to the current dogma thatver greater reductions in microvascular resistance shouldead to an improvement in classification agreement (20).
owever, our results indicate that iFR, FFR, and iFRa
Figure 9 Comparison of Diagnostic Characteristics of iFR,FFR, and iFRa in Stenoses in 0.6 to 0.9 FFR Range
Instantaneous wave-free ratio (iFR) and fractional flow reserve (FFR) have equiv-alent diagnostic characteristics when compared to hyperemic stenosis resis-tance (HSR) diagnostic categorization in the 0.6 to 0.9 FFR range.
ad equivalent agreement in diagnostic classification with
HSR. This observation is in keeping with other recentindependent studies, which have also shown that diag-nostic categorization agreement is not necessarily im-proved after the administration of pharmacological vaso-dilators (28).
From our results, the lack of incremental diagnosticbenefit of the hyperemic indices of iFRa and FFR is becauseof 2 principle reasons, as follows.Resistance reduction during FFR varies according tostenosis severity. During FFR, adenosine-mediated re-duction in microvascular resistance was most marked inpatients with physiologically unobstructed arteries asdefined by HSR (Fig. 8). In these patients, the reductionin microvascular resistance was significantly greater thanthat during iFR (Fig. 8B, shaded area, left panel). This issimply a reflection of the effect of autoregulation thatkeeps coronary flow constant (23); as stenoses get pro-gressively more severe, the microvasculature dilates toensure adequate flow to the myocardium. Consequently,the effect of adenosine in arteries with severe lesions islimited as the microcirculation has little scope to dilatefurther when adenosine is administered—they have lim-ited vasodilator reserve. However, the effect of adenosine inarteries with mild lesions is much greater as the microcircula-tion is relatively vasoconstricted, and as a result, the vasodilatorreserve of these arteries is much larger. These findings areconsistent with previous observations demonstrating an inverserelationship between adenosine-mediated vasodilator reserve ofa coronary artery and epicardial stenosis severity (23,25).
As a result, when there is a significantly greaterreduction in microvascular resistance during FFR, ascompared to iFR, it does not impact on diagnosticaccuracy because it occurs in the physiologically leastobstructive cases (which are so far from the ischemiccut-off point that they are anyway correctly classified).These cases of physiologically unobstructed arteries con-trast markedly with those patients with significant ob-structive coronary disease. In cases of physiologicallysignificant coronary disease (HSR �0.8), the magnitudeof resistance reduction achieved by adenosine during FFRis far lower (Fig. 8A, “whole cycle adenosine”), and iFRmicrovascular resistance is equivalent to FFR microvas-cular resistance, and in some cases, even lower (Fig. 8B,left panel, unshaded area).Reduction in microvascular resistance during the wave-free period is sufficient to differentiate between stenosisseverities. Microvascular resistance reduction during iFRawas consistently greater than that possible during iFR andFFR. Despite this, diagnostic accuracy of iFRa was notimproved even in the clinically relevant 0.6 to 0.9 FFRrange. This suggests that the natural increase in coronaryflow velocity and reduction in microvascular resistanceduring iFR is sufficient in magnitude to assess the fluiddynamics of a stenosis and to accurately differentiate accord-
ing to severity without the need for adenosine.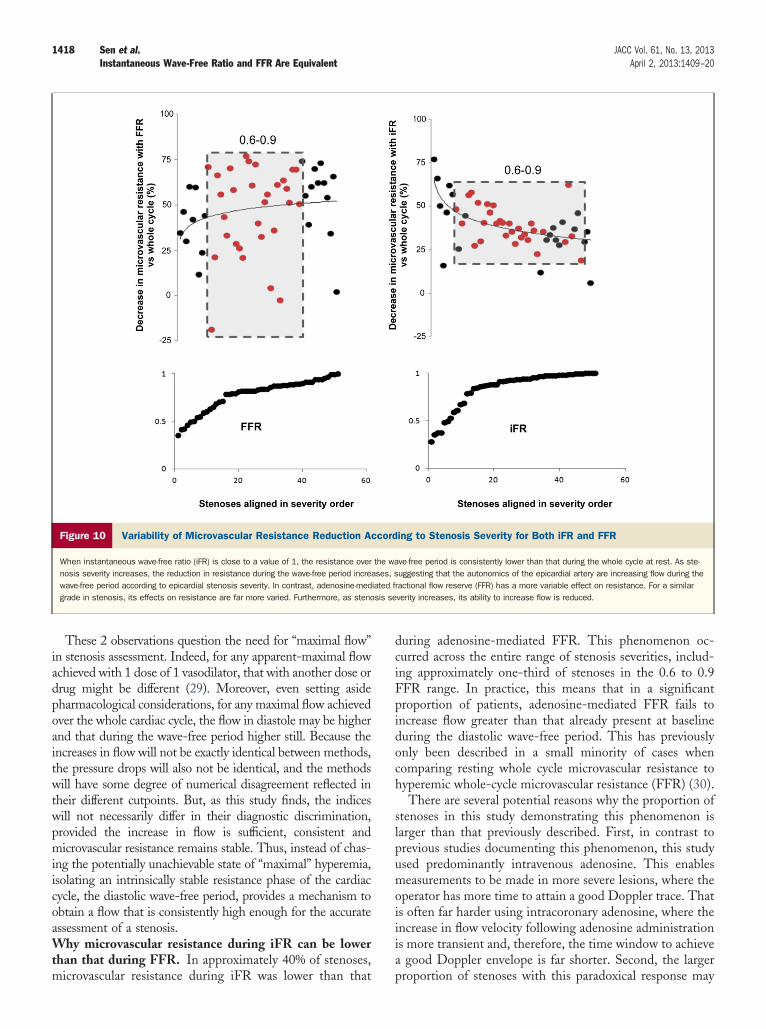
1418 Sen et al. JACC Vol. 61, No. 13, 2013Instantaneous Wave-Free Ratio and FFR Are Equivalent April 2, 2013:1409–20
These 2 observations question the need for “maximal flow”in stenosis assessment. Indeed, for any apparent-maximal flowachieved with 1 dose of 1 vasodilator, that with another dose ordrug might be different (29). Moreover, even setting asidepharmacological considerations, for any maximal flow achievedover the whole cardiac cycle, the flow in diastole may be higherand that during the wave-free period higher still. Because theincreases in flow will not be exactly identical between methods,the pressure drops will also not be identical, and the methodswill have some degree of numerical disagreement reflected intheir different cutpoints. But, as this study finds, the indiceswill not necessarily differ in their diagnostic discrimination,provided the increase in flow is sufficient, consistent andmicrovascular resistance remains stable. Thus, instead of chas-ing the potentially unachievable state of “maximal” hyperemia,isolating an intrinsically stable resistance phase of the cardiaccycle, the diastolic wave-free period, provides a mechanism toobtain a flow that is consistently high enough for the accurateassessment of a stenosis.Why microvascular resistance during iFR can be lowerthan that during FFR. In approximately 40% of stenoses,
Figure 10 Variability of Microvascular Resistance Reduction A
When instantaneous wave-free ratio (iFR) is close to a value of 1, the resistance overnosis severity increases, the reduction in resistance during the wave-free period increwave-free period according to epicardial stenosis severity. In contrast, adenosine-medgrade in stenosis, its effects on resistance are far more varied. Furthermore, as steno
microvascular resistance during iFR was lower than that
during adenosine-mediated FFR. This phenomenon oc-curred across the entire range of stenosis severities, includ-ing approximately one-third of stenoses in the 0.6 to 0.9FFR range. In practice, this means that in a significantproportion of patients, adenosine-mediated FFR fails toincrease flow greater than that already present at baselineduring the diastolic wave-free period. This has previouslyonly been described in a small minority of cases whencomparing resting whole cycle microvascular resistance tohyperemic whole-cycle microvascular resistance (FFR) (30).
There are several potential reasons why the proportion ofstenoses in this study demonstrating this phenomenon islarger than that previously described. First, in contrast toprevious studies documenting this phenomenon, this studyused predominantly intravenous adenosine. This enablesmeasurements to be made in more severe lesions, where theoperator has more time to attain a good Doppler trace. Thatis often far harder using intracoronary adenosine, where theincrease in flow velocity following adenosine administrationis more transient and, therefore, the time window to achievea good Doppler envelope is far shorter. Second, the larger
ing to Stenosis Severity for Both iFR and FFR
ve-free period is consistently lower than that during the whole cycle at rest. As ste-uggesting that the autonomics of the epicardial artery are increasing flow during the
ractional flow reserve (FFR) has a more variable effect on resistance. For a similarverity increases, its ability to increase flow is reduced.
ccord
the waases, siated fsis se
proportion of stenoses with this paradoxical response may
1419JACC Vol. 61, No. 13, 2013 Sen et al.April 2, 2013:1409–20 Instantaneous Wave-Free Ratio and FFR Are Equivalent
also reflect the unique hemodynamics of the wave-freeperiod. Phasic analysis of coronary pressure, flow, andmicrovascular resistance demonstrates that microvascularresistance is approximately 30% to 40% lower during thewave-free period when compared to whole-cycle microvas-cular resistance. Consequently, adenosine-mediated FFRmicrovascular resistance is required to be consistently lowerto surpass the reduction in microvascular resistance alreadyachieved by simply selecting the wave-free period. Unfor-tunately, the variable reduction in microvascular resistanceduring FFR (20) prevents this from being consistentlyachieved and it is not possible to predict in which patientsthis will occur. By obviating the need for vasodilatoradministration, iFR is not subject to the natural variabilityassociated with drug administration between patients, andtherefore provides a more consistent assessment acrosslesions of similar severity (Fig. 10).The next step for iFR. Physiologic-guided revasculariza-tion has been demonstrated to improve clinical outcomesand reduce procedural costs (1,2). However, adoption intoclinical practice has been limited (31). One of the reasonsfor this is the requirement of adenosine (29–32). As avasodilator-free index, iFR has been proposed as a possiblesolution to this problem. Given the good categorizationmatch with FFR in �700 stenoses to date, it can be arguedthat there is little to gain from further comparisons withFFR. Furthermore, by measuring flow we identify a phys-iological reason that questions the use of FFR as thereference standard, particularly in the 0.6 to 0.9 range—thevariable response to adenosine. Although we find that iFRis equivalent to FFR at detecting hemodynamic significantstenoses (as defined by HSR �0.8), the true measure of theclinical utility of the index will be determined by outcomestudies. To this end, a systematic appraisal of iFR-guideddeferral of therapy would allow clinicians to begin to assessits place in the clinical domain.Study limitations. Although we use HSR as the referencestandard in this study, it should be noted that there is nogold standard ischemia test. Despite being an inherentlimitation to the establishment of any new ischemic test, wechose HSR as the reference standard because it measuresboth pressure and flow and is, therefore, less susceptible tothe heterogenous effect of adenosine and because of its highspecificity for ischemia (10–14).
The iFR cutpoint of 0.86 in this study is different fromthat in the ADVISE study (6). That is because in this studywe compare iFR to the ischemic cut-off points of HSR (0.8)and FFR (0.75). It should be noted that this is differentfrom the ADVISE Registry (18) and the Korean study (19),which were both highly powered to assess the cutpointrelating to the clinical (nonischemic) FFR cut-off of 0.8.Their findings were consistent with 0.89 being equivalent toFFR 0.8. In this study, the HSR 0.8 cut off is equivalent toFFR 0.75, and as such, it was necessary to obtain the iFR
value (0.86) pertaining to these values.This is a small study compared to the larger pressure-onlystudies in this field. As with all mechanistic studies, inter-pretation of our findings should be done in the context ofthe study size. However, this remains 1 of the largestpressure and flow studies using intravenous adenosine, andthe only study comparing FFR, iFR, and HSR in the 0.6 to0.9 range. The number of patients in which iFR and FFRdisagree with each other is small, and their significanceshould be interpreted with caution. However, it should benoted that the proportion (7.7%) is consistent with clinicalpopulations, the ADVISE Registry (6%), and South KoreanStudy (6%), suggesting that the study findings are consistentwith other, larger datasets (18,19).
The distribution of stenoses in this study is unimodalwith leftward skew, which is more reflective of the distri-bution seen in routine clinical practice (18,19). It may beargued that this may have masked any potential differencesbetween iFR and the hyperemic indices. However, ratherthan acting in favor of iFR, such a skew is more likely toplace iFR at a disadvantage, particularly if the magnitude ofmicrovascular resistance is a key discriminator between thediagnostic accuracy of iFR and FFR as is assumed. This isbecause in a population such as this, the predominance ofstenoses in the 0.6–1.0 FFR range identifies a populationwith marked differences in microvascular resistance betweeniFR and FFR. Given that reductions in microvascularresistance with hyperemia are most marked in patients withless obstructive lesions, one would expect the agreement ofiFR to FFR and HSR to be weak in such a population andtherefore biased against iFR. That the level of agreementbetween indices is good (including the 0.6 to 0.9 range)suggests that our conclusions that the flow velocity achievedduring the wave-free period is sufficient to assess a stenosisand that pharmacologically induced greater flow is surplusto requirement are valid. Therefore, rather than introducingbias, the good level of agreement in this data distributionshould reassure clinicians that the principal physiologicalfindings of this study are applicable to the patients they seein the catheterization laboratory.
The ability to measure flow velocity accurately is chal-lenging and has the potential to introduce a source of error.However, this was limited as measurements were predom-inantly made with intravenous adenosine to ensure adequatetime was available to achieve the best possible flow velocityenvelope and performed by experienced operators wellpracticed at making flow measurements. To this end, it isreassuring that our resistance findings are consistent withthat reported by others (23).
Conclusions
iFR and FFR have equivalent levels of agreement with HSRclassification of coronary stenoses severity. Adenosine ad-ministration did not improve the diagnostic performance ofiFR, indicating that iFR can used as an adenosine-free
alternative to FFR.
1
1
1
1
2
2
2
2
2
2
2
2
2
2
3
3
3
1420 Sen et al. JACC Vol. 61, No. 13, 2013Instantaneous Wave-Free Ratio and FFR Are Equivalent April 2, 2013:1409–20
Reprint requests and correspondence: Dr. Sayan Sen,International Centre of Circulatory Health, National Heartand Lung Institute, 59-61 North Wharf Road, London W21LA, United Kingdom. E-mail: [email protected]
REFERENCES
1. Fearon WF, Bornschein B, Tonino PA, et al. Economic evaluation offractional flow reserve-guided percutaneous coronary intervention inpatients with multivessel disease. Circulation 2010;122:2545–50.
2. Tonino PA, De BB, Pijls NH, et al. Fractional flow reserve versusangiography for guiding percutaneous coronary intervention. N EnglJ Med 2009;360:213–24.
3. Davies JE, Whinnett ZI, Francis DP, et al. Evidence of a dominantbackward-propagating “suction” wave responsible for diastolic coro-nary filling in humans, attenuated in left ventricular hypertrophy.Circulation 2006;113:1768–78.
4. Pijls NH, van Son JA, Kirkeeide RL, De BB, Gould KL. Experimen-tal basis of determining maximum coronary, myocardial, and collateralblood flow by pressure measurements for assessing functional stenosisseverity before and after percutaneous transluminal coronary angio-plasty. Circulation 1993;87:1354–67.
5. De BB, Pijls NH, Barbato E, et al. Intracoronary and intravenousadenosine 5’-triphosphate, adenosine, papaverine, and contrast me-dium to assess fractional flow reserve in humans. Circulation 2003;107:1877–83.
6. Sen S, Escaned J, Malik IS, et al. Development and validation of a newadenosine-independent index of stenosis severity from coronary wave-intensity analysis: results of the ADVISE (Adenosine VasodilatorIndependent Stenosis Evaluation) study. J Am Coll Cardiol 2012;59:1392–402.
7. Gould KL. Pressure-flow characteristics of coronary stenoses inunsedated dogs at rest and during coronary vasodilation. Circ Res1978;43:242–53.
8. Berry C, van ’t Veer M, Witt N, et al. VERIFY (VERification ofInstantaneous wave-Free ratio and fractional flow reserve for theassessment of coronary artery stenosis severity in everydaY practice: amulticenter study in consecutive patients. J Am Coll Cardiol 2013;61:1421–7.
9. Christou MA, Siontis GC, Katritsis DG, Ioannidis JP. Meta-analysisof fractional flow reserve versus quantitative coronary angiography andnoninvasive imaging for evaluation of myocardial ischemia. Am JCardiol 2007;99:450–6.
10. Meuwissen M, Siebes M, Spaan JA, Piek JJ. Rationale of combinedintracoronary pressure and flow velocity measurements. Z Kardiol2002;91 Suppl 3:108–12.
11. Meuwissen M, Siebes M, Chamuleau SA, et al. Hyperemic stenosisresistance index for evaluation of functional coronary lesion severity.Circulation 2002;106:441–6.
12. Meuwissen M, Siebes M, Chamuleau SA, Tijssen JG, Spaan JA, PiekJJ. Intracoronary pressure and flow velocity for hemodynamic evalua-tion of coronary stenoses. Expert Rev Cardiovasc Ther 2003;1:471–9.
13. Meuwissen M, Chamuleau SA, Siebes M, et al. The prognostic valueof combined intracoronary pressure and blood flow velocity measure-ments after deferral of percutaneous coronary intervention. CatheterCardiovasc Interv 2008;71:291–7.
14. Siebes M, Chamuleau SA, Meuwissen M, Piek JJ, Spaan JA. Influenceof hemodynamic conditions on fractional flow reserve: parametricanalysis of underlying model. Am J Physiol Heart Circ Physiol2002;283:H1462–70.
15. Meuwissen M, Chamuleau SA, Siebes M, et al. Role of variability inmicrovascular resistance on fractional flow reserve and coronary blood
flow velocity reserve in intermediate coronary lesions. Circulation2001;103:184–7.
6. Verhoeff BJ, Siebes M, Meuwissen M, et al. Influence of percutaneouscoronary intervention on coronary microvascular resistance index.Circulation 2005;111:76–82.
7. DeLong ER, DeLong DM, Clarke-Pearson DL. Comparing the areasunder two or more correlated receiver operating characteristic curves: anonparametric approach. Biometrics 1988;44:837–45.
8. Petraco R, Escaned J, Sen S, et al. Classification performance ofinstantaneous wave-free ratio (iFR) and fractional flow reserve in aclinical population of intermediate coronary stenoses: results of theADVISE registry. EuroIntervention 2012 Aug 25 [E-Pub ahead ofprint].
9. Park JJ, Yang HM, Park KW, et al. Diagnostic performance of a novelindex, the instantaneous wave-free ratio (iFR), for the detection offunctionally significant coronary artery stenosis. EuroIntervention2012;130;8.
0. De Bruyne B, Baudhuin T, Melin JA, et al. Coronary flow reservecalculated from pressure measurements in humans. Validation withpositron emission tomography. Circulation 1994;89:1013–22.
1. Pijls NH, De Bruyne B, Peels K, et al. Measurement of fractional flowreserve to assess the functional severity of coronary-artery stenoses.N Engl J Med 1996;334:1703–8.
2. Gould KL, Lipscomb K, Hamilton GW. Physiologic basis for assess-ing critical coronary stenosis. Instantaneous flow response and regionaldistribution during coronary hyperemia as measures of coronary flowreserve. Am J Cardiol 1974;33:87–94.
3. Uren NG, Melin JA, De Bruyne B, Wijns W, Baudhuin T, CamiciPG. Relation between myocardial blood flow and the severity ofcoronary-artery stenosis. N Engl J Med 1994;330:1782–8.
4. Vinereanu D, Fraser AG, Robinson M, Lee A, Tweddel A. Adenosineprovokes diastolic dysfunction in microvascular angina. Postgrad MedJ 2002;78:40–2.
5. Chamuleau SA, Siebes M, Meuwissen M, Koch KT, Spaan JA, PiekJJ. Association between coronary lesion severity and distal microvas-cular resistance in patients with coronary artery disease. Am J PhysiolHeart Circ Physiol 2003;285:H2194–200.
6. Bech GJ, De Bruyne B, Pijls NH, et al. Fractional flow reserve todetermine the appropriateness of angioplasty in moderate coronarystenosis: a randomized trial. Circulation 2001;103:2928–34.
7. Bland JM, Altman DG. Correlation in restricted ranges of data. BMJ2011;342:d556.
8. Van de Hoef TP, Nolte F, Damman P, et al. Diagnostic accuracy ofcombined intracoronary pressure and flow velocity information duringbaseline conditions: adenosine-free assessment of functional coronarylesion severity. Circ Cardiovasc Interv 2012;5:508–14.
9. DeLuca G, Venegoni L, Iorio S, Giuliani L, Marino P. Effects ofincreasing doses of intracoronary adenosine on the assessment offractional flow reserve. J Am Coll Cardiol Intv 2011;4:1079–84.
0. Spaan JA, Piek JJ, Hoffman JI, Siebes M. Physiological basis ofclinically used coronary hemodynamic indices. Circulation 2006;113:446–55.
1. Kleiman NS. Bringing it all together: integration of physiology withanatomy during cardiac catheterization. J Am Coll Cardiol 2011;58:1219–21.
2. Pijls NH, Tonino PA. The crux of maximum hyperemia: the lastremaining barrier for routine use of fractional flow reserve. J Am CollCardiol Intv 2011;4:1093–5.
Key Words: adenosine y coronary stenosis y fractional flow reserve yrevascularization.