diagnostic value of serum procalcitonin, lactate, and … · 1 department of bioinformatics and...
TRANSCRIPT
Submitted 3 August 2017Accepted 6 November 2017Published 27 November 2017
Corresponding authorsVictor C. Kok, [email protected] Horng,[email protected]
Academic editorSteven Tong
Additional Information andDeclarations can be found onpage 17
DOI 10.7717/peerj.4094
Copyright2017 Lin et al.
Distributed underCreative Commons CC-BY 4.0
OPEN ACCESS
Diagnostic value of serum procalcitonin,lactate, and high-sensitivity C-reactiveprotein for predicting bacteremia in adultpatients in the emergency departmentChiung-Tsung Lin1,2, Jang-Jih Lu3,4, Yu-Ching Chen1,5, Victor C. Kok1,5,6 andJorng-Tzong Horng1,5,7
1Department of Bioinformatics and Medical Engineering, Asia University Taiwan, Taichung, Taiwan2Department of Laboratory Medicine, China Medical University Hospital, Taichung, Taiwan3Department of Laboratory Medicine, Chang Gung Memorial Hospital at Linkou, Taoyuan, Taiwan4Department of Medical Biotechnology and Laboratory Science, College of Medicine, Chang Gung University,Taoyuan, Taiwan
5Disease Informatics Research Group, Asia University Taiwan, Taichung, Taiwan6Department of Internal Medicine, Kuang Tien General Hospital, Taichung, Taiwan7Department of Computer Science and Information Engineering, National Central University, Taoyuan,Taiwan
ABSTRACTBackground. Few studies compared the diagnostic value of procalcitonin with acombination of other tests including lactate and high-sensitivity C-reactive proteinin the prediction of pathogenic bacteremia in emergency department adult patients.Methods.We performed a retrospective study assessing the differences in performancesof procalcitonin at a cutoff of 0.5 ng/mL, lactate at a cutoff of 19.8 mg/dL, high-sensitivity C-reactive protein at a cutoff of 0.8 mg/dL and their combinations forpredicting bacteremia in emergency department adult patients. Sensitivity, specificity,overall accuracy, positive-test and negative-test likelihood, and diagnostic odds ratiowith 95% confidence interval for each test combinationwere calculated for comparison.The receiver operating characteristic curve for every single test were compared usingDeLong’s method. We also performed a sensitivity analysis in two expanded patientcohorts to assess the discriminative ability of procalcitonin or test combination.Results. A total of 886 patients formed the initial patient cohort. The area under thereceiver operating characteristic curve for discriminating positive blood culture was:procalcitonin = 0.72 (95% CI [0.69–0.75]) with a derived optimal cutoff at 3.9 ng/mL;lactate 0.69 (0.66–0.72)with an optimal cutoff at 17.9mg/dL; high-sensitivity C-reactiveprotein 0.56 (0.53–0.59) with an optimal cutoff of 13mg/dL; with pairwise comparisonsshowing statistically significant better performance of either procalcitonin or lactateoutperforming high-sensitivity C-reactive protein. To predict positive blood cultures,the diagnostic odds ratio for procalcitonin was 3.64 (95% CI [2.46–5.51]), lactate 2.93(2.09–4.14), and high-sensitivity C-reactive protein 0.91 (0.55–1.55; P = 0.79). Aboutcombined tests, the diagnostic odds ratio for procalcitonin and lactate increases were3.98 (95% CI [2.81–5.63]) for positive blood culture prediction. Elevated procalcitoninlevel rendered a six-fold increased risk of positive gram-negative bacteremia witha diagnostic odds ratio of 6.44 (95% CI [3.65–12.15]), which showed no furtherimprovement in any test combinations. In the sensitivity analysis, as a single test
How to cite this article Lin et al. (2017), Diagnostic value of serum procalcitonin, lactate, and high-sensitivity C-reactive protein for pre-dicting bacteremia in adult patients in the emergency department. PeerJ 5:e4094; DOI 10.7717/peerj.4094
to predict unspecified, gram-negative and gram-positive bacteremia, procalcitoninperformed even better in an expanded cohort of 2,234 adult patients in terms of thediagnostic odds ratio.Discussions. For adult emergency patients, procalcitonin has an acceptable dis-criminative ability for bacterial blood culture and a better discriminative ability forgram-negative bacteremia when compared with lactate and high-sensitivity C-reactiveprotein. High-sensitivity C-reactive protein at a cutoff of 0.8 mg/dL performed poorlyfor the prediction of positive bacterial culture.
Subjects Emergency and Critical Care, Infectious Diseases, Internal Medicine, PathologyKeywords Procalcitonin, Lactate, Hypersensitivity C-reactive protein, Bacterial sepsis, Diagnosticodds ratio, Septic workup, Emergency department
INTRODUCTIONBacterial bloodstream infection has been reported to have a rapid disease course, especiallyin patients admitted to the emergency department (ED) (Lindvig et al., 2016), and it isdifficult to make an immediate and accurate diagnosis of bacteremia according to theclinical manifestations of patients. Sepsis is not easy to detect in the early phase, as theclinical manifestation could be latent or an exacerbation of a pre-existing condition,resulting in diagnostic difficulty (Castelli et al., 2004). Moreover, the mortality rate ofblood-cultured patients in the medical ED has been reported to be high. In a cohortstudy, among patients who had blood cultures performed within 72 h of arrival to themedical ED, the overall 30-day mortality rate was 11% (Lindvig et al., 2016). The samestudy used a multivariate Cox model and demonstrated that bacteremia was one of theimportant prognostic factors of mortality among blood-cultured patients, with a hazardratio of 1.4 (95% CI [1.1–1.8]). The mortality could be reduced by early detection andinitiation of appropriate antibiotics. The ED of a hospital is the first point of entry forthe majority of emergency patients. Distinguishing bacteremic sepsis from non-infectioussystemic inflammation is very challenging, and blood culture is considered as the standarddiagnostic approach (Riedel, 2012).
However, blood culture, including identification and drug sensitivity testing, requiresat least 12–48 h; therefore, early-stage diagnosis is very important. In the past twodecades, procalcitonin has been adopted for early-stage diagnosis. Procalcitonin is aprecursor hormone of calcitonin. It was found that when the body is stimulated by aninflammatory response, especially bacterial infection, different cells in multiple organssecrete procalcitonin (Linscheid et al., 2003; Nishikura, 1999). Many studies have shownthat procalcitonin has an excellent predictive ability for sepsis (Arora et al., 2017; Kibe,Adams & Barlow, 2011; Nishikawa et al., 2017). Additionally, another study showed thatthere is a risk of bacteremia in patients with acute fever when the procalcitonin level isgreater than 0.5 ng/ml (Kim et al., 2011). However, few studies argued against the usefulnessof procalcitonin for predicting bloodstream infection in certain clinical settings (Aalto etal., 2004; Hoenigl et al., 2014).
Lin et al. (2017), PeerJ, DOI 10.7717/peerj.4094 2/21
Clinically, the combination of the C-reactive protein level and white blood cell countis commonly used as a basis for determining infection (Julian-Jimenez et al., 2015; Leli etal., 2014; Liu et al., 2017; Ljungstrom et al., 2017), although there is a lack of solid evidence.C-reactive protein is a marker of acute inflammation and is associated with non-specificinflammatory responses by the human body to infection or trauma. Blood C-reactiveprotein levels rapidly rise during such events.
Several studies in the past have examined the role in the risk stratification or thediscriminative ability of lactate in the management of the bacterial sepsis in emergencypatients (Freund et al., 2012; Ljungstrom et al., 2017; Shapiro et al., 2005). However, fewstudies have focused on the discriminative power of elevated lactate levels in blood topredict bacteremia in the literature. The results of the tests for procalcitonin, C-reactiveprotein, and lactate can be obtained within 1 h, which may significantly shorten the time ofdecision-making for prescribing appropriate antibiotics if bacteremia is highly suggestedby the results of the above tests, either singly or in combination.
This study focused on the differences in the performances of procalcitonin, lactate, high-sensitivity C-reactive protein (Milone, Kamath & Israelite, 2014; Su et al., 2013;Windgassenet al., 2011;Yildiz et al., 2013) and their combinations for predicting positive blood bacterialculture in adult patients in the ED and analyzed the discriminative ability of these tests topredict positive blood culture for any non-contaminant bacteria, gram-positive bacteria(GPB), and gram-negative bacteria (GNB) (Nishikawa et al., 2016; Wang et al., 2016). Thetest efficiency of single items was analyzed using the area under the receiver operatingcharacteristic (ROC) curve (AUROC) (Alemayehu & Zou, 2012). The method with thegreatest AUROC was used as a judgment standard for the relatively superior methodamong similar methods.
MATERIALS & METHODSCollection of test dataThis study used test data extracted from the dataset of a total of 41,358 blood bacterialculture bottle records (aerobic and anaerobic bottles were counted separately) at the EDof a medical center in central Taiwan between January 1, 2010 and December 31, 2010. Inaddition, the information system of the hospital was used to collect patient test reports,including 7,879 lactate test records, 50,287 high-sensitivity C-reactive protein test records,and 3,037 procalcitonin test records. In total, 886 records with all tests performed in 24 hwere identified after examining the records.
Research ethics and personal information protectionThis study was approved by theMedical Research Department of ChinaMedical UniversityHospital, Taichung, Taiwan (certificate number DMR-99-133). The study populationincluded adult patients who were admitted to the Department of Emergency Medicine ofChinaMedical University Hospital and underwent septic workup in 2010. After identifyingthe study candidates, data files were de-identified. The whole process of data mining anddata manipulation strictly complied with the Taiwan Personal Information Protection Act.The study was classified as an exempt research study (number CMUH106-REC-003) by
Lin et al. (2017), PeerJ, DOI 10.7717/peerj.4094 3/21
the Research Ethics Committee of China Medical University Hospital, Taichung, Taiwan.The Ethics Committee also waived the need for written or verbal informed consent fromthe patients.
Biological measurementsThe medical center used UniCel DXC-800 (Beckman Coulter, Brea, CA, USA) to analyzehigh-sensitivity C-reactive protein, and a value of <0.8 mg/dl was used as the biologicalreference. Traditional C-reactive protein and high-sensitivity C-reactive protein involvethe same protein in the plasma, and they have been shown to represent the same entity(Windgassen et al., 2011). Lactate measurements were also analyzed using DXC-800, witha biological reference range of 4.5–19.8 mg/dl. Procalcitonin testing was performed usinga mini VIDAS (BioMérieux, Marcy-l’Étoile, France) B.R.A.H.M.S procalcitonin analysis(https://www.procalcitonin.com/pct-assays/pct-sensitive-kryptor.html; B.R.A.H.M.S.,Hennigsdorf, Germany). The VIDAS B.R.A.H.M.S procalcitonin is an automated test fordetermining human procalcitonin in human serum or plasma (lithium heparin) using theenzyme-linked fluorescent assay technique. The biological reference is 0.5 ng/ml, and thefunctional sensitivity of the assay is 0.05 ng/ml. Laboratory standard operating procedureswere used for plasma/serum analyses of the above three items. A total of two blood culturesets (each set consists of one aerobic bottle and one anaerobic bottle) for each patient wasconsideredmandatory. The volume of blood drawn for each culture set was 20ml. Bacterialblood culture and analysis were performed using BD BACTECTM 9240 (Becton-DickinsonDiagnostic Instrument Systems, Baltimore, MD, USA). The BD BACTEC blood culturesystem is a fully automated microbiology growth and detection system designed to detectmicrobial growth in blood specimens.
Our research question was to examine the diagnostic value of elevated biomarkers usinga cutoff at the upper limit of reference range (procalcitonin, 0.5 ng/mL; lactate, 19.8 mg/dL;and high-sensitivity C-reactive protein, 0.8 mg/dL) for predicting bacteremia, not to derivean optimal cutoff for each single test for the best discriminative power. However, the bestcutoff would be presented where appropriate when a receiver operating characteristicscurve analysis of a diagnostic biomarker was performed.
Definition of true bacteremiaBlood culture is a standard method for determining bloodstream infections, and cultureresults can be as follows: (1) positive with a pathogen; (2) blood culture contamination,defined as either less than two blood cultures positive for coagulase-negative staphylococcior diphtheroids (catalase-positive gram-positive rods from multiple genera) (Leal Jr, Jones& Gilligan, 2016) or time to positivity for coagulase-negative staphylococci of more than15 h (Schuetz, Mueller & Trampuz, 2007); and (3) negative without the culture of anybacteria from blood after more than 7 days.
True bacteremia was defined as growth of any significant, pathogenic bacterial species inone ormore sets of blood cultures consisting of aerobic and anaerobic bottles. Common skinpathogens often considered as contaminants (namely, coagulase-negative Staphylococci,aerobic and anaerobic diphtheroids, Micrococcus species, Propionibacterium species,
Lin et al. (2017), PeerJ, DOI 10.7717/peerj.4094 4/21
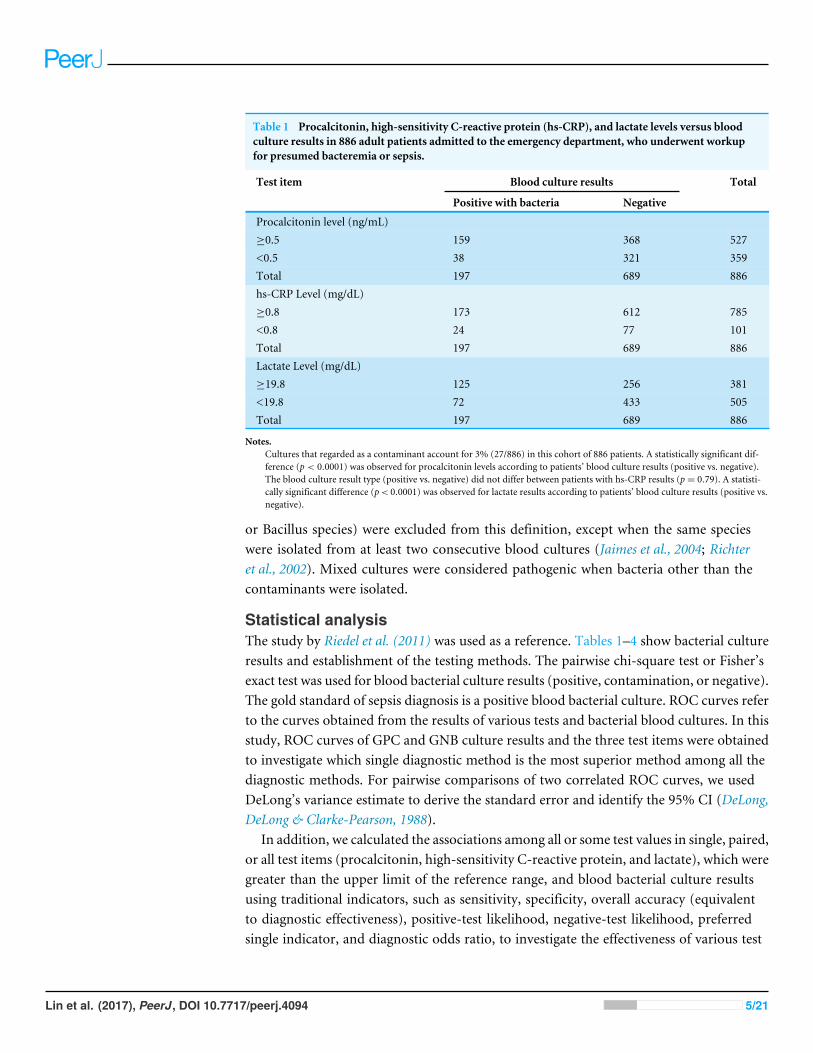
Table 1 Procalcitonin, high-sensitivity C-reactive protein (hs-CRP), and lactate levels versus bloodculture results in 886 adult patients admitted to the emergency department, who underwent workupfor presumed bacteremia or sepsis.
Test item Blood culture results Total
Positive with bacteria Negative
Procalcitonin level (ng/mL)≥0.5 159 368 527<0.5 38 321 359Total 197 689 886hs-CRP Level (mg/dL)≥0.8 173 612 785<0.8 24 77 101Total 197 689 886Lactate Level (mg/dL)≥19.8 125 256 381<19.8 72 433 505Total 197 689 886
Notes.Cultures that regarded as a contaminant account for 3% (27/886) in this cohort of 886 patients. A statistically significant dif-ference (p < 0.0001) was observed for procalcitonin levels according to patients’ blood culture results (positive vs. negative).The blood culture result type (positive vs. negative) did not differ between patients with hs-CRP results (p= 0.79). A statisti-cally significant difference (p< 0.0001) was observed for lactate results according to patients’ blood culture results (positive vs.negative).
or Bacillus species) were excluded from this definition, except when the same specieswere isolated from at least two consecutive blood cultures (Jaimes et al., 2004; Richteret al., 2002). Mixed cultures were considered pathogenic when bacteria other than thecontaminants were isolated.
Statistical analysisThe study by Riedel et al. (2011) was used as a reference. Tables 1–4 show bacterial cultureresults and establishment of the testing methods. The pairwise chi-square test or Fisher’sexact test was used for blood bacterial culture results (positive, contamination, or negative).The gold standard of sepsis diagnosis is a positive blood bacterial culture. ROC curves referto the curves obtained from the results of various tests and bacterial blood cultures. In thisstudy, ROC curves of GPC and GNB culture results and the three test items were obtainedto investigate which single diagnostic method is the most superior method among all thediagnostic methods. For pairwise comparisons of two correlated ROC curves, we usedDeLong’s variance estimate to derive the standard error and identify the 95% CI (DeLong,DeLong & Clarke-Pearson, 1988).
In addition, we calculated the associations among all or some test values in single, paired,or all test items (procalcitonin, high-sensitivity C-reactive protein, and lactate), which weregreater than the upper limit of the reference range, and blood bacterial culture resultsusing traditional indicators, such as sensitivity, specificity, overall accuracy (equivalentto diagnostic effectiveness), positive-test likelihood, negative-test likelihood, preferredsingle indicator, and diagnostic odds ratio, to investigate the effectiveness of various test
Lin et al. (2017), PeerJ, DOI 10.7717/peerj.4094 5/21
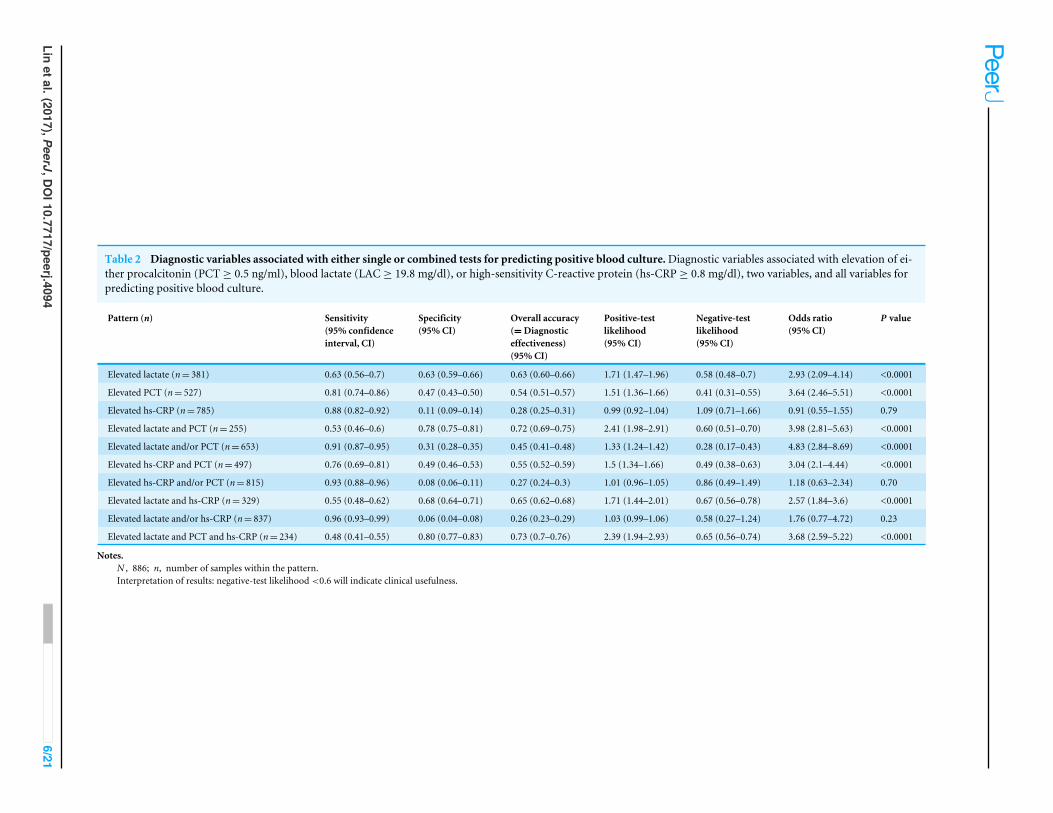
Table 2 Diagnostic variables associated with either single or combined tests for predicting positive blood culture.Diagnostic variables associated with elevation of ei-ther procalcitonin (PCT ≥ 0.5 ng/ml), blood lactate (LAC ≥ 19.8 mg/dl), or high-sensitivity C-reactive protein (hs-CRP ≥ 0.8 mg/dl), two variables, and all variables forpredicting positive blood culture.
Pattern (n) Sensitivity(95% confidenceinterval, CI)
Specificity(95% CI)
Overall accuracy(=Diagnosticeffectiveness)(95% CI)
Positive-testlikelihood(95% CI)
Negative-testlikelihood(95% CI)
Odds ratio(95% CI)
P value
Elevated lactate (n= 381) 0.63 (0.56–0.7) 0.63 (0.59–0.66) 0.63 (0.60–0.66) 1.71 (1.47–1.96) 0.58 (0.48–0.7) 2.93 (2.09–4.14) <0.0001
Elevated PCT (n= 527) 0.81 (0.74–0.86) 0.47 (0.43–0.50) 0.54 (0.51–0.57) 1.51 (1.36–1.66) 0.41 (0.31–0.55) 3.64 (2.46–5.51) <0.0001
Elevated hs-CRP (n= 785) 0.88 (0.82–0.92) 0.11 (0.09–0.14) 0.28 (0.25–0.31) 0.99 (0.92–1.04) 1.09 (0.71–1.66) 0.91 (0.55–1.55) 0.79
Elevated lactate and PCT (n= 255) 0.53 (0.46–0.6) 0.78 (0.75–0.81) 0.72 (0.69–0.75) 2.41 (1.98–2.91) 0.60 (0.51–0.70) 3.98 (2.81–5.63) <0.0001
Elevated lactate and/or PCT (n= 653) 0.91 (0.87–0.95) 0.31 (0.28–0.35) 0.45 (0.41–0.48) 1.33 (1.24–1.42) 0.28 (0.17–0.43) 4.83 (2.84–8.69) <0.0001
Elevated hs-CRP and PCT (n= 497) 0.76 (0.69–0.81) 0.49 (0.46–0.53) 0.55 (0.52–0.59) 1.5 (1.34–1.66) 0.49 (0.38–0.63) 3.04 (2.1–4.44) <0.0001
Elevated hs-CRP and/or PCT (n= 815) 0.93 (0.88–0.96) 0.08 (0.06–0.11) 0.27 (0.24–0.3) 1.01 (0.96–1.05) 0.86 (0.49–1.49) 1.18 (0.63–2.34) 0.70
Elevated lactate and hs-CRP (n= 329) 0.55 (0.48–0.62) 0.68 (0.64–0.71) 0.65 (0.62–0.68) 1.71 (1.44–2.01) 0.67 (0.56–0.78) 2.57 (1.84–3.6) <0.0001
Elevated lactate and/or hs-CRP (n= 837) 0.96 (0.93–0.99) 0.06 (0.04–0.08) 0.26 (0.23–0.29) 1.03 (0.99–1.06) 0.58 (0.27–1.24) 1.76 (0.77–4.72) 0.23
Elevated lactate and PCT and hs-CRP (n= 234) 0.48 (0.41–0.55) 0.80 (0.77–0.83) 0.73 (0.7–0.76) 2.39 (1.94–2.93) 0.65 (0.56–0.74) 3.68 (2.59–5.22) <0.0001
Notes.N , 886; n, number of samples within the pattern.Interpretation of results: negative-test likelihood <0.6 will indicate clinical usefulness.
Linetal.(2017),PeerJ,D
OI10.7717/peerj.4094
6/21
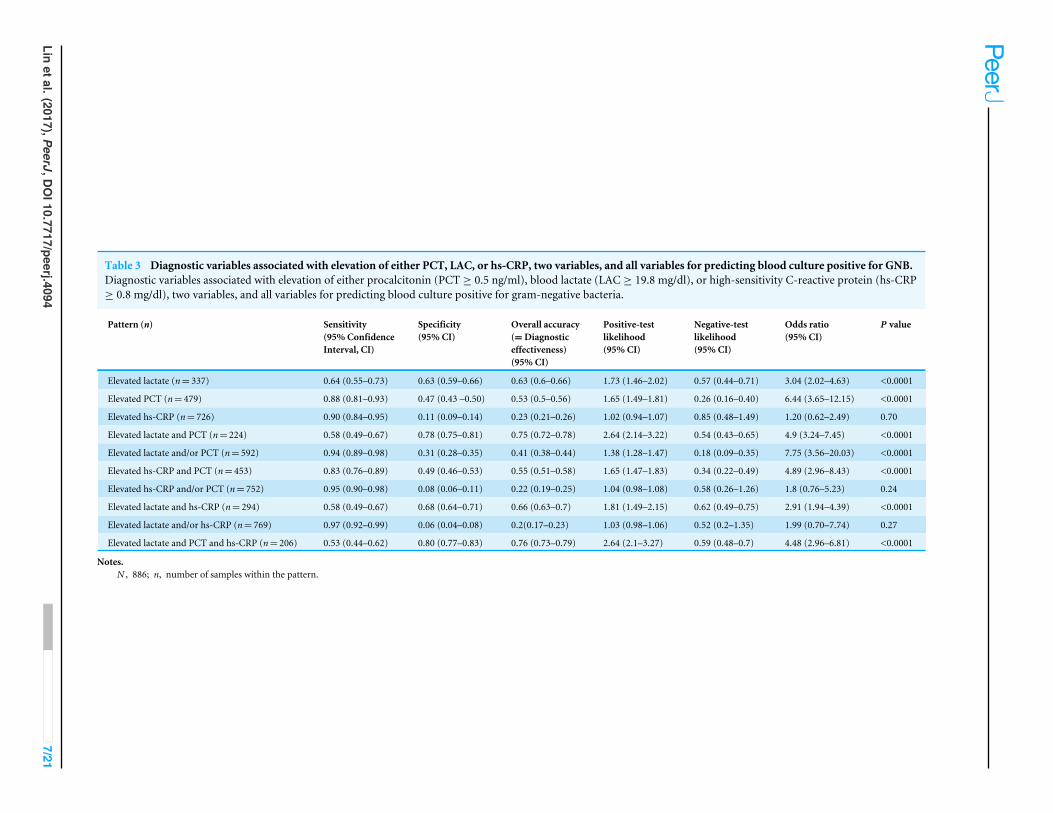
Table 3 Diagnostic variables associated with elevation of either PCT, LAC, or hs-CRP, two variables, and all variables for predicting blood culture positive for GNB.Diagnostic variables associated with elevation of either procalcitonin (PCT ≥ 0.5 ng/ml), blood lactate (LAC ≥ 19.8 mg/dl), or high-sensitivity C-reactive protein (hs-CRP≥ 0.8 mg/dl), two variables, and all variables for predicting blood culture positive for gram-negative bacteria.
Pattern (n) Sensitivity(95% ConfidenceInterval, CI)
Specificity(95% CI)
Overall accuracy(=Diagnosticeffectiveness)(95% CI)
Positive-testlikelihood(95% CI)
Negative-testlikelihood(95% CI)
Odds ratio(95% CI)
P value
Elevated lactate (n= 337) 0.64 (0.55–0.73) 0.63 (0.59–0.66) 0.63 (0.6–0.66) 1.73 (1.46–2.02) 0.57 (0.44–0.71) 3.04 (2.02–4.63) <0.0001
Elevated PCT (n= 479) 0.88 (0.81–0.93) 0.47 (0.43 –0.50) 0.53 (0.5–0.56) 1.65 (1.49–1.81) 0.26 (0.16–0.40) 6.44 (3.65–12.15) <0.0001
Elevated hs-CRP (n= 726) 0.90 (0.84–0.95) 0.11 (0.09–0.14) 0.23 (0.21–0.26) 1.02 (0.94–1.07) 0.85 (0.48–1.49) 1.20 (0.62–2.49) 0.70
Elevated lactate and PCT (n= 224) 0.58 (0.49–0.67) 0.78 (0.75–0.81) 0.75 (0.72–0.78) 2.64 (2.14–3.22) 0.54 (0.43–0.65) 4.9 (3.24–7.45) <0.0001
Elevated lactate and/or PCT (n= 592) 0.94 (0.89–0.98) 0.31 (0.28–0.35) 0.41 (0.38–0.44) 1.38 (1.28–1.47) 0.18 (0.09–0.35) 7.75 (3.56–20.03) <0.0001
Elevated hs-CRP and PCT (n= 453) 0.83 (0.76–0.89) 0.49 (0.46–0.53) 0.55 (0.51–0.58) 1.65 (1.47–1.83) 0.34 (0.22–0.49) 4.89 (2.96–8.43) <0.0001
Elevated hs-CRP and/or PCT (n= 752) 0.95 (0.90–0.98) 0.08 (0.06–0.11) 0.22 (0.19–0.25) 1.04 (0.98–1.08) 0.58 (0.26–1.26) 1.8 (0.76–5.23) 0.24
Elevated lactate and hs-CRP (n= 294) 0.58 (0.49–0.67) 0.68 (0.64–0.71) 0.66 (0.63–0.7) 1.81 (1.49–2.15) 0.62 (0.49–0.75) 2.91 (1.94–4.39) <0.0001
Elevated lactate and/or hs-CRP (n= 769) 0.97 (0.92–0.99) 0.06 (0.04–0.08) 0.2(0.17–0.23) 1.03 (0.98–1.06) 0.52 (0.2–1.35) 1.99 (0.70–7.74) 0.27
Elevated lactate and PCT and hs-CRP (n= 206) 0.53 (0.44–0.62) 0.80 (0.77–0.83) 0.76 (0.73–0.79) 2.64 (2.1–3.27) 0.59 (0.48–0.7) 4.48 (2.96–6.81) <0.0001
Notes.N , 886; n, number of samples within the pattern.
Linetal.(2017),PeerJ,D
OI10.7717/peerj.4094
7/21
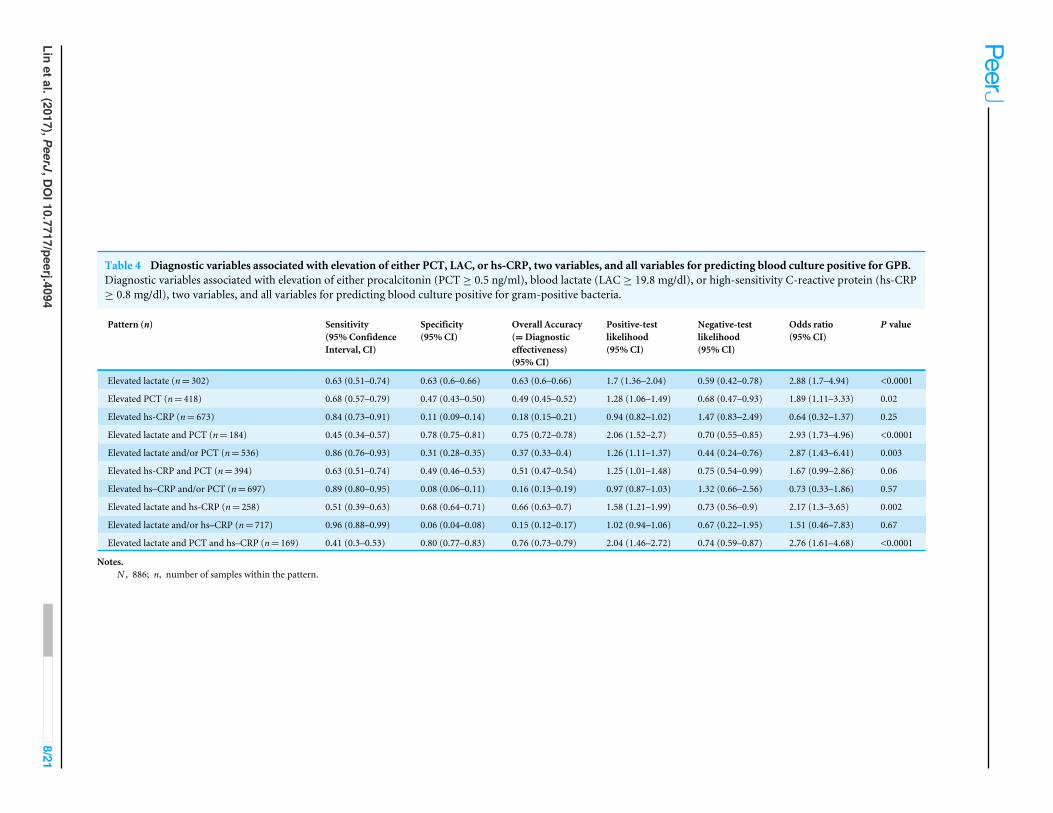
Table 4 Diagnostic variables associated with elevation of either PCT, LAC, or hs-CRP, two variables, and all variables for predicting blood culture positive for GPB.Diagnostic variables associated with elevation of either procalcitonin (PCT ≥ 0.5 ng/ml), blood lactate (LAC ≥ 19.8 mg/dl), or high-sensitivity C-reactive protein (hs-CRP≥ 0.8 mg/dl), two variables, and all variables for predicting blood culture positive for gram-positive bacteria.
Pattern (n) Sensitivity(95% ConfidenceInterval, CI)
Specificity(95% CI)
Overall Accuracy(=Diagnosticeffectiveness)(95% CI)
Positive-testlikelihood(95% CI)
Negative-testlikelihood(95% CI)
Odds ratio(95% CI)
P value
Elevated lactate (n= 302) 0.63 (0.51–0.74) 0.63 (0.6–0.66) 0.63 (0.6–0.66) 1.7 (1.36–2.04) 0.59 (0.42–0.78) 2.88 (1.7–4.94) <0.0001
Elevated PCT (n= 418) 0.68 (0.57–0.79) 0.47 (0.43–0.50) 0.49 (0.45–0.52) 1.28 (1.06–1.49) 0.68 (0.47–0.93) 1.89 (1.11–3.33) 0.02
Elevated hs-CRP (n= 673) 0.84 (0.73–0.91) 0.11 (0.09–0.14) 0.18 (0.15–0.21) 0.94 (0.82–1.02) 1.47 (0.83–2.49) 0.64 (0.32–1.37) 0.25
Elevated lactate and PCT (n= 184) 0.45 (0.34–0.57) 0.78 (0.75–0.81) 0.75 (0.72–0.78) 2.06 (1.52–2.7) 0.70 (0.55–0.85) 2.93 (1.73–4.96) <0.0001
Elevated lactate and/or PCT (n= 536) 0.86 (0.76–0.93) 0.31 (0.28–0.35) 0.37 (0.33–0.4) 1.26 (1.11–1.37) 0.44 (0.24–0.76) 2.87 (1.43–6.41) 0.003
Elevated hs-CRP and PCT (n= 394) 0.63 (0.51–0.74) 0.49 (0.46–0.53) 0.51 (0.47–0.54) 1.25 (1.01–1.48) 0.75 (0.54–0.99) 1.67 (0.99–2.86) 0.06
Elevated hs–CRP and/or PCT (n= 697) 0.89 (0.80–0.95) 0.08 (0.06–0.11) 0.16 (0.13–0.19) 0.97 (0.87–1.03) 1.32 (0.66–2.56) 0.73 (0.33–1.86) 0.57
Elevated lactate and hs-CRP (n= 258) 0.51 (0.39–0.63) 0.68 (0.64–0.71) 0.66 (0.63–0.7) 1.58 (1.21–1.99) 0.73 (0.56–0.9) 2.17 (1.3–3.65) 0.002
Elevated lactate and/or hs–CRP (n= 717) 0.96 (0.88–0.99) 0.06 (0.04–0.08) 0.15 (0.12–0.17) 1.02 (0.94–1.06) 0.67 (0.22–1.95) 1.51 (0.46–7.83) 0.67
Elevated lactate and PCT and hs–CRP (n= 169) 0.41 (0.3–0.53) 0.80 (0.77–0.83) 0.76 (0.73–0.79) 2.04 (1.46–2.72) 0.74 (0.59–0.87) 2.76 (1.61–4.68) <0.0001
Notes.N , 886; n, number of samples within the pattern.
Linetal.(2017),PeerJ,D
OI10.7717/peerj.4094
8/21
combinations. A two-sided P-value <0.05 was considered statistically significant. Statisticalanalyses were performed using the StatsDirect statistical software.
We also performed a sensitivity analysis that assessed the discriminative ability of a testor test combination in an expanded cohort of patients from the original dataset, in whomonly the procalcitonin test or two tests (procalcitonin + lactate) had been performedin addition to standard blood culture. The diagnostic performance results from thesetwo expanded cohorts of patients are displayed along with the initial research cohort of886 patients for comparison purposes. Since the group sizes are important for the testperformance, the prevalence of positive blood culture in the two expanded cohorts are asfollows: the expanded cohort that consisted of 923 patients who had procalcitonin, lactateand blood cultures taken on the same day had a prevalence of true bacteremia of 21.9%(202+/923). Another expanded cohort of 2,234 patients who had procalcitonin test resultand blood culture results had a prevalence of true bacteremia at 15.5% (347+/2,234).
RESULTSBetween January 2010 and December 2010, a total of 886 adult patients admitted to the EDunderwent all three tests (procalcitonin, lactate, and high-sensitivity C-reactive protein)and at least two sets of blood culture within 24 h of the workup window. In this EDcohort, 22.2% (197/886) of the patients showed positive results on blood culture. Bloodcultures that had contaminants were noted in 3.05% (27/886) of the patients (Table 1). Thecut-off values selected for the three tests were above the upper limit of the normal range(≥0.5 ng/ml for procalcitonin,≥19.8 mg/dl for lactate, and≥0.8 mg/dl for high-sensitivityC-reactive protein).
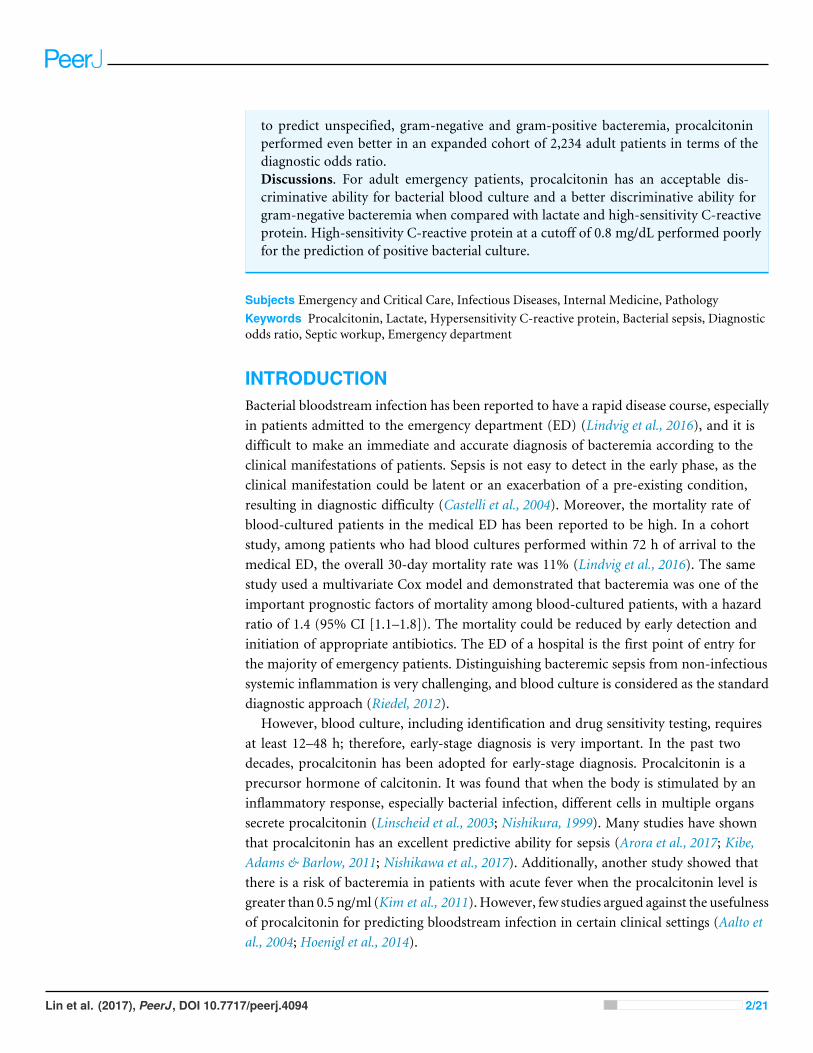
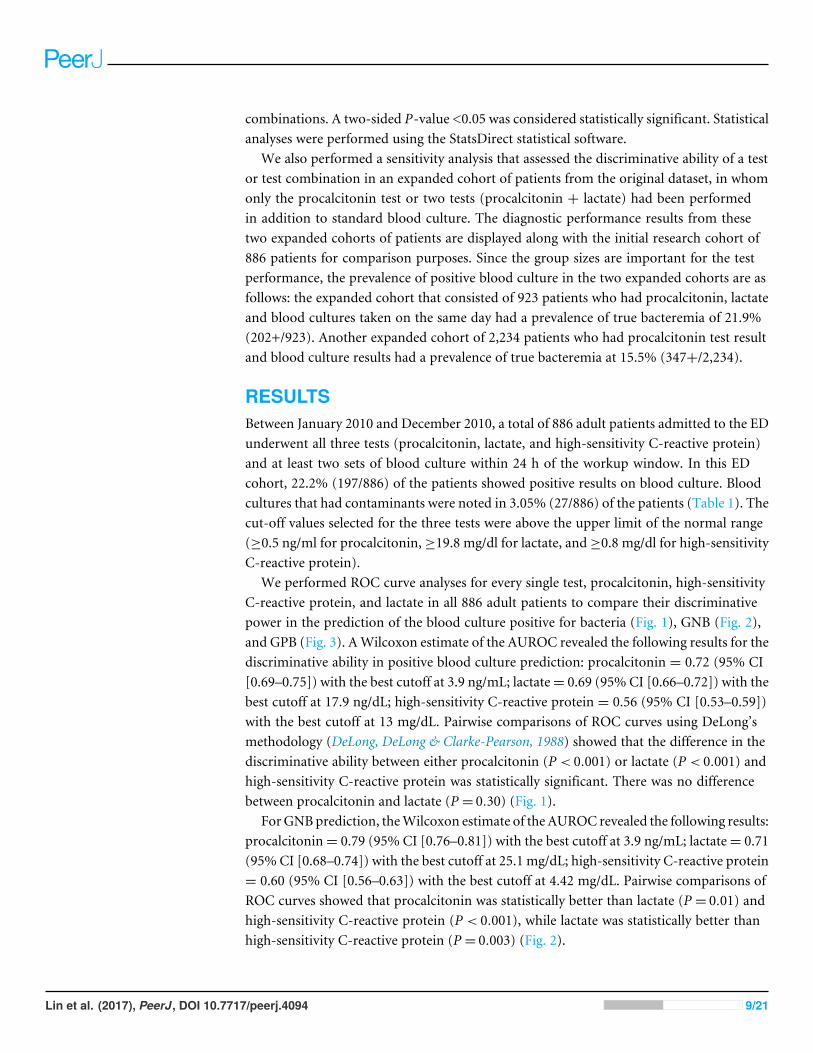
We performed ROC curve analyses for every single test, procalcitonin, high-sensitivityC-reactive protein, and lactate in all 886 adult patients to compare their discriminativepower in the prediction of the blood culture positive for bacteria (Fig. 1), GNB (Fig. 2),and GPB (Fig. 3). AWilcoxon estimate of the AUROC revealed the following results for thediscriminative ability in positive blood culture prediction: procalcitonin = 0.72 (95% CI[0.69–0.75]) with the best cutoff at 3.9 ng/mL; lactate= 0.69 (95% CI [0.66–0.72]) with thebest cutoff at 17.9 ng/dL; high-sensitivity C-reactive protein = 0.56 (95% CI [0.53–0.59])with the best cutoff at 13 mg/dL. Pairwise comparisons of ROC curves using DeLong’smethodology (DeLong, DeLong & Clarke-Pearson, 1988) showed that the difference in thediscriminative ability between either procalcitonin (P < 0.001) or lactate (P < 0.001) andhigh-sensitivity C-reactive protein was statistically significant. There was no differencebetween procalcitonin and lactate (P = 0.30) (Fig. 1).
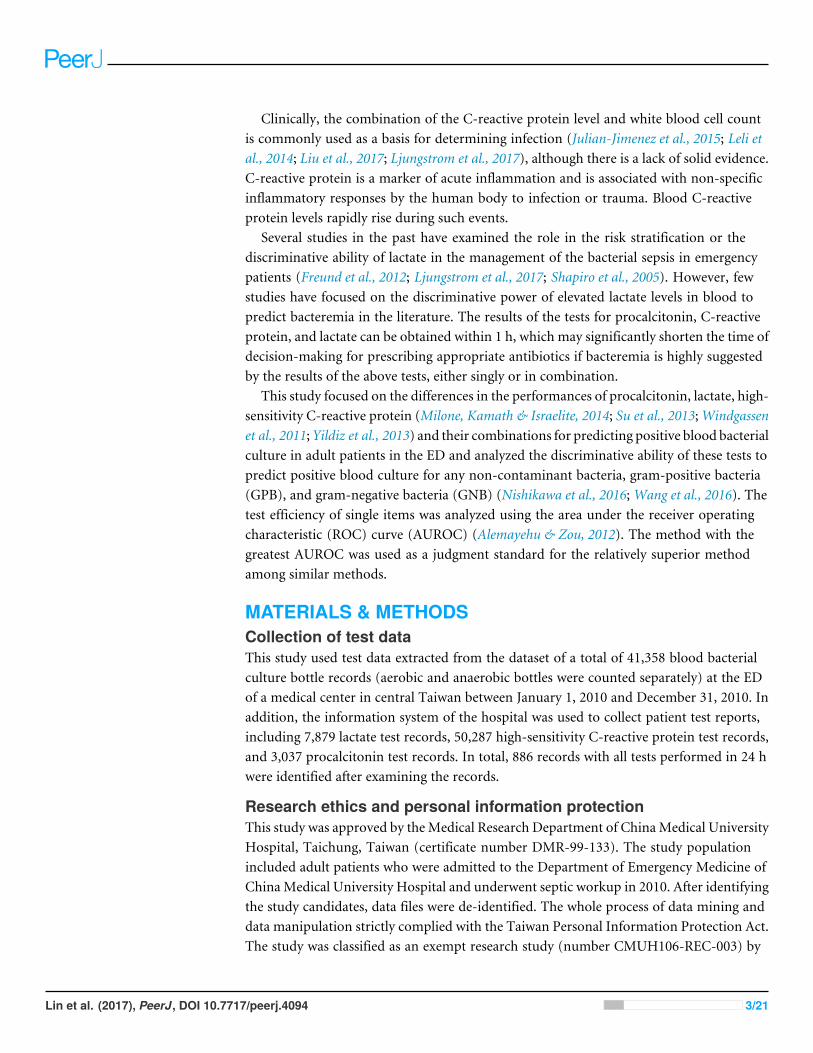
ForGNBprediction, theWilcoxon estimate of the AUROC revealed the following results:procalcitonin= 0.79 (95% CI [0.76–0.81]) with the best cutoff at 3.9 ng/mL; lactate= 0.71(95% CI [0.68–0.74]) with the best cutoff at 25.1 mg/dL; high-sensitivity C-reactive protein= 0.60 (95% CI [0.56–0.63]) with the best cutoff at 4.42 mg/dL. Pairwise comparisons ofROC curves showed that procalcitonin was statistically better than lactate (P = 0.01) andhigh-sensitivity C-reactive protein (P < 0.001), while lactate was statistically better thanhigh-sensitivity C-reactive protein (P = 0.003) (Fig. 2).
Lin et al. (2017), PeerJ, DOI 10.7717/peerj.4094 9/21
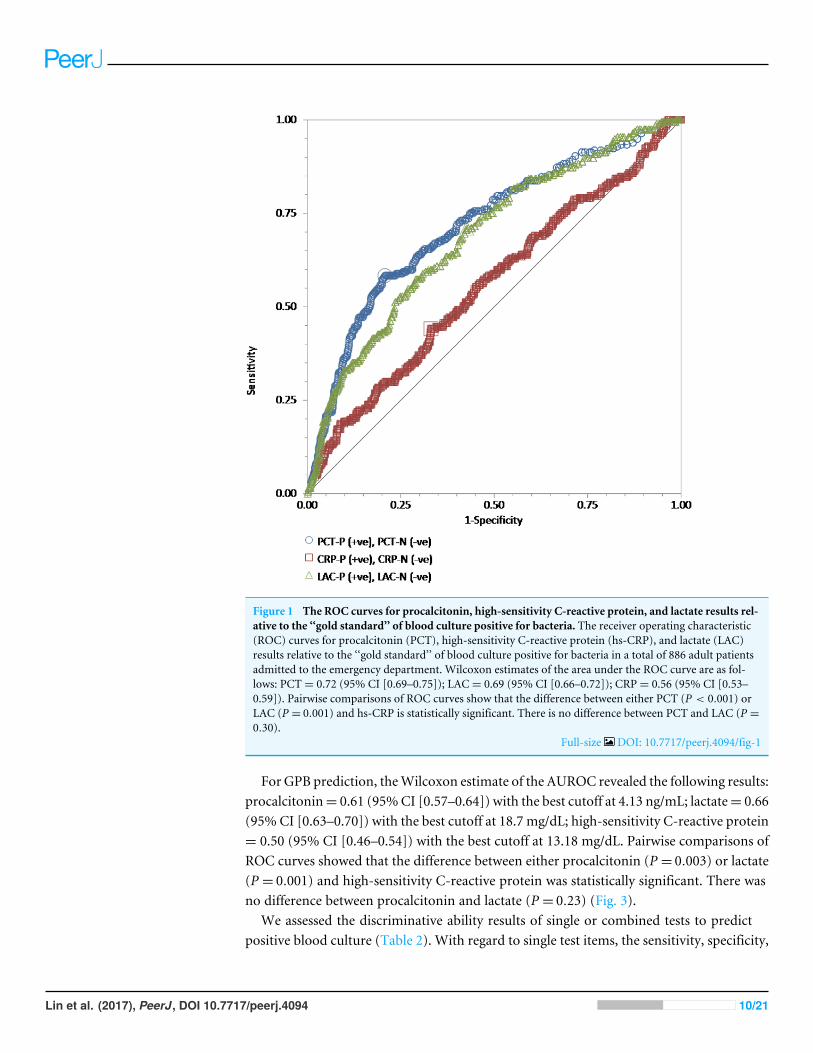
Figure 1 The ROC curves for procalcitonin, high-sensitivity C-reactive protein, and lactate results rel-ative to the ‘‘gold standard’’ of blood culture positive for bacteria. The receiver operating characteristic(ROC) curves for procalcitonin (PCT), high-sensitivity C-reactive protein (hs-CRP), and lactate (LAC)results relative to the ‘‘gold standard’’ of blood culture positive for bacteria in a total of 886 adult patientsadmitted to the emergency department. Wilcoxon estimates of the area under the ROC curve are as fol-lows: PCT= 0.72 (95% CI [0.69–0.75]); LAC= 0.69 (95% CI [0.66–0.72]); CRP= 0.56 (95% CI [0.53–0.59]). Pairwise comparisons of ROC curves show that the difference between either PCT (P < 0.001) orLAC (P = 0.001) and hs-CRP is statistically significant. There is no difference between PCT and LAC (P =0.30).
Full-size DOI: 10.7717/peerj.4094/fig-1
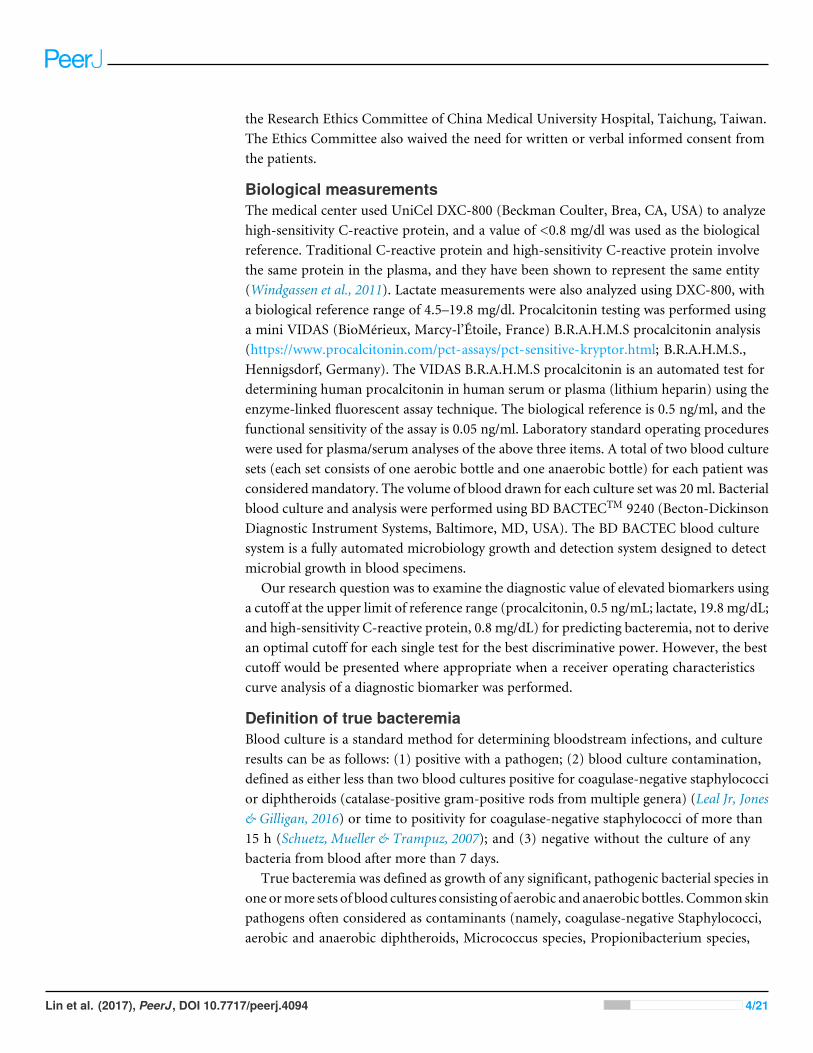
For GPB prediction, theWilcoxon estimate of the AUROC revealed the following results:procalcitonin= 0.61 (95%CI [0.57–0.64]) with the best cutoff at 4.13 ng/mL; lactate= 0.66(95% CI [0.63–0.70]) with the best cutoff at 18.7 mg/dL; high-sensitivity C-reactive protein= 0.50 (95% CI [0.46–0.54]) with the best cutoff at 13.18 mg/dL. Pairwise comparisons ofROC curves showed that the difference between either procalcitonin (P = 0.003) or lactate(P = 0.001) and high-sensitivity C-reactive protein was statistically significant. There wasno difference between procalcitonin and lactate (P = 0.23) (Fig. 3).
We assessed the discriminative ability results of single or combined tests to predictpositive blood culture (Table 2). With regard to single test items, the sensitivity, specificity,
Lin et al. (2017), PeerJ, DOI 10.7717/peerj.4094 10/21
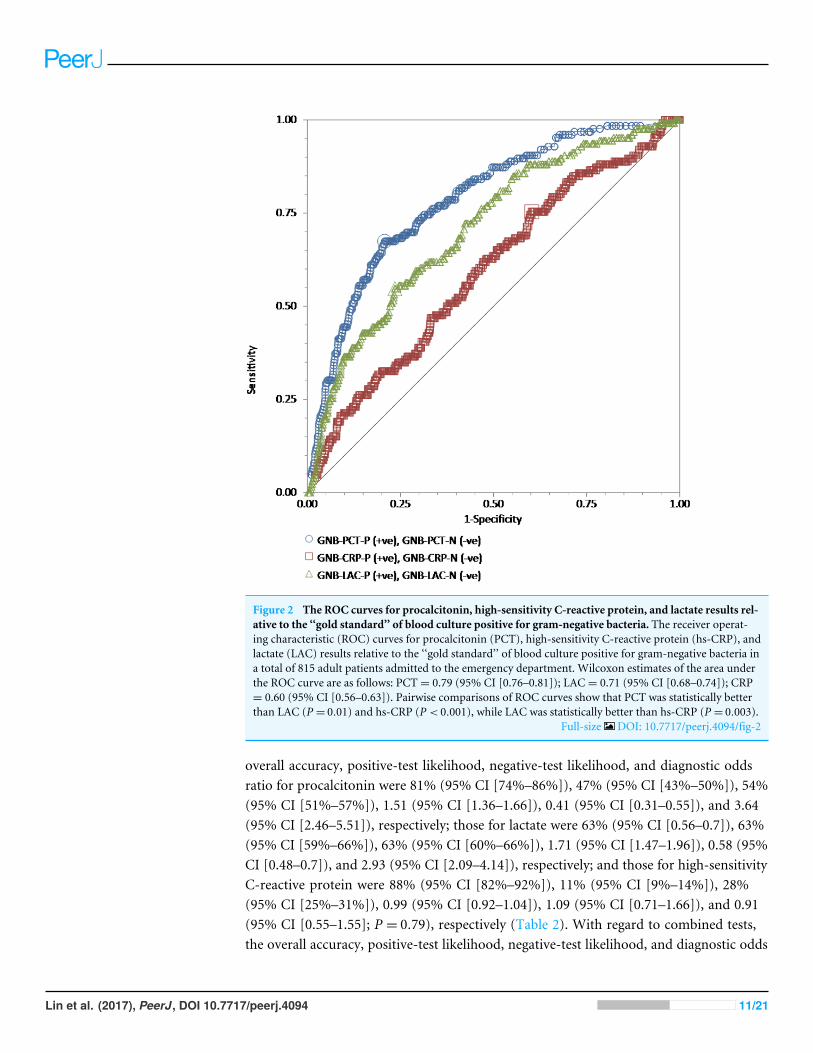
Figure 2 The ROC curves for procalcitonin, high-sensitivity C-reactive protein, and lactate results rel-ative to the ‘‘gold standard’’ of blood culture positive for gram-negative bacteria. The receiver operat-ing characteristic (ROC) curves for procalcitonin (PCT), high-sensitivity C-reactive protein (hs-CRP), andlactate (LAC) results relative to the ‘‘gold standard’’ of blood culture positive for gram-negative bacteria ina total of 815 adult patients admitted to the emergency department. Wilcoxon estimates of the area underthe ROC curve are as follows: PCT= 0.79 (95% CI [0.76–0.81]); LAC= 0.71 (95% CI [0.68–0.74]); CRP= 0.60 (95% CI [0.56–0.63]). Pairwise comparisons of ROC curves show that PCT was statistically betterthan LAC (P = 0.01) and hs-CRP (P < 0.001), while LAC was statistically better than hs-CRP (P = 0.003).
Full-size DOI: 10.7717/peerj.4094/fig-2
overall accuracy, positive-test likelihood, negative-test likelihood, and diagnostic oddsratio for procalcitonin were 81% (95% CI [74%–86%]), 47% (95% CI [43%–50%]), 54%(95% CI [51%–57%]), 1.51 (95% CI [1.36–1.66]), 0.41 (95% CI [0.31–0.55]), and 3.64(95% CI [2.46–5.51]), respectively; those for lactate were 63% (95% CI [0.56–0.7]), 63%(95% CI [59%–66%]), 63% (95% CI [60%–66%]), 1.71 (95% CI [1.47–1.96]), 0.58 (95%CI [0.48–0.7]), and 2.93 (95% CI [2.09–4.14]), respectively; and those for high-sensitivityC-reactive protein were 88% (95% CI [82%–92%]), 11% (95% CI [9%–14%]), 28%(95% CI [25%–31%]), 0.99 (95% CI [0.92–1.04]), 1.09 (95% CI [0.71–1.66]), and 0.91(95% CI [0.55–1.55]; P = 0.79), respectively (Table 2). With regard to combined tests,the overall accuracy, positive-test likelihood, negative-test likelihood, and diagnostic odds
Lin et al. (2017), PeerJ, DOI 10.7717/peerj.4094 11/21
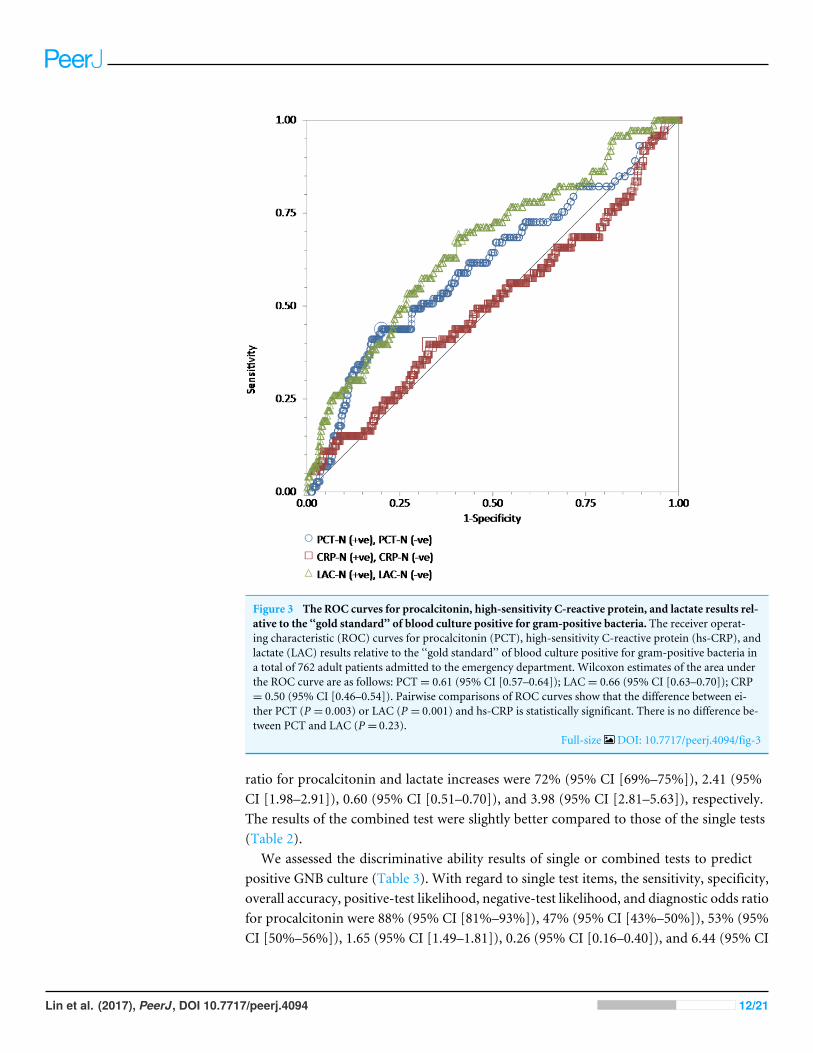
Figure 3 The ROC curves for procalcitonin, high-sensitivity C-reactive protein, and lactate results rel-ative to the ‘‘gold standard’’ of blood culture positive for gram-positive bacteria. The receiver operat-ing characteristic (ROC) curves for procalcitonin (PCT), high-sensitivity C-reactive protein (hs-CRP), andlactate (LAC) results relative to the ‘‘gold standard’’ of blood culture positive for gram-positive bacteria ina total of 762 adult patients admitted to the emergency department. Wilcoxon estimates of the area underthe ROC curve are as follows: PCT= 0.61 (95% CI [0.57–0.64]); LAC= 0.66 (95% CI [0.63–0.70]); CRP= 0.50 (95% CI [0.46–0.54]). Pairwise comparisons of ROC curves show that the difference between ei-ther PCT (P = 0.003) or LAC (P = 0.001) and hs-CRP is statistically significant. There is no difference be-tween PCT and LAC (P = 0.23).
Full-size DOI: 10.7717/peerj.4094/fig-3
ratio for procalcitonin and lactate increases were 72% (95% CI [69%–75%]), 2.41 (95%CI [1.98–2.91]), 0.60 (95% CI [0.51–0.70]), and 3.98 (95% CI [2.81–5.63]), respectively.The results of the combined test were slightly better compared to those of the single tests(Table 2).
We assessed the discriminative ability results of single or combined tests to predictpositive GNB culture (Table 3). With regard to single test items, the sensitivity, specificity,overall accuracy, positive-test likelihood, negative-test likelihood, and diagnostic odds ratiofor procalcitonin were 88% (95% CI [81%–93%]), 47% (95% CI [43%–50%]), 53% (95%CI [50%–56%]), 1.65 (95% CI [1.49–1.81]), 0.26 (95% CI [0.16–0.40]), and 6.44 (95% CI
Lin et al. (2017), PeerJ, DOI 10.7717/peerj.4094 12/21
[3.65–12.15]), respectively; those for lactate were 64% (95% CI [55%–73%]), 63% (95%CI [59%–66%]), 63% (95% CI [60%–66%]), 1.73 (95% CI [1.46–2.02]), 0.57 (95% CI[0.44–0.71]), and 3.04 (95% CI [2.02–4.63]), respectively; and those for high-sensitivityC-reactive protein were 90% (95% CI [84%–95%]), 11% (95% CI [9%–14%]), 23%(95% CI [21%–26%]), 1.02 (95% CI [0.94–1.07]), 0.85 (95% CI [0.48–1.49]), and 1.20(95%CI [0.62–2.49]; P = 0.70), respectively. With regard to combined tests, the sensitivity,specificity, overall accuracy, positive-test likelihood, negative-test likelihood, and diagnosticodds ratio for procalcitonin and lactate increases were 58% (95% CI [49%–67%]), 78%(95% CI [75%–81%]), 75% (95% CI [72%–78%]), 2.64 (95% CI [2.14–3.22]), 0.54 (95%CI [0.43–0.65]), and 4.9 (95% CI [3.24–7.45]); P < 0.001), respectively. According tothe diagnostic effectiveness (accuracy) results, both procalcitonin and lactate increasesprovided the highest overall accuracy for the prediction of GNB bacteremia (75%) whencompared to the findings of the single tests of procalcitonin (53%), lactate (63%), andhigh-sensitivity C-reactive protein (23%). However, in terms of the diagnostic odds ratio,the single test of procalcitonin showed better results than the combination (6.44 forprocalcitonin alone vs. 4.9 for the combination) (Table 3).
We further assessed the discriminative ability results of single or combined tests topredict positive GPB culture (Table 4). With regard to single test items, the sensitivity,specificity, overall accuracy, positive-test likelihood, negative-test likelihood, and diagnosticodds ratio for procalcitonin at a cutoff of 0.5 ng/mL were 68% (95% CI [57%–79%]), 47%(95% CI [43%–50%]), 49% (95% CI [45%–52%]), 1.28 (95% CI [1.06–1.49]), 0.68 (95%CI [0.47–0.93]), and 1.89 (95% CI [1.11–3.33]; P = 0.02), respectively; those for lactatewere 63% (95% CI [51%–74%]), 63% (95% CI [60%–66%]), 63% (95% CI [60%–66%]),1.7 (95% CI [1.36–2.04]), 0.59 (95% CI [0.42–0.78]), and 2.88 (95% CI [1.7–4.94];P < 0.001), respectively; and those for high-sensitivity C-reactive protein were 84% (95%CI [73%–91%]), 11% (95% CI [9%–14%]), 18% (95% CI [15%–21%]), 0.94 (95%CI [0.82–1.02]), 1.47 (95% CI [0.83–2.49]), and 0.64 (95% CI [0.32–1.37]; P = 0.25),respectively. With regard to combined tests, the overall accuracy and diagnostic odds ratiofor procalcitonin and lactate increases were 75% (95% CI [72%–78%]) and 2.93 (95% CI[1.73–4.96]; P < 0.001), respectively. The results of the combined test were slightly bettercompared to those of the single tests (Table 4).
Validity analysesWe performed a further analysis to determine whether the discriminative powers of theelevation of procalcitonin (≥0.5 ng/mL) in a single test and the elevations of procalcitoninand lactate (≥19.8 mg/dL) in a combined test for predicting positive blood bacterial cultureor positive GNB or GPB culture remain in an expanded cohort of similar patients (Tables S1and S2). The discriminative ability of procalcitonin at a cutoff of 0.5 ng/mL remained inan expanded cohort of 923 patients, with similar results for overall accuracy and diagnosticodds ratio between the single test and the combined test (72% vs. 72% in terms of overallaccuracy and 3.98 vs. 3.94 in terms of the diagnostic odds ratio for predicting positive bloodculture; 75% vs. 75% in terms of accuracy and 4.90 vs. 5.02 in terms of the diagnostic odds
Lin et al. (2017), PeerJ, DOI 10.7717/peerj.4094 13/21
ratio for predicting positive GNB culture;) 75% vs. 75% in terms of accuracy and 2.93 vs.2.75 in terms of the diagnostic odds ratio for predicting positive GPB culture (Table S2).
As a single test to predict bacteremia, the procalcitonin test performed even better in alarger expanded cohort of 2,234 adult patients than in the initial cohort of 886 patients interms of overall accuracy and diagnostic odds ratio, 65% vs. 54% in terms of accuracy and5.34 vs. 3.64 in terms of the diagnostic odds ratio for predicting blood culture positivity;65% vs. 53% in terms of accuracy and 10.13 vs. 6.44 in terms of the diagnostic odds ratiofor predicting positive GNB culture; and 63% vs. 49% in terms of accuracy and 2.83 vs.1.89 in terms of the diagnostic odds ratio for predicting positive GPB culture (Table S1).
The predictive performance of high-sensitivity C-reactive protein was consistentlypoor for predicting positive blood culture, positive GNB culture, and positive GPBculture, according to all three single global diagnostic indicators, namely AUROC analysis,diagnostic effectiveness (accuracy), and diagnostic odds ratio.
DISCUSSIONIn our study, with regard to the discriminative ability to predict bloodstream bacterialinfection in adult patients admitted to the ED of a tertiary care medical center, theprocalcitonin test was clinically useful to predict positive bacteremia and GNB bloodstreaminfection. This discriminative power was valid on assessment in a subsequently expandedcohort of 2,234 patients. In terms of a single global indicator, patients with elevatedprocalcitonin at a cutoff of 0.5 ng/mL have an at least six-fold increased diagnostic oddsratio for GNB bloodstream infection, as compared with normal procalcitonin results.The diagnostic odds ratio does not further improve when elevated lactate at a cutoffof ≥19.8 mg/dL is added to elevated procalcitonin. Elevated procalcitonin can predictpositive GPB culture but with a much lower diagnostic odds ratio than that for positiveGNB culture. High-sensitivity C-reactive protein performed poorly across all assessmentsof bloodstream infection, regardless of evaluation using any of the following diagnosticperformance indicators: overall accuracy, AUROC analysis, or diagnostic odds ratio. Ourdata do not support the practice at the ED using high-sensitivity C-reactive protein as asingle test at a cutoff of ≥0.8 mg/dL to predict bloodstream bacterial infection.
Using multiple concurrent indicators, such as sensitivity, specificity, and positive-testor negative-test likelihood values, to compare the performance of competing diagnostictests can be a disadvantage particularly if one test does not outperform the others onall indicators. The diagnostic odds ratio has been proposed as a single indicator oftest performance especially in the era of evidence-based practice (Glas et al., 2003). Inthe stressful setting of the ED involving patient care with a presumptive diagnosis ofbacterial bloodstream infection, the identification of themost appropriate test for antibioticstewardship before the availability of blood culture results and notification of the chanceof bacteremia to the patient and family after obtaining the result of the decision test areextremely important. In this study, the procalcitonin test was compared with conventionalcompeting tests, such as high-sensitivity C-reactive protein and lactate, and it was shownthat the procalcitonin test has better discrimination ability for blood culture results of
Lin et al. (2017), PeerJ, DOI 10.7717/peerj.4094 14/21
contamination and negative bacterial growth, and its performance has better consistencywith blood culture results of positive bacterial growth.
Our study incorporated three different single indicators of test performance for decision-making, namely, overall accuracy, diagnostic odds ratio, andAUROCanalysis. Additionally,a negative-test likelihood of <0.6 can help indicate the clinical usefulness of a test. Therefore,one can compare the results of test performance by appreciating the results of the aboveindicators, and this is a strength of the present study.
We attempted to compare our results with those of other studies. Table S3 presents ouranalysis of recent studies that reported procalcitonin as a single decision tool and used thediagnostic odds ratio as a single indicator of bloodstream infection. It is noteworthy that forpredicting positive GNB culture, a positive procalcitonin test indicates a four- to seven-foldhigher chance in terms of the diagnostic odds ratio when compared with a negative testresult (diagnostic odds ratio = 4.14 95% CI [2.00–8.58] in the study by Juutilainen et al.;5.98 95% CI [5.20–6.88] in the study by Oussalah et al. using a cutoff of ≥10 ng/mL; and6.44 95% CI [3.65–12.15] in our study using a cutoff of ≥0.5 ng/mL) (Juutilainen et al.,2011; Oussalah et al., 2015). The predictive power of a single procalcitonin test markedlydropped to around two- to four-fold for GPB (diagnostic odds ratio = 1.89 95% CI[1.11–3.33] in our study and 3.64 95% CI [3.11–4.26] in the study by Oussalah et al. usinga cutoff of ≥10 ng/mL).
It is worthwhile to look more deeply at the suitable cutoff of procalcitonin level aimingto predict or rule out a positive bacteremia. In a prospective cohort study involving a totalof 898 patients fulfilling the systemic inflammatory response syndrome (SIRS) criteria,at the cut-off of 0.1 ng/mL, procalcitonin failed to predict bloodstream infection in 7%of patients (Hoenigl et al., 2014). If this cutoff is used to distinguish blood contaminationfrom bloodstream infection due to coagulase-negative Staphylococci, procalcitonin testperformed on the same day of blood culture collection had a sensitivity of 100%, and aspecificity of 80% for the diagnosis of bloodstream infection (Schuetz, Mueller & Trampuz,2007). Another retrospective single institution study reported that using procalcitonin topredict gram-negative bacteremia, at a cutoff of >3.39 ng/mL, the sensitivity would be 80%,specificity 71%, and the area under the curve 0.73 (Guo et al., 2015). A recent Japaneseretrospective study involving 1,331 adults with suspicious bloodstream infections derivedan optimal cutoff of procalcitonin for discriminating positive blood cultures from negativeones; with the cutoff at 0.9 ng/mL, the sensitivity, specificity, positive predictive value, andnegative predictive value were 71.9%, 69.1%, 24.5%, and 94.6%, respectively (Hattori etal., 2014). Another South Korean retrospective study involving 300 patients with fever, 58of them had positive blood culture, when using procalcitonin level at a cut-off value of0.5 ng/mL, the sensitivity and specificity were 74.2% and 70.1%, respectively. This Koreanstudy also demonstrates that when procalcitonin level is <0.4 ng/mL, it accurately rules outthe diagnosis of bacteremia (Kim et al., 2011). In a Swiss prospective case-control studyaccruing 200 hospitalized adults, at a cut-off of 0.5 ng/mL, the sensitivity of procalcitoninwas 56%, and the specificity was 83% to discriminate positive blood cultures from negativeblood cultures (Liaudat et al., 2001). Physicians frequently place the bloodstream infectionson the top of the differential diagnoses when a patient presents with the SIRS defined as
Lin et al. (2017), PeerJ, DOI 10.7717/peerj.4094 15/21
two or more abnormalities in temperature, heart rate, respiration, or white blood cell count(Levy et al., 2003). A recent study demonstrates that the performance of procalcitonin topredict a bloodstream infection was not affected by the SIRS status. Procalcitonin of <0.1ng/mL had a negative predictive value of 97.4 and 96.2% for bloodstream infection in theSIRS-negative and SIRS-positive patients, respectively (Arora et al., 2017). Using a cutoff atthe upper limit of reference range for all three biomarkers, the generalizability of our studyresults will be more easily applied to the real-world practice in the emergency department.
Interestingly, elevated lactate at a cutoff of ≥19.8 mg/dL is better than elevatedprocalcitonin in terms of producing a higher diagnostic odds ratio with a two- to three-foldincrease in the prediction of positive GPB culture. This association has not been reportedin previous studies. In our study, lactate combined with procalcitonin was found to havea better detection capability than high-sensitivity C-reactive protein, and this result maydecrease the use of antibiotics in this aspect, when practicing physicians in the ED, whofrequently depend on high-sensitivity C-reactive protein to help with the decision toprescribe antibiotics (antibiotic stewardship), make use of decision tools, such as lactate,instead of high-sensitivity C-reactive protein.
From the results of single tests, pairwise test combinations, and blood culture, wenoted some important features. First, test combinations may not have better detectionability than a single test. Second, for test combinations, the combination with an increasein a single factor has a higher odds ratio and lower negative-test likelihood than thecombination with increases in both factors. Third, elevated lactate and/or procalcitoninshow a lower negative-test likelihood and higher odds ratio. Finally, for predicting GNBinfection, procalcitonin has better detection capability, and the diagnostic odds ratio doesnot improve when procalcitonin is used in combination with lactate. To the best of ourknowledge, there are few published works investigating whether a combination of testssuch as the combination of procalcitonin + lactate or procalcitonin + C-reactive proteinor all three of them would outperform procalcitonin as a single test in prediction of thebloodstream infections in adult patients in the setting of emergency department care(Ljungstrom et al., 2017). For prediction of bacteremia in adult patients suspected withsepsis admitted to the emergency department at Skaraborg Hospital, Sweden, elevatedprocalcitonin (AUC = 0.74; 95% CI [0.70–0.78]) performs as good as the composite fourbiomarkers (procalcitonin, lactate, C-reactive protein and neutrophil and lymphocytecount (NLCR)) (AUC = 0.78; 95% CI [0.74–0.81]) (P = 0.06) (Ljungstrom et al., 2017).This group of patients had a very high prevalence of verified bacterial infection, at 55.6%(874/1,572).
The present study has some limitations. First, this study only collected data of samplesfrom an academic medical center in central Taiwan, and this could have led to samplingbias. The results from this study may not apply to the ED of other hospitals. Second, duringenrollment in this study, the number of cases that fulfilled the enrollment criteria wasnot large; therefore, this study only classified bacteria as GPB and GNB. Readers are againreminded here that our study assesses predictors of blood culture positivity, but not ofsepsis. In further analysis, the sample size should be expanded to increase the credibility ofthe results. Third, as this study only examined adult emergency patients in a medical center
Lin et al. (2017), PeerJ, DOI 10.7717/peerj.4094 16/21
in central Taiwan, the results may be affected by factors such as prior use of antibioticsby the patient, underlying disease status, conduction of tests simultaneously, impropersterilization during blood sample collection resulting in contamination, and insufficientblood collection resulting in negative results. Subsequent studies could consider includingspecialty-specific and clinical signs (e.g., temperature, blood pressure, arterial blood gas,leukocyte count, breathing rate, and heart rate).
CONCLUSIONSFor adult emergency patients, procalcitonin has an acceptable discriminative ability forbacterial blood culture and a better discriminative ability for positive GNB culture whencompared with lactate and high-sensitivity C-reactive protein. Although blood culturemay be positive, the patient may not have sepsis; therefore, accurate discrimination ofcontamination is important to ED physicians for treatment purposes. In terms of a singleglobal indicator, patients with elevated procalcitonin at a cutoff of 0.5 ng/mL harbor anat least six-fold increased diagnostic odds ratio for GNB bloodstream infection, whencompared with a normal procalcitonin result. The diagnostic odds ratio does not furtherimprove when elevated lactate at a cutoff of 19.8 mg/dL is added to elevated procalcitonin.Elevated procalcitonin can predict positive GPB culture with a much lower diagnostic oddsratio than that for positive GNB culture. High-sensitivity C-reactive protein performedpoorly for the prediction of positive bacterial culture. The development of new and effectivetesting methods will be beneficial for institutions with limited medical resources. Futurestudies should be performed to determine whether both new and old methods can be usedin combination. It is worth mentioning that high-sensitivity C-reactive protein does notshow significance for distinguishing blood bacterial culture results of contamination andpositivity.
ACKNOWLEDGEMENTSWe thank Crimson Interactive Pvt. Ltd. (Enago)—http://www.enago.tw for their assistancein manuscript editing.
ADDITIONAL INFORMATION AND DECLARATIONS
FundingThis study was supported by grants to to Chiung–Tsung Lin from the China MedicalUniversity Hospital (DMR–99–133), Taichung, Taiwan; and Jorng-Tzong Horng from theMinistry of Science and Technology of Taiwan (MOST 106-2221-E-008-098-MY2). Thefunders had no role in study design, data collection and analysis, decision to publish, orpreparation of the manuscript.
Grant DisclosuresThe following grant information was disclosed by the authors:China Medical University Hospital: DMR–99–133.The Ministry of Science and Technology of Taiwan: MOST 106-2221-E-008-098-MY2.
Lin et al. (2017), PeerJ, DOI 10.7717/peerj.4094 17/21
Competing InterestsThe authors declare there are no competing interests.
Author Contributions• Chiung-Tsung Lin conceived and designed the experiments, performed the experiments,analyzed the data, contributed reagents/materials/analysis tools, wrote the paper,prepared figures and/or tables.• Jang-Jih Lu performed the experiments, analyzed the data.• Yu-Ching Chen analyzed the data, reviewed drafts of the paper.• Victor C. Kok conceived and designed the experiments, analyzed the data, contributedreagents/materials/analysis tools, wrote the paper, prepared figures and/or tables,reviewed drafts of the paper.• Jorng-Tzong Horng analyzed the data, reviewed drafts of the paper.
Human EthicsThe following information was supplied relating to ethical approvals (i.e., approving bodyand any reference numbers):
The Research Ethics Committee of China Medical University & Hospital, Taichung,Taiwan, recommended and classified the study as an exempt research and granted Ethicalapproval to carry out the study.
Data AvailabilityThe following information was supplied regarding data availability:
The raw dataset is provided as a Supplemental File.
Supplemental InformationSupplemental information for this article can be found online at http://dx.doi.org/10.7717/peerj.4094#supplemental-information.
REFERENCESAalto H, Takala A, Kautiainen H, Repo H. 2004. Laboratory markers of systemic
inflammation as predictors of bloodstream infection in acutely ill patients admittedto hospital in medical emergency. European Journal of Clinical Microbiology andInfectious Diseases 23:699–704 DOI 10.1007/s10096-004-1191-8.
Alemayehu D, Zou KH. 2012. Applications of ROC analysis in medical research: recentdevelopments and future directions. Academic Radiology 19:1457–1464DOI 10.1016/j.acra.2012.09.006.
Arora R, Campbell JP, Simon G, Sahni N. 2017. Does serum procalcitonin aid inthe diagnosis of bloodstream infection regardless of whether patients exhibit thesystemic inflammatory response syndrome? Infection 45:291–298DOI 10.1007/s15010-016-0965-0.
Castelli GP, Pognani C, Meisner M, Stuani A, Bellomi D, Sgarbi L. 2004. Procalcitoninand C-reactive protein during systemic inflammatory response syndrome, sepsis andorgan dysfunction. Critical Care 8:R234–R242 DOI 10.1186/cc2877.
Lin et al. (2017), PeerJ, DOI 10.7717/peerj.4094 18/21
DeLong ER, DeLong DM, Clarke-Pearson DL. 1988. Comparing the areas under two ormore correlated receiver operating characteristic curves: a nonparametric approach.Biometrics 44:837–845 DOI 10.2307/2531595.
Freund Y, Delerme S, Goulet H, BernardM, Riou B, Hausfater P. 2012. Serumlactate and procalcitonin measurements in emergency room for the diagnosis andrisk-stratification of patients with suspected infection. Biomarkers 17:590–596DOI 10.3109/1354750X.2012.704645.
Glas AS, Lijmer JG, Prins MH, Bonsel GJ, Bossuyt PMM. 2003. The diagnostic oddsratio: a single indicator of test performance. Journal of Clinical Epidemiology56:1129–1135 DOI 10.1016/s0895-4356(03)00177-x.
Guo SY, Zhou Y, Hu QF, Yao J, Wang H. 2015. Procalcitonin is a marker of gram-negative bacteremia in patients with sepsis. American Journal of the Medical Sciences349:499–504 DOI 10.1097/maj.0000000000000477.
Hattori T, Nishiyama H, Kato H, Ikegami S, NagayamaM, Asami S, UsamiM, SuzukiM, Murakami I, MinoshimaM, Yamagishi H, Yuasa N. 2014. Clinical value ofprocalcitonin for patients with suspected bloodstream infection. American Journalof Clinical Pathology 141:43–51 DOI 10.1309/ajcp4gv7zfdtangc.
Hoenigl M, Raggam RB,Wagner J, Prueller F, Grisold AJ, Leitner E, Seeber K, PrattesJ, Valentin T, Zollner-Schwetz I, Schilcher G, Krause R. 2014. Procalcitonin fails topredict bacteremia in SIRS patients: a cohort study. International Journal of ClinicalPractice 68:1278–1281 DOI 10.1111/ijcp.12474.
Jaimes F, Arango C, Ruiz G, Cuervo J, Botero J, Velez G, Upegui N, Machado F.2004. Predicting bacteremia at the bedside. Clinical Infectious Diseases 38:357–362DOI 10.1086/380967.
Julian-Jimenez A, Gutierrez-Martin P, Lizcano-Lizcano A, Lopez-GuerreroMA,Barroso-Manso A, Heredero-Galvez E. 2015. Usefulness of procalcitonin andC-reactive protein for predicting bacteremia in urinary tract infections in theemergency department. Actas Urologicas Espanolas 39:502–510DOI 10.1016/j.acuro.2015.03.003.
Juutilainen A, Hamalainen S, Pulkki K, Kuittinen T, Nousiainen T, Jantunen E,Koivula I. 2011. Biomarkers for bacteremia and severe sepsis in hematologicalpatients with neutropenic fever: multivariate logistic regression analysis and factoranalysis. Leukemia and Lymphoma 52:2349–2355DOI 10.3109/10428194.2011.597904.
Kibe S, Adams K, Barlow G. 2011. Diagnostic and prognostic biomarkers of sepsisin critical care. Journal of Antimicrobial Chemotherapy 66(Suppl 2):ii33–ii40DOI 10.1093/jac/dkq523.
KimMH, Lim G, Kang SY, LeeWI, Suh JT, Lee HJ. 2011. Utility of procalcitonin as anearly diagnostic marker of bacteremia in patients with acute fever. Yonsei MedicalJournal 52:276–281 DOI 10.3349/ymj.2011.52.2.276.
Leal Jr SM, Jones M, Gilligan PH. 2016. Clinical significance of commensal gram-positive rods routinely isolated from patient samples. Journal of Clinical Microbiology54:2928–2936 DOI 10.1128/jcm.01393-16.
Lin et al. (2017), PeerJ, DOI 10.7717/peerj.4094 19/21
Leli C, Cardaccia A, Ferranti M, Cesarini A, D’Alo F, Ferri C, Cenci E, Mencacci A.2014. Procalcitonin better than C-reactive protein, erythrocyte sedimentation rate,and white blood cell count in predicting DNAemia in patients with sepsis. Scandina-vian Journal of Infectious Diseases 46:745–752 DOI 10.3109/00365548.2014.936493.
LevyMM, FinkMP, Marshall JC, Abraham E, Angus D, Cook D, Cohen J, Opal SM,Vincent JL, Ramsay G. 2003. 2001 SCCM/ESICM/ACCP/ATS/SIS internationalsepsis definitions conference. Critical Care Medicine 31:1250–1256DOI 10.1097/01.ccm.0000050454.01978.3b.
Liaudat S, Dayer E, Praz G, Bille J, Troillet N. 2001. Usefulness of procalcitonin serumlevel for the diagnosis of bacteremia. European Journal of Clinical Microbiology andInfectious Diseases 20:524–527 DOI 10.1007/s100960100548.
Lindvig KP, Nielsen SL, Henriksen DP, Jensen TG, Kolmos HJ, Pedersen C, VinholtPJ, Lassen AT. 2016.Mortality and prognostic factors of patients who have bloodcultures performed in the emergency department: a cohort study. European Journalof Emergency Medicine 23:166–172 DOI 10.1097/mej.0000000000000250.
Linscheid P, Seboek D, Nylen ES, Langer I, Schlatter M, Becker KL, Keller U,Muller B. 2003. In vitro and in vivo calcitonin I gene expression in parenchymalcells: a novel product of human adipose tissue. Endocrinology 144:5578–5584DOI 10.1210/en.2003-0854.
Liu HH, ZhangMW, Guo JB, Li J, Su L. 2017. Procalcitonin and C-reactive protein inearly diagnosis of sepsis caused by either Gram-negative or Gram-positive bacteria.Irish Journal of Medical Science 186:207–212 DOI 10.1007/s11845-016-1457-z.
Ljungstrom L, Pernestig AK, Jacobsson G, Andersson R, Usener B, Tilevik D. 2017.Diagnostic accuracy of procalcitonin, neutrophil-lymphocyte count ratio, C-reactive protein, and lactate in patients with suspected bacterial sepsis. PLOS ONE12:e0181704 DOI 10.1371/journal.pone.0181704.
MiloneMT, Kamath AF, Israelite CL. 2014. Converting between high- and low-sensitivity C-reactive protein in the assessment of periprosthetic joint infection.Journal of Artroplasty 29:685–689 DOI 10.1016/j.arth.2013.09.015.
Nishikawa H, ShiranoM, Kasamatsu Y, Morimura A, Iida K, Kishi T, Goto T,Okamoto S, Ehara E. 2016. Comparative usefulness of inflammatory markersto indicate bacterial infection-analyzed according to blood culture results andrelated clinical factors. Diagnostic Microbiology and Infectious Disease 84:69–73DOI 10.1016/j.diagmicrobio.2015.09.015.
Nishikawa H, ShiranoM, Kasamatsu Y, Morimura A, Iida K, Kishi T, Goto T, OkamotoS, Ehara E. 2017. Comparison between procalcitonin and C-reactive protein inpredicting bacteremias and confounding factors: a case-control study. ClinicalChemistry and Laboratory Medicine 55:1043–1052 DOI 10.1515/cclm-2016-0705.
Nishikura T. 1999. Procalcitonin (PCT) production in a thyroidectomized patient.Intensive Care Medicine 25:1031 DOI 10.1007/s001340051006.
Oussalah A, Ferrand J, Filhine-Tresarrieu P, Aissa N, Aimone-Gastin I, Namour F,Garcia M, Lozniewski A, Gueant JL. 2015. Diagnostic accuracy of procalcitonin forpredicting blood culture results in patients with suspected bloodstream infection: an
Lin et al. (2017), PeerJ, DOI 10.7717/peerj.4094 20/21
observational study of 35,343 consecutive patients (A STROBE-Compliant Article).Medicine 94:e1774 DOI 10.1097/md.0000000000001774.
Richter SS, Beekmann SE, Croco JL, Diekema DJ, Koontz FP, Pfaller MA, Doern GV.2002.Minimizing the workup of blood culture contaminants: implementationand evaluation of a laboratory-based algorithm. Journal of Clinical Microbiology40:2437–2444 DOI 10.1128/JCM.40.7.2437-2444.2002.
Riedel S. 2012. Procalcitonin and the role of biomarkers in the diagnosis and man-agement of sepsis. Diagnostic Microbiology and Infectious Disease 73:221–227DOI 10.1016/j.diagmicrobio.2012.05.002.
Riedel S, Melendez JH, An AT, Rosenbaum JE, Zenilman JM. 2011. Procalcitonin asa marker for the detection of bacteremia and sepsis in the emergency department.American Journal of Clinical Pathology 135:182–189 DOI 10.1309/ajcp1mfyinqlecv2.
Schuetz P, Mueller B, Trampuz A. 2007. Serum procalcitonin for discriminationof blood contamination from bloodstream infection due to coagulase-negativestaphylococci. Infection 35:352–355 DOI 10.1007/s15010-007-7065-0.
Shapiro NI, Howell MD, Talmor D, Nathanson LA, Lisbon A,Wolfe RE,Weiss JW.2005. Serum lactate as a predictor of mortality in emergency department patientswith infection. Annals of Emergency Medicine 45:524–528DOI 10.1016/j.annemergmed.2004.12.006.
Su YJ, Liao SC, Cheng BC, Hwang JC, Chen JB. 2013. Increasing high-sensitive C-reactive protein level predicts peritonitis risk in chronic peritoneal dialysis patients.BMC Nephrology 14:185 DOI 10.1186/1471-2369-14-185.
Wang T, Cui YL, Lin ZF, Chen DC. 2016. Comparative study of plasma endotoxin withprocalcitonin levels in diagnosis of bacteremia in intensive care unit patients. ChineseMedical Journal 129:417–423 DOI 10.4103/0366-6999.176064.
Windgassen EB, Funtowicz L, Lunsford TN, Harris LA, Mulvagh SL. 2011. C-reactiveprotein and high-sensitivity C-reactive protein: an update for clinicians. PostgraduateMedicine 123:114–119 DOI 10.3810/pgm.2011.01.2252.
Yildiz B, Poyraz H, Cetin N, Kural N, Colak O. 2013.High sensitive C-reactive protein:a new marker for urinary tract infection, VUR and renal scar. European Review forMedical and Pharmacological Sciences 17:2598–2604.
Lin et al. (2017), PeerJ, DOI 10.7717/peerj.4094 21/21