diagram 1.1.7: 2047 with project average speeds, am peak
TRANSCRIPT

Preliminary Environmental Information Report: September 2021 Appendix 12.9.1: Preliminary Transport Assessment Report (PTAR) Page 102
Our northern runway: making best use of Gatwick
Diagram 1.1.7: 2047 with Project – Average Speeds, AM Peak
Preliminary Environmental Information Report: September 2021 Appendix 12.9.1: Preliminary Transport Assessment Report (PTAR) Page 103
Our northern runway: making best use of Gatwick
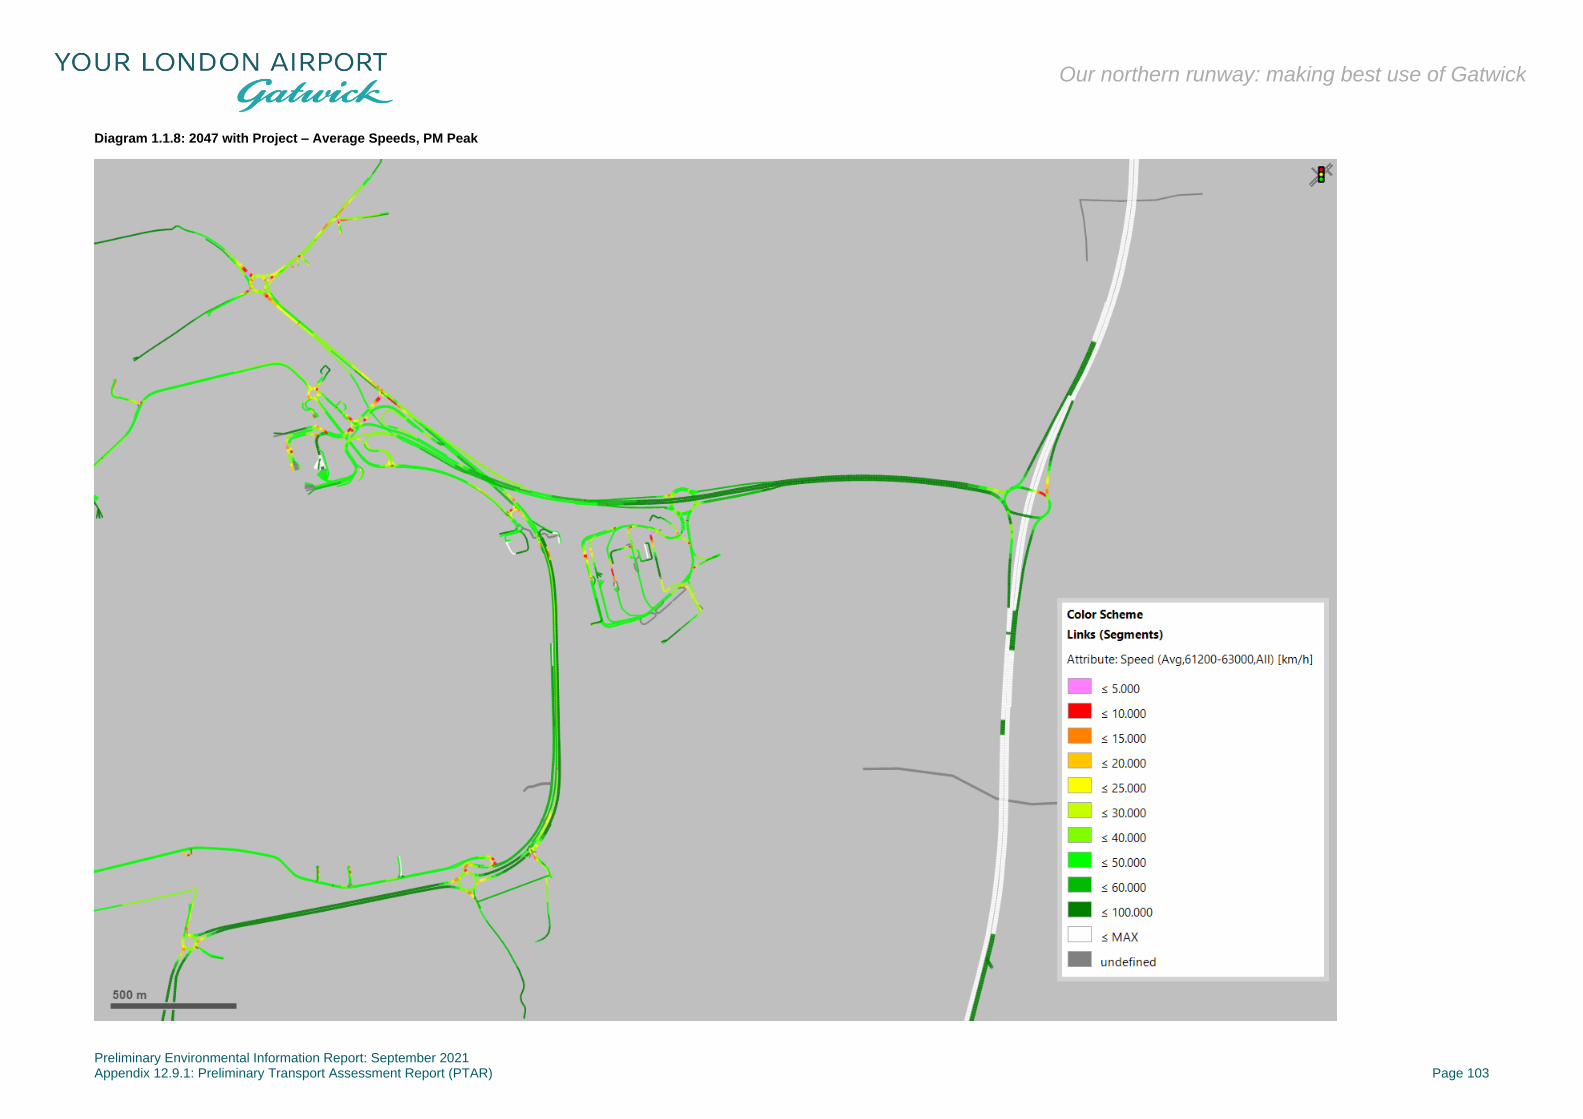
Diagram 1.1.8: 2047 with Project – Average Speeds, PM Peak
Preliminary Environmental Information Report: September 2021 Appendix 12.9.1: Preliminary Transport Assessment Report (PTAR) Page 104
Our northern runway: making best use of Gatwick
11.4 Forecourt Operations
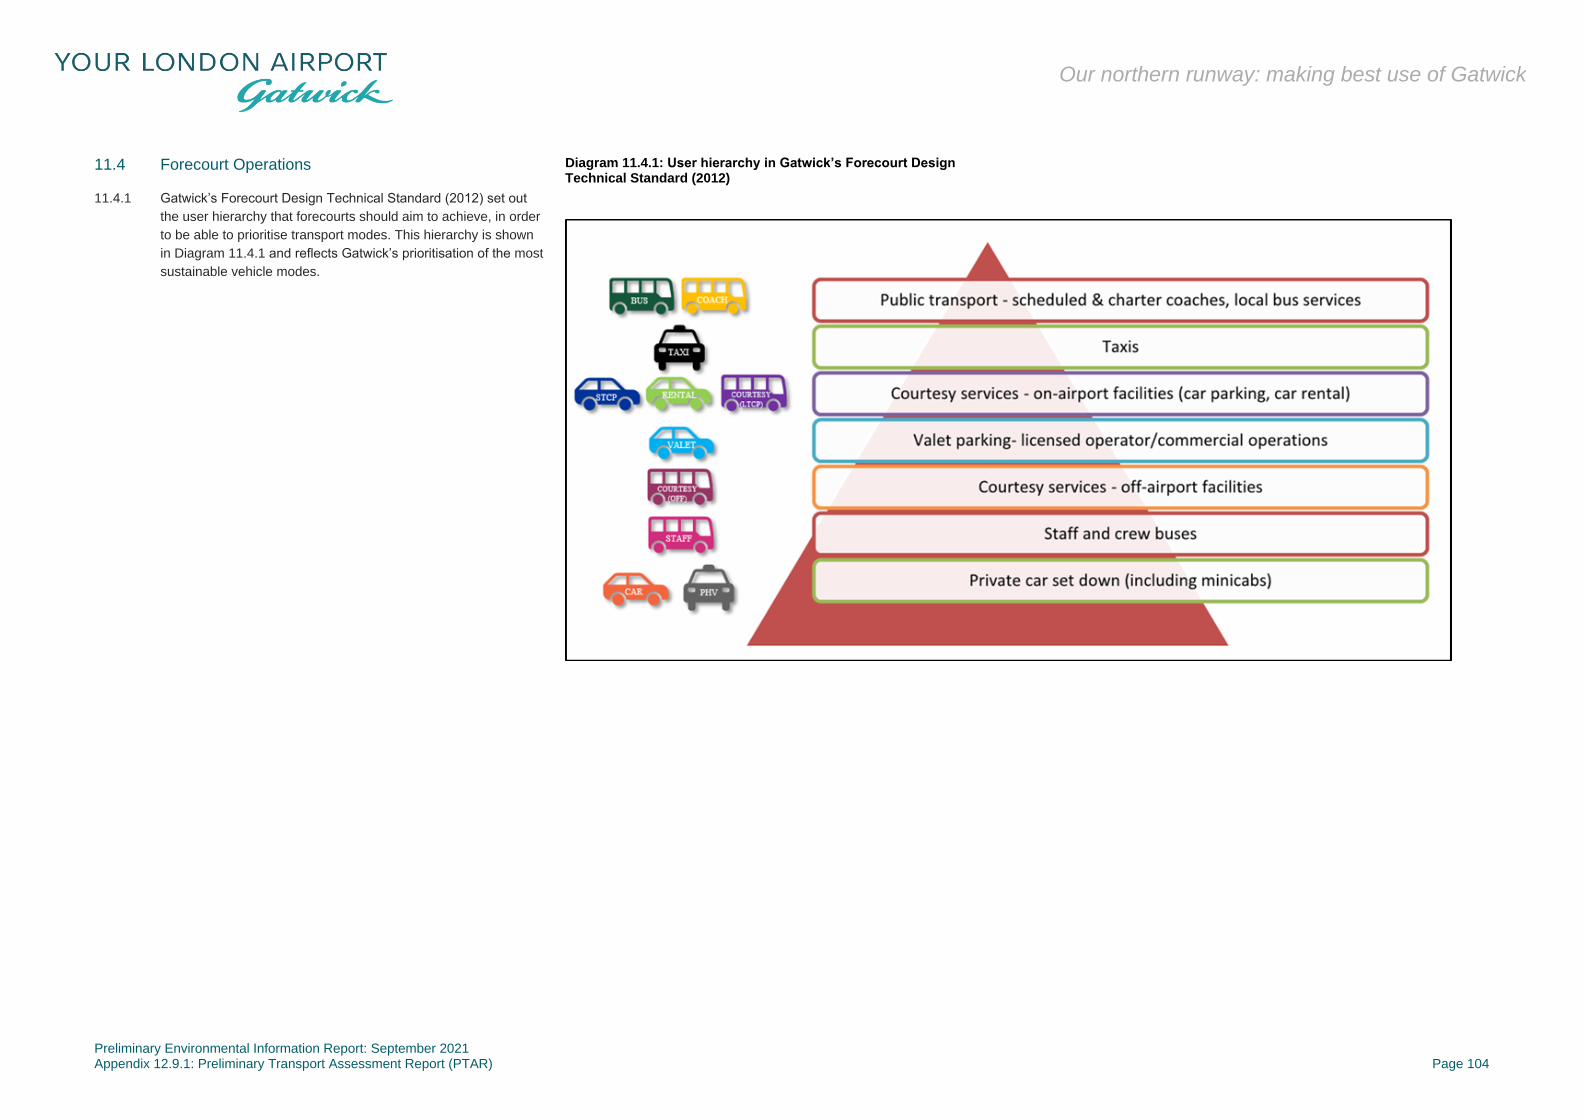
11.4.1 Gatwick’s Forecourt Design Technical Standard (2012) set out
the user hierarchy that forecourts should aim to achieve, in order
to be able to prioritise transport modes. This hierarchy is shown
in Diagram 11.4.1 and reflects Gatwick’s prioritisation of the most
sustainable vehicle modes.
Diagram 11.4.1: User hierarchy in Gatwick’s Forecourt Design Technical Standard (2012)
Preliminary Environmental Information Report: September 2021 Appendix 12.9.1: Preliminary Transport Assessment Report (PTAR) Page 105
Our northern runway: making best use of Gatwick
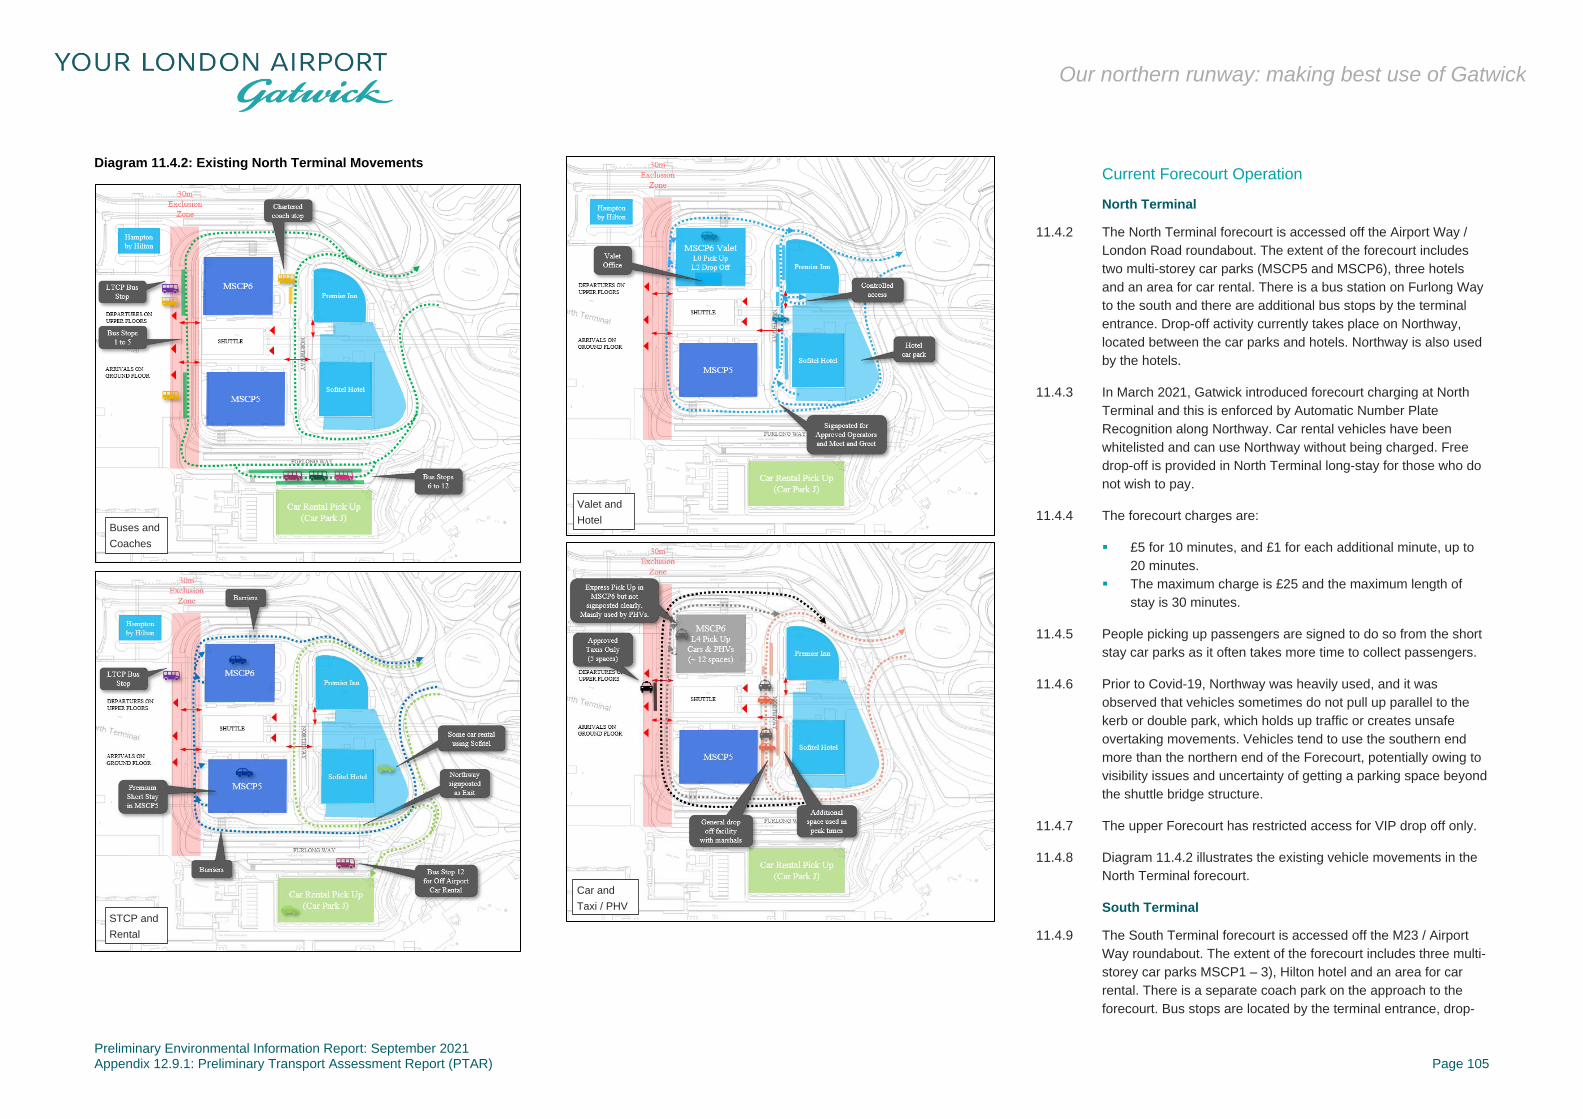
Diagram 11.4.2: Existing North Terminal Movements
Current Forecourt Operation
North Terminal
11.4.2 The North Terminal forecourt is accessed off the Airport Way /
London Road roundabout. The extent of the forecourt includes
two multi-storey car parks (MSCP5 and MSCP6), three hotels
and an area for car rental. There is a bus station on Furlong Way
to the south and there are additional bus stops by the terminal
entrance. Drop-off activity currently takes place on Northway,
located between the car parks and hotels. Northway is also used
by the hotels.
11.4.3 In March 2021, Gatwick introduced forecourt charging at North
Terminal and this is enforced by Automatic Number Plate
Recognition along Northway. Car rental vehicles have been
whitelisted and can use Northway without being charged. Free
drop-off is provided in North Terminal long-stay for those who do
not wish to pay.
11.4.4 The forecourt charges are:
▪ £5 for 10 minutes, and £1 for each additional minute, up to
20 minutes.
▪ The maximum charge is £25 and the maximum length of
stay is 30 minutes.
11.4.5 People picking up passengers are signed to do so from the short
stay car parks as it often takes more time to collect passengers.
11.4.6 Prior to Covid-19, Northway was heavily used, and it was
observed that vehicles sometimes do not pull up parallel to the
kerb or double park, which holds up traffic or creates unsafe
overtaking movements. Vehicles tend to use the southern end
more than the northern end of the Forecourt, potentially owing to
visibility issues and uncertainty of getting a parking space beyond
the shuttle bridge structure.
11.4.7 The upper Forecourt has restricted access for VIP drop off only.
11.4.8 Diagram 11.4.2 illustrates the existing vehicle movements in the
North Terminal forecourt.
South Terminal
11.4.9 The South Terminal forecourt is accessed off the M23 / Airport
Way roundabout. The extent of the forecourt includes three multi-
storey car parks MSCP1 – 3), Hilton hotel and an area for car
rental. There is a separate coach park on the approach to the
forecourt. Bus stops are located by the terminal entrance, drop-
STCP and
Rental
Car and
Taxi / PHV
Buses and
Coaches
Valet and
Hotel

Preliminary Environmental Information Report: September 2021 Appendix 12.9.1: Preliminary Transport Assessment Report (PTAR) Page 106
Our northern runway: making best use of Gatwick
off activity takes place on Coach Road. Access to the multi-storey
car parks is from Westway.
11.4.10 Forecourt charging was introduced at South Terminal in April
2021, with the same charges as at North Terminal. Prior to the
Covid-19 pandemic, it was observed that queuing occurs at the
primary drop-off kerb during busier times, with vehicles prioritising
spaces near to the forecourt entry point. The secondary drop-off
area is often underutilised which is a feature of drivers having to
make a decision about which lane to be in before being able to
see the kerbside occupancy. Steps have been taken to improve
signage as part of the forecourt charging works. Free drop-off is
provided in South Terminal long-stay for those who do not wish to
pay.
11.4.11 The upper Forecourt has restricted access for long stay car park
buses, approved taxis, premium valet and electric car rental only.
11.4.12 Diagram 11.4.3 illustrates the existing vehicles movements in the
South Terminal forecourt.
Diagram 11.4.3: Existing South Terminal Movements
Buses and
Coaches
STCP and
Rental
Valet and
Hotel
Car and
Taxi / PHV

Preliminary Environmental Information Report: September 2021 Appendix 12.9.1: Preliminary Transport Assessment Report (PTAR) Page 107
Our northern runway: making best use of Gatwick
Estimated Future Forecourt Requirements
11.4.13 Initial estimates have been undertaken for drop off / pick up
demand using landside passenger forecasts and existing
departure mode shares with some amendments to reflect rail
targets.
11.4.14 Whilst the North Terminal handles more than half of Gatwick
Airport demand now and into the future, the terminal forecourt
itself is around half the size of the South Terminal and
accordingly static analysis indicates the potential for capacity
constraints into the future both for the future baseline and the
Project scenarios.
11.4.15 Analysis for the South Terminal indicates that the forecourt is
sufficiently sized to accommodate future growth, subject to
appropriate utilisation of the full capacity of the forecourt. This will
require signage and operational management strategies to make
full use of the available space.
11.4.16 The demand for the North Terminal forecourt with the northern
runway in operation under the Project scenarios for 2032 and
2047 is shown in Table 11.4.1 below.
Table 11.4.1: North Terminal Forecast drop off / pick up (2032 and 2047 with Project)
Drop Off /
Pick Up
Activity
Peak
hourly pick
up + drop
off demand
No. of Spaces Required
2 minute dwell time
5 minute dwell time
2032 with
Project
Overall Peak
1,424 47 (315m) 119 (797m)
- Arrivals 405 13 34
- Departures 996 33 83
Peak
Departures 1,086 36 91
2047 with Project
Overall Peak
1,575 53 (355m) 131 (878m)
- Arrivals 464 15 39
- Departures 1,026 34 86
Peak
Departures 1,157 39 96
Proposed Future Forecourt Strategy
North Terminal
11.4.17 The existing drop off facility on Northway is not expected to be
able to accommodate the forecast level of passenger growth for
drop-off and pick-up.
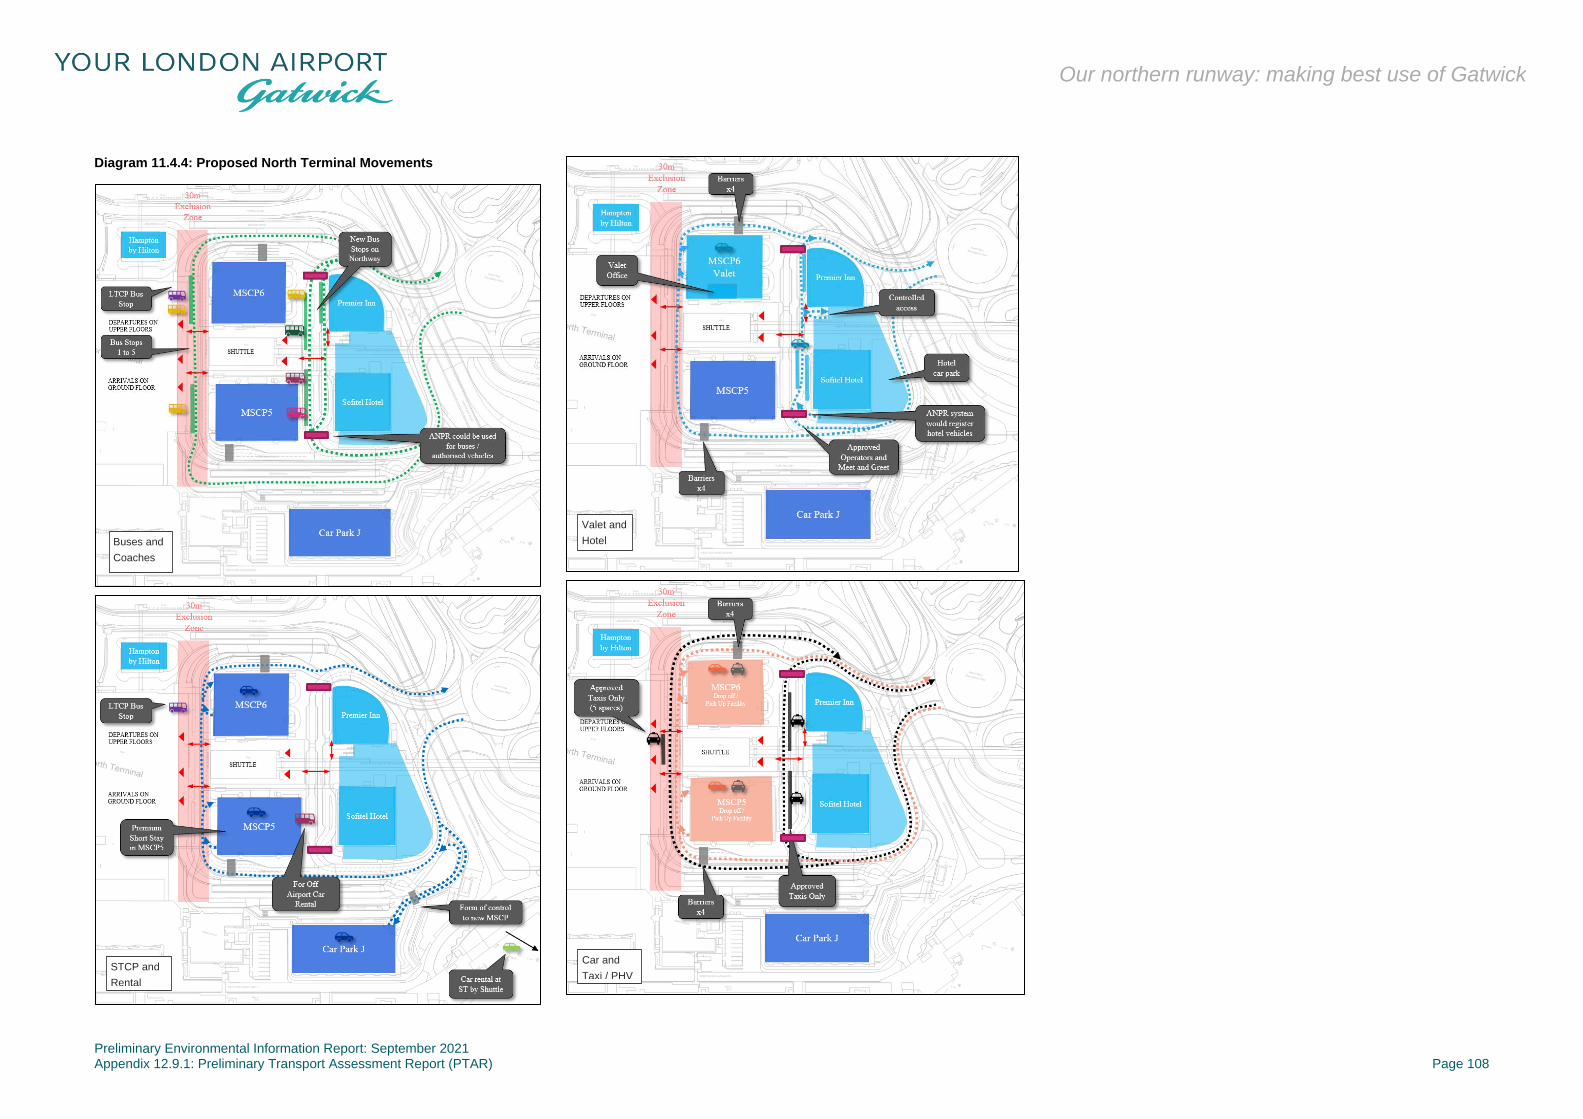
11.4.18 The strategy envisages moving drop-off from Northway into the
short-stay Multi-Storey Car Parks (MSCPs) which is where pick-
up is currently handled.
11.4.19 Accordingly, there is an opportunity to reconfigure the North
Terminal forecourt to provide more capacity for drop off and also
to increase priority for buses.
11.4.20 The proposed strategy at North Terminal also opens up the
potential option for Northway to be repurposed as the primary bus
station, which would be more visible and have more direct
pedestrian access from the terminal building than Furlong Way.
11.4.21 Car rental is proposed to be relocated and consolidated to the
South Terminal and a new multi-storey car park is proposed to
the south of Furlong Way.
11.4.22 Diagram 11.4.4 below illustrates the proposed vehicle
movements in the North Terminal forecourt.
South Terminal
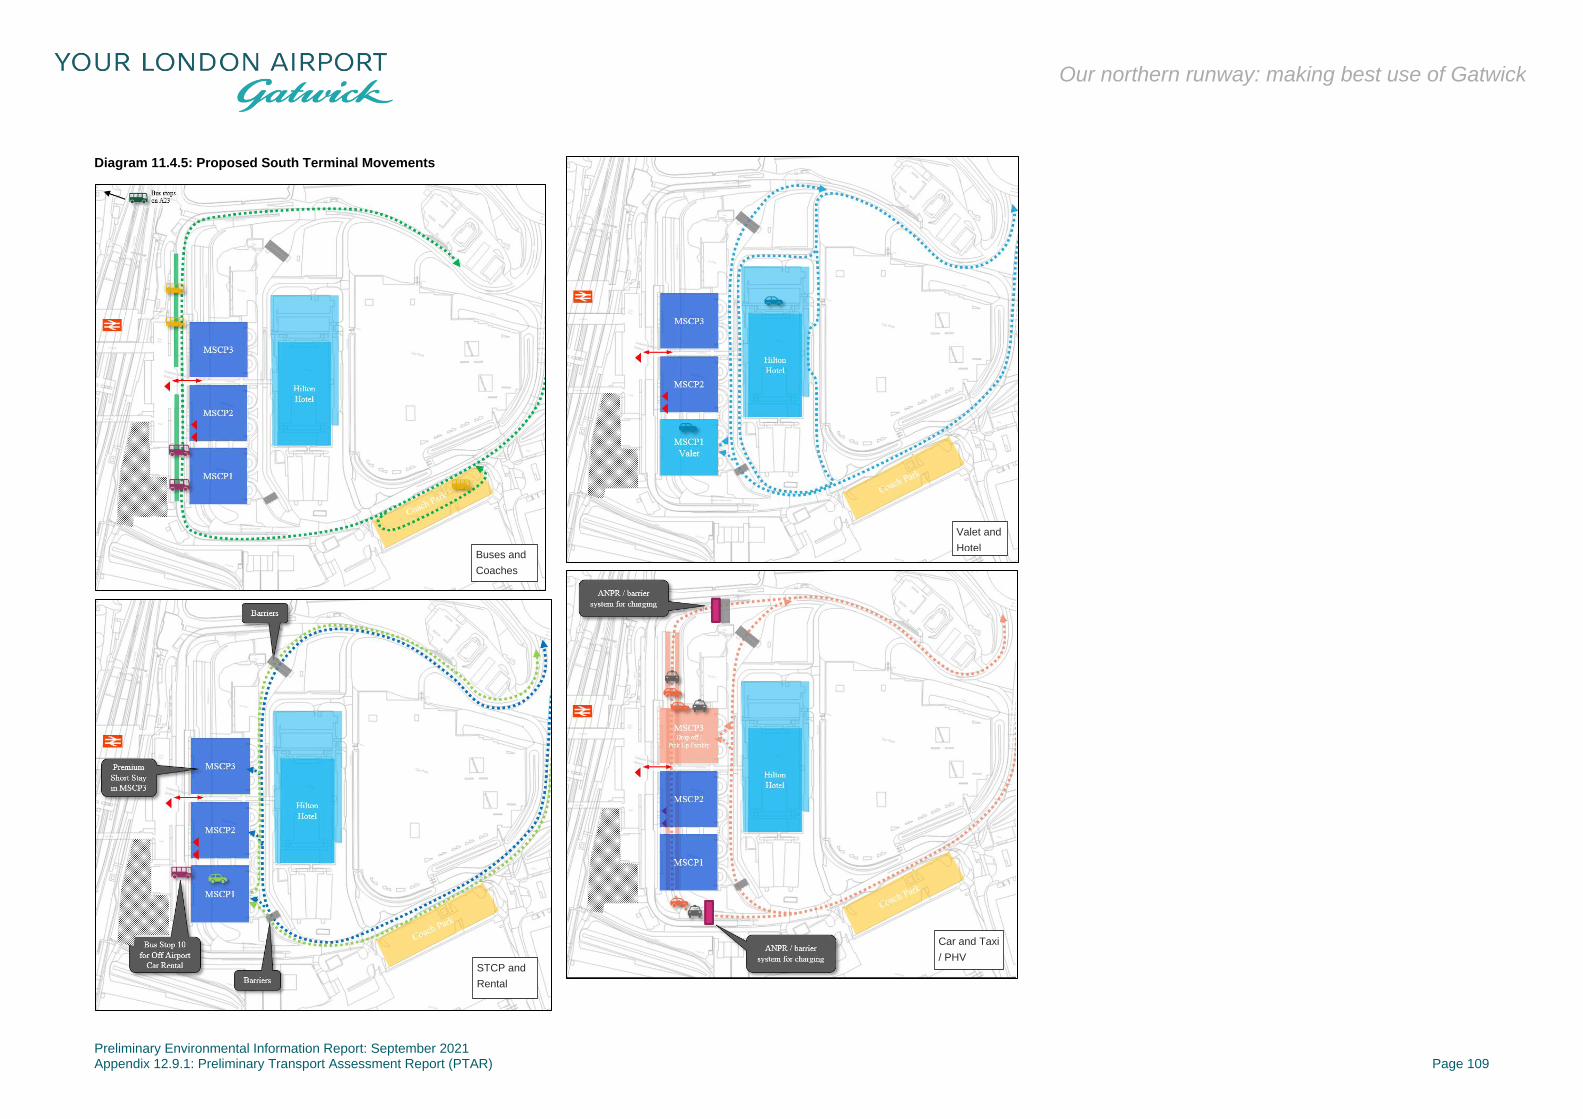
11.4.23 The South Terminal forecourt generally has more capacity than
the North Terminal and it is not expected that significant changes
are required. Additional highway infrastructure is proposed to
create the same charging regime as at North Terminal. The use
of MSCP3 for pick up / drop off could also be expanded.
11.4.24 Diagram 11.4.5 below illustrates the proposed vehicles
movements in the South Terminal forecourt.
11.4.25 The demand for the South Terminal forecourt with the northern
runway in operation under the Project scenarios for 2032 and
2047 is shown in Table 11.4.2.
Table 11.4.2: South Terminal Forecast drop off / pick up (2032 and 2047 with Project)
Drop Off /
Pick Up
Activity
Peak
hourly pick
up + drop
off demand
No. of Spaces Required
2 minute dwell time
5 minute dwell time
2032 with Project
Overall Peak
1,424 47 (315m) 119 (797m)
- Arrivals 405 13 34
- Departures 996 33 83
Peak
Departures 1,086 36 91
2047 with Project
Overall Peak
1,575 53 (355m) 131 (878m)
- Arrivals 464 15 39
- Departures 1,026 34 86
Peak
Departures 1,157 39 96
Preliminary Environmental Information Report: September 2021 Appendix 12.9.1: Preliminary Transport Assessment Report (PTAR) Page 108
Our northern runway: making best use of Gatwick
Diagram 11.4.4: Proposed North Terminal Movements
STCP and
Rental
Car and
Taxi / PHV
Valet and
Hotel Buses and
Coaches
Preliminary Environmental Information Report: September 2021 Appendix 12.9.1: Preliminary Transport Assessment Report (PTAR) Page 109
Our northern runway: making best use of Gatwick
Diagram 11.4.5: Proposed South Terminal Movements
Buses and
Coaches
Car and Taxi
/ PHV
Valet and
Hotel
STCP and
Rental
Preliminary Environmental Information Report: September 2021 Appendix 12.9.1: Preliminary Transport Assessment Report (PTAR) Page 110
Our northern runway: making best use of Gatwick
12 Active Travel: Walking and Cycling
12.1 Introduction
12.1.1 Although less than 0.5% of air passengers travel to the airport on
foot or by bicycle, these modes are important for employee travel.
3% of staff at the airport regularly walk or cycle to work. These
are supported under the Travel Plan with a number of initiatives
for staff to consider sustainable modes as well as supporting
infrastructure including cycle parking at a number of locations.
12.2 Approach and Methodology
12.2.1 The attractiveness of walking and cycling to work is influenced by
several factors, including distance, safety, the quality of available
routes, and the level of amenities and incentives provided on-site
(such as showers and lockers).
12.2.2 The latest available employee survey data from GAL has been
analysed to map trip-end patterns to better understand the home
locations of employees currently using active travel. GIS methods
provide the basis for understanding the catchment area for
walking and cycling. A qualitative assessment of routes has been
undertaken to assess opportunities for increasing walking and
cycling mode shares and improving the active travel experience
for employees, based on site visits and visual inspection.
12.3 Current Active Travel Patterns at Gatwick
12.3.1 As of the latest GAL survey, approximately 3% of employees
walk or cycle to work (about 1% and 2% respectively) on an
average day. It is estimated that the average travel time for walk-
to-work trips is approximately 25 minutes, or about a 2.5 km walk
at an average walking speed. The average travel time for cycling
is 22 minutes, which at an average speed of 19 km/hr (or
12 mph) indicates a primary catchment of approximately 6km to
8km. This implies that walking trips are primarily generated from
the immediate vicinity surrounding the airport, while cycling trips
occur from locations slightly further afield.
12.3.2 Geographic analysis of the employee survey data supports these
insights. Data mapped in Diagram 12.3.1 and Diagram 12.3.2
shows walking and cycling trips into Gatwick by staff, assuming
13,000 staff on site on a typical work day.
12.3.3 Approximately 115 employees walk to work at Gatwick, the vast
majority of whom – over 70% – live in Horley. While some
employees walk from areas in Crawley and towns in Mole Valley
to the west of Gatwick, such as Charlwood, most residential
areas fall outside the catchment area for walking, especially
considering the limited number of entry points into the airport and
the busyness of highways around the Airport.
12.3.4 Cycling has a wider catchment area. Of the 216 employees
cycling to work, just under half come from Horley and surrounding
communities. An additional 32% come in from Crawley, which
reflects the fact that while most people find the walk from Crawley
too far, it is within a 30-minute cycle of the airport. Small numbers
of employees at Gatwick cycle from further areas, such as
Horsham, communities in Mid-Sussex and from the north.
12.3.5 Although the overall mode shares for active travel are low when
considering all airport employees, they are substantial in the
areas immediately surrounding the airport and present a
significant opportunity. In central Horley, more than one third of
employees walk or cycle to work; in Greenfields to the northwest,
this figure is over 20%, and in north-east Horley, it is 15%. In
sections of Mole Valley including Hookwood and Charlwood lying
just west of airport, walking and cycling mode share is almost
15%, and in areas of Crawley immediately south of Gatwick, over
8% walk and cycle.

Preliminary Environmental Information Report: September 2021 Appendix 12.9.1: Preliminary Transport Assessment Report (PTAR) Page 111
Our northern runway: making best use of Gatwick
Diagram 12.3.1: Home locations of employees walking to work
Diagram 12.3.2: Home locations of employees cycling to work

Preliminary Environmental Information Report: September 2021 Appendix 12.9.1: Preliminary Transport Assessment Report (PTAR) Page 112
Our northern runway: making best use of Gatwick
12.4 Active travel infrastructure
Key Routes
12.4.1 Gatwick is connected with its surrounding communities by a
network of local streets and highways, as well as National Cycle
Network Route 21 (NCN21) which runs north and south to the
west of the railway line. Additionally, the areas around the airport
are connected by a variety of public footpaths and bridleways,
including the Sussex Border Path, mostly providing connectivity
through wooded areas and farmland. The network of key links for
pedestrians and cyclists is shown in Diagram 12.4.1.
12.4.2 NCN21 provides the key active travel link into the airport, with a
mixture of on-road and off-road cycle facilities that result in a
disjointed north/south link. A signage strategy has been
implemented to direct cyclists and pedestrians along
underpasses and overbridges. While some sections of the route
provide adequate lighting and priority off-road space, other
sections are less well signed and require users to switch to on-
road facilities.
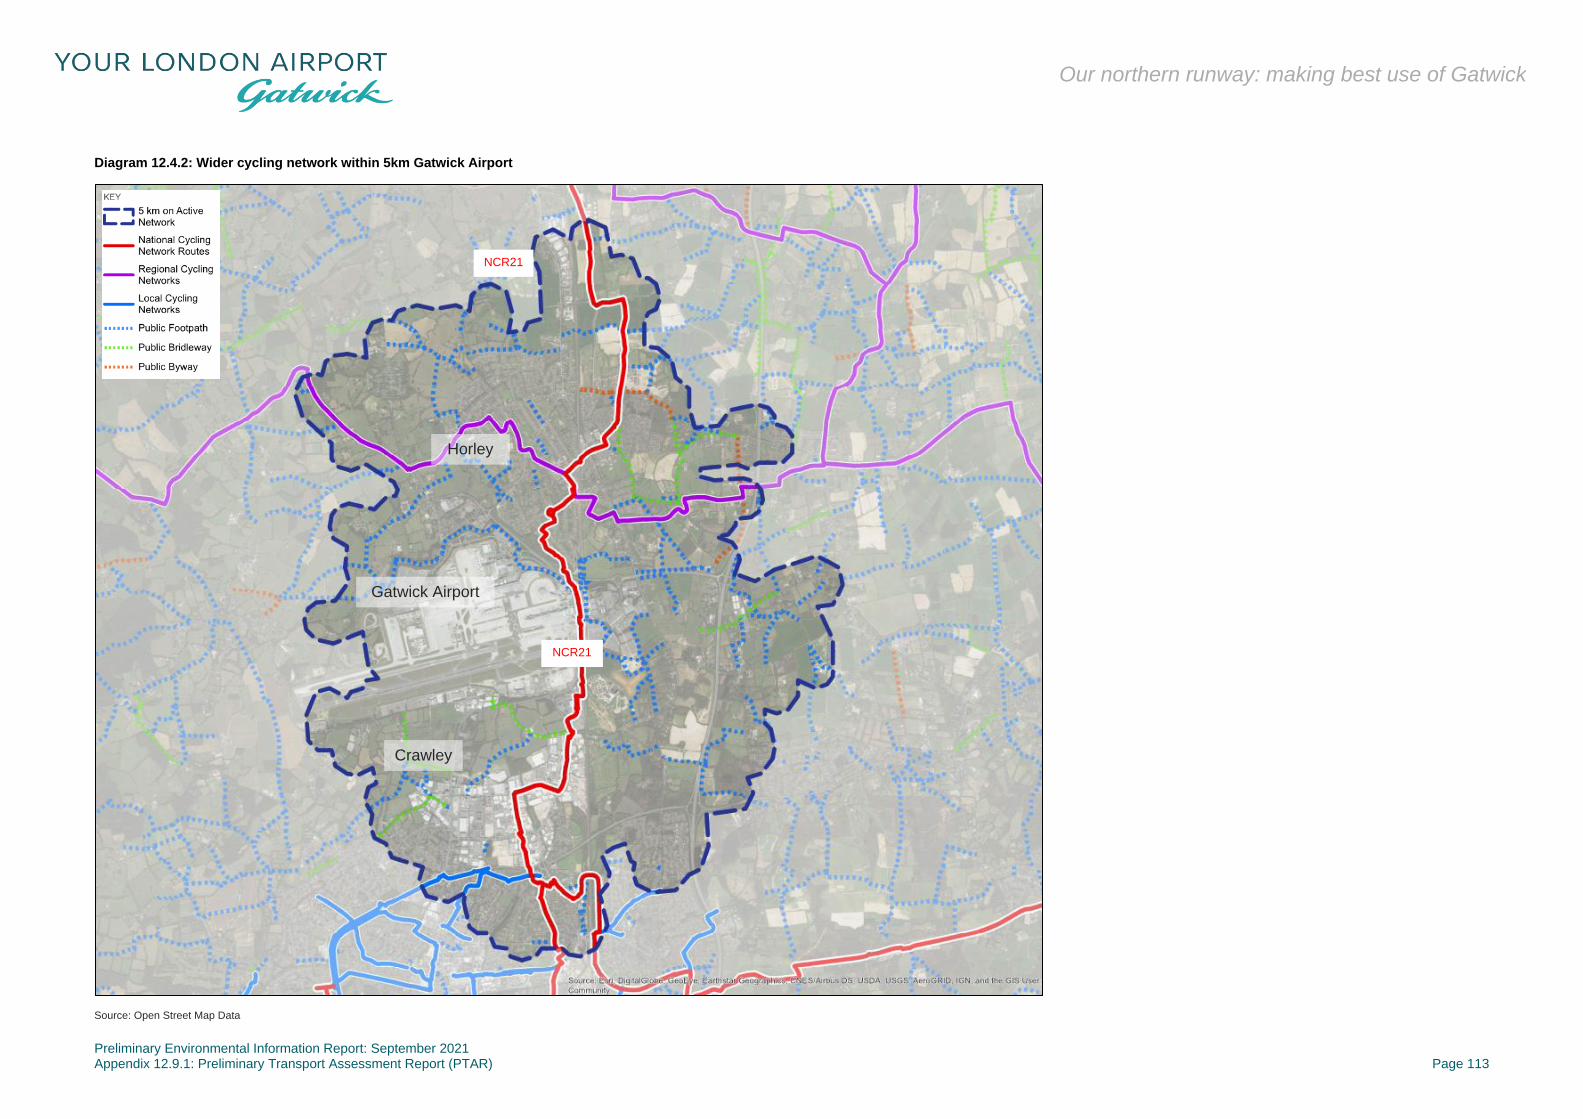
12.4.3 Diagram 12.4.2 shows a wider view of cycling routes within 5 km
of the airport. This illustrates the connection to Gatwick via local
routes into the centre of Crawley. It also shows the Surrey
Cycleway through Horley. These routes are primarily on-street
but provide connections with the north-south NCN21.
Diagram 12.4.1: Active travel network around Gatwick Airport
Preliminary Environmental Information Report: September 2021 Appendix 12.9.1: Preliminary Transport Assessment Report (PTAR) Page 113
Our northern runway: making best use of Gatwick
Diagram 12.4.2: Wider cycling network within 5km Gatwick Airport
Source: Open Street Map Data
NCR21
NCR21
Horley
Crawley
Gatwick Airport
Preliminary Environmental Information Report: September 2021 Appendix 12.9.1: Preliminary Transport Assessment Report (PTAR) Page 114
Our northern runway: making best use of Gatwick
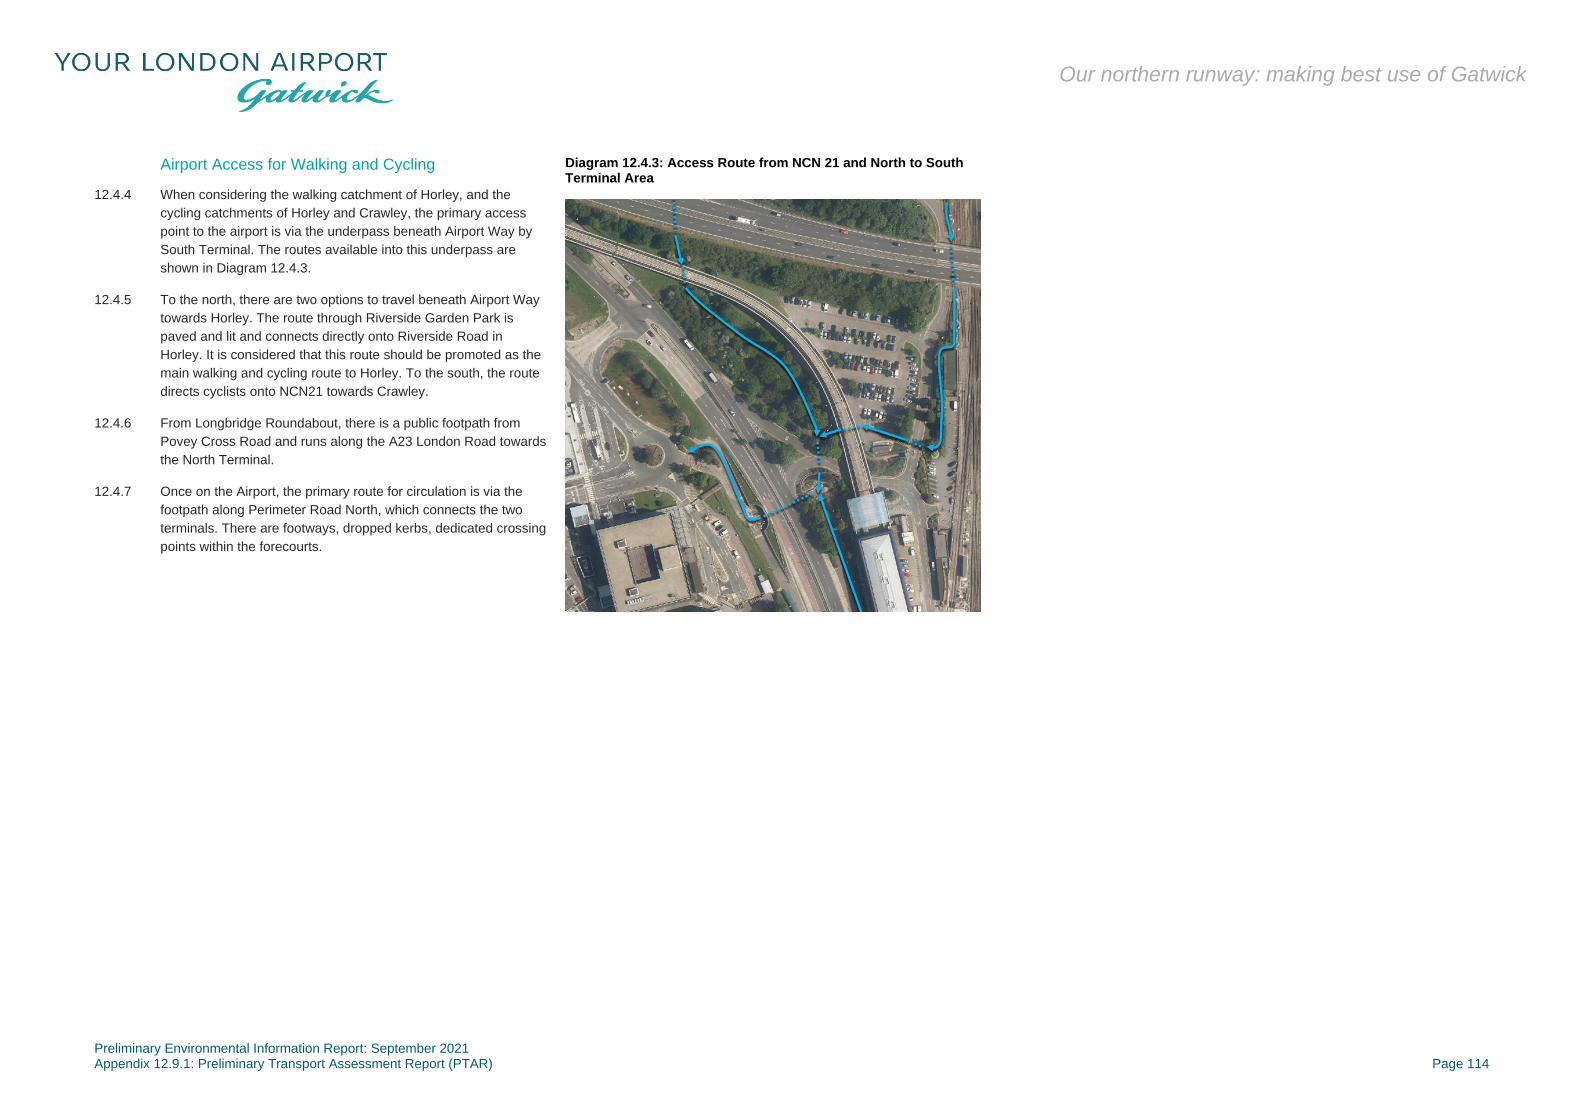
Airport Access for Walking and Cycling
12.4.4 When considering the walking catchment of Horley, and the
cycling catchments of Horley and Crawley, the primary access
point to the airport is via the underpass beneath Airport Way by
South Terminal. The routes available into this underpass are
shown in Diagram 12.4.3.
12.4.5 To the north, there are two options to travel beneath Airport Way
towards Horley. The route through Riverside Garden Park is
paved and lit and connects directly onto Riverside Road in
Horley. It is considered that this route should be promoted as the
main walking and cycling route to Horley. To the south, the route
directs cyclists onto NCN21 towards Crawley.
12.4.6 From Longbridge Roundabout, there is a public footpath from
Povey Cross Road and runs along the A23 London Road towards
the North Terminal.
12.4.7 Once on the Airport, the primary route for circulation is via the
footpath along Perimeter Road North, which connects the two
terminals. There are footways, dropped kerbs, dedicated crossing
points within the forecourts.
Diagram 12.4.3: Access Route from NCN 21 and North to South Terminal Area

Preliminary Environmental Information Report: September 2021 Appendix 12.9.1: Preliminary Transport Assessment Report (PTAR) Page 115
Our northern runway: making best use of Gatwick
Diagram 12.4.4: Gatwick cycling facilities
Source: https://www.gatwickairport.com/globalassets/to-and-from/airport-cycle-routes-and-
facilities.pdf
Preliminary Environmental Information Report: September 2021 Appendix 12.9.1: Preliminary Transport Assessment Report (PTAR) Page 116
Our northern runway: making best use of Gatwick
Bicycle Parking and Amenities
12.4.8 Currently, Gatwick provides upwards of 300 cycle parking spaces
for airport staff and the general public. Cycle parking is available
in several of the staff car parks, including car parks B, M and L.
Much of the parking is clustered in the vicinity of the NCN 21
cycle route.
12.4.9 A locker and shower room is available to staff at the South
Terminal, with another shower room at Atlantic House. Jubilee
House provides the shower facility at the North Terminal.
Improvements to Walking and Cycling
12.4.10 GAL is exploring options to improve walking and cycling and have
submitted proposals to improve linkages alongside the CIP
improvements proposed for highways (see Section 11.2.10). The
proposals include:
▪ new footways and pedestrian and cycle bridge over the
River Mole to provide a more direct link between Longbridge
Roundabout and the North Terminal;
▪ Provision of signal-controlled pedestrian crossings at the
North Terminal roundabout;
▪ Shared cycle footway along Perimeter Road North; and
▪ Improved connection to NCN21 at the South Terminal.
12.4.11 The proposals are shown in Diagram 12.4.5 to Diagram 12.4.7.
12.4.12 There is a network of walking and cycling routes to Gatwick and it
is proposed that the key routes shown in Diagram 12.4.8 should
be promoted as the main access to the airport. These routes are
considered to be more direct and of higher quality, suitable for
staff and local residents, compared to the alternative public rights
of way routes which may be more suitable for leisure users and
ramblers, such as the Sussex Border Path.
12.4.13 At this stage and to be conservative, no walking and cycling
improvements have been included in any of the modelling and
therefore these improvements would provide a benefit over and
above the findings in this PTAR.

Preliminary Environmental Information Report: September 2021 Appendix 12.9.1: Preliminary Transport Assessment Report (PTAR) Page 117
Our northern runway: making best use of Gatwick
Diagram 12.4.5: Proposed Longbridge walking and cycling improvements

Preliminary Environmental Information Report: September 2021 Appendix 12.9.1: Preliminary Transport Assessment Report (PTAR) Page 118
Our northern runway: making best use of Gatwick
Diagram 12.4.6: Proposed North Terminal walking and cycling improvements

Preliminary Environmental Information Report: September 2021 Appendix 12.9.1: Preliminary Transport Assessment Report (PTAR) Page 119
Our northern runway: making best use of Gatwick
Diagram 12.4.7: Proposed South Terminal walking and cycling improvements

Preliminary Environmental Information Report: September 2021 Appendix 12.9.1: Preliminary Transport Assessment Report (PTAR) Page 120
Our northern runway: making best use of Gatwick
Diagram 12.4.8: Proposed promoted walking and cycling routes
12.5 Opportunities to Increase Active Travel
12.5.1 In 2016, 11% of Gatwick employees travelled 3 miles or fewer to
work by car. Many of these employees who drive are within a
comfortable distance to walk or cycle instead. Analysis of
previous survey data for 2012 shows that 1 in 10 staff could have
chosen to walk or cycle rather than drive.
12.5.2 The ASAS accompanying the DCO application will further
develop Gatwick’s strategic plan for walking and cycling.
Strategies that will be explored and will include the following.
▪ Increased and improved amenities: Gatwick already
provides locker and shower facilities to employees choosing
to walk or cycle to work as well as cycle parking. Increasing
the quantity or improving the quality of these facilities, as
well as optimising their location, will further incentivise active
travel amongst employees.
▪ Improved routes on the airport: Identifying and improving
‘gaps’ in infrastructure provision which may include provision
of additional cycleways, footways, and improved crossings,
as described above and as shown in Diagram 12.4.5 to
Diagram 12.4.7. As appropriate, these routes should be
separated from vehicular traffic.
▪ Improved connections: Some employees may find
travelling to and from NCN21 or other key parts of the
existing active travel network difficult or unsafe. Strategic
investment in the wider network in Horley and Crawley could
improve employee access and willingness to walk or cycle
and Gatwick will work with Local Authorities to identify
measures to improve these journeys.
▪ Improved permeability: As discussed above, the primary
access point into the airport is the underpass under the A23
and into South Terminal. Additional, secure entrances and
routes may need to be considered, such as the proposed
route from Horley via Longbridge Roundabout, around car
park Y and into the North Terminal and then along Perimeter
Road to the South Terminal.
▪ Improved wayfinding: In some areas on the airport, it may
be possible to enhance the sense of connectivity for users
by improving or introducing new wayfinding signage.
Gatwick has already begun this process along Perimeter
Road North.
Preliminary Environmental Information Report: September 2021 Appendix 12.9.1: Preliminary Transport Assessment Report (PTAR) Page 121
Our northern runway: making best use of Gatwick
13 Railway Station and Inter-Terminal
Shuttle Assessment
13.1 Gatwick Airport Railway Station
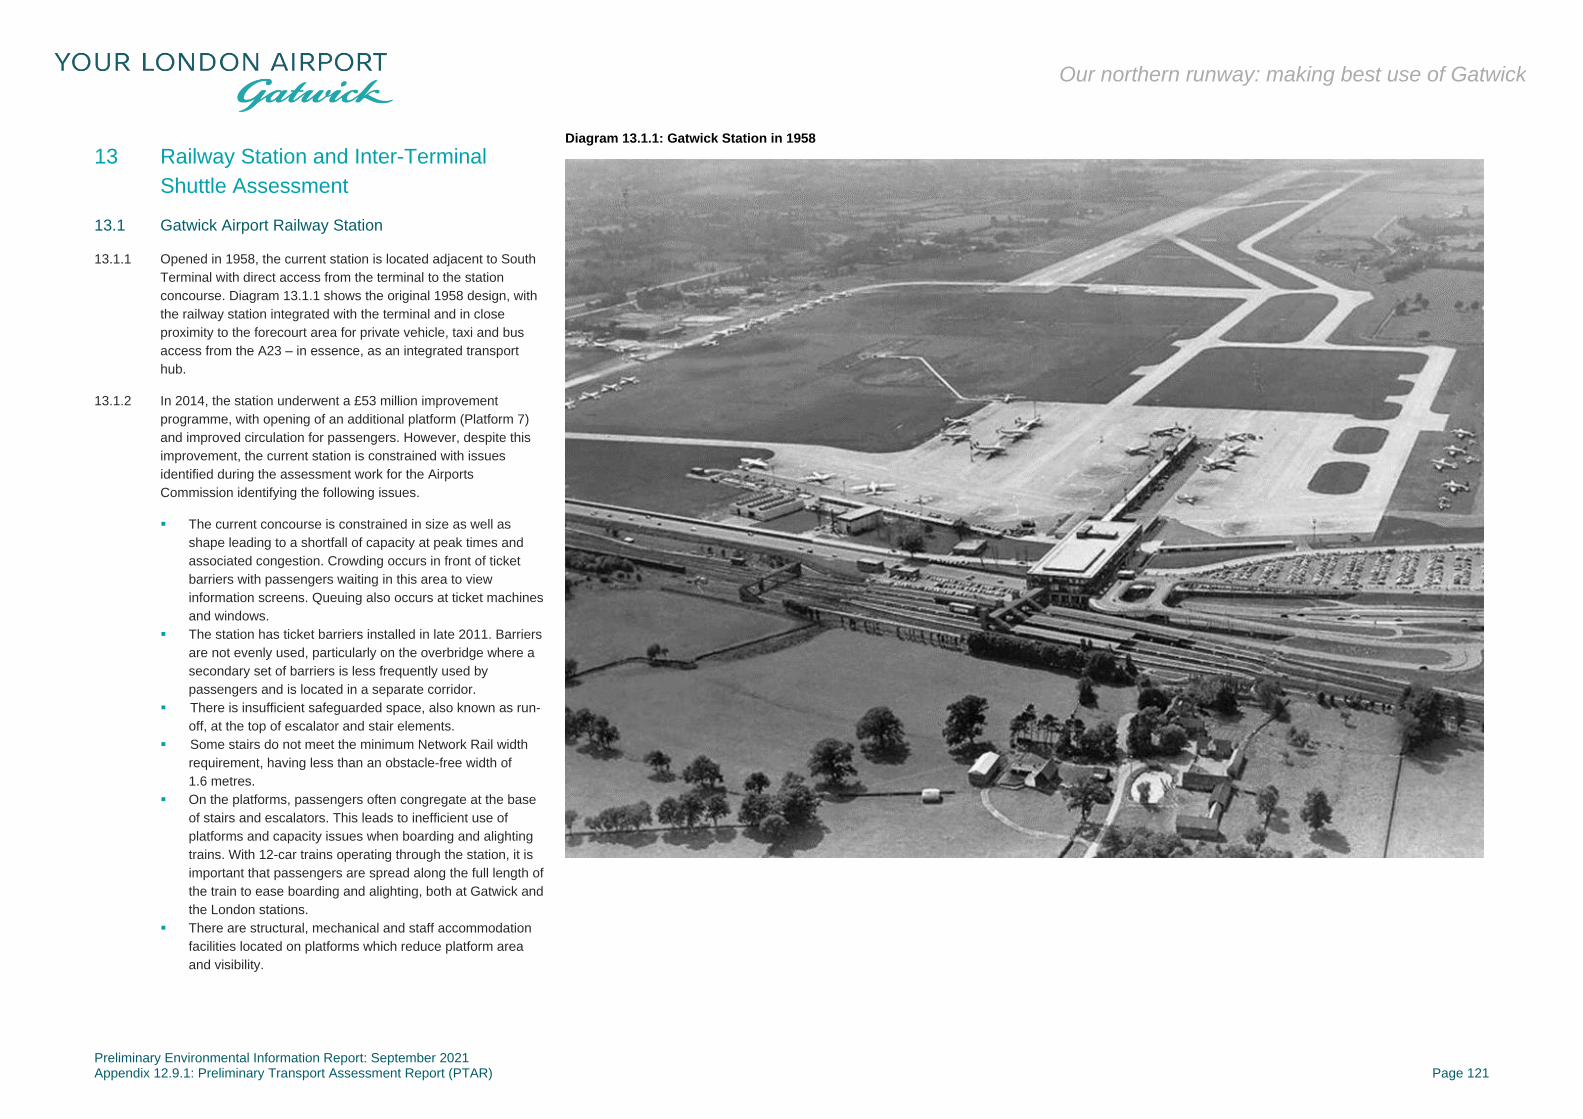
13.1.1 Opened in 1958, the current station is located adjacent to South
Terminal with direct access from the terminal to the station
concourse. Diagram 13.1.1 shows the original 1958 design, with
the railway station integrated with the terminal and in close
proximity to the forecourt area for private vehicle, taxi and bus
access from the A23 – in essence, as an integrated transport
hub.
13.1.2 In 2014, the station underwent a £53 million improvement
programme, with opening of an additional platform (Platform 7)
and improved circulation for passengers. However, despite this
improvement, the current station is constrained with issues
identified during the assessment work for the Airports
Commission identifying the following issues.
▪ The current concourse is constrained in size as well as
shape leading to a shortfall of capacity at peak times and
associated congestion. Crowding occurs in front of ticket
barriers with passengers waiting in this area to view
information screens. Queuing also occurs at ticket machines
and windows.
▪ The station has ticket barriers installed in late 2011. Barriers
are not evenly used, particularly on the overbridge where a
secondary set of barriers is less frequently used by
passengers and is located in a separate corridor.
▪ There is insufficient safeguarded space, also known as run-
off, at the top of escalator and stair elements.
▪ Some stairs do not meet the minimum Network Rail width
requirement, having less than an obstacle-free width of
1.6 metres.
▪ On the platforms, passengers often congregate at the base
of stairs and escalators. This leads to inefficient use of
platforms and capacity issues when boarding and alighting
trains. With 12-car trains operating through the station, it is
important that passengers are spread along the full length of
the train to ease boarding and alighting, both at Gatwick and
the London stations.
▪ There are structural, mechanical and staff accommodation
facilities located on platforms which reduce platform area
and visibility.
Diagram 13.1.1: Gatwick Station in 1958

Preliminary Environmental Information Report: September 2021 Appendix 12.9.1: Preliminary Transport Assessment Report (PTAR) Page 122
Our northern runway: making best use of Gatwick
13.1.3 These constraints have been reaffirmed by consultation
responses on Gatwick’s 2018 Master Plan, which include 13
stakeholder comments on the need to improve the railway
station, eg the Sussex Community Rail Partnership Limited which
stated that ‘upgrading work to improve the station is essential to
reduce current ticket hall and platform congestion’.
13.1.4 As such, Gatwick has been working with the Department for
Transport, Network Rail and other stakeholders to develop an
appropriate design to improve passenger experience in the
station, as part of the Station Project.
13.1.5 In July 2019, the Department for Transport announced £150
million investment in the Station Project, which will include
doubling the size of the station concourse, adding five new lifts
and eight escalators to improve passenger flow, and widening
two platforms to reduce crowding.
Diagram 13.1.2: Station Project Enhancements
13.1.6 The Station Project is currently under construction, despite the
Covid pandemic, and should be complete by 2022. It is therefore
the reference design for all future assessment work on the
station.
13.2 Inter-Terminal Shuttle
13.2.1 Located in close proximity to the railway station is the Inter-
Terminal Shuttle which takes passengers arriving by rail to or
from the North Terminal. The shuttle operates as two trains of
three Innovia APM 100 cars as manufactured by Bombardier.
These two trains each operate on their own track, with a peak
headway of 6 minutes, which means that passengers never wait
more than 3 minutes for a train at peak times.
Diagram 13.2.1: Gatwick Inter-Terminal Shuttle System
13.2.2 There is a shuttle station at each end of the system, with a single
central boarding platform between the two tracks and two
alighting platforms, on the outside of each track. This means that
boarding and alighting flows can be kept separate which reduces
congestion and dwell times.
13.2.3 The system was upgraded in 2010 and has an average design
life of 25 years, meaning another upgrade is likely to be required
prior to the end of the assessment period. Modelling reported
here has assumed the current shuttle configuration and service
frequency, though future improvements have been identified (see
Section 13.5.21).

Preliminary Environmental Information Report: September 2021 Appendix 12.9.1: Preliminary Transport Assessment Report (PTAR) Page 123
Our northern runway: making best use of Gatwick
13.3 Legion Model
Model History
13.3.1 Network Rail provided GAL with the 2036 Legion model
developed as part of the Gatwick Station Project and used to
demonstrate the performance of the station under AM and PM
peak demand conditions. The model was provided on 19 March
2019.
Model Extents
13.3.2 The model of station as provided by Network Rail includes the
existing concourse, the new concourse and all seven platforms,
as shown in Diagram 13.3.1.
13.3.3 The model provided by Network Rail has been built on the
following assumptions.
▪ An ungated station solution, ie with no gateline, which is the
preferred operation at Gatwick Airport into the future (though
the station project design does allow for the inclusion of
ticket gates).
▪ The existing concourse is primarily the entry concourse to
the station from the airport, with the main Customer
Information Screens and ticket retail accommodated in the
reconfigured concourse.
▪ The concourse provides the main exit route from all
platforms to both the Airport and the South Terminal
forecourt area and interchange with bus and coach services.
It also provides a new entry route to the station from the
South Terminal forecourt, which is new and which will benefit
commuters who park at Gatwick Airport and use the station
for journeys into London and elsewhere on the rail network.
Customer Information Screens will also be provided on this
concourse.
▪ The station will continue to operate broadly as per current
passenger flows, with boarding passengers encouraged to
wait on the platforms as far as possible (to safeguard train
dwell times).
▪ The passenger composition (the number of passengers with
luggage and restricted mobility) passing through the station
is based on NR’s passenger survey carried out at the station
in May 2014.
13.3.4 Arup has taken Network Rail’s validated and calibrated Legion
model and extended it to include the inter-terminal shuttle
operation. Diagram 13.3.2 shows the South Terminal station but
the model now also includes the North Terminal station which is
configured in the same way, with a central boarding platform and alighting platforms on the outside.
13.3.5 The shuttle operation has been calibrated to video and CCTV footage, in particular for loading of boarding platforms and maximum loading of the
shuttle itself
Diagram 13.3.1: Legion Model of Gatwick Airport Rail Station
Diagram 13.3.2: Legion Model of Inter-Terminal Shuttle Extension (South Terminal)
South
Terminal
South Terminal Forecourt
Station
Concour
P1/2
P3/4
P5/6
P7
Station
Overbrid
Boarding Platform
Alighting Platform
Alighting Platform
Preliminary Environmental Information Report: September 2021 Appendix 12.9.1: Preliminary Transport Assessment Report (PTAR) Page 124
Our northern runway: making best use of Gatwick
Demand
13.3.6 Testing of Gatwick Airport Station and the shuttle has been
undertaken for four future demand scenarios; future baseline
2032 and 2047, as well as for 2032 and 2047 with the Project.
Both the AM and PM 2-hour peak have been modelled.
13.3.7 Demand into and out of the station taken from the strategic rail
model for the specific peak hours modelled.
13.3.8 Entity groups include passengers arriving at or departing from
Gatwick Airport and using rail, passengers using the South
Terminal Forecourt and commuters using Gatwick Airport railway
station. Interchange movements are also included and have been
calculated as 7.3% of the total station entry and exit journeys,
based on the 2015/16 Office of Road and Rail (ORR) Station
Footfall figures. Table 13.3.1 shows the total modelled demand
across a 2-hour AM and PM peak in line with the strategic
modelling, as compared to demand in the 2036 Network Rail
model. These demand numbers include rail passengers as well
as people using South Terminal forecourt and parts of the South
Terminal.
13.3.9 Demand in the 2032 and 2047 models as compared to the 2036
Network Rail model is provided in Table 13.3.1 It can be seen
that demand in the 2032 and 2047 models with Project is higher
than the previous 2036 demand test used for the Station Project,
even by 2032. The PM peak has therefore been assessed in the
EIA and PTAR.
Passenger Types and Luggage
13.3.10 The passenger composition is based on Network Rail’s
passenger survey carried out in May 2014, and divides
passengers across three types: no luggage, medium luggage and
large luggage.
Train Timetable
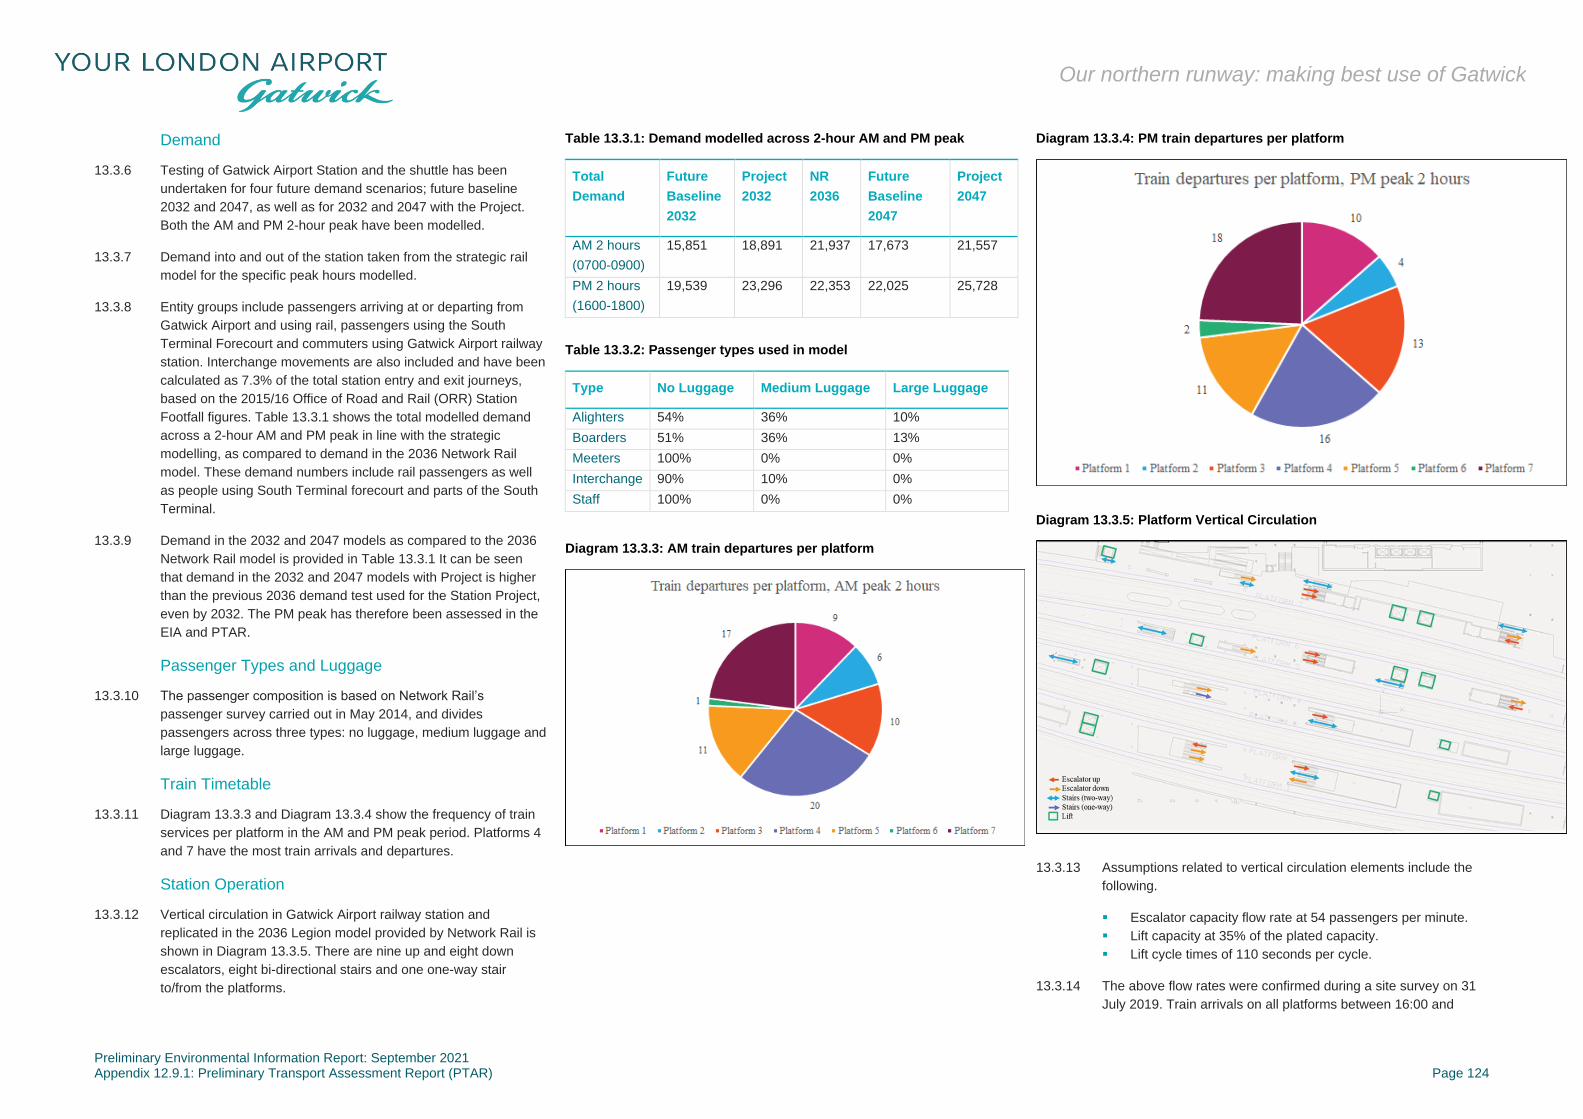
13.3.11 Diagram 13.3.3 and Diagram 13.3.4 show the frequency of train
services per platform in the AM and PM peak period. Platforms 4
and 7 have the most train arrivals and departures.
Station Operation
13.3.12 Vertical circulation in Gatwick Airport railway station and
replicated in the 2036 Legion model provided by Network Rail is
shown in Diagram 13.3.5. There are nine up and eight down
escalators, eight bi-directional stairs and one one-way stair
to/from the platforms.
Table 13.3.1: Demand modelled across 2-hour AM and PM peak
Total
Demand
Future
Baseline
2032
Project
2032
NR
2036
Future
Baseline
2047
Project
2047
AM 2 hours
(0700-0900)
15,851 18,891 21,937 17,673 21,557
PM 2 hours
(1600-1800)
19,539 23,296 22,353 22,025 25,728
Table 13.3.2: Passenger types used in model
Type No Luggage Medium Luggage Large Luggage
Alighters 54% 36% 10%
Boarders 51% 36% 13%
Meeters 100% 0% 0%
Interchange 90% 10% 0%
Staff 100% 0% 0%
Diagram 13.3.3: AM train departures per platform
Diagram 13.3.4: PM train departures per platform
Diagram 13.3.5: Platform Vertical Circulation
13.3.13 Assumptions related to vertical circulation elements include the
following.
▪ Escalator capacity flow rate at 54 passengers per minute.
▪ Lift capacity at 35% of the plated capacity.
▪ Lift cycle times of 110 seconds per cycle.
13.3.14 The above flow rates were confirmed during a site survey on 31
July 2019. Train arrivals on all platforms between 16:00 and

Preliminary Environmental Information Report: September 2021 Appendix 12.9.1: Preliminary Transport Assessment Report (PTAR) Page 125
Our northern runway: making best use of Gatwick
17:30 were observed and escalator flow rates recorded. For
escalators with a continuous demand over 1 minute, flow rates
observed were between 52 and 57 people per minute.
13.3.15 The following maximum flow rates for stairs have been used from
Network Rail’s Station Capacity Planning Guidance (Network
Rail, 2016).
▪ Stairs (one-way): 35 passengers/minute/metre.
▪ Stairway (two-way): 28 passengers/minute/metre.
Shuttle Operation
13.3.16 The shuttle connections between the North and South Terminals
have been added to the Network Rail model. Diagram 13.3.6
shows the pattern of service to achieve a 6-minute shuttle
headway. Timings are based on data received from GAL and a
site survey.
Diagram 13.3.6: 6-minute shuttle operation times
13.4 Assessment Criteria
Levels of Service
13.4.1 The analysis has been undertaken against Network Rail’s Station
Capacity Planning Guidance (November 2016). The assessment
of crowding is based on Fruin Level of Service (LoS) criteria.
13.4.2 In the 1970s and 1980s, John Fruin pioneered pedestrian
planning analysis and the development of LoS criteria for
pedestrians – previously Level of Service metrics had only been
used to describe vehicular traffic flow by highways agencies
(Fruin, 1987).
13.4.3 LoS is used to describe pedestrian movement, relating density of
pedestrians and flow rates for walkways and circulation areas,
stairs and in queues, with LoS A representing free flow and LoS F
a complete breakdown in circulation.
13.4.4 LoS C is typically used for designing transport interchanges as it
provides a balance between congestion, design and operations.
Network Rail therefore typically recommends LoS C or better for
the design of new stations and station enhancements.
Diagram 13.4.1: Levels of Service ranges

Preliminary Environmental Information Report: September 2021 Appendix 12.9.1: Preliminary Transport Assessment Report (PTAR) Page 126
Our northern runway: making best use of Gatwick
13.4.5 It is important to note that Fruin differentiates between LoS for
walkways – areas where a pedestrian would expect free
movement – and queues/waiting areas – where pedestrians
tolerate higher densities and still consider their environment
comfortable. The difference between flow rates and area
requirements for walkways and queues at each LoS range are
very different, as shown in Table 13.4.1.
13.4.6 Platforms are considered as a queuing/waiting environment and
Network Rail guidance states that these should perform at LoS
B/C or 0.93 m2 per person. Similarly, concourse waiting areas
should perform at LoS B for queuing/waiting behaviour at 1.0 m2
per person.
13.4.7 This is an important consideration when reviewing any Legion
outputs shown in this report. The typical approach is to show a
Fruin walkways map such that the overall station performance
can be considered. This mapping is likely showing areas of
queuing as LoS D or E for walkways – ie less than 1.0 m2 per
person. However, if these locations are where a queue should
occur, such as at the top or bottom of an escalator, at gatelines or
for boarding on a platform, the queuing density is more
appropriate.
Table 13.4.1: Fruin Level of Service criteria for Walkways and Queues
Level of
Service
Fruin Walkways Fruin Queues
Flow (people per m of circulation width)
Area per Person (m2)
Area per Person (m2)
A 23 or less 3.3 or more 1.2 or more
B 23 to 33 2.3 to 3.3 0.9 to 1.2
C 33 to 49 1.4 to 2.3 0.7 to 0.9
D 49 to 66 0.9 to 1.4 0.3 to 0.7
E 66 to 82 0.5 to 0.9 0.2 to 0.3
F 82 and over 0.5 or less 0.2 or less
13.5 Comparison of Baseline and Project
2032 Future Baseline
13.5.1 Diagram 13.5.1 and Diagram 13.5.2 show LoS for the peak 15
minutes in the 2032 future baseline for the concourse and for the
platform level in terms of Fruin Walkways.
13.5.2 From Diagram 13.5.1, it can be seen that the station concourse
level performs at an appropriate Level of Service in the 2032
future baseline, with predominantly LoS A to LoS C shown by
modelling. Higher densities are shown on escalator elements
which reflects people bunching on escalator treads which is
typical and expected.
13.5.3 From Diagram 13.5.2, it can be seen that platforms performs at
an appropriate Level of Service in the 2032 future baseline, with
predominantly LoS C or better shown by the modelling. Higher
densities are shown on some narrower sections of platform as
well as at the base of escalator elements, in particular on
Platforms 3 and 7, which reflects that these are waiting or
queuing environments. As described in section 13.4, these higher
densities are typical and expected at such locations.
Diagram 13.5.1: Concourse LoS, Fruin Walkways – 2032 Future Baseline PM Peak (17:45 – 18:00)
Diagram 13.5.2: Platform LoS, Fruin Walkways – 2032 Future Baseline PM Peak (17:45 – 18:00)

Preliminary Environmental Information Report: September 2021 Appendix 12.9.1: Preliminary Transport Assessment Report (PTAR) Page 127
Our northern runway: making best use of Gatwick
2047 Future Baseline
13.5.4 Diagram 13.5.3 and Diagram 13.5.4 show LoS for the peak 15
minutes in the 2047 future baseline for the concourse and for the
platform level in terms of Fruin Walkways.
13.5.5 From Diagram 13.5.3, it can be seen that the station concourse
level performs at a comparable Level of Service to the 2032
future baseline, with predominantly LoS A to LoS C shown by
modelling.
13.5.6 From Diagram 13.5.4, it can be seen that platforms also perform
at a comparable Level of Service to the 2032 Future Baseline,
with predominantly LoS C or better shown by the modelling.
However, higher densities are shown on some narrower sections
of platform, most notably on Platforms 3 and 7, as well as at the
base of escalator elements, in particular on Platforms 2 and 7.
However, these are queuing or platform waiting environments,
where people expect higher densities as described in 13.4.
Diagram 13.5.3: Concourse LoS, Fruin Walkways – 2047 Future Baseline PM Peak (17:45 – 18:00)
Diagram 13.5.4: Platform LoS, Fruin Walkways – 2047 Future Baseline PM Peak (17:45 – 18:00)
2032 with Project
13.5.7 Diagram 13.5.5 and Diagram 13.5.6 show LoS for the peak 15
minutes in 2032 with Project for the concourse and for the
platform level in terms of Fruin Walkways.
13.5.8 From Diagram 13.5.5, it can be seen that the station concourse
level performs at a comparable Level of Service to the 2032
future baseline, with predominantly LoS A to LoS C shown by
modelling.
13.5.9 From Diagram 13.5.6, it can be seen that platforms also perform
at a comparable Level of Service to the 2032 future baseline, with
predominantly LoS C or better shown by the modelling. However,
higher densities are shown on some narrower sections of
platform, most notably on Platforms 1, 3 and 7, as well as at the
base of escalator elements, in particular on Platforms 2 and 7.
However, these are queuing or platform waiting environments,
where people tolerate higher densities as described in section
13.4.
13.5.10 Level of Service for platforms based on Fruin Queuing are
presented in paragraph 13.5.20 onwards.

Preliminary Environmental Information Report: September 2021 Appendix 12.9.1: Preliminary Transport Assessment Report (PTAR) Page 128
Our northern runway: making best use of Gatwick
Diagram 13.5.5: Concourse LoS, Fruin Walkways – 2032 with Project PM Peak (17:45 – 18:00)
Diagram 13.5.6: Platform LoS, Fruin Walkways – 2032 with Project PM Peak (17:45 – 18:00)
2047 with Project
13.5.11
Diagram 13.5.7 and Diagram 13.5.8 show LoS for the peak 15
minutes in 2047 with the Project for the concourse and for the
platform level in terms of Fruin Walkways.
13.5.12 When compared to Diagram 13.5.3, it can be seen that the
station concourse level performs at a comparable Level of
Service to the 2047 future baseline, with predominantly LoS A to
LoS C shown by modelling.
13.5.13 When compared to Diagram 13.5.4, it can be seen that platforms
also perform at a comparable Level of Service to the 2047 future
baseline, with predominantly LoS C or better shown by the
modelling. However, higher densities are shown on some
narrower sections of platform, most notably on Platforms 1, 3 and
7, as well as at the base of escalator elements, in particular on
Platforms 2 and 7. However, these are queuing or platform
waiting environments, where people tolerate higher densities as
described in 13.4.
13.5.14 Level of Service for platforms based on Fruin Queuing are
presented in paragraph 13.5.20 onwards.
Diagram 13.5.7: Concourse LoS, Fruin Walkways – 2047 with Project PM Peak (17:45 – 18:00)
Diagram 13.5.8: Platform LoS, Fruin Walkways – 2047 with Project PM Peak (17:45 – 18:00)

Preliminary Environmental Information Report: September 2021 Appendix 12.9.1: Preliminary Transport Assessment Report (PTAR) Page 129
Our northern runway: making best use of Gatwick
Summary of Performance
Level of Service
13.5.15 The Level of Service performance across all scenarios for the
existing and new concourses is shown in Diagram 13.5.9 and
Table 12.5.1, excluding escalator elements.
13.5.16 The percentage of passengers experiencing different Level of
Service ranges varies between scenarios however all future
years show station performance at concourse level being
predominantly LoS C or better (95% to 97% of passengers
experience LoS C or better depending on scenario). This
indicates that there is no material difference in performance
between the baseline and with Project scenarios and that
performance is acceptable and appropriate.
13.5.17 The Level of Service performance across all scenarios for the
station platforms is shown in Diagram 13.5.10 and Table 12.5.2,
excluding escalator queuing areas and escalator elements, using
a Walkways comparison i.e. as if the platforms were circulation
environments.
13.5.18 All future years show station performance at platform level at
predominantly LoS C or better (70% to 81% of passengers
experience LoS C or better depending on scenario). However,
the proportion of passengers experiencing more congested
conditions at LoS D also increases into the future and with
Project, with 30% of passengers experiencing higher densities by
2047.
13.5.19 However, it should be noted that platforms are considered more
of a queuing environment than a typical walking environment as
platforms typically have a mix of passengers waiting and standing
still (essentially queuing) or walking at slower speeds to either
move along or exit from the platform. To reflect this type of
environment, Network Rail recommends using Fruin Queuing
Level of Service for platforms, which represents a lower overall
space requirement per passenger. The guidance states that
platforms should perform at Queueing LoS B/C or 0.93 m2 per
person or better.
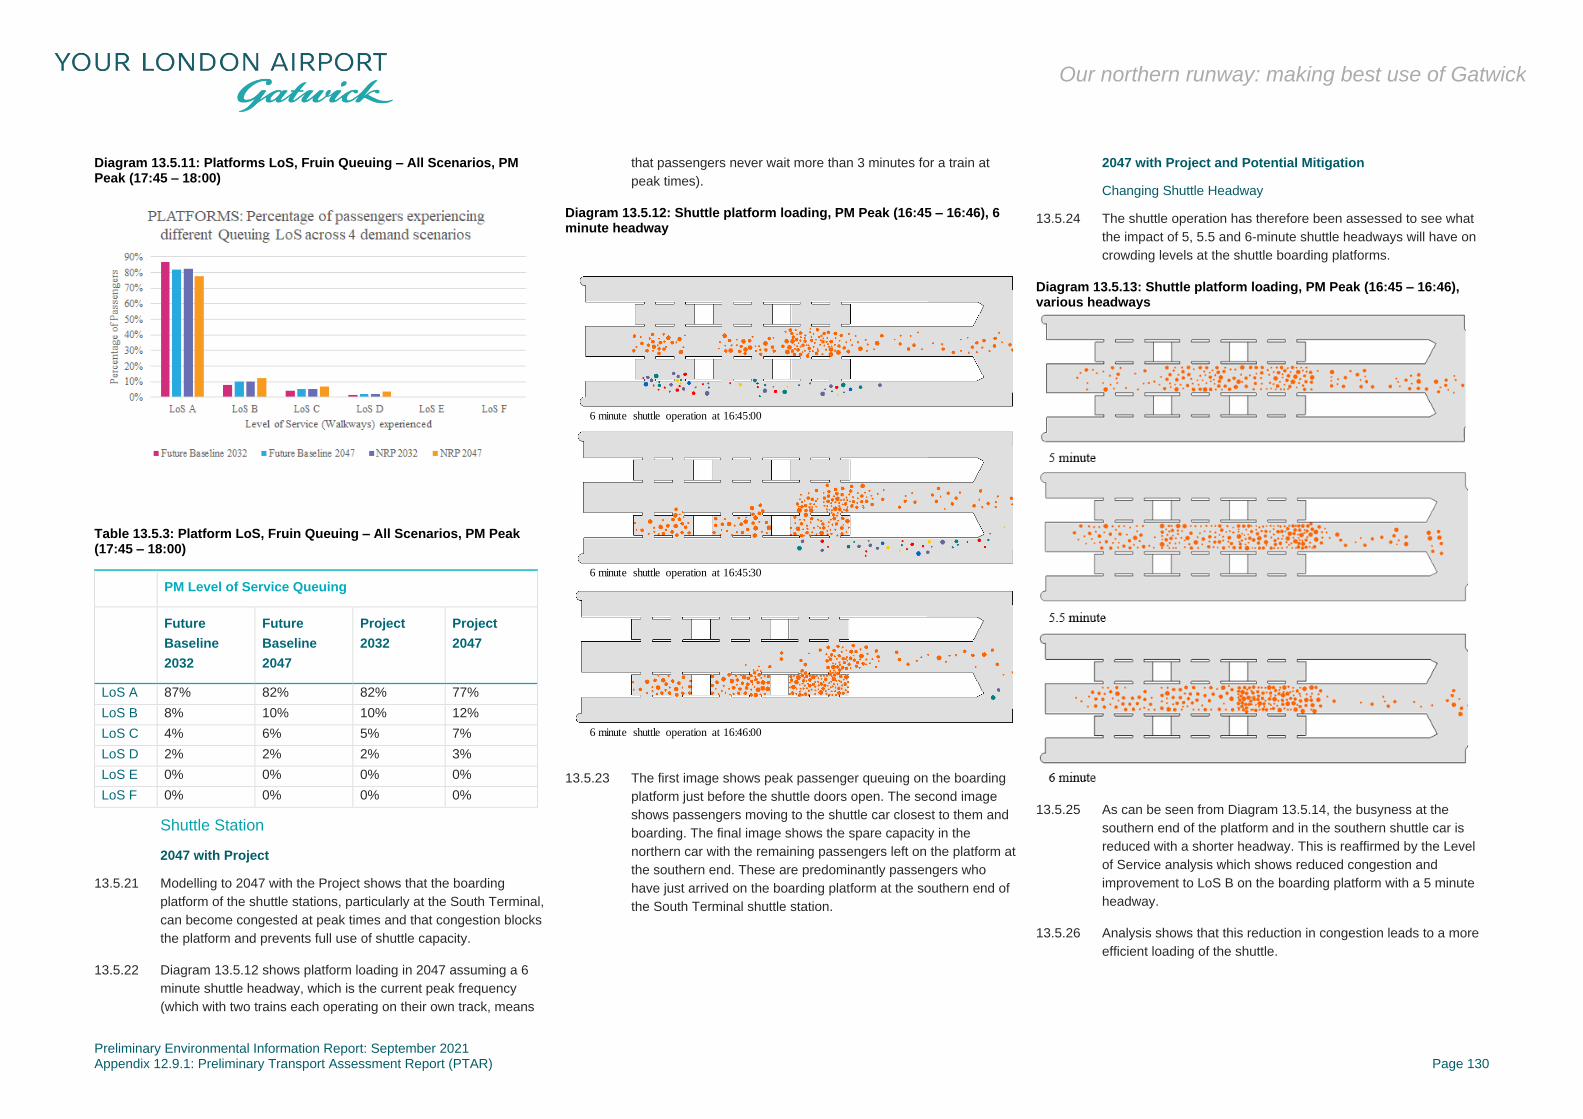
13.5.20 The Level of Service performance across all scenarios for the
station platforms is shown in Diagram 13.5.11 and Table 13.5.3
using Fruin Queuing Level of Service criteria, excluding
escalator-related elements. This shows performance at
predominantly LoS B or better in terms of Fruin Queuing (90% to
94% of passengers depending on scenario), so acceptable
conditions.
Diagram 13.5.9: Concourse LoS, Fruin Walkways – All Scenarios, PM Peak (17:45 – 18:00)
Table 13.5.1: Concourse LoS, Fruin Walkways – All Scenarios, PM Peak (17:45 – 18:00)
PM Level of Service Walkways
Future Baseline 2032
FUTURE Baseline 2047
Project 2032 Project 2047
LoS A 62% 58% 58% 55%
LoS B 18% 19% 19% 19%
LoS C 17% 19% 19% 21%
LoS D 3% 3% 4% 4%
LoS E 0% 0% 1% 1%
LoS F 0% 0% 0% 0%
Diagram 13.5.10: Platforms LoS, Fruin Walkways – All Scenarios, PM Peak (17:45 – 18:00)
Table 13.5.2: Platform LoS, Fruin Walkways – All Scenarios, PM Peak (17:45 – 18:00)
PM Level of Service Walkways
Future Baseline 2032
Future Baseline 2047
Project 2032 Project 2047
LoS A 42% 37% 37% 33%
LoS B 12% 11% 11% 11%
LoS C 26% 26% 27% 26%
LoS D 14% 17% 17% 19%
LoS E 5% 7% 7% 10%
LoS F 0% 0% 0% 1%
Preliminary Environmental Information Report: September 2021 Appendix 12.9.1: Preliminary Transport Assessment Report (PTAR) Page 130
Our northern runway: making best use of Gatwick
Diagram 13.5.11: Platforms LoS, Fruin Queuing – All Scenarios, PM Peak (17:45 – 18:00)
Table 13.5.3: Platform LoS, Fruin Queuing – All Scenarios, PM Peak (17:45 – 18:00)
PM Level of Service Queuing
Future
Baseline
2032
Future
Baseline
2047
Project
2032
Project
2047
LoS A 87% 82% 82% 77%
LoS B 8% 10% 10% 12%
LoS C 4% 6% 5% 7%
LoS D 2% 2% 2% 3%
LoS E 0% 0% 0% 0%
LoS F 0% 0% 0% 0%
Shuttle Station
2047 with Project
13.5.21 Modelling to 2047 with the Project shows that the boarding
platform of the shuttle stations, particularly at the South Terminal,
can become congested at peak times and that congestion blocks
the platform and prevents full use of shuttle capacity.
13.5.22 Diagram 13.5.12 shows platform loading in 2047 assuming a 6
minute shuttle headway, which is the current peak frequency
(which with two trains each operating on their own track, means
that passengers never wait more than 3 minutes for a train at
peak times).
Diagram 13.5.12: Shuttle platform loading, PM Peak (16:45 – 16:46), 6 minute headway
13.5.23 The first image shows peak passenger queuing on the boarding
platform just before the shuttle doors open. The second image
shows passengers moving to the shuttle car closest to them and
boarding. The final image shows the spare capacity in the
northern car with the remaining passengers left on the platform at
the southern end. These are predominantly passengers who
have just arrived on the boarding platform at the southern end of
the South Terminal shuttle station.
2047 with Project and Potential Mitigation
Changing Shuttle Headway
13.5.24 The shuttle operation has therefore been assessed to see what
the impact of 5, 5.5 and 6-minute shuttle headways will have on
crowding levels at the shuttle boarding platforms.
Diagram 13.5.13: Shuttle platform loading, PM Peak (16:45 – 16:46), various headways
13.5.25 As can be seen from Diagram 13.5.14, the busyness at the
southern end of the platform and in the southern shuttle car is
reduced with a shorter headway. This is reaffirmed by the Level
of Service analysis which shows reduced congestion and
improvement to LoS B on the boarding platform with a 5 minute
headway.
13.5.26 Analysis shows that this reduction in congestion leads to a more
efficient loading of the shuttle.
6 minute shuttle operation at 16:45:00
6 minute shuttle operation at 16:45:30
6 minute shuttle operation at 16:46:00

Preliminary Environmental Information Report: September 2021 Appendix 12.9.1: Preliminary Transport Assessment Report (PTAR) Page 131
Our northern runway: making best use of Gatwick
Four car shuttle operation
13.5.27 Additionally, a test model considers the impact of the shuttle
comprising four cars rather than the current configuration of three
cars, ie a potential 33% uplift in capacity, to understand what this
enhancement might provide. This analysis shows that adding an
additional shuttle car reduces density and number of passengers
left on the platform during the peak period. However, no
discernible improvement occurs outside of the peak period and
indeed the peak impacts are nominal, owing to congestion on the
boarding platform full and even utilisation of the fourth car.
Diagram 13.5.14: Shuttle platform Level of Service, Fruin Queuing, PM Peak (16:45 – 16:46), various headways
13.6 Conclusions
13.6.1 Improvements to Gatwick Station are the subject of a separate
consenting process, with a planning application submitted by
Network Rail to Crawley Borough Council in April 2018. Consent
has been granted and these improvements are currently under
construction, despite the Covid pandemic, and will be complete
by the time the Project is operational.
13.6.2 Analysis and modelling with the Project shows that no further
improvements will be required to the railway station platforms or
concourse.
13.6.3 Modelling to 2047 with the Project shows that the boarding
platform of the shuttle stations, particularly at the South Terminal,
can become congested at peak times and that congestion blocks
the platform and prevents full use of shuttle capacity. Analysis
indicates that reducing the headway of the system from 6 minutes
down to 5 minutes has the greatest benefit. Adding a fourth car to
the system does not provide an additional 33% capacity as the
boarding platform remains congested unless the shuttle headway
is changed. GAL therefore proposes to reduce the shuttle
headway to achieve appropriate additional capacity in peak
periods by 2047.
14 Impacts of Construction
14.1 Introduction
14.1.1 This section describes the impacts of construction on the
transport network for the PEIR. For the final Transport
Assessment, this section will additionally reference Gatwick
Airport’s Construction Traffic Management Plan for the Project
and the associated Appendices related to construction vehicle
traffic management and construction workforce travel planning
which are currently in development.
14.1.2 The section describes impacts related to two construction
scenarios, namely:
▪ Understanding the impact of peak construction vehicle traffic
on the highway network.
▪ Understanding the impact of constructing highway mitigation,
including grade-separation, on the network and the potential
reassignment of traffic this may cause as drivers seek
alternative routes.
14.2 Construction Inputs
Indicative Construction Programme
14.2.1 Gatwick has developed a programme of works covering all of the
construction activities related to the project and when these will
occur. The programme will likely evolve and change however the
initial timings are presented in Chapter 5: Project Description of
the PEIR.
Construction Workforce
14.2.2 This construction programme generates a peak of construction
activity over winter 2026/27, with over 1,300 construction workers
on site.
Construction Sites
14.2.3 Various construction compounds have been identified as follows:
▪ Main contractor compound (MA1) – the main site and
compound for airfield works.
▪ Airfield satellite contractor compound – this compound will
support most of the core airfield works to the North West of
the airfield.
▪ Surface access satellite contractor compounds – up to three
off airport locations to be used for construction activities
related to highway works at South Terminal, North Terminal
and Longbridge roundabout works.
14.2.4 There will be construction-related and construction workforce-
related trips to these locations at various project stages.
However, the location for construction workforce car parking will
be MA1 and therefore the highest number of overall trips will be
made to this location.

Preliminary Environmental Information Report: September 2021 Appendix 12.9.1: Preliminary Transport Assessment Report (PTAR) Page 132
Our northern runway: making best use of Gatwick
Diagram 14.2.1: Peak Construction Workforce
Diagram 14.2.2: Proposed Construction Compounds
14.3 Impacts of Airfield Construction Trips
14.3.1 This section relates to vehicles carrying materials to and waste
from the Airport, typically Heavy Goods Vehicles (HGVs over 7.5
tons), Light Goods Vehicles (LGVs between 3.5 tons and 7.5
tons) and small delivery vans.
14.3.2 The objective of the Construction Traffic Management Plan will
be to reduce the impact of construction traffic including:
▪ reducing potential congestion impacts, caused by additional
vehicles on the network over and above typical traffic levels;
▪ reducing safety risks related to construction vehicle
movements;
▪ minimising emission levels;
▪ limiting noise impacts; and
▪ minimising other impacts such as wear and tear of the road
network and dust from construction traffic.
14.3.3 In order to achieve this, Gatwick Airport has prescribed a single
route into the Airport, with all construction traffic coming via
Junction 9 of the M23, as shown in Diagram 14.3.1. Access will
be via M23 Junction 9 through South Terminal roundabout (STR),
onto North Terminal roundabout (NTR) and around Longbridge
Roundabout. Construction vehicles then take the A23 south to
Gatwick Road roundabout and from there into the MA1 site.
14.3.4 An option had been discussed which allowed construction
vehicles to access the Airport via Junction 9 and Junction 10.
However, whilst this approach distributes the impact of
construction traffic and therefore potentially reduces its intensity,
it also has the effect of spreading the impact of construction traffic
across a wider area, specifically into north Crawley and is
therefore not preferred and has not been taken forward for
assessment.
14.3.5 At this stage further analysis is required to confirm the need for
and location of a Construction Logistics Consolidation Centre.
This could be on an existing site or one that is permitted for such
use already. As the details are yet to be confirmed, it is assumed
that such a facility is not provided for the purposes of this
assessment. This is a conservative assumption as the
consolidation centre should reduce trips to and from the
construction sites on Airport. Should a consolidation centre be
provided, this could be explored as further mitigation as part of
the final ES if necessary.
0
200
400
600
800
1000
1200
1400
01 J
ul 2
2
01 D
ec 2
2
01 M
ay 2
3
01 O
ct 2
3
01 M
ar 2
4
01 A
ug 2
4
01 J
an 2
5
01 J
un 2
5
01 N
ov 2
5
01 A
pr 2
6
01 S
ep 2
6
01 F
eb 2
7
01 J
ul 2
7
01 D
ec 2
7
01 M
ay 2
8
01 O
ct 2
8
01 M
ar 2
9
01 A
ug 2
9
01 J
an 3
0
01 J
un 3
0
01 N
ov 3
0
01 A
pr 3
1
01 S
ep 3
1
01 F
eb 3
2
01 J
ul 3
2
01 D
ec 3
2
01 M
ay 3
3
01 O
ct 3
3
01 M
ar 3
4
01 A
ug 3
4
01 J
an 3
5
01 J
un 3
5
01 N
ov 3
5
01 A
pr 3
6
01 S
ep 3
6
01 F
eb 3
7
01 J
ul 3
7
01 D
ec 3
7
01 M
ay 3
8
01 O
ct 3
8
01 M
ar 3
9
Num
ber
of w
orke
rs p
er d
ay
Date
Construction Workforce Activity
Manual workers Field non Manual Total

Preliminary Environmental Information Report: September 2021 Appendix 12.9.1: Preliminary Transport Assessment Report (PTAR) Page 133
Our northern runway: making best use of Gatwick
Diagram 14.3.1: Prescribed Routes for Construction Traffic
14.4 Impacts of Airfield Construction Staff Trips
14.4.1 An outline Construction Workforce Travel Plan (CWTP) is being
developed for the Project. It will focus on how the construction
workforce will travel to and from the Airport, including measures
that encourage alternatives to the use of private car in particular
single-occupancy car journeys. The intent of the Travel Plan is to
put forward a range of travel options for the construction
workforce which encourage and deliver a high sustainable mode
share and, through this, reduce any potential capacity and
environmental impacts of the Project.
14.4.2 It should be noted that each contractor appointed by Gatwick to
deliver the Project will be responsible for developing their own
detailed CWTP and will be monitored against it to ensure
compliance. The outline CWTP is therefore a guidance document
to inform appropriate strategies from contractors, which will then
become enshrined in contracts and obligations as the Project
moves forward.
Aims of Construction Workforce Travel Plan
14.4.3 The aims of the outline Construction Workforce Travel Plan are
to:
▪ Increase the workforce awareness of more sustainable and
healthier travel choices.
▪ Through this, to achieve the highest possible mode share by
public transport, walking and cycling as sustainable transport
modes.
▪ Reduce travel by private car, particularly single occupancy
car journeys.
▪ But where car travel is the only viable mode, to encourage
multi-occupancy car use to reduce the number of trips.
14.4.4 Through this, the outcomes of the CWTP are to:
▪ Reduce congestion on key routes / junctions, especially
during traditional morning and evening peak travel times.
This will benefit Airport passengers, staff and the local
community.
▪ Identify appropriate bus and shuttle services for the
construction workforce to augment existing rail, bus and
coach connectivity.
▪ Maintain safety and comfort by minimising increases in traffic
levels on local routes; and
▪ Minimise noise and air quality impacts throughout the
Project.

Preliminary Environmental Information Report: September 2021 Appendix 12.9.1: Preliminary Transport Assessment Report (PTAR) Page 134
Our northern runway: making best use of Gatwick
Total Construction Workforce
14.4.5 The construction workforce is estimated to reach a peak of
approximately 1,300 workers over the winter of 2026/27 and then
reduce to approximately 800 - 900 workers to summer 2030, with
workforce numbers reducing after that point to less than 400 by
mid-2031.
Rail
14.4.6 Gatwick is the UK’s best connected airport by rail. It has regular,
direct daily services from over 120 stations, across the South
Coast from Southampton to Hastings, west to Reading and as far
north as Bedford, Cambridge and Peterborough.
14.4.7 Prior to Covid, rail already accounted for a reasonable proportion
of staff travel, 12%, and this was increasing. 2019 timetable
changes with earlier and more frequent services as well as
potential future measures, such as increasing the Staff Travel
Discount, will likely help to drive rail mode share amongst
employees even higher.
14.4.8 Accordingly, rail could be a viable mode for some of the
construction workforce, particularly those that live in towns and
cities along the Brighton Main Line or the Arun Valley Line.
Discounted travel could be used to incentivise rail usage.
Local Bus Services
14.4.9 Most Gatwick employees who use bus/coach live in Crawley and
Horley, with smaller clusters in surrounding towns and villages
including Horsham, Redhill, Reigate and East Grinstead. The
2016 employee mode share by bus/coach was 16% of all staff.
14.4.10 Construction workers living in these locations could make use of
existing bus/coach connectivity to access the Airport and,
depending on the Metrobus route used, some of the construction
workforce may be able to be dropped at bus-stops directly
adjacent to construction sites (e.g. Metrobus routes 4 and 5 from
Crawley/County Oak will pass construction compound MA1).
Specific Construction-Related Bus Services
14.4.11 Rail services are accessed via the station at South Terminal, and
bus routes pick up and drop off at both the South and North
Terminals. As such, the workforce arriving at those locations will
require a method of travelling the final leg of their journey to site.
A construction workforce shuttle bus would provide this service.
This will require bus service planning, procurement of a supplier
and identification of locations for pick-up, drop-off and layover.
14.4.12 The possibility of developing one or more ‘Park and Ride’ hub
stations outside of the Airport and creating a dedicated workforce
bus connection from these locations directly to site is being
considered. This would reduce any potential impact of
construction workers using the rail and local bus services.
14.4.13 At a minimum, lower emission Euro 6 engines would be expected
in all construction-related vehicles, including buses, accessing
the Airport. This would reduce the air quality impacts of emissions
related to construction traffic.
14.4.14 Further development of a system for dedicated worker buses is
underway and will be further defined within the CWTP.
Active Travel
14.4.15 The following initiatives are being considered to support walking
and cycling for the construction workforce.
▪ A ‘cycle to work bundle’ including discounts on bike and
equipment purchases and free bike servicing.
▪ Safe routes - design consideration is being given to access
routes for walking and cycling (as described in Section 11).
▪ Cycle stands - secure cycle parking to be provided in a
convenient location relative to the desired arrival route and
site location.
▪ Showering and locker facilities - provided in the welfare
facilities specifically for cyclists.
▪ Workforce recruitment - a drive to recruit a significant
proportion of the workforce from the local area.
Car Parking and Car Sharing
14.4.16 Some of the workforce will continue to drive to work, particularly
those working non-standard hours or those carrying equipment
and tools. Parking will be provided only at the MA1 compound
located near the A23 in the south east corner of the Airport. An
internal shuttle bus service will then transport the workforce to
their site locations.
14.4.17 The CWTP will develop the parking strategy further based on
refined modelling of the workforce profile. However, at this stage,
it is envisaged that around 500 car parking spaces may be
provided, which can accommodate the total peak project
workforce (even assuming some overlap of parking demand at
shift changeover – please also see 14.5.8).
14.4.18 This means that 10% of the workforce will need to come by other
modes such as public transport and active travel, which is
conservative when considering the mode share of current Airport
staff. Gatwick will also encourage car sharing by providing
incentives for workers to travel to work together (priority parking
spots, meal vouchers etc). The current assumption is 1.5
construction workers per vehicle and car parking provision
reflects this.
14.5 Impacts of Airfield Construction Trips on Highway
Network
14.5.1 A peak airfield construction scenario has been tested with
construction trips added on to 2029 baseline traffic levels. This is
conservative but reasonable as traffic flows in 2029 will be a few
percent higher than in 2026/27, albeit within the daily variation in
any given year.
14.5.2 Construction vehicle data has been generated on a monthly basis
by GAL’s construction team in relation to core and non-core
construction activities to deliver the Northern Runway Project.
The data is based on project activity, with vehicle numbers for
core works generated from quantities for earthworks, pavement
works, drainage, aeronautical ground lighting, navaids etc and
non-core works based on an intensity factor and costs of the
various projects at design status of RIBA 0-1.
14.5.3 The busiest month for construction vehicle activity is December
2026 with 38,450 construction vehicles for the busiest shift across
the month. This comprises16,360 construction workforce or
Person Owned Vehicles (POVs) and 22,090 other construction
vehicles as a mix of HGVs, LGVs and Liveried Vans with two
shifts per day.
14.5.4 However, December is a lower month for traffic on the highway
network around the Airport and therefore the assessment has
also considered other months during the peak months of
construction activity in 2026 and 2027. Typically, the summer
months, with high Airport activity and background traffic, are the
busiest on the network.
14.5.5 Accordingly, the modelling and assessment considers the highest
summer month which occurs in August 2027 with 21,834 vehicles
for the busiest shift across that month, comprising 7,326 POVs
and 14,508 other construction vehicles and with three shifts per
day (two x 10 hour shifts and an 8 hour night shift).
14.5.6 Monthly data has been used to generate daily and peak period
traffic volumes by:
▪ Considering shift patterns.

Preliminary Environmental Information Report: September 2021 Appendix 12.9.1: Preliminary Transport Assessment Report (PTAR) Page 135
Our northern runway: making best use of Gatwick
▪ Dividing monthly vehicle numbers by 22 working days per
month.
▪ Assuming 1.5 construction workers per vehicle, which is
considered to be conservative. GAL's construction team
have data which suggests that a reasonable proportion of
the recent workforce on airside projects at the Airport came
to site in minivans with up to 6 people per van. As such, 1.5
construction workers per vehicle is considered a
conservative case.
▪ Assuming 10% construction workforce public transport mode
share. Again, this is a low percentage given the excellent
connectivity provided by Gatwick Airport railway station, as
well as local bus and long-distance coach services.
14.5.7 The three shifts in August 2027 mean that, for the busiest
daytime peak, the monthly total POVs is 7,326 vehicles,
equivalent to 3,663 POVs in one direction. When divided by 22
working days and factored by 90% to reflect 10% of construction
workers on public transport, this gives 150 construction worker
vehicles travelling into the MA1 site in the AM peak period (07:00-
08:00) and out of the site after the PM peak period (18:00-19:00)
in August 2027.
14.5.8 Note that the peak construction worker vehicle activity is higher in
the autumn and winter months, with between 330 and 440 POVs
for a single shift ie 180 to 290 vehicles more than the August
peak. However, traffic into Gatwick Airport is lower in these
months - for example, traffic heading into South Terminal
roundabout is estimated to be more than 400 vehicles lower in
December 2026 than August 2027. Accordingly, there is greater
capacity on the network to accommodate these additional
vehicles.
14.5.9 The 150 construction worker vehicles travel into the MA1 site in
the AM peak period (07:00-08:00) and out of the site after the PM
peak period (18:00-19:00) in August 2027.
14.5.10 In order to provide a reasonable distribution of potential locations
from which construction workers will travel to/from, the modelling
assumes that construction workers are drawn from Croydon, the
Gatwick Diamond area and Brighton and Hove. Whilst some
construction workers will be drawn from a wider catchment, the
length of the Northern Runway construction works over several
years, is likely to result in construction workers staying in the area
temporarily while working at the Airport and this is the assumption
used for modelling. The distribution of construction workers by
Local Authority reflects the proportion of construction workers
living in those areas from 2019 Office of National Statistics data.
The trips are distributed evenly between zones in these Local
Authority areas. Given that it will be very difficult to mandate and
then monitor routes for construction workers, it is assumed that
these vehicles will arrive at MA1 via the most appropriate
highway route from or to each zone.
14.5.11 For HGVs and LGVs, the shift patterns in August 2027 mean that,
for the busiest daytime shift, the monthly total construction
vehicles are 14,508 vehicles, equivalent to 7,254 in one direction.
When divided by 22 working days and spread over a 10 hour
shift, the estimated vehicle trip generation is 33 vehicles (HGVs
and LGVs) in and out every hour along the M23 Spur. At this
stage, material-carrying construction vehicles, i.e. LGVs and
HGVs, have not been excluded from peak hours on the highway
network to test the impact of extra construction traffic in the peak.
14.5.12 The modelling has tested the summer peak level of construction
activity in August 2027 on 2029 baseline airport and background
traffic levels to provide a robust assessment of potential
construction impacts. The difference in traffic flows between 2027
and 2029 will be small (up to 5% higher) and accordingly within
the daily variation in any given year.
14.5.13 Traffic flows have been provided to environmental modelling
workstreams, specifically air quality and noise, for modelling and
input to the draft EIA. Those flows have been provided as 24 hour
AADT.
Comparison of Baseline and Project
14.5.14 The proposal is for all construction vehicles to travel to and from
the airport from via M23 Junction 9, and no restrictions are
proposed for construction worker vehicles. Construction traffic
would be monitored to ensure compliance with proposed routes,
unless disruption causes these to be unavailable and signed
diversionary routes provided.
14.5.15 The estimated vehicle trip generation is 33 vehicles (HGVs and
LGVs) in and out an hour along the M23 Spur, and 150
construction worker vehicles in the AM peak hour.
14.5.16 In line with IEMA guidance, the assessment considers highway
links where traffic flows will increase by more than 30% (or the
number of Heavy Goods Vehicles (HGVs) will increase by more
than 30%); or links through any other specifically sensitive areas
where traffic flows have increased by 10% or more.
14.5.17 Strategic modelling shows that no link within the study area
exceeds an increase in traffic of over 30%, which is expected
given the volume of airfield construction traffic generated by the
Project.
14.5.18 Flows on Old Brighton Road South, Lowfield Heath Roundabout-
Perimeter Road South are 20% higher in the AM peak and 25%
higher in the afternoon inter-peak owing to the location of the
MA1 site off this junction.
14.5.19 The modelling shows that HGV flows increase by more than 30%
on some roads into the Airport in the AM and PM peaks, which is
expected given the requirement for construction HGVs related to
the Project to use the Strategic Road Network. The roads
impacted are as follows:
▪ M23 Spur, J9-South Terminal roundabout
▪ A23 Airport Way
▪ A23 London road, North Terminal-Longbridge Roundabout
▪ A23 London Road, Beehive Ring Road-South Terminal
▪ A23 London Road, Beehive Ring Road-A23 London Road
14.5.20 No other roads into the Airport show HGV increases of 30% or
more in the AM and PM peaks. Moreover, with the 150
construction worker vehicles coming from nine Local Authority
areas, the most vehicles from one Local Authority area is
between 20 and 30 vehicles in an hour. This is only a small
increase in traffic when considered against other demand on
highways and roads around the Airport.
14.5.21 The above effects are shown in Diagram 14.5.1 for the AM peak
hour, with a 30 to 100 vehicle two-way flow change shown
predominantly on the M23, M23 Spur and A23. There are also
minor vehicle increases on Charlwood Road south of the Airport
and a number of smaller roads in North Crawley. 30 vehicles per
hour two-way is equivalent 15 vehicles per hour in each direction,
or one every 4 minutes.
14.5.22 Given the limited impact of construction traffic, it is not anticipated
that there would be overlap between construction traffic when
considering Heathrow R3 construction on a cumulative basis.
However, this will be reviewed for the application for development
consent.
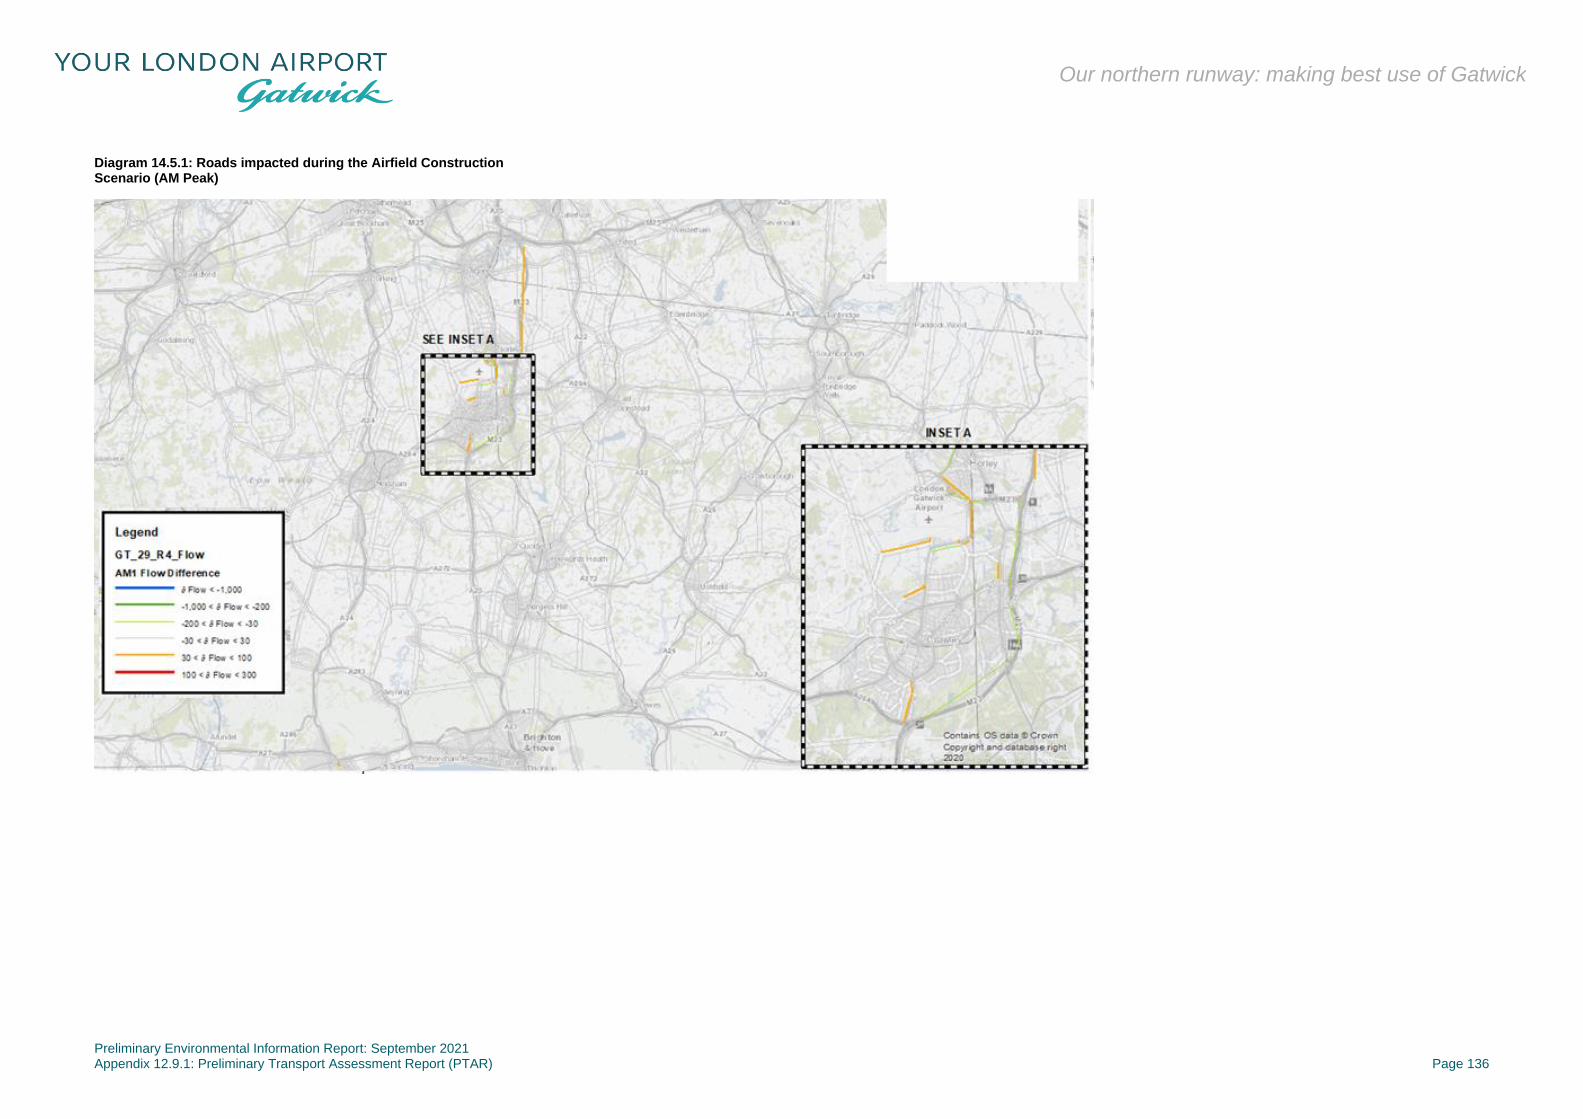
Preliminary Environmental Information Report: September 2021 Appendix 12.9.1: Preliminary Transport Assessment Report (PTAR) Page 136
Our northern runway: making best use of Gatwick
Diagram 14.5.1: Roads impacted during the Airfield Construction Scenario (AM Peak)
Preliminary Environmental Information Report: September 2021 Appendix 12.9.1: Preliminary Transport Assessment Report (PTAR) Page 137
Our northern runway: making best use of Gatwick
Mitigation of Construction Traffic Impacts
14.5.23 Based on the levels of construction traffic described above, it is
not considered that peak airfield construction will have a
significant impact on the performance of the highway network
around the Airport.
14.5.24 Further work will be undertaken for the Environmental Statement
to explore measures to mitigate the potential impacts from
construction traffic during peak periods and reduce the overall
construction traffic loading created by the Project.
14.5.25 Whilst the modelling indicates that there is available capacity in
peak hours on the network, a conservative assumption is to aim
for minimal additional construction traffic at these times to make
sure construction works related to the Project do not negatively
impact on network capacity and safety.
14.5.26 Potential traffic mitigation measures could include the following
and would need to be modelled and assessed to confirm
effectiveness prior to being taken forward.
▪ Developing a Travel Plan for deliveries including HGVs: A
Travel Plan which puts in place a series of sustainable
measures to address the delivery or removal of materials to
or from site. This may include the use of low or zero
emission delivery vehicles and the leveraging of the rail
network that supports Gatwick including the potential for
setting up local rail hub(s) for the delivery of bulk materials. It
will also include measures to consolidate deliveries to site.
This measure has the potential to reduce the number of
vehicle movements during peak and off-peak periods.
▪ Restrict material deliveries and waste away to outside of
peak hours: This measure is not intended to reduce vehicle
movements overall but rather to flatten the vehicle loading
across the day and remove any vehicle movements that are
not time-critical during the morning and evening traffic peak
hours. This measure may require more capacity in holding
and layover areas to maintain reliable arrival times on site.
▪ Restricting car parking spaces for the construction
workforce: This is a base measure which is already included
in the mitigation, limiting car parking to 45% of the peak
workforce.
▪ Travel Plan for staff and workforce: A Travel Plan which puts
in place a series of sustainable measures to address the
impacts of workers travelling to and from site and which
promotes sustainable travel. Measures might include staff
travel discounts to maximise the use of public transport
(including rail), incentives for car sharing, and the provision
of ‘cycle to work’ schemes. The elements of the plan would
build on Gatwick’s existing staff travel plan, which includes
discount schemes for public transport use.
▪ Provide ‘Park and Ride’ services for construction workers:
Provision of ‘Park and Ride’ hubs in towns and cities around
the airport where Project construction workers will be drawn
from. Providing ‘Park and Ride’ bus operations will address
vehicle impacts on roads leading to the airport by
consolidating the vehicles, however the location of the car
parks will govern the extent of the benefit and may result in
additional, unwanted congestion at or near the sites
themselves.
▪ Use of bus lanes for construction workforce buses: This
option is intended to speed up the transport of workers from
car parks (including ‘Park and Ride’ sites etc.), the railway
station and off-site bussing to the compounds. This option
would not reduce the number of vehicle movements directly
but would speed up the transit time of buses to and from site
and as such may indirectly reduce the vehicle movements by
making bus travel more attractive. However, this option may
also result in slowing down existing public bus services so its
advantages and disadvantages need to be further assessed.
▪ Reduce the amount of ‘business as usual’ construction work:
Reduce the volume of ‘business as usual’ construction work
to a minimum during the peak Project construction period(s).
It is intended that this measure would reduce some of the
existing traffic thereby releasing some capacity for Project
construction vehicles.
▪ Increase non-day shift working: Undertaking more work on a
back shift (from late afternoon until midnight) or night shift,
especially in the summer when daylight hours are longer.
This measure is not intended to reduce overall vehicle
movements but to flatten or remove construction vehicle
activity from the morning and evening peak hours. This
measure could not be applied to all project activities but
could be applied to selected works.
▪ Stagger shift patterns: This measure could be used to flatten
or remove construction vehicle activity from the morning and
evening peak hours. This measure may not need to be
applied to all project activities and may only be applied to
selected areas of work. This is an approach commonly taken
for large development projects near congested networks and
has been adopted by several DCO projects.
▪ Move selected construction activities to the winter months:
Moving selected construction activities to the winter months
would reduce the impact on the roads during spring and
summer months when the roads can be busier. The extent of
the impact would be dependent on the activities to be
moved. This may also impact the overall completion date for
the works. At this stage, it is envisaged that peak airfield
construction will occur during the winter months of 2026/27.
14.6 Sequencing and Impacts of Highway Construction
14.6.1 Understanding the impact of constructing highway mitigation,
including potential grade-separation, has been assessed for a
conservative construction phase which envisages works at both
South and North Terminal junctions at the same time. Further
scenarios will need to be considered in conjunction with
Highways England and local highway authorities prior to DCO
submission.
Overview of Highway Works
14.6.2 All highways construction activities tend to follow a broadly similar
construction sequence, with the duration and detail dependent
upon the scale and complexity of the scheme in question, as
follows:
▪ Activities normally start with delineation of the boundary to
the work, site clearance where required for the work and
protection or diversion of utilities affected by the scheme.
▪ Prior to site clearance, any trees or vegetation to be retained
are identified and safe paths maintained through or around
the works for pedestrians, cyclists and other non-motorised
users of the network who may be affected by the
construction activities.
▪ Once the site is cleared, topsoil and possibly also subsoil will
be removed where roads are widened, or new roads are to
be built. Soils are placed in stockpiles for re-use.
▪ Structure foundations are then built, and earth or other
materials removed to sufficient depth to prepare the ground
for new road embankments or road pavement layers.
Various ancillary items can be constructed at this stage
including access chambers, sign and gantry foundations,
draw pits, drainage pipes and ducts for highway
communications systems or traffic signals.
▪ The next stage comprises above ground structures such as
bridge piers or abutments and bridge decks, as well as the
laying and compaction of road pavement sub-base
materials.
▪ Kerbs are then installed and new road pavements
constructed.
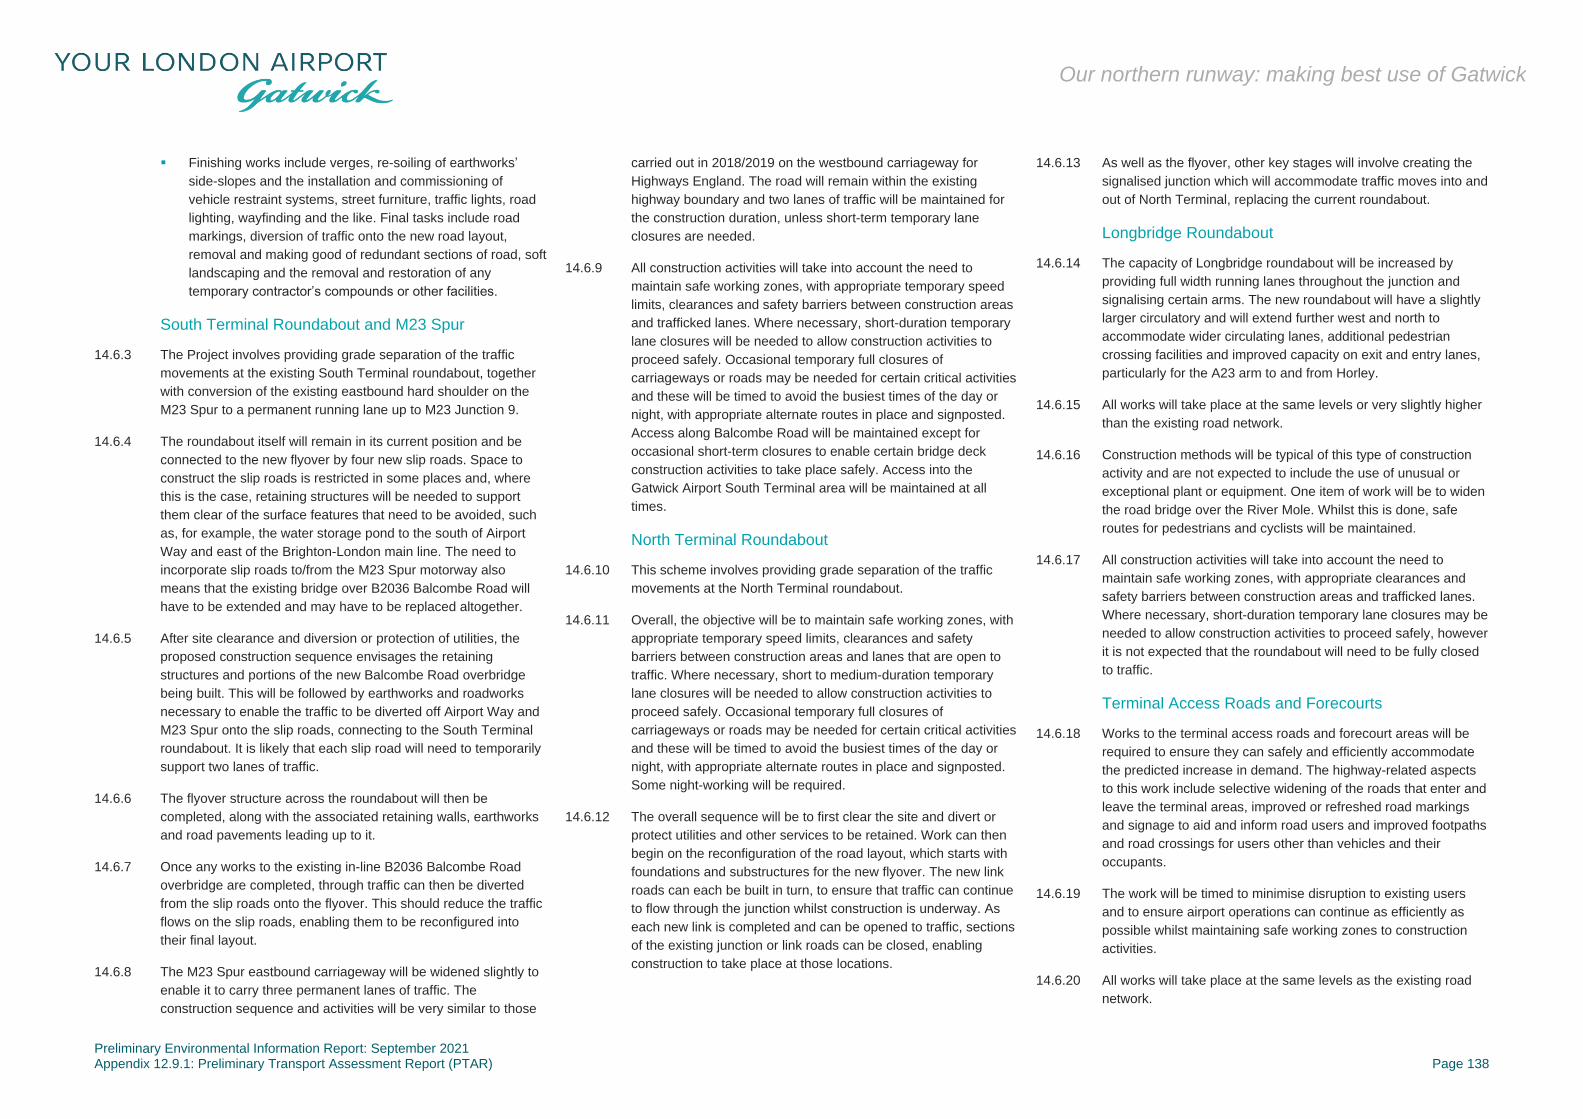
Preliminary Environmental Information Report: September 2021 Appendix 12.9.1: Preliminary Transport Assessment Report (PTAR) Page 138
Our northern runway: making best use of Gatwick
▪ Finishing works include verges, re-soiling of earthworks’
side-slopes and the installation and commissioning of
vehicle restraint systems, street furniture, traffic lights, road
lighting, wayfinding and the like. Final tasks include road
markings, diversion of traffic onto the new road layout,
removal and making good of redundant sections of road, soft
landscaping and the removal and restoration of any
temporary contractor’s compounds or other facilities.
South Terminal Roundabout and M23 Spur
14.6.3 The Project involves providing grade separation of the traffic
movements at the existing South Terminal roundabout, together
with conversion of the existing eastbound hard shoulder on the
M23 Spur to a permanent running lane up to M23 Junction 9.
14.6.4 The roundabout itself will remain in its current position and be
connected to the new flyover by four new slip roads. Space to
construct the slip roads is restricted in some places and, where
this is the case, retaining structures will be needed to support
them clear of the surface features that need to be avoided, such
as, for example, the water storage pond to the south of Airport
Way and east of the Brighton-London main line. The need to
incorporate slip roads to/from the M23 Spur motorway also
means that the existing bridge over B2036 Balcombe Road will
have to be extended and may have to be replaced altogether.
14.6.5 After site clearance and diversion or protection of utilities, the
proposed construction sequence envisages the retaining
structures and portions of the new Balcombe Road overbridge
being built. This will be followed by earthworks and roadworks
necessary to enable the traffic to be diverted off Airport Way and
M23 Spur onto the slip roads, connecting to the South Terminal
roundabout. It is likely that each slip road will need to temporarily
support two lanes of traffic.
14.6.6 The flyover structure across the roundabout will then be
completed, along with the associated retaining walls, earthworks
and road pavements leading up to it.
14.6.7 Once any works to the existing in-line B2036 Balcombe Road
overbridge are completed, through traffic can then be diverted
from the slip roads onto the flyover. This should reduce the traffic
flows on the slip roads, enabling them to be reconfigured into
their final layout.
14.6.8 The M23 Spur eastbound carriageway will be widened slightly to
enable it to carry three permanent lanes of traffic. The
construction sequence and activities will be very similar to those
carried out in 2018/2019 on the westbound carriageway for
Highways England. The road will remain within the existing
highway boundary and two lanes of traffic will be maintained for
the construction duration, unless short-term temporary lane
closures are needed.
14.6.9 All construction activities will take into account the need to
maintain safe working zones, with appropriate temporary speed
limits, clearances and safety barriers between construction areas
and trafficked lanes. Where necessary, short-duration temporary
lane closures will be needed to allow construction activities to
proceed safely. Occasional temporary full closures of
carriageways or roads may be needed for certain critical activities
and these will be timed to avoid the busiest times of the day or
night, with appropriate alternate routes in place and signposted.
Access along Balcombe Road will be maintained except for
occasional short-term closures to enable certain bridge deck
construction activities to take place safely. Access into the
Gatwick Airport South Terminal area will be maintained at all
times.
North Terminal Roundabout
14.6.10 This scheme involves providing grade separation of the traffic
movements at the North Terminal roundabout.
14.6.11 Overall, the objective will be to maintain safe working zones, with
appropriate temporary speed limits, clearances and safety
barriers between construction areas and lanes that are open to
traffic. Where necessary, short to medium-duration temporary
lane closures will be needed to allow construction activities to
proceed safely. Occasional temporary full closures of
carriageways or roads may be needed for certain critical activities
and these will be timed to avoid the busiest times of the day or
night, with appropriate alternate routes in place and signposted.
Some night-working will be required.
14.6.12 The overall sequence will be to first clear the site and divert or
protect utilities and other services to be retained. Work can then
begin on the reconfiguration of the road layout, which starts with
foundations and substructures for the new flyover. The new link
roads can each be built in turn, to ensure that traffic can continue
to flow through the junction whilst construction is underway. As
each new link is completed and can be opened to traffic, sections
of the existing junction or link roads can be closed, enabling
construction to take place at those locations.
14.6.13 As well as the flyover, other key stages will involve creating the
signalised junction which will accommodate traffic moves into and
out of North Terminal, replacing the current roundabout.
Longbridge Roundabout
14.6.14 The capacity of Longbridge roundabout will be increased by
providing full width running lanes throughout the junction and
signalising certain arms. The new roundabout will have a slightly
larger circulatory and will extend further west and north to
accommodate wider circulating lanes, additional pedestrian
crossing facilities and improved capacity on exit and entry lanes,
particularly for the A23 arm to and from Horley.
14.6.15 All works will take place at the same levels or very slightly higher
than the existing road network.
14.6.16 Construction methods will be typical of this type of construction
activity and are not expected to include the use of unusual or
exceptional plant or equipment. One item of work will be to widen
the road bridge over the River Mole. Whilst this is done, safe
routes for pedestrians and cyclists will be maintained.
14.6.17 All construction activities will take into account the need to
maintain safe working zones, with appropriate clearances and
safety barriers between construction areas and trafficked lanes.
Where necessary, short-duration temporary lane closures may be
needed to allow construction activities to proceed safely, however
it is not expected that the roundabout will need to be fully closed
to traffic.
Terminal Access Roads and Forecourts
14.6.18 Works to the terminal access roads and forecourt areas will be
required to ensure they can safely and efficiently accommodate
the predicted increase in demand. The highway-related aspects
to this work include selective widening of the roads that enter and
leave the terminal areas, improved or refreshed road markings
and signage to aid and inform road users and improved footpaths
and road crossings for users other than vehicles and their
occupants.
14.6.19 The work will be timed to minimise disruption to existing users
and to ensure airport operations can continue as efficiently as
possible whilst maintaining safe working zones to construction
activities.
14.6.20 All works will take place at the same levels as the existing road
network.
Preliminary Environmental Information Report: September 2021 Appendix 12.9.1: Preliminary Transport Assessment Report (PTAR) Page 139
Our northern runway: making best use of Gatwick
14.6.21 Construction methods will be typical of this type of construction
activity and are not expected to include the use of unusual or
exceptional plant or equipment.
14.6.22 Access into the Gatwick Airport terminal areas will be maintained
at all times and during busy periods the number of lanes open to
traffic will not be reduced.
14.6.23 Access to side roads and facilities alongside the primary roads to
be widened will be maintained at all times. If temporary road,
access or lanes closures are required to maintain safe working
zones whilst completing the works, signed alternative access
arrangements will be put in place.
Assessment of Impacts
14.6.24 The most complex highway construction phase as currently
envisaged would involve a combination of construction works at
both the South and North Terminal roundabouts, as shown in
Diagram 14.6.1. The construction methods are typical for the
works envisaged but the sequencing of these to avoid
unnecessary disruption creates complexity.
Diagram 14.6.1: Potential Highway Construction Phase
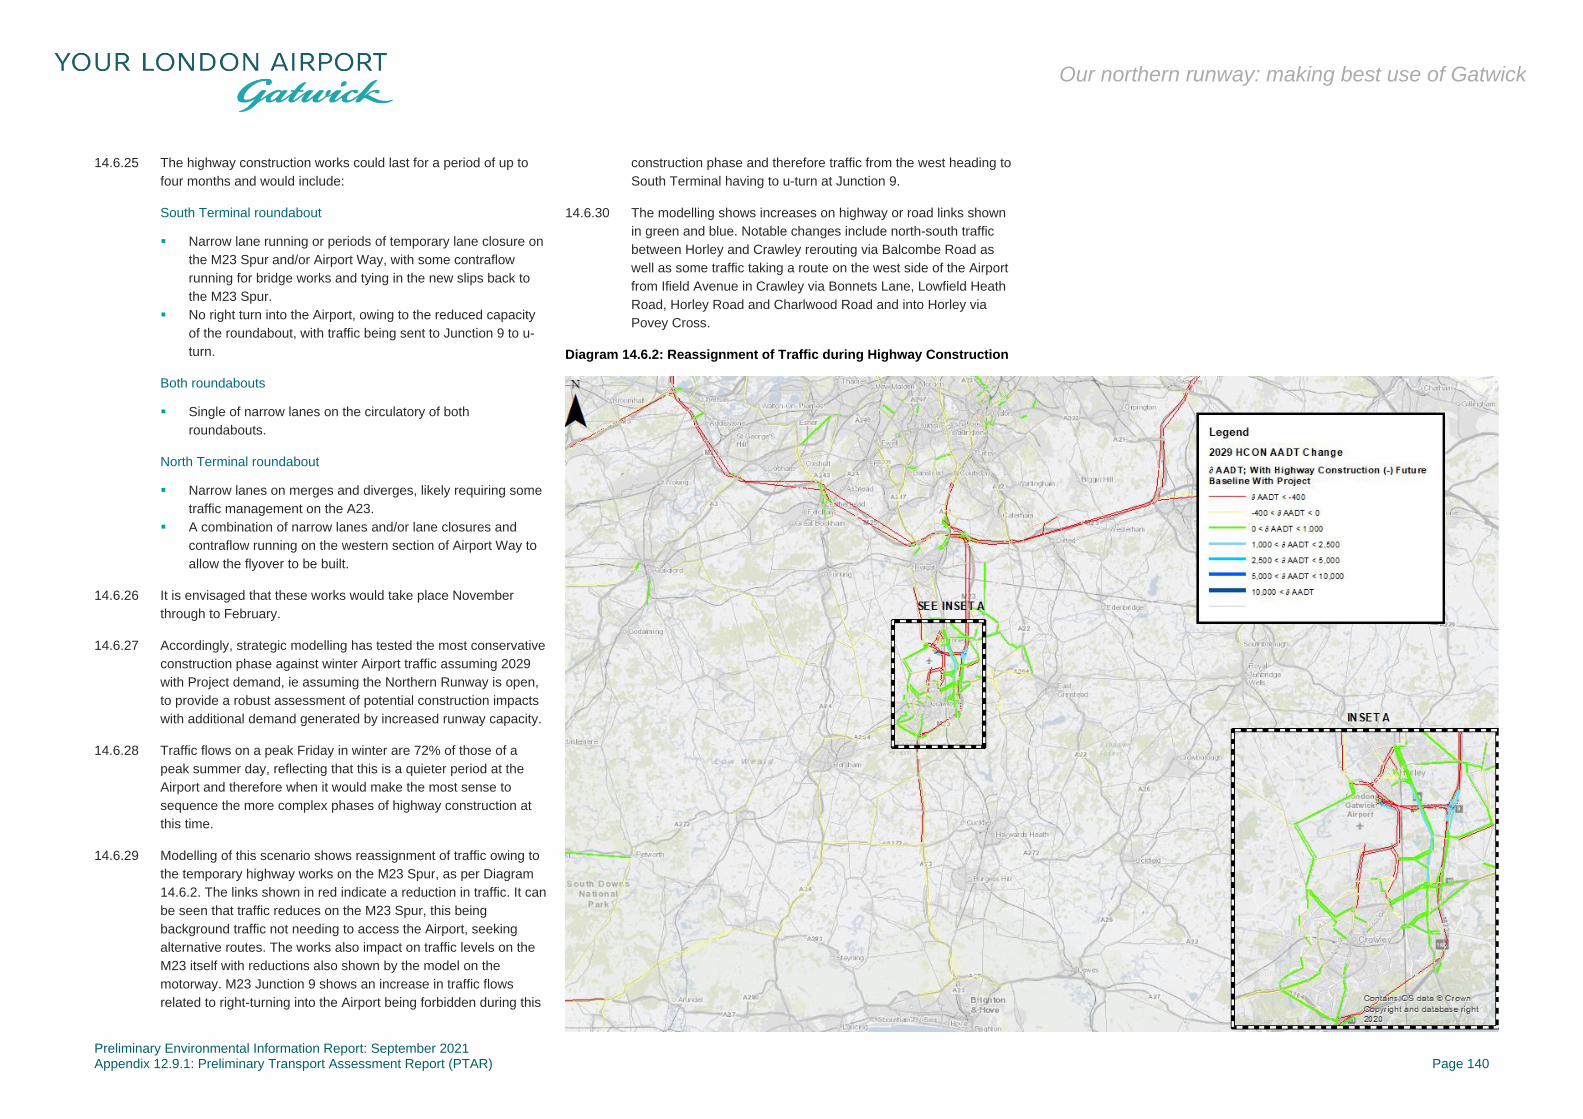
Preliminary Environmental Information Report: September 2021 Appendix 12.9.1: Preliminary Transport Assessment Report (PTAR) Page 140
Our northern runway: making best use of Gatwick
14.6.25 The highway construction works could last for a period of up to
four months and would include:
South Terminal roundabout
▪ Narrow lane running or periods of temporary lane closure on
the M23 Spur and/or Airport Way, with some contraflow
running for bridge works and tying in the new slips back to
the M23 Spur.
▪ No right turn into the Airport, owing to the reduced capacity
of the roundabout, with traffic being sent to Junction 9 to u-
turn.
Both roundabouts
▪ Single of narrow lanes on the circulatory of both
roundabouts.
North Terminal roundabout
▪ Narrow lanes on merges and diverges, likely requiring some
traffic management on the A23.
▪ A combination of narrow lanes and/or lane closures and
contraflow running on the western section of Airport Way to
allow the flyover to be built.
14.6.26 It is envisaged that these works would take place November
through to February.
14.6.27 Accordingly, strategic modelling has tested the most conservative
construction phase against winter Airport traffic assuming 2029
with Project demand, ie assuming the Northern Runway is open,
to provide a robust assessment of potential construction impacts
with additional demand generated by increased runway capacity.
14.6.28 Traffic flows on a peak Friday in winter are 72% of those of a
peak summer day, reflecting that this is a quieter period at the
Airport and therefore when it would make the most sense to
sequence the more complex phases of highway construction at
this time.
14.6.29 Modelling of this scenario shows reassignment of traffic owing to
the temporary highway works on the M23 Spur, as per Diagram
14.6.2. The links shown in red indicate a reduction in traffic. It can
be seen that traffic reduces on the M23 Spur, this being
background traffic not needing to access the Airport, seeking
alternative routes. The works also impact on traffic levels on the
M23 itself with reductions also shown by the model on the
motorway. M23 Junction 9 shows an increase in traffic flows
related to right-turning into the Airport being forbidden during this
construction phase and therefore traffic from the west heading to
South Terminal having to u-turn at Junction 9.
14.6.30 The modelling shows increases on highway or road links shown
in green and blue. Notable changes include north-south traffic
between Horley and Crawley rerouting via Balcombe Road as
well as some traffic taking a route on the west side of the Airport
from Ifield Avenue in Crawley via Bonnets Lane, Lowfield Heath
Road, Horley Road and Charlwood Road and into Horley via
Povey Cross.
Diagram 14.6.2: Reassignment of Traffic during Highway Construction

Preliminary Environmental Information Report: September 2021 Appendix 12.9.1: Preliminary Transport Assessment Report (PTAR) Page 141
Our northern runway: making best use of Gatwick
14.6.31 It should be noted that flows are shown as Annual Average Daily
Traffic, equivalent to average 24 hour flows. As such, where red
is shown, traffic flow has reduced by 400 AADT or more, which is
equivalent to a reduction of 17 vehicles or more per hour on
average on those roads. Green shows increases of between 0
and 1000 AADT, which is equivalent to between 42 more vehicles
per hour on average on those roads. These changes are
therefore relatively small, less than one vehicle per minute, which
is reflected in changes in junction performance.
14.6.32 In general, temporary capacity issues at junctions are only
observed on the SRN where works are taking place or at
junctions on Airport. Minor changes in capacity are shown in
Redhill and Copthorne owing to some local traffic reassignment in
the model.
Diagram 0.1: Junction Analysis during Highway Construction
14.6.33 At this stage, the effects associated with highway networks, such
as potential congestion and traffic reassignment, are preliminary
as construction sequencing has not been fully developed or
agreed with Highways England.
Preliminary Environmental Information Report: September 2021 Appendix 12.9.1: Preliminary Transport Assessment Report (PTAR) Page 142
Our northern runway: making best use of Gatwick
15 Freight, Cargo and Logistics
15.1 Definition of Freight Movements
15.1.1 At Gatwick, there are four types of goods vehicle movements, as
described below.
▪ Air cargo: movements related to shipments that have been
brought in or will be taken away by air, typically in the belly
of passenger aircraft.
▪ Logistics: movements that relate to goods delivered to
businesses that operate on airport, including retailers, food
and beverage outlets and catering. The reverse flow of
waste away is also included in logistics movements.
▪ Airline servicing: movements related to inflight catering,
including movements to the consolidation centre near
Perimeter Road South, as well as those between the
consolidation centre and the aircraft.
▪ Airport servicing: movements related to construction and
maintenance on the airport estate.
15.1.2 Each of these movements occurs in a different area of the airport.
▪ Air cargo and logistics are handled in the cargo area north of
the airfield and west of North Terminal.
▪ Waste consolidation occurs south of the cargo area along
Larkins Road.
▪ Airline servicing is based south of the airfield in the Gatwick
Gate Industrial Estate.
▪ Airport servicing originates from both north and south of the
airfield, depending on the type of activity.
15.1.3 This section describes these different types of traffic, their activity
within each freight zone and impact on the road network. For the
purposes of the assessment, freight traffic comprises Light Goods
Vehicles (LGVs) and Heavy Goods Vehicles (HGVs).
15.2 Air Cargo
Current demand and future growth
15.2.1 In 2019, Gatwick handled over 150,000 tonnes of cargo driven by
additional long-haul services. A high proportion of Gatwick’s
cargo traffic involves non-EU markets and most of this cargo is
carried by passenger aircraft in the form of belly cargo. This is
expected to continue into the future.
15.2.2 Gatwick’s cargo volumes are forecast to grow to over 229,000
tonnes by 2047 in the baseline and to over 303,000 tonnes with
the Project.
15.2.3 Forecast growth in cargo volumes is driven by an increasing
proportion and volume of flights to long haul markets where cargo
volumes are typically strong. To serve these markets, the
forecasts anticipate a greater proportion of wide-body aircraft with
cargo capacities in line with or greater than today’s fleet.
Cargo Handling Area
15.2.4 The Cargo facility covers an area of 10 hectares. This is made up
of 23,000 m² of cargo sheds, plus office accommodation, areas
for HGV loading, unloading and parking, and open equipment
parking areas.
15.2.5 The cargo sheds are owned by a third party with a long-term
ground lease. Gatwick has no direct commercial involvement with
the cargo operation, although GAL manages the Border
Inspection Post located there. The inspection post is used for
temporary storage, inspection and clearance of live animals and
foodstuffs.
15.2.6 The Gatwick Direct logistics operation run by DHL, consolidates
deliveries and some of the waste collection operation, is also
located in part of the cargo building (see Section 15.3).
15.2.7 In the mid-2000s, the cargo area handled 300,000 tonnes of air
freight annually. Therefore, it is envisaged the return to these
historic air cargo levels by 2047 can be accommodated within the
existing air cargo area.
15.2.8 The cargo area is shown in Diagram 15.2.1. Access is via the
North Terminal roundabout. The Project envisages reconfiguring
this junction to provide additional capacity. Longbridge
roundabout will also be upgraded as part of the Project. These
enhancements and their performance are discussed in more
detail in Sections 9 and 11.
Current Cargo Traffic
15.2.9 When considering cargo growth into the future, the following can
be inferred from current operations.
▪ Landside vehicle movements related to air cargo tend to be
outside typical commuter peak periods.
▪ The last decade has witnessed an increase in consolidation
with fewer but larger shipments on heavier vehicles, such as
typical 30 tonne HGVs.
▪ The number of cargo vehicles is typically low when
compared against other vehicle movements to and from
Gatwick. Cargo handlers typically expect a maximum of
between 50 and 60 LGVs and HGVs per day.
15.2.10 Data from August 2019 shows an average two vehicles per hour
(55 across the day) into Dnata’s area of the cargo centre. Whilst
there is no current data for Royal Mail, WFS movements and
other cargo movements, it is estimated that a maximum of five
vehicles of varying size arrive at the cargo centre in any given
hour currently. When compared to traffic on the highway network
around the Airport, this is a very low level of vehicle activity.

Preliminary Environmental Information Report: September 2021 Appendix 12.9.1: Preliminary Transport Assessment Report (PTAR) Page 143
Our northern runway: making best use of Gatwick
Diagram 15.2.1: Location and scale of cargo and freight facilities
Diagram 15.2.2: Cargo Facility during Commuter Peak Period – Low Activity
North
Terminal
South
Terminal
Cargo
Facility
Preliminary Environmental Information Report: September 2021 Appendix 12.9.1: Preliminary Transport Assessment Report (PTAR) Page 144
Our northern runway: making best use of Gatwick
15.3 Logistics
Gatwick Direct
15.3.1 Gatwick Direct is a consolidation centre, which opened in
November 2013, for the handling of consumer goods that are
sold by retail concessionaires in the terminal buildings. This is a
fully secure operation, controlled by Gatwick security and with
CCTV throughout, but operated by DHL.
15.3.2 The Gatwick Direct facility is located at the eastern end of the
cargo facility. There is an airside / landside boundary that runs
through the Gatwick Direct warehouse, with screening being
conducted through a security fence from one side of the building
to the other.
15.3.3 All vehicles arriving at Gatwick Direct must have an online,
system-generated valid booking reference with a specific timed
delivery. This allows DHL to manage incoming flows to suit
operations and / or peak traffic hours on road networks. Vehicles
are directed to specific loading bays by the booking reference.
15.3.4 When goods arrive, they are unloaded against the booking-in
information and marshalled prior to being screened through the
control point (CP) fence. Gatwick has introduced paying for
screening, the cost of which is invoiced to Gatwick Direct users.
15.3.5 The major benefits to concessionaires are in time-saving and
potentially stockroom savings, therefore cost reduction.
Moreover, there is no need to have airside passes/training for
staff. The benefit to Gatwick is that fewer vehicles are allowed, or
need to pass, airside.
15.3.6 The service has reduced airside vehicle traffic, and through
managed deliveries and increased volumes should help to reduce
landside vehicles and spread the deliveries over non-peak hours.
Both will be of benefit for the access strategy for Gatwick.
15.3.7 Gatwick Direct therefore brings advantages in terms of efficiency
and security, but importantly for the road network, also in terms of
potential consolidation and a reduction in vehicle movements.
15.3.8 Data from August 2019 shows an average four vehicles per hour
(84 across the day) from 350 different suppliers into the Gatwick
Direct area managed by DHL. 50% of vehicles entered between
05:00-12:00, peaking at 05:00-06:00 and 10:00-11:00, with peak
hour arrivals up to 7 vehicles. 46% of all vehicles booked in by
DHL were LGVs, with most arrivals through the morning and
middle of the day. On average, two HGVs arrived per hour across
the day. Again, these numbers are not significant compared to
flows on the wider network.
Waste
15.3.9 There are three groups of waste movements: Gatwick airside,
Gatwick landside and third party. Data from October 2019 shows
an average one vehicle per hour (16 across the day) into the
waste centre.
15.4 Airline Servicing
15.4.1 Airline servicing includes provision of fuel, catering and other
services.
15.4.2 At this stage, data on tanker trips to / from the fuel farm from
outside the airport are still being analysed. This is also true of
supplier trips to / from the catering consolidation centre from
outside the airport.
15.4.3 This data will be included in the strategic modelling when
available.
15.5 Airport Servicing
15.5.1 Airport servicing includes movements by construction, facilities
maintenance, air traffic control and other services.
15.5.2 Data exists for business-as-usual construction traffic and this
data will be used to inform baseline construction and
maintenance and activity in terms of number of vehicles as
compared to capital expenditure of works.
15.6 Conclusions
15.6.1 Strategic highway modelling of future highway network around
the Airport, including air cargo and logistics activities, is described
in Section 10, with more localised capacity modelling of junctions
around the Airport described in Section 11. These models include
the main access points to the Gatwick Airport site from the wider
road network for cargo and logistics vehicles.
16 Catchment Areas
16.1.1 Surface access connectivity is important in terms of widening and
spreading the benefits of air traffic growth across the South-East
and the rest of the UK. This section sets out the extent of Gatwick
Airport’s catchment.
16.1.2 This section is supported by GIS mapping, provided in Annex A,
which reflects the journey times and accessibility of transport
services from parts of the UK as well as proximity and ease of
access to Gatwick. In particular, it provides specific “quality of life”
analysis of:
▪ the geographical proximity of Gatwick in 5 mile, 10 mile, 25
mile and under 50 mile catchments; and
▪ the surface access journey time proximity to Gatwick at less
than 30 minutes, less than one hour, less than two hours
and less than four hours.
16.2 Current Catchment
16.2.1 In terms of catchment and based on the current geographical
location of population, the number of people living in 5 mile, 10
mile, 25 mile and 50 mile catchments from Gatwick is as follows:
▪ 170,000 people between 0 and 5 miles.
▪ 248,000 people between 5 and 10 miles, equivalent to
418,000 between 0 and 10 miles of the airport.
▪ 5.662 million people within 10 and 25 miles, equivalent to
5.910 million between 0 and 25 miles of the airport.
▪ 11.193 million people within 25 and 50 miles, equivalent to
16.855 million people within 0 and 50 miles of the airport.
16.3 Current Journey Times (All Modes)
16.3.1 In terms of current journey times across all modes, the number of
people between 0 and 4 hours from Gatwick is as follows:
▪ 494,000 people between 0 and 30 minutes.
▪ 4.259 million people between 30 and 60 minutes, equivalent
to 4.75 million within 0 to 60 minutes from the airport.
▪ 8.831 million people between 60 and 90 minutes, equivalent
to 13.584 million people within 0 and 90 minutes from the
airport.
▪ 7.574 people within 90 and 120 minutes, equivalent to
21.158 million persons within 0 and 120 minutes of the
airport.
▪ 25.538 million people within 120 and 240 minutes,
equivalent to 46.696 million people within 0 to 120 minutes
from the airport.
Preliminary Environmental Information Report: September 2021 Appendix 12.9.1: Preliminary Transport Assessment Report (PTAR) Page 145
Our northern runway: making best use of Gatwick
17 Resiliency and Reliability of
Transportation Networks
17.1.1 Gatwick currently has a 24/7 surface transport operational
response team to enable it to react and respond to incidents or
accidents at the airport, as well as on transport networks
approaching the airport.
17.1.2 Gatwick is the only UK airport to still have this type of team with
other airports having disbanded their teams and passed
responsibility to other agencies.
17.1.3 The role of the operational response team is to make sure
everything runs smoothly. This includes managing and inspecting
the road network and using established safety techniques to
monitor, analyse and prevent accidents. In addition, Gatwick’s
team is also equipped with a snow fleet to clear roads in winter
conditions as well as flooding kits, in order to be able to respond
to extreme wet weather events.
17.1.4 Gatwick has implemented joined-up rail contingency planning
with Network Rail, relevant Train Operating Companies and
Transport for London. This aligned thinking and coordinated
response has been clearly demonstrated during planned
closures, as described in Section 17.2.
17.1.5 The safety response to accidents and incidents on the road
network is governed principally by Highways Regulations.
Gatwick’s approach is to have a comprehensive strategy to
manage these risks, based on leadership and behaviours,
effective management systems, assurance systems and
performance management. In addition, protocols are in place with
key stakeholders and agencies, including West Sussex Police, to
deliver a rapid and coordinated response.
17.2 Resilience and Reliability of the Rail Network
Configuration of the Network
17.2.1 The Brighton-London main line is one of the busiest railway lines
in the country, and therefore the performance and resilience of
this part of the network is important to the whole of the south of
England.
17.2.2 It is important to note that the Brighton-London main line is not a
single corridor, it has a number of built-in diversionary routes,
which increase its resilience.
▪ North of Gatwick there are two independent routes as far as
Purley, known as the Quarry Line and the Redhill line.
▪ Beyond East Croydon there are three independent routes to
London termini, again able to be used to divert services
when necessary.
▪ From South Croydon, there are five tracks to provide
additional 'tidal flow' capability.
▪ A completely independent route to London is also available
via Horsham and Epsom.
▪ In times of operational disruption, all trains from Gatwick can
use any route to London.
▪ There is also scope to turn trains back at Three Bridges
helped by one of the Thameslink depots being there.
Investment in capacity and asset resilience
17.2.3 The Network Rail Sussex Area Route Study, published in 2015,
identifies the long-term strategy for the Sussex Route, particularly
in terms of enhancing capacity to meet forecast traffic growth
through projects such as the Thameslink Programme, whilst also
considering the need for a renewal programme to address
sustainability, resilience and asset performance along the
Brighton-London main line. The Plan recognises that there is a
balance required between increasing capacity and improving
reliability through planned upgrades.
17.2.4 Data collected by Network Rail shows that passenger numbers
on the line have more than doubled since the year 2000, with
around 300,000 people using the route each day. This means
busier services and more crowded trains in peak periods,
particularly north of Croydon.
17.2.5 As described in Section 7, a major infrastructure proposal exists
to eliminate bottlenecks in the Croydon and Windmill Bridge area
to release more train paths that can be used to run additional
train services to reduce crowding and support future growth.
17.2.6 In addition, removing the bottlenecks on the line will provide
greater resilience. At the moment, these bottlenecks ‘magnify the
impact of even the most minor incident or delay along the line,
making it much harder to get trains back on time when things go
wrong’. (Network Rail, 2018)
17.2.7 Accordingly, passengers on the Brighton-London main line are
more likely to experience 60% more knock-on delay when an
incident occurs when compared to the South West Main Line.
The South West Main Line is a useful comparator as it has similar
passenger numbers and train service frequencies as the
Brighton-London main line.
17.2.8 In addition to major investment, Network Rail has also been
carrying out a progressive series of renewals and repairs to
improve reliability and performance on the Brighton-London main
line, including a major 9-day closure in February 2019 and an
additional series of weekend closures around it.
17.2.9 The focus of these improvements has been towards the southern
end of the line between Three Bridges and Brighton / Lewes, with
engineering work to repair bridges and tunnels, improve
drainage, as well as replace or upgrade power supply, points,
signals and track. The works have included the railway itself as
well as the Victorian-era tunnels at Balcombe, Clayton, Haywards
Heath and Patcham.
17.2.10 The main works undertaken during the 9-day closure related to
renewal of the Balcombe Tunnel Junction along with upgrades to
lineside signalling and power systems between Haywards Heath
and Preston Park. The Brighton-London main line was closed
south of Gatwick Airport and the airport played its part in
supporting this coordinated operation, providing pre-booked car
parking for those who wished to park and ride on train services
north of the Airport. Direct trains to London Victoria continued to
operate every 30 minutes from Gatwick Airport but on a
diversionary route via Horsham.
17.2.11 In total, more than 36,000 hours of work were carried out which
Network Rail estimated as being the equivalent of 79 separate
weekend closures.
17.2.12 Separate weekend closures were also carried out, with works
including ballast cleaning, signal upgrades, improved track
formation (Preston Park Station), rerailing through Keymer level
crossing and deep cleaning of track and other infrastructure
(Wivelsfield Station).
17.2.13 The works described above represent £67 million in upgrades to
the Brighton-London main line corridor which will improve
reliability along the line. In addition, north of London, engineering
works on the East Coast Main Line will significantly improve
reliability for all operators, including Great Northern and
Thameslink.
Service reliability
17.2.14 Gatwick has one of the widest ranges of through train
destinations of any station in the south of England, which makes
it an ideal transport hub with a number of alternative routes,
including two to London in terms of Victoria and London Bridge.
In particular, the improvement works related to the Thameslink
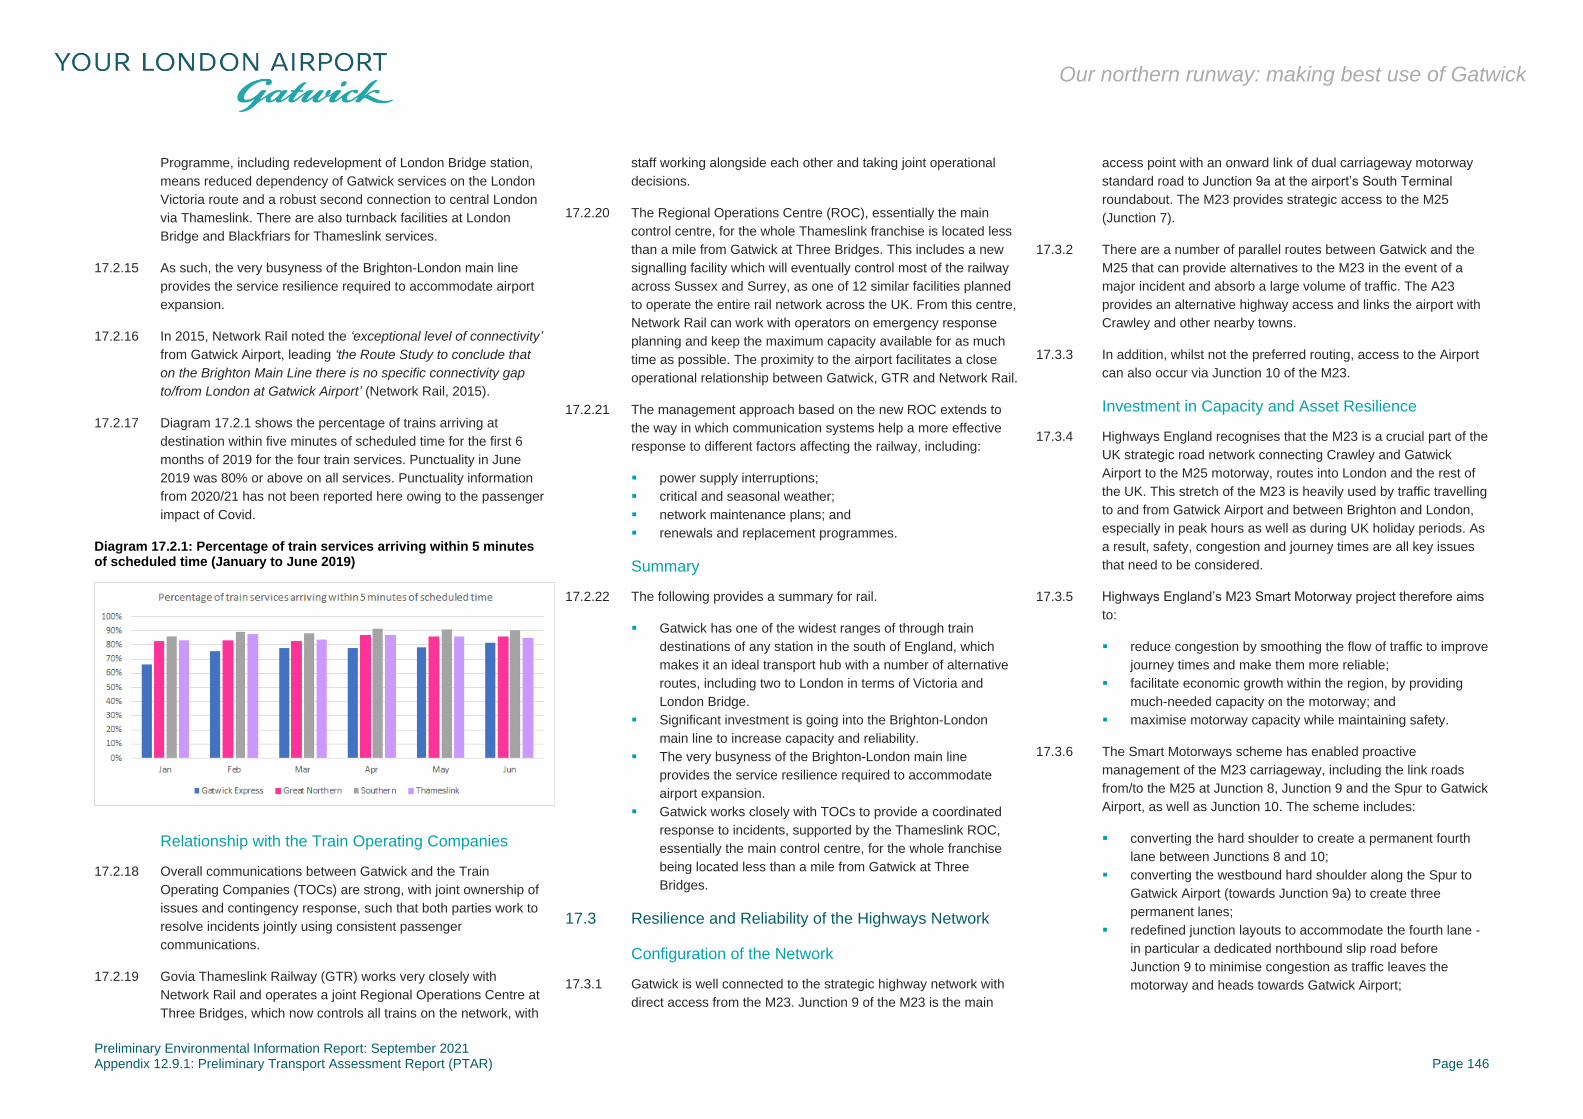
Preliminary Environmental Information Report: September 2021 Appendix 12.9.1: Preliminary Transport Assessment Report (PTAR) Page 146
Our northern runway: making best use of Gatwick
Programme, including redevelopment of London Bridge station,
means reduced dependency of Gatwick services on the London
Victoria route and a robust second connection to central London
via Thameslink. There are also turnback facilities at London
Bridge and Blackfriars for Thameslink services.
17.2.15 As such, the very busyness of the Brighton-London main line
provides the service resilience required to accommodate airport
expansion.
17.2.16 In 2015, Network Rail noted the ‘exceptional level of connectivity’
from Gatwick Airport, leading ‘the Route Study to conclude that
on the Brighton Main Line there is no specific connectivity gap
to/from London at Gatwick Airport’ (Network Rail, 2015).
17.2.17 Diagram 17.2.1 shows the percentage of trains arriving at
destination within five minutes of scheduled time for the first 6
months of 2019 for the four train services. Punctuality in June
2019 was 80% or above on all services. Punctuality information
from 2020/21 has not been reported here owing to the passenger
impact of Covid.
Diagram 17.2.1: Percentage of train services arriving within 5 minutes of scheduled time (January to June 2019)
Relationship with the Train Operating Companies
17.2.18 Overall communications between Gatwick and the Train
Operating Companies (TOCs) are strong, with joint ownership of
issues and contingency response, such that both parties work to
resolve incidents jointly using consistent passenger
communications.
17.2.19 Govia Thameslink Railway (GTR) works very closely with
Network Rail and operates a joint Regional Operations Centre at
Three Bridges, which now controls all trains on the network, with
staff working alongside each other and taking joint operational
decisions.
17.2.20 The Regional Operations Centre (ROC), essentially the main
control centre, for the whole Thameslink franchise is located less
than a mile from Gatwick at Three Bridges. This includes a new
signalling facility which will eventually control most of the railway
across Sussex and Surrey, as one of 12 similar facilities planned
to operate the entire rail network across the UK. From this centre,
Network Rail can work with operators on emergency response
planning and keep the maximum capacity available for as much
time as possible. The proximity to the airport facilitates a close
operational relationship between Gatwick, GTR and Network Rail.
17.2.21 The management approach based on the new ROC extends to
the way in which communication systems help a more effective
response to different factors affecting the railway, including:
▪ power supply interruptions;
▪ critical and seasonal weather;
▪ network maintenance plans; and
▪ renewals and replacement programmes.
Summary
17.2.22 The following provides a summary for rail.
▪ Gatwick has one of the widest ranges of through train
destinations of any station in the south of England, which
makes it an ideal transport hub with a number of alternative
routes, including two to London in terms of Victoria and
London Bridge.
▪ Significant investment is going into the Brighton-London
main line to increase capacity and reliability.
▪ The very busyness of the Brighton-London main line
provides the service resilience required to accommodate
airport expansion.
▪ Gatwick works closely with TOCs to provide a coordinated
response to incidents, supported by the Thameslink ROC,
essentially the main control centre, for the whole franchise
being located less than a mile from Gatwick at Three
Bridges.
17.3 Resilience and Reliability of the Highways Network
Configuration of the Network
17.3.1 Gatwick is well connected to the strategic highway network with
direct access from the M23. Junction 9 of the M23 is the main
access point with an onward link of dual carriageway motorway
standard road to Junction 9a at the airport’s South Terminal
roundabout. The M23 provides strategic access to the M25
(Junction 7).
17.3.2 There are a number of parallel routes between Gatwick and the
M25 that can provide alternatives to the M23 in the event of a
major incident and absorb a large volume of traffic. The A23
provides an alternative highway access and links the airport with
Crawley and other nearby towns.
17.3.3 In addition, whilst not the preferred routing, access to the Airport
can also occur via Junction 10 of the M23.
Investment in Capacity and Asset Resilience
17.3.4 Highways England recognises that the M23 is a crucial part of the
UK strategic road network connecting Crawley and Gatwick
Airport to the M25 motorway, routes into London and the rest of
the UK. This stretch of the M23 is heavily used by traffic travelling
to and from Gatwick Airport and between Brighton and London,
especially in peak hours as well as during UK holiday periods. As
a result, safety, congestion and journey times are all key issues
that need to be considered.
17.3.5 Highways England’s M23 Smart Motorway project therefore aims
to:
▪ reduce congestion by smoothing the flow of traffic to improve
journey times and make them more reliable;
▪ facilitate economic growth within the region, by providing
much-needed capacity on the motorway; and
▪ maximise motorway capacity while maintaining safety.
17.3.6 The Smart Motorways scheme has enabled proactive
management of the M23 carriageway, including the link roads
from/to the M25 at Junction 8, Junction 9 and the Spur to Gatwick
Airport, as well as Junction 10. The scheme includes:
▪ converting the hard shoulder to create a permanent fourth
lane between Junctions 8 and 10;
▪ converting the westbound hard shoulder along the Spur to
Gatwick Airport (towards Junction 9a) to create three
permanent lanes;
▪ redefined junction layouts to accommodate the fourth lane -
in particular a dedicated northbound slip road before
Junction 9 to minimise congestion as traffic leaves the
motorway and heads towards Gatwick Airport;
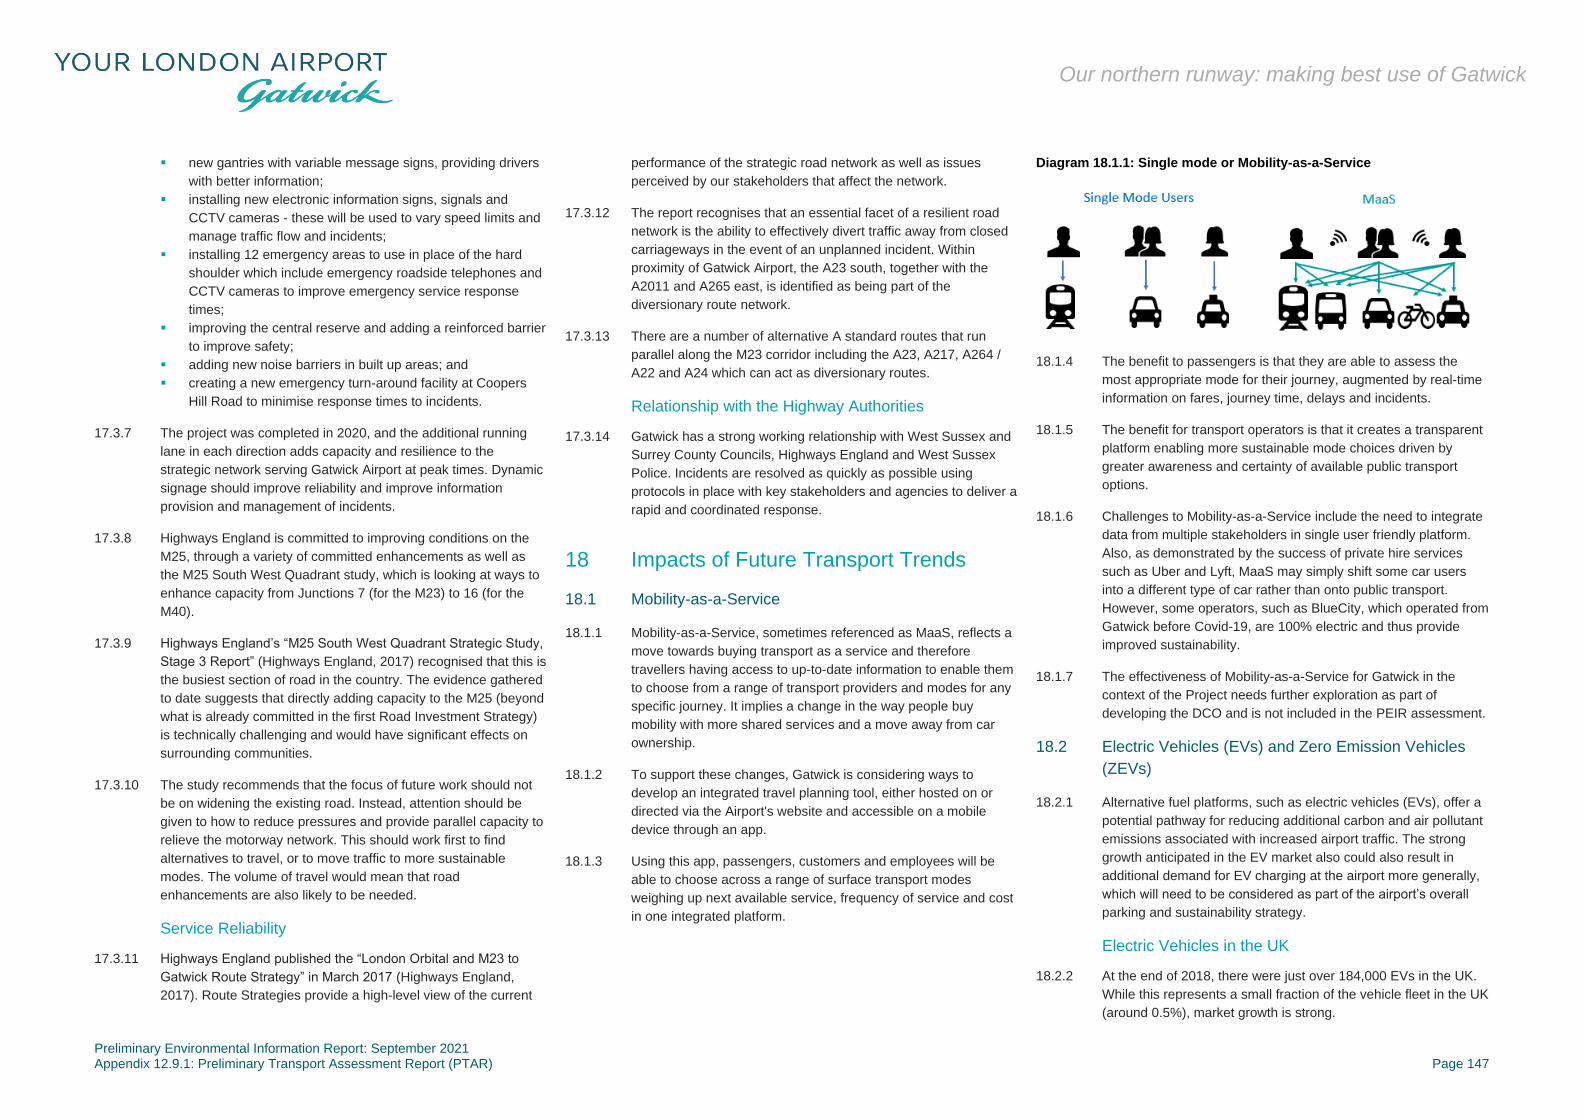
Preliminary Environmental Information Report: September 2021 Appendix 12.9.1: Preliminary Transport Assessment Report (PTAR) Page 147
Our northern runway: making best use of Gatwick
▪ new gantries with variable message signs, providing drivers
with better information;
▪ installing new electronic information signs, signals and
CCTV cameras - these will be used to vary speed limits and
manage traffic flow and incidents;
▪ installing 12 emergency areas to use in place of the hard
shoulder which include emergency roadside telephones and
CCTV cameras to improve emergency service response
times;
▪ improving the central reserve and adding a reinforced barrier
to improve safety;
▪ adding new noise barriers in built up areas; and
▪ creating a new emergency turn-around facility at Coopers
Hill Road to minimise response times to incidents.
17.3.7 The project was completed in 2020, and the additional running
lane in each direction adds capacity and resilience to the
strategic network serving Gatwick Airport at peak times. Dynamic
signage should improve reliability and improve information
provision and management of incidents.
17.3.8 Highways England is committed to improving conditions on the
M25, through a variety of committed enhancements as well as
the M25 South West Quadrant study, which is looking at ways to
enhance capacity from Junctions 7 (for the M23) to 16 (for the
M40).
17.3.9 Highways England’s “M25 South West Quadrant Strategic Study,
Stage 3 Report” (Highways England, 2017) recognised that this is
the busiest section of road in the country. The evidence gathered
to date suggests that directly adding capacity to the M25 (beyond
what is already committed in the first Road Investment Strategy)
is technically challenging and would have significant effects on
surrounding communities.
17.3.10 The study recommends that the focus of future work should not
be on widening the existing road. Instead, attention should be
given to how to reduce pressures and provide parallel capacity to
relieve the motorway network. This should work first to find
alternatives to travel, or to move traffic to more sustainable
modes. The volume of travel would mean that road
enhancements are also likely to be needed.
Service Reliability
17.3.11 Highways England published the “London Orbital and M23 to
Gatwick Route Strategy” in March 2017 (Highways England,
2017). Route Strategies provide a high-level view of the current
performance of the strategic road network as well as issues
perceived by our stakeholders that affect the network.
17.3.12 The report recognises that an essential facet of a resilient road
network is the ability to effectively divert traffic away from closed
carriageways in the event of an unplanned incident. Within
proximity of Gatwick Airport, the A23 south, together with the
A2011 and A265 east, is identified as being part of the
diversionary route network.
17.3.13 There are a number of alternative A standard routes that run
parallel along the M23 corridor including the A23, A217, A264 /
A22 and A24 which can act as diversionary routes.
Relationship with the Highway Authorities
17.3.14 Gatwick has a strong working relationship with West Sussex and
Surrey County Councils, Highways England and West Sussex
Police. Incidents are resolved as quickly as possible using
protocols in place with key stakeholders and agencies to deliver a
rapid and coordinated response.
18 Impacts of Future Transport Trends
18.1 Mobility-as-a-Service
18.1.1 Mobility-as-a-Service, sometimes referenced as MaaS, reflects a
move towards buying transport as a service and therefore
travellers having access to up-to-date information to enable them
to choose from a range of transport providers and modes for any
specific journey. It implies a change in the way people buy
mobility with more shared services and a move away from car
ownership.
18.1.2 To support these changes, Gatwick is considering ways to
develop an integrated travel planning tool, either hosted on or
directed via the Airport's website and accessible on a mobile
device through an app.
18.1.3 Using this app, passengers, customers and employees will be
able to choose across a range of surface transport modes
weighing up next available service, frequency of service and cost
in one integrated platform.
Diagram 18.1.1: Single mode or Mobility-as-a-Service
18.1.4 The benefit to passengers is that they are able to assess the
most appropriate mode for their journey, augmented by real-time
information on fares, journey time, delays and incidents.
18.1.5 The benefit for transport operators is that it creates a transparent
platform enabling more sustainable mode choices driven by
greater awareness and certainty of available public transport
options.
18.1.6 Challenges to Mobility-as-a-Service include the need to integrate
data from multiple stakeholders in single user friendly platform.
Also, as demonstrated by the success of private hire services
such as Uber and Lyft, MaaS may simply shift some car users
into a different type of car rather than onto public transport.
However, some operators, such as BlueCity, which operated from
Gatwick before Covid-19, are 100% electric and thus provide
improved sustainability.
18.1.7 The effectiveness of Mobility-as-a-Service for Gatwick in the
context of the Project needs further exploration as part of
developing the DCO and is not included in the PEIR assessment.
18.2 Electric Vehicles (EVs) and Zero Emission Vehicles
(ZEVs)
18.2.1 Alternative fuel platforms, such as electric vehicles (EVs), offer a
potential pathway for reducing additional carbon and air pollutant
emissions associated with increased airport traffic. The strong
growth anticipated in the EV market also could also result in
additional demand for EV charging at the airport more generally,
which will need to be considered as part of the airport’s overall
parking and sustainability strategy.
Electric Vehicles in the UK
18.2.2 At the end of 2018, there were just over 184,000 EVs in the UK.
While this represents a small fraction of the vehicle fleet in the UK
(around 0.5%), market growth is strong.

Preliminary Environmental Information Report: September 2021 Appendix 12.9.1: Preliminary Transport Assessment Report (PTAR) Page 148
Our northern runway: making best use of Gatwick
18.2.3 The primary types of electric vehicles operating in the UK are
plug-in hybrid (PHEVs) and pure, battery electric vehicles (BEVs).
Historically, most EVs sold in the UK have been PHEVs, which
make up nearly two thirds of the EV fleet while BEVs comprised
around a third. The small remainder of the market is comprised of
range extended and hydrogen fuel cell vehicles.
18.2.4 Although PHEV vehicles have been a prominent feature of the
early technology cycle for EVs, they are widely seen as a
steppingstone in a transition to fully electric vehicles. Recently,
PHEVs were excluded from government grants programs for low-
emission vehicles, which resulted in 34% drop in sales (Autocar,
2019). At the same time, improvements to battery technology
resulting in improved vehicle range, wider availability of charging
infrastructure, and development of rapid charging networks are
also increasing consumer acceptance of 100% battery electric
vehicles.
18.2.5 EV batteries are charged by plugging the vehicle into a charge
point. A spectrum of alternating and direct current (AC and DC)
charging infrastructure exists, which may be characterised as
slow to rapid charging. Power is measured in kW and the greater
the power supplied by charge point, the faster the battery will
charge. While larger batteries usually supply greater range – the
same way a larger petrol tank would – they also take longer to
reach a full state of charge.
18.2.6 Depending on the vehicle and type of charging infrastructure
used, current vehicles may take up to 8 hours to reach a full state
of charge from empty. However, fast and rapid charging
infrastructure is increasingly available. A 50kw DC rapid-charge
point can recharge 80% of a typical vehicle’s capacity in less than
1 hour. The following table provides an overview of charging
equipment. The total time required to charge an EV varies both
by battery capacity and the on-board charging equipment – which
receives and manages the supplied load.
5 Analysis of popular vehicles on ev-database.co.uk. Ranges vary by driving conditions and weather and is highest in urban areas and in mild temperatures.
Table 18.2.1: Electric Vehicle Charging Infrastructure Levels
Type Power
Supplied
Charge Time Typical Application
Slow 3 kW AC 6 - 12 hours Overnight home
charging
Fast 7 kW -22 kW
AC
3 - 4 hours Workplace charging;
public charging
Rapid > 50 kW DC 80% charge in 30 -
60 minutes
Fuel stations; public
charging; taxi ranks
Source: www.zap-map.com
18.2.7 Industry continues to invest in improving charging infrastructure
to provide consumers with an experience in line with traditional
petrol stations. Ultra-rapid chargers, with power levels between
150 and 350 kW could provide compatible vehicles with well over
200 miles of range in about 10 minutes (Current News, 2019).
EV market forecasts
18.2.8 National Grid’s annual Future Energy Scenarios publication
provides scenario-based forecasts of EV uptake throughout the
UK (National Grid, 2019). These forecasts provide a reasonable
estimate of the potential growth in the EV market out to 2050.
They are based on varied assumptions regarding government
policy and technological advancement, including Net Zero by
2050.
18.2.9 In all scenarios, it is anticipated that most vehicles sold in the
future will be fully battery electric, with the speed of transition
varying between scenarios. By 2050, it is envisaged that battery
electric cars and vans will comprise 80 to 90% of all vehicles on
UK roads.
18.2.10 Those passengers and staff who continue to drive to Gatwick in
the future will transition to electric vehicles faster than most other
vehicle types. The chart below presents the range (low to high) of
BEV uptake amongst cars only. The ranges begin to converge in
late 2040s indicating relative confidence in long term market for
EVs, with a much greater bandwidth in the 2020s and 2030s.
Diagram 18.2.1: National Grid, Battery Electric Car Scenarios (2015-2050)
Source: FES 2019
18.2.11 While the ranges above are large, the direction is clear that,
within the next 10 years, several thousand cars parked at
Gatwick Airport at any given time are likely to be EVs.
General planning considerations
18.2.12 In the context of tens of thousands of EVs at the Airport in the
next 20 years, developing a sensible and appropriate strategy to
accommodate this increased in EV activity is important for the
DCO and for the Project ASAS.
18.2.13 That said, it is unlikely that most EVs will require on-airport
charging. Overnight, home-based charging is likely to remain the
most prevalent behaviour short-term and the growth and spread
of EV infrastructure in local areas surrounding the Airport will play
a part in reducing the need for lots of charging activity on Airport.
18.2.14 Increasing vehicle range is also an important factor in
determining the overall charging demand for airport users.
Ranges of up to 200 to 500 km (125 to 315 miles) are typical of
the current generation of EVs, with premium vehicles such as the
Tesla Model S reaching ranges of up to 500 km (315 miles).5
Even as driving range improves, the current ranges are high
enough to support a return journey from home to the Airport for
all staff and a large proportion of Gatwick passengers.
0.0%
20.0%
40.0%
60.0%
80.0%
100.0%
2015 2020 2025 2030 2035 2040 2045 2050
Range of Uptake in Battery Electric Cars

Preliminary Environmental Information Report: September 2021 Appendix 12.9.1: Preliminary Transport Assessment Report (PTAR) Page 149
Our northern runway: making best use of Gatwick
18.2.15 For those users who do require a charge or top-off while at the
airport, several models of infrastructure delivery could be
deployed. Each has advantages and disadvantages and a
comprehensive strategy is likely to rely on elements of each.
These include:
▪ Distributed slow charging – a large, distributed network of
low-power charge points deployed across parking facilities,
typically serving only one parking space. This model is
employed at Oslo airport, which features over 700 chargers
in two passenger parking facilities. Whilst comparatively
easy to provide, this method can be relatively inefficient with
low-utilisation per space, eg an air passenger taking a two
week trip may only require the use of the charger for a small
portion of their overall parking duration but remain parked at
that space for the entirety of their trip.
▪ Valet model – Under a valet model, a parking attendant
would be able to move multiple vehicles each day and
charge them on the same charge points. Passengers or staff
would leave their car with the attendant, who would fuel the
vehicle at a charging hub prior to parking it at a designated
location (or prior to collection). Chargers could be fast to
rapid. An alternative to this model could employ mobile
charging units, which have been developed by several
companies. This model, which is actively managed, requires
less infrastructure to charge the same number of vehicles
and could be offered as a premium parking product. The
process could also be automated using robot technology.
▪ Rapid charging hub –Charging hubs would feature clusters
of rapid and ultrarapid chargers, likely en-route from parking
locations to the airport exit, or within the airport’s immediate
surrounds. These locations would be comparable to a
conventional petrol station, providing an opportunity for EV
drivers to “fuel” before leaving the airport. This model
establishes confidence among EV owners that their vehicle
can be charged as needed. 50 kW rapid charge points could
replete the bulk of an EVs battery capacity in about 30
minutes. Use could be time limited to manage demand and
queuing and to encourage turnover, maximising the use
available infrastructure.
Considerations for specific airport users
18.2.16 Gatwick will be able to influence different airport users to varying
degrees, as follows:
▪ Airport passengers – the largest user group but the one that
Gatwick Airport has least direct influence over in terms of
uptake of EVs. The average consumers’ decision to
purchase an EV rather than a conventional vehicle depends
on government incentives, lifestyle factors, and the
availability of convenient charging infrastructure to serve
their daily needs. Nonetheless, Gatwick could support those
passengers that do own EVs by providing sufficient, flexible
charging options for those drivers that require it.
▪ Airport staff – Gatwick has much more influence over airport
staff choices. A variety of incentive programs could be
developed for those choosing to drive electric cars.
However, any incentives should avoid encouraging driving
EVs rather than using other sustainable modes.
▪ Taxis and private hire vehicles – Gatwick’s official taxi
operator already uses an electric fleet (see below). Gatwick
does not have direct influence over other taxi operators or
private-hire vehicle companies. However, Gatwick can
support operators and government initiatives to transition to
electric fleet.
▪ Buses and coaches – Gatwick can influence certain bus
operations directly, such as long-stay car park buses, and
has some influence over third party providers in terms of a
transition to electric buses and coaches. The only existing
electric buses operating at the Airport today are hydrogen
powered and are fuelled off Airport (see below).
▪ Freight – Gatwick has a high level of influence over its own
supply chains, but less so for the delivery of goods to other
on Airport businesses. Businesses operating on Airport can
be incentivised to choose sustainable suppliers and Gatwick
itself could facilitate identification of suppliers for airport
businesses.
Current EV infrastructure and Initiatives at Gatwick
18.2.17 Gatwick currently has several initiatives to promote the use of
EVs at the Airport.
Charging Network
18.2.18 For passenger convenience, Gatwick has installed two EV
chargers at short stay car parks at both North and South
Terminals (four in total). These 22 kW AC fast chargers each
feature two connections and are operated as part of the national
PodPoint charging network. While previously free to use, the
airport now charges an energy tariff of £0.22 per kWh – a cost of
under £10 to fully charge a typical electric vehicle with a 40 kWh
battery. Charge time will vary by vehicle capability at these
locations, ranging from about two to six hours for a full charge.
While PodPoint does not require a membership to use its network
of chargers, users must download their smartphone app to use
the equipment.
18.2.19 In addition to PodPoint chargers, Gatwick has installed an
additional 28 vehicles chargers. These primarily serve airport
vehicles and are located at the fleet vehicle campus and public
short stay car parks (Advance, 2019).
BlueCity Electric Car Club
18.2.20 Gatwick partnered with BlueCity to expand its London-based car
club to the airport. The company used three-door, four-seater
electric vehicles manufactured by Bollore with a range of about
200 km (125 miles). Space for 10 vehicles were dedicated on the
upper forecourt of South Terminal, directly in front of the short
stay car parks with dedicated charge points. These vehicles were
available for trips to and from London. Access to vehicles
requires membership in the car club (£5 per month). Vehicles
were rented at a fee of £0.19 per minute, fully inclusive, with a
£8.50 surcharge for trips to and from Gatwick.
Electric Taxis
18.2.21 Beginning in 2016, Gatwick partnered with its official taxi operator
to transition their fleet to electric and hybrid vehicles. All vehicles
will transition to electric platforms from 2020 and will operate in
emissions free mode within 10 km from the airport (Gatwick
Airport Ltd, 2019).
Hydrogen Buses
18.2.22 Gatwick has partnered with MetroBus to support innovative trials
for hydrogen fuel cell (HFC) electric buses on its network. In
2018, MetroBus introduced the region’s first HFC bus on the
Fastway 100 route. The company has plans to procure a total of
20 fuel cell buses with the intention of operating these on its
network serving the Airport. Gatwick’s support has included
funding for upgrades at the Manor Royal bus depot that will
support the zero-emission fleet.
Electric Forecourt
18.2.23 In collaboration with Gridserve Gatwick is currently investigating
the feasibility of an electric forecourt, equivalent to a petrol
station, on Airport, with charging points for 36 EVs. Initial plans
include provision of fast and rapid charging infrastructure, with
co-located retail and amenities, and additional solar electricity
generation.

Preliminary Environmental Information Report: September 2021 Appendix 12.9.1: Preliminary Transport Assessment Report (PTAR) Page 150
Our northern runway: making best use of Gatwick
Future Electric Vehicle Infrastructure Strategy
18.2.24 Into the future, Gatwick is committed to minimising its carbon
emissions and is therefore actively considering the following.
▪ Encouraging greater use of EVs by airport passengers and
staff through provision of flexible charging options in line with
observed growth in EV demand, investing progressively in
new charging technology and upgrading power supply as
part of major planning and design projects to accommodate
future charging needs. For passengers, this could include
provision of a mix of charging options such as distributed
charging valet charging, and rapid or ultra-rapid charging
hub such as an electric forecourt(s).
▪ Potential provision of a rapid or ultra-rapid charging hub(s)
for taxi and private hire vehicle operators as they require the
fastest charging options available, along with provision of
amenities and welfare. The location of this hub will need to
be carefully considered to prevent non-airport related taxi
use which will create unnecessary trips on Airport.
▪ Transition of Gatwick vehicle fleets supporting airport
operations, including its own vehicles (such as long-stay
buses), third-party authorised operators, airside vehicles,
and ground service equipment to EVs.
18.3 Autonomous Vehicles (AVs)
Understanding Autonomous Vehicles
18.3.1 The advent of Autonomous Vehicles (AVs) promises an array of
benefits to transport users and systems, making driving more
efficient, productive, safer, and more sustainable. The timescales
and scope of impacts, depends on several factors including
manufacturers’ ability to introduce high levels of automation at
scale, government and indeed public acceptance as well as
consumers’ preferred models for meeting their mobility needs.
18.3.2 The transition to an AV future will occur in stages, with driving
functions progressively shifting from driver to vehicle.
18.3.3 The Society of Automotive Engineers (SAE) framework describes
six levels of autonomy, ranging from no autonomy (Level 0) to full
autonomous operation (Level 5) (SAE, 2019). Many vehicles on
the market today have features that correspond to Levels 0 and
1, with some having Level 2 features.
Table 18.3.1: SAE Levels of Autonomy
Driver
Support
Level 0 Limited assistance features, such as blind spot
or lane departure warnings, automated
emergency braking, etc.
Level 1 Either steering or acceleration/braking support.
Typical features are lane centring and adaptive
cruise control.
Level 2 Both steering and acceleration/braking support.
Level 2 vehicles have both lane centring and
adaptive cruise control.
Automated
Driving
Level 3 Vehicle can drive itself under specific conditions
but human driver must take control when
system requests. Examples include traffic jam
chauffeur features.
Level 4 Vehicle can drive itself under specific conditions
without human intervention. Examples include
local, driverless taxis. Steering wheels or
pedals may be absent.
Level 5 Vehicle can drive itself under any conditions
without human intervention.
18.3.4 Although vehicles with Level 3 or better advanced levels of
autonomy are being tested across the globe in various transport
markets segments, such as public transport and in the taxi sector,
such vehicles are not yet in widespread production or operation.
Several pilot projects exist in the UK , including Bristol, London,
Milton Keynes, Oxford, Cambridge, and the West Midlands.
18.3.5 Radical changes to the mobility landscape will be required with
introduction of Level 4 and 5 vehicles which have true self-driving
technology. The key difference between these technologies is
that Level 5 autonomous driving functions must be advanced
enough to perform under all conditions, while Level 4 vehicles are
expected to be limited to specific geographic areas and driving
conditions (known as the “operational design domain”).
Market Timescales
18.3.6 Timescales for deployment of advanced AV technologies remain
uncertain, with predictions of Level 4 and 5 vehicles becoming
more widespread in the 2030s. Highways England has stated that
they expect the Strategic Road Network to be fully autonomous
by 2050 (Highways England, 2017).
18.3.7 Based on these ranges, it appears likely that significant growth in
self-driving vehicles in the UK is likely to begin toward the end the
of the next decade and continue into the 2040s. However,
markets such as taxis/private hire vehicles, buses, and freight
may begin transitioning to automated technologies more quickly.
AVs Impacts on Airports
18.3.8 In long term, the primary impact of AVs on airports is likely to be
a reduction in the overall parking requirements and the potential
need to shift parking to more remote locations. However, the
magnitude of the impact is dependent on whether vehicles are
primarily shared or privately owned.
18.3.9 Private AVs could conduct pick-up and drop-off near terminals,
subsequently parking in more remote locations – or even
returning home – while their owner’s travel. If AVs are primarily a
shared mobility service, fewer vehicles may need to park for long
periods on-site. Instead vehicles will likely circulate to the arrivals
area to pick up new passengers and leave the airport.
18.3.10 In either scenario, more intensive pick-up and drop-off activity
near the terminal is likely, requiring more space in the forecourts
which could be through repurposing of short-stay parking. New
technological and physical design solutions may be needed to
facilitate passenger-vehicle meet up locations. In addition, new
user charging mechanisms may need to be considered to
manage traffic levels. In particular, lower operating costs for
shared AV trips may make AV trips more attractive than public
transport which will in turn impact on highway capacity.
18.3.11 By reducing or shifting parking demand to new locations, valuable
space nearby the terminals dedicated to short-term parking could
be repurposed to serve other landside transport needs, to provide
additional passenger amenities, or be given over to other airport
operating functions.
18.3.12 AVs will change how parking is provided and indeed Gatwick is
already exploring optimising long-term parking through its robotic
valet pilot, which uses small tows capable of lifting a vehicle by
the wheels and moving it to secure storage area. This system has
the potential to store 50% more vehicles within a given area than
traditional, self-parking arrangements (Airport Technology, 2019).
18.3.13 AV buses could serve a wide variety of landside transportation
functions. Driverless shuttles could be operated higher on
frequencies, providing convenient circulators to move staff and
passengers between terminals, remote parking facilities, rental
car centres, and worksites across the airport. This type of

Preliminary Environmental Information Report: September 2021 Appendix 12.9.1: Preliminary Transport Assessment Report (PTAR) Page 151
Our northern runway: making best use of Gatwick
operation is likely to be easier to introduce on the airside where
vehicle types are more controlled.
18.3.14 In conclusion, AVs will introduce changes to the operation of the
Airport into the future, potentially from the end of the assessment
period onwards. Given that this technology is in its infancy,
Gatwick will respond to AVs and their introduction as the
technology begins to emerge and be relevant to airports of
comparable size and scale. Gatwick will therefore evolve and
adapt its AV strategy over time but at this stage AVs have not
been included in this PTAR.
18.3.15 There are many opportunities which Gatwick is keen to take
advantage of, including connecting AVs with the Airport’s
infrastructure through communications technology to actively
manage the location and quantity of vehicles across the Airport
throughout the day to help balance capacity and demand.
19 Conclusions
19.1 Summary of Identified Impacts and Mitigation
19.1.1 The following impacts and mitigation have been identified through
transport modelling and analysis to date.
Rail
19.1.2 Modelling indicates no additional mitigation other than that
already proposed by the rail industry and as included in the future
baseline.
Bus and coach
19.1.3 Potential mitigation may include additional peak period services
or network changes including consideration of new or revised
routes, such as a new bus route hourly Uckfield to Gatwick via
East Grinstead and a new coach route two-hourly Chatham -
Maidstone - Sevenoaks – Gatwick, in line with GAL’s bus and
coach strategy. With these enhancements, modelling indicates no
adverse effects with Project on bus and coach operations.
Highway network
19.1.4 2047 flows with the Project can be accommodated on the main
strategic highway routes currently used by airport traffic.
19.1.5 The M23 Smart Motorways scheme widens the motorway to
effectively 4 lanes in each direction at peak times between
Junctions 8 and 10, providing significant additional capacity.
Furthermore, committed schemes improve reliability along the
corridor.
19.1.6 Given the above, GAL is not proposing any additional mitigation
for the SRN over and above that already envisaged by the
highway authorities, with the exception of the M23 Spur between
Junction 9 and Longbridge Roundabout.
19.1.7 Modelling undertaken to date has identified the Croydon area of
the network as being particularly sensitive (as a result of high
volumes of inner London traffic as well as areas of variable speed
in the model, as opposed to with Project impacts) and the
modelling assumptions (e.g. network definition / scale / coding of
speeds) will be further reviewed during future workstreams in
preparation for the DCO.
19.1.8 Modelling shows that the future baseline to 2029 can be
accommodated on the M23 Spur with local widening and
signalisation works that will be delivered prior to 2029.
19.1.9 Given the congestion shown by the model for 2032 future
baseline, Gatwick has made the decision that more significant
improvements will be required on the highway network to support
additional growth with the Project, otherwise there will be
potential for delays on the network.
19.1.10 With Project and background traffic growth to 2047, modelling
shows some localised areas where congestion would still be
expected, even with highway improvements. However,
congestion levels are manageable and at expected levels for 15
years after opening, indicating that the improvements are
appropriate and proportionate - ie it is sufficient to provide for
expected growth but does not over-provide network capacity.
19.1.11 Through to DCO submission, the highway designs will be
adjusted in line with VISSIM modelling to provide further
improvements.
Walking and Cycling
19.1.12 Gatwick is exploring options to improve walking and cycling and
have submitted proposals to improve linkages alongside the CIP
improvements proposed for highways (see Section 11.2.10).
19.1.13 The final ASAS accompanying the application for development
consent will further develop Gatwick's strategic plan for walking
and cycling. Strategies that will be explored will include increased
and improved amenities, upgraded routes on and, where
appropriate, off airport, improved wayfinding and a programme of
maintenance for existing routes.
Station and Shuttle
19.1.14 Analysis and modelling with Project show that no further
improvements will be required to the railway station platforms or
concourse.
19.1.15 Modelling to 2047 with the Project shows that the boarding
platform of the shuttle stations, particularly at the South Terminal,
can become congested at peak times and that congestion blocks
the platform and prevents full use of shuttle capacity. Analysis
indicates that reducing the headway of the system from 6 minutes
down to 5 minutes would have the greatest benefit in increasing
capacity.
Construction
19.1.16 In terms of airfield construction, preferred option is to have all
material-carrying construction traffic (HGVs and LGVs) use
Junction 9 and the M23 Spur which form part of the SRN. The
SRN is designed to handle higher volumes of traffic. Construction
workforce traffic has been modelled as coming via the shortest
route.
19.1.17 Based on the levels of construction traffic estimated for the
Project, it is not considered that peak airfield construction will
have a significant effect on the performance of the highway
network around the Airport. Further work will be undertaken for
the Environmental Statement to explore measures to mitigate the
potential impacts from construction traffic during peak periods
(such as excluding LGVs and HGVs from peak hours on the
highway network) and reduce the overall construction traffic
loading created by the Project.
19.1.18 Modelling of highway construction shows reassignment of traffic
owing to the temporary highway works on the M23 Spur, with
traffic volumes reducing on the M23 Spur as background traffic
not needing to access the Airport seeks alternative routes. The
works also impact on traffic levels on the M23 itself with
reductions also shown by the model on the motorway. M23
Junction 9 shows an increase in traffic flows related to right-
turning into the Airport being forbidden during this construction
phase and therefore traffic from the west heading to South
Terminal having to u-turn at Junction 9.
19.1.19 The modelling shows increases in north-south traffic between
Horley and Crawley rerouting via Balcombe Road as well as

Preliminary Environmental Information Report: September 2021 Appendix 12.9.1: Preliminary Transport Assessment Report (PTAR) Page 152
Our northern runway: making best use of Gatwick
some traffic taking a route on the west side of the Airport from
Ifield Avenue in Crawley via Bonnets Lane, Lowfield Heath Road,
Horley Road and Charlwood Road and into Horley via Povey
Cross.
19.1.20 These temporary changes are relatively small in traffic terms, less
than one vehicle per minute. As such, capacity issues at junctions
are only observed on the SRN where works are taking place or at
junctions on Airport.
19.2 Airport Surface Access Strategy and Travel Plan for
Gatwick
19.2.1 Draft actions and targets for the Airport Surface Access Strategy
are included for consultation in this PTAR. The final strategy in
the application for development consent will be prepared in
conjunction with Gatwick’s Airport Transport Forum and in
accordance with the Aviation Policy Framework guidance.
19.2.2 Gatwick intends to put forward a robust strategy which enhances
Gatwick as a regional transport hub through improvements to rail,
bus, and sustainable transport with challenging but achievable
mode share targets established towards a lower carbon future.
19.2.3 In alignment with the ASAS, the Travel Plan will focus on specific
interventions related to staff travel in particular. The Travel Plan
will seek to promote sustainable and healthier modes of transport
for staff and reduce travel to work by single occupancy car.

Preliminary Environmental Information Report: September 2021 Appendix 12.9.1: Preliminary Transport Assessment Report (PTAR) Page 153
Our northern runway: making best use of Gatwick
20 References
Advance, 2019. Dyer & Butler install EV charging points at Gatwick Airport.
[Online]
Available at: https://www.adsadvance.co.uk/dyer-butler-install-ev-charging-
points-at-gatwick-airport.html
AECOM, 2016. West Sussex Infrastructure Study. [Online]
Available at:
http://www.businesswestsussex.co.uk/storage/downloads/resource_westsus
sexinfrastructurestudy_1472035643.pdf
Airport Technology, 2019. Gatwick Airport and Stanley Robotics to test valet
parking robots. [Online]
Available at: https://www.airport-technology.com/news/gatwick-airport-
stanley-robotics/
Airports Commission, 2015. [Online]
Available at:
https://assets.publishing.service.gov.uk/government/uploads/system/uploads
/attachment_data/file/440316/airports-commission-final-report.pdf
Autocar, 2019. Exclusive: Government won't reinstate plug-in hybrid grants.
[Online]
Available at: https://www.autocar.co.uk/car-news/industry/exclusive-
government-wont-reinstate-plug-hybrid-grants
Chartered Institute of Highways and Transportation, 2010. Manual for
Streets 2. [Online].
Coast to Capital, 2018. Gatwick 360 Straetgic Economic Plan 2018-2030.
[Online]
Available at:
https://www.coast2capital.org.uk/storage/downloads/coast_to_capital_strate
gic_economic_plan_2018-2030_pdf-1535099447.pdf
Crawley Borough Council, 2020. Crawley’s Local Cycling and Walking
Infrastructure Plan, consultation draft. [Online].
Current News, 2019. BP Chargemaster lauds first 150kW ultra rapid
charging hub in London. [Online]
Available at: https://www.current-news.co.uk/news/bp-chargemaster-lauds-
first-150kw-ultra-rapid-charging-hub-in-london
Department for Transport, 2007. Manual for Streets. [Online].
Department for Transport, 2013. The Strategic Road Network and the
Delivery of Sustainable Development. [Online]
Available at:
https://assets.publishing.service.gov.uk/government/uploads/system/uploads
/attachment_data/file/237412/dft-circular-strategic-road.pdf
Department for Transport, 2014. TAG Unit M1: Principles of Modelling and
Forecasting, s.l.: s.n.
Department for Transport, 2015. National Policy Statement for National
Networks. [Online]
Available at:
https://assets.publishing.service.gov.uk/government/uploads/system/uploads
/attachment_data/file/387223/npsnn-web.pdf
Department for Transport, 2018. Airports National Policy Statement: New
Runway Capacity and Infrastructure in the South East of England. [Online]
Available at:
https://assets.publishing.service.gov.uk/government/uploads/system/uploads
/attachment_data/file/714106/airports-nps-new-runway-capacity-and-
infrastructure-at-airports-in-the-south-east-of-england-web-version.pdf
Department for Transport, 2019. Transport analysis guidance. [Online]
Available at: https://www.gov.uk/guidance/transport-analysis-guidance-
webtag
Department for Transport, 2020. Road Investment Strategy 2: 2020-2025.
[Online]
Available at:
https://assets.publishing.service.gov.uk/government/uploads/system/uploads
/attachment_data/file/951100/road-investment-strategy-2-2020-2025.pdf
East Sussex County Council, 2011. Local Transport Plan 2011-2026.
[Online]
Available at:
https://www.eastsussex.gov.uk/media/2336/ltp3_main_doc_2011-2026.pdf
Fruin, J., 1987. Pedestrian Planning and Design. Revised Edition ed. Mobile:
Elevator World.
Gatwick Airport Limited, 2021. Second Decade of Change to 2030. s.l.:s.n.
Gatwick Airport Ltd, 2016. Gatwick Employer and Travel to Work Survey, s.l.:
s.n.
Gatwick Airport Ltd, 2019. Decade of Change: 2018 Performance Report,
s.l.: s.n.
Gatwick Airport Ltd, 2019. Gatwick Airport Master Plan 2019. [Online]
Available at: https://www.gatwickairport.com/globalassets/business--
community/growing-gatwick/master-plan-2019/gatwick-master-plan-2019.pdf
Greater London Authority, 2018. Mayor's Transport Strategy. [Online]
Available at: https://www.london.gov.uk/sites/default/files/mayors-transport-
strategy-2018.pdf
Greater London Authority, 2021. The London Plan. [Online]
Available at:
https://www.london.gov.uk/sites/default/files/the_london_plan_2021.pdf
Highways England, 2017. Connecting the Country: Planning for the Long
Term, s.l.: s.n.
Highways England, 2017. London Orbital and M23 to Gatwick Route
Strategy,
https://assets.publishing.service.gov.uk/government/uploads/system/uploads
/attachment_data/file/600313/London_Orbital___M23_to_Gatwick_Final.pdf:
s.n.
Highways England, 2017. M25 South West Quadrant Strategic Study - Stage
3 Report, s.l.: s.n.
Highways England, 2019. Design Manual for Roads and Bridges. [Online]
Available at: http://www.standardsforhighways.co.uk/ha/standards/dmrb/
Highways England, p. H. A., 1995. DMRB Volume 5 Section 1 Part 2 (TD
37/93) Assessment and preparation of road schemes. Assessment of road
schemes. Scheme assessment reporting. s.l.:s.n.
Horsham District Council, 2020. Draft Infrastructure Delivery Plan. [Online]
Available at:
https://www.horsham.gov.uk/__data/assets/pdf_file/0012/80220/HDC-
Infrastructure-Delivery-Plan-2020.pdf
Kent County Council, 2017. Local Transport Plan 4: Growth Without Gridlock
2016-2031. [Online]
Available at:
https://www.kent.gov.uk/__data/assets/pdf_file/0011/72668/Local-transport-
plan-4.pdf
Mid Sussex District Council, 2016. Mid Sussex Infrastructure Delivery Plan.
[Online]
Available at: https://www.midsussex.gov.uk/media/3229/ep42_idp-
august2016-vdistrictplan-final2.pdf
Ministry of Housing, Communities and Local Government, 2019. Planning
Practice Guidance. [Online]
Available at: https://www.gov.uk/government/collections/planning-practice-
guidance
Ministry of Housing, Communities and Local Government, 2021. National
Planning Policy Framework. [Online]
Preliminary Environmental Information Report: September 2021 Appendix 12.9.1: Preliminary Transport Assessment Report (PTAR) Page 154
Our northern runway: making best use of Gatwick
Available at:
https://assets.publishing.service.gov.uk/government/uploads/system/uploads
/attachment_data/file/1005759/NPPF_July_2021.pdf
National Grid, 2019. Future Energy Scenarios, s.l.: s.n.
Network Rail, 2015. South East Route: Sussex Area Route Study, s.l.: s.n.
Network Rail, 2016. Station Capacity Planning Guidance,
https://cdn.networkrail.co.uk/wp-content/uploads/2019/03/Station-capacity-
planning-guidance.pdf: s.n.
Network Rail, 2018. Consultation announced on ‘transformational’ plan to
remove Britain’s worst railway bottleneck and provide a step-change in
reliability. [Online]
Available at: https://www.networkrailmediacentre.co.uk/news/consultation-
announced-on-transformational-plan-to-remove-britains-worst-railway-
bottleneck-and-provide-a-step-change-in-reliability
[Accessed October].
Network Rail, 2018. Our Delivery Plan for 2019 – 2024. [Online]
Available at: https://www.networkrail.co.uk/who-we-are/publications-and-
resources/our-delivery-plan-for-2019-2024
Network Rail, 2019. South East Route Control Period 6 Delivery Plan.
s.l.:s.n.
Office of Rail and Road, 2018. Periodic review 2018 (PR18). [Online]
Available at: https://orr.gov.uk/rail/economic-regulation/regulation-of-
network-rail/price-controls/periodic-review-2018
SAE, 2019. SAE Standards News: J3016 automated-driving graphic update.
[Online]
Available at: https://www.sae.org/news/2019/01/sae-updates-j3016-
automated-driving-graphic
Surrey County Council, 2018. Surrey Transport Plan (LTP 3). [Online]
Available at: https://www.surreycc.gov.uk/roads-and-transport/policies-plans-
consultations/transport-plan
Surrey County Council, 2021. Draft Surrey Local Transport Plan 2022–2032
(LTP4). [Online]
Available at: https://s3-eu-west-2.amazonaws.com/commonplace-customer-
assets/surreyltp4/Surrey%20Transport%20Plan.pdf
Transport for the South East, 2019. Transport Strategy for the South East:
Consultation Draft. [Online]
Available at: https://transportforthesoutheast.org.uk/wp-
content/uploads/2019/10/TfSE-Draft-Transport-Strategy-v24.0.pdf
West Sussex County Council, 2011. West Sussex Transport Plan 2011-
2026. [Online]
Available at:
https://www.westsussex.gov.uk/media/3042/west_sussex_transport_plan_20
11-2026_low_res.pdf
West Sussex County Council, 2016. West Sussex Walking and Cycling
Strategy 2016-2026. [Online]
Available at:
https://www.westsussex.gov.uk/media/9584/walking_cycling_strategy.pdf
West Sussex County Council, 2018. Highway Infrastruture Policy and
Strategy. [Online]
Available at: https://www.westsussex.gov.uk/about-the-council/policies-and-
reports/roads-and-travel-policy-and-reports/highway-infrastructure-policy-
and-strategy/
West Sussex County Council, 2019. West Sussex Cycling Design Guide.
[Online]
Available at:
https://www.westsussex.gov.uk/media/13164/cycling_design_guide.pdf
West Sussex County Council, 2020. West Sussex Guidance on Parking at
New Developments. [Online]
Available at:
https://www.westsussex.gov.uk/media/1847/guidance_parking_res_dev.pdf
West Sussex County Council, 2021. Draft West Sussex Transport Plan 2022
to 2036. [Online]
Available at:
https://yourvoice.westsussex.gov.uk/9868/widgets/28223/documents/13943
West Sussex Couny Council, 2007. West Sussex Transport Assessment
Methodology. [Online]
Available at:
http://www2.westsussex.gov.uk/roadsandtransport/WSCC%20Transport%20
Assessments%20-
%20Guidance%20on%20Methodology%20for%20Developers.pdf
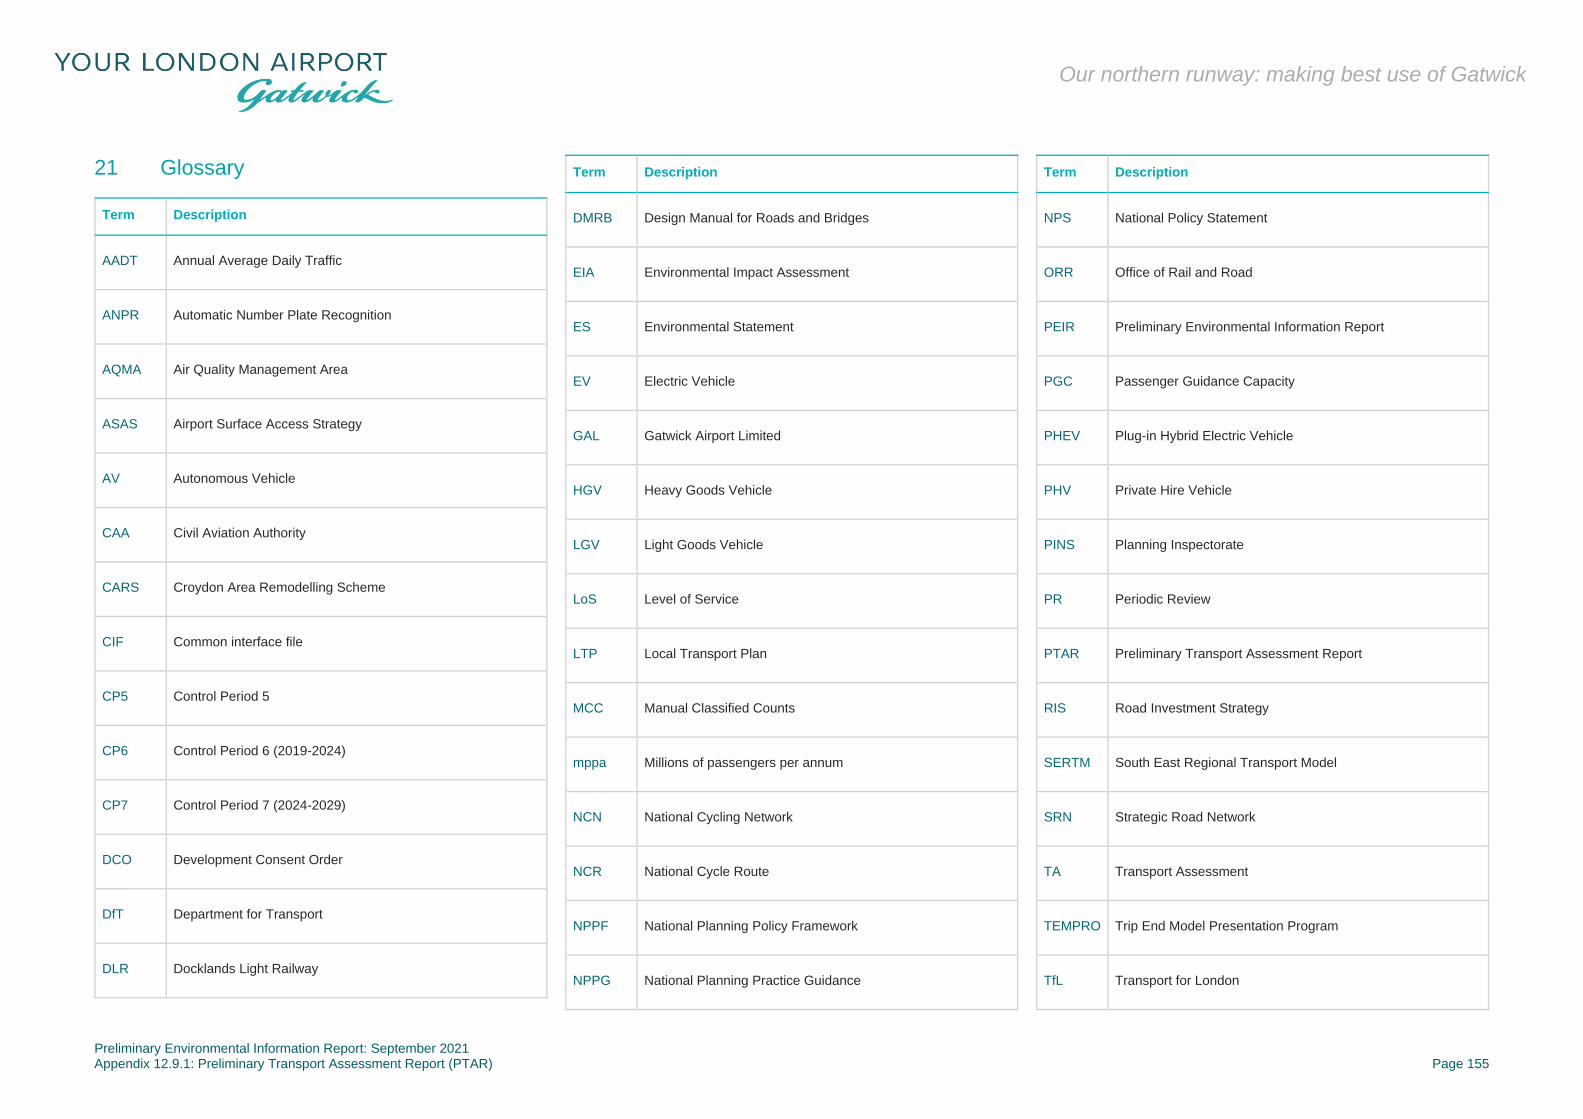
Preliminary Environmental Information Report: September 2021 Appendix 12.9.1: Preliminary Transport Assessment Report (PTAR) Page 155
Our northern runway: making best use of Gatwick
21 Glossary
Term Description
AADT Annual Average Daily Traffic
ANPR Automatic Number Plate Recognition
AQMA Air Quality Management Area
ASAS Airport Surface Access Strategy
AV Autonomous Vehicle
CAA Civil Aviation Authority
CARS Croydon Area Remodelling Scheme
CIF Common interface file
CP5 Control Period 5
CP6 Control Period 6 (2019-2024)
CP7 Control Period 7 (2024-2029)
DCO Development Consent Order
DfT Department for Transport
DLR Docklands Light Railway
Term Description
DMRB Design Manual for Roads and Bridges
EIA Environmental Impact Assessment
ES Environmental Statement
EV Electric Vehicle
GAL Gatwick Airport Limited
HGV Heavy Goods Vehicle
LGV Light Goods Vehicle
LoS Level of Service
LTP Local Transport Plan
MCC Manual Classified Counts
mppa Millions of passengers per annum
NCN National Cycling Network
NCR National Cycle Route
NPPF National Planning Policy Framework
NPPG National Planning Practice Guidance
Term Description
NPS National Policy Statement
ORR Office of Rail and Road
PEIR Preliminary Environmental Information Report
PGC Passenger Guidance Capacity
PHEV Plug-in Hybrid Electric Vehicle
PHV Private Hire Vehicle
PINS Planning Inspectorate
PR Periodic Review
PTAR Preliminary Transport Assessment Report
RIS Road Investment Strategy
SERTM South East Regional Transport Model
SRN Strategic Road Network
TA Transport Assessment
TEMPRO Trip End Model Presentation Program
TfL Transport for London
Preliminary Environmental Information Report: September 2021 Appendix 12.9.1: Preliminary Transport Assessment Report (PTAR) Page 156
Our northern runway: making best use of Gatwick
Term Description
tph Trains per hour
vehs Vehicles
ZEV Zero Emissions Vehicle