diana vanda d doda - university of adelaide€¦ · diana vanda d doda dr (medical doctor), mohs a...
TRANSCRIPT
PREVENTION OF MUSCULOSKELETAL PAIN AND
DISCOMFORT IN SOUTH AUSTRALIAN WORKPLACES:
EVALUATION OF A STAGE OF CHANGE APPROACH
Diana Vanda D Doda
Dr (Medical Doctor), MOHS
A thesis submitted for fulfilment of the requirements for the degree of
Doctor of Philosophy
The Discipline of Public Health
School of Population Health
Faculty of Health Sciences
The University of Adelaide
South Australia
2014

i
DECLARATION
This work contains no material which has been accepted for the award of any other degree or
diploma in any university or other tertiary institution and to the best of my knowledge and
belief, contains no material previously published or written by another person, except where
due reference has been made in the text.
I give consent to this copy of my thesis, when deposited in the University Library, being made
available for loan and photocopying, subject to the provisions of the Copyright Act 1968.
I also give permission for the digital version of my thesis to be made available on the web, via
the University’s digital research repository, the Library catalogue, and also through web
search engines.
Diana Vanda Daturara Doda
ii
CONTENTS
DECLARATION .......................................................................................................................... i
CONTENTS .................................................................................................................................ii
SUMMARY .............................................................................................................................. xiii
ACKNOWLEDGEMENTS AND DEDICATION ................................................................xvii
AWARDS, CONFERENCES and PUBLICATIONS......................................................... xviii
LIST OF FIGURES .................................................................................................................. xix
LIST OF TABLES .................................................................................................................... xxi
LIST OF ABBREVIATIONS ................................................................................................ xxiv
CHAPTER 1 GENERAL INTRODUCTION ......................................................................... 1
1.1 The Definition of Work-Related Musculoskeletal Disorders .................................... 1
1.2 The Magnitude of the WRMSD Problem ................................................................... 2
1.2.1 International WRMSD Profile ................................................................................. 2
1.2.2 Australian WRMSD Profile ..................................................................................... 3
1.2.3 South Australian WRMSD profile ........................................................................... 5
1.3 Conclusion of the Magnitude and Costs of WRMSD ................................................ 8
1.4 Interventions .................................................................................................................. 9
1.5 Research Questions for the Literature Review .......................................................... 9
1.6 Thesis Organisation .................................................................................................... 10
CHAPTER 2 BACKGROUND AND LITERATURE REVIEW ........................................ 12
2.1 Introduction ................................................................................................................. 12
2.1.1 The Purpose of the Review .................................................................................... 12
2.1.2 The Literature Review Method .............................................................................. 13
2.2 The Study of Work-Related Musculoskeletal Disorders ......................................... 14
2.2.1 The Terminology and Definitions of WRMSD ..................................................... 14
2.2.2 The Aetiology and Pathway of the Development of WRMSD ............................. 15
2.2.2.1 A Conceptual Model of the Development of Musculoskeletal Disorders. ...... 16
iii
2.2.2.2 Research Studies on Aetiology/Risks of WRMSD ........................................... 20
2.2.2.2.1 Individual Factors .................................................................................... 20
2.2.2.2.2 Physical / Mechanical Factors ................................................................. 22
2.2.2.2.3 Psychosocial Factors ................................................................................ 23
2.2.2.2.4 Organisational Factors ............................................................................. 24
2.2.3 The Assessment of WRMSD and Exposures to WRMSD Risk Factors ............... 25
2.2.3.1 The Assessment of Health Outcomes (WRMSD and/or MSPD) ..................... 26
2.2.3.2 The Assessment of Risk Factors for Health Outcomes ................................... 26
2.2.3.2.1 Self Reported Assessment ....................................................................... 27
2.2.3.2.2 Observational Assessment ....................................................................... 27
2.2.3.2.3 Biomeasurement ...................................................................................... 28
2.2.4 Prevention Methods for WRMSD ......................................................................... 29
2.2.4.1 Basic Approaches ........................................................................................... 30
2.2.4.1.1 Ergonomics Approach ............................................................................. 30
2.2.4.1.1.1 Biomechanical/ Physical Risks Approaches ..................................... 30
2.2.4.1.1.2 Psychological Risks Approaches ...................................................... 31
2.2.4.1.2 Education / Training Approaches ............................................................ 31
2.2.4.2 Supplementary Approaches ............................................................................ 32
2.2.4.2.1 Participatory Ergonomics ........................................................................ 33
2.2.4.2.2 Organisational/ Psychosocial Approach .................................................. 33
2.2.4.2.3 Stage of Change Approach ...................................................................... 35
2.3 The Application of the Stage of Change Approach in Organisations .................... 36
2.3.1 What is Stage of Change ........................................................................................ 36
2.3.2 Evidence of the Effectiveness of ‘Stage of Change’ Approach to Individual
Behaviour ............................................................................................................... 39
2.3.3 Evidence for the Effectiveness of the ‘Stage of Change' Approach in
Organisations ......................................................................................................... 40
2.3.4 Factors that May Influence a ‘Stage of Change’ Approach in Organisations. ...... 43
2.3.5 Other Criticisms of the Stage of Change Approach .............................................. 44
2.4 Research Gaps ............................................................................................................. 45
2.5 Research Objectives and Research Questions .......................................................... 46
2.5.1 Research Objectives ............................................................................................... 47
iv
2.5.2 Research Questions ................................................................................................ 47
CHAPTER 3 THE BASELINE SURVEY: THE PREVALENCE OF
MUSCULOSKELETAL PAIN/DISCOMFORT AND ITS ASSOCIATION WITH
INDIVIDUAL, OCCUPATIONAL AND ORGANISATIONAL CHARACTERISTICS .. 48
3.1 Introduction ................................................................................................................. 48
3.1.1 Overview ................................................................................................................. 48
3.1.2 Research Questions ................................................................................................ 49
3.2 Method ......................................................................................................................... 50
3.2.1 Study Design .......................................................................................................... 50
3.2.2 Sampling for the Baseline Survey ......................................................................... 50
3.2.4 Survey Instrument .................................................................................................. 53
3.2.4.1 Demographic Information .............................................................................. 53
3.2.4.2 Musculoskeletal Pain and Discomfort Questionnaire .................................... 54
3.2.4.3 Safety Climate Tool ......................................................................................... 54
3.2.4.4 Stage of Change (SOC) Assessment ................................................................ 56
3.2.4.5 Job Satisfaction Questionnaire ....................................................................... 57
3.2.4.6 Workload and Vibration Assessment .............................................................. 58
3.2.5 Research Procedure for the Baseline Survey ......................................................... 60
3.2.5.1 Ethics Approval ............................................................................................... 60
3.2.5.2 Questionnaire Administration ......................................................................... 60
3.2.6 Data Analysis for the Baseline Survey .................................................................. 60
3.2.6.1 Variables in this Research .............................................................................. 61
3.2.6.2 Statistical Analysis for the Baseline Survey .................................................... 65
3.2.6.2.1 The Distribution of Participant Characteristics and Prevalence of MSPD
(undifferentiated MSPD, Severe MSPD, and MSPD in Body Parts) ...... 65
3.2.6.2.2 The Association between MSPD and Independent Variables (Bivariate
and Regression) ....................................................................................... 66
3.2.6.2.3 Additional Analyses ................................................................................. 68
3.2.7 Pilot Study.............................................................................................................. 68
3.3 Results of the Baseline Survey ................................................................................... 69

v
3.3.1 The Distribution of Individual, Occupational and Organisational Characteristics of
Participants and the Prevalence of MSPD in the Baseline Survey (Univariate
analysis) ................................................................................................................. 70
3.3.1.2 The Distribution of Participants’ Occupational Characteristics in the
Baseline Survey ............................................................................................... 71
3.3.1.3 The Distribution of Participants’ Organisational Characteristics in the
Baseline Survey ............................................................................................... 74
3.3.1.4 Distribution of Safety Climate Items/Dimensions and Job Satisfaction Items
in the Baseline Survey ..................................................................................... 75
3.3.1.4.1 Distribution of Workers’ Perception across Safety Climate
items/dimensions in the Baseline Survey ................................................ 75
3.3.1.4.2 Distribution of Workers’ Job Satisfaction in the Baseline Survey .......... 78
3.3.2 The Prevalence of MSPD: Undifferentiated MSPD, Severe MSPD and MSPD by
Body Area in the Baseline Survey ......................................................................... 80
3.3.2.1 Prevalence of Undifferentiated MSPD (any MSPD reported) in the Baseline
Survey .............................................................................................................. 80
3.3.2.2 Prevalence of Severe MSPD in the Baseline Survey ...................................... 80
3.3.2.3 Prevalence of MSPD in the Body areas in the Baseline Survey ..................... 80
3.3.3 The Association of MSPD (undifferentiated MSPD, severe MSPD, neck, shoulder
and lower back MSPD) and Individual /Occupational/ Organisational Factors in
the Baseline Survey ................................................................................................ 82
3.3.3.1 The Association between Undifferentiated MSPD and Individual,
Occupational and Organisational Characteristic (Bivariate and Multivariate
Analysis) .......................................................................................................... 83
3.3.3.2 The Association between Severe MSPD and Individual / Occupational/
Organisational Characteristics (Bivariate and Multivariate Analysis) in the
Baseline Survey ............................................................................................... 88
3.3.3.3 The Association between Neck, Shoulder and Low Back MSPD and
Individual/ Occupational/ Organisational Characteristic (Bivariate and
Multivariate analysis) in the Baseline Survey ................................................ 92
3.3.4 Additional Analyses Regarding the Associations of Undifferentiated MSPD with
Safety Climate and Job Satisfaction ...................................................................... 95
vi
3.3.4.1 Association between MSPD and Safety Climate Dimensions in the Baseline
Survey .............................................................................................................. 95
3.3.4.2 Association between Undifferentiated MSPD and Job Satisfaction items in the
Baseline Survey ............................................................................................... 96
3.4 Summary of the Main Findings ................................................................................... 97
3.5 Discussion .................................................................................................................... 98
3.5.1 Main Results of the Baseline Survey and Comparison with other Studies ........... 98
3.5.1.1 The Prevalence of Self-Reported Musculoskeletal Pain/Discomfort in the
Baseline Survey. .............................................................................................. 98
3.5.1.2. The Association of MSPD with Individual / Occupational/ Organisational
Factors .......................................................................................................... 100
3.5.2 Strengths and Weaknesses of the Baseline Survey .............................................. 103
3.5.2.1 Strengths of this Study ................................................................................... 103
3.5.2.2 The Weaknesses of this Study ......................................................................... 104
3.6 Conclusions .................................................................................................................. 105
CHAPTER 4 THE FOLLOW-UP SURVEY: THE PREVALENCE OF
MUSCULOSKELETAL PAIN/DISCOMFORT AND ITS ASSOCIATION WITH
INDIVIDUAL, OCCUPATIONAL AND ORGANISATIONAL CHARACTERISTICS 106
4.1 Introduction ............................................................................................................... 106
4.1.1 Overview 106
4.1.2 Research Questions .............................................................................................. 107
4.2 Methods ...................................................................................................................... 108
4.2.1 Design …… ......................................................................................................... 108
4.2.2 Sampling .............................................................................................................. 108
4.2.4 Survey Instruments .............................................................................................. 108
4.2.5 Research Procedure.............................................................................................. 108
4.2.6 Statistical Data Analysis ...................................................................................... 108
4.3 Results ........................................................................................................................ 109
4.3.1 The Distribution of Individual, Occupational and Organisational Characteristics of
Participants and the Prevalence of MSPD in the Follow-up Survey (Univariate
analysis) ............................................................................................................... 109

vii
4.3.1.1 The Distribution of Participants Characteristics in the Follow-Up Survey . 109
4.3.1.2 Occupational Characteristics in the Follow-Up Survey ............................... 110
4.3.1.3 Organisational Characteristics in the Follow-Up Survey ............................ 112
4.3.1.4 Distribution of Safety Climate Items/Dimensions and Job Satisfaction Items
in the Follow-Up Survey ............................................................................... 113
4.3.1.4.1 Distribution of Workers’ Perception across Safety Climate
Items/Dimensions in the Follow-Up Survey ......................................... 113
4.3.1.4.2 Distribution of Workers’ Job Satisfaction in the Follow-Up Survey .... 116
4.3.2 The Prevalence of MSPD: Undifferentiated MSPD, Severe MSPD and MSPD in
particular body areas. ......................................................................................... 118
4.3.2.1 The Prevalence of Undifferentiated MSPD in Follow-Up Survey ............... 118
4.3.2.2 The Prevalence of Severe MSPD in the Follow-Up Survey .......................... 118
4.3.2.3 The Prevalence of MSPD by Body Part in the Follow-Up Survey ............... 118
4.3.3 The Association of MSPD (undifferentiated MSPD, severe MSPD, neck, shoulder
and lower back MSPD and Individual /Occupational/ Organisational Factors in
the Follow-Up Survey .......................................................................................... 121
4.3.3.1 The Association between Undifferentiated MSPD and Individual /
Occupational/ Organisational Characteristics (Bivariate and Multivariate
Analysis) ........................................................................................................ 121
4.3.3.2 The Association between Severe MSPD and Individual / Occupational/
Organisational Characteristics (Bivariate and Multivariate Analysis) in the
Follow-Up Survey ......................................................................................... 125
4.3.3.3 The Association between Neck, Shoulder and Lower Back MSPD and
Individual / Occupational/ Organisational Factors (Bivariate and
Multivariate Analysis) ................................................................................... 128
4.3.4 Additional Results for Safety Climate and Job Satisfaction ................................ 131
4.3.4.1 Association between MSPD and Safety Climate dimensions in the Follow-Up
Survey ............................................................................................................ 131
4.3.4.2 Association between MSPD and Job Satisfaction Items in the Follow-Up
Survey ............................................................................................................ 132
4.4 Summary of the Main Findings ............................................................................... 133
4.5 Discussion .................................................................................................................. 134
viii
4.5.1 Main Results of the Follow-Up Survey and Comparison with Other Studies ..... 134
4.5.1.1 The Prevalence of MSPD in the Follow-Up Survey ..................................... 134
4.5.1.2 The Association of MSPD with Individual/Occupational/Organisational
Factors .......................................................................................................... 134
4.5.2 Strengths and Weaknesses of the Follow-Up Survey .......................................... 137
4.5.2.1 The Strengths of this Study............................................................................ 137
4.5.2.2 The Weaknesses of this study ........................................................................ 137
4.6 Conclusions ................................................................................................................ 137
CHAPTER 5 EVALUATION OF THE STAGE OF CHANGE-BASED
INTERVENTIONS AND COMPARISON WITH INTERVENTIONS BASED SOLELY
ON ERGONOMIC ADVICE .................................................................................................. 138
5.1 Introduction ............................................................................................................... 138
5.1.1 General Description of the Research Protocol ..................................................... 139
5.1.1.1 Protocol for the Standard Group .................................................................. 159
5.1.1.2 Protocol for the Tailored Group ................................................................... 159
5.1.2 Research Questions .............................................................................................. 160
5.2. Overall Changes in MSPD Before and After the Interventions and Association
with Risk Factors .............................................................................................................. 161
5.2.1 Methods 161
5.2.1.2 Sampling ....................................................................................................... 161
5.2.1.3 Study Instrument (Intervention Study) .......................................................... 161
5.2.1.4 Research Procedure ...................................................................................... 162
5.2.1.5 Data Analysis ................................................................................................ 163
5.2.1.5.1 The Proportion of Workers within each Categorisation in the Standard
Group and the Tailored Group (Univariate analysis) ............................ 163
5.2.1.5.2 Changes in the Prevalence of MSPD after the Interventions within each
Category: Comparing Standard and Tailored Groups ........................... 163
5.2.1.5.3 Change in Other Variables after the Interventions, including Safety
Climate, Job Satisfaction and SOC ........................................................ 164
ix
5.2.1.5.4 The Association between Changes in MSPD and Individual/
Occupational/ Organisational Characteristics (Bivariate and Multivariate
Analysis): Comparing Standard and Tailored Groups ........................... 164
5.2.2 Results… .............................................................................................................. 166
5.2.2.1 The Distribution of Participants based on Individual / Occupational/
Organisational Characteristics and Changes in Prevalence of MSPD
(Univariate Analysis): Comparing Standard and Tailored Groups ............. 166
5.2.2.1.1 The Distribution of Participant Individual/ Occupational/ Organisational
Characteristics ........................................................................................ 166
5.2.2.1.2 Changes in the Prevalence of MSPD after the Intervention .................. 170
5.2.2.1.3 Change in Job Satisfaction, Safety Climate, and SOC after the
Interventions. ......................................................................................... 172
5.2.2.1.3.1 The Changes in Job Satisfaction after the Interventions ................. 172
5.2.2.1.3.2 Safety Climate after the Interventions ........................................... 174
5.2.2.1.3.3 The Change in SOC after the Interventions .................................... 176
5.2.2.2 The Association between Changes in MSPD and Individual/ Occupational/
Organisational Characteristics: Paired Participants (overall) and Paired
Participants by Standard and Tailored Groupings ...................................... 177
5.2.2.2.1 The Changes in Undifferentiated MSPD and Associations with Workers’
Individual/ Occupational/ Organisational Characteristics for overall
Paired Participants. ................................................................................ 177
5.2.2.2.2 The Change in MSPD and Associations with Workers’ Individual/
Occupational/ Organisational Characteristics in the Standard Groups. . 181
5.2.2.2.3 The Change in MSPD and Its Association with Individual/ Occupational/
Organisational Characteristics in the Tailored group. ........................... 184
5.3 Cluster Randomised Trial Analysis – Comparison of Tailored Interventions with
Standard Interventions ..................................................................................................... 188
5.3.1 Methods .............................................................................................................. 189
5.3.1.1 Study Design (Cluster Randomised Trial study) ........................................... 189
5.3.1.2 Sampling (Cluster Randomised Trial study) ................................................. 189
5.3.1.3 Randomisation Procedure and Blinding....................................................... 190
5.3.1.4 Study Analysis (Cluster Randomised Trial study) ........................................ 192

x
5.3.2 Results of the GEE statistical treatment .............................................................. 193
5.3.2.1 The Effect of Tailored Intervention compared with Standard Intervention .. 193
5.3.2.2 Characteristics affecting the outcome .......................................................... 194
5.3.2.2.1 Characteristics of the individual or organisation affecting MSPD ........ 194
5.3.2.2.2 Characteristics of the individual or organisation affecting Neck and
Shoulder MSPD ..................................................................................... 195
5.3.2.2.3 Characteristics of the individual or organisation affecting Lower Back
MSPD .................................................................................................... 195
5.4 Workers’ Perceptions Concerning the Implementation of the SOC Intervention
…… .................................................................................................................................... 196
5.4.1 Method . ............................................................................................................... 196
5.4.1.1 Instruments for the evaluation Workers’ Perception of the Implementation of
the Stage of Change Intervention .................................................................. 196
5.4.1.2 Analysis of Workers’ Perception of the Implementation of the Stage of
Change Intervention ..................................................................................... 196
5.4.2 Results .. ............................................................................................................... 197
5.4.2.1 Worker’s Perception of Changes Made by Employer to Prevent WRMSD .. 197
5.4.2.2 Workers Perception towards the Training and Information Provided by the
Employer in the Last 6 -12 Months ............................................................... 198
5.5 Summary of Main Findings ....................................................................................... 200
5.6 Discussion .................................................................................................................. 203
5.6.1 Main Results in Comparison with Other Studies................................................. 203
5.6.1.1 The Change in Prevalence of MSPD after the Intervention ......................... 203
5.6.1.2 The Effectiveness of SOC Approach in an Organisational Setting .............. 204
5.6.1.3 The Changes in Job Satisfaction, Safety Climate and Stage of Change After
Intervention ................................................................................................... 205
5.6.1.4 The predictors of the Changes in MSPD - Individual and
Occupational/Organisation Factors. ............................................................ 206
5.6.1.5 Workers Perception of the Implementation of the Intervention .................... 208
5.6.2 Strength and Weaknesses of the Research ........................................................... 209
5.6.2.1 Strengths of this Research ............................................................................. 209
5.6.2.2 Weaknesses of this Research ......................................................................... 210
xi
5.7 Conclusions .................................................................................................................. 211
CHAPTER 6 GENERAL DISCUSSION ............................................................................. 212
6.1 Introduction ............................................................................................................... 212
6.2 Significance of the Research .................................................................................... 212
6.3 Summary of Main Findings in the Context of Other Research. ........................... 213
6.3.1 The Prevalence of MSPD .................................................................................... 214
6.3.2 The Association of MSPD with Psychosocial Factors ......................................... 217
6.3.3 Workers’ Perception of the Implementation of the Intervention ......................... 219
6.3.4 The Effectiveness of SOC Approach in an Organisational Context. ................... 220
6.4 Strengths and Weaknesses of the Research ............................................................ 221
6.4.1 The Strengths of this Research ............................................................................ 221
6.4.2 The Weaknesses of this Research ........................................................................ 222
CHAPTER 7 CONCLUSIONS AND RECOMMENDATIONS ....................................... 224
7.1 Conclusions ................................................................................................................ 224
7.2 Implications and Recommendations ....................................................................... 224
7.2.1 For workplaces:.................................................................................................... 224
7.2.2 For Future research: ............................................................................................. 225
REFERENCES ......................................................................................................................... 226
APPENDICES .......................................................................................................................... 242
APPENDIX 1 Questionnaires ......................................................................................... 242
Appendix 1a Demographic Information ........................................................................ 242
Appendix 1b Stage of Change Assessment Surveys ..................................................... 243
Appendix 1c Safety Climate Surveys ............................................................................ 244
Appendix 1d Job Satisfaction Survey ............................................................................ 245
Appendix 1e Pain and Discomfort Rating Survey ......................................................... 246
APPENDIX 2 Information Sheet, Consent Form and Independent Complaints Form
…… .................................................................................................................................... 248
Appendix 2a Information Sheet ..................................................................................... 248
Appendix 2b Consent Form ........................................................................................... 249
xii
Appendix 2c Independent Complaints Form ………………………………………...250
Appendix 2d Ethics Approval – Baseline Survey ......................................................... 251
Appendix 2e Ethics Approval – Follow-Up Survey ...................................................... 252
APPENDIX 3 Confirmatory Factor Analysis and Cronbach Alpha of Job Satisfaction
data .................................................................................................................................... 253
APPENDIX 4 Prevalence Rate-ratio (PRR) with Log-binomial model for MSPD (as a
comparison with the ODDS Ratio) .................................................................................. 257
APPENDIX 5 Additional Results of Baseline Survey ................................................... 258
Appendix 5a Table of the Multivariate Regression of the Association between
Undifferentiated MSPD and Safety Climate Dimensions ................................... 258
Appendix 5b Multivariate Regression of the Association between Undifferentiated
MSPD and Job Satisfaction Items ........................................................................ 260
APPENDIX 6 Additional Questions in Follow-Up Survey .......................................... 262
APPENDIX 7 Sample Management Report for a Standard workgroup ................... 264
APPENDIX 8 Sample Management Report for a Tailored workgroup ..................... 268
APPENDIX 9 Additional Results of Follow-Up Survey ............................................... 275
Appendix 9a The Multivariate Regression Result of the Association between
undifferentiated MSPD and Safety Climate Dimensions (Follow-Up survey) ... 275
Appendix 9b The Multivariate Regression Result of the Association between
undifferentiated MSPD and Job satisfaction Items (Follow-Up survey) ............. 276
APPENDIX 10 Result of Cluster Randomised Trial GEE analysis ............................ 278
Appendix 10a The table of undifferentiated MSPD final model result ......................... 278
Appendix 10b The Table of Neck and Shoulder MSPD Final Model Results .............. 279
Appendix 10c The Table of Back MSPD Final Model Results ..................................... 280

xiii
SUMMARY
INTRODUCTION: There are significant human, social, and business costs associated with
work-related musculoskeletal disorders (WRMSD), despite being the subject of extensive
research and widespread interventions. A profile of WRMSD can be obtained via workers
compensation data, but the distribution of precursor conditions, such as localised body pain
and discomfort, are not routinely assessed. Moreover, there is a paucity of data in Australia.
The experience of pain has a psychological component, and it is now believed that
psychosocial factors are an independent cause of WRMSD. As a result, psychosocial
approaches are increasingly applied to WRMSD prevention. In particular, the Trans-
Theoretical model has recently found application in workplaces, and there is some evidence in
a UK study of benefit in tailoring interventions using a stage of change (SOC) construct.
Here, the interventions are designed to address workers readiness to change behaviour.
AIMS AND OBJECTIVES: The research in this thesis aimed to describe the relationship
between psychosocial factors and musculoskeletal pain and discomfort (MSPD) experience in
workplace settings, and to evaluate the effectiveness and implementation of a stage of change
approach to MSPD prevention.
The objectives of the research were as follows:
1. Determine the prevalence of MSPD in a sample of South Australian workplaces.
2. Examine relationships between MSPD and a range of individual, work, and
organisational factors.
3. Evaluate the effectiveness of MSPD prevention interventions informed by SOC,
compared with interventions informed only by standard ergonomic advice.
4. Evaluate the implementation of such interventions, based on worker perceptions.
METHOD: This research was designed as a repeated cross-sectional survey, with MSPD as
the principal outcome measure. It allowed for a nested cluster-randomised trial at the
workgroup level. A purposive sampling method was used to recruit participants in
representative companies. Workgroups comprising 10-15 workers were surveyed and
xiv
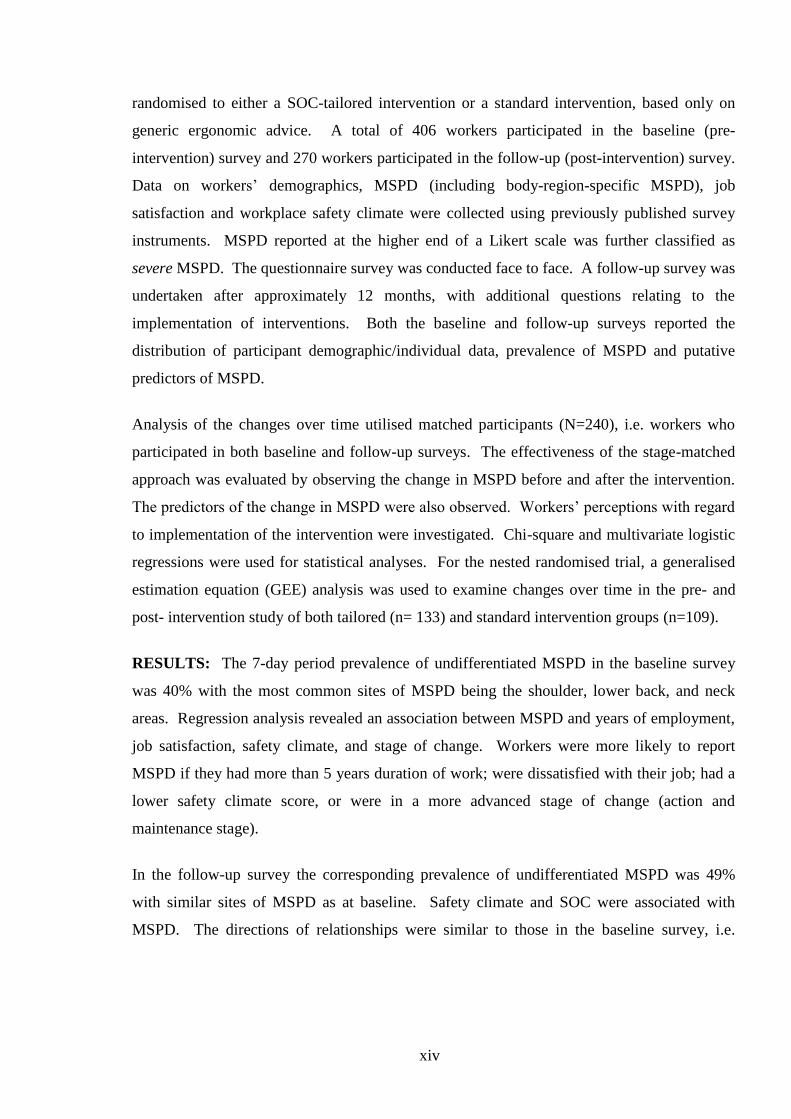
randomised to either a SOC-tailored intervention or a standard intervention, based only on
generic ergonomic advice. A total of 406 workers participated in the baseline (pre-
intervention) survey and 270 workers participated in the follow-up (post-intervention) survey.
Data on workers’ demographics, MSPD (including body-region-specific MSPD), job
satisfaction and workplace safety climate were collected using previously published survey
instruments. MSPD reported at the higher end of a Likert scale was further classified as
severe MSPD. The questionnaire survey was conducted face to face. A follow-up survey was
undertaken after approximately 12 months, with additional questions relating to the
implementation of interventions. Both the baseline and follow-up surveys reported the
distribution of participant demographic/individual data, prevalence of MSPD and putative
predictors of MSPD.
Analysis of the changes over time utilised matched participants (N=240), i.e. workers who
participated in both baseline and follow-up surveys. The effectiveness of the stage-matched
approach was evaluated by observing the change in MSPD before and after the intervention.
The predictors of the change in MSPD were also observed. Workers’ perceptions with regard
to implementation of the intervention were investigated. Chi-square and multivariate logistic
regressions were used for statistical analyses. For the nested randomised trial, a generalised
estimation equation (GEE) analysis was used to examine changes over time in the pre- and
post- intervention study of both tailored (n= 133) and standard intervention groups (n=109).
RESULTS: The 7-day period prevalence of undifferentiated MSPD in the baseline survey
was 40% with the most common sites of MSPD being the shoulder, lower back, and neck
areas. Regression analysis revealed an association between MSPD and years of employment,
job satisfaction, safety climate, and stage of change. Workers were more likely to report
MSPD if they had more than 5 years duration of work; were dissatisfied with their job; had a
lower safety climate score, or were in a more advanced stage of change (action and
maintenance stage).
In the follow-up survey the corresponding prevalence of undifferentiated MSPD was 49%
with similar sites of MSPD as at baseline. Safety climate and SOC were associated with
MSPD. The directions of relationships were similar to those in the baseline survey, i.e.
xv
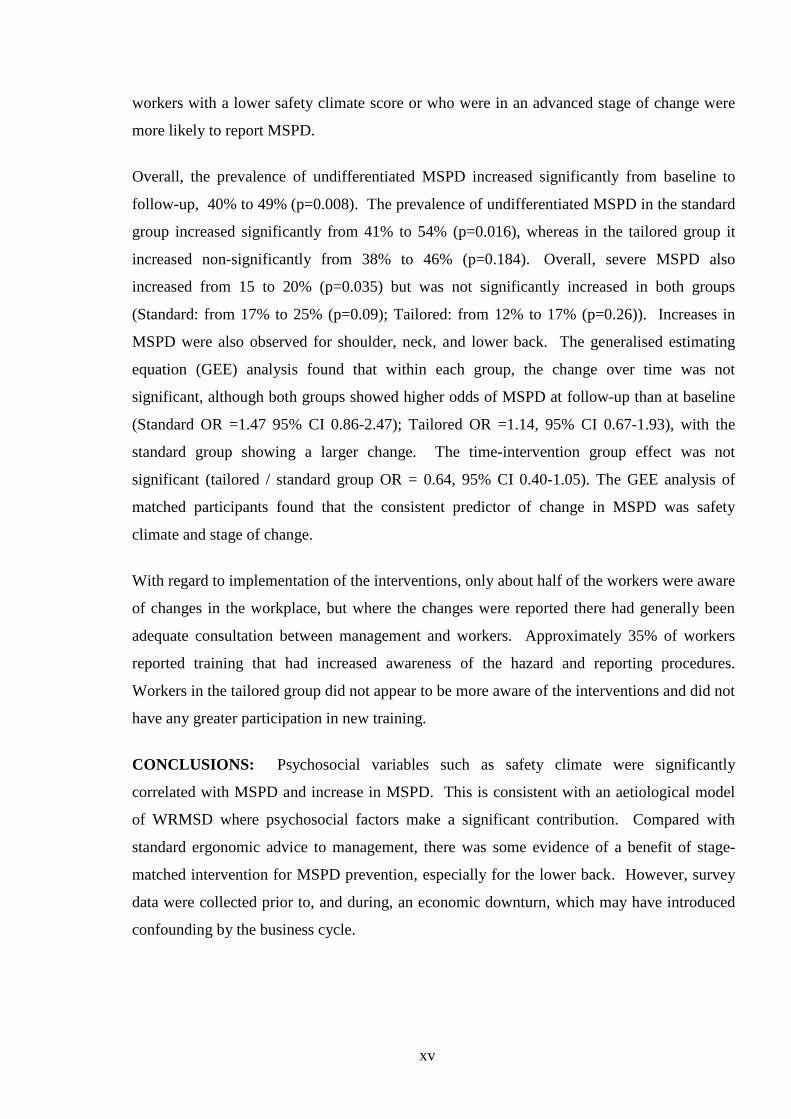
workers with a lower safety climate score or who were in an advanced stage of change were
more likely to report MSPD.
Overall, the prevalence of undifferentiated MSPD increased significantly from baseline to
follow-up, 40% to 49% (p=0.008). The prevalence of undifferentiated MSPD in the standard
group increased significantly from 41% to 54% (p=0.016), whereas in the tailored group it
increased non-significantly from 38% to 46% (p=0.184). Overall, severe MSPD also
increased from 15 to 20% (p=0.035) but was not significantly increased in both groups
(Standard: from 17% to 25% (p=0.09); Tailored: from 12% to 17% (p=0.26)). Increases in
MSPD were also observed for shoulder, neck, and lower back. The generalised estimating
equation (GEE) analysis found that within each group, the change over time was not
significant, although both groups showed higher odds of MSPD at follow-up than at baseline
(Standard OR =1.47 95% CI 0.86-2.47); Tailored OR =1.14, 95% CI 0.67-1.93), with the
standard group showing a larger change. The time-intervention group effect was not
significant (tailored / standard group OR = 0.64, 95% CI 0.40-1.05). The GEE analysis of
matched participants found that the consistent predictor of change in MSPD was safety
climate and stage of change.
With regard to implementation of the interventions, only about half of the workers were aware
of changes in the workplace, but where the changes were reported there had generally been
adequate consultation between management and workers. Approximately 35% of workers
reported training that had increased awareness of the hazard and reporting procedures.
Workers in the tailored group did not appear to be more aware of the interventions and did not
have any greater participation in new training.
CONCLUSIONS: Psychosocial variables such as safety climate were significantly
correlated with MSPD and increase in MSPD. This is consistent with an aetiological model
of WRMSD where psychosocial factors make a significant contribution. Compared with
standard ergonomic advice to management, there was some evidence of a benefit of stage-
matched intervention for MSPD prevention, especially for the lower back. However, survey
data were collected prior to, and during, an economic downturn, which may have introduced
confounding by the business cycle.

xvi
RECOMMENDATIONS: It is recommended that stage of change, safety climate and job
satisfaction be surveyed as part of any comprehensive strategy for the control of WRMSD.
During implementation of any intervention, there should be consultation with the workforce
in order to maximise the benefits of a stage-matched approach. Further trials are required to
characterise the time trends of psychosocial and organisation factors, and their influence on
MSPD outcomes.

xvii
ACKNOWLEDGEMENTS AND DEDICATION
First and foremost, praises and thanks to the God, the Almighty, for His blessings throughout
my life especially this PhD journey.
I wish to acknowledge the scholarship support provided by the Department of National
Education of Republic Indonesia through the University of Sam Ratulangi, Manado. I also
appreciate the enormous supports from The University of Adelaide during the
accomplishment of my PhD study.
I express my sincere gratitude to my supervisors: Professor Dino L. Pisaniello, Dr.
Mohammad Afzal Mahmood, and Professor Janet Hiller, for their support and guidance.
They have provided excellent feedback and comments on my thesis drafts. Without their
continuous support and assistance it would not have been possible to finish this thesis.
I would also like to thank Mr. Paul Rothmore for ergonomics assessments and advice, and
my friends and colleagues Ms. Sasha Stewart and Dr Junaid Ahmad for assistance with
questionnaire data collection. Equally, I cannot express enough thanks to Dr. Nancy Briggs
for her support in statistics work especially in Section 5.3 of my thesis. Special thanks must
also go to Mr. Paul Green and Dr. Arthur Saniotis for helping me in English editing of this
thesis. Thank you also to my friends in the thesis writing group for their sharing of
experiences and their support.
Very special thanks to my dearest mother, Professor Adelheid, B, for her love,
encouragement, and unconditional support throughout my life. Finally, I am deeply indebted
to my dearest husband, Yos Dundu, SE and children, Bryan, Timmy and Cindy, whose
patient love and excellent supports enable me to complete this PhD study.
This thesis is dedicated to the memory of my beloved father, Professor. Dr. J. Doda.

xviii
AWARDS, CONFERENCES and PUBLICATIONS
Awards, Conferences and Publication Related to this Research
1. Awards
November 2010 - The Conference Attendance Grant – by New Zealand
Ergonomics Society and the NZES conference committee
September 2011 - Postgraduate Travel Fellowship 2011 – by The University of
Adelaide, Faculty of Health Science
2. Conferences
18-19 November 2010 – The 16th
Conference of the New Zealand Ergonomics
Society – Nelson, New Zealand
7-9 September 2011 - 22nd
International Conference on EPICOH (Epidemiology in
Occupational Health) – Oxford, United Kingdom
3. Publications
Proceedings of the 16th Conference of the New Zealand Ergonomics Society – A
survey of musculoskeletal pain and discomfort and organizational factors in South
Australian workplaces - Diana V Doda, Dino Pisaniello, Paul Rothmore, Afzal
Mahmood, Janet Hiller, Helen Winefield, Rose Boucaut & Sasha Stewart
Occupational & Health Environmental Medicine, Sep 2011, vol 68, issue suppl1,
A74. Prevention of workplace musculoskeletal disorders based on a stage of
change approach: preliminary findings from an intervention study in South
Australia – Diana V Doda, Dino Pisaniello, Paul Rothmore, Janet E Hiller, Afzal
M Mahmood, Sasha Stewart, Helen Winefield, Rose Boucaut.
https://icoh.conference-
services.net/reports/template/onetextabstract.xml?xsl=template/onetextabstract.xsl
&conferenceID=2501&abstractID=512539
Musculoskeletal pain and discomfort and associated worker and organizational
factors: A cross-sectional study- Sasha K. Stewart, Paul R. Rothmore, Diana V.D.
Doda, Janet E. Hiller, M.A. Mahmood, Dino L. Pisaniello. (2013) Work: A
Journal of Prevention, Assessment and Rehabilitation. DOI: 10.3233/WOR-
131622, Pre-press
xix
LIST OF FIGURES
Figure 1.1 The number of serious claims for sprain, strain and MSD from 2000-01 to 2009-10 ......... 3
Figure 1.2 Percentage of serious claim for WRMSD, by age and gender, 2009-10 ............................. 4
Figure 1.3 Median time lost for sprain, strain & MSD (working weeks) from 2000-01 to 2009-10 .... 4
Figure 1.4 Median payment for sprain, strain & MSD (A$) from 2000-01 to 2009-10 ....................... 5
Figure 1.5 Percentage of claims cost due to sprain and strains and MSD in 2008/09 in South
Australia (registered/self- insured) ...................................................................................... 6
Figure 1.6 Thesis overview chart ....................................................................................................... 11
Figure 2.1 Conceptual framework of work-related musculoskeletal disorders (Adapted from National
Research Council, 2001).................................................................................................... 17
Figure 2.2 WRMSD model of Macdonald and Evans (Adapted from Macdonald and Evans, 2006) 19
Figure 2.3 Physiological changes as a response of stress (adopted from Aptel and Cnockaert, 2002
in (Macdonald and Evans, 2006) ....................................................................................... 20
Figure 2.4 Stage of change concept by Prochaska and DiClemente, 1982 (Adapted from Whysall,
2005) .................................................................................................................................. 36
Figure 2.5 The transtheorical model of behaviour change and the process of change by Prochaska
and DiClemente, 1982. (Adapted from Adam and White, 2003 in Adam and White,
2005) .................................................................................................................................. 38
Figure 3.1 Recruitment of the companies participating in the research .............................................. 52
Figure 3.2 Independent and dependent variables ................................................................................ 67
Figure 3.3 Workers engaged in some physically demanding tasks ..................................................... 73
Figure 3.4 Workers engaged in working above the shoulder, repetitive task, or in an awkward
position. ............................................................................................................................. 73
Figure 3.5 Percentage of workers within industrial types in the baseline survey ............................... 75
Figure 3.6 Average score for safety climate dimension for all participants in the baseline survey .... 78
Figure 3.7 The distribution of safety climate dimension, comparing workers with and without
Undifferentiated MSPD ..................................................................................................... 96
Figure 4.1 Percentage of workers within industry type (N=270) in the follow-up survey ............... 113
Figure 4.2 The dimension of safety climate for all companies in the follow-up survey ................... 115
Figure 4.3 The Distribution of Safety Climate Dimension, Comparing Workers With and Without
MSPD (Follow-Up Survey) ............................................................................................. 131
Figure 5.1 Overall research procedure .............................................................................................. 162

xx
Figure 5.2 The prevalence of MSPD and severe MSPD before and after the implementation in the
standard and tailored groups ............................................................................................ 171
Figure 5.3 The prevalence of MSPD in body part (neck, shoulder, and lower back) before and after
the intervention in the standard and tailored groups (percentage) ................................... 171
Figure 5.4 The average safety climate dimension score in standard groups before and after
interventions .................................................................................................................... 175
Figure 5.5 The average safety climate dimension score in tailored groups before and after
interventions .................................................................................................................... 175
Figure 5.6 Framework of recruitment and randomisation (Cluster randomised trial study) ............. 191
Figure 6.1 General trend of MSPD, severe MSPD, job satisfaction, and safety climate. ................. 215
Figure 6.2 Dow Jones industrial average 2004 -2012 (Economic crisis in 2009) ............................. 216

xxi
LIST OF TABLES
Table 1.1 List of industries in South Australia with musculoskeletal diseases claims (registered
claims). ................................................................................................................................ 6
Table 1.2 List of industries in South Australia with back injuries claims in 2008-2009 (registered
and self insured). ................................................................................................................. 7
Table 3.1 Example of the calculation of safety climate dimension score. ............................. 55
Table 3.2 The workers’ SOC assessment, adapted from Whysall et al. (2005). ................... 56
Table 3.3 Variables used in this research. .......................................................................................... 61
Table 3.4 Distribution of participants’ individual characteristics in the baseline survey. ................. 70
Table 3.5 The comparison of the study population and Australian/ South Australian population year
2009-2010. ......................................................................................................................... 71
Table 3.6 The distribution of participants’ occupational characteristics (total N=406) in the baseline
survey. ............................................................................................................................... 72
Table 3.7 The distribution of participants’ organisational characteristics in the baseline survey. ..... 74
Table 3.8 The percentage safety climate perception of the participants in baseline survey. ............. 76
Table 3.9 Distribution of all items of job satisfaction in the baseline survey. ................................... 79
Table 3.10 The prevalence of MSPD in body areas of the participants and the percentage of the body
pain within overall MSPD in the baseline survey. ............................................................ 81
Table 3.11 The prevalence of severe MSPD in different body areas in the baseline survey. .............. 82
Table 3.12 Bivariate: Prevalence rate ratio (PRR), 95% CI and P-value of the association between
Undifferentiated MSPD and individual /occupational/organisational factors. .................. 84
Table 3.13 Multivariate logistic regression: The odd ratio, 95% CI and P-value of the association
between undifferentiated MSPD and individual /occupational/organisational factors in
baseline survey. ................................................................................................................. 87
Table 3.14 Bivariate: Prevalence rate ratio (PRR), 95% CI and P-value of the association between
severe MSPD and individual /occupational/organisational factors in the baseline survey.
........................................................................................................................................... 89
Table 3.15 Multivariate logistic regression: The odd ratio, 95% CI and P-value of the association
between severe MSPD and individual /occupational/organisational factors. .................... 91
Table 3.16 Bivariate: The prevalence rate ratio (PRR), 95%CI of the association neck, shoulder and
lower back MSPD with individual /occupational/organisational factors in the baseline
survey. ............................................................................................................................... 93
xxii
Table 3.17 Regression: The odd ratio, 95% CI of the association neck, shoulder and lower back
MSPD with individual /occupational/organisational factors. ............................................ 94
Table 3.18 Summary of the main finding of baseline survey. ............................................................. 97
Table 3.19 Comparison of prevalence of MSPD in the last 7 days between studies. .......................... 99
Table 4.1 Distribution of participant characteristics in the follow-up survey. ............................... 1100
Table 4.2 Occupational characteristics (total N=270) in follow-up survey. .................................... 111
Table 4.3 Organisational characteristics in the follow-up survey. ................................................... 112
Table 4.4 The percentage of participants’ safety climate perceptions in the follow-up survey. ...... 114
Table 4.5 The distribution of items of job satisfaction in the follow-up survey (N=270). .............. 117
Table 4.6 The prevalence of MSPD in body areas in the follow-up survey. ................................... 119
Table 4.7 The distribution of severe MSPD by body area in the follow-up survey. ........................ 120
Table 4.8 Bivariate analysis: the prevalence rate ratio of MSPD and associations with individual
/ocupational/organisational factors in the follow-up survey............................................ 122
Table 4.9 Regression analysis: the odds ratio of undifferentiated MSPD by individual /ocupational/
organisational factors in the follow-up survey. ............................................................... 124
Table 4.10 Bivariate analysis: the prevalence rate ratio (prr) for severe MSPD and associations with
individual /ocupational/organisational factors in the follow-up survey. ......................... 126
Table 4.11 Regression analysis: the odd ratios of severe MSPD by individual/ ocupational/
organisational factors in the follow-up survey. ............................................................... 128
Table 4.12 Bivariate analysis: the prevalence rate ratios for neck, shoulder and lower back MSPD by
individual /ocupational/organisational factors in the follow-up survey. ......................... 129
Table 4.13 Regression analysis: the odd ratio of MSPD by body area by individual
/ocupational/organisational factors in the follow-up survey............................................ 130
Table 4.14 Summary of the main finding of the follow-up survey .................................................... 133
Table 5.1 Stage matched approach (adopted from Whysall et al., 2005). ....................................... 140
Table 5.2 The intervention / recommendation detail. ...................................................................... 142
Table 5.3 The proportion of the workers individual/ occupational/ organisational characteristic in
standard and tailored groups (baseline and follow-up surveys). ..................................... 167
Table 5.4 The changes in job satisfaction after interventions (Wilcoxon signed rank test) ............. 172
Table 5.5 The change in overall job satisfaction and safety climate after the interventions (Wilcoxon
signed ranks test and effect size). .................................................................................... 174
Table 5.6 The variation in SOC after the interventions (assessed using McNemar’s test). ............. 176
Table 5.7 Bivariate analysis: The changes in undifferentiated MSPD and associations with
individual/ occupational/ organisational characteristics in overall paired participants. .. 178
xxiii
Table 5.8 Logistic regression analysis: The association between change in MSPD and individual/
occupational/ organisational characteristics for overall paired participants. ................... 180
Table 5.9 Bivariate analysis: The change in MSPD prevalence and associations with individual/
occupational/ organisational characteristics in the standard group. ................................ 181
Table 5.10 Logistic regression analysis: The association of change in MSPD with individual/
occupational/ organisational characteristics in the standard groups. ............................... 184
Table 5.11 Bivariate analysis: The change in MSPD and associations with individual/ occupational/
organisational characteristics in tailored group. .............................................................. 185
Table 5.12 Logistic regression analysis : The association of the change in MSPD with individual/
occupational/ organisational characteristics in the tailored groups. ................................ 187
Table 5.13 Adjusted ORs (95% CI) by intervention and time effect. ................................................ 194
Table 5.14 Workers perceptions of the changes made by the employer in the last 6 -12 months to
reduce MSPD and the difference between groups. .......................................................... 198
Table 5.15 Workers perceptions of the training / information to reduce MSPD that was provided by
the employer in the last 6 -12 months and the difference between both groups. ............. 199
Table 5.16 Summary of main finding of the comparison between standard and tailored interventions
………………………………………………………………………………………….200

xxiv
LIST OF ABBREVIATIONS
BBS Behaviour Based Safety
CI Confidence Interval
EMG Electromyography
ESWC European Survey on Working Conditions
GEE Generalised Estimation Equation
ICC Intra-class Correlation Coefficient
HSE U.K. Health and Safety Executive
JS Job satisfaction
MSD Musculoskeletal Disorders
MSPD Musculoskeletal Pain and Discomfort
NIOSH U.S. National Institute for Occupational Safety and Health
NHEWS National Hazard Exposure Worker Surveillance
OR Odds Ratio
OWAS Ovako Working Posture Analysis System
PE Participatory Ergonomics
PRR Prevalence Rate Ratio
QEC Quick Exposure Check
REBA Rapid Entire Body Assessment
RSI Repetitive Strain Injury
RULA Rapid Upper Limb Assessment
SOC Stage of Change
SC Safety climate
T1 Time 1 or Baseline
T2 Time 2 or Follow-up
TTM Trans Theoretical Model
UE Upper extremities
Undifferentiated MSPD
A ‘Yes’ response to the question: Have you felt any pain/discomfort
in the last 7 days?
(Questionnaire in Appendix 1e, Q.1)
WRMSD Work Related Musculoskeletal Disorders

1
CHAPTER 1
GENERAL INTRODUCTION
Back pain, neck pain and shoulder pain are common in workplaces and have a significant
impact on workers’ health and wellbeing. Work-related musculoskeletal disorders (WRMSD)
cause economic burden, not only to workers but also organisations and governments, from
compensation costs, lost wages, and reduced productivity (National Research Council, 2001).
Musculoskeletal disorders have been identified as a workplace health issue for thousands of
years. Ramazzini, for example, recognized the problem in a range of occupations (bakers,
workers who stand, sedentary workers, scribes etc.) as well as the need to undertake measures
to prevent disorders from repetitive motions and manual lifting (Franco and Fusetti, 2004).
This brief introductory chapter provides context for the research presented in this thesis. It
includes a statistical review, research questions for the literature review in Chapter 2 and also
describes the organisation of the thesis.
The statistical review of recent workers compensation and other data is provided to
characterise various dimensions of the WRMSD problem, such as time trends and industry
impacts.
1.1 The Definition of Work-Related Musculoskeletal Disorders
Health researchers have used various terms and definitions for musculoskeletal disorders
particularly in occupational settings. There is no standardised terminology for WRMSD
(Macdonald and Evans, 2006). Safe Work Australia (2012a) has used the term

2
‘musculoskeletal disorder (MSD)’ and ‘strain and sprain’ to describe compensable claims
arising from body stressing. For statistical review purposes, the terms ‘Sprain/Strain and
MSD’ are defined as “sprains and strains of joints and adjacent muscles and diseases of the
musculoskeletal system & connective tissue” (Safe Work Australia, 2012a). A review of
terminology and the definitions of WRMSD are presented in Chapter 2.
1.2 The Magnitude of the WRMSD Problem
1.2.1 International WRMSD Profile
The prevalence and/or incidence of WRMSD and associated pain have been studied in many
countries. According to the report from the Third European Survey on Working Conditions
in 2000, the prevalence of workers reporting backaches was 34%, and for the neck and
shoulder pain it was 23%.
In addition, the report recorded that approximately 57% of individuals suffering from back
aches, neck and shoulder pain were agricultural workers (Paoli and Merllie, 2001). The
Fourth European Survey on Working Conditions in 2005 found that backache complaints in
Europe were 24.7%, muscular pain 22.8%, and fatigue 22.6% (Eurofound, 2007, Schneider
and Irastorza, 2010). In the United Kingdom (UK), there has been a decrease in WRMSD
over the last decade, with a total number of WRMSD of 508,000 out of a total number of
work-related illnesses of 1,152,000 in 2010/2011 (Health and Safety Executive, 2011). The
UK HSE also found that postal and courier jobs, construction, and agricultural sectors have
the highest rates of WRMSD. In addition, one UK study found that back pain was the most
costly health complaint with a direct health care cost of £1632 million, and informal care and
production losses of £. 10668 million in 1998 (Maniadakis and Gray, 2000).
In 2004, 69% of the US workers compensation cases were WRMSD. Labourers, material
movers, nurses and tractor-trailer truck drivers had the highest rates of WRMSD (U.S Bureau
of Labor Statistics, 2007). Another report from the Bureau of Labor Statistics highlighted that
in the US in 2010, the total number of WRMSD cases was 346,400 from a total nonfatal
occupational injuries of 1,191,100.

3
The median number of days away from work because of these illnesses was 11. This report
included data from private industries, state governments and local governments (Bureau of
Labor Statistics, 2011). Even though some countries may have a lower WRMSD rate, it is
still one of the common workplace health problems in many countries.
1.2.2 Australian WRMSD Profile
This section presents some information about the Australian WRMSD profile based on
compensation statistics.
In Australia in 2009/10, 43% of all serious claims were sprains and strains of joints and
adjacent muscles and 40.8% of the work related injuries were caused by the mechanism of
body stressing (Safe Work Australia, 2012 a, c).
The term ‘serious claim’ in Safe Work Australia reports is defined as follows: “Serious
claims involve either a death; a permanent incapacity; or a temporary incapacity requiring
an absence from work of one working week or more.” (Safe Work Australia, 2012 a, p.1).
Collectively, sprain, strain, and MSD claims represented 65% of all serious injuries. There
was a 25% decrease in claims from 2001 to 2010 (Figure 1.1).
Figure 1.1 The number of serious claims for sprain, strain and MSD from 2000-01 to 2009-10
Note: The graph was generated based from table 13, Compendium of workers’ compensation statistics
Australia 2009-10, p.30. (Safe Work Australia, 2012)
65,000
70,000
75,000
80,000
85,000
2000-01 2002-03 2004-05 2006-07 2008-09 2009-10
Sprain, Strain & MSD
4
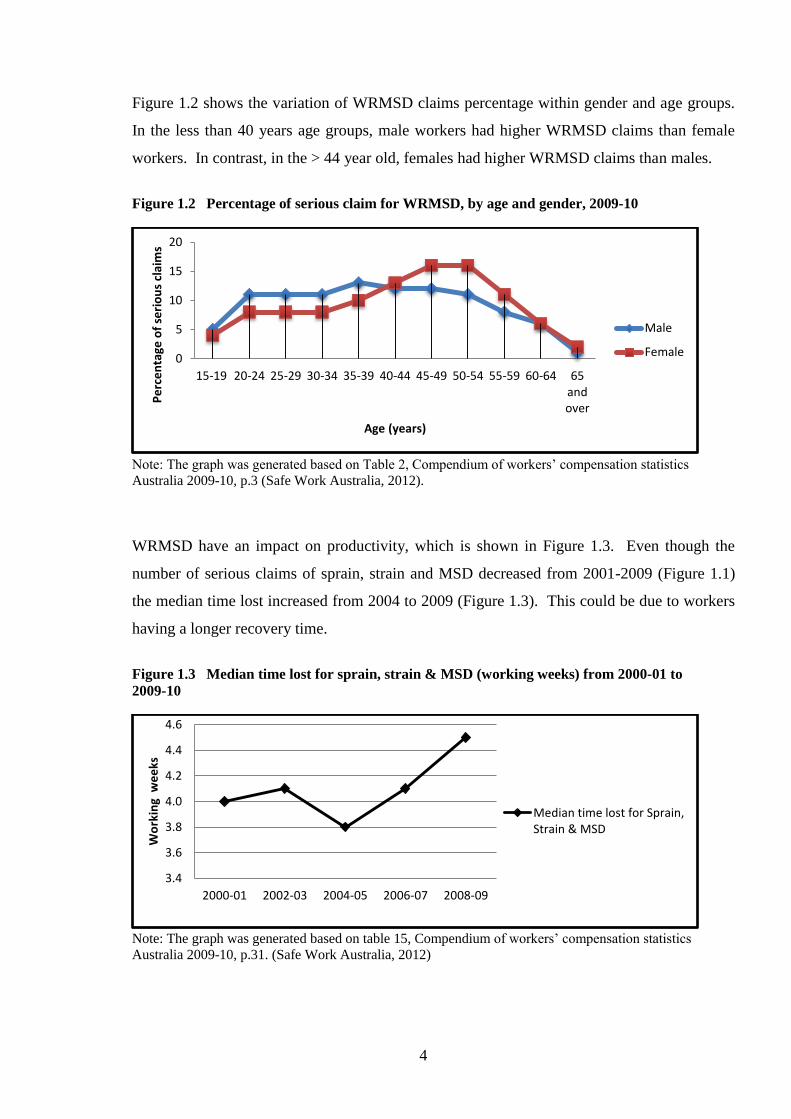
Figure 1.2 shows the variation of WRMSD claims percentage within gender and age groups.
In the less than 40 years age groups, male workers had higher WRMSD claims than female
workers. In contrast, in the > 44 year old, females had higher WRMSD claims than males.
Figure 1.2 Percentage of serious claim for WRMSD, by age and gender, 2009-10
Note: The graph was generated based on Table 2, Compendium of workers’ compensation statistics
Australia 2009-10, p.3 (Safe Work Australia, 2012).
WRMSD have an impact on productivity, which is shown in Figure 1.3. Even though the
number of serious claims of sprain, strain and MSD decreased from 2001-2009 (Figure 1.1)
the median time lost increased from 2004 to 2009 (Figure 1.3). This could be due to workers
having a longer recovery time.
Figure 1.3 Median time lost for sprain, strain & MSD (working weeks) from 2000-01 to
2009-10
Note: The graph was generated based on table 15, Compendium of workers’ compensation statistics
Australia 2009-10, p.31. (Safe Work Australia, 2012)
0
5
10
15
20
15-19 20-24 25-29 30-34 35-39 40-44 45-49 50-54 55-59 60-64 65andover
Pe
rce
nta
ge o
f se
rio
us
clai
ms
Age (years)
Male
Female
3.4
3.6
3.8
4.0
4.2
4.4
4.6
2000-01 2002-03 2004-05 2006-07 2008-09
Wo
rkin
g w
ee
ks
Median time lost for Sprain,Strain & MSD
5
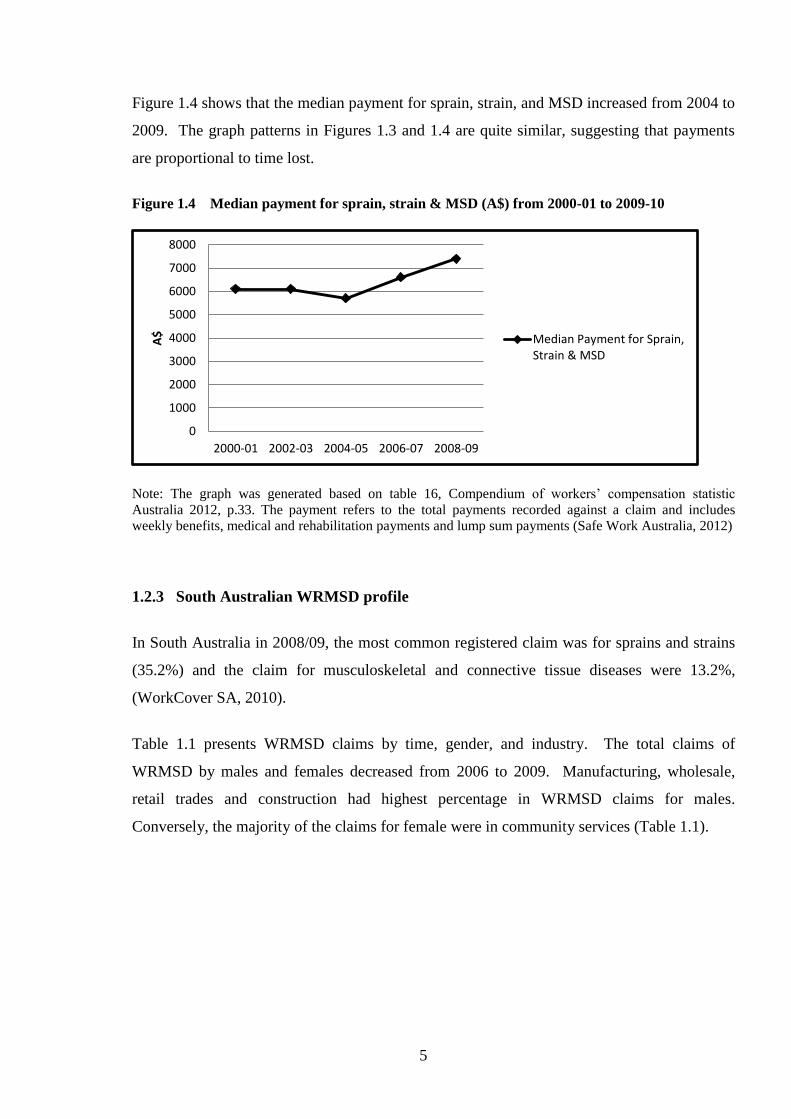
Figure 1.4 shows that the median payment for sprain, strain, and MSD increased from 2004 to
2009. The graph patterns in Figures 1.3 and 1.4 are quite similar, suggesting that payments
are proportional to time lost.
Figure 1.4 Median payment for sprain, strain & MSD (A$) from 2000-01 to 2009-10
Note: The graph was generated based on table 16, Compendium of workers’ compensation statistic
Australia 2012, p.33. The payment refers to the total payments recorded against a claim and includes
weekly benefits, medical and rehabilitation payments and lump sum payments (Safe Work Australia, 2012)
1.2.3 South Australian WRMSD profile
In South Australia in 2008/09, the most common registered claim was for sprains and strains
(35.2%) and the claim for musculoskeletal and connective tissue diseases were 13.2%,
(WorkCover SA, 2010).
Table 1.1 presents WRMSD claims by time, gender, and industry. The total claims of
WRMSD by males and females decreased from 2006 to 2009. Manufacturing, wholesale,
retail trades and construction had highest percentage in WRMSD claims for males.
Conversely, the majority of the claims for female were in community services (Table 1.1).
0
1000
2000
3000
4000
5000
6000
7000
8000
2000-01 2002-03 2004-05 2006-07 2008-09
A$
Median Payment for Sprain,Strain & MSD
6
Table 1.1 List of industries in South Australia with musculoskeletal diseases claims
(registered claims).
Male Female
Industry 2006-07 2007-08 2008-09 2006-07 2007-08 2008-09
Agriculture, forestry, fishing
and hunting 101 88 83 25 22 16
Community services 172 153 129 348 353 322 Construction 264 257 251 4 8 7 Finance, property and
business services 76 87 57 102 115 70
Manufacturing 637 546 473 188 160 143 Recreation, personal and other
services 87 88 72 144 153 121
Transport and storage 209 173 168 15 10 13 Wholesale and retail trade 331 306 294 160 160 145
Other industries 25 44 46 7 5 8
Total 1,902 1,742 1,573 993 986 845
Note: Adapted from Sources: Work Cover SA statistical Review 2008-2009 part 1, table 3.60, page 61,
www.workcover.com
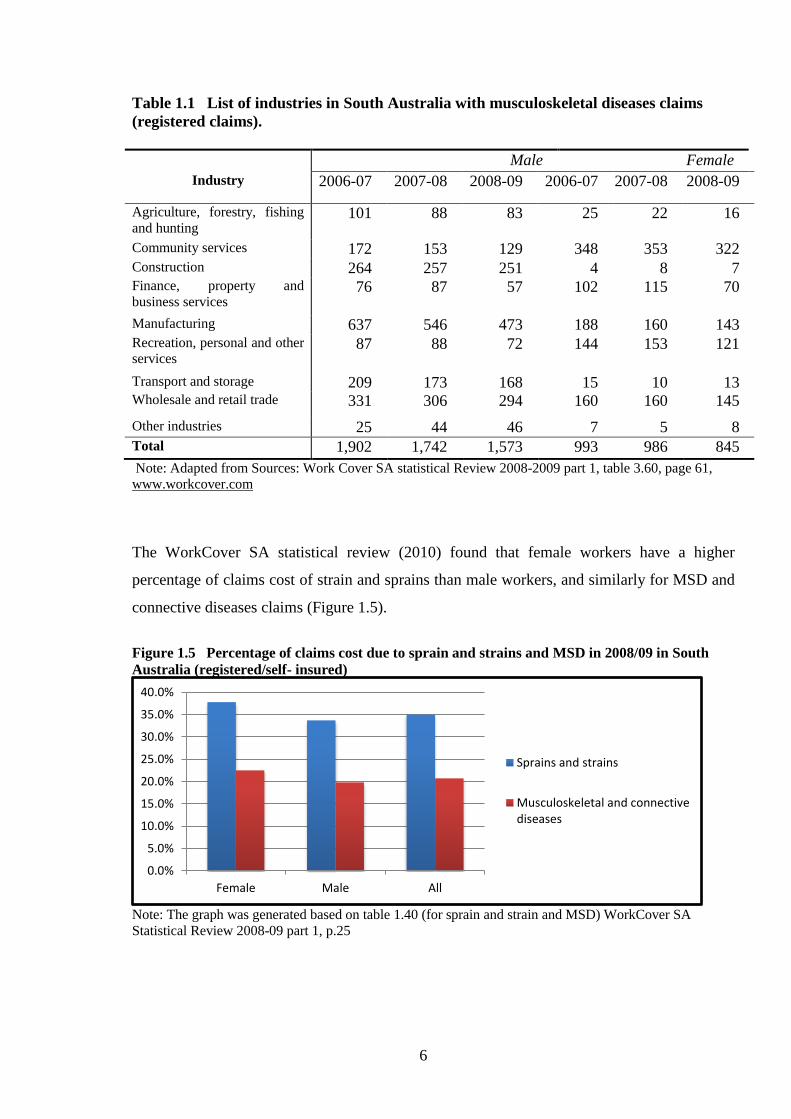
The WorkCover SA statistical review (2010) found that female workers have a higher
percentage of claims cost of strain and sprains than male workers, and similarly for MSD and
connective diseases claims (Figure 1.5).
Figure 1.5 Percentage of claims cost due to sprain and strains and MSD in 2008/09 in South
Australia (registered/self- insured)
Note: The graph was generated based on table 1.40 (for sprain and strain and MSD) WorkCover SA
Statistical Review 2008-09 part 1, p.25
0.0%
5.0%
10.0%
15.0%
20.0%
25.0%
30.0%
35.0%
40.0%
Female Male All
Sprains and strains
Musculoskeletal and connectivediseases
7
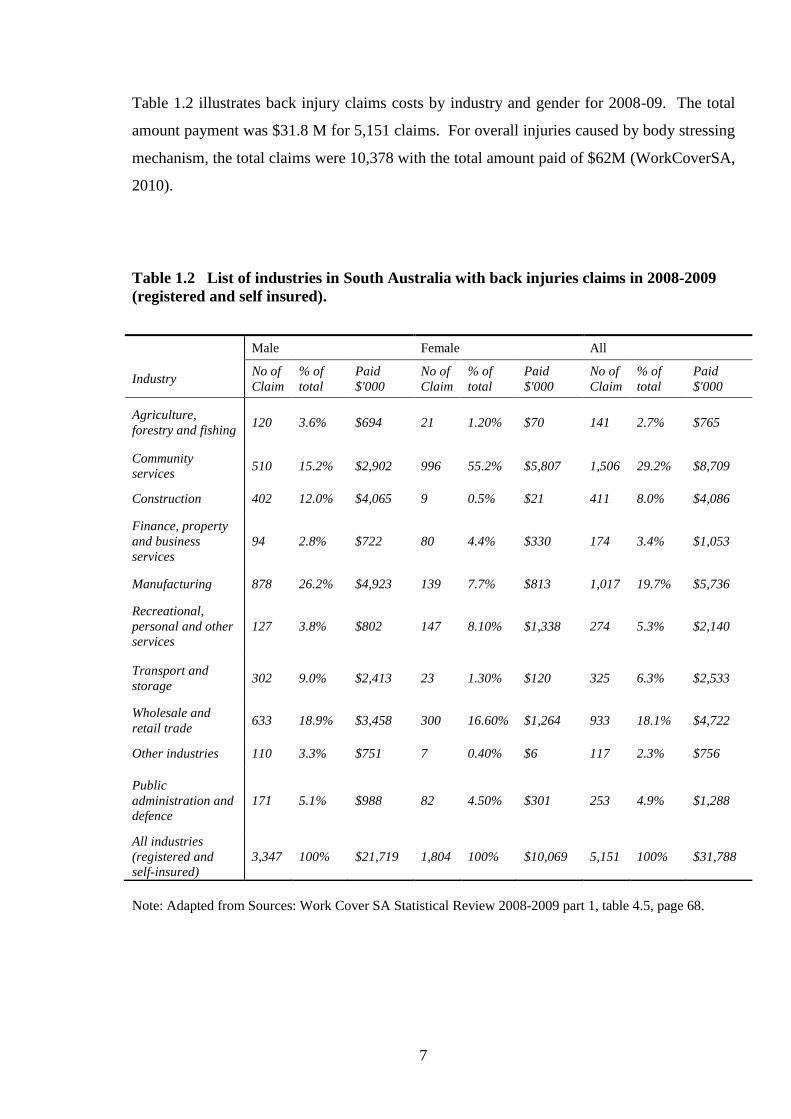
Table 1.2 illustrates back injury claims costs by industry and gender for 2008-09. The total
amount payment was $31.8 M for 5,151 claims. For overall injuries caused by body stressing
mechanism, the total claims were 10,378 with the total amount paid of $62M (WorkCoverSA,
2010).
Table 1.2 List of industries in South Australia with back injuries claims in 2008-2009
(registered and self insured).
Note: Adapted from Sources: Work Cover SA Statistical Review 2008-2009 part 1, table 4.5, page 68.
Male Female All
Industry No of
Claim
% of
total
Paid
$'000
No of
Claim
% of
total
Paid
$'000
No of
Claim
% of
total
Paid
$'000
Agriculture,
forestry and fishing 120 3.6% $694 21 1.20% $70 141 2.7% $765
Community
services 510 15.2% $2,902 996 55.2% $5,807 1,506 29.2% $8,709
Construction 402 12.0% $4,065 9 0.5% $21 411 8.0% $4,086
Finance, property
and business
services
94 2.8% $722 80 4.4% $330 174 3.4% $1,053
Manufacturing 878 26.2% $4,923 139 7.7% $813 1,017 19.7% $5,736
Recreational,
personal and other
services
127 3.8% $802 147 8.10% $1,338 274 5.3% $2,140
Transport and
storage 302 9.0% $2,413 23 1.30% $120 325 6.3% $2,533
Wholesale and
retail trade 633 18.9% $3,458 300 16.60% $1,264 933 18.1% $4,722
Other industries 110 3.3% $751 7 0.40% $6 117 2.3% $756
Public
administration and
defence
171 5.1% $988 82 4.50% $301 253 4.9% $1,288
All industries
(registered and
self-insured)
3,347 100% $21,719 1,804 100% $10,069 5,151 100% $31,788
8
If one considers musculoskeletal disorders to encompass strains and sprains, it is evident that
these represent a major proportion of workers compensation claims and costs. The statistics
in Table 1.2 demonstrate that back injuries are common. Essentially all industry categories
are represented with large proportions of claims in the manufacturing industry and community
services.
Pain is considered a precursor to WRMSD (see Chapter 2), and a number of Australian
studies of musculoskeletal pain have been reported. However, the results cannot be directly
compared due to differences in classification methods. In a study of Queensland veterinarians
63% of the participants reported having lower back pain, 57% had neck pain and 52% had
shoulder pain during the last 12 months (Smith et al., 2009). In a study on neck pain for
university office workers, Hush found that 49% of the workers experienced neck pain (Hush
et al., 2009).
In the National Hazard Exposure Workers Surveillance survey, 27.8% of workers reported
having no musculoskeletal pain in any body part (back and neck, upper limb and lower limb)
in the last 7 days (Safe Work Australia, 2011). This implies that 72.2% of the participants
experience pain. However this study was not regarded as representative of the Australian
working population.
1.3 Conclusion of the Magnitude and Costs of WRMSD
Worldwide, work related musculoskeletal disorders are prevalent in a wide range of industries
and have a significant impact on workers’ health and wellbeing. WRMSD also create an
economic burden, not only to workers but also organisations and governments, including
compensation costs, lost wages, and reduced productivity. The magnitude of the problem and
is associated costs are supported by Australian and South Australian compensation data.

9
1.4 Interventions
Historically, a vast range of interventions has been applied to address the burden of WRMSD
and associated pain. These will be discussed in Chapter 2, but include ergonomic/engineering
approaches and training interventions. Agricola, for example, was one of the earliest to
describe control measures in mining (Hoover and Hoover, 1950.). More recently,
participatory ergonomics (Straker et al, 2004) and psychological approaches (Whysall et al,
2006) have been used to enhance the effectiveness of traditional interventions. In principle,
interventions for the prevention of WRMSD should be developed from an understanding of
the aetiology of WRMSD. A range of individual, occupational and organisational factors
(including workplace psychosocial factors) has been implicated (Macdonald and Evans,
2006). The experience of pain has a psychological component, and it is now believed that
psychosocial factors are an independent cause of WRMSD. As a result, psychosocial aspects
are increasingly applied to WRMSD prevention.
Based on the available evidence from workers compensation data and various surveys,
WRMSD remains a significant challenge in terms of human and economic cost, and warrants
further basic and applied research, especially with regard to prevention.
1.5 Research Questions for the Literature Review
This thesis is oriented to the prevention of WRMSD, and in order to explore the topic, models
of WRMSD were first considered and a literature review was conducted. These are described
in the next Chapter.
The main research questions for the literature review were:
1. What is the association between WRMSD and individual, occupational, and
organisational factors?
2. What types of prevention methods have been applied to reduce WRMSD and how
effective are these methods?
10
1.6 Thesis Organisation
This thesis comprises 7 chapters. The organisation of the thesis is presented in Figure 1.6.
Chapter 1 describes the context of the research including a statistical review.
Chapter 2 provides background to the research and a literature review. The background
addresses terminology, aetiological models of WRMSD, and the assessment of WRMSD.
The literature review describes the prevention of WRMSD focussing on the application of
stage of change strategy in organisations.
Chapter 3 presents the baseline survey conducted in South Australian workplaces. It describes
the prevalence of work-related MSPD and the association of MSPD with individual/
occupational/ organisational characteristics.
Chapter 4 is quite similar to Chapter 3, and describes the follow-up survey undertaken after
the implementation of the intervention. This chapter also describes the prevalence of work-
related MSPD and the association of MSPD with individual/ occupational/ organisational
characteristics.
Chapter 5 is the main results chapter and comprises of three subsections namely: comparison
of baseline and follow-up surveys with basic statistical analysis; the nested randomised trial
results following GEE analysis and the evaluation of the tailored and standard interventions.
Chapter 6 discusses the significance of the research, considers its main findings in the context
of other literature, and summarises its strengths and limitations.
Finally Chapter 7 summarises the conclusion of the research and provides recommendation
for researchers and industry.
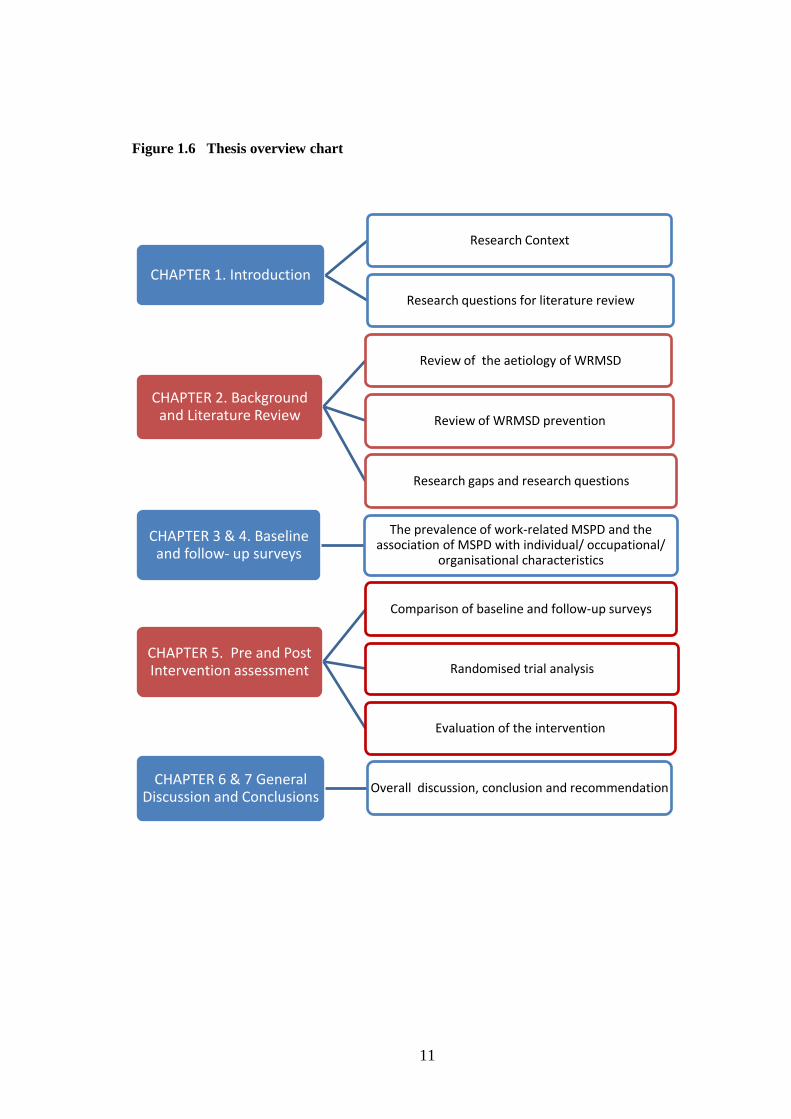
11
Figure 1.6 Thesis overview chart
CHAPTER 1. Introduction
Research Context
Research questions for literature review
CHAPTER 2. Background and Literature Review
Review of the aetiology of WRMSD
Review of WRMSD prevention
Research gaps and research questions
CHAPTER 3 & 4. Baseline and follow- up surveys
The prevalence of work-related MSPD and the association of MSPD with individual/ occupational/
organisational characteristics
CHAPTER 5. Pre and Post Intervention assessment
Comparison of baseline and follow-up surveys
Randomised trial analysis
Evaluation of the intervention
CHAPTER 6 & 7 General Discussion and Conclusions
Overall discussion, conclusion and recommendation

12
CHAPTER 2
BACKGROUND AND LITERATURE REVIEW
2.1 Introduction
This chapter reviews the theoretical and empirical literature regarding the aetiology as well as
the prevention of work-related musculoskeletal disorders (WRMSD). There are several
sections in this chapter: Section 2.1 is the introduction and review methodology, Section 2.2
is a general review of WRMSD prevention, and Section 2.3 is a review of the application of
the stage of change (SOC) approach to WRMSD prevention. As a result of the review,
research gaps are identified in Section 2.4 and research objectives and questions listed in
Section 2.5.
2.1.1 The Purpose of the Review
The literature on WRMSD is vast and so this review is necessarily focussed. It addresses
terminology, aetiological models, systematic reviews (as in the Cochrane library) and general
review articles relating to preventive approaches. The evidence for the utility of a SOC
approach to the prevention of WRMSD has a particular emphasis, because this is the basis of
the intervention study reported later in the thesis.

13
2.1.2 The Literature Review Method
In addressing the broad research questions posed in Chapter 1, the methodology comprised:
1. The definition of relevant topics and subtopics.
2. A search of the Cochrane Library from 2000-2012. The keywords for this search were as
follows: “musculoskeletal pain” OR neck pain OR “back pain” OR “shoulder pain” OR
“musculoskeletal disorders” AND workplace AND prevention OR ergonomic. This search
identified 92 articles. The search was refined by a closer inspection of topics and abstracts.
3. A search of Scopus and PubMed bibliographic databases. Keywords included:
“musculoskeletal pain” OR neck pain OR “back pain” OR “shoulder pain” OR
“musculoskeletal disorders” OR “musculoskeletal sprain” OR “musculoskeletal strain”
AND workplace OR ergonomic OR worksite. This search identified 652 articles. These
articles were reduced by using additional keywords. For example the subtopic of MSD
prevalence and risk factors used the keywords “MSD prevalence” and “risk factor” were
added and limited to 2000-12. Similarly, if the topic was focusing on the prevention of
musculoskeletal disorder, then additional keywords such as “prevention” or “intervention”
were used.
4. A search of the websites of governments and Occupational Health and Safety (OHS)
institutions such as those from WorkCover SA, Safe Work Australia, the Health and Safety
Executive (HSE) from the United Kingdom, and the US National Institute of Occupational
Health and Safety (NIOSH).
5. Reading articles, and key articles’ references which were relevant to the topic of the
review. Searches relating to SOC were expanded to the years before 2000.
- This literature review only included full text articles in English.
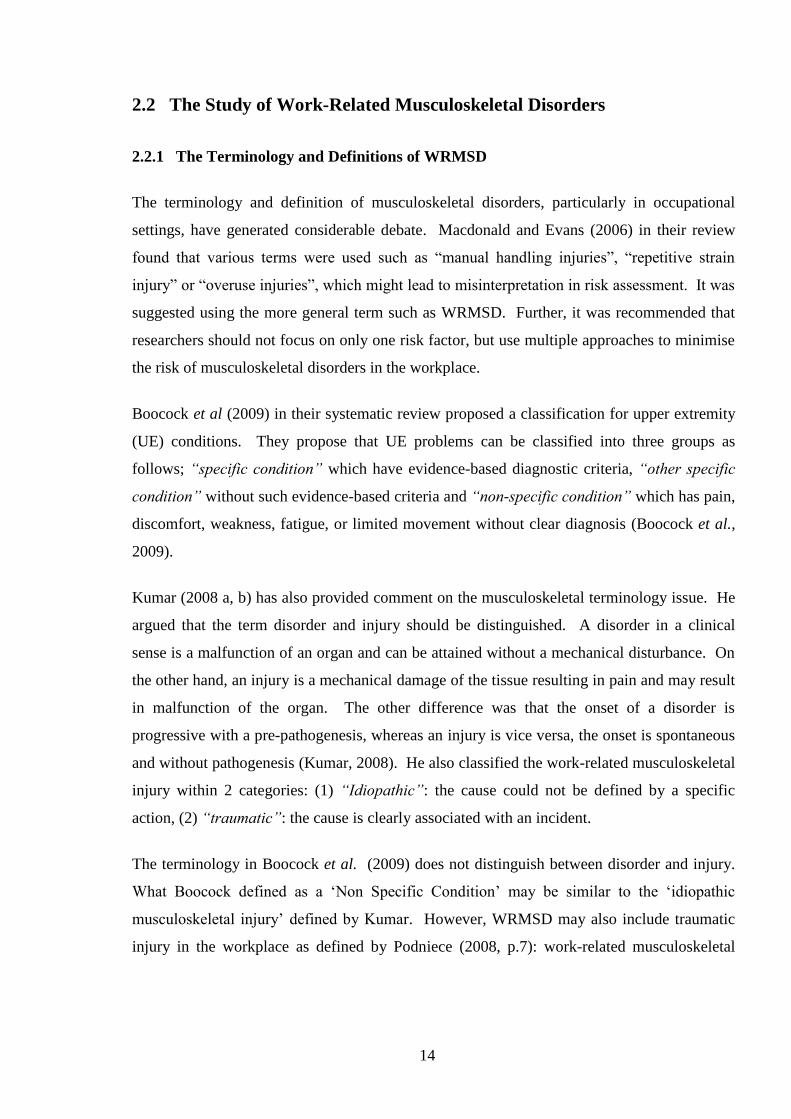
14
2.2 The Study of Work-Related Musculoskeletal Disorders
2.2.1 The Terminology and Definitions of WRMSD
The terminology and definition of musculoskeletal disorders, particularly in occupational
settings, have generated considerable debate. Macdonald and Evans (2006) in their review
found that various terms were used such as “manual handling injuries”, “repetitive strain
injury” or “overuse injuries”, which might lead to misinterpretation in risk assessment. It was
suggested using the more general term such as WRMSD. Further, it was recommended that
researchers should not focus on only one risk factor, but use multiple approaches to minimise
the risk of musculoskeletal disorders in the workplace.
Boocock et al (2009) in their systematic review proposed a classification for upper extremity
(UE) conditions. They propose that UE problems can be classified into three groups as
follows; “specific condition” which have evidence-based diagnostic criteria, “other specific
condition” without such evidence-based criteria and “non-specific condition” which has pain,
discomfort, weakness, fatigue, or limited movement without clear diagnosis (Boocock et al.,
2009).
Kumar (2008 a, b) has also provided comment on the musculoskeletal terminology issue. He
argued that the term disorder and injury should be distinguished. A disorder in a clinical
sense is a malfunction of an organ and can be attained without a mechanical disturbance. On
the other hand, an injury is a mechanical damage of the tissue resulting in pain and may result
in malfunction of the organ. The other difference was that the onset of a disorder is
progressive with a pre-pathogenesis, whereas an injury is vice versa, the onset is spontaneous
and without pathogenesis (Kumar, 2008). He also classified the work-related musculoskeletal
injury within 2 categories: (1) “Idiopathic”: the cause could not be defined by a specific
action, (2) “traumatic”: the cause is clearly associated with an incident.
The terminology in Boocock et al. (2009) does not distinguish between disorder and injury.
What Boocock defined as a ‘Non Specific Condition’ may be similar to the ‘idiopathic
musculoskeletal injury’ defined by Kumar. However, WRMSD may also include traumatic
injury in the workplace as defined by Podniece (2008, p.7): work-related musculoskeletal

15
disorders are the “impairment of body structures such as muscle, joints, tendons, ligaments,
nerve, bones or a localised blood circulation system caused or aggravated primarily by the
performance of work and by the effects of the immediate environment where the work is
carried out”.
The term “musculoskeletal pain and discomfort” (MSPD) has been used in various studies
(Corlett and Bishop, 1976, Whysall et al., 2005, Village and Ostry, 2010, Shaw et al., 2007)
and is also used in this thesis. MSPD is associated with the muscles, tendons, and other
supporting elements of the body (Shaw et al., 2007, Whysall et al., 2005), and includes, but
not limited to, the arm and wrist pain or discomfort caused by repetitive strain injury, and the
back, neck and shoulder pain caused by over-contraction. However, it does not include
injuries such as bone fracture etc.
Thus, work-related MSPD may refer to either the non-specific condition of Boocock et al.
(2009) or idiopathic musculoskeletal injury by Kumar (2008) or a specific condition (e.g.
lateral epicondylitis).
2.2.2 The Aetiology and Pathway of the Development of WRMSD
Before developing prevention strategies to address WRMSD, it is necessary to consider the
aetiologies and/or risk factors in the workplace that may generate these disorders. The risk
factors for WRMSD have been assessed in numerous industry-based studies including those
in construction, health care and manufacturing. It is assumed that WRMSD have various
contributing casual factors, including individual, and workplace factors (National Research
Council, 2001).
Punnett and Wegman (2004), p.15 stated, “….Not everyone with MSDs has ergonomic
exposures at work and not everyone exposed at work develops a MSD”. In the general
population musculoskeletal disorders may be caused by systemic diseases such as rheumatoid
arthritis, diabetes, lupus and also as a result of unhealthy life style, (i.e. irregular exercise)
(Punnett and Wegman, 2004).

16
Therefore, non-occupational risk factors should also be considered when undertaking risk
assessment, but rarely considered except in the management of injuries.
2.2.2.1 A Conceptual Model of the Development of Musculoskeletal Disorders.
A conceptual framework including pathways for WRMSD has been produced by US National
Research Council (National Research Council, 2001) and is presented in Figure 2.1. It
illustrates potential interactions among different factors, which might be considered direct or
indirect. Pain and discomfort may be precursors to WRMSD and individual, biomechanical,
and organisational factors may play a role in the development of both work-related MSPD
and WRMSD.
According to this framework there can be workplace factors and person factors. Within a
person, a biomechanical load potentially interacts with physiological, psychological factors
and individual coping mechanisms. If one or more factors, with or without the interaction,
exceed an individual’s tolerance, it may result in mechanical strain, fatigue and ensuing pain.
Relatedly, data from a prospective cohort study (Hamberg-van Reenen et al., 2008) suggested
that musculoskeletal discomfort was a predictor of future musculoskeletal pain, which itself
may be a precursor of injuries, body part impairment, or disability. In studies, which have
tested the ability of self-reported body part discomfort to predict future injury (and lost time)
the results have been inconclusive. In their study involving four large enterprises Macdonald
et al. (2007) collected data on musculoskeletal discomfort from workers in two sectors –
‘manufacturing’ and ‘transport and storage’ – and compared this with company records of
actual lost time injuries due to musculoskeletal disorders. The results were shown to be
highly variable with the correlation between self-reported discomfort and compensable injury
at the various sites ranging from very low (0.262) to very high (0.704).
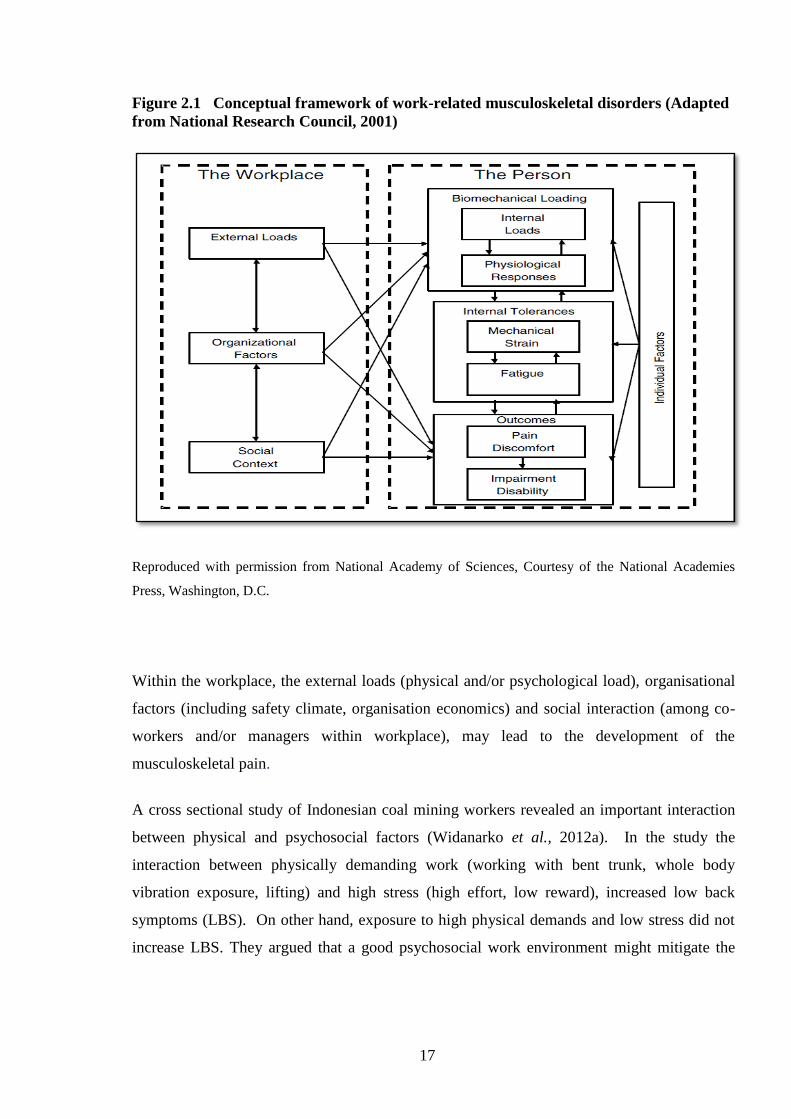
17
Figure 2.1 Conceptual framework of work-related musculoskeletal disorders (Adapted
from National Research Council, 2001)
Reproduced with permission from National Academy of Sciences, Courtesy of the National Academies
Press, Washington, D.C.
Within the workplace, the external loads (physical and/or psychological load), organisational
factors (including safety climate, organisation economics) and social interaction (among co-
workers and/or managers within workplace), may lead to the development of the
musculoskeletal pain.
A cross sectional study of Indonesian coal mining workers revealed an important interaction
between physical and psychosocial factors (Widanarko et al., 2012a). In the study the
interaction between physically demanding work (working with bent trunk, whole body
vibration exposure, lifting) and high stress (high effort, low reward), increased low back
symptoms (LBS). On other hand, exposure to high physical demands and low stress did not
increase LBS. They argued that a good psychosocial work environment might mitigate the

18
effects of a poor physical work situation. Their argument is supported by a Dutch longitudinal
study that also found that high quality psychosocial conditions (high communication) could
buffer the negative effects of a high physical workload (Joling et al., 2008).
A limitation of the framework is that factors outside of the workplace (such as lifestyle,
household activity etc.) are not explicitly described, but these also have the potential to
contribute to MSPD. For example, lifestyle and household activities such as irregular
exercise or house cleaning may influence MSPD in the workplace (Alipour et al., 2008).
Moreover, financial hardship may indirectly contribute to MSPD through stress reaction (Rios
and Zautra, 2011).
Another aetiological model has been described by Macdonald and Evans (2006) and is
illustrated in Figure 2.2. The top of this figure shows that physical factors, including
cumulative compression, may result in tissue damage, which may generate pain in single or
multiple body regions.
Independently, or in parallel, a psychological pathway may trigger hormonal changes or
muscle tension as a stress response, leading to tissue damage and/or pain. The psychosocial
pathway may relate to work organisation, demands, rewards, relationships etc.
Carayon et al. (1999) asserted that job stress could change physiological responses, which
may then contribute to work-related musculoskeletal pain and “reduced blood flow to the
extremities and to the muscles; increased blood pressure; increased corticosteroids, such as
cortisol – fluid retention in body tissues; increase in peripheral neurotransmitters, such as
norepinephrine – increased motor activity; increased muscle tension; reduced effectiveness of
immune system response; hyperventilation/over breathing, evidenced by reductions in end-
tidal PCO2” .

19
Figure 2.2 WRMSD model of Macdonald and Evans (Adapted from Macdonald and Evans,
2006)
In a more fundamental and specific model by Cnockaert and co-workers, cited in Macdonald
and Evans (2006), a relationship exists between physiological changes and stress in Figure
2.3. This depicts four pathways by which different physiological dimensions of the stress
response can directly increase MSD risk. Similar to Carayon et al., Cnockaert’s flowchart also
includes the reduction of microcirculation, corticosteroid increase and muscle tone increase.
All of these effects may predispose to muscle pain.
Macdonald and Evans (2006) have criticised the US National Research Council’s framework
(Figure 2.1) in that it doesn’t specifically refer to stress, although ‘physiological responses’ to
workplace factors is among the internal states depicted. They proposed a composite model
emphasising linkages between psychosocial and physical hazards, whilst acknowledging
potential confusion concerning the conceptual nature of ‘psychosocial’ hazards (Macdonald
and Evans, 2006).

20
Figure 2.3 Physiological changes as a response of stress (adopted from Aptel and Cnockaert,
2002 in (Macdonald and Evans, 2006)
2.2.2.2 Research Studies on Aetiology/Risks of WRMSD
A range of empirical studies has addressed the aetiology and/or risk factors for WRMSD.
The following is a review based on four risk factors from the conceptual framework in Figure
2.1, and the issues raised by Macdonald and Evans.
2.2.2.2.1 Individual Factors
Individual factors include genetic factors (such as gender), morphological factors (age, bone
size, spinal canal size, body size) (Kumar, 2008b), work experience, life style (such as regular
exercise) (Alipour et al., 2008), and behaviour (e.g. risky behaviour). Genetic and
morphological factors have been classified as non-manageable factors (Kumar, 2008a) since
they cannot be controlled. In principle, these factors, particularly age and gender, should be
taken into account when planning a prevention strategy, by “fitting the task to human”

21
(Kroemer and Grandjean, 1997) age or gender if it is available, e.g. by giving an appropriate
workload based on their capabilities to do a task.
Females often have a higher prevalence of WRMSD than males (Roquelaure et al., 2006,
Nordander et al., 2009, Dahlberg et al., 2004, Safe Work Australia, 2011, Widanarko et al.,
2011). It is plausible that that women may be predisposed as they may also be doing
housework (Alipour et al., 2008; Matthews et al., 1998) or that there are differences in males’
and females’ physiological capabilities to do physically demanding work (Cole and Rivilis,
2004). Women over the age of 45 with pre- or post-menopause syndrome may experience
stress and a somatic syndrome including muscular pain (Hunter, 1990), which may be an
indirect contributor. In contrast with the previously mentioned studies, Daraiseh, et al. (2010)
found that age and gender were not associated with WRMSD.
A distinction can be made between the influences of work experience and age. There is
evidence that WRMSD prevalence increases with age, because of the deterioration of the
body as an effect of hormonal and physiological changes in older people (Kumar, 2008b,
Roquelaure et al., 2006). However, one study found that in the older age groups of 40-49
and 50-59, the prevalence was flat or decreasing (de Zwart et al., 1997 a,b). This may be due
to reduced participation in heavy work (de Zwart et al, 1997b, Punnett, 1996). A New
Zealand study found that there were no significant differences in prevalence of
musculoskeletal symptoms among age groups (Widanarko et al., 2011). In a review of aging
and work, Silverstein argued that older workers were less likely to experience work-related
injuries or sickness, but when they did occur they were more severe (Silverstein, 2008).
In a study of nurses, a negative correlation was found between reported musculoskeletal pain
and length of work experience (Daraiseh et al., 2010). However, in a study of autoworkers, it
was found that neck and shoulder pain increased with length of work experience (Alipour et
al., 2008). It can be argued that workers with more experience are more likely to be familiar
with the work safety procedures, better skilled or be better adjusted with their current work
(Daraiseh et al., 2010), hence experience less pain. Alternatively the longer an individual is
employed the more confident they may become in reporting work-related pain.

22
Conversely, newly employed workers may be apprehensive in reporting workplace hazards
(Cole and Rivilis, 2004).
Another predictor of WRMSD may be the individual’s perception of risk, and associated
behaviours. In a study of construction industry workers, it was found that an advanced stage
of behaviour change toward MSD prevention effort was associated with a higher prevalence
of musculoskeletal problems (Village and Ostry, 2010). An explanation may be that workers
in advanced stages of change could be more aware of the risks and thus more likely to report
MSPD. Alternatively, pain may heighten of workers’ awareness of the risk, so they are more
likely to take action to prevent the risk.
Individual lifestyle factors have also been reported as having a relationship with WRMSD.
Workers with irregular exercise patterns reported more neck and shoulder pain (Alipour et al.,
2008).
2.2.2.2.2 Physical / Mechanical Factors
In accordance with the models depicted in Figures 2.1 and 2.2, biomechanical forces from
repetitive or static tasks may initiate WRMSD, especially in the upper limbs, shoulder, neck
and lower back pain (Ijmker et al., 2006, Wells et al., 1994). Repetitive work or working
above the shoulders was found to lead to shoulder and neck pain (Bernard, 1997, Dahlberg et
al., 2004, Alipour et al., 2008). In a report by the US National Research Council and Institute
of Medicine, pain and discomfort in the upper limbs were associated with repetitive tasks, the
magnitude of the external load and long working hours (National Research Council, 2001).
Back pain varied with lifting loads, frequency of lifting, lifting duration, and increased with
particular movements - “trunk flexion, trunk twisting and lateral bending” (National Research
Council, 2001). These findings are consistent with other studies that found that heavy
physical work, lifting, and forceful movement were associated with low back pain (Bernard,
1997, Widanarko et al., 2011). In the healthcare industries, shoulder and neck pain have
been linked to manual patient handling, which often entails heavy loads and long working
hours (Smith et al., 2006, Walters et al., 2006, Glover et al., 2005).

23
Vibration exposure and heavy physical work were also associated with lower back pain
(Bongers and Boshuizen, 1992, Village and Morrison, 2008, Bernard, 1997). Regional
musculoskeletal pain may be associated with tasks that regularly or continuously use the
specific body area.
Overall, there is good evidence from a variety of industries for the contribution of physical or
mechanical risk factors to pain and WRMSD.
2.2.2.2.3 Psychosocial Factors
Psychosocial factors such as monotonous work, uninteresting jobs, inter-personal
relationships, and organisational issues that may initiate work stress have been found to be
associated with musculoskeletal health outcomes (Alipour et al., 2008). Scuffham et al.
(2010) reported that job satisfaction and organisation safety climate were potential risk factors
for developing illnesses in workplaces. Widanarko et al. (2012b) also found that psychosocial
factors including dissatisfaction with contact and cooperation with management was
associated with LBS for females. A longitudinal study of Dutch workers also found that a
good quality of psychosocial such as communication and social support buffer the negative
effect of high physical workload on the risk of musculoskeletal problems (Joling, et al.,
2008).
More indirectly, economic difficulties were associated with daily worries and pain (Rios and
Zautra, 2011). Such economic difficulties may be common across a group of workers.
A Canadian longitudinal study showed evidence for a relationship between job insecurity and
distress at work (Marchand et al., 2005). In accordance with Figures 2.2 and 2.3, the stress,
from whatever source, might generate musculoskeletal pain, inflammation and other
conditions.
Perceptions of job insecurity may reduce safety compliance and safety participation in
organisations (Probst and Brubaker, 2001, Clarke, 2010), which in turn might lead to work-
related health problems.

24
Safety climate will be discussed in the following section on organisational risk factors, even
though it could be considered as a psychosocial factor since it relates to worker and manager
safety attitude and behaviour.
2.2.2.2.4 Organisational Factors
Organisational characteristics can be classified at various levels and potentially include
company size, industry and culture, or the way the work is organised. For the purposes of this
research a company is also referred to as an organisation. Factors such as the organisation’s
safety climate, type and size may have an effect on the development of work-related illness,
specifically musculoskeletal pain or disorders.
Industrial sectors with a high risk of MSPD are nursing facilities, air transportation, mining,
food processing, leather tanning, and heavy or light manufacturing (Punnett and Wegman,
2004)). The type of company might reflect a similarity of the type of tasks done. For
example, in construction companies, the majority of workers might engage in similar tasks
such as lifting, pushing and the other forced manual handling which might lead to back pain
(Village and Ostry, 2010). In a manufacturing environment, most workers are dealing with
processing tasks, which are repetitive, and therefore increasing the incidence of upper limb
pain (Alipour et al., 2008).
Company size may have an association with WRMSD in that employees in a larger company
might be more likely to report WRMSD. Morse et al. (2004) claimed that this was not
because of a real difference in the distribution of illness, but rather due to under-reporting in
smaller companies. There are some possible reasons for under reporting in smaller
companies. The first possibility is that the smaller companies might not have formal
implementation of health and safety policies or record keeping compared with the large
companies (Bohle and Quinlan, 2000). Therefore, workers in smaller companies might be
less compliant in reporting workplace hazards.
In addition, smaller companies were less likely to have health promotion programs (Linnan,
et.al, 2008 in (Hughes et al., 2011), limited resources, and a lack of training (Bohle and
Quinlan, 2000) compared with larger companies.
25
Long working hours are also an important risk factor for WRMSD occurrence. This might be
related to the length of exposure time of physical demands and also the high level of job stress
(Grosch et al., 2006). There is evidence supporting the relationship between long working
hours and sickness including WRMSD as found by previous studies (Trinkoff et al., 2006,
Dembe et al., 2005).
Safety climate is defined as the shared perception of safety policy, procedures, and practice
among members of an organisation (Zohar, 1980); Neal and Griffin, 2006). It is thought to
reflect the underlying safety culture in the organisation (Cox and Flin, 1998 in Cox and
Cheyne, 2000)). There is believed to be a relationship between safety climate and workers’
general attitudes toward safety or safety performance (Griffin and Neal, 2000, Pousette et al.,
2008). Management commitment and supervisor support significantly affect employees’
perception of safety (Seo et al., 2004). Studies by Torp et al (1999 and 2001) also found that
a good psychosocial environment, including high social support and involvement of
managers, supervisors, stakeholder and workers in health and safety, positively influenced
coping strategies to reduce musculoskeletal problems. Indeed, both managers’ and
employees’ attitudes and behaviours towards all aspects of safety issues in an organisation are
important (Clarke, 2006). Various researchers have found evidence for a relationship
between safety climate and work-related accidents or injuries (Seo et al., 2004, Huang et al.,
2007, Clarke, 2006, Vinodkumar and Bhasi, 2009) as well as a relationship between safety
behaviour and workplace accidents (Neal and Griffin, 2006).
2.2.3 The Assessment of WRMSD and Exposures to WRMSD Risk Factors
Various methods are used to assess WRMSD and various tools are used to measure exposure
to WRMSD risk factors in workplaces. The following provides background, and is not
intended to be a comprehensive review.
26
2.2.3.1 The Assessment of Health Outcomes (WRMSD and/or MSPD)
Survey methods are commonly used to characterise the prevalence of MSPD in workplaces.
Examples include the standardised Nordic questionnaire or its modified version (Kourinka et
al, 1987; Öztürk and Esin, 2011; Scuffham et al., 2010; Glover et al., 2005; Widanarko et al.
2011) and the Postural Discomfort questionnaire (Whysall et al., 2005, Village and Ostry,
2010). The standardised Nordic questionnaire has been used to assess musculoskeletal
symptoms in any body area within the last 12 months and previous 7 days (Gershon et al.,
2007). Corlett and Bishop (1976) developed the postural discomfort questionnaire to assess
musculoskeletal discomfort and pain severity. These assessments have certain limitations,
e.g. recall bias, and are blunt instruments in assessing the effectiveness of intervention.
A clinical assessment method for musculoskeletal disorders is the physical examination. In a
study utilising both the Nordic questionnaire and physical examination with pre-defined
diagnostic criteria, higher risk estimates for the effects of repetitive/constrained work were
derived with physical examination (Nordander et al., 2009).
Beyond physical examination and observation of signs, a wide variety of diagnostic tools and
assessments are available, and used by medical and allied health professionals.
2.2.3.2 The Assessment of Risk Factors for Health Outcomes
Macdonald and Evans (2006) categorised the various methods of WRMSD risk factor
analysis according to hazards, jobs and industries, and also indicate the evidence of validity,
sensitivity and reliability. The eight hazard categories included “postures and loads,
repetitiveness, psychosocial hazards, stress and fatigue” (Macdonald and Evans, 2006, p.47).
Exposure assessment tools can also be classified as qualitative, semi-quantitative or
quantitative tools (Pascual and Naqvi, 2008).
These following subsections describe selected techniques, namely self–reported exposures,
observational assessment, and bio-measurement.

27
2.2.3.2.1 Self Reported Assessment
Survey instruments relying on self-reporting often combine individual, physical, and
psychosocial and lifestyle factors at work (Alipour et al., 2008; Widanarko et al., 2012a). The
National Hazard Exposure Worker Surveillance (NHEWS) survey utilised telephone methods
and referred to nine biomechanical demands (Safe Work Australia, 2011) derived from other
studies (Paoli and Merllie, 2001, Eurofound, 2007). The Job Content Questionnaire (JCQ)
developed by Karasek et al. (1998) is used to measure the psychosocial characteristic of jobs
(Hush et al., 2009, Scuffham et al., 2010, Karasek et al., 1998). A number of safety climate
survey instruments have been developed (Zohar, 1980; Whysall et al., 2005, Village and
Ostry, 2010, Shaw et al., 2007). Job satisfaction scales have been developed and utilised
(Warr et al., 1979, Lu et al., 2012, Fatimah et al., 2012).
2.2.3.2.2 Observational Assessment
Several tools are commonly used by the practitioners or researchers for observing tasks in
workplace. For example RULA (Rapid Upper Limb Assessment) (McAtamney and Corlett,
1993), REBA (Rapid Entire Body Assessment) (Hignett and McAtamney, 2000) and the
Quick Exposure Check (QEC) (David et al., 2008). RULA is often employed for assessing
the shoulder, neck, and upper limb physical exposure and load. REBA is a complete
assessment for the entire body. The QEC assesses exposure to the back, shoulders, upper
limbs and neck and evaluates both physical and psychosocial risk factors. It also
recommended to be used in the evaluation of the effectiveness of intervention in workplaces
(David et al., 2008).
Another ergonomics assessment tool is the National Institute for Occupational Safety and
Health (NIOSH) lifting equation (Waters et al., 1993). This assessment has a high sensitivity
but it has been argued that it needs a more detailed postural assessment (Waters et al., 1993,
Hignett and McAtamney, 2000). There are also several other tools used in ergonomics such
as the Strain Index (Torres et al., 2011) and OWAS (Ovako Working Posture Analysis
System) (Karhu et al., 1977, Torres et al., 2011). These tools are also observational
assessments that have more objective interpretation.
28
Researchers have used the Dictionary of Occupational Titles (DOT) as a source of
occupational data, including a job’s physical demands (Lee and Chan, 2003, Opsteegh et al.,
2010, Wong et al., 2010, Ryan et al., 2009). The Division of Occupational Analysis (a unit
within the US Department of Labor) developed the DOT incorporating a range of factors
(Cain and Treiman, 1981). However, the validity of the DOT is still being debated. Opsteegh
et al. (2010) contend that the DOT is not valid for assessing physical demand of upper limbs.
These authors also claim that the classification of job characteristics may not be reasonable
for different companies.
Lee and Chan (2003) found the DOT-based job characteristic was mostly accurate, although
discrepancies still exist. They compared the job characteristics of formwork carpentry in
Hong-Kong using Job analysis questionnaire to the job characteristics specified in the DOT.
They found that the physical demands in both descriptions were quite different. They argued
that this dissimilarity might be due to the different environmental specifications and the ways
in which employees performed tasks. Ideally, job characteristics should take into account
individual workers characteristics, workplace situations, and tasks performed. For example,
while individual physical capacity or capability is an important element with respect to
workload, a similar task may differ in workload for a smaller individual compared to larger
individuals or for a man and a woman (Kumar, 2008b). Furthermore, one job title might
require different tasks to be performed in different locations. Lee and Chan (2003) found that
formwork carpentry in Hong Kong is more likely to occur in building residential skyscrapers
with medium-scale formwork such as walls, columns etc., instead of small-scale formwork.
On the other hand, in the United States, a carpenter may mostly work for building residential
houses, which includes both medium and small scale formwork (Lee and Chan, 2003).
2.2.3.2.3 Biomeasurement
Biomeasurement or biomonitoring are also utilised to provide a more precise measurement of
physical workload, for example, electromyography (EMG) to measure and monitor muscle
fatigue (Herberts et al., 1980), heart rate monitoring during work (Roja et al., 2006, Garet et
al., 2005a), perceived physical exertion and physical isometric workload (Roja et al., 2006).

29
Researchers usually choose the most practical and affordable instruments for assessing
WRMSD and its exposure to be used in their studies. For instance biomonitoring assessment
precisely measures MSD-related exposures but it is more costly for a large sample size,
compared with the self-reported measurement, which is a practical and a low cost method for
a large sample size study. Punnett and Wegman (2004) stated that researchers commonly
assessed the exposure using the crude indicator such as job title and work type, which
consequently leads to misclassification. However, it could not be expected that researchers
might use similar measurements for assessing WRMSD risk factors, since each study has its
own aims, and capability and affordability in choosing an appropriate and feasible
measurement. Consequently, the current prevalence of WRMSD and its risk factors in
workplaces are still diverse partly due to the differences in measurements used (Huisstede,
2006). However, it might be worthwhile to use a more precise assessment of work-related
musculoskeletal pain for evaluating the efficacy of any intervention or prevention method in
workplaces.
2.2.4 Prevention Methods for WRMSD
Given the diversity and potential interaction of risk factors for WRMSD, there can be
numerous approaches and methods for prevention. Approaches can address engineering
design, human-systems interfaces, psychosocial issues, work organisation, behavioural
control, and can be employed alone or in combination (described in Section 2.2.4.1 and
2.2.4.2 below). In Europe, organisational and administrative interventions, technical,
engineering or ergonomic intervention, personal intervention, and behavioural modification
have been employed (Podniece, 2008).
Approaches to prevention may also be considered in terms of the traditional hierarchy of
control measures (ILO-OSH., 2001). However, Macdonald and Evans (2006) argued that the
hierarchy of risk control measures should be followed as long as is ‘practical’ and affordable.
For the purposes of this thesis, the preventative approaches are classified into two groups:
basic approaches and supplementary approaches. The basic approaches are those that directly

30
address the WRMSD risk factors, including engineering/design controls (such as workstation
re-design and lighting), biomechanical hazard mitigation (such as anti-vibration gloves),
administrative approaches (such as safety signs, job rotation or education, rest breaks to
address repetitive, heavy work etc.), and relaxation techniques. The supplementary or top-up
approaches may aim to regulate behaviour e.g. behaviour based safety approaches
(performance feedback, incentives), or improve worker participation (Haines et al., 2002;
Isabel and Rodríguez, 2012). The supplementary approaches are carried out to support or
enhance the main prevention approaches.
2.2.4.1 Basic Approaches
Two preventive approaches are described, with some overlapping elements. The
ergonomics/engineering approach is the most direct approach. The educational/training
approach seeks to inform workers about hazards and controls, so that hazards can be avoided
etc.
2.2.4.1.1 Ergonomics Approach
Ergonomics is to do with “the process of designing and/or modifying tools, materials,
equipment, work spaces, tasks, job, products, systems and environments to match the mental
and physical abilities and limitation and social needs of people” (Wells et al., 2003, Kumar,
2008a). Based on this definition, ergonomics is aimed at the elimination or mitigation of
physical or biomechanical and psychological risks. These are briefly considered below.
2.2.4.1.1.1 Biomechanical/ Physical Risks Approaches
Ergonomic approaches that are aimed at prevention of biomechanical risk may include
changes to forces, posture, task durations, frequencies etc. Examples from the literature
include designing/redesigning workload, implementing job rotation and job variation (De
Oliveira Sato and Coury, 2008, Wells et al., 1994, Hakkanen et al., 1997), mechanical or
workstation modification such as providing adjustable equipment or tools (Walters et al.,
2006), and biomechanical exposure mitigation (Mathiassen, 2006).
31
The Cochrane Reviews on ergonomic design and training indicated moderate quality evidence
for the benefit of arm support with alternative mouse to prevent WRMSD in the upper limbs
and neck (Hoe et al., 2012). There was low to very low quality of evidence that other
ergonomic interventions including patient lifting, and supplementary breaks reduced
WRMSD (Hoe et al., 2012). The low quality of evidence might be due to the dearth of studies
available for review.
Regular physical exercises stimulate hypertrophy of muscle fibre, thereby, increasing muscle
strength (Fry, 2004, Kumar, 2008a). The Cochrane Review on post-treatment exercise for
prevention of recurrence of back pain identified that there was a moderate amount of evidence
that exercise programmes can reduce the recurrence of back pain (Choi et al., 2010).
2.2.4.1.1.2 Psychological Risks Approaches
Psychological interventions aim to reduce stress in the workplace. For example, workers
engaged in monotonous work and/or low demand work require intervention such as job
variation (De Oliveira Sato and Coury, 2008). However, a review of 19 studies on the
prevention of occupational stress in health care workers, comprising individually-directed and
work-directed elements found that there was limited evidence that the interventions were
effective in reduce stress levels (Marine et al., 2009). It appears unlikely that stress
management strategies alone are effective in reducing WRMSD.
2.2.4.1.2 Education / Training Approaches
Education/training is a preventive approach, which combines knowledge, skill, and
competency. It is built into modern health and safety legislative requirements. Education/
training could be used for prevention of both physical/biomechanical and psychological risks.
While training programs are commonly used in the prevention of WRMSD, a recent review
found that training programs were not suitably wide-ranging (Denis et al., 2008).
Physical or biomechanical training includes training in manual handling technique (lifting,
pushing, pulling, carrying, lowering, holding, and dragging), patient handling, and equipment-
handling etc. After completion of this training, it is expected that the skilled person will be
confident in avoiding hazards and will be more economically efficient in his/her movements
32
when doing his/her tasks, thereby reducing the level of energy consumption (Kumar, 2008a).
By doing correct training the body parts involved may adapt and become more resilient.
Hignett’s review found that patient-handling training does not improve work performance and
injury rates (Hignett, 2003 in Denis et al., 2008). A Cochrane Review found low to very low
quality of evidence that training reduced work-related upper limb and neck MSD (Hoe et al.,
2012). A more recent Cochrane Systematic Review found moderate to very low quality of
evidence for the effectiveness of manual material handling advice and training (Verbeek et
al., 2011). Possible reasons include: ‘ a lack of power to detect a relevant difference, a bias
toward a negative outcome…a lack of sufficient exposure to back strain.., the intervention in
the included studies are not appropriate..” (Verbeek et al., 2011, p.14).
Training may also be applied in order to educate workers on how to cope with workplace
stress. The UK Health and Safety Executive has developed a management standard for
managing stress in workplace (Health and Safety Executive, 2010) and is relevant for training
of managers. However, the Cochrane Review on workplace interventions for neck pain,
including education about stress management, principles of ergonomics and the importance of
physical activity, found a paucity of evidence, with no advantage nor disadvantage of any
workplace intervention (Aas et al., 2011). On the other hand, moderate evidence was found
with respect to sickness absence (Aas et al., 2011).
2.2.4.2 Supplementary Approaches
As mentioned, and for the purpose of this thesis, supplementary approaches are aimed at
enhancing, increasing the longevity or smoothing the implementation of the main intervention
approach.

33
2.2.4.2.1 Participatory Ergonomics
Wilson and Haines 1997 in Haines (2002) (p.309) defined Participatory Ergonomics (PE) as
“the involvement of people in planning and controlling a significant amount of their own
work activities, with sufficient knowledge and power to influence both processes and
outcomes to achieve desirable goals”. The workgroup team (which might include
consultants) is expected to identify problems, plan, evaluate and implement changes (Haukka
et al., 2010). As a supplementary approach, PE was found to improve the implementation of
existing ergonomics programs (Driessen et al., 2010). Other studies found that PE was
beneficial (Straker et al., 2004; Cristancho, 2012; Rivilis et al., 2008). Cristancho’s (2012)
study on female cashiers, examined participatory ergonomics by understanding the nature of
companies; work team creation, training of work teams, and decision-making and intervention
processes. They reported that PE reduced problems such as mental fatigue, discomfort etc.
Rivilis et al., (2008), in their systematic review found that 11 of the 12 medium to high
quality studies reported evidence on the effectiveness of participatory ergonomics.
However, some studies have found no significant effect of PE in reducing WRMSD (Haukka
et al., 2010, Driessen et al., 2011). In one study, it was concluded that there was no evidence
of the reduction of WRMSD, but that the participatory ergonomics intervention was beneficial
in encouraging the workers to improve the ergonomics in their workplace (Haukka et al.,
2010). They suggested that there is a need to have a longer follow-up (more than 1 year) to
observe the effect of WRMSD interventions. Driessen et al. (2010) found that facilitating
factors in PE program implementation were participation and cooperation between teams and
stakeholders.
2.2.4.2.2 Organisational/ Psychosocial Approach
Behaviour Based Safety (BBS) may be regarded as a supplementary approach. It relies on
regular feedback from the manager. Hopkins (2006) stated that the benefit of a safe behaviour
program depends on the management commitment. Changes in management culture are
recommended. Managers should change their leadership behaviour, for example, by giving
support, encouragement, and feedback to workers.

34
Various BBS intervention elements have been applied to workplaces such as feedback, goal
setting, training, inspections, incentives, cash rewards, posters, empowerment, social
networking, accountability, and safety direction (Hikman and Geller, 2003, Al-Hemoud and
Al-Asfoor, 2006, Laitinen et al., 1997, Krause et al., 1999).
However, debates persist in terms of the effectiveness of these programs, where some studies
found BBS successful, while others found it unsuccessful. The weaknesses of BBS approach
are a short- lasting effect (Ray et al., 1993) and a partial effect on several tasks categories
(Lingard and Rowlinson, 1997). Moreover, BBS may be less effective if only one element of
BBS is implemented in the work place (Ray et al., 1997). Therefore, in order to have
sufficient results from the BBS method, the implementation of multiple elements of BBS
should be considered.
There is evidence supporting the effectiveness of BBS using multiple approaches such as
safety self management techniques, training, incentive/ reward and feedback (Hikman and
Geller, 2003); behaviour safety education/training, performance feedback, and Critical
Behaviour Checklist (CBC) observations (Al-Hemoud and Al-Asfoor, 2006); workers and
employers participation and safety performance feedback (Laitinen et al., 1997); employee
training, and observation and feedback (Krause et al., 1999). A study of a single approach
using only safety training showed that it did not alter safety behaviour. However, after
combining it with other approaches, i.e. feedback and goal setting, the safety performance
indicator increased significantly (Ray et al., 1997).
A long-term study of the behaviour based safety method using multiple elements, found that
the average reduction of the injury incident rates from the baseline were 26% in the first year
with an increase to 69% by the fifth year (Krause et al., 1999). Therefore, there is evidence
that implementing multiple elements of BBS is more effective than only applying one element
of the BBS. Besides the multiple elements of BBS, other factors that may affect its success
include managers’ and workers’ commitment toward safety (Laitinen et al., 1997, Podniece,
2008).
35
2.2.4.2.3 Stage of Change Approach
Another supplementary approach is based on a Stage of Change (SOC) construct. This
approach has been previously used to reduce individual health risk. A detailed explanation of
the stage of change approach is presented in Section 2.3.
In conclusion, it is clear from the evidence presented in this review that WRMSD aetiology is
complex and to adequately reduce the numbers of WRMSD a multifactorial approach is
needed. A European systematic review on MSD preventions found that “There is moderate
evidence that a combination of several kinds of interventions (multidisciplinary approach)
including organisational, technical and personal/ individual measures is better than single
measures. However, it is not known how such interventions should be combined for optimal
results” (Podniece, 2008; p.7). Other supportive factors for the successful workplace
intervention identified by Podniece (2008) were a participatory approach, management
support, and tailoring interventions based on the specific workplace conditions.
In fact the more multiple approaches involved in the prevention program, the more costly it is,
and therefore the cost/benefit analysis should be undertaken before planning such prevention
programs (Podniece, 2008). Thus, the economic issues should also be considered when
planning for WRMSD intervention (Feuerstein and Harrington, 2006, Burdorf, 2007).
Supporting research from Macdonald and Evans (2006) point out that “... the tendency is for
organisations to implement changes themselves and to select from the recommendations
which are the least expensive or easiest changes.” (Macdonald and Evans, 2006, p.66).
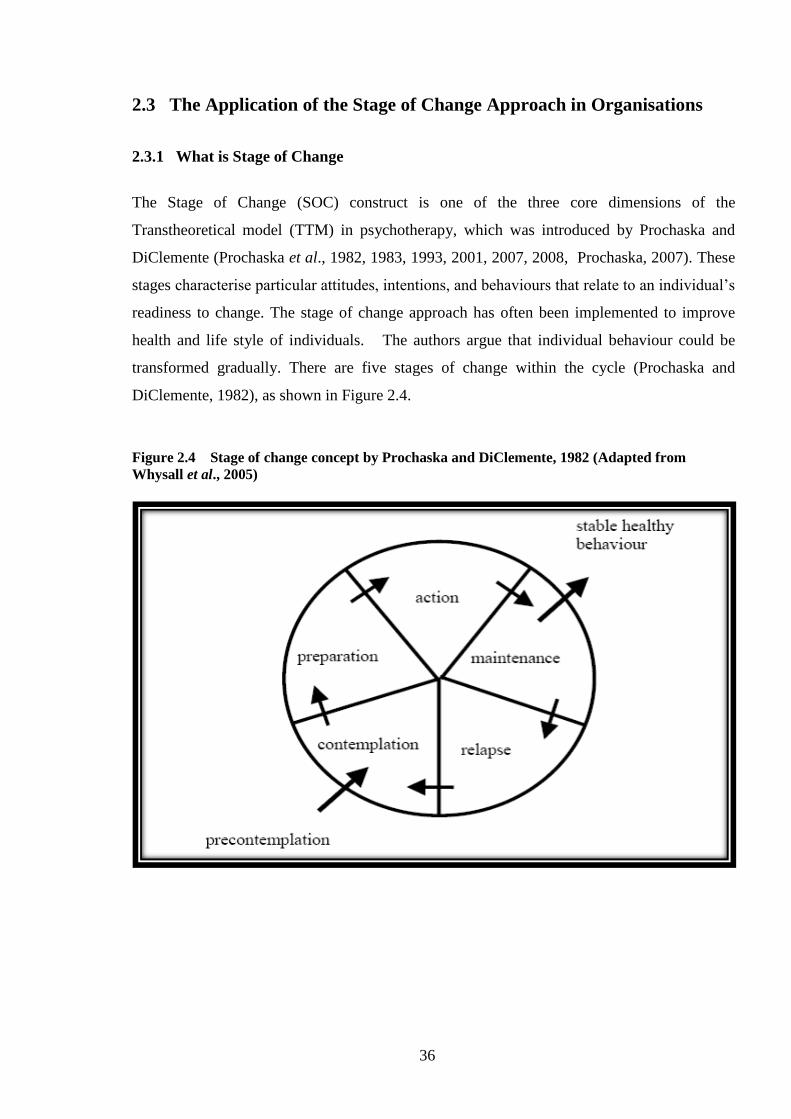
36
2.3 The Application of the Stage of Change Approach in Organisations
2.3.1 What is Stage of Change
The Stage of Change (SOC) construct is one of the three core dimensions of the
Transtheoretical model (TTM) in psychotherapy, which was introduced by Prochaska and
DiClemente (Prochaska et al., 1982, 1983, 1993, 2001, 2007, 2008, Prochaska, 2007). These
stages characterise particular attitudes, intentions, and behaviours that relate to an individual’s
readiness to change. The stage of change approach has often been implemented to improve
health and life style of individuals. The authors argue that individual behaviour could be
transformed gradually. There are five stages of change within the cycle (Prochaska and
DiClemente, 1982), as shown in Figure 2.4.
Figure 2.4 Stage of change concept by Prochaska and DiClemente, 1982 (Adapted from
Whysall et al., 2005)
37
- Pre-contemplation Stage: This is resistance to recognising or modifying problem
behaviours. Pre-contemplation persons are unaware of their own problems or the risks
associated with a particular behaviour. In order to make a change, the pre-contemplators need
to understand and be aware of the problem.
- Contemplation Stage: This is the recognition of the problem with thinking about changing
but not yet ready to act. To make a forward change, persons need to decide to make a
movement.
- Preparation Stage: (This is defined as intending to change in the next 30 days, and/or
having made specific plans to do so). This stage is a combination of individual intention and
behaviour. Some persons may have made small, but inadequate changes. To move forward
they need more relevant goal directives to handle their problems.
- Action Stage: This is described as having engaged in behaviour change, within the last six
months. Individuals in this stage have made significant change to overcome their problem.
However, they may still need skills to solve the problem.
- Maintenance Stage: In this stage, the person has initiated changes more than 6 months ago
and is working to consolidate gains made in order to avoid relapse.
This does not mean that during the maintenance stage no further changes are made. Rather
individuals make an effort to prevent relapse.
If the person does not successfully initiate change, then they may remain in the current stage
or revert back to the lower stages. Even though the individual has reached the action or
maintenance stage, he or she could still relapse to the lower stages (Prochaska and Norcross,
2007).
A person may use many distinct change processes (Prochaska et al., 1995 in Prochaska and
Norcross, 2007). There are ten processes of change based on empirical studies (Figure 2.5),
as follows: consciousness raising, catharsis/dramatic relief, self re-evaluation, environmental
re-evaluation, self-liberation, social liberation, counter-conditioning, stimulus control,
contingency management, and helping relationship (Prochaska and Norcross, 2007, Adams
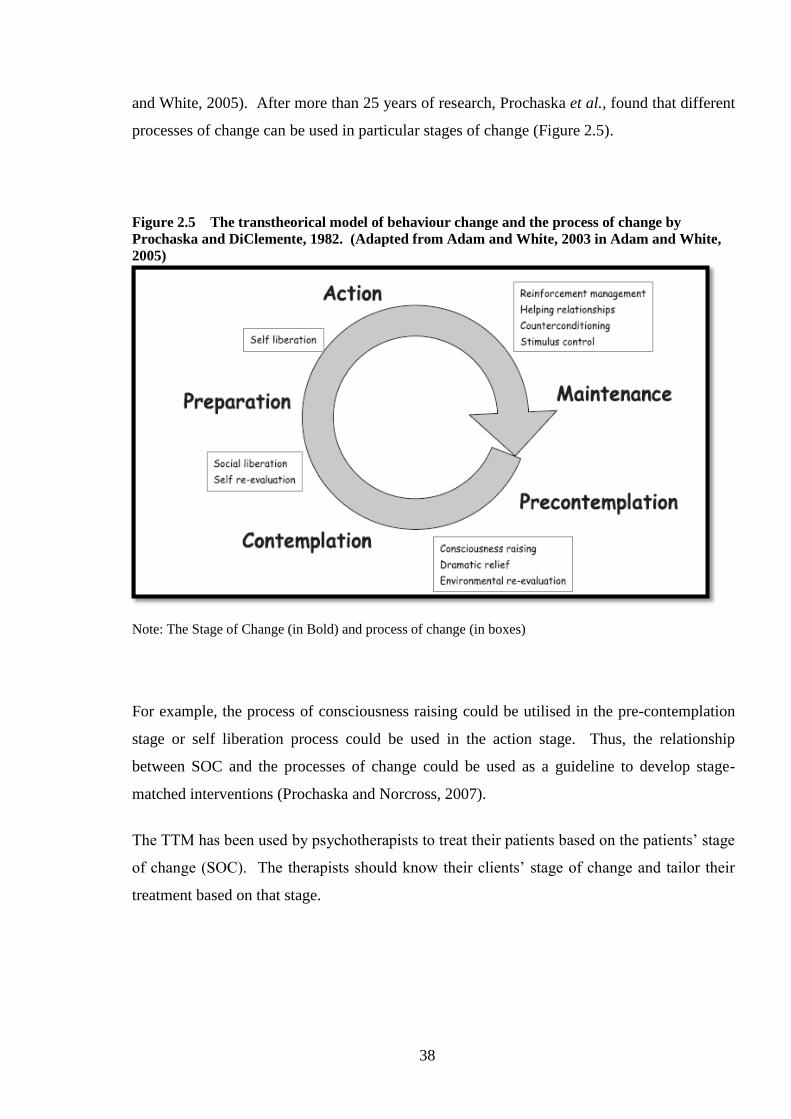
38
and White, 2005). After more than 25 years of research, Prochaska et al., found that different
processes of change can be used in particular stages of change (Figure 2.5).
Figure 2.5 The transtheorical model of behaviour change and the process of change by
Prochaska and DiClemente, 1982. (Adapted from Adam and White, 2003 in Adam and White,
2005)
Note: The Stage of Change (in Bold) and process of change (in boxes)
For example, the process of consciousness raising could be utilised in the pre-contemplation
stage or self liberation process could be used in the action stage. Thus, the relationship
between SOC and the processes of change could be used as a guideline to develop stage-
matched interventions (Prochaska and Norcross, 2007).
The TTM has been used by psychotherapists to treat their patients based on the patients’ stage
of change (SOC). The therapists should know their clients’ stage of change and tailor their
treatment based on that stage.

39
2.3.2 Evidence of the Effectiveness of ‘Stage of Change’ Approach to Individual
Behaviour
A large number of studies have been conducted to evaluate the Transtheoretical model (TTM)
during the last two decades (Prochaska and DiClemente, 1983, 1982, Prochaska, 2008,
Prochaska et al., 1993, King et al., 1996).
Examples include the case of smoking (Prochaska and DiClemente, 1983, King et al., 1996,
Nierkens et al., 2006), alcohol drinking habits (Smith and Tran, 2007), eating disorders
(Hasler et al., 2004), and weight management (Johnson et al., 2008). Some studies had
unconvincing evidence for the effectiveness of the SOC strategy such as the study of young
adult smokers (Quintlan and McCaul, 2000). The study found that more participants in the
mismatched intervention group than in matched intervention group tried to quit smoking and
advanced at least one stage; hence Quintlan claimed that stage-matched intervention was less
important, particularly for those who are pre-contemplators (Dijkstra et al., 1998 in Quintlan
and McCaul, 2000, Prochaska et al., 1993). In addition, Prochaska (2007) found that studies
used a partial set of TTM variables (such as SOC, pros and cons and self-efficacy) were less
likely to have significant results than those who used all TTM variables.
Conversely, most studies have found this SOC approach to be successful. For example, stage
matched interventions were identified with increasing the chance of smoking cessation
(Prochaska et al., 1993, DiClemente et al., 1991), changes in drinking habits (Carlo, 2007),
and tailored feedback to improve healthy eating, improve exercise, manage emotional distress
and weight (Johnson et al., 2008). Additionally, it has been used in the treatment of eating
disorders (Hasler et al., 2004). Stage matched tailored interventions have also been found to
increase mammography uptake among women aged 40-74 (Rakowski et al., 1998).
Evidence for the usefulness of this SOC approach at the individual level was found in many
studies. The SOC approach might be also potentially effective to change workers’ and
managers’ behaviour toward better safety performance in workplaces. Unfortunately, only
few studies of SOC identified in the literature review that have been implemented in
workplace.
40
2.3.3 Evidence for the Effectiveness of the ‘Stage of Change' Approach in
Organisations
There is no Cochrane Review of evidence for TTM in the workplace. Only a few studies have
examined the implementation of the stage of change approach in workplaces. Even though
this method has mostly addressed individual behaviour change, conceptually and practically,
the SOC construct can be applied to other areas including organisational behaviour (Urlings et
al., 1990, Prochaska et al., 2001), for example, encouraging managers’ commitment,
increasing workers’ participation, and increasing intention to change.
It has been argued that stage matched interventions are not practical since there is potentially
a big variability of SOC among workers or managers within organisations (Berry et al.,
2007). However, findings from a case study in a manufacturing company provide support for
the applicability of the TTM (Barrett et al., 2005, Haslam, 2002). The authors believed that
the SOC approach could be used as an ergonomics tool.
A recent longitudinal study in the UK (Whysall et al., 2006, Whysall et al., 2005, Whysall et
al., 2007) has implemented the SOC approach to reduce WRMSD in a range of organisations.
It was thought that by targeting the attitudes, beliefs, and behavioural intentions that support
an individuals’ SOC, the stage-matched approach could increase the uptake, implementation,
and maintenance of the WRMSD preventive measures (Shaw et al., 2007).
Their first study developed the SOC tool to measure worker and manager SOC with regards
to MSD prevention, and assessed its applicability to workplaces (Whysall et al., 2005, 2007).
The SOC approach was assessed within different occupational sectors and it was found that
this approach had high validity and reliability. They also noted that advanced SOC was
related to MSPD within the previous 7 days. One of their comments regarding this result was
that the experience of MSPD has a short term effect on workers ‘risk-reducing behaviour’ and
therefore the workers need to be encouraged to maintain such behaviour (Whysall et al.,
2007). Another finding of Whysall et al (2007) was that the managers were more likely to
report that the action had been taken, than the workers.

41
They argued that either the managers were over-reporting the changes had been made, or the
workers had not recognised or were unaware of the changes.
The second study was the assessment of the effectiveness of SOC approach to reduce the
MSPD, within 4-6 months (Whysall et al., 2006) and 15-20 months following stage-matched
interventions (Shaw et al., 2007). Sixteen organisations participated in their 4-6 months
intervention study with a total of 384 participants in the baseline survey and 304 participants
in the follow-up survey. Twenty-four interventions were monitored, 13 standard
interventions and 11 tailored (stage-matched) interventions. For the tailored interventions,
mangers were provided with recommendations, to be subsequently implemented with the
workgroups surveyed. Thus tailored groups received specific advice based on a stage-matched
framework (Velicer et al., 1998; Whysall et al., 2006). See Table 5.1 in Chapter 5 for details.
On the other hand, the standard groups participated in the company’s previously planned
interventions.
The allocation of the workgroups to either standard or tailored intervention was “alternately,
in the order that they were recruited”, and aimed to avoid selection bias (Whysall et al., 2005,
p.19). Tailoring of the intervention was done according to the stage for the majority of
workers. This approach was based on the evidence that workers SOC profile was relatively
similar within the organisation but different between organisations (Whysall et al., 2006,
2007). Several outcome measures were used in this study to evaluate the effectiveness of the
SOC approach, including: MSPD in the last 7 days, MSPD severity rating and stage of
change.
Findings at 6- months follow-up found that in the tailored group there was a slightl reduction
in the proportion of workers who reported undifferentiated MSPD following the
implementation of stage matched intervention (80% to 73%). However there were significant
reductions in the percentage of workers having musculoskeletal pain in several specific body
areas including in upper arm, elbow, forearm, wrist, hand, lower back, and leg.
42
In addition there were significantly fewer workers in pre-contemplation (χ2 (1) = 4.27; p <
0.05), and preparation stage (χ2 (1) = 20.83; p < 0.002) and significantly more workers in the
action (χ2 (1) = 24.16; p = 0.001), and maintenance stages and (χ2 (1) = 21.29; p = 0.001).
The authors claimed that the tailored intervention was important to reduce MSPD,
encouraging advancement through SOC and in helping changing behaviour (Whysall, et al.,
2005, 2006). Based on their post intervention interviews the most cited barrier to intervention
implementation was the difficulty in gaining senior management authorisation for the
intended changes. However positive support from employees and effective communication
within the company were enablers (Whysall et al., 2005).
The third study was the 15-20 months follow-up (Shaw et al., 2007). The methods were
similar to those in the 6 month intervention study. At 15 months post-intervention the
findings for tailored interventions showed that there was a significant reduction in workers
who reported musculoskeletal discomfort in some specific body areas including the neck,
shoulder, upper arms, elbows, forearms, wrist, hand, upper back, lower back and legs
compared to pre-intervention. There were also significantly fewer workers in the pre-
contemplation stage (χ2 (1) = 8.58; p < 0.003) and preparation stage (χ2 (1) = 30.2; p <
0.001), compared to pre-intervention (Shaw et al., 2007).
At 20 months post-intervention the tailored group showed a significant reduction in the
number of workers experiencing discomfort (compared to pre-intervention) in the neck,
shoulder elbow, forearm, wrist, hand, lower back and legs. There were also significantly
fewer workers in preparation (χ2 (1) = 14.2; p < 0.001) and significantly more in action
(χ2 (1) = 8.84; p = 0.003) and maintenance (χ2 (1) = 11.57; p = 0.001) compared to pre-
intervention.
Thus, there is evidence that a SOC approach might be useful for the prevention of WRMSD if
applied in the workplace setting. However, this approach needs to be further researched.
Additionally, factors that may influence the implementation of SOC-based interventions in
workplace settings need to be further assessed.
43
2.3.4 Factors that May Influence a ‘Stage of Change’ Approach in Organisations.
Several factors may affect the application of SOC approach in workplaces, and in turn
influence its effectiveness to improve health and safety performance. The factors including:
knowledge about SOC, manager and workers support and commitment or organisational
safety culture and the assessment and application of SOC in the workplace.
In practice, people who are not familiar with behaviour change in an organisation might not
undertake it appropriately (Winum et al., 1997 in Barrett et al., 2005). Thus, it may be
necessary to provide information about behaviour change to stakeholders within an
organization, before the implementation of the SOC approach begins.
Another factor that is also important is organisational support in terms of a strong
commitment from managers and employees (Harris and Cole, 2007). In practice in a
workplace, workers’ and managers’ behaviour may be influenced not only by an individual’s
attitudes and beliefs, but also by co-workers and the social climate in the organisation (Barrett
et al., 2005). Barrett’s study on SOC assessment also found the importance of encouraging
senior and middle management commitment toward health and safety issues, and improving
communication and motivation amongst workers (Barrett et al., 2005). Therefore, without
strong organisational support and commitment concerning safety, it may be hard to change
workers’ and managers’ behaviour towards a better safety performance. Furthermore, the
ability of the organisation to apply the SOC strategy and the readiness of stakeholders to
change should also be taken into account (Armenakis et al., 1993 in Barrett et al., 2005).
Consequently, the authors have recommended matching the prevention method based on
stakeholders’ SOC and implementing the change strategy based on individuals’ role and
levels within the organization (Barrett et al., 2005). For example, the change approach for
managers should be differentiated from the approach for the workers. Relatedly, Berry et al
(2007) used different questionnaires to assess the individuals’ and organisation’s level of
SOC. Similarly, Whysall et al. (2007) developed different SOC questionnaires for managers
and employees.

44
According to Prochaska (2001) the stage-matched intervention can be implemented,
individualised and matched to workers’ readiness to change. It also provides the opportunity
to workers to contribute in the change process. However, it might be difficult and inefficient
to apply the intervention at individual levels in the workplace, since it will need considerable
time and cost. A practical way might be to base the intervention on the majority stage, which
the workers exist in, for a workgroup (Whysall et al., 2005, Levesque et al., 2001).
2.3.5 Other Criticisms of the Stage of Change Approach
Prochaska and DiClemente’s Transtheoretical model states that people have different change
processes within different stages of behaviour change (Prochaska and Norcross, 2007)
(Figure. 2.5).
In the studies on smoking cessation, cognitive-affective processes are mostly used in the
contemplation and preparation stages, whereas behaviour processes are mostly used in the
action and maintenance stages (Prochaska, 1992 in (Rosen, 2000)). However, a meta analysis
of 47 studies found that the change processes within stages were inconsistent amongst health
problems (Rosen, 2000). In Rosen’s study, for example, in exercise and diet change, the
behavioural and cognitive processes increased together, whereas in substance abuse both
processes were inconsistent. Thus, the author suggested that researchers and clinicians should
not generalise the association between the change process and stage across health problems
(Rosen, 2000). However, these studies reviewed by Rosen were cross sectional studies, so
they are descriptive and have less power to prove causality.
There has been criticism regarding the method of assessing SOC. In order to assess and
evaluate the SOC construct, Weinstein et al., (1998) have developed a framework as follows
(cited in Herzog, 2008, p.549): 1). Stages should consist of qualitatively different and
mutually exclusive categorise, 2). There should be a specified ordering of the categories, 3).
There should be similar barriers to change for individuals within each stage, 4). There should
be different barriers to stage transition between people in the different stages. However,
Herzog (2008) found that the TTM stage of change does not match the framework developed
45
by Weinstein et al. (1998). For instance, the SOC algorithm has illogical time frames of 6
months and 30 days, and questionable reasons to justify these time frames (Sutton 2005 in
Herzog, 2008).
The timing of changes in an organisation is under the authority of the manager or employer
(Senge et al., 2007). Consequently, workers might have limited opportunity to implement
workplace change. Therefore, it is important for researchers to precisely and efficiently
assess the stages in order to improve the application of the SOC approach (Weinstein et al.,
1998). An important way to make the SOC model useful in developing interventions is to
recognise the specific factors that make people move forward to the next stage (Weinstein et
al., 1998).
Barrett et al. (2005) claimed that the SOC approach can be used as an ergonomics tool, which
can provide an initial understanding of individuals’ attitudes and beliefs within an
organisational level but the effectiveness is only for short timeframes. He suggested the need
for further longitudinal studies to assess the long-term effectiveness of the organisation’s
intervention using SOC approach (Barrett et al., 2005). In Barrett’s case study, it was found
that the companies’ upper and middle management needed to increase their commitment to
make changes and the workers should be encouraged to have a good communication and
motivation. Prochaska stated: “change in individual organisation member’s behaviour is the
core of organisation change” (Prochaska et al., 2001 p.248).
Overall, it can be concluded that there is evidence to support the effectiveness of SOC
approach but further empirical studies in the workplace are required.
2.4 Research Gaps
Many studies have looked at WRMSD and risk factors. However, few studies have examined
precursor MSPD and its risk factors in a holistic manner, i.e. looking at individual,
organisational, psychosocial and biomechanical/physical factors. No such studies appear to
have been published in the Australian context.

46
There is also a paucity of Australian WRMSD prevention intervention studies. “Despite
musculoskeletal disorders being a highly prevalent occupational disease, there is a little
information in Australia on the burden of these disorder, other than estimates based on
workers’ compensation datasets” (Macdonald and Evans, 2006, p.33).
The SOC approach appears to have merit in increasing the acceptance of WRMSD prevention
measures in an organisational setting. The only longitudinal research for SOC in workplaces
has been carried out in the UK (Whysall et.al., 2005). This research has limitations in that it
reported the effectiveness of the SOC approach using basic statistical methods, rather than
advanced methods suitable for intervention trials. It also did not assess worker perceptions of
the implementation of the interventions.
2.5 Research Objectives and Research Questions
Based on the research gaps, there is a need for a longitudinal study of the SOC approach in an
Australian context. A broad set of risk factors and advanced statistical methods should be
used to compare interventions based on the SOC approach with interventions based on
conventional advice to management (i.e. without consideration of SOC). Reported MSPD
would be a practical outcome measure.
The following research objectives and broad research questions were developed.
47
2.5.1 Research Objectives
1. Determine the prevalences of MSPD and the relationships between MSPD and individual
and occupational/organisational factors in a range of South Australian workplaces.
2. Evaluate the effectiveness of interventions using the SOC approach by observing the
change in MSPD.
3. Evaluate the process of the implementation of the interventions based on workers’
perceptions.
2.5.2 Research Questions
1. What is the prevalence of MSPD in a sample of South Australian workplaces?
2. What are the correlates of the reported MSPD?
3. What are the prevalences of MSPD before and after SOC (stage-matched) interventions
and standard interventions? What are association between the risk factors and the
changes in MSPD?
4. Is a tailored intervention using the SOC approach effective in reducing MSPD in South
Australian workplaces compared with the standard intervention (based on conventional
ergonomics advice to management)?
5. What are the workers perceptions of the intervention implementation, comparing the
Tailored and Standard interventions?
48
CHAPTER 3
THE BASELINE SURVEY: THE PREVALENCE OF
MUSCULOSKELETAL PAIN/DISCOMFORT AND ITS ASSOCIATION
WITH INDIVIDUAL, OCCUPATIONAL AND ORGANISATIONAL
CHARACTERISTICS
3.1 Introduction
3.1.1 Overview
This chapter describes the baseline survey, which was aimed at answering the first two
research questions given in Chapter 2, Section 2.5.2. This survey used a similar method as in
the UK study (Whysall et al., 2005) with some modifications in terms of the questionnaire,
mode of administration, and additional questions and variables such as job satisfaction,
workload, and vibration. A new variable, “severe pain” was created, based on the Likert scale
for discomfort in the UK questionnaire.
Thus, this chapter reports on the observed prevalence of MSPD and the relationships between
MSPD and other variables.
The findings show the musculoskeletal pain is common in South Australian workplaces and
that psychosocial factors are associated with MSPD.
The next Chapter 4, reports on the follow-up survey, which enables comparisons of MSPD
and other variables over two time periods.

49
3.1.2 Research Questions
The two research questions can be broken down into more specific questions as detailed
below:
1. What is the prevalence of MSPD (Undifferentiated MSPD in the last 7 days, severe MSPD,
and MSPD in various body parts) in a representative sample of SA workplaces?
2. What is the association between MSPD (undifferentiated MSPD, severe MSPD, neck
MSPD, shoulder MSPD and lower back MSPD) and other variables, including:
• Individual characteristics
o Age
o Gender
o English/Non English Speaking Background (ESB/NESB)
• Occupational characteristics
o Tenure (length of employment)
o Workload
o Vibration exposure
o Job satisfaction
o SOC
• Organisational characteristics
o Safety climate
o Company size
o Company type

50
3.2 Method
This section describes the study design, recruitment, survey instrument, research
procedure, statistical analysis methods, and a pre-survey pilot study.
3.2.1 Study Design
This baseline survey is a conventional cross sectional study, assessing the prevalence of self-
reported MSPD and the relationships between MSPD and selected risk factors.
3.2.2 Sampling for the Baseline Survey
For practical reasons, a purposive sampling method (Quine, 1998) was carried out to recruit
workplaces. The choice reflected MSD claims experience from WorkCover SA
(WorkCoverSA, 2007) and included community services and manufacturing (Table 1.1 and
1.2 in Chapter 1). Companies were recruited by advertisement and invitation from lists of
businesses, predominantly located in metropolitan Adelaide. Small to large size companies
(Australian Bureau of Statistics, 2002) were invited to participate in this study by sending
letters or making phone calls.
The inclusion criteria for a company were (1) having definable workgroups with at least 10
workers in each workgroup1 (Jehn and Bezrukova, 2004), and (2) planning to introduce
interventions to reduce MSD. The inclusion criteria for individual workers at each company
were (1) being employed on an ongoing basis, (2) having similar roles to each other within
the workgroup, enabling comparison of similar risk of MSPD, and (3) having sufficient
English language skills.
1 “Workgroups” followed the definition of Jehn and Bezrukova - “they interacted on a day to day basis, were
task interdependent, identified each other as group members, and were seen by others as workgroups” (Jehn and
Bezrukova, 2004. p.711)
51
These inclusion criteria were discussed with the companies who agreed to participate.
However, participation of the workers was voluntary and based on their availability. If they
agreed to participate, workers were asked to sign the appropriate ethics consent form (see
Appendix 2b).
A total of 206 companies were invited to participate in this study. Of these, 62 companies
were interested, 25 companies refused to participate, and 119 did not respond. Of the 62
companies interested 54 companies were eligible, but only 23 companies participated.
Several reasons for refusal were given such as are not being interested, company restructuring
/ relocation, too busy, satisfied with current OHS systems, participating in other research, and
workers were not interested. See Figure 3.1 for a breakdown of recruitment information.
Each participating company had one to three workgroups participating in this study. Overall,
this baseline survey consisted of 29 workgroups from 23 companies (medium to large
companies) with 406 workers.
There were no small companies (i.e. less than 20 workers) in the study, as those that were
interested either did not fulfil the criteria of intending to introduce interventions to reduce
MSD or having definable workgroups with at least 10 workers in each workgroup.
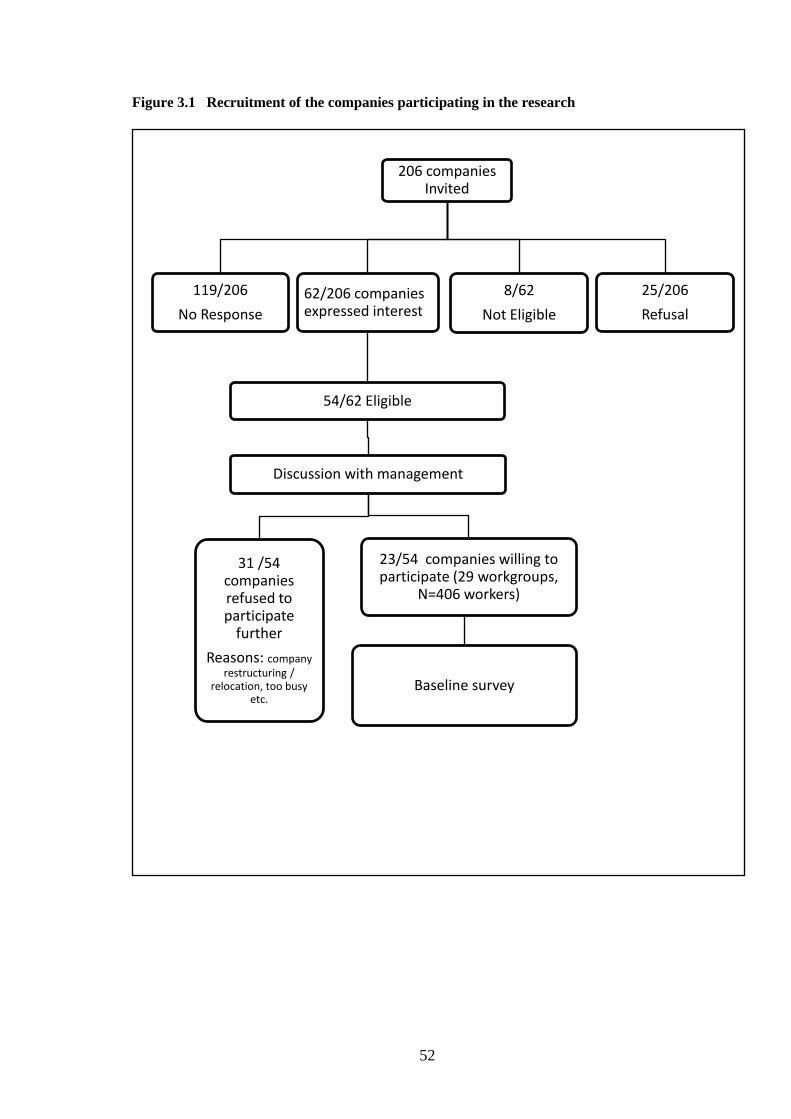
52
Figure 3.1 Recruitment of the companies participating in the research
206 companies Invited
119/206
No Response
62/206 companies expressed interest
54/62 Eligible
Discussion with management
31 /54 companies refused to participate
further
Reasons: company restructuring /
relocation, too busy etc.
23/54 companies willing to participate (29 workgroups,
N=406 workers)
Baseline survey
8/62
Not Eligible
25/206
Refusal
53
3.2.4 Survey Instrument
The survey instrument comprised several questionnaires (see Appendix 1) namely:
A questionnaire was adapted from Whysall and Haslam’s study in 2005 (Whysall et al.,
2005), which assessed MSPD within the last 7 days, safety climate and stage of change.
A job satisfaction questionnaire was also included. This was adapted from that developed by
Warr (Warr et al., 1979, Lu et al., 2012, Fatimah et al., 2012).
Thus, the questionnaires for workers consisted of five parts, namely:
- Demographic/individual information
- Musculoskeletal pain or discomfort (with body chart)
- Employees’ safety climate checklist
- Stage of change (SOC) assessment
- Job satisfaction scale
Before using the questionnaires they were piloted with three companies with 50 workers.
Based on the result of the pilot study, minor changes in the SOC component were made, but
otherwise the survey instrument was unchanged. The pilot study is described in Section
3.2.7. These questionnaires were utilised for both the baseline and follow-up surveys.
The questionnaire set was administered face to face within a private room in each worksite.
3.2.4.1 Demographic Information
The following demographic/individual information was collected: age, gender, position held
in the company, and length of employment, working hours, and English speaking background
(ESB/NESB).
54
3.2.4.2 Musculoskeletal Pain and Discomfort Questionnaire
The self-reported prevalence of MSPD was assessed by asking about any musculoskeletal
pain/discomfort in the last 7 days, pain at particular body areas, and the pain severity of each
body area (Appendix 1e) (Whysall et al., 2005, Shaw et al., 2007, Village and Ostry, 2010).
The body map of musculoskeletal discomfort and severity rating as originally developed by
Corlett and Bishop (1976) was used. Even though, the original questionnaire by Corlett and
Bishop (1976) only assessed the discomfort, the authors stated that the major component of
discomfort is bodily pain as an effect of the involvement of postural, effort and environment
factors. Additionally, they measured the level of pain for assessing postural discomfort. A
range of researchers have administered the modified questionnaire using ‘pain or discomfort’
to assess musculoskeletal problem in workplaces (Whysall et al., 2005, Shaw et al., 2007,
Village and Ostry, 2010).
The dichotomous variable of severe pain (see Table 3.3 later) was obtained by considering the
workers’ MSPD severity level on the Likert scale. The points of 5, 6, or 7 were defined as
severe MSPD and points of 1, 2, 3, or 4 as non-severe MSPD.
3.2.4.3 Safety Climate Tool
The safety climate assessment tool consisted of 18 questions (Cox and Cheyne, 2000), asking
about the workers’ perception of the safety climate in the workplace (Appendix 1c). The
answers used a 5-points Likert scale; from strongly disagree to strongly agree (Table 3.3).
The individual’s total score of safety climate and the nine safety climate dimensions were
derived. The total score was obtained by adding the scores of the 18 safety climate items,
after reversing the scores of some negatively worded questions. Since, the safety climate used
5 points scale; each item’s score was subtracted from 6 to reverse the scoring. For example, a
score of 4 on the negative wording item became a score of 2.

55
The dimensions of safety climate were obtained by undertaking several steps. Firstly,
negatively worded items were reversed and the scores averaged over all participants.
Secondly, the average score of each item was standardised by converting the score to a 1 to 10
scale, to allow the comparison of the safety climate dimension scores (Cox and Cheyne,
2000). Table 3.1 presents an example for calculation of the safety climate dimensions score.
For example, the dimension of “Management Commitment” comprised item SC1 (average
score 4) and SC2 (average score 2) and the possible total score is 10.
The formula is
Therefore, the score of safety climate dimension of management commitment is six.
Table 3.1 Example of the calculation of safety climate dimension score.
Dimension Average Add Divide by Multiply
by
Score
Management
Commitment
Item SC1 & SC2 Item SC1 + item SC2 10 10
Personal appreciation of
risk (contains items
with negative wording)
Item SC15 & SC16 (6-Item SC15)+ (6-
item SC16)
10 10

56
3.2.4.4 Stage of Change (SOC) Assessment
The SOC questionnaire (Appendix 1b) was adapted from the previous UK study (Whysall et
al., 2005). Before using the questionnaire of SOC, it was modified according to the
recommendation of Shaw et al. (2007).
Table 3.2 The workers’ SOC assessment, adapted from Whysall et al. (2005).
Stage Question item/s Question change Assessment
Precontemplation Are you concerned
about developing
musculoskeletal
problems from your
work?
no change No = Precontemplation,
Yes = next question
Contemplation Do you think changes
should be made to
reduce the risk of
musculoskeletal
problems from your
work in the next 6
months?
Compile the
contemplation and
preparation: Do you
think changes
should be made to
reduce the risk of
musculoskeletal
problems from your
work in the next few
months?
No = Precontemplation
Yes= next question
Preparation Do you think changes
should be made in the
next month or two? Do
you have any specific
suggestions for changes
that would reduce the
strain of your work?
Action Are you doing or have
you done anything to
reduce the risk? If so,
how long ago did you
make these changes?
no change No = Contemplation/
Preparation
Yes - less than 6 months =
Action
Yes-more than 6 months=next
question
Maintenance If more than six months
ago, do you intend to
do anything more?
no change No= go to the first question and
start again. Yes = Maintenance
57
The modification involved combining the contemplation and preparation stages questions
without stating the time of intention of making changes (Table 3.2). The difference
between the two stages was on the timing of the changes, which is considered essential.
Shaw et al. (2007) suggested that there were effectively two groups in the earlier stage or
non-action stage, namely: Precontemplation group (those who do not recognise the health
problem and do not considering change) and Contemplation/Preparation (those who do
recognise the problem and are considering making change) (Shaw et al., 2007). They found
that simplifying the stage is a rational approach, which may improve the implementation of
the intervention in an organisational context.
Similarly, the workers responses to the SOC questions in the pilot study indicated that the
timing of change was inappropriate. Some of them thought that the decision of making
change in the company, including the timing of making change is the employer’s
responsibility. Therefore, in this study the SOC only consists of 4 stages: precontemplation,
contemplation/preparation, action, and maintenance. Table 3.2 presents the questions
for assessing worker’s SOC (Whysall et al., 2005) and the modification of the questions for
the contemplation and preparation stages.
3.2.4.5 Job Satisfaction Questionnaire
The job satisfaction questionnaire was developed by Warr et al. (1979) and has been used in
other studies (Fatimah et al., 2012, Lu et al., 2012). Job satisfaction assessment had 16
questions. The details of job satisfaction questions 1 to 16 can be seen in Table 3.3 (or
Appendix 1), with a 7-point Likert scale, from extremely dissatisfied to extremely satisfied.
To ensure that the job satisfaction scale was appropriate for the study, reliability and
confirmatory factor analysis was performed on the 15-item scale. As shown in the Appendix
3a, the overall Cronbach’s alpha for the scale was 0.89, above the conventional level of 0.80
indicating acceptable reliability. In addition, individual item alpha values were 0.88 or above.
This indicates that none of the 15 items substantially reduces the reliability of the scale as a
whole; all items are contributing to the high reliability.
The underlying factor structure of the job satisfaction data was examined as well. Warr et al.
(1979) reported that either a 2- or 3-factor solution was appropriate for the scale. A

58
confirmatory factor analysis with correlated factors for both the 2- and 3-factor solutions was
run. Results are presented in the Appendix.3b. Analysis was performed using Stata/SE
13.1.
As indicated, both solutions showed adequate fit, with the 3-factor solution showing evidence
of good fit (RMSEA=0.059, 95%CI 0.04-0.07; CFI=0.95; TLI=0.93). In addition, all items
loaded highly on the factors defined by Warr et al. (1979). There was no evidence that factor
structure of the job satisfaction scale differed from that described by Warr et al. (1979).
The overall job satisfaction question (Now, taking everything into consideration, how do you
feel about your job as a whole?) was predominantly used in this study, because it assesses the
workers’ overall feeling towards their job. Warr et al. (1979) also indicated in their paper that
researchers using job satisfaction data could decide whether a total score or individual sub-
scale scores could be used.
“The choice of the complete scale or subscales in any investigation will depend upon the
degree of specificity, which is required. The subscales are strongly intercorrelated, and they
are of course statistically associated with the full scales of which they are a part.” (Warr et
al., 1979, p.136).
3.2.4.6 Workload and Vibration Assessment
A professional ergonomist was engaged to carry out onsite-observation for the tasks at the
participating companies. Based on the task observation, the ergonomist categorised the
workload based on the tasks carried out in each work group and matched them to the physical
demand categorisations defined for each job title in the Dictionary of Occupational Titles
(DOT) (Cain and Treiman, 1981, Miller et al., 1980, Fletcher et al., 2011, Lee and Chan,
2003, National Academic Science Committee on Occupational Classification and Analysis,
2003). The presence/absence of vibration was also determined by observation of the majority
of tasks undertaken in each workgroup. Where there was a difference between the workload
classification of the job title defined in DOT and what was observed, the workload was
assigned on the basis of the observed task.
59
Then definition of workload was made based on Physical Demand definitions from the
Dictionary of Occupational Titles (U.S. Department of Labor: Dictionary of Occupational
Titles, fourth edition supplement, Appendix D pp. 101-102) as described below:
1. S-Sedentary Work – Exerting up to 10 pounds of force occasionally (Occasionally:
activity or condition exists up to 1/3 of the time) and/or a negligible amount of force
frequently (Frequently: activity or condition exists from 1/3 to 2/3 of the time) to lift, carry,
push, pull, or otherwise move objects, including the human body. Sedentary work involves
sitting most of the time, but may involve walking or standing for brief periods of time. Jobs
are sedentary if walking and standing are required only occasionally and all other sedentary
criteria are met.
2. L-Light Work - Exerting up to 20 pounds of force occasionally, and/or up to 10 pounds of
force frequently, and/or a negligible amount of force constantly (Constantly: activity or
condition exists 2/3 or more of the time) to move objects. Physical demand requirements are
in excess of those for Sedentary Work. Even though the weight lifted may be only a
negligible amount, a job should be rated Light Work: (1) when it requires walking or standing
to a significant degree; or (2) when it requires sitting most of the time but entails pushing
and/or pulling of arm or leg controls; and/or (3) when the job requires working at a production
rate pace entailing the constant pushing and/or pulling of materials even though the weight of
those materials is negligible.
NOTE: The constant stress and strain of maintaining a production rate pace, especially in an
industrial setting, can be and is physically demanding of a worker even though the amount of
force exerted is negligible.
3. M-Medium Work - Exerting 20 to 50 pounds of force occasionally, and/or 10 to 25
pounds of force frequently, and/or greater than negligible up to 10 pounds of force constantly
to move objects. Physical Demand requirements are in excess of those for Light Work.
4. H-Heavy Work - Exerting 50 to 100 pounds of force occasionally, and/or 25 to 50 pounds
of force frequently, and/or 10 to 20 pounds of force constantly to move objects. Physical
Demand requirements are in excess of those for Medium Work.

60
5. V-Very Heavy Work - Exerting in excess of 100 pounds of force occasionally, and/or in
excess of 50 pounds of force frequently, and/or in excess of 20 pounds of force constantly to
move objects. Physical Demand requirements are in excess of those for Heavy Work.
3.2.5 Research Procedure for the Baseline Survey
3.2.5.1 Ethics Approval
Ethics approval for the baseline survey was obtained from the University of Adelaide Human
Research Ethics Committee in October 2008 (Project No. H-129-2008 and RM No.
0000008775). (Appendix 2). The baseline survey was conducted from late 2008 to early 2009.
3.2.5.2 Questionnaire Administration
Workgroups were selected in advance. On the day of survey, an information sheet and
consent form was provided to members of the workgroup (see Appendix 2). An explanation
of the project was provided, and if workers agreed to participate, questionnaires were
administered to each worker by research assistants in a private room. The questionnaire was
completed face to face, and took around 10 to 15 minutes to complete. The research
assistants had previously been trained together to ensure consistency.
3.2.6 Data Analysis for the Baseline Survey
This section describes the method used in this baseline cross sectional study in order to
identify the prevalence of MSPD and its associations with individual/occupational and
organisational factors. This section presents the list of variables (outcome variables and
covariate variables) and statistical analyses used in this study.
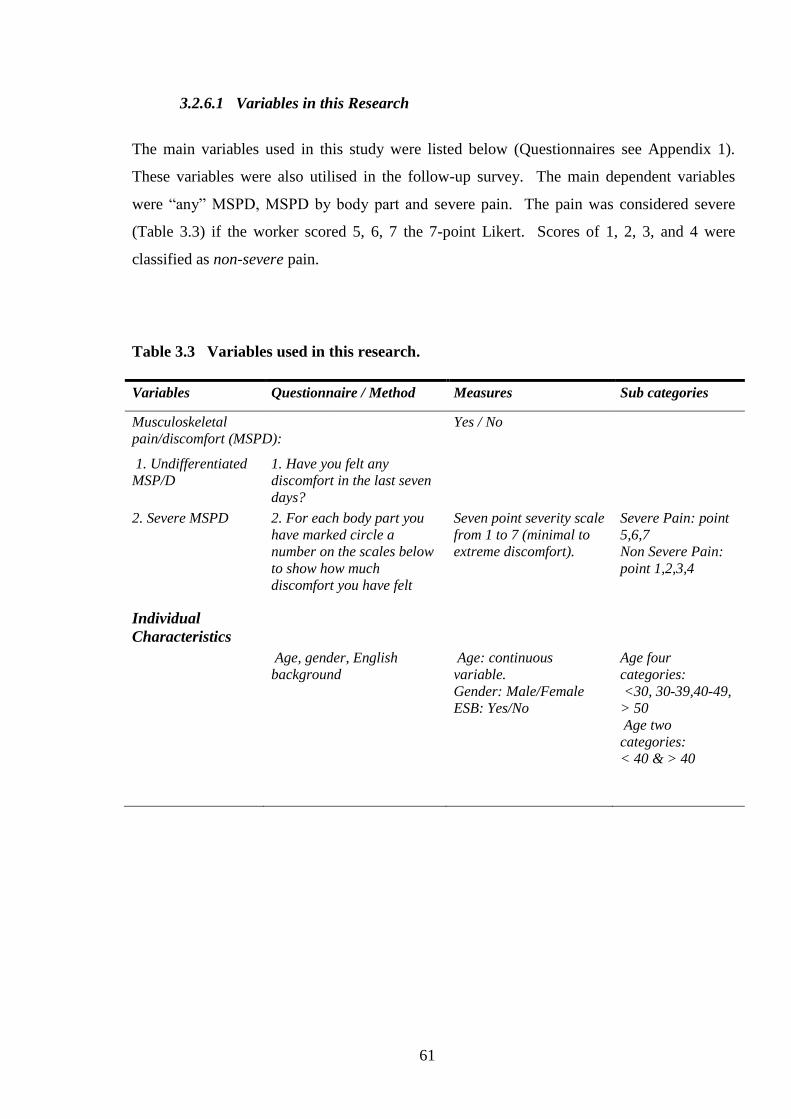
61
3.2.6.1 Variables in this Research
The main variables used in this study were listed below (Questionnaires see Appendix 1).
These variables were also utilised in the follow-up survey. The main dependent variables
were “any” MSPD, MSPD by body part and severe pain. The pain was considered severe
(Table 3.3) if the worker scored 5, 6, 7 the 7-point Likert. Scores of 1, 2, 3, and 4 were
classified as non-severe pain.
Table 3.3 Variables used in this research.
Variables Questionnaire / Method Measures Sub categories
Musculoskeletal
pain/discomfort (MSPD):
Yes / No
1. Undifferentiated
MSP/D
1. Have you felt any
discomfort in the last seven
days?
2. Severe MSPD 2. For each body part you
have marked circle a
number on the scales below
to show how much
discomfort you have felt
Seven point severity scale
from 1 to 7 (minimal to
extreme discomfort).
Severe Pain: point
5,6,7
Non Severe Pain:
point 1,2,3,4
Individual
Characteristics
Age, gender, English
background
Age: continuous
variable.
Gender: Male/Female
ESB: Yes/No
Age four
categories:
<30, 30-39,40-49,
> 50
Age two
categories:
< 40 & > 40
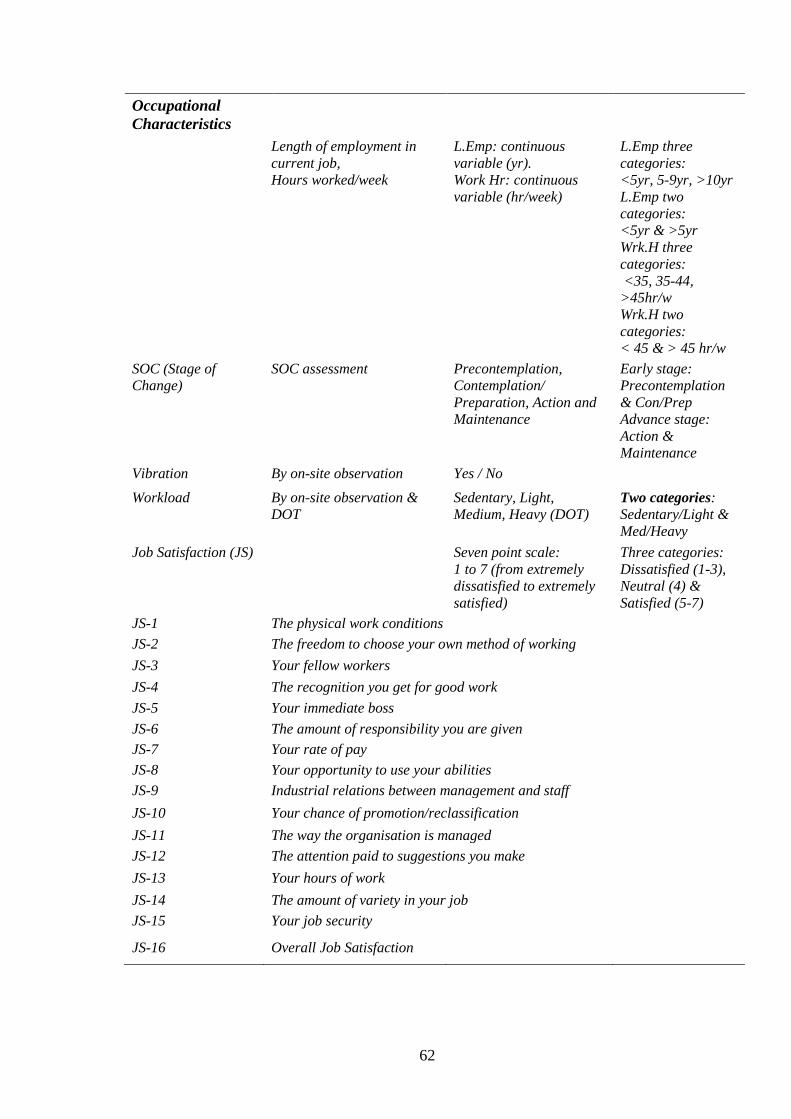
62
Occupational
Characteristics
Length of employment in
current job,
Hours worked/week
L.Emp: continuous
variable (yr).
Work Hr: continuous
variable (hr/week)
L.Emp three
categories:
<5yr, 5-9yr, >10yr
L.Emp two
categories:
<5yr & >5yr
Wrk.H three
categories:
<35, 35-44,
>45hr/w
Wrk.H two
categories:
< 45 & > 45 hr/w
SOC (Stage of
Change)
SOC assessment Precontemplation,
Contemplation/
Preparation, Action and
Maintenance
Early stage:
Precontemplation
& Con/Prep
Advance stage:
Action &
Maintenance
Vibration By on-site observation Yes / No
Workload By on-site observation &
DOT
Sedentary, Light,
Medium, Heavy (DOT)
Two categories:
Sedentary/Light &
Med/Heavy
Job Satisfaction (JS) Seven point scale:
1 to 7 (from extremely
dissatisfied to extremely
satisfied)
Three categories:
Dissatisfied (1-3),
Neutral (4) &
Satisfied (5-7)
JS-1 The physical work conditions
JS-2 The freedom to choose your own method of working
JS-3 Your fellow workers
JS-4 The recognition you get for good work
JS-5 Your immediate boss
JS-6 The amount of responsibility you are given
JS-7 Your rate of pay
JS-8 Your opportunity to use your abilities
JS-9 Industrial relations between management and staff
JS-10 Your chance of promotion/reclassification
JS-11 The way the organisation is managed
JS-12 The attention paid to suggestions you make
JS-13 Your hours of work
JS-14 The amount of variety in your job
JS-15 Your job security
JS-16 Overall Job Satisfaction
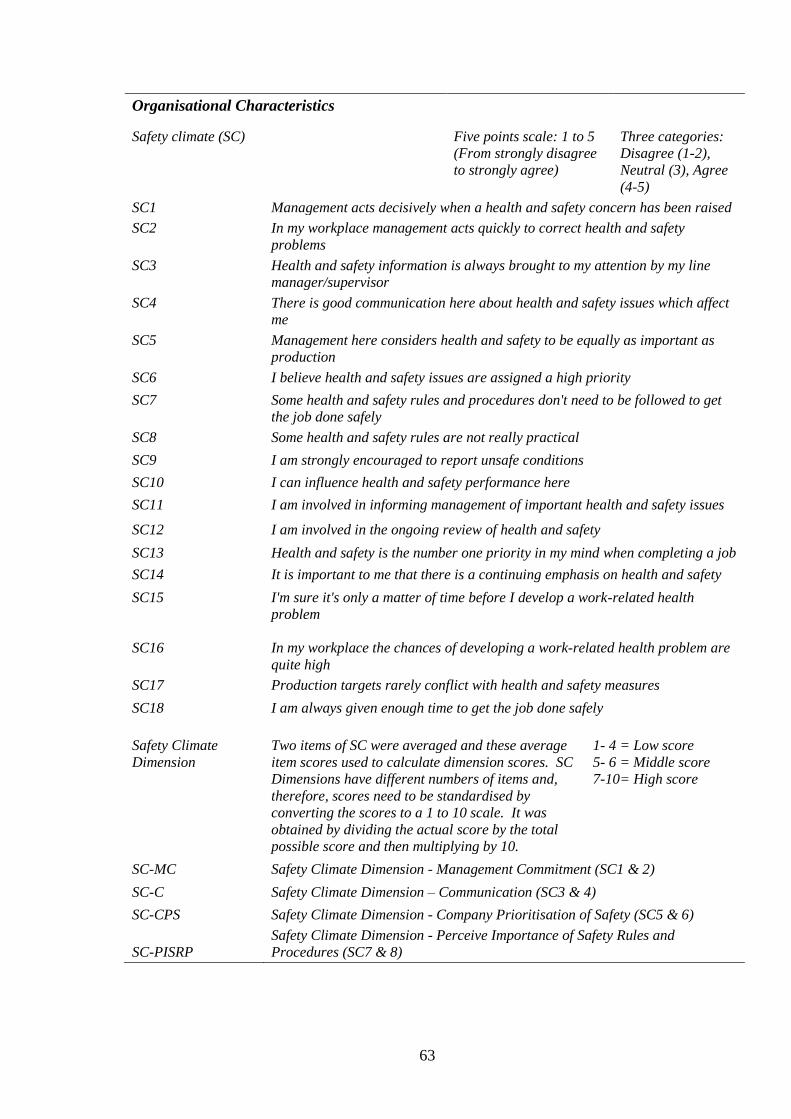
63
Organisational Characteristics
Safety climate (SC) Five points scale: 1 to 5
(From strongly disagree
to strongly agree)
Three categories:
Disagree (1-2),
Neutral (3), Agree
(4-5)
SC1 Management acts decisively when a health and safety concern has been raised
SC2 In my workplace management acts quickly to correct health and safety
problems
SC3 Health and safety information is always brought to my attention by my line
manager/supervisor
SC4 There is good communication here about health and safety issues which affect
me
SC5 Management here considers health and safety to be equally as important as
production
SC6 I believe health and safety issues are assigned a high priority
SC7 Some health and safety rules and procedures don't need to be followed to get
the job done safely
SC8 Some health and safety rules are not really practical
SC9 I am strongly encouraged to report unsafe conditions
SC10 I can influence health and safety performance here
SC11 I am involved in informing management of important health and safety issues
SC12 I am involved in the ongoing review of health and safety
SC13 Health and safety is the number one priority in my mind when completing a job
SC14 It is important to me that there is a continuing emphasis on health and safety
SC15 I'm sure it's only a matter of time before I develop a work-related health
problem
SC16 In my workplace the chances of developing a work-related health problem are
quite high
SC17 Production targets rarely conflict with health and safety measures
SC18 I am always given enough time to get the job done safely
Safety Climate
Dimension
Two items of SC were averaged and these average
item scores used to calculate dimension scores. SC
Dimensions have different numbers of items and,
therefore, scores need to be standardised by
converting the scores to a 1 to 10 scale. It was
obtained by dividing the actual score by the total
possible score and then multiplying by 10.
1- 4 = Low score
5- 6 = Middle score
7-10= High score
SC-MC Safety Climate Dimension - Management Commitment (SC1 & 2)
SC-C Safety Climate Dimension – Communication (SC3 & 4)
SC-CPS Safety Climate Dimension - Company Prioritisation of Safety (SC5 & 6)
SC-PISRP
Safety Climate Dimension - Perceive Importance of Safety Rules and
Procedures (SC7 & 8)
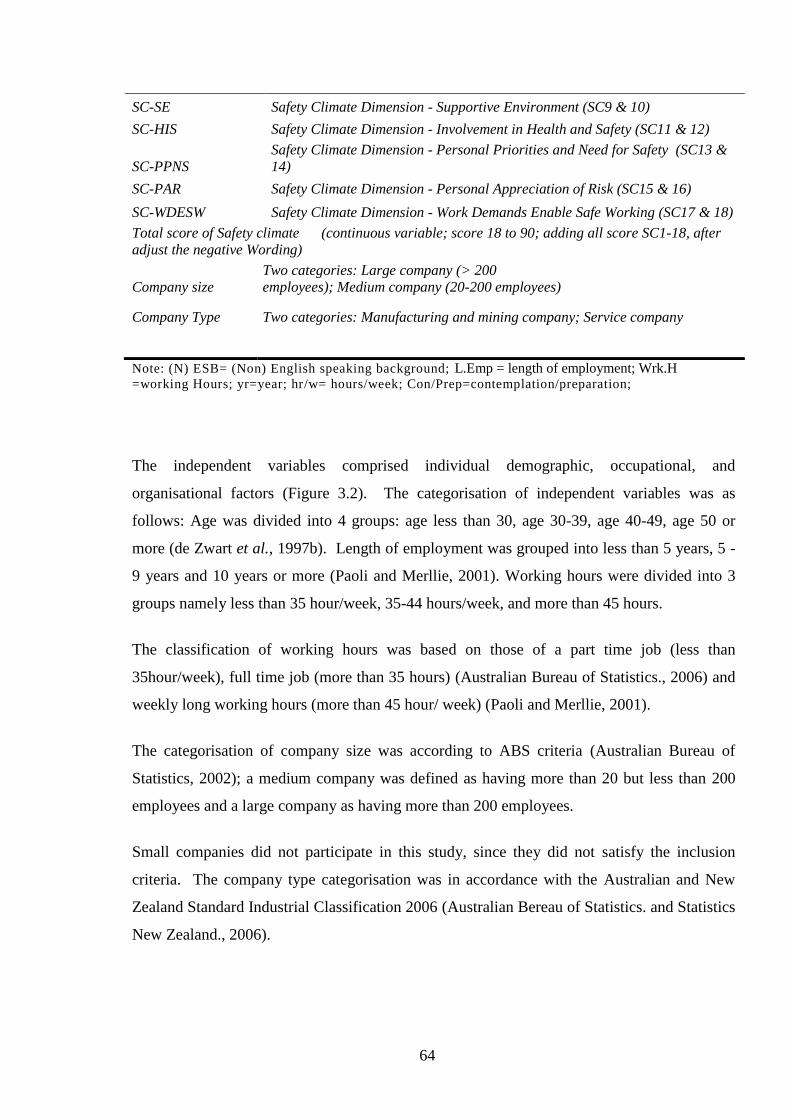
64
SC-SE Safety Climate Dimension - Supportive Environment (SC9 & 10)
SC-HIS Safety Climate Dimension - Involvement in Health and Safety (SC11 & 12)
SC-PPNS
Safety Climate Dimension - Personal Priorities and Need for Safety (SC13 &
14)
SC-PAR Safety Climate Dimension - Personal Appreciation of Risk (SC15 & 16)
SC-WDESW Safety Climate Dimension - Work Demands Enable Safe Working (SC17 & 18)
Total score of Safety climate (continuous variable; score 18 to 90; adding all score SC1-18, after
adjust the negative Wording)
Company size
Two categories: Large company (> 200
employees); Medium company (20-200 employees)
Company Type Two categories: Manufacturing and mining company; Service company
Note: (N) ESB= (Non) English speaking background; L.Emp = length of employment; Wrk.H =working Hours; yr=year; hr/w= hours/week; Con/Prep=contemplation/preparation;
The independent variables comprised individual demographic, occupational, and
organisational factors (Figure 3.2). The categorisation of independent variables was as
follows: Age was divided into 4 groups: age less than 30, age 30-39, age 40-49, age 50 or
more (de Zwart et al., 1997b). Length of employment was grouped into less than 5 years, 5 -
9 years and 10 years or more (Paoli and Merllie, 2001). Working hours were divided into 3
groups namely less than 35 hour/week, 35-44 hours/week, and more than 45 hours.
The classification of working hours was based on those of a part time job (less than
35hour/week), full time job (more than 35 hours) (Australian Bureau of Statistics., 2006) and
weekly long working hours (more than 45 hour/ week) (Paoli and Merllie, 2001).
The categorisation of company size was according to ABS criteria (Australian Bureau of
Statistics, 2002); a medium company was defined as having more than 20 but less than 200
employees and a large company as having more than 200 employees.
Small companies did not participate in this study, since they did not satisfy the inclusion
criteria. The company type categorisation was in accordance with the Australian and New
Zealand Standard Industrial Classification 2006 (Australian Bereau of Statistics. and Statistics
New Zealand., 2006).
65
There were variables with more than two categories namely, job satisfaction with seven
categories; safety climate with five categories; and SOC with four categories. However, in
order to obtain a sufficient number of observations in each category for regression analysis,
the variables with more than two response categories were collapsed into two groups
(dichotomous) or three groups (Table 3.3). In addition the dichotomous variables were also
used for prevalence rate ratio calculation in the bivariate analysis. For example, age was
collapsed into a younger group (less than 40) and an older group (40 or more). In the case of
the SOC variable, those workers who were in precontemplation and
contemplation/preparation were grouped together (labelled as early stage or non action stage)
and those who were in action and maintenance were grouped together (labelled as advanced
stage or action stage). The total safety climate score, collapsed into two categories was used
in bivariate and regression models.
3.2.6.2 Statistical Analysis for the Baseline Survey
Questionnaire and other data were entered and cleaned in Excel and then transferred to SPSS
18. The data validation and univariate, bivariate and multivariate analyses were undertaken
using SPSS 18. The univariate analyses considered MSPD, individual (age, gender etc.),
occupational (length of employment, hours of work, workload, etc.) and organisational factors
(safety climate, company size, etc.). The bivariate analyses covered the association of MSPD
and risk factors. Logistic regression was used to further explore the association of MSPD,
severe pain, neck, shoulder and back pain with the risk factors.
3.2.6.2.1 The Distribution of Participant Characteristics and Prevalence of
MSPD (undifferentiated MSPD, Severe MSPD, and MSPD in Body Parts)
Univariate analysis using prevalence or proportions aims to describe the distribution of basic
Individual of the study population including age, gender, length of employment, hours
worked as well as the other important variable such as musculoskeletal pain/discomfort,
severe pain, job satisfaction, safety climate and workers’ SOC. The prevalence of MSPD,
severe pain, body area pain was obtained by dividing the number with reported pain and
discomfort by the total number of participants. The distributions of each variable were
presented in numbers and percentages.
66
For comparison with other studies (in Discussion Section), the prevalence numbers were
obtained by either obtaining the proportions directly or by calculation from data presented in
publications. For example in the 2011 Safe Work Australia report page 18 (Safe Work
Australia., 2011), “27.8% (n = 1250) of workers reported that they experienced no pain
symptoms in the last week”. This prevalence was calculated as 100% – 27.8 %= 72.2%.
3.2.6.2.2 The Association between MSPD and Independent Variables (Bivariate
and Regression)
The prevalence rate ratio / prevalence ratio (PRR/ PR) as an effect measure was calculated by
dividing the proportion with a characteristic experiencing MSPD by the proportion without
that characteristic with MSPD. PRR is recommended to be used for common diseases in
populations (Elwood, 2007, Lee and Chia, 1993, Zocchetti et al., 1997) rather than a
prevalence odds ratio. This study used non-parametric tests such as Chi-square (Pallant,
2011) to assess the relationship between MSPD and individual, occupational, and
organisational variables because most of these data were nominal and ordinal. Figure 3.2
shows the dependent and independent variables used in the baseline survey.
The MSPD in this study comprised of undifferentiated MSPD, severe pain, shoulder, neck,
and lower back MSPD. These particular body areas MSPD were utilised since they were the
most common MSPD that were reported by the workers.
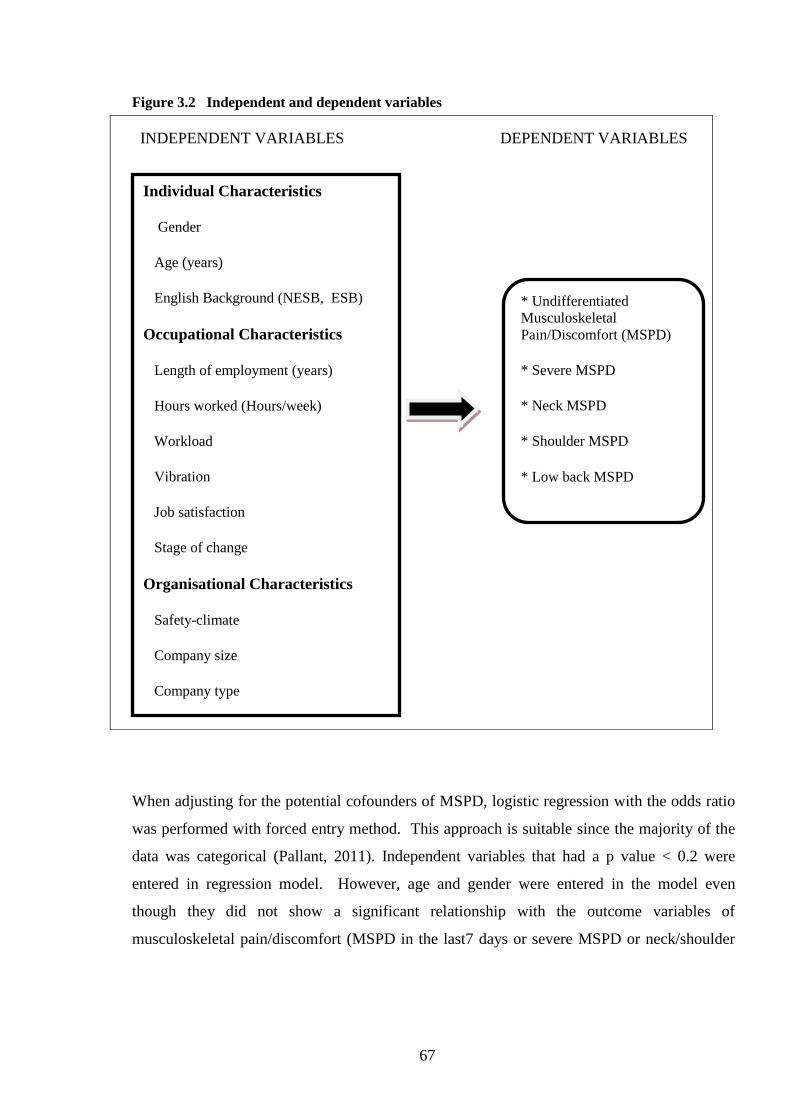
67
Figure 3.2 Independent and dependent variables
INDEPENDENT VARIABLES DEPENDENT VARIABLES
When adjusting for the potential cofounders of MSPD, logistic regression with the odds ratio
was performed with forced entry method. This approach is suitable since the majority of the
data was categorical (Pallant, 2011). Independent variables that had a p value < 0.2 were
entered in regression model. However, age and gender were entered in the model even
though they did not show a significant relationship with the outcome variables of
musculoskeletal pain/discomfort (MSPD in the last7 days or severe MSPD or neck/shoulder
Individual Characteristics
Gender
Age (years)
English Background (NESB, ESB)
Occupational Characteristics
Length of employment (years)
Hours worked (Hours/week)
Workload
Vibration
Job satisfaction
Stage of change
Organisational Characteristics
Safety-climate
Company size
Company type
* Undifferentiated
Musculoskeletal
Pain/Discomfort (MSPD)
* Severe MSPD
* Neck MSPD
* Shoulder MSPD
* Low back MSPD
68
and lower back MSPD). Odds ratios for MSPD are presented in this study. Prevalence rate
ratios for undifferentiated MSPD are also provided in Appendix 4. A comparison of the
results of both approaches indicates that there is no change in interpretation of the association
in this study. This is in accord with the results presented by Davies et al. (1998). While an
odds ratio may over- (or under-) estimate the relative risk, it is very unlikely to lead to
qualitatively different judgments about the results of a study.
3.2.6.2.3 Additional Analyses
The association of MSPD with the dimensions of safety climate were also analysed. These
were examined in bivariate and multivariate logistic regression analysis. The spider chart
comparing MSPD and No MSPD within safety climate dimension is also presented in this
study.
Another additional analysis was the association of MSPD with the items of job satisfaction.
Chi-square and multivariate logistic regression were undertaken to determine the most
important items within the job satisfaction scale that associated with MSPD. In this analysis
the safety climate dimension and job satisfaction components with 3 categories was utilised.
3.2.7 Pilot Study
A pilot survey was conducted for the purpose of trialling the assessment tools.
Organisations selected for the pilot study were a manufacturing, a library, and a primary
school. Prior to the survey, information was obtained about the company and the work
environment. In addition, tasks and work practices were observed. A total of 50 employees
participated in the pilot survey. The surveys were administered individually, face-to-face and
in a closed room to ensure confidentiality. Participants were asked to provide feedback on the
survey instrument, particularly regarding the comprehensibility of the questions.
69
The questions were considered as being straightforward and easily understood by the vast
majority of participants, across all the organisations. Some of the participants from non-
English speaking backgrounds found some parts of the questionnaire were difficult to be
understood. However, since the administration of the questionnaire was face-to-face the
questions could be clarified by the interviewer.
3.3 Results of the Baseline Survey
This section addresses the research questions specified in Section 3.1.2.
Firstly, the distributions with respect to individual worker characteristics, occupational and
organisational characteristics are presented in order. Following this is a description of the
prevalence of MSPD including undifferentiated MSPD, severe MSPD, and MSPD by body
part within the last 7 days.
Then the results of bivariate and multivariate analyses are presented. These address research
question number 2: ‘What is the association between undifferentiated MSPD/ Severe MSPD /
neck, shoulder and lower back MSPD and individual, occupational, and organisational
characteristics?’
Note that the data generated from the pilot study were not included in the results.

70
3.3.1 The Distribution of Individual, Occupational and Organisational Characteristics
of Participants and the Prevalence of MSPD in the Baseline Survey (Univariate analysis)
3.3.1.1 The Distribution of Participants’ Individual Characteristics in the Baseline
Survey
Four hundred and six workers within the 23 companies participated in this survey. Table 3.4
shows the distribution of personal age, gender, and English background.
Table 3.4 indicates a similarity in gender distribution; Males (49.1%) and Females (50.9%).
The median age was 38, with a similar proportion of workers in every age group. Workers
from non-English speaking backgrounds comprised 12 % of the sample size.
Table 3.4 Distribution of participants’ individual characteristics in the baseline survey.
*Note: Where totals do not total 406, data are missing for those variables.
Individual
Characteristic Median Range N*
Percentage of
Workers
Total Participants
406
Gender
405
Male 199 49.1
Female 206 50.9
Age
38.0 16 - 72 404
Less than 30 119 29.5
30 – 39 95 23.5
40 – 49 92 22.8
50 or more 96 24.3
English speaking background (ESB) 394
Yes (ESB) 346 87.8
No (NESB) 48 12.2
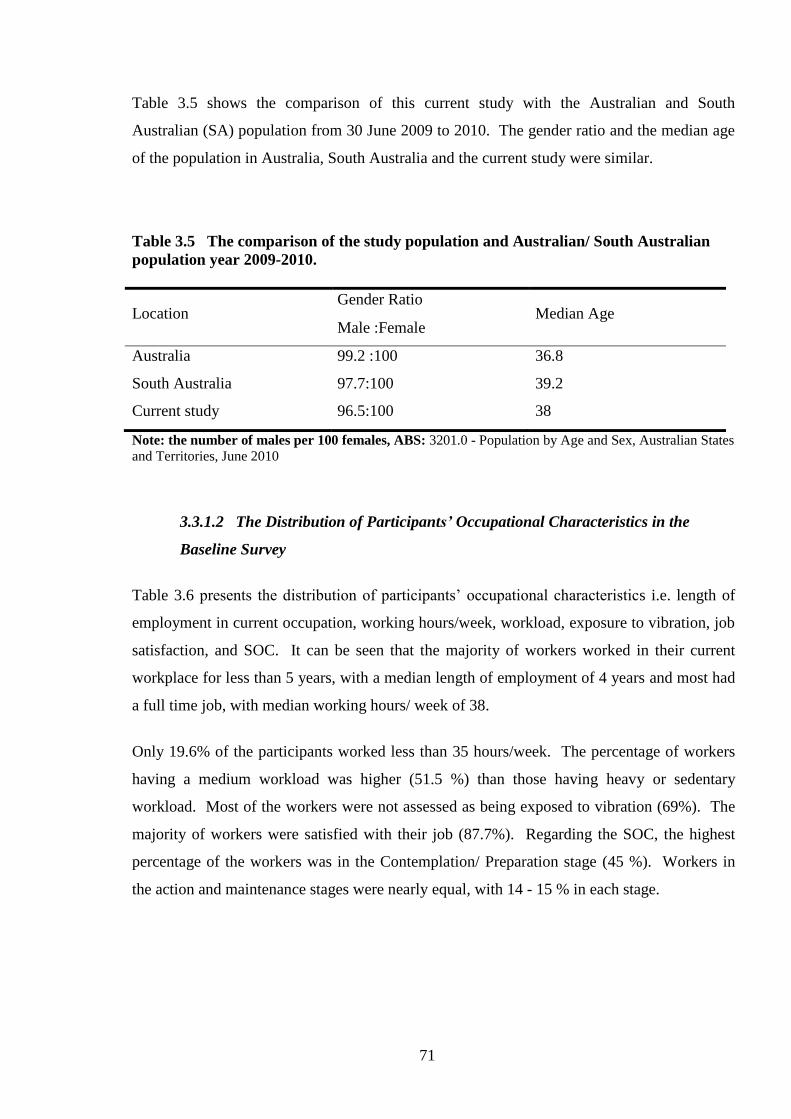
71
Table 3.5 shows the comparison of this current study with the Australian and South
Australian (SA) population from 30 June 2009 to 2010. The gender ratio and the median age
of the population in Australia, South Australia and the current study were similar.
Table 3.5 The comparison of the study population and Australian/ South Australian
population year 2009-2010.
Location Gender Ratio
Median Age Male :Female
Australia 99.2 :100 36.8
South Australia 97.7:100 39.2
Current study 96.5:100 38
Note: the number of males per 100 females, ABS: 3201.0 - Population by Age and Sex, Australian States
and Territories, June 2010
3.3.1.2 The Distribution of Participants’ Occupational Characteristics in the
Baseline Survey
Table 3.6 presents the distribution of participants’ occupational characteristics i.e. length of
employment in current occupation, working hours/week, workload, exposure to vibration, job
satisfaction, and SOC. It can be seen that the majority of workers worked in their current
workplace for less than 5 years, with a median length of employment of 4 years and most had
a full time job, with median working hours/ week of 38.
Only 19.6% of the participants worked less than 35 hours/week. The percentage of workers
having a medium workload was higher (51.5 %) than those having heavy or sedentary
workload. Most of the workers were not assessed as being exposed to vibration (69%). The
majority of workers were satisfied with their job (87.7%). Regarding the SOC, the highest
percentage of the workers was in the Contemplation/ Preparation stage (45 %). Workers in
the action and maintenance stages were nearly equal, with 14 - 15 % in each stage.
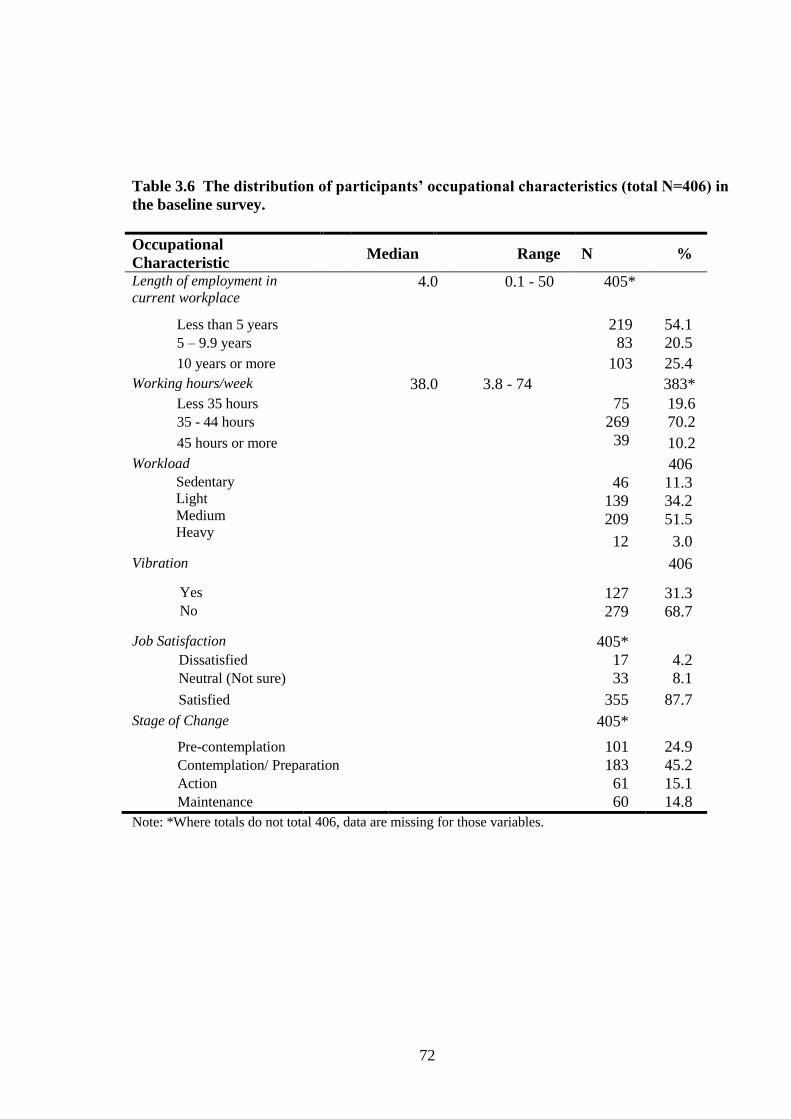
72
Table 3.6 The distribution of participants’ occupational characteristics (total N=406) in
the baseline survey.
Occupational
Characteristic Median Range N %
Length of employment in
current workplace
4.0 0.1 - 50 405*
Less than 5 years 219 54.1
5 – 9.9 years 83 20.5
10 years or more 103 25.4
Working hours/week 38.0 3.8 - 74 383*
Less 35 hours 75 19.6
35 - 44 hours 269 70.2
45 hours or more 39 10.2
Workload 406 Sedentary
Light
Medium
Heavy
46 11.3
139 34.2
209 51.5
12 3.0
Vibration 406
Yes 127 31.3 No 279 68.7
Job Satisfaction 405* Dissatisfied 17 4.2 Neutral (Not sure) 33 8.1
Satisfied 355 87.7
Stage of Change 405*
Pre-contemplation 101 24.9 Contemplation/ Preparation 183 45.2 Action 61 15.1 Maintenance 60 14.8
Note: *Where totals do not total 406, data are missing for those variables.

73
Figures 3.3-3.4 are photographs of workers in South Australian companies engaged in
physically demanding tasks. They are not meant to be representative of all tasks.
Figure 3.3 Workers engaged in some physically demanding tasks
Figure 3.4 Workers engaged in working above the shoulder, repetitive task, or in an awkward
position.

74
3.3.1.3 The Distribution of Participants’ Organisational Characteristics in the
Baseline Survey
The distribution of organisational characteristics including workers’ perceptions of the
organisation safety climate, company size and company types are given in Table 3.7. The
table shows the median of total score of safety climate was 67 with the range of 37 to 90. Of
the 23 companies, 15 companies were categorised as large companies and 5 as medium
companies. Three companies did not answer this question in informal interviews. The
percentage of participants in large companies (more than 200 employees) was 69% and in
medium companies (20-200 employees) was 31%.
Table 3.7 The distribution of participants’ organisational characteristics in the baseline
survey.
Organisational
Characteristic Median Range N %
Total Safety Climate score
67 37-90 373a /400
b,c
Lower score 184 49.3
Higher score 189 50.7
Company Size 355c
Medium 109 30.7
Large 246 69.3
Type of Company 406
Manufacturing/ mining 164 40.4
Service 242 59.6
Note: a.
Due to the grouping of safety climate into 2 groups, participants who had a total score between 1
standard deviation lower and higher than the median were not included.; b.
Total number of participants for
safety climate as continuous variables; c.
Where totals do not total 406, data are missing for those
variables.
The 23 participating companies were categorised into eight industry types based on the
categorisation from the Australian and New Zealand Standard Industrial Classification 2006
(Australian Bureau of Statistics and Statistics New Zealand, 2006).
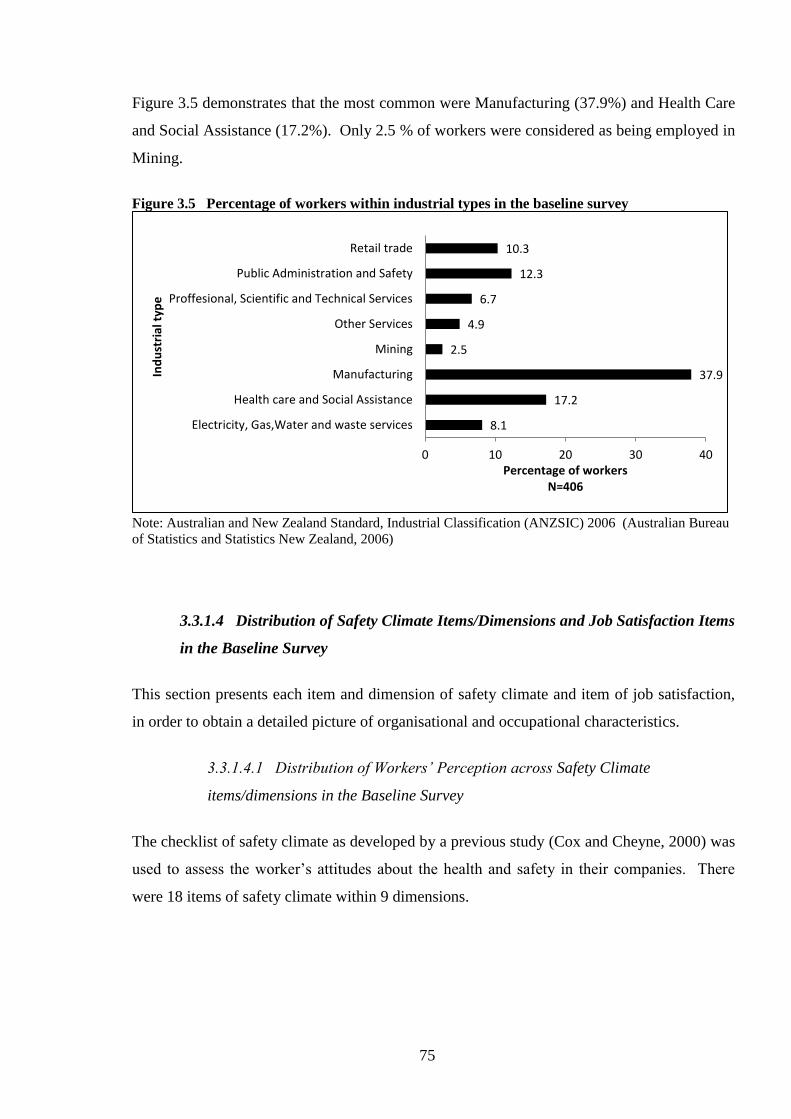
75
Figure 3.5 demonstrates that the most common were Manufacturing (37.9%) and Health Care
and Social Assistance (17.2%). Only 2.5 % of workers were considered as being employed in
Mining.
Figure 3.5 Percentage of workers within industrial types in the baseline survey
Note: Australian and New Zealand Standard, Industrial Classification (ANZSIC) 2006 (Australian Bureau
of Statistics and Statistics New Zealand, 2006)
3.3.1.4 Distribution of Safety Climate Items/Dimensions and Job Satisfaction Items
in the Baseline Survey
This section presents each item and dimension of safety climate and item of job satisfaction,
in order to obtain a detailed picture of organisational and occupational characteristics.
3.3.1.4.1 Distribution of Workers’ Perception across Safety Climate
items/dimensions in the Baseline Survey
The checklist of safety climate as developed by a previous study (Cox and Cheyne, 2000) was
used to assess the worker’s attitudes about the health and safety in their companies. There
were 18 items of safety climate within 9 dimensions.
8.1
17.2
37.9
2.5
4.9
6.7
12.3
10.3
0 10 20 30 40
Electricity, Gas,Water and waste services
Health care and Social Assistance
Manufacturing
Mining
Other Services
Proffesional, Scientific and Technical Services
Public Administration and Safety
Retail trade
Percentage of workers N=406
Ind
ust
rial
typ
e

76
Table 3.8 summarises the data and shows the majority of workers had positive perceptions of
the safety climate in their workplace.
Table 3.8 The percentage safety climate perception of the participants in baseline
survey.
Safety Climate (N=400)
Agree
%
Neither
Agree nor
Disagree
%
Disagree
%
Management commitment
SC 1 Management acts decisively when a health and safety
concern has been raised
81.8 13.0 5.3
SC 2 In my workplace management acts quickly to correct
health and safety problems
78.8 13.8 7.5
Communication
SC 3 Health and safety information is always brought to my
attention by my line manager/supervisor
81.7 13.8 4.5
SC 4 There is good communication here about health and
safety issues which affect me
79.4 13.8 6.8
Company prioritization of safety
SC 5 Management here considers health and safety to be
equally as important as production
72.8 17.8 9.5
SC 6 I believe health and safety issues are assigned a high
priority
79.4 12.5 8.0
Perceived importance of safety rules and procedures
SC 7 Some health and safety rules and procedures don't need to
be followed to get the job done safely
18.5 17.8 63.7
SC 8 Some health and safety rules are not really practical 33.6 17.5 48.9
Supportive environment
SC 9 I am strongly encouraged to report unsafe conditions 91.0 6.0 3.0
SC 10 I can influence health and safety performance here 77.4 17.1 5.5
Involvement in health and safety
SC 11 I am involved in informing management of important
health and safety issues
74.9 17.1 8.0
SC 12 I am involved in the ongoing review of health and safety 51.8 30.2 18.1
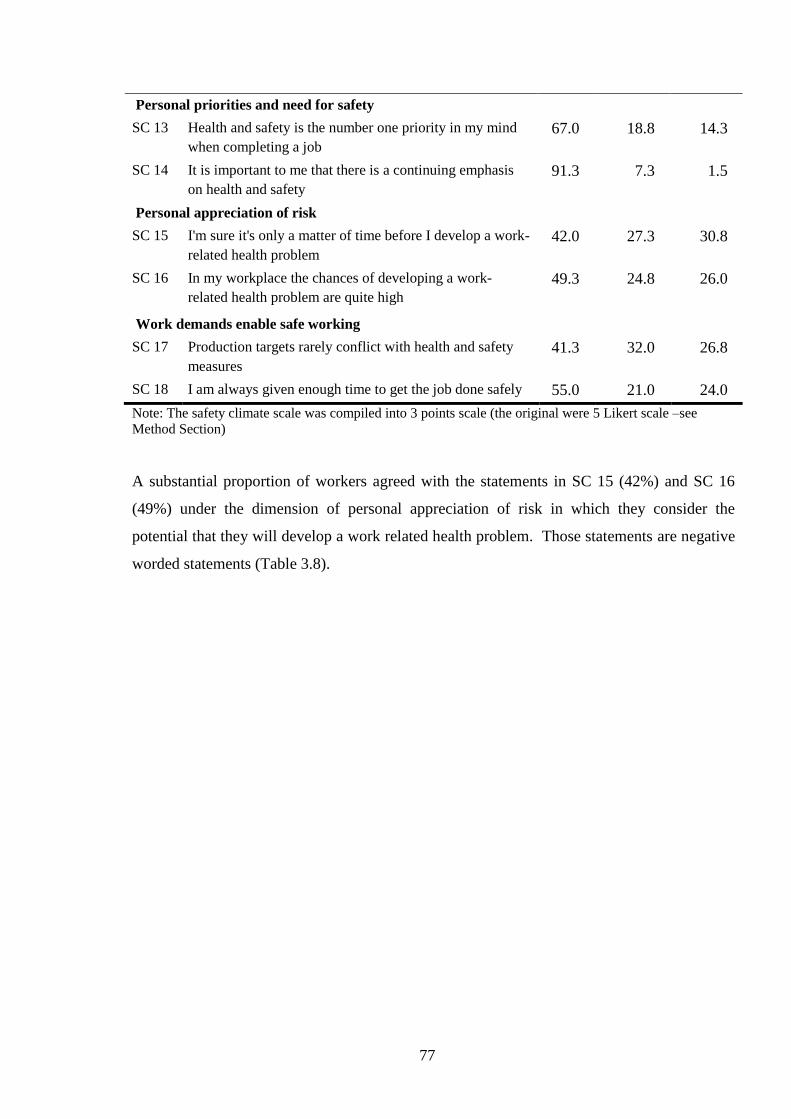
77
Personal priorities and need for safety
SC 13 Health and safety is the number one priority in my mind
when completing a job
67.0 18.8 14.3
SC 14 It is important to me that there is a continuing emphasis
on health and safety
91.3 7.3 1.5
Personal appreciation of risk
SC 15 I'm sure it's only a matter of time before I develop a work-
related health problem
42.0 27.3 30.8
SC 16 In my workplace the chances of developing a work-
related health problem are quite high
49.3 24.8 26.0
Work demands enable safe working
SC 17 Production targets rarely conflict with health and safety
measures
41.3 32.0 26.8
SC 18 I am always given enough time to get the job done safely 55.0 21.0 24.0
Note: The safety climate scale was compiled into 3 points scale (the original were 5 Likert scale –see
Method Section)
A substantial proportion of workers agreed with the statements in SC 15 (42%) and SC 16
(49%) under the dimension of personal appreciation of risk in which they consider the
potential that they will develop a work related health problem. Those statements are negative
worded statements (Table 3.8).

78
The spider chart in Figure 3.6 shows the average for the 9 safety climate dimension among all
participants in this study. The lowest score is the personal appreciation of risk (score 5.4) and
the highest score is for a supportive environment (score 8.3).
Figure 3.6 Average score for safety climate dimension for all participants in the baseline survey
Note: The score were calculated based on the formula of safety climate dimension (Section 3.2.4.3 Safety
Climate Tool).
3.3.1.4.2 Distribution of Workers’ Job Satisfaction in the Baseline Survey
The distribution of workers’ job satisfaction is presented in Table 3.9. It shows that overall
the workers were satisfied with their jobs.
Nevertheless, there were some issues of job satisfaction that indicated that more than 10% of
workers were dissatisfied, such as with the physical work conditions (moderately dissatisfied
11%), the recognition obtained for good work (moderately dissatisfied 11%), payment rate
(moderately dissatisfied 16%), the way the organisation is managed (moderately dissatisfied
18%) and attention to suggestions (moderately dissatisfied 11%). On average around 10 % of
the workers were not sure of their job satisfaction.
0
5
10Management Commitment
Communication
Company Prioritisation ofSafety
Perceive Importance of SafetyRules and Procedures
Supportive EnvironmentInvolvement in Health and
Safety
Personal Priorities and Needfor Safety
Personal Appreciation of Risk
Work Demands Enable SafeWorking
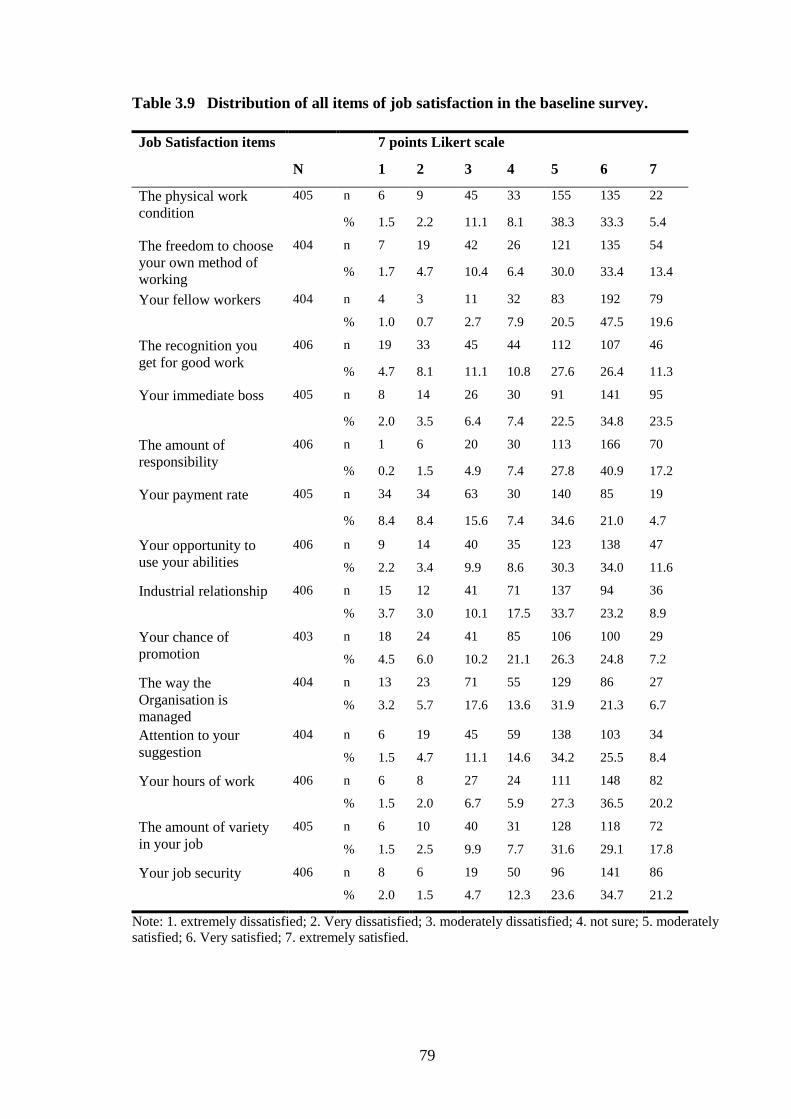
79
Table 3.9 Distribution of all items of job satisfaction in the baseline survey.
Job Satisfaction items 7 points Likert scale
N 1 2 3 4 5 6 7
The physical work
condition
405 n 6 9 45 33 155 135 22
% 1.5 2.2 11.1 8.1 38.3 33.3 5.4
The freedom to choose
your own method of
working
404 n 7 19 42 26 121 135 54
% 1.7 4.7 10.4 6.4 30.0 33.4 13.4
Your fellow workers 404 n 4 3 11 32 83 192 79
% 1.0 0.7 2.7 7.9 20.5 47.5 19.6
The recognition you
get for good work
406 n 19 33 45 44 112 107 46
% 4.7 8.1 11.1 10.8 27.6 26.4 11.3
Your immediate boss 405 n 8 14 26 30 91 141 95
% 2.0 3.5 6.4 7.4 22.5 34.8 23.5
The amount of
responsibility
406 n 1 6 20 30 113 166 70
% 0.2 1.5 4.9 7.4 27.8 40.9 17.2
Your payment rate 405 n 34 34 63 30 140 85 19
% 8.4 8.4 15.6 7.4 34.6 21.0 4.7
Your opportunity to
use your abilities
406 n 9 14 40 35 123 138 47
% 2.2 3.4 9.9 8.6 30.3 34.0 11.6
Industrial relationship 406 n 15 12 41 71 137 94 36
% 3.7 3.0 10.1 17.5 33.7 23.2 8.9
Your chance of
promotion
403 n 18 24 41 85 106 100 29
% 4.5 6.0 10.2 21.1 26.3 24.8 7.2
The way the
Organisation is
managed
404 n 13 23 71 55 129 86 27
% 3.2 5.7 17.6 13.6 31.9 21.3 6.7
Attention to your
suggestion
404 n 6 19 45 59 138 103 34
% 1.5 4.7 11.1 14.6 34.2 25.5 8.4
Your hours of work 406 n 6 8 27 24 111 148 82
% 1.5 2.0 6.7 5.9 27.3 36.5 20.2
The amount of variety
in your job
405 n 6 10 40 31 128 118 72
% 1.5 2.5 9.9 7.7 31.6 29.1 17.8
Your job security 406 n 8 6 19 50 96 141 86
% 2.0 1.5 4.7 12.3 23.6 34.7 21.2
Note: 1. extremely dissatisfied; 2. Very dissatisfied; 3. moderately dissatisfied; 4. not sure; 5. moderately
satisfied; 6. Very satisfied; 7. extremely satisfied.

80
3.3.2 The Prevalence of MSPD: Undifferentiated MSPD, Severe MSPD and MSPD by
Body Area in the Baseline Survey
This section presents data on the prevalence of MSPD, addressing research question 1: What
is the prevalence of MSPD (undifferentiated MSPD in the last 7 days, severe MSPD, and
MSPD in each body part) in a representative sample of SA workplaces (the baseline survey)?
3.3.2.1 Prevalence of Undifferentiated MSPD (any MSPD reported) in the
Baseline Survey
The percentage of workers reporting undifferentiated MSPD within the previous seven days
was 40% (n=162). Table 3.10 provides details of prevalence of MSPD by body area (N=406
workers) and the percentage of MSPD by body area within those reporting MSPD (n=162).
3.3.2.2 Prevalence of Severe MSPD in the Baseline Survey
Approximately 15% (60/406 workers) of all participants reported severe MSPD (rating 5-7 of
the severity scale) in at least one body area. Of the 162 employees reporting undifferentiated
MSPD, 37% (60/162 workers) reported severe MSPD. The severe MSPD by body part is
given in the following section.
3.3.2.3 Prevalence of MSPD in the Body areas in the Baseline Survey
Table 3.10 shows that the most commonly reported MSPD was in the shoulder; 18% of all
participants or 46.9% from overall self-reported MSPD (i.e. those reporting undifferentiated
MSPD).
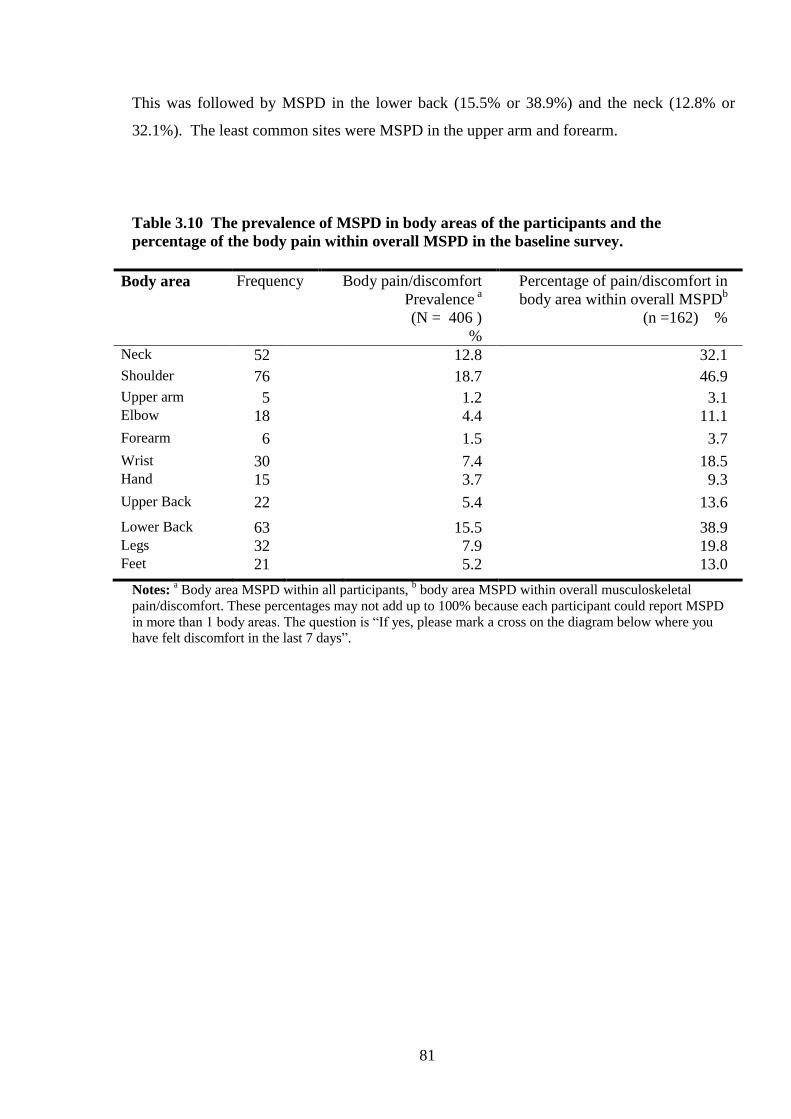
81
This was followed by MSPD in the lower back (15.5% or 38.9%) and the neck (12.8% or
32.1%). The least common sites were MSPD in the upper arm and forearm.
Table 3.10 The prevalence of MSPD in body areas of the participants and the
percentage of the body pain within overall MSPD in the baseline survey.
Body area Frequency Body pain/discomfort
Prevalence a
(N = 406 )
%
Percentage of pain/discomfort in
body area within overall MSPDb
(n =162) %
Neck 52 12.8 32.1
Shoulder 76 18.7 46.9
Upper arm 5 1.2 3.1 Elbow 18 4.4 11.1
Forearm 6 1.5 3.7
Wrist 30 7.4 18.5 Hand 15 3.7 9.3
Upper Back 22 5.4 13.6
Lower Back 63 15.5 38.9 Legs 32 7.9 19.8 Feet 21 5.2 13.0
Notes: a Body area MSPD within all participants,
b body area MSPD within overall musculoskeletal
pain/discomfort. These percentages may not add up to 100% because each participant could report MSPD
in more than 1 body areas. The question is “If yes, please mark a cross on the diagram below where you
have felt discomfort in the last 7 days”.

82
Table 3.11 shows that within overall severe MSPD the most common areas having severe
MSPD were the lower back (31.6%), the neck (26.6%), and the shoulder (26.6%).
Table 3.11 The prevalence of severe MSPD in different body areas in the baseline
survey.
Body area MSPD
Frequency of
Severe MSPD in body areas
Within overall
Severe MSPD (N=60)
n %
Neck
16 26.6
Shoulder
16 26.6
Upper Arm
3 5.0
Elbow
8 13.3
Forearm
1 1.6
Wrist
8 13.3
Hand
4 6.6
Upper Back
8 13.3
Lower Back
19 31.6
Legs
10 16.6
Feet
9 15.0
Notes: Every worker who reported having MSPD severity rate of 5-7 of any body-areas were categorised as
having severe pain/discomfort.
3.3.3 The Association of MSPD (undifferentiated MSPD, severe MSPD, neck, shoulder
and lower back MSPD) and Individual /Occupational/ Organisational Factors in the
Baseline Survey
This section shows the results of the association of MSPD with individual
/occupational/organisational factors which answer the research question 2: What is the
association between MSPD (undifferentiated MSPD in the last 7 days, severe MSPD, neck,
shoulder and lower back MSPD) and individual /occupational/organisational factors, at the
baseline?
83
Firstly, this section reports bivariate analyses of the association between MSPD and
individual risk factors. Secondly, the findings from the multivariate logistic regression
analyses are presented.
3.3.3.1 The Association between Undifferentiated MSPD and Individual,
Occupational and Organisational Characteristic (Bivariate and Multivariate
Analysis)
Table 3.12 shows the prevalence rate ratio (PRR), 95% confidence intervals and P values for
the association between MSPD and worker, occupational and organisation characteristics.
Firstly the individual characteristics:
Women were 1.13 times more likely to report MSPD than men. Workers within the age
group of 40 or more were 1.3 times more likely to experience MSPD that those in the age
group of less than 40. However, the MSPD percentage in the age group of 50 or more
declined slightly. Those with non-English speaking backgrounds were similar in their
experience of MSPD compared with those from English speaking backgrounds.
Regarding occupational characteristics, workers who worked 45 hours or more a week were
more likely to experience MSPD than those who worked less than 45 hours.
The percentage with MSPD was higher for workers with more than 5 years of experience than
among those with less than 5 years. Workers with heavy/medium workloads and exposed to
vibration were more likely to report MSPD compared with those with sedentary/light
workload and were not exposed to vibration.
Workers who were dissatisfied or not sure with their job were more frequently experiencing
MSPD (PRR 1.67, 95%CI: 1.29- 2.16) compared with than those who were satisfied with
their job. Within SOC, workers in advanced stages (action and maintenance stage) were 1.5
times more likely to report MSPD than those in early stages (precontemplation,
contemplation/ preparation).
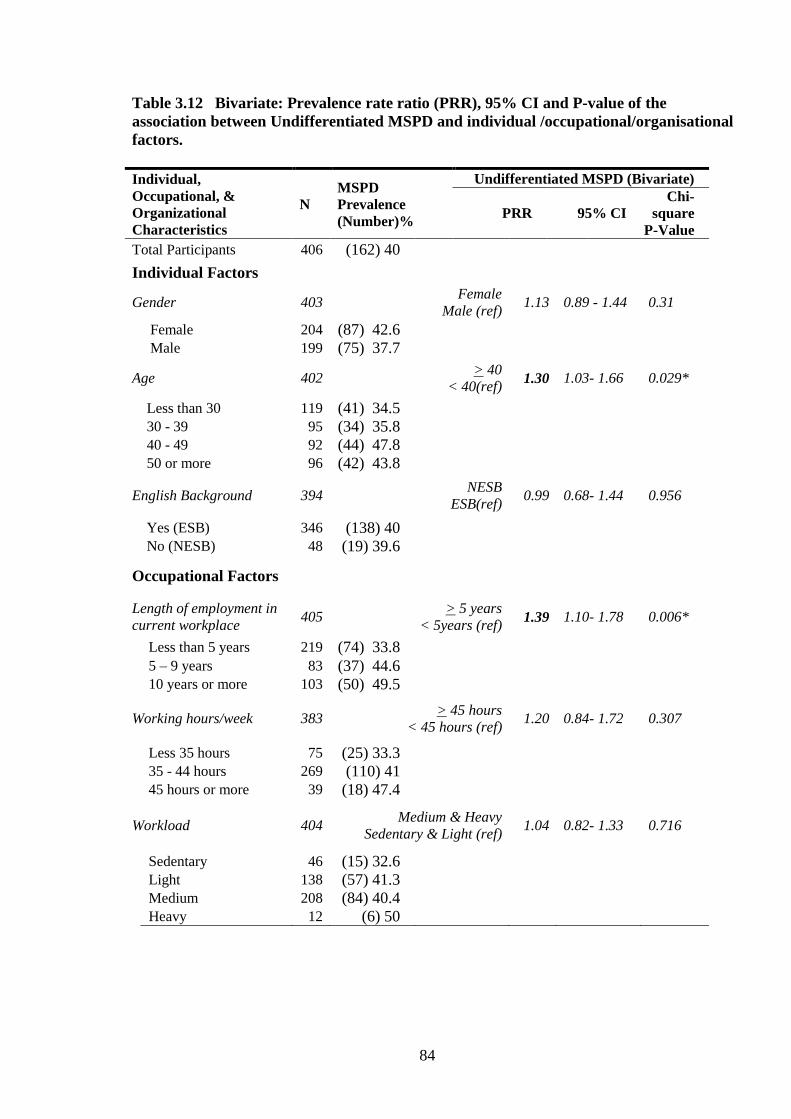
84
Table 3.12 Bivariate: Prevalence rate ratio (PRR), 95% CI and P-value of the
association between Undifferentiated MSPD and individual /occupational/organisational
factors.
Individual,
Occupational, &
Organizational
Characteristics
N
MSPD
Prevalence
(Number)%
Undifferentiated MSPD (Bivariate)
PRR 95% CI
Chi-
square
P-Value
Total Participants 406 (162) 40
Individual Factors
Gender 403 Female
Male (ref) 1.13 0.89 - 1.44 0.31
Female 204 (87) 42.6 Male 199 (75) 37.7
Age 402 > 40
< 40(ref) 1.30 1.03- 1.66 0.029*
Less than 30 119 (41) 34.5 30 - 39 95 (34) 35.8 40 - 49 92 (44) 47.8 50 or more 96 (42) 43.8
English Background 394 NESB
ESB(ref) 0.99 0.68- 1.44 0.956
Yes (ESB) 346 (138) 40 No (NESB) 48 (19) 39.6
Occupational Factors
Length of employment in
current workplace 405
> 5 years
< 5years (ref) 1.39 1.10- 1.78 0.006*
Less than 5 years 219 (74) 33.8
5 – 9 years 83 (37) 44.6 10 years or more 103 (50) 49.5
Working hours/week 383 > 45 hours
< 45 hours (ref) 1.20 0.84- 1.72 0.307
Less 35 hours 75 (25) 33.3 35 - 44 hours 269 (110) 41 45 hours or more 39 (18) 47.4
Workload 404 Medium & Heavy
Sedentary & Light (ref) 1.04 0.82- 1.33 0.716
Sedentary 46 (15) 32.6 Light 138 (57) 41.3 Medium 208 (84) 40.4 Heavy 12 (6) 50
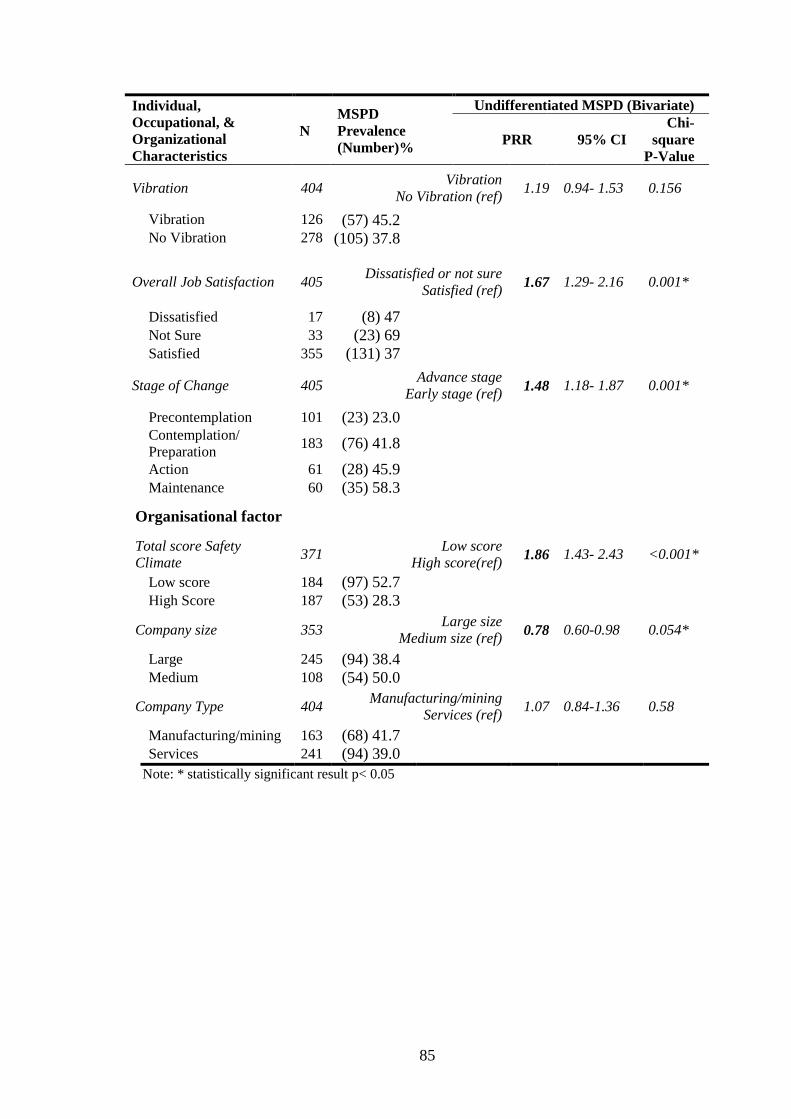
85
Individual,
Occupational, &
Organizational
Characteristics
N
MSPD
Prevalence
(Number)%
Undifferentiated MSPD (Bivariate)
PRR 95% CI
Chi-
square
P-Value
Vibration 404 Vibration
No Vibration (ref) 1.19 0.94- 1.53 0.156
Vibration 126 (57) 45.2 No Vibration 278 (105) 37.8
Overall Job Satisfaction 405 Dissatisfied or not sure
Satisfied (ref) 1.67 1.29- 2.16 0.001*
Dissatisfied 17 (8) 47 Not Sure 33 (23) 69 Satisfied 355 (131) 37
Stage of Change 405 Advance stage
Early stage (ref) 1.48 1.18- 1.87 0.001*
Precontemplation 101 (23) 23.0 Contemplation/
Preparation 183 (76) 41.8
Action 61 (28) 45.9 Maintenance 60 (35) 58.3
Organisational factor
Total score Safety
Climate 371
Low score
High score(ref) 1.86 1.43- 2.43 <0.001*
Low score 184 (97) 52.7 High Score 187 (53) 28.3
Company size 353 Large size
Medium size (ref) 0.78 0.60-0.98 0.054*
Large 245 (94) 38.4 Medium 108 (54) 50.0
Company Type 404 Manufacturing/mining
Services (ref) 1.07 0.84-1.36 0.58
Manufacturing/mining 163 (68) 41.7 Services 241 (94) 39.0
Note: * statistically significant result p< 0.05

86
Concerning the organisational characteristics, such as workers’ perceptions of a company’s
safety climate, those with negative or uncertain perceptions were 1.2 times more likely to
report MSPD compared to those with a positive perception of the safety climate. Workers in
medium sized companies and in manufacturing companies were more likely to report MSPD
than those in large sized companies. Mining/manufacturing and services companies were
similar in respect of MSPD prevalence.
In the bivariate analyses, age (p =0.029) overall job satisfaction (p = 0.001), stage of
behaviour change (p = 0.001), length of employment (p = 0.006) safety climate (p< 0.001)
were significantly associated with undifferentiated MSPD. The company size (p = 0.054) was
considered to be statistically significant associated with MSPD since the 95% CI of its
prevalence rate ratio was 0.60-0.98.

87
Table 3.13 presents the findings of the multivariate regression analyses for MSPD. This table
shows that there were significant associations between MSPD and job dissatisfaction, longer
length of employment, advanced SOC, lower score safety climate, and smaller company size.
Workers who were satisfied with their current job were less likely to have MSPD than those
who were dissatisfied and not sure. Employees who had durations of employment of 5 years
or more were also more likely to report MSPD compared with those who had less than 5 years
of employment.
Table 3.13 Multivariate logistic regression: The odd ratio, 95% CI and P-value of the
association between undifferentiated MSPD and individual /occupational/organisational
factors in baseline survey.
Individual/Occupational/ Organizational
Characteristics
Undifferentiated MSPD
in the last 7 days
Odds Ratio P-value (95% CI)
Gender Covariate
Age
Older > 40 1.04 0.88 (0.60 – 1.78)
Younger < 40 (ref) . . .
Length of Employment in the current job
> 5 years 2.32 0.003* (1.34 – 4.03)
< 5 years (ref) . . .
Vibration
Vibration: YES 1.10 0.72 (0.64 – 1.89)
Vibration: NO (ref) . . .
Job Satisfaction
Dissatisfied/not sure 2.56 0.016* (1.18 – 5.54)
Satisfied (ref) . . .
Safety Climate total score
Lower score 2.47 <0.001* (1.49 – 4.09)
Higher score (ref) . . .
Stage of Change
Advance stage 2.39 0.001* (1.40 – 4.08)
Early Stage (ref) . . .
Company Size
Large 0.51 0.014* (0.29 – 0.87)
Medium (ref) . . .
Note: * statistically significant result p< 0.05, Enter all variables P-value <0.2, except for age and gender if
P-value>0.2 enter as covariate.

88
On the other hand, workers with a lower score of safety climate and were in an advanced SOC
more likely to report MSPD than those with high score safety climate and who were in early
stage. Finally workers in large companies (> 200 employees) were less frequently reporting
MSPD than those in medium sized companies.
Thus the multivariate regression model confirmed that years of employment, job satisfaction,
safety climate, and SOC were significant correlates of MSPD.
3.3.3.2 The Association between Severe MSPD and Individual / Occupational/
Organisational Characteristics (Bivariate and Multivariate Analysis) in the Baseline
Survey
Table 3.14 indicates the associations of Severe MSPD Prevalence Rate Ratio (PRR) with
worker/ occupational characteristics/organisational in a bivariate analysis.
The individual characteristics show that women were 1.6 times more likely to report severe
MSPD than were men (non-sig, borderline). Younger workers had about half the rate of
severe MSPD than the older workers (significant).
Those with longer length of employment had rates of severe MSPD 1.78 times higher than
those with less work experience. Employees who work 45 hours weekly or more had a higher
percentage of MSPD than those who work less than 45 hours. Those who were dissatisfied
(or not sure) with their job showed twice the odds of severe MSPD as those who were
satisfied. Those who had sedentary or light workload were less likely to report MSPD than
those who had medium and heavy workload. Finally, workers who exposed to vibration had
higher percentage of severe MSPD than those who did not, but this was not statistically
significant.
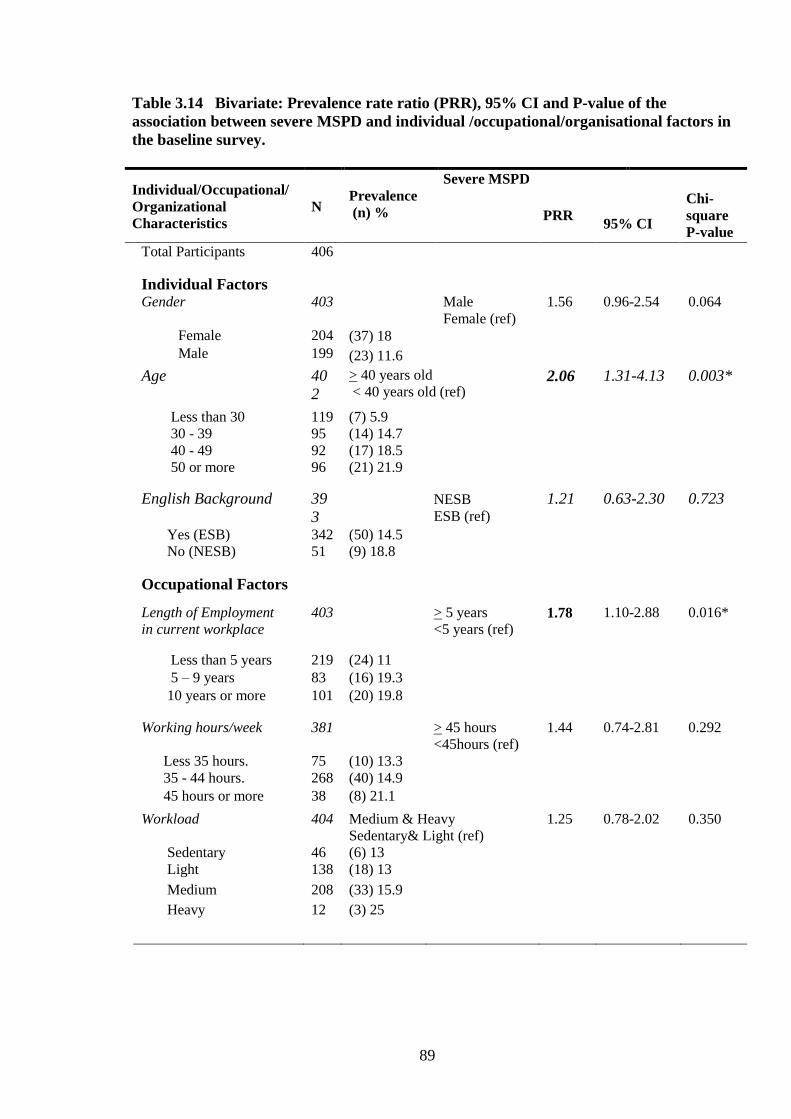
89
Table 3.14 Bivariate: Prevalence rate ratio (PRR), 95% CI and P-value of the
association between severe MSPD and individual /occupational/organisational factors in
the baseline survey.
Individual/Occupational/
Organizational
Characteristics
N
Prevalence
(n) %
Severe MSPD
PRR
95% CI
Chi-
square
P-value
Total Participants 406
Individual Factors
Gender 403 Male
Female (ref)
1.56 0.96-2.54 0.064
Female 204 (37) 18
Male 199 (23) 11.6
Age 40
2
> 40 years old
< 40 years old (ref) 2.06 1.31-4.13 0.003*
Less than 30 119 (7) 5.9
30 - 39 95 (14) 14.7
40 - 49 92 (17) 18.5
50 or more 96 (21) 21.9
English Background 39
3
NESB
ESB (ref) 1.21 0.63-2.30 0.723
Yes (ESB) 342 (50) 14.5
No (NESB) 51 (9) 18.8
Occupational Factors
Length of Employment
in current workplace
403 > 5 years
<5 years (ref) 1.78 1.10-2.88 0.016*
Less than 5 years 219 (24) 11
5 – 9 years 83 (16) 19.3
10 years or more 101 (20) 19.8
Working hours/week 381 > 45 hours
<45hours (ref)
1.44 0.74-2.81 0.292
Less 35 hours. 75 (10) 13.3
35 - 44 hours. 268 (40) 14.9
45 hours or more 38 (8) 21.1
Workload 404 Medium & Heavy
Sedentary& Light (ref)
1.25 0.78-2.02 0.350
Sedentary 46 (6) 13
Light 138 (18) 13
Medium 208 (33) 15.9
Heavy 12 (3) 25
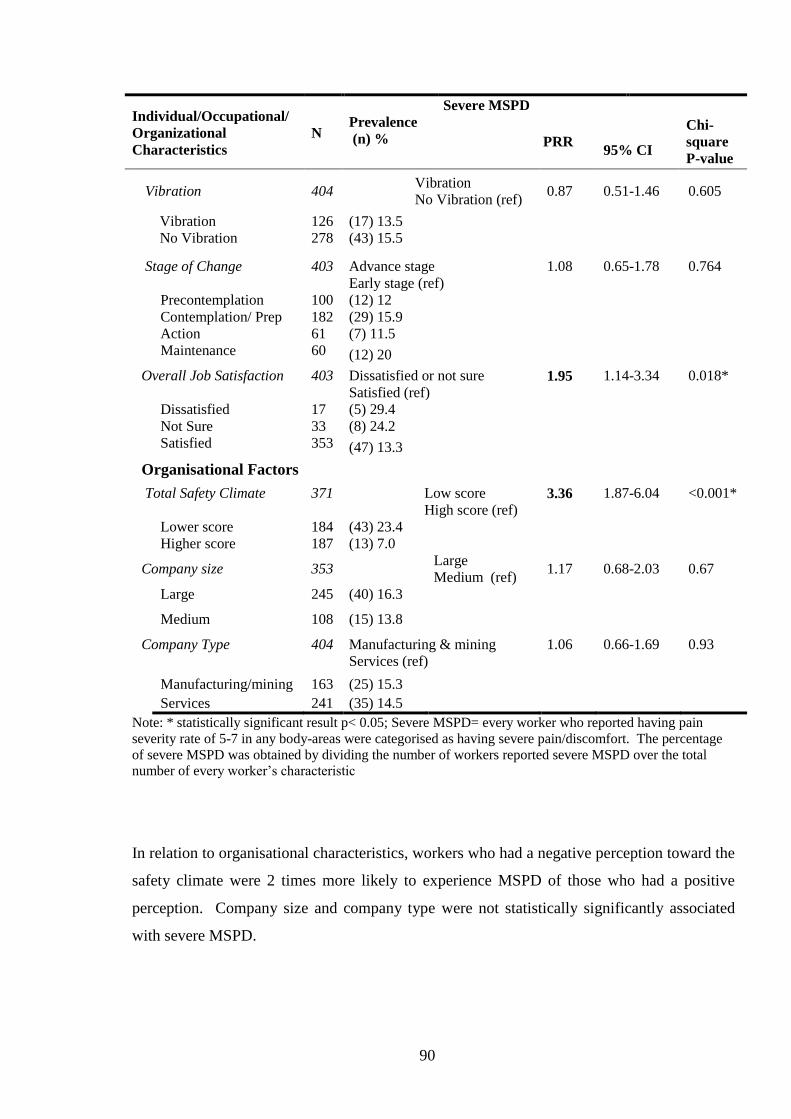
90
Individual/Occupational/
Organizational
Characteristics
N
Prevalence
(n) %
Severe MSPD
PRR
95% CI
Chi-
square
P-value
Vibration 404 Vibration
No Vibration (ref) 0.87 0.51-1.46 0.605
Vibration 126 (17) 13.5
No Vibration 278 (43) 15.5
Stage of Change 403 Advance stage
Early stage (ref)
1.08 0.65-1.78 0.764
Precontemplation 100 (12) 12
Contemplation/ Prep 182 (29) 15.9
Action 61 (7) 11.5
Maintenance 60 (12) 20
Overall Job Satisfaction 403 Dissatisfied or not sure
Satisfied (ref) 1.95 1.14-3.34 0.018*
Dissatisfied 17 (5) 29.4
Not Sure 33 (8) 24.2
Satisfied 353 (47) 13.3
Organisational Factors
Total Safety Climate
371 Low score
High score (ref) 3.36 1.87-6.04 <0.001*
Lower score 184 (43) 23.4
Higher score 187 (13) 7.0
Company size 353 Large
Medium (ref) 1.17 0.68-2.03 0.67
Large 245 (40) 16.3
Medium 108 (15) 13.8
Company Type 404 Manufacturing & mining
Services (ref)
1.06 0.66-1.69 0.93
Manufacturing/mining 163 (25) 15.3
Services 241 (35) 14.5
Note: * statistically significant result p< 0.05; Severe MSPD= every worker who reported having pain
severity rate of 5-7 in any body-areas were categorised as having severe pain/discomfort. The percentage
of severe MSPD was obtained by dividing the number of workers reported severe MSPD over the total
number of every worker’s characteristic
In relation to organisational characteristics, workers who had a negative perception toward the
safety climate were 2 times more likely to experience MSPD of those who had a positive
perception. Company size and company type were not statistically significantly associated
with severe MSPD.
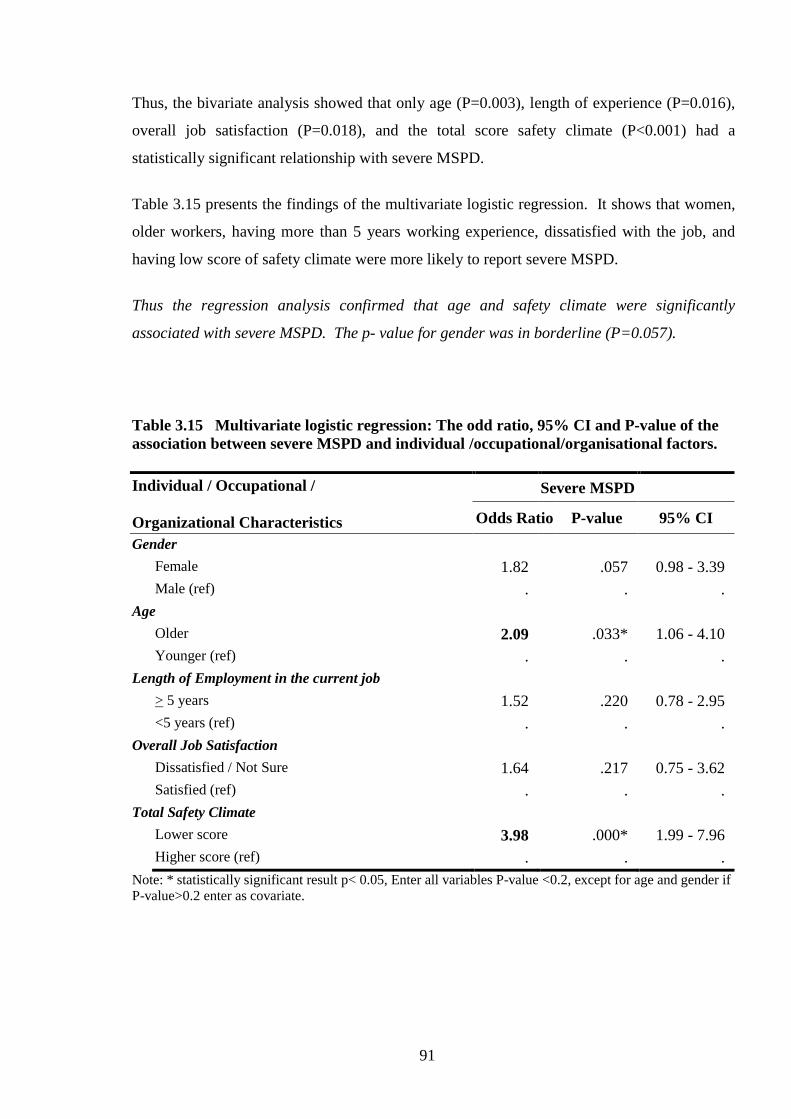
91
Thus, the bivariate analysis showed that only age (P=0.003), length of experience (P=0.016),
overall job satisfaction (P=0.018), and the total score safety climate (P<0.001) had a
statistically significant relationship with severe MSPD.
Table 3.15 presents the findings of the multivariate logistic regression. It shows that women,
older workers, having more than 5 years working experience, dissatisfied with the job, and
having low score of safety climate were more likely to report severe MSPD.
Thus the regression analysis confirmed that age and safety climate were significantly
associated with severe MSPD. The p- value for gender was in borderline (P=0.057).
Table 3.15 Multivariate logistic regression: The odd ratio, 95% CI and P-value of the
association between severe MSPD and individual /occupational/organisational factors.
Individual / Occupational /
Organizational Characteristics
Severe MSPD
Odds Ratio P-value 95% CI
Gender
Female 1.82 .057 0.98 - 3.39
Male (ref) . . .
Age
Older 2.09 .033* 1.06 - 4.10
Younger (ref) . . .
Length of Employment in the current job
> 5 years 1.52 .220 0.78 - 2.95
<5 years (ref) . . .
Overall Job Satisfaction
Dissatisfied / Not Sure 1.64 .217 0.75 - 3.62
Satisfied (ref) . . .
Total Safety Climate
Lower score 3.98 .000* 1.99 - 7.96
Higher score (ref) . . .
Note: * statistically significant result p< 0.05, Enter all variables P-value <0.2, except for age and gender if
P-value>0.2 enter as covariate.
92
3.3.3.3 The Association between Neck, Shoulder and Low Back MSPD and
Individual/ Occupational/ Organisational Characteristic (Bivariate and Multivariate
analysis) in the Baseline Survey
The relationships of neck, shoulder, and lower back MSPD with individual/ job/ organisation
factors are presented in in Table 3.16. The results of the multivariate analyses are given in
Table 3.17.
Bivariate analyses found that neck MSPD was statistically significantly associated with length
of employment, and safety climate. Workers who worked 5 years or more or had a lower
score of safety climate more frequently reported neck MSPD. Shoulder MSPD was
statistically significantly associated with longer length of employment, advanced SOC, job
dissatisfaction, lower score of safety climate and smaller company type. Those workers, who
had 5 years or more duration of work, were in advanced SOC, dissatisfied with their job, and
had lower score of safety climate and who were in manufacturing/mining companies, reported
shoulder MSPD more frequently.
Lower back MSPD was significantly (and positively) related to exposure to vibration,
advanced SOC, job dissatisfaction and lower score of safety climate.

93
Table 3.16 Bivariate: The prevalence rate ratio (PRR), 95%CI of the association neck,
shoulder and lower back MSPD with individual /occupational/organisational factors in
the baseline survey.
Individual/Occupational /
Organizational Characteristics
MSPD - Neck MSPD - Shoulder MSPD – Lower back
N PRR 95% CI PRR 95% CI PRR 95% CI
Individual Factors
Age group
≥40 years
<40years (ref)
402
1.63
0.97-2.74
1.41
0.94-2.11
1.34
0.85-2.10
Gender
Female
Male (ref)
403
1.33
0.79-2.23
1.21
0.80-1.81
1.07
0.68-1.69
English speaking background
NESB
ESB (ref)
393
0.74
0.31-1.78
1.32
0.76-2.27
0.34
0.11-1.05
Occupational Factors
Length employment
>=5years
< 5 years (ref)
403
2.07
1.22-3.51 *
1.78
1.17-2.71*
1.39
0.88-2.19
Worked hours
>45 hours/week
<45 hours/week (ref)
381
0.98
0.42-2.32
1.11
0.57-2.13
1.02
0.47-2.22
Workload
Medium- heavy
Sedentary- light (ref)
404
0.98
0.58-1.62
0.88
0.58-1.32
1.27
0.79-2.02
Vibration
Exposed
No Exposed (ref)
404
0.98
0.56-1.70
0.89
0.57-1.41
1.65
1.05-2.60 *
SOC
Advanced
Early stage (ref)
403
1.58
0.95-2.63
1.52
1.01-2.28 *
1.86
1.19-2.92 *
Overall Job satisfaction
Dissatisfied or not sure
Satisfied (ref)
403
1.68
0.90-3.13
1.88
1.18-2.99 *
2.12
1.21-3.38 *
Organisational Factors
Total safety climate score
Lower
Higher (ref)
371
3.33
1.75-6.33 *
2.37
1.48-3.79 *
2.32
1.38-3.87 *
Company size
Large
Medium (ref)
353
1.13
0.63-2.01
1.02
0.65-1.59
0.99
0.58-1.66
Company type
Manufacturing & mining
Services (ref)
404
1.00
0.59-1.68
1.56
1.04-2.33*
0.85
0.53-1.36
Note: * statistically significant result p< 0.05
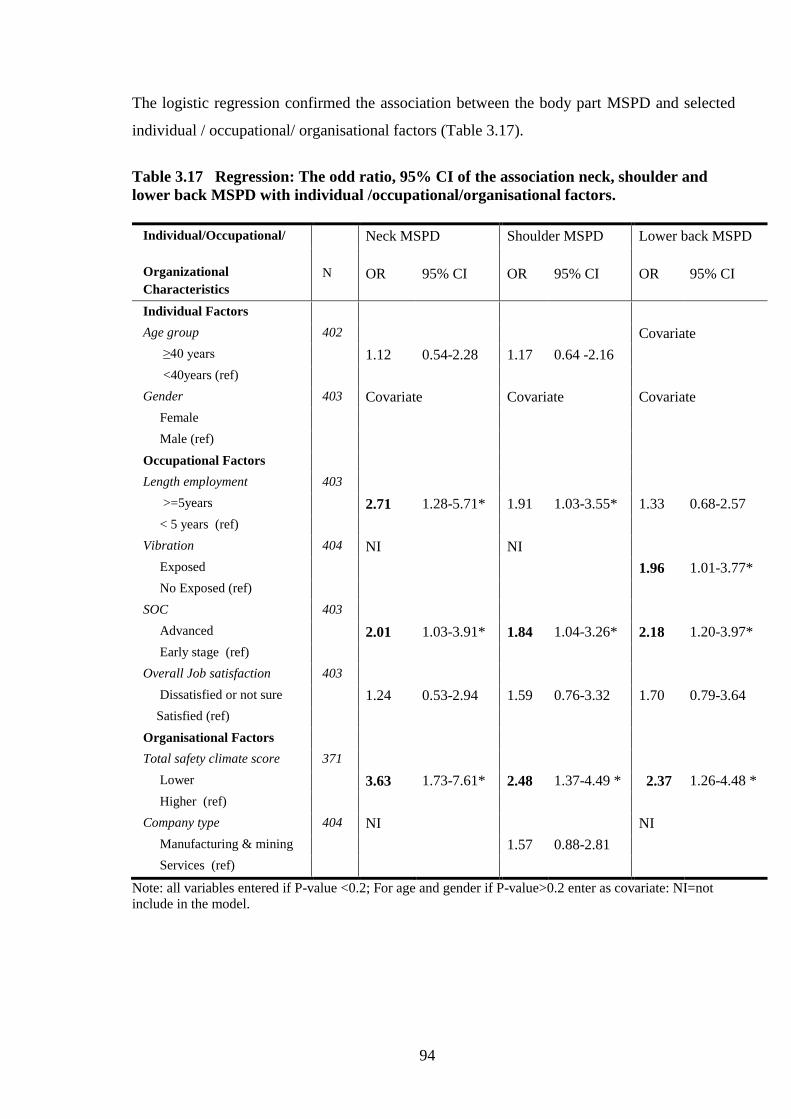
94
The logistic regression confirmed the association between the body part MSPD and selected
individual / occupational/ organisational factors (Table 3.17).
Table 3.17 Regression: The odd ratio, 95% CI of the association neck, shoulder and
lower back MSPD with individual /occupational/organisational factors.
Individual/Occupational/
Organizational
Characteristics
Neck MSPD Shoulder MSPD Lower back MSPD
N OR 95% CI OR 95% CI OR 95% CI
Individual Factors
Age group 402 Covariate
≥40 years 1.12 0.54-2.28 1.17 0.64 -2.16
<40years (ref)
Gender 403 Covariate Covariate Covariate
Female
Male (ref)
Occupational Factors
Length employment 403
>=5years 2.71 1.28-5.71* 1.91 1.03-3.55* 1.33 0.68-2.57
< 5 years (ref)
Vibration 404 NI NI
Exposed 1.96 1.01-3.77*
No Exposed (ref)
SOC 403
Advanced 2.01 1.03-3.91* 1.84 1.04-3.26* 2.18 1.20-3.97*
Early stage (ref)
Overall Job satisfaction 403
Dissatisfied or not sure 1.24 0.53-2.94 1.59 0.76-3.32 1.70 0.79-3.64
Satisfied (ref)
Organisational Factors
Total safety climate score 371
Lower 3.63 1.73-7.61* 2.48 1.37-4.49 * 2.37 1.26-4.48 *
Higher (ref)
Company type 404 NI NI
Manufacturing & mining 1.57 0.88-2.81
Services (ref)
Note: all variables entered if P-value <0.2; For age and gender if P-value>0.2 enter as covariate: NI=not
include in the model.
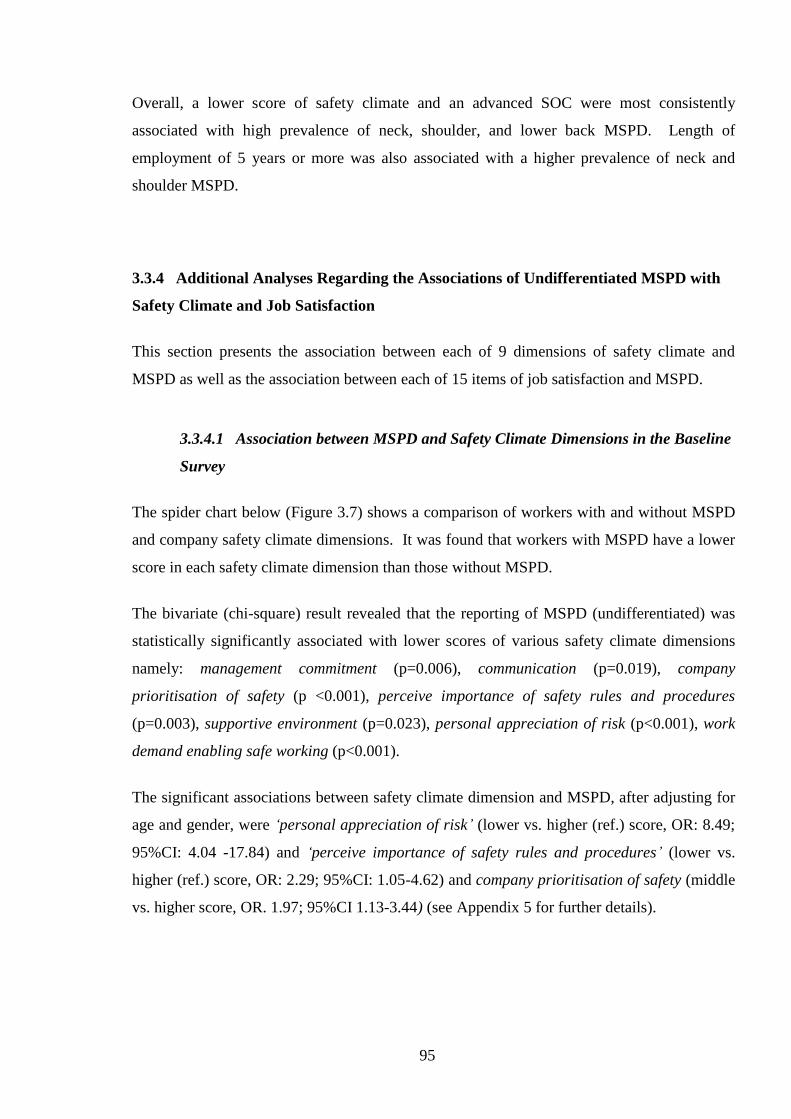
95
Overall, a lower score of safety climate and an advanced SOC were most consistently
associated with high prevalence of neck, shoulder, and lower back MSPD. Length of
employment of 5 years or more was also associated with a higher prevalence of neck and
shoulder MSPD.
3.3.4 Additional Analyses Regarding the Associations of Undifferentiated MSPD with
Safety Climate and Job Satisfaction
This section presents the association between each of 9 dimensions of safety climate and
MSPD as well as the association between each of 15 items of job satisfaction and MSPD.
3.3.4.1 Association between MSPD and Safety Climate Dimensions in the Baseline
Survey
The spider chart below (Figure 3.7) shows a comparison of workers with and without MSPD
and company safety climate dimensions. It was found that workers with MSPD have a lower
score in each safety climate dimension than those without MSPD.
The bivariate (chi-square) result revealed that the reporting of MSPD (undifferentiated) was
statistically significantly associated with lower scores of various safety climate dimensions
namely: management commitment (p=0.006), communication (p=0.019), company
prioritisation of safety (p <0.001), perceive importance of safety rules and procedures
(p=0.003), supportive environment (p=0.023), personal appreciation of risk (p<0.001), work
demand enabling safe working (p<0.001).
The significant associations between safety climate dimension and MSPD, after adjusting for
age and gender, were ‘personal appreciation of risk’ (lower vs. higher (ref.) score, OR: 8.49;
95%CI: 4.04 -17.84) and ‘perceive importance of safety rules and procedures’ (lower vs.
higher (ref.) score, OR: 2.29; 95%CI: 1.05-4.62) and company prioritisation of safety (middle
vs. higher score, OR. 1.97; 95%CI 1.13-3.44) (see Appendix 5 for further details).
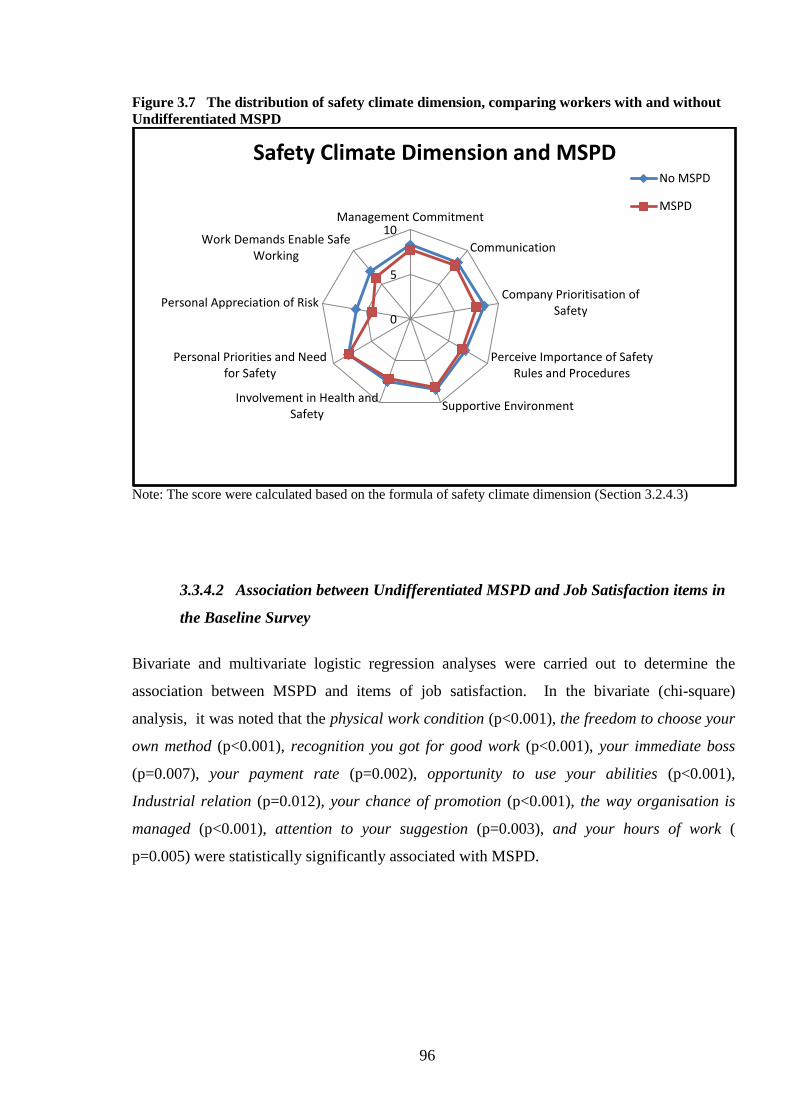
96
Figure 3.7 The distribution of safety climate dimension, comparing workers with and without
Undifferentiated MSPD
Note: The score were calculated based on the formula of safety climate dimension (Section 3.2.4.3)
3.3.4.2 Association between Undifferentiated MSPD and Job Satisfaction items in
the Baseline Survey
Bivariate and multivariate logistic regression analyses were carried out to determine the
association between MSPD and items of job satisfaction. In the bivariate (chi-square)
analysis, it was noted that the physical work condition (p<0.001), the freedom to choose your
own method (p<0.001), recognition you got for good work (p<0.001), your immediate boss
(p=0.007), your payment rate (p=0.002), opportunity to use your abilities (p<0.001),
Industrial relation (p=0.012), your chance of promotion (p<0.001), the way organisation is
managed (p<0.001), attention to your suggestion (p=0.003), and your hours of work (
p=0.005) were statistically significantly associated with MSPD.
0
5
10Management Commitment
Communication
Company Prioritisation ofSafety
Perceive Importance of SafetyRules and Procedures
Supportive EnvironmentInvolvement in Health and
Safety
Personal Priorities and Needfor Safety
Personal Appreciation of Risk
Work Demands Enable SafeWorking
Safety Climate Dimension and MSPD No MSPD
MSPD

97
After adjusting for age and gender, the multivariate regression model found that MSPD was
statistically significantly associated with various elements of job dissatisfaction namely: the
physical work condition (dissatisfied vs. satisfied, OR: 2.28, 95%CI: 1.16-4.47), recognition
you got for good work (dissatisfied vs. satisfied, OR: 1.99, 95%CI: 0.99-3.99), your hours of
work (dissatisfied vs. satisfied, OR: 2.47, 95%CI: 1.09-5.61) (Appendix 5).
3.4 Summary of the Main Findings
Finally, Table 3.18 summarises the main findings of the Baseline Survey.
Table 3.18 Summary of the main finding of baseline survey.
Outcome measure Finding
Prevalence of MSPD:
- Undifferentiated MSPD
- Severe MSPD
- Neck MSPD
- Shoulder MSPD
- Lower back MSPD
40% (162/406)
15% (60/406)
12% (52/406)
18.7% (76/406)
15.5% (63/406)
Association between MSPD and risk factors
- Undifferentiated MSPD
- Severe MSPD
- Neck MSPD
- Shoulder MSPD
- Lower back MSPD
Longer length of employment, Job dissatisfaction, lower score SC,
advanced stage of SOC and smaller company size
Older age group, Lower SC score
Longer length of employment, advance stage of SOC, lower score
SC
Longer length of employment, advance stage of SOC, lower SC
score
Exposure to vibration, advanced stage of SOC, lower SC score
Association between
Undifferentiated MSPD with
Safety Climate dimensions
Lower score of Personal appreciation of risk, Perceive importance
of safety rules and procedures, and Company prioritisation of
safety.
Association between
Undifferentiated MSPD with
Job Satisfaction items
Dissatisfaction of The physical work condition, Recognition you
got for good work, Your hours of work
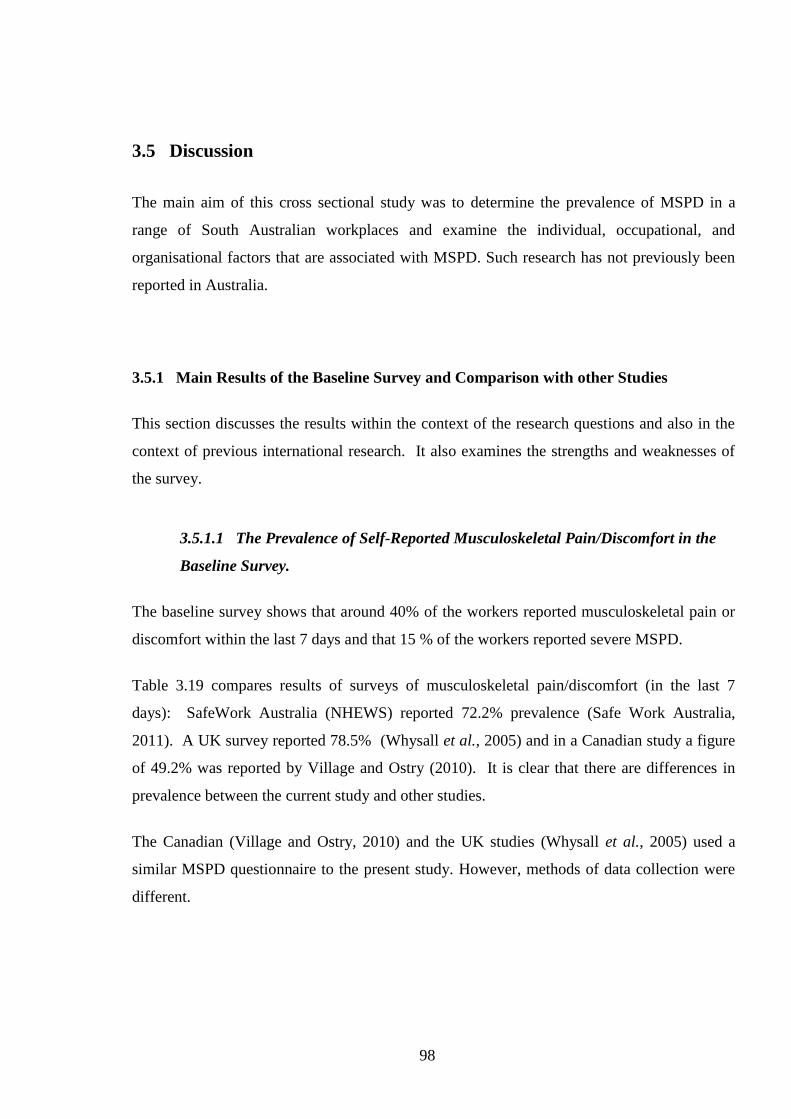
98
3.5 Discussion
The main aim of this cross sectional study was to determine the prevalence of MSPD in a
range of South Australian workplaces and examine the individual, occupational, and
organisational factors that are associated with MSPD. Such research has not previously been
reported in Australia.
3.5.1 Main Results of the Baseline Survey and Comparison with other Studies
This section discusses the results within the context of the research questions and also in the
context of previous international research. It also examines the strengths and weaknesses of
the survey.
3.5.1.1 The Prevalence of Self-Reported Musculoskeletal Pain/Discomfort in the
Baseline Survey.
The baseline survey shows that around 40% of the workers reported musculoskeletal pain or
discomfort within the last 7 days and that 15 % of the workers reported severe MSPD.
Table 3.19 compares results of surveys of musculoskeletal pain/discomfort (in the last 7
days): SafeWork Australia (NHEWS) reported 72.2% prevalence (Safe Work Australia,
2011). A UK survey reported 78.5% (Whysall et al., 2005) and in a Canadian study a figure
of 49.2% was reported by Village and Ostry (2010). It is clear that there are differences in
prevalence between the current study and other studies.
The Canadian (Village and Ostry, 2010) and the UK studies (Whysall et al., 2005) used a
similar MSPD questionnaire to the present study. However, methods of data collection were
different.

99
The current study employed face to face interviews whereas previous studies (including the
NHEWS study) used telephone/mail survey methods. Unfortunately, the description of
distribution of questionnaires in the UK study was not available.
Table 3.19 Comparison of prevalence of MSPD in the last 7 days between studies.
Therefore, these disparities with Australian and international reports might be due to the
variations in questionnaires used and data collection methods. Regardless of methodology,
another reason for this difference could be due to the variation in company or government
health and safety policy/interventions in particular countries.
With regards to MSPD in specific body areas, the most commonly reported MSPD areas were
shoulder (47%), lower back (39%), and neck (32%) respectively. This was a similar finding
to previous studies, albeit, their sequences were different. The Canadian study (Village and
Ostry, 2010) revealed that back pain was the most common followed by neck and shoulder.
The UK study (Whysall et al., 2006) respectively found back pain, shoulder, and neck.
The diversity of these findings could be associated with the kinds of tasks the participants in
each study had. For example, if the tasks mostly required working above shoulder level, the
most affected parts tended to be shoulders or neck. Also, highly repetitive work was found to
be associated with neck and shoulder pain (Bernard, 1997). This result might support the
current study since the majority of participants were manufacturing workers. This study also
Location
Comparative MSPD Prevalence
South Australia (current study) 39.9 %
Australia (NHEWS (Safe Work
Australia, 2011))
72.2 %
UK (Whysall et al., 2005) 78.5%
Canada (Village and Ostry,
2010)
49.2%

100
found that workers in manufacturing /mining significantly have more shoulder pain than those
in service type of company. Heavy physical work, lifting, and forceful movement was
associated with lower back pain (Bernard, 1997, Widanarko et al., 2012 a,b). These 2 studies
supported the Canadian study, which had observed MSPD in the construction industry.
However, the prevalence among the studies should be treated with caution due to the diversity
of methods and terms addressing musculoskeletal pain.
3.5.1.2. The Association of MSPD with Individual / Occupational/ Organisational
Factors
Before adjusting for cofounders this study found that individual factors (age), occupational
factors (length of employment, job satisfaction, SOC) and organisational factors (safety
climate, company size, company type) were associated with MSPD.
After adjusting for cofounders, the most important correlates with MSPD were longer length
of employment (undifferentiated MSPD, neck MSPD, shoulder MSPD), job dissatisfaction
(undifferentiated MSPD, shoulder MSPD, and lower back MSPD), lower safety climate score
(undifferentiated MSPD, severe MSPD, neck MSPD, shoulder MSPD, and lower back
MSPD), and advanced SOC (undifferentiated MSPD, shoulder MSPD, and lower back
MSPD). Additionally, it was found that vibration was associated with lower back MSPD.
Individual factors:
Age was also considered as an important predictor of severe MSPD. The workers in the age
group of more than 40 were more likely to report severe MSPD. However, the prevalence of
undifferentiated MSPD in the more than 50 age group was less than for those in the age group
of 40-49. This result supports a previous study reviewing age and work that found that older
workers had experienced less frequent but more severe work related illnesses (Silverstein,
2008). Another possible reason may have been due to seniority or survivor bias as the oldest
workers may no longer have been able to carry out heavy tasks, or those with severe pain
were not working anymore (Punnett, 1996). Age itself may affect body deterioration, even
though the somatic mechanisms of the deterioration in older people remain uncertain. This
may be due to an effect of hormonal and physiological change when people getting older
101
(Woo, et a. (2008) in (Kumar, 2008b). In addition, women aged more than 45 years with
menopause syndrome were likely to experience stress and somatic pain (Hunter, 1990).
However, the baseline survey did not found that gender was associated with MSPD. Previous
research also found that gender was not associated with WRMSPD (Daraiseh, et al., 2010).
Occupational factors:
Length of employment in the current job also had a relationship with MSPD. This survey
found that workers who have a longer duration of work reported MSPD more frequently.
This supports a previous study (Alipour et al., 2008). This could be explained, as workers
with longer duration of employment may feel more confident to report pain than those newly
employed workers. New workers might feel insecure to complain about health problems. On
the other hand, researchers in another study (Daraiseh et al., 2010) found that the longer the
work experience, the less musculoskeletal pain reported and argued that this was because
workers become adjusted and have more experience to handling the tasks. The differences
with this current study might be because of the difference in the questions addressing the
musculoskeletal pain. The previous study used musculoskeletal symptoms within 12 month,
while this study used musculoskeletal pain prior 7 days.
A significant relationship was also found between job satisfaction, and MSPD in workplaces.
Workers dissatisfied with their jobs were more likely to report MSPD. This supports the
findings from a veterinarian study in New Zealand (Scuffham et al., 2010). It is plausible that
dissatisfaction with a job might relate to stress at work, which in turn may generate
psychosomatic problems such as musculoskeletal pain, high blood pressure, gastritis, etc.
Marchand and coworkers (2005) also found that psychological distress increased with job
insecurity. It could be also interpreted that those workers, who were frequently experiencing
pain, may become dissatisfied with their job.
Therefore, it is difficult to suggest which comes first - health problems or job dissatisfaction.
This study, being cross-sectional in design doesn’t provide any insight.
Regarding the SOC, the highest proportion of workers was in a Contemplation/Preparation
stage. Initially, it was assumed that an advanced SOC might relate to low frequency of
102
MSPD, but in fact the results were the reverse. The advanced stages (action and maintenance)
were more likely to report MSPD than the early stages (precontemplation,
contemplation/preparation), which is consistent with a previous study (Village and Ostry,
2010). Workers at an advanced stage might be more compliant towards safety policy in terms
of reporting hazards in the workplaces or they might be more aware of the risk of MSPD. In
any case the alternate assumption could be that those who suffer from pain or discomfort were
more likely to heed the advice and take action (Village and Ostry, 2010).
Another risk associated with MSPD is exposure to vibration. The current study found a
relationship between exposure to vibration and lower back MSPD which was consistent with
previous studies (Bernard, 1997; Bongers and Boshuizen, 1992). Whole body vibration, in
particular, might have an impact on the back and could generate pain or disorders in this body
area (Village and Morrison, 2008).
Interestingly, MSPD was not associated with workload, which is inconsistent with other
studies (de Zwart et al., 1997b, Widanarko et al., 2011). The inconsistency may due to the
different methods used. De Zwart et al. (1997) used the defined occupational title developed
by them to assess the workload while this study used the defined physical workload in the
dictionary of occupational title (DOT). The categorisation in DOT may differ from those by
Widanarko et al. (2011). To assess the workload, Widanarko used the modified Standardised
Nordic Musculoskeletal questionnaire. The other possibility is the difference in terms and
definition addressing MSD. This current study used MSPD within the previous 7 days, while
the other study used the 12 months musculoskeletal symptom experience. Another possible
reason is that the sample size, in previous studies was >3000 participants (Widanarko, et al.,
2011), whereas, this study had a sample size of 400 participants.
Organisational factors:
An important finding from the baseline survey was that safety climate was a robust risk factor
for undifferentiated MSPD, severe MSPD, neck MSPD, shoulder MSPD, and lower back
MSPD. This survey supports previous studies that found that positive organisation safety
climate was related to less work-related illness or injuries (Seo et al., 2004, Huang et al.,
2007, Clarke, 2006, Vinodkumar and Bhasi, 2009). This might have been due to workers’

103
positive perceptions of safety climate, which may have reflected an organisation’s
constructive safety policy, procedures, and practice (Cox and Cheyne, 2000). One study
found a positive relationship between safety climate and workers safety attitude (Pousette et
al., 2008). Another revealed that workers perception of safety was affected by management
commitment and supervisor support (Seo et al., 2004).
Another consideration is company size. Workers in medium sized companies were found to
report undifferentiated MSPD more frequently than the large companies. This is in line with a
previous study (Morse et al., 2004) that found the larger companies reported lowest rate of
MSD. However, it was contradicted in another annual survey that showed higher incidence
rates of MSD in larger companies (NIOSH, 2000 in Morse et al. (2004)). Morse et a.l (2004)
argued that the NIOSH finding was not the real distribution, but there is likely to be under-
reporting in smaller companies.
This current result also should be interpreted with caution since only medium and large
companies participated in the study. Since studies appear to be inconsistent in delineating
safe work environments, it is necessary to conduct more studies with regards to the relation
between company size and health and safety problems.
3.5.2 Strengths and Weaknesses of the Baseline Survey
3.5.2.1 Strengths of this Study
The individual characteristics, such as age and gender, were similar to those in Australia and
South Australia populations. Moreover, a wide range of industry types participated including
manufacturing, food industries, health care services, mining, professional sectors, and other
services. Therefore, this study could be generalised widely within Australia.
The survey was undertaken in workplaces. Onsite data collection and semi structured
interviews were carried out one by one in a closed room to ensure that workers felt secure.
This method was considered an appropriate one as a way of reducing over and/or under
reporting of MSPD and other confidential issues, such as job satisfaction and safety climate.
104
The face-to-face method allowed the interviewer to explain uncertain questions, which is
more likely to prevent over reporting. However, undertaking interviews in the workplace may
still have caused workers to feel insecure, which may have influenced the survey results
(Pransky et al., 1999).
The question of MSPD within 7 days was used to reduce recall bias. People commonly forget
if he/she was experiencing pain/ discomfort, except severe pain or chronic pain. In addition,
the analysis of severe pain was conducted in order to explore the nature of reported pain in
workplace.
This study also addressed a range of variables that were plausible risk factors for MSPD, as
indicated in the conceptual frameworks described in Chapter 2.
3.5.2.2 The Weaknesses of this Study
Even though some effort had been undertaken to increase the response rate such as
encouraging companies to participate through phone calls following the invitation
(Tourangeau, 2004), the participation rate was moderate. Further actions such as repeated
call-backs and giving incentives to increase participation rate (Tourangeau, 2004) were not
undertaken due to a limited budget and time frame. However, as stated before, the
demographic profile was similar to those in South Australia and other Australian states.
Therefore, this would increase generalisability. However this study could not be generalised
to small companies because none of the small companies participated in this study.
The question addressing MSPD in this study was not specific to work related pain, as it was
rather general (‘have you felt any discomfort in the last 7 days?’). Since musculoskeletal pain
or discomfort is a multi-factorial illness (Punnett and Wegman, 2004), misunderstandings by
participants may occur. For example, participants may have reported MSPD, which was not
specifically related to their work, such as musculoskeletal pain caused by doing housework,
awkward sleeping postures, or symptoms due to systemic diseases etc. However, as this
survey was undertaken face to face in the worksite, it enabled the interviewer to clarify the
105
meaning of MSPD, which could minimise such misunderstandings. In addition, participants
could also read the information sheets, which explained the MSPD in detail. While the use of
a self-reported survey of workplace musculoskeletal pain was feasible, applicable, and
affordable for this current study, this method may have lacked validity, compared with the
objective measures described in Chapter 2.
The results of the association of MSPD and the risk factors need to be interpreted with caution
since two difference analysis were undertaken namely prevalence ratio (PR) for the bivariate
analysis and odd ratio (OR) for the regression analysis. However, after checking the
differences between PR and OR (refer to Appendix 4), it was found these differences do not
change the interpretation of the outcomes (Davies et al., 1998).
Workload categorisation used in this study was largely derived from the defined workload in
the Dictionary of Occupational Title (Lee and Chan, 2003). However, this categorisation
might be inaccurately assessing an individual’s workload. For example, individual physical
capacity or capability is an important element to cope with workload. A similar task may
differ in workload requirements between smaller and larger individuals (Kumar, 2008b).
3.6 Conclusions
The baseline survey revealed that MSPD is common in workplaces and that individual factors
(older age), physical factors (exposure to vibration), psychosocial factors (job dissatisfaction),
and organisational factors (smaller company size, lower safety climate score), are associated
with MSPD. However, safety climate was the most consistent factor that correlated with all
types of MSPD. These findings are consistent with the conceptual frameworks of WRMSD
(National Research Council, 2001 and Macdonald and Evans, 2006).
The next Chapter presents the findings of the follow-up survey.
106
CHAPTER 4
THE FOLLOW-UP SURVEY: THE PREVALENCE OF
MUSCULOSKELETAL PAIN/DISCOMFORT AND ITS ASSOCIATION
WITH INDIVIDUAL, OCCUPATIONAL AND ORGANISATIONAL
CHARACTERISTICS
4.1 Introduction
4.1.1 Overview
This Chapter presents findings from the follow-up cross sectional study, which occurred 10 to
12 months after the baseline survey. Note that the follow-up survey was carried after the
implementation of the interventions, which are described in the next Chapter.
The research questions, and methodology of this follow-up survey are the same as those in the
baseline survey.
The outcomes of the follow-up survey will be shown to be similar to those of baseline survey
- that is, workers commonly experienced MSPD and psychosocial factors such as the safety
climate of the organisation were found to be important correlates of MSPD in workplaces.
107
4.1.2 Research Questions
1. What is the prevalence of MSPD (undifferentiated MSPD in the last 7 days, severe MSPD,
and MSPD in each body part) in a representative sample of South Australian workplaces (at
follow-up)?
2. What is the association between MSPD (undifferentiated MSPD in the last 7 days, severe
MSPD, and MSPD in each body part) at follow-up, and the following factors?
• Individual characteristics
o Age
o Gender
o English/Non English Speaking Background (ESB/NESB)
• Occupational characteristics
o Tenure (length of employment)
o Workload
o Vibration exposure
o Job satisfaction
o SOC
• Organisational characteristics
o Safety climate
o Company size
o Company type
108
4.2 Methods
4.2.1 Design
The methods and survey instrument used in the follow-up survey were essentially the same as
those used in the baseline survey (chapter 3, Section 3.2).
4.2.2 Sampling
Companies who participated in the baseline survey were invited to participate in the follow-up
survey. However, some of them could not participate in this study because of particular
reasons such as reorganisation or relocation. A total of 270 workers within 21 companies
participated in the follow-up.
4.2.4 Survey Instruments
The basic questionnaire described in Chapter 3, Section 3.2.4 was kept; however there were
several additional questions that were developed to assess the workers perceptions of the
implementation of the intervention. The additional questions are presented in Appendix 6 and
the results are reported in Chapter 5, Section 5.4.
4.2.5 Research Procedure
The research procedure including Ethics and questionnaire administration for the follow-up
survey were similar to those in baseline survey (see Chapter 3, Section 3.2.5). The renewal of
ethics approval was obtained from The Adelaide University Human Research Ethics
Committee (Appendix 2).
4.2.6 Statistical Data Analysis
Similar data analyses (univariate, bivariate and multivariate) were used to answer the research
questions - see Chapter 3, Section 3.2.6 for details.

109
4.3 Results
Section 4.3.1 describes participants’ characteristics.
Section 4.3.2 addresses research question 1: ‘What is the prevalence of MSPD
(undifferentiated MSPD in the last 7 days, severe MSPD, and MSPD in each body part) in a
representative sample of SA workplaces at the follow-up survey?’
Section 4.3.3 addresses the research question number 2: ‘What is the association between
undifferentiated MSPD/ Severe MSPD / neck, shoulder and lower back MSPD and individual,
occupational, and organisational characteristics at the follow-up?’
4.3.1 The Distribution of Individual, Occupational and Organisational Characteristics
of Participants and the Prevalence of MSPD in the Follow-up Survey (Univariate
analysis)
4.3.1.1 The Distribution of Participants Characteristics in the Follow-Up Survey
A total of 270 workers within 21 companies participated in the follow-up survey. Table 4.1
shows the distribution of workers’ characteristics. The median age was 41.4 years with the
range of 18 to 74 years.
The workers’ distribution according to gender was nearly the same (Male (51%) and Female
(49%). The workers were mostly in the age group of > 40. Workers from a NESB were 16 %
of the total.

110
Table 4.1 Distribution of participant characteristics in the follow-up survey.
Individual
Characteristic Median Range N
Percentage of
Workers
Total
Participants 270
Gender 270
Male 138 51.1%
Female 132 48.9%
Age 41.5 18 - 74 270
Less than 30 52 19.3%
30 - 39 67 24.8%
40 - 49 76 28.1%
50 or more 75 27.8%
English speaking background (ESB) 270
Yes (ESB) 227 84.1%
No (NESB) 43 15.9%
Note: Where totals do not equal 270, data are missing for those variables.
4.3.1.2 Occupational Characteristics in the Follow-Up Survey
Table 4.2 presents the distribution of workers by occupational characteristics. The median
year of employment was 6 with a range of 0.2-52.5 years.
The working hours had a median of 38, with minimum of 4 hours and a maximum of 74
hours. The workers mostly had work experience of <5 years and at their current workplace
were working full time. The highest percentage of workers had the medium workload,
followed by light, sedentary, and heavy workload. Most of the workers were not exposed to
vibration. The percentage of workers who were satisfied with their job was 82.5%. The other
occupational characteristic was SOC.
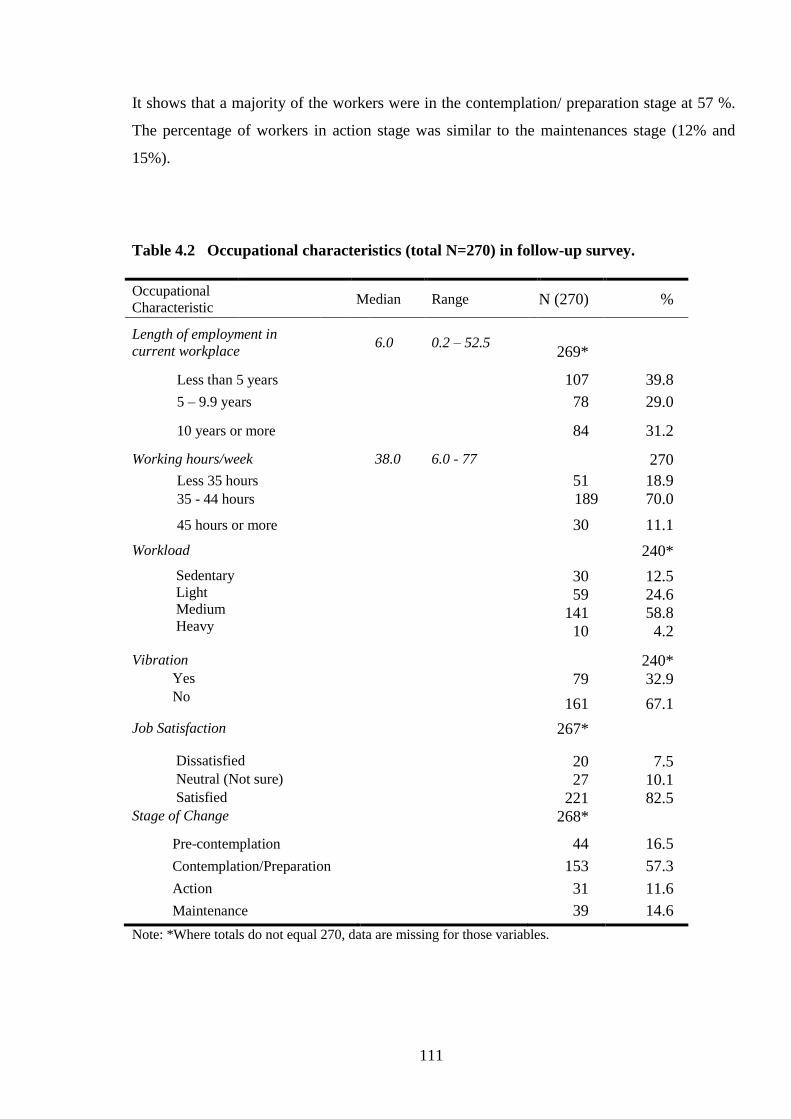
111
It shows that a majority of the workers were in the contemplation/ preparation stage at 57 %.
The percentage of workers in action stage was similar to the maintenances stage (12% and
15%).
Table 4.2 Occupational characteristics (total N=270) in follow-up survey.
Occupational
Characteristic Median Range N (270) %
Length of employment in
current workplace 6.0 0.2 – 52.5
269*
Less than 5 years 107 39.8
5 – 9.9 years 78 29.0
10 years or more 84 31.2
Working hours/week 38.0 6.0 - 77 270
Less 35 hours 51 18.9
35 - 44 hours 189 70.0
45 hours or more 30 11.1
Workload 240*
Sedentary
Light
Medium
Heavy
30 12.5
59 24.6
141 58.8
10 4.2
Vibration 240* Yes 79 32.9 No 161 67.1
Job Satisfaction 267*
Dissatisfied 20 7.5 Neutral (Not sure) 27 10.1 Satisfied 221 82.5 Stage of Change 268*
Pre-contemplation 44 16.5
Contemplation/Preparation 153 57.3
Action 31 11.6
Maintenance 39 14.6
Note: *Where totals do not equal 270, data are missing for those variables.
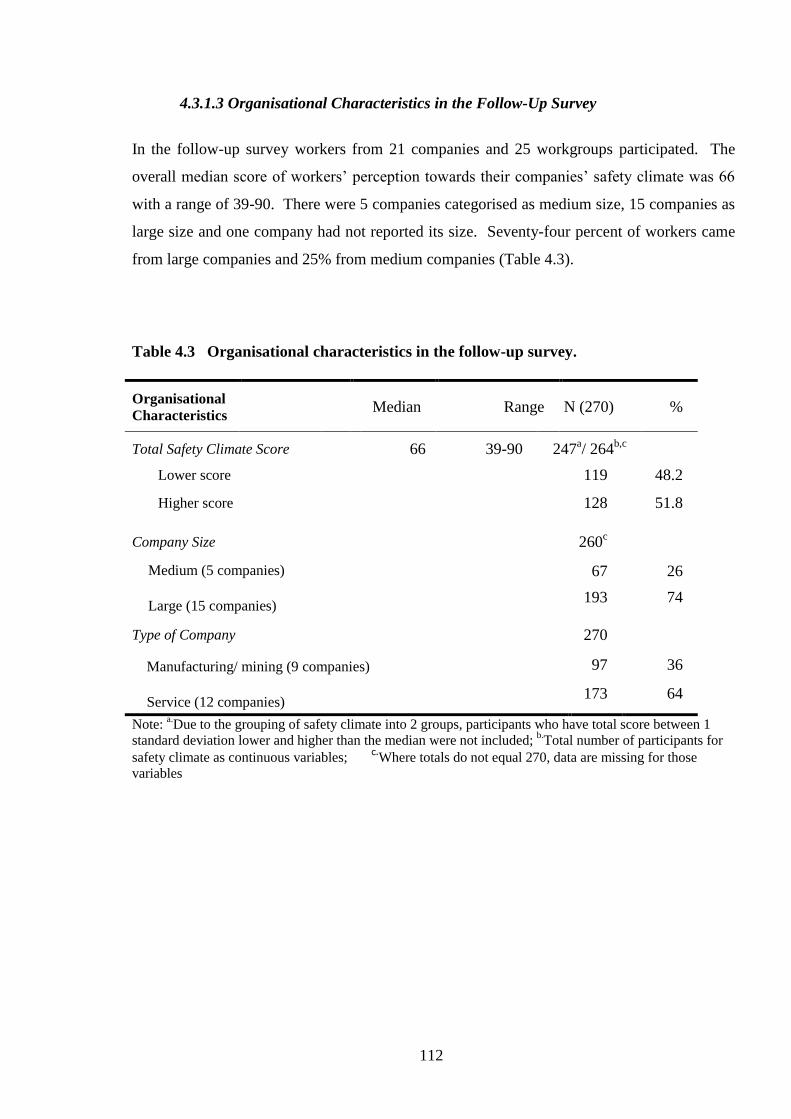
112
4.3.1.3 Organisational Characteristics in the Follow-Up Survey
In the follow-up survey workers from 21 companies and 25 workgroups participated. The
overall median score of workers’ perception towards their companies’ safety climate was 66
with a range of 39-90. There were 5 companies categorised as medium size, 15 companies as
large size and one company had not reported its size. Seventy-four percent of workers came
from large companies and 25% from medium companies (Table 4.3).
Table 4.3 Organisational characteristics in the follow-up survey.
Organisational
Characteristics Median Range N (270) %
Total Safety Climate Score
66 39-90 247a/ 264
b,c
Lower score 119 48.2
Higher score 128 51.8
Company Size 260c
Medium (5 companies)
Large (15 companies)
67 26
193 74
Type of Company 270
Manufacturing/ mining (9 companies)
Service (12 companies)
97 36
173 64
Note: a.Due to the grouping of safety climate into 2 groups, participants who have total score between 1
standard deviation lower and higher than the median were not included; b.Total number of participants for
safety climate as continuous variables; c.
Where totals do not equal 270, data are missing for those
variables

113
Most companies belonged to the service sector. Manufacturing (34 %) was followed by
Health Care and Social Assistance (19%) and Public Administration and Safety (17%)
(Figure 4.1).
Figure 4.1 Percentage of workers within industry type (N=270) in the follow-up survey
Note: Australian and New Zealand Standard, Industrial Classification (ANZSIC) 2006 (Australian Bureau
of Statistics and Statistics New Zealand, 2006)
4.3.1.4 Distribution of Safety Climate Items/Dimensions and Job Satisfaction Items
in the Follow-Up Survey
In order to present a more detailed picture of organisational and occupational characteristics,
this section presents each item and dimensions of safety climate and items of job satisfaction.
4.3.1.4.1 Distribution of Workers’ Perception across Safety Climate
Items/Dimensions in the Follow-Up Survey
Table 4.4 shows that the majority of workers agreed with the safety climate statements.
However there were some items where more than 20% of workers disagree, such as safety
climate item 12 and 17.
7.4
19.3
34.1
1.9
7.4
4.8
17.0
8.1
0 10 20 30 40
Electricity, Gas,Water and waste ser
Health care and Social Assistance
Manufacturing
Mining
Other Services
Proffesional, Scientific and Technic
Public Administration and Safety
Retail trade
Percentage of workers N= 270
Ind
ust
rial
Typ
e
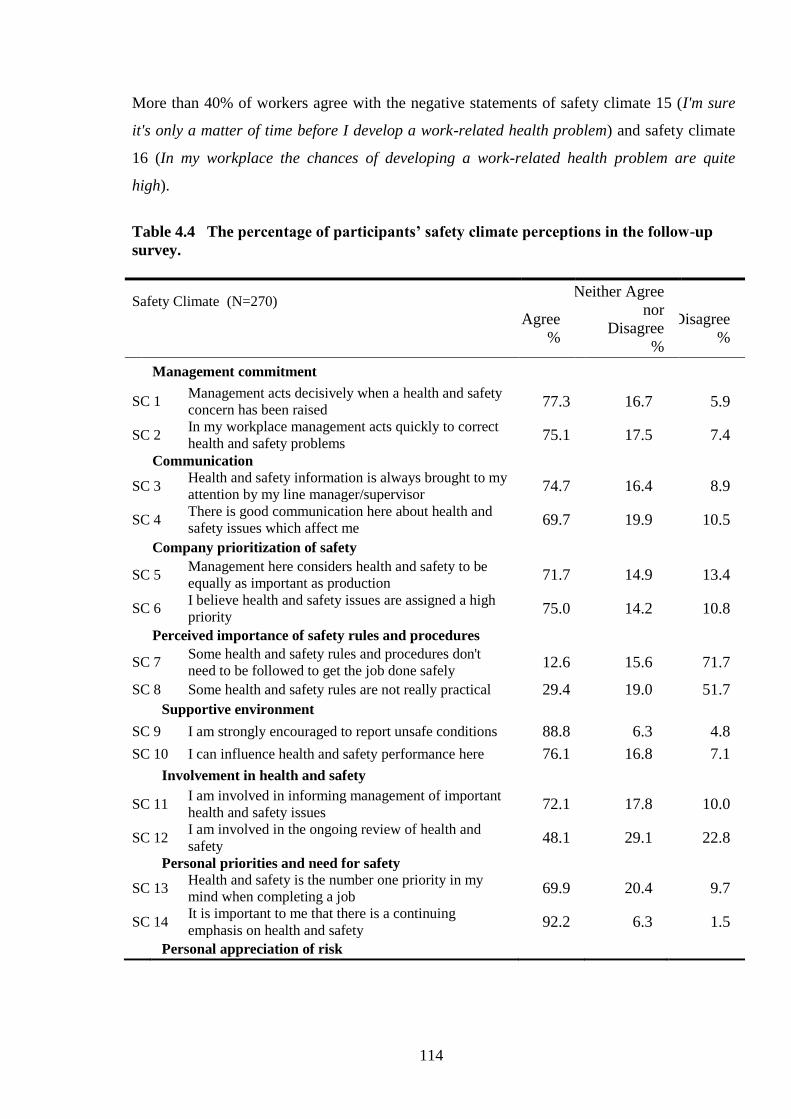
114
More than 40% of workers agree with the negative statements of safety climate 15 (I'm sure
it's only a matter of time before I develop a work-related health problem) and safety climate
16 (In my workplace the chances of developing a work-related health problem are quite
high).
Table 4.4 The percentage of participants’ safety climate perceptions in the follow-up
survey.
Safety Climate (N=270)
Agree
%
Neither Agree
nor
Disagree
%
Disagree
%
Management commitment
SC 1 Management acts decisively when a health and safety
concern has been raised 77.3 16.7 5.9
SC 2 In my workplace management acts quickly to correct
health and safety problems 75.1 17.5 7.4
Communication
SC 3 Health and safety information is always brought to my
attention by my line manager/supervisor 74.7 16.4 8.9
SC 4 There is good communication here about health and
safety issues which affect me 69.7 19.9 10.5
Company prioritization of safety
SC 5 Management here considers health and safety to be
equally as important as production 71.7 14.9 13.4
SC 6 I believe health and safety issues are assigned a high
priority 75.0 14.2 10.8
Perceived importance of safety rules and procedures
SC 7 Some health and safety rules and procedures don't
need to be followed to get the job done safely 12.6 15.6 71.7
SC 8 Some health and safety rules are not really practical 29.4 19.0 51.7
Supportive environment
SC 9 I am strongly encouraged to report unsafe conditions 88.8 6.3 4.8
SC 10 I can influence health and safety performance here 76.1 16.8 7.1
Involvement in health and safety
SC 11 I am involved in informing management of important
health and safety issues 72.1 17.8 10.0
SC 12 I am involved in the ongoing review of health and
safety 48.1 29.1 22.8
Personal priorities and need for safety
SC 13 Health and safety is the number one priority in my
mind when completing a job 69.9 20.4 9.7
SC 14 It is important to me that there is a continuing
emphasis on health and safety 92.2 6.3 1.5
Personal appreciation of risk

115
Safety Climate (N=270)
Agree
%
Neither Agree
nor
Disagree
%
Disagree
%
SC 15 I'm sure it's only a matter of time before I develop a
work-related health problem 39.4 27.5 33.1
SC 16 In my workplace the chances of developing a work-
related health problem are quite high 50.6 24.2 25.3
Work demands enable safe working
SC 17 Production targets rarely conflict with health and
safety measures 45.0 31.6 23.4
SC 18 I am always given enough time to get the job done
safely 52.4 21.6 26.0
Note: The safety climate (SC) scale was compiled into 3 points scale (the original were 5 points Likert
scale –see Method Section).
The data in Table 4.4 can be more clearly presented in a dimension diagram. Figure 4.2
presents the dimensions of safety climate for the 21 companies, which participated in this
follow-up survey. The dimension of ‘personal appreciation of risk’ has the lowest score (6).
The companies have the highest safety dimension score in ‘personal priorities and need for
safety’ (8), ‘supportive environment’ (score 8), and ‘management commitment’ (score 8).
Figure 4.2 The dimension of safety climate for all companies in the follow-up survey
Note: The score were calculated based on the formula of safety climate dimension (Section 3.2.4.3)
0
5
10Management Commitment
Communication
Company Prioritisation of Safety
Perceive Importance of SafetyRules and Procedures
Supportive EnvironmentInvolvement in Health and
Safety
Personal Priorities and Need forSafety
Personal Appreciation of Risk
Work Demands Enable SafeWorking
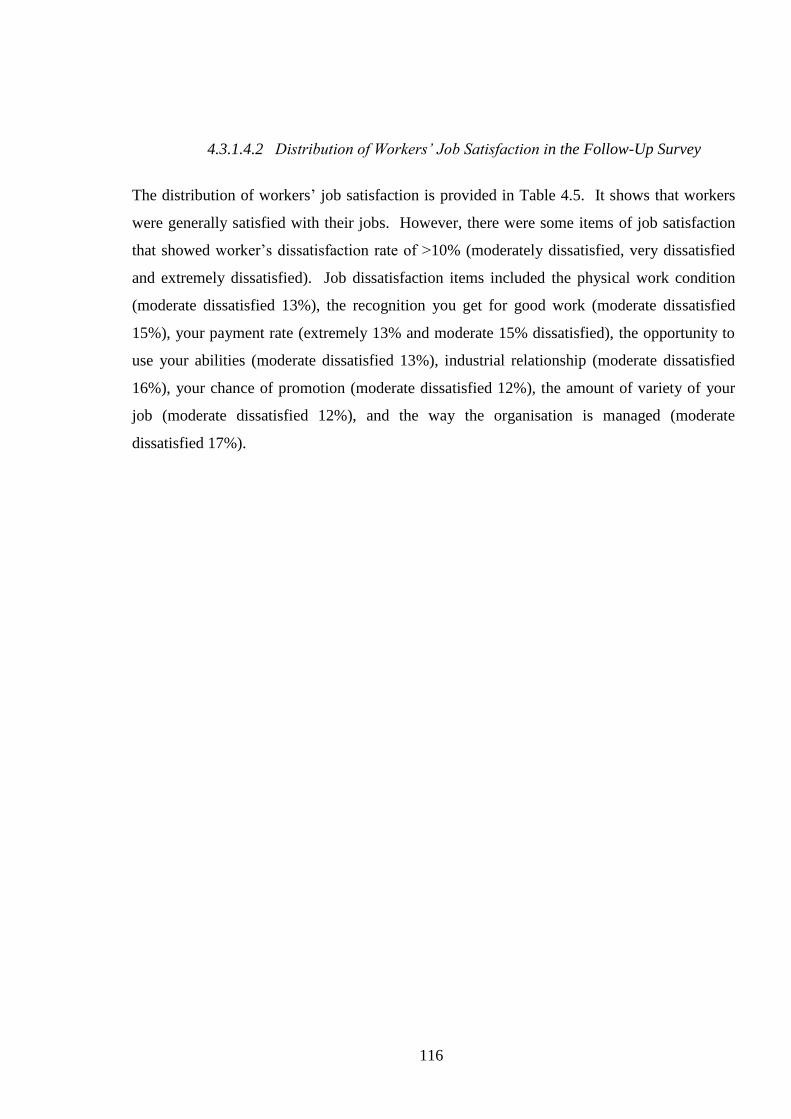
116
4.3.1.4.2 Distribution of Workers’ Job Satisfaction in the Follow-Up Survey
The distribution of workers’ job satisfaction is provided in Table 4.5. It shows that workers
were generally satisfied with their jobs. However, there were some items of job satisfaction
that showed worker’s dissatisfaction rate of >10% (moderately dissatisfied, very dissatisfied
and extremely dissatisfied). Job dissatisfaction items included the physical work condition
(moderate dissatisfied 13%), the recognition you get for good work (moderate dissatisfied
15%), your payment rate (extremely 13% and moderate 15% dissatisfied), the opportunity to
use your abilities (moderate dissatisfied 13%), industrial relationship (moderate dissatisfied
16%), your chance of promotion (moderate dissatisfied 12%), the amount of variety of your
job (moderate dissatisfied 12%), and the way the organisation is managed (moderate
dissatisfied 17%).
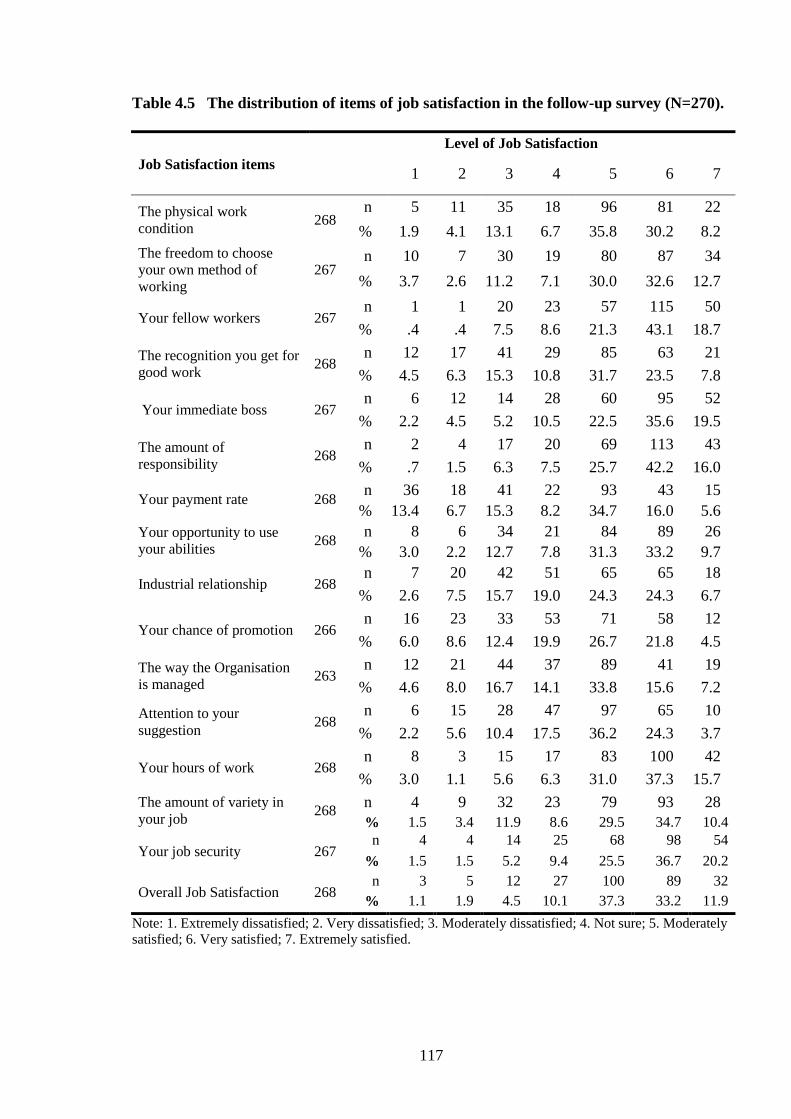
117
Table 4.5 The distribution of items of job satisfaction in the follow-up survey (N=270).
Job Satisfaction items
Level of Job Satisfaction
1 2 3 4 5 6 7
The physical work
condition 268
n 5 11 35 18 96 81 22
% 1.9 4.1 13.1 6.7 35.8 30.2 8.2
The freedom to choose
your own method of
working
267 n 10 7 30 19 80 87 34
% 3.7 2.6 11.2 7.1 30.0 32.6 12.7
Your fellow workers 267 n 1 1 20 23 57 115 50
% .4 .4 7.5 8.6 21.3 43.1 18.7
The recognition you get for
good work 268
n 12 17 41 29 85 63 21
% 4.5 6.3 15.3 10.8 31.7 23.5 7.8
Your immediate boss 267 n 6 12 14 28 60 95 52
% 2.2 4.5 5.2 10.5 22.5 35.6 19.5
The amount of
responsibility 268
n 2 4 17 20 69 113 43
% .7 1.5 6.3 7.5 25.7 42.2 16.0
Your payment rate 268 n 36 18 41 22 93 43 15
% 13.4 6.7 15.3 8.2 34.7 16.0 5.6
Your opportunity to use
your abilities 268
n 8 6 34 21 84 89 26
% 3.0 2.2 12.7 7.8 31.3 33.2 9.7
Industrial relationship 268 n 7 20 42 51 65 65 18
% 2.6 7.5 15.7 19.0 24.3 24.3 6.7
Your chance of promotion 266 n 16 23 33 53 71 58 12
% 6.0 8.6 12.4 19.9 26.7 21.8 4.5
The way the Organisation
is managed 263
n 12 21 44 37 89 41 19
% 4.6 8.0 16.7 14.1 33.8 15.6 7.2
Attention to your
suggestion 268
n 6 15 28 47 97 65 10
% 2.2 5.6 10.4 17.5 36.2 24.3 3.7
Your hours of work 268 n 8 3 15 17 83 100 42
% 3.0 1.1 5.6 6.3 31.0 37.3 15.7
The amount of variety in
your job 268
n 4 9 32 23 79 93 28
% 1.5 3.4 11.9 8.6 29.5 34.7 10.4
Your job security 267 n 4 4 14 25 68 98 54
% 1.5 1.5 5.2 9.4 25.5 36.7 20.2
Overall Job Satisfaction 268 n 3 5 12 27 100 89 32
% 1.1 1.9 4.5 10.1 37.3 33.2 11.9
Note: 1. Extremely dissatisfied; 2. Very dissatisfied; 3. Moderately dissatisfied; 4. Not sure; 5. Moderately
satisfied; 6. Very satisfied; 7. Extremely satisfied.
118
4.3.2 The Prevalence of MSPD: Undifferentiated MSPD, Severe MSPD and MSPD in
particular body areas.
This section provides the results of the prevalence of MSPD, which pertain to the research
question 1: What is the prevalence of MSPD (undifferentiated MSPD in the last 7 days, severe
MSPD, and MSPD in each body part) in a representative sample of SA workplaces (the
follow-up survey)?
4.3.2.1 The Prevalence of Undifferentiated MSPD in Follow-Up Survey
In this follow-up survey, the percentage of workers reporting having undifferentiated MSPD
within the previous seven days was 49% (131 workers).
4.3.2.2 The Prevalence of Severe MSPD in the Follow-Up Survey
Twenty percent (54 workers) of the overall participants (N= 270) reported severe MSPD in
some body area. Out of the 131 participants reporting MSPD, 41.2 % of them had severe
MSPD. The distribution of severe MSPD by body part is described in the following section.
4.3.2.3 The Prevalence of MSPD by Body Part in the Follow-Up Survey
The prevalences of MSPD in body areas are presented in Table 4.6. The most commonly
reported MSPD was in the shoulder - 24.8% from all participants, or 51% from overall self-
reported musculoskeletal pain/discomfort. These results were followed by MSPD at the
lower back (23%) and the neck (14%). The least common MSPD was in the upper arm and
forearm.
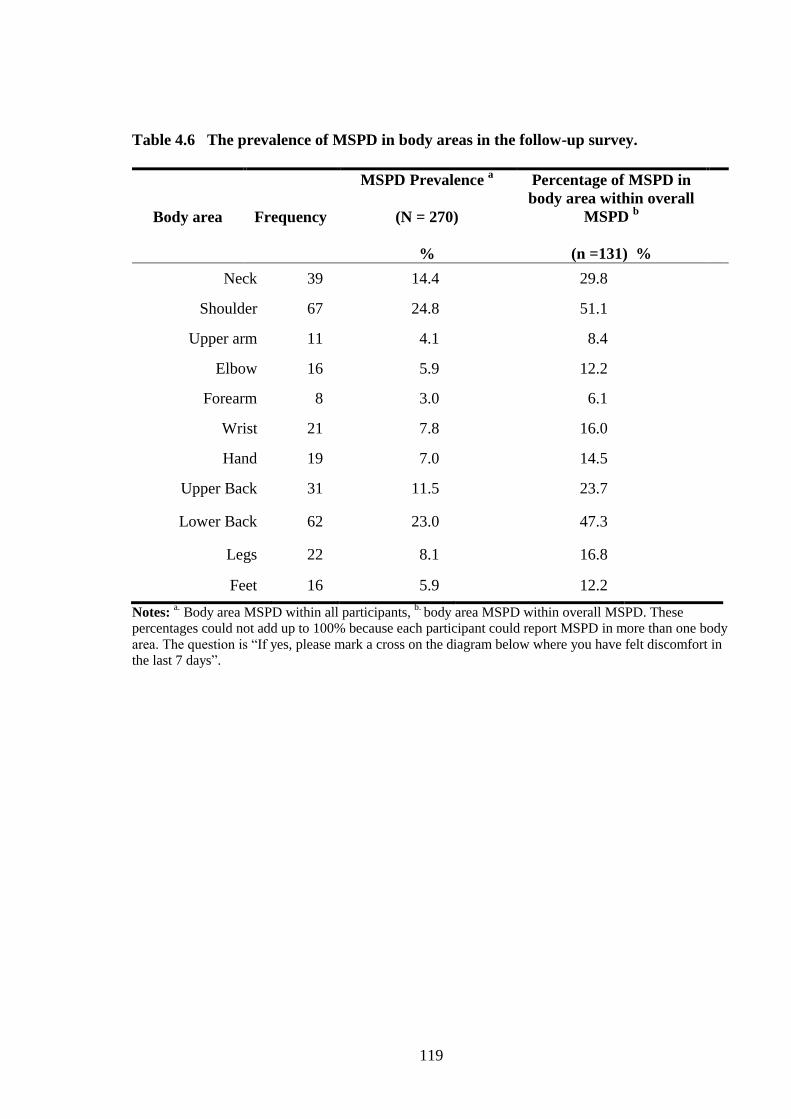
119
Table 4.6 The prevalence of MSPD in body areas in the follow-up survey.
Body area Frequency
MSPD Prevalence a
(N = 270)
%
Percentage of MSPD in
body area within overall
MSPD b
(n =131) %
Neck 39 14.4 29.8
Shoulder 67 24.8 51.1
Upper arm 11 4.1 8.4
Elbow 16 5.9 12.2
Forearm 8 3.0 6.1
Wrist 21 7.8 16.0
Hand 19 7.0 14.5
Upper Back 31 11.5 23.7
Lower Back 62 23.0 47.3
Legs 22 8.1 16.8
Feet 16 5.9 12.2
Notes: a. Body area MSPD within all participants,
b. body area MSPD within overall MSPD. These
percentages could not add up to 100% because each participant could report MSPD in more than one body
area. The question is “If yes, please mark a cross on the diagram below where you have felt discomfort in
the last 7 days”.
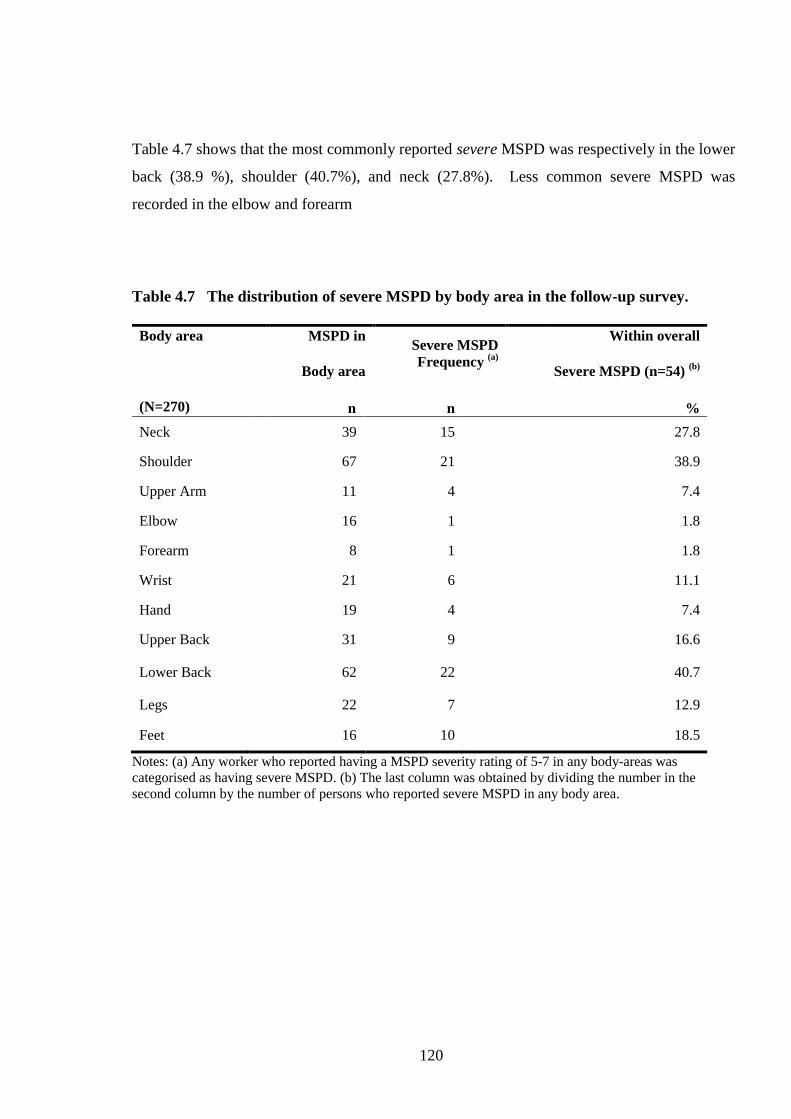
120
Table 4.7 shows that the most commonly reported severe MSPD was respectively in the lower
back (38.9 %), shoulder (40.7%), and neck (27.8%). Less common severe MSPD was
recorded in the elbow and forearm
Table 4.7 The distribution of severe MSPD by body area in the follow-up survey.
Body area
(N=270)
MSPD in
Body area
Severe MSPD
Frequency (a)
Within overall
Severe MSPD (n=54) (b)
n n %
Neck 39 15 27.8
Shoulder 67 21 38.9
Upper Arm 11 4 7.4
Elbow 16 1 1.8
Forearm 8 1 1.8
Wrist 21 6 11.1
Hand 19 4 7.4
Upper Back 31 9 16.6
Lower Back 62 22 40.7
Legs 22 7 12.9
Feet 16 10 18.5
Notes: (a) Any worker who reported having a MSPD severity rating of 5-7 in any body-areas was
categorised as having severe MSPD. (b) The last column was obtained by dividing the number in the
second column by the number of persons who reported severe MSPD in any body area.
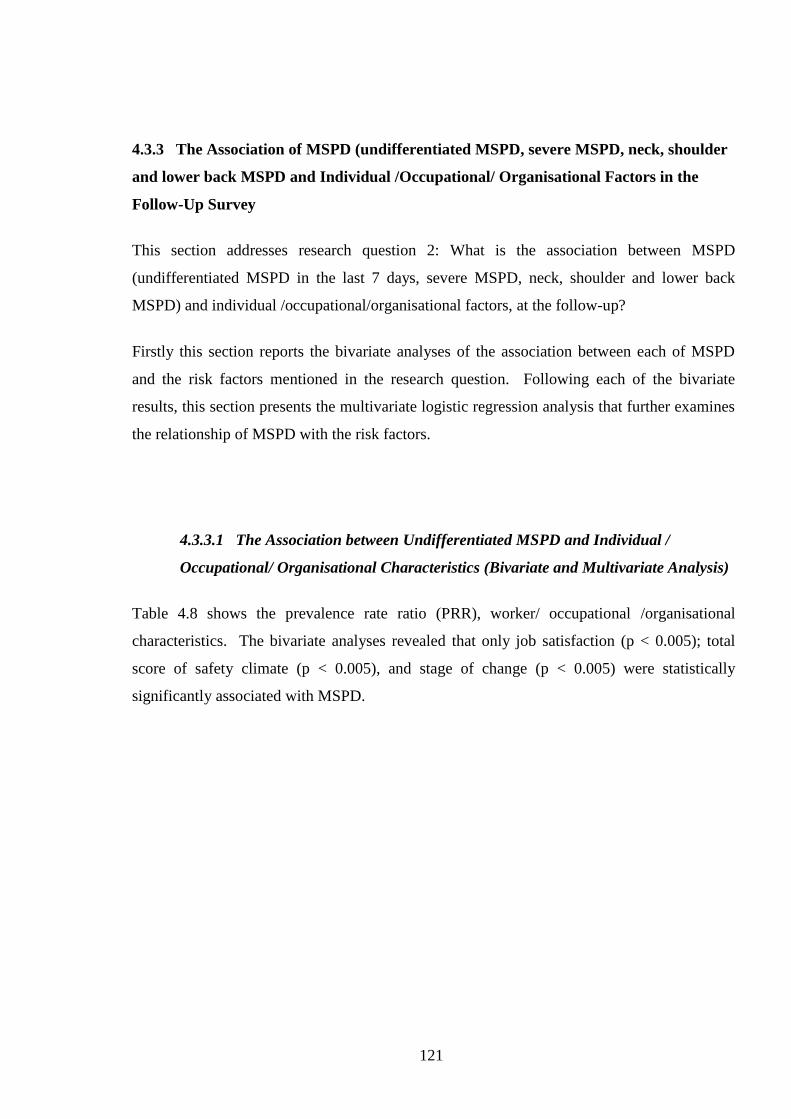
121
4.3.3 The Association of MSPD (undifferentiated MSPD, severe MSPD, neck, shoulder
and lower back MSPD and Individual /Occupational/ Organisational Factors in the
Follow-Up Survey
This section addresses research question 2: What is the association between MSPD
(undifferentiated MSPD in the last 7 days, severe MSPD, neck, shoulder and lower back
MSPD) and individual /occupational/organisational factors, at the follow-up?
Firstly this section reports the bivariate analyses of the association between each of MSPD
and the risk factors mentioned in the research question. Following each of the bivariate
results, this section presents the multivariate logistic regression analysis that further examines
the relationship of MSPD with the risk factors.
4.3.3.1 The Association between Undifferentiated MSPD and Individual /
Occupational/ Organisational Characteristics (Bivariate and Multivariate Analysis)
Table 4.8 shows the prevalence rate ratio (PRR), worker/ occupational /organisational
characteristics. The bivariate analyses revealed that only job satisfaction (p < 0.005); total
score of safety climate (p < 0.005), and stage of change (p < 0.005) were statistically
significantly associated with MSPD.

122
Table 4.8 Bivariate analysis: the prevalence rate ratio of undifferentiated MSPD and
associations with individual /ocupational/organisational factors in the follow-up survey.
Worker/Occupational /
Organisational
Characteristics
N BIVARIATE
Prevalence
(n) %
MSPD
Prevalence
rate ratio
95% CI P-Value
Total Participants 270 (131) 49
Gender 267 Male
Female (ref)
1.05 0.83-1.35 0.662
Female 130 (62) 47.7 Male 137 (69) 50.4
Age 267 > 40 years old
< 40 years old (ref)
1.01 0.79 -1.29 0.507
< 30 years old 51 (28) 54.9 30 – 39 years old 67 (30) 44.8
40 – 49 years old 75 (40) 53.3 > 50 years old 74 (33) 44.6
Length of Employment in
current workplace 260 > 5 years
< 5 years (ref)
1.05 0.80-1.36 0.309
< 5 years 100 (47) 47
5 – 9 years 76 (42) 55.3
> 10 years 83 (36) 43.4
Working hours/week 267 > 45 hours
< 45 hours (ref)
1.02 0.69-1.49 0.454
< 35 hours 51 (21) 41.2 35 - 44 hours 186 (95) 51.1 > 45 hours 30 (15) 50
English Background 267 NESB
ESB (ref)
0.75 0.49-1.11 0.121
Yes (ESB) 42 (16) 38.1
No (NESB) 225 (115) 51.1 Overall Job Satisfaction 266 Dissatisfied or not sure
Satisfied (ref) 1.38 1.07-1.79 <0.001*
Dissatisfied 20 (15) 75 Not Sure 27 (15) 55.6 Satisfied 219 (101) 46.1
Total Value Safety Climate 244 Low score
High score (ref) 1.77 1.34-2.34 <0.001*
Low score 117 (72) 61.5 High Score 127 (44) 34.6
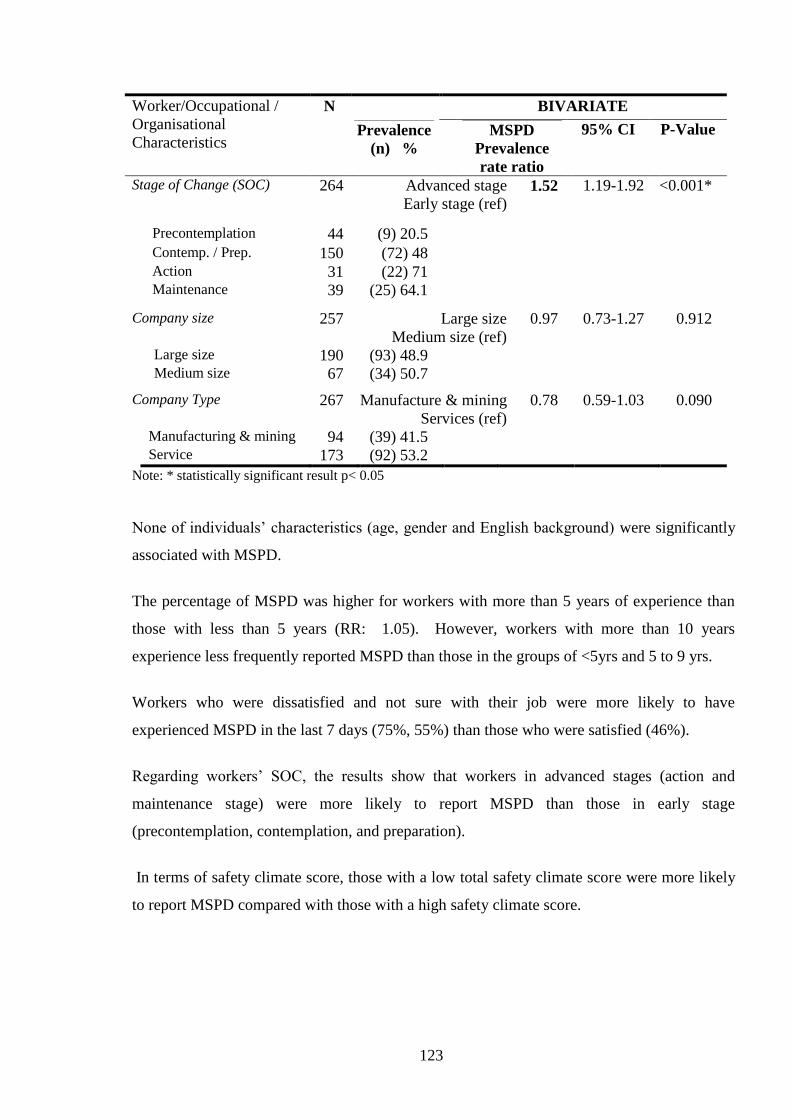
123
Worker/Occupational /
Organisational
Characteristics
N BIVARIATE
Prevalence
(n) %
MSPD
Prevalence
rate ratio
95% CI P-Value
Stage of Change (SOC) 264 Advanced stage
Early stage (ref) 1.52 1.19-1.92 <0.001*
Precontemplation 44 (9) 20.5
Contemp. / Prep. 150 (72) 48 Action 31 (22) 71 Maintenance 39 (25) 64.1
Company size 257 Large size
Medium size (ref)
0.97 0.73-1.27 0.912
Large size 190 (93) 48.9 Medium size 67 (34) 50.7
Company Type 267 Manufacture & mining
Services (ref)
0.78 0.59-1.03 0.090
Manufacturing & mining 94 (39) 41.5 Service 173 (92) 53.2
Note: * statistically significant result p< 0.05
None of individuals’ characteristics (age, gender and English background) were significantly
associated with MSPD.
The percentage of MSPD was higher for workers with more than 5 years of experience than
those with less than 5 years (RR: 1.05). However, workers with more than 10 years
experience less frequently reported MSPD than those in the groups of <5yrs and 5 to 9 yrs.
Workers who were dissatisfied and not sure with their job were more likely to have
experienced MSPD in the last 7 days (75%, 55%) than those who were satisfied (46%).
Regarding workers’ SOC, the results show that workers in advanced stages (action and
maintenance stage) were more likely to report MSPD than those in early stage
(precontemplation, contemplation, and preparation).
In terms of safety climate score, those with a low total safety climate score were more likely
to report MSPD compared with those with a high safety climate score.

124
To confirm the relationship of those variables stated above, multivariate regression analysis of
MSPD with adjustment for age and gender was carried out, and the results are presented in
Table 4.9. The analysis found that safety climate (p=0.001) and SOC (p=0.012) were
statistically significantly associated with undifferentiated MSPD.
Table 4.9 Regression analysis: the odds ratio of undifferentiated MSPD by individual
/ocupational/ organisational factors in the follow-up survey.
Musculoskeletal Pain/ Discomfort
in the last 7 days
Odds Ratio
P-value
95% Confidence Interval
Lower Bound Upper Bound
Age Covariate
Gender Covariate
Safety Climate
Low score 2.62 0.001* 1.48 4.63
High score (ref) . . . .
Stage of change
Advance stage 2.14 0.012* 1.18 3.88
Early stage (ref) . . . .
Job Satisfaction
Dissatisfied/ Not Sure 1.53 0.241 0.74 3.37
Satisfied (ref) . . . .
English background
NESB 0.67 0.32 0.30 1.47
ESB (ref)
Note: * statistically significant result p< 0.05, adjusted with age and gender
Thus workers with low safety climate score were 2.6 times more likely (95%CI: 1.48-4.63) to
report MSPD than those with high safety climate score. Workers in advanced SOC reported
MSPD more frequently (OR 2.14, 95%CI: 1.18-3.88) than those in early stages.

125
4.3.3.2 The Association between Severe MSPD and Individual / Occupational/
Organisational Characteristics (Bivariate and Multivariate Analysis) in the Follow-
Up Survey
Findings from the bivariate and multivariate logistic regression analyses of the association
between severe MSPD and individual / occupational/organisational characteristics are
presented in Tables 4.10 and 4.11.
Bivariate analysis demonstrated that job satisfaction (p=0.044), safety climate (p<0.001), and
SOC (p=0.047) had statistically significant associations with severe MSPD. It can be seen
that workers who were dissatisfied with their jobs, had low safety climate scores, or were in
advanced SOC were more likely to report severe MSPD.
Male workers and the less than 40 age group were less likely to report severe MSPD
compared with female workers and the age group more than 40. Employees who worked in
their current workplaces for more than 5 years were more likely to report severe MSPD than
those who had worked less than 5 years. Those workers who had long working hours were
less likely to report severe MSPD. Those from an English speaking background were more
likely to report severe MSPD than those who were from non-English speaking background.
However, these results were not found to be statistically significant.

126
Table 4.10 Bivariate analysis: the prevalence rate ratio (PRR) for severe MSPD and
associations with individual /ocupational/organisational factors in the follow-up survey.
Worker/Occupational
Characteristic N/n
SEVERE MSPD
Prevalence
(Number)
%
Bivariate
PRR 95%
CI P-Value
Total Participants 270 (131) 49%
Gender 266
Male
Female (ref) 0.87 0.54- 1.41 0.689
Female 129 (28) 21.7
Male 137 (26) 19.0
Age 266 > 40 years old
< 40 years old (ref) 1.27 0.77 – 2.07 0.415
Less than 30 51 (10) 19.6
30 - 39 67 (11) 16.4
40 - 49 74 (19) 25.7
50 or more 74 (14) 18.9
Length of
Employment
in current workplace
265 > 5 years
< 5 years (ref) 1.42 0.85-2.40 0.224
Less than 5 years 105 (17) 16.2
5 – 9 years 77 (19) 24.7
10 years or more 83 (18) 21.7
Working hours/week 266 > 45 hours
< 45 hours (ref) 0.46 0.15-1.39 0.212
Less 35 hrs 50 (11) 22.0 35 - 44 hrs 186 (40) 21.5
45 hrs or more 30 (3) 10.0
English Background 266 NESB
ESB (ref) 0.56 0.24-1.32 0.233
Yes (ESB) 225 (49) 21.8
No (NESB) 41 (5) 12.2
Overall Job
Satisfaction 265 Dissatisfied or not sure
Satisfied (ref) 1.36 0.78- 2.38 0.392
Dissatisfied 19 (8) 42.1 0.044*a
Not Sure 27 (4) 14.8
Satisfied 219 (42) 19.2
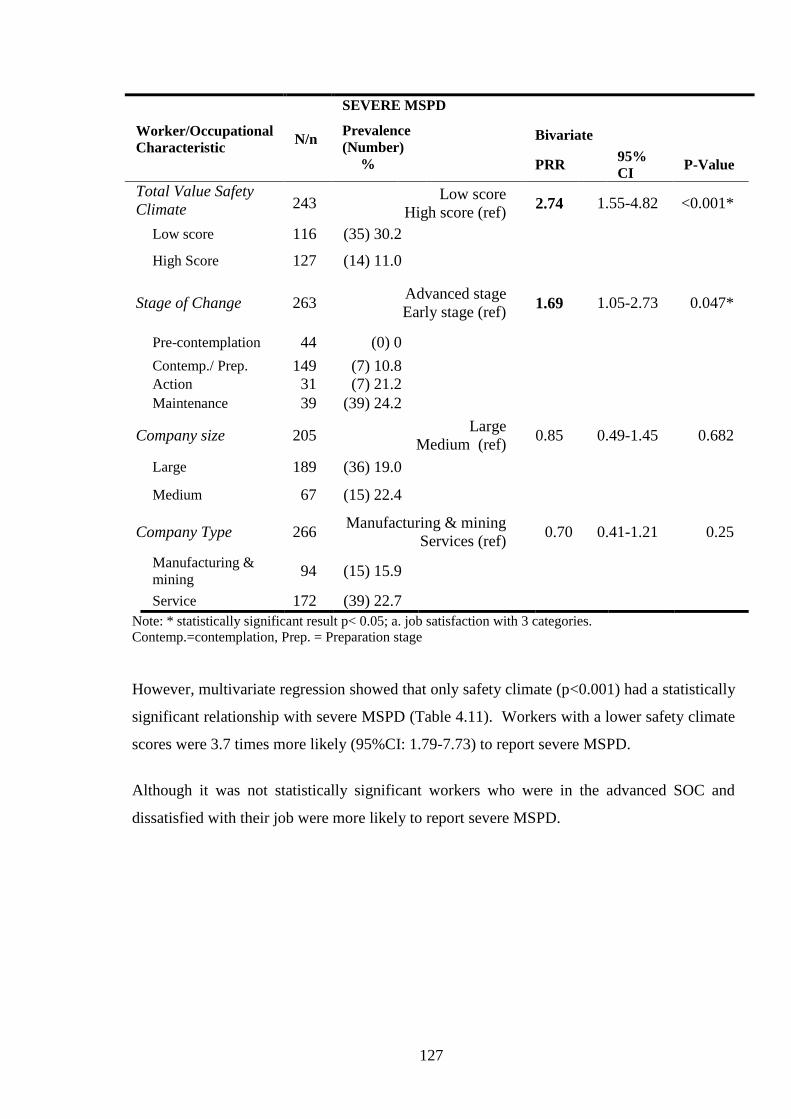
127
Worker/Occupational
Characteristic N/n
SEVERE MSPD
Prevalence
(Number)
%
Bivariate
PRR 95%
CI P-Value
Total Value Safety
Climate 243 Low score
High score (ref) 2.74 1.55-4.82 <0.001*
Low score 116 (35) 30.2
High Score 127 (14) 11.0
Stage of Change 263 Advanced stage
Early stage (ref) 1.69 1.05-2.73 0.047*
Pre-contemplation 44 (0) 0
Contemp./ Prep. 149 (7) 10.8 Action 31 (7) 21.2
Maintenance 39 (39) 24.2
Company size 205 Large
Medium (ref) 0.85 0.49-1.45 0.682
Large 189 (36) 19.0
Medium 67 (15) 22.4
Company Type 266 Manufacturing & mining
Services (ref) 0.70 0.41-1.21 0.25
Manufacturing &
mining 94 (15) 15.9
Service 172 (39) 22.7
Note: * statistically significant result p< 0.05; a. job satisfaction with 3 categories.
Contemp.=contemplation, Prep. = Preparation stage
However, multivariate regression showed that only safety climate (p<0.001) had a statistically
significant relationship with severe MSPD (Table 4.11). Workers with a lower safety climate
scores were 3.7 times more likely (95%CI: 1.79-7.73) to report severe MSPD.
Although it was not statistically significant workers who were in the advanced SOC and
dissatisfied with their job were more likely to report severe MSPD.
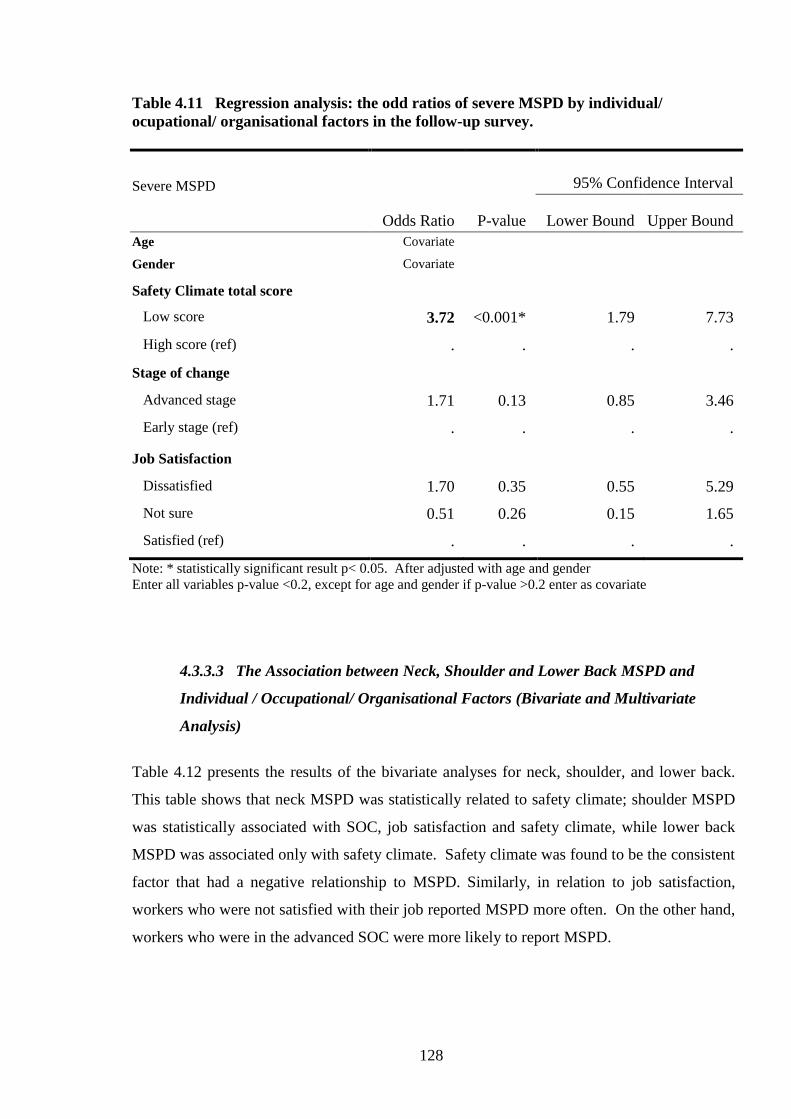
128
Table 4.11 Regression analysis: the odd ratios of severe MSPD by individual/
ocupational/ organisational factors in the follow-up survey.
Severe MSPD
Odds Ratio P-value
95% Confidence Interval
Lower Bound Upper Bound
Age Covariate
Gender Covariate
Safety Climate total score
Low score 3.72 <0.001* 1.79 7.73
High score (ref) . . . .
Stage of change
Advanced stage 1.71 0.13 0.85 3.46
Early stage (ref) . . . .
Job Satisfaction
Dissatisfied 1.70 0.35 0.55 5.29
Not sure 0.51 0.26 0.15 1.65
Satisfied (ref) . . . .
Note: * statistically significant result p< 0.05. After adjusted with age and gender
Enter all variables p-value <0.2, except for age and gender if p-value >0.2 enter as covariate
4.3.3.3 The Association between Neck, Shoulder and Lower Back MSPD and
Individual / Occupational/ Organisational Factors (Bivariate and Multivariate
Analysis)
Table 4.12 presents the results of the bivariate analyses for neck, shoulder, and lower back.
This table shows that neck MSPD was statistically related to safety climate; shoulder MSPD
was statistically associated with SOC, job satisfaction and safety climate, while lower back
MSPD was associated only with safety climate. Safety climate was found to be the consistent
factor that had a negative relationship to MSPD. Similarly, in relation to job satisfaction,
workers who were not satisfied with their job reported MSPD more often. On the other hand,
workers who were in the advanced SOC were more likely to report MSPD.

129
Table 4.12 Bivariate analysis: the prevalence rate ratios for neck shoulder and lower
back MSPD by individual /ocupational/organisational factors in the follow-up survey.
Individual/Occupational/
Organizational
Characteristics
MSPD - Neck MSPD - Shoulder MSPD – Lower back
N PRR 95% CI PRR 95% CI PRR 95% CI
*Individual Factors /
Individual
Age group
≥40 years
<40 years (ref)
267
1.29 0.71-2.34 0.99 0.65-1.50 1.11 0.72-1.73
Gender
Female
Male (ref)
267
1.00 0.56-1.79 1.47 0.96-2.24 0.71 0.45-1.11
English speaking background
NESB
ESB (ref)
267
0.61 0.23-1.63 0.73 0.37-1.41 0.47 0.20-1.10
* Occupational factors
Length employment
>5years
< 5 years) (ref)
266
1.06 0.58-1.93 1.05 0.68-1.59 0.86 0.55-1.33
Worked hours/ week
>45 hours
<45hours (ref)
267
0.43 0.11-1.68 0.77 0.367-1.64 0.85 0.39-1.79
Workload
Medium-heavy
Sedentary- light (ref)
237
0.72 0.39-1.30 0.98 0.63-1.54 1.19 0.73-1.94
Vibration
Exposed
No Exposed (ref)
237
0.56 0.27-1.17 0.61 0.36-1.03 1.02 0.63-1.65
SOC
Advanced stage
Early stage (ref)
265
1.62 0.90-2.92 1.86 1.24-2.79* 1.26 0.80-1.98
Overall job satisfaction
Dissatisfied or not sure
Satisfied (ref)
266
1.39 0.71-2.74 1.84 1.20-2.83* 1.48 0.91-2.42
Organisational Factor
Total safety climate score
Lower
Higher (ref)
244 2.17
1.10-4.28*
2.41
1.47-3.96*
3.89
2.16-7.01*
Company size
Large size
Medium size (ref)
257
0.76 0.41-1.43 1.10 0.68-1.78 0.95 0.57-1.57
Company type
Manufacturing
Services (ref)
267
0.64 0.32-1.25 0.96 0.62-1.49 0.69 0.42-1.14
Note: *statistically significant result p< 0.05

130
After adjusting for age and gender, multivariate regression analysis showed that only safety
climate was statistically associated with neck, shoulder, and lower back MSPD (Table 4.13).
The workers with a lower score on safety climate were more likely to report neck, shoulder,
and lower back MSPD.
Table 4.13 Regression analysis: the odd ratio of MSPD by body area by individual
/ocupational/organisational factors in the follow-up survey.
Individual/Occupational/
Organizational
Characteristics
MSPD - Neck MSPD - Shoulder MSPD – Lower back
N OR 95% CI OR 95% CI OR 95% CI
Individual Factors
Age group 267 Covariate Covariate Covariate
Gender 267 Covariate Covariate Covariate
English speaking background
NESB
ESB (ref)
267 NI NI 0.30
0.06-1.38
Occupational factors
Vibration
Exposed
No Exposed (ref)
237
0.43
0.15-1.19
0.49
0.22-1.12
0.73
0.33-1.63
SOC
Advanced stage
Early stage (ref)
265 1.86 0.81-4.25 1.69 0.84-3.41 1.42 0.67-2.99
Overall job satisfaction
Dissatisfied or not sure
Satisfied (ref)
266 NI 1.30 0.57-2.96 1.23 0.52-2.88
Organisational Factor
Total safety climate score
Lower
Higher (ref)
244 2.44 1.05-5.64* 2.93 1.43-6.02 * 4.88 2.19-10.86*
Note: enter all variables p-value <0.2, except for age and gender if p-value >0.2 enter as covariate; NI=not
included in the model, * statistically significant result
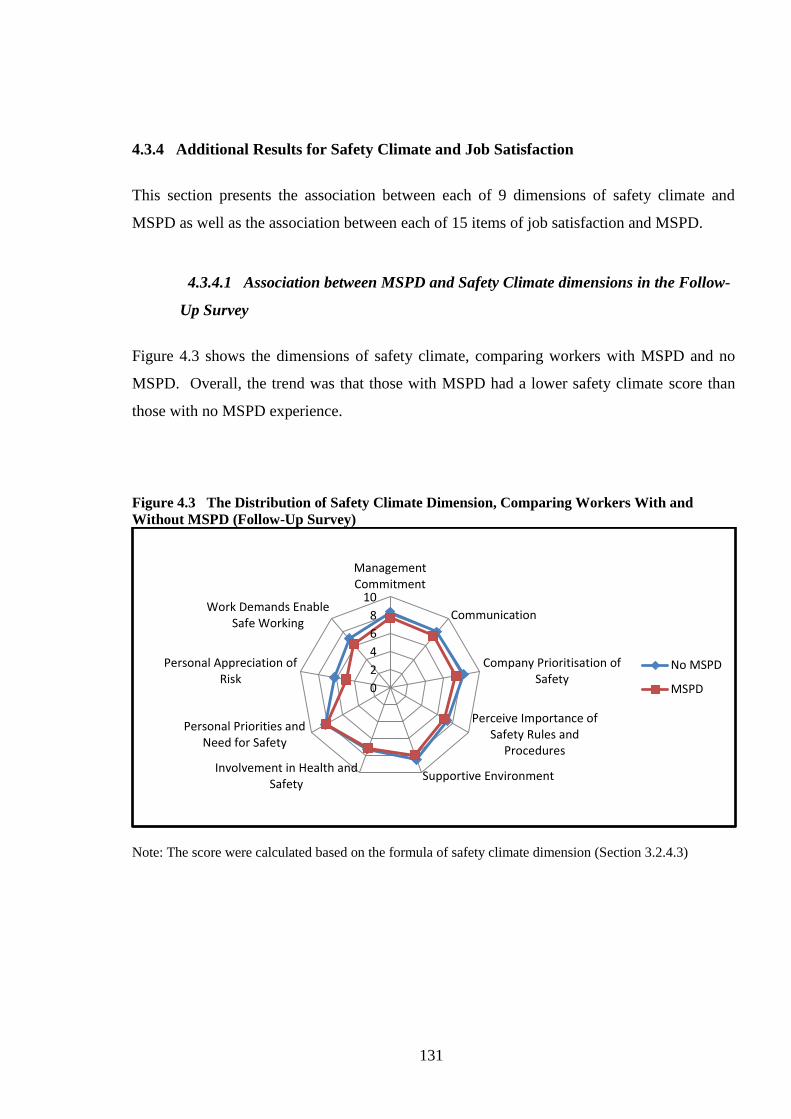
131
4.3.4 Additional Results for Safety Climate and Job Satisfaction
This section presents the association between each of 9 dimensions of safety climate and
MSPD as well as the association between each of 15 items of job satisfaction and MSPD.
4.3.4.1 Association between MSPD and Safety Climate dimensions in the Follow-
Up Survey
Figure 4.3 shows the dimensions of safety climate, comparing workers with MSPD and no
MSPD. Overall, the trend was that those with MSPD had a lower safety climate score than
those with no MSPD experience.
Figure 4.3 The Distribution of Safety Climate Dimension, Comparing Workers With and
Without MSPD (Follow-Up Survey)
Note: The score were calculated based on the formula of safety climate dimension (Section 3.2.4.3)
0
2
4
6
8
10
ManagementCommitment
Communication
Company Prioritisation ofSafety
Perceive Importance ofSafety Rules and
Procedures
Supportive EnvironmentInvolvement in Health and
Safety
Personal Priorities andNeed for Safety
Personal Appreciation ofRisk
Work Demands EnableSafe Working
No MSPD
MSPD

132
In Bivariate (chi-square) analyses, statistically significant associations with “any” MSPD
were found for the lower score of safety climate dimensions namely: management
commitment (p=0.02), communication (p=0.019), company prioritisation of safety (p<0.001),
supportive environment (p=0.018), Personal appreciation of risk (p<0.001), work demands
enable safe working (p=0.004).
After adjusting for age and gender, the multivariate regression showed that there were several
statistically significant associations between MSPD and the dimension of safety climate
including: lower scores of ‘personal appreciation of risk’ (lower vs. higher: OR. 4.0, 95%CI:
1.60-10.01) and middle score of ‘management commitment’ (middle vs. higher OR. 2.49,
95%CI: 1.07-5.76) were more likely to have MSPD than those with high scores.
4.3.4.2 Association between MSPD and Job Satisfaction Items in the Follow-Up
Survey
Several components of job satisfaction found to be negatively associated with MSPD in
bivariate (chi-square) analyses namely physical work condition (p=0.003), your immediate
boss (p=0.031), your rate pay (p=0.019), industrial relation between management and staff
(0.036), your chance of promotion (p=0.040), and the attention paid to suggestion you make
(0.003). After adjusting for age and gender, the multivariate regression confirmed that the
associations with MSPD were only found for the ‘physical work conditions’ (dissatisfied vs.
satisfied: OR: 2.56, 95%CI: 1.20-5.43) and ‘the attention paid to suggestion you make’ (not
sure vs. satisfied: OR: 2.78, 95%CI: 1.26-6.15).
Table 4.14 provides an overall summary of the findings from the Follow-Up Survey.
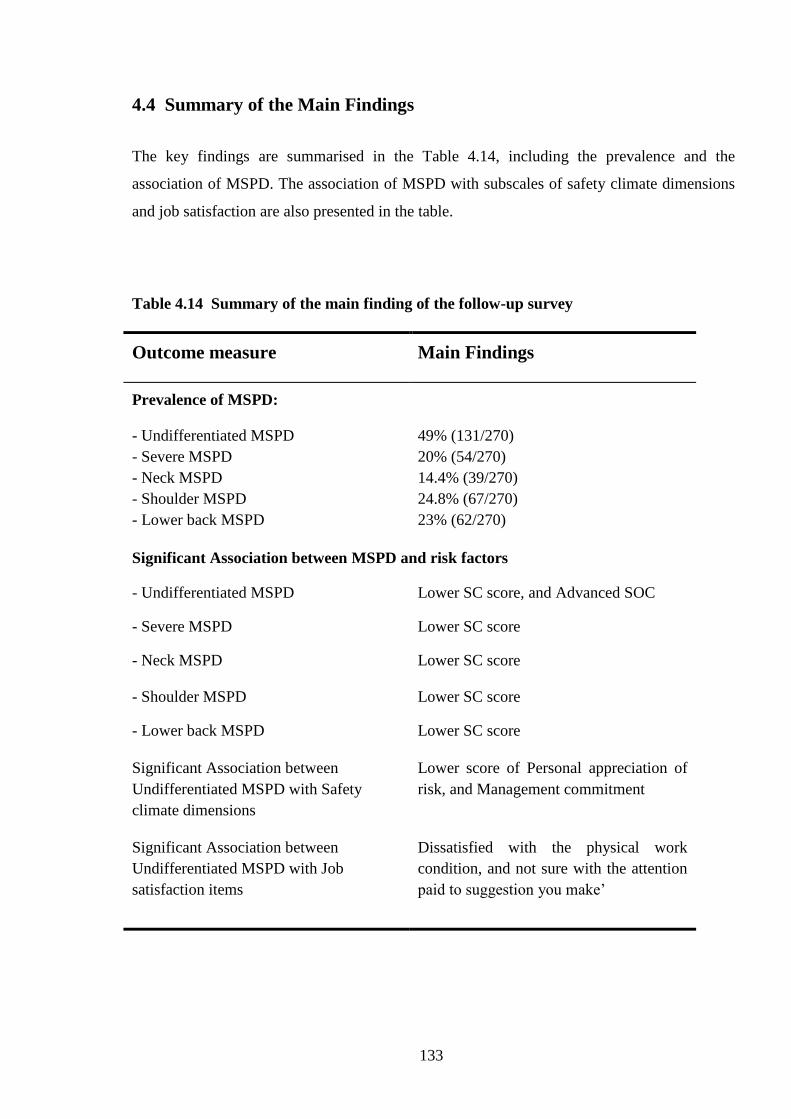
133
4.4 Summary of the Main Findings
The key findings are summarised in the Table 4.14, including the prevalence and the
association of MSPD. The association of MSPD with subscales of safety climate dimensions
and job satisfaction are also presented in the table.
Table 4.14 Summary of the main finding of the follow-up survey
Outcome measure Main Findings
Prevalence of MSPD:
- Undifferentiated MSPD
- Severe MSPD
- Neck MSPD
- Shoulder MSPD
- Lower back MSPD
49% (131/270)
20% (54/270)
14.4% (39/270)
24.8% (67/270)
23% (62/270)
Significant Association between MSPD and risk factors
- Undifferentiated MSPD Lower SC score, and Advanced SOC
- Severe MSPD Lower SC score
- Neck MSPD Lower SC score
- Shoulder MSPD Lower SC score
- Lower back MSPD Lower SC score
Significant Association between
Undifferentiated MSPD with Safety
climate dimensions
Lower score of Personal appreciation of
risk, and Management commitment
Significant Association between
Undifferentiated MSPD with Job
satisfaction items
Dissatisfied with the physical work
condition, and not sure with the attention
paid to suggestion you make’

134
4.5 Discussion
This section discusses the results within the context of the research questions. It also
examines the strengths and weaknesses of the survey.
4.5.1 Main Results of the Follow-Up Survey and Comparison with Other Studies
4.5.1.1 The Prevalence of MSPD in the Follow-Up Survey
This study revealed the prevalence of MSPD in this follow-up survey as 49%. The
prevalence of severe MSPD was 20%. Regional MSPD was respectively neck (14%)
shoulder (25%), lower back (23%).
When comparing the prevalence of MSPD in this follow-up survey (from late 2009 to early
2010) with the baseline survey (from the end of 2008 to early 2009), the prevalences of
MSPD were uniformly higher, namely:
Undifferentiated MSPD (49 vs. 40), Severe MSPD (20 vs. 15), Neck (14 vs. 12), Shoulder (25
vs. 19) and Lower back MSPD (23 vs. 16).
4.5.1.2 The Association of MSPD with Individual/Occupational/Organisational
Factors
This follow-up survey investigated possible predictors of work-related MSPD. It was found
that job dissatisfaction, lower score of safety climate, and advanced SOC were statistically
significantly associated with MSPD. However, after adjusting for age and gender, this
analysis revealed that only lower safety climate scores and advanced SOC have a relationship
with MSPD. Similarly, only lower safety climate score was associated with severe MSPD.
The conclusion is that safety climate is the consistent correlate with all types of MSPD
(Undifferentiated MSPD, Severe MSPD, Neck, Shoulder, and Lower back MSPD).

135
Individual Factors
The follow-up result did not demonstrate significant associations with age, gender and
physical workload. Some studies have found that age, gender and workload is associated with
work-related MSPD (Widanarko et al., 2011, Scuffham et al., 2010, Safe Work Australia.,
2011). Other studies have found that age and gender were not associated with WRMSD
(Daraiseh et al., 2010). The variation between studies may have reflected differences in
methodologies and sample size.
Occupational/ Organisational Factors
The findings are consistent with research which suggests that a negative safety climate in
organisations is associated with work related illness or injuries (Seo et al., 2004, Isla Diaz and
Diaz Cabrera, 1997, Huang et al., 2007, Vinodkumar and Bhasi, 2009). Clarke found that
safety behaviour and general health was related to safety climate and occupational accidents
(Clarke, 2010). In addition this study found that the lower score of ‘personal appreciation of
risk’ was associated with MSPD. The study also found that safety climate had a positive
relationship with safety attitude (Pousette et al., 2008, Isla Diaz and Diaz Cabrera, 1997). An
explanation for this is that workers with a positive attitude may have a higher appreciation of
risk so the exposure to work related injuries or illness could be reduced. Workers’ attitude
towards safety, therefore, should be taken into account when planning to reduce work-related
MSPD or other work-related accidents.
Job dissatisfaction was also found to be an important correlate of MSPD. Workers
dissatisfied with their job were more likely to report musculoskeletal pain. This result was
consistent with a previous study in New Zealand (Scuffham et al., 2010) and those from the
United States (Probst and Brubaker, 2001). Job dissatisfaction may indirectly or directly
cause musculoskeletal pain. Studies found that job dissatisfaction may influence safety
compliance and safety participation in an organisation, which in turn might lead to work-
related health problems (Probst and Brubaker, 2001, Clarke, 2010).
136
Furthermore, job insecurity may lead to musculoskeletal pain as a result of the psychosomatic
effect of stress (Marchand et al., 2005).
Another important factor was the stage of change. Advanced stages (action & maintenance)
were more frequently associated with pain than earlier stage (precontemplation &
contemplation/ preparation). In a similar finding to the baseline survey, the majority of
workers were in contemplation/preparation stage.
In an occupational setting, workers might not have authority to decide the type of
modification and its timing in a workplace. Perhaps the only modification workers can make,
apart from physical conditioning, is changing their behaviour in order to have a better attitude
towards safety, such as more compliance towards the safety policy. The top-level managers
have the authority and responsibility to make changes such as changes in ergonomic
equipment, tools and administrative controls (job rotation, job duration, working break etc.),
based on company availability, including budget and time.
Concerning the MSPD association with advanced SOC, this result is in line with a previous
study, which found that the advanced stage was more likely to report musculoskeletal pain in
workplaces (Village and Ostry, 2010). Workers in an advanced stage could be more aware of
MSPD risk and become more compliant toward safety rules, thereby encouraging employees
to report hazards in the workplace. The alternative reason is because of the high prevalence
of MSPD, workers may be more likely to take action (Village and Ostry, 2010), such as
engaging in more short exercises or body stretching during break times.
As stated before this research assessed the workload by doing onsite observation and
determining the categorisation based on Dictionary of occupational title (DOT) (Lee and
Chan, 2003, National Academic Science Commitee on Occupational Classification and
Analysis, 2003), based on the common job title in the workgroup. In contrast, other studies
used self-reported or observation methods to assess workload.

137
4.5.2 Strengths and Weaknesses of the Follow-Up Survey
Most of the strengths and weaknesses in the follow-up survey were similar to the baseline
survey. Some strengths and weaknesses are restated here.
4.5.2.1 The Strengths of this Study
The participants’ individual data such as age and gender were similar to those in Australia and
South Australia (Australian Bureau of Statistics, 2010). In addition, the broad variation in the
types of companies participating in the study might allow generalisation of the results within
Australian and to all type of industries in Australia.
The face-to-face data collection allows clarification of meaning, and is generally considered
more reliable than self-administered methods.
The assessment tool of MSPD within the last 7 days was used to minimise the recall bias.
Furthermore, analysis of severe MSPD was conducted in order to clarify expand
understanding of MSPD.
4.5.2.2 The Weaknesses of this study
The cross-sectional design cannot be used to interpret the cause and effect of the outcome and
other variables (Elwood, 2007).
4.6 Conclusions
The findings of the follow-up survey are similar to those of the baseline survey, which found
that MSPD is common and that safety climate is associated with all types of MSPD. Thus
there is evidence that psychosocial factors are important correlates of MSPD, which in turn is
consistent with the conceptual model of WRMSD (Macdonald and Evans, 2006).

138
CHAPTER 5
EVALUATION OF THE STAGE OF CHANGE-BASED
INTERVENTIONS AND COMPARISON WITH INTERVENTIONS
BASED SOLELY ON ERGONOMIC ADVICE
5.1 Introduction
Chapters 3 and 4 have described two surveys, which up until now were considered as simple
consecutive studies without regard to any specific intervention or MSPD prevention strategy.
However, previous research (Whysall et al., 2005, Prochaska, 2007, Shaw et al., 2007) has
suggested that a SOC approach could be effective in reducing WRMSD, and that further
research was warranted. Accordingly, one of the aims of this thesis was to assess SOC-based
interventions, and also compare them to standard interventions, in this case, based on routine
ergonomic advice/practice.
The assessment was conceived as a cluster-randomised trial, in conjunction with rigorous
statistical analysis – something that has been lacking in previous research.
Thus, this Chapter reports on the design and methods enabling a comparison of the baseline
and follow-up survey data, as well as an evaluation of the intervention processes and
outcomes.
139
The comparison of raw baseline and follow-up data using a simple “before and after” analysis
is presented on section 5.2. The evaluation of the interventions, as a cluster-randomised trial,
and using advanced statistical treatment is presented in section 5.3. Section 5.4 presents the
result of workers’ perception of the interventions.
The findings are presented according to the order of the research questions posed at the end of
Chapter 2, namely:
1. What are the changes in the prevalence of MSPD, and for Tailored and Standard
interventions? What are associations between risk factors and the changes in MSPD?
(Section 5.2, Research question 3)
2. Is a Tailored intervention using a SOC approach effective in reducing MSPD in South
Australian workplaces compared with a standard intervention (without using a SOC
approach)? (Section 5.3, Research question 4)
3. What are the workers perceptions of the intervention implementation, and how do these
compared between Standard and Tailored interventions? (Section 5.4, Research question 5)
5.1.1 General Description of the Research Protocol
There were two types of intervention groups in this study, namely the Standard and Tailored
work groups. These were randomly pre-allocated prior to the baseline questionnaire survey.
Both groups received recommendations after the observation of each worksite, and the
baseline survey. The recommendations that were given to the Tailored group were tailored
based on SOC data for the workgroup, whereas the recommendations for the Standard group
were not tailored.
The stage-matched approach to WRMSD prevention (Table 5.1) was adapted from the UK
study (Whysall et al., 2005), and this, in conjunction with workgroup SOC data, was used to
tailor the recommendation provided to managers.
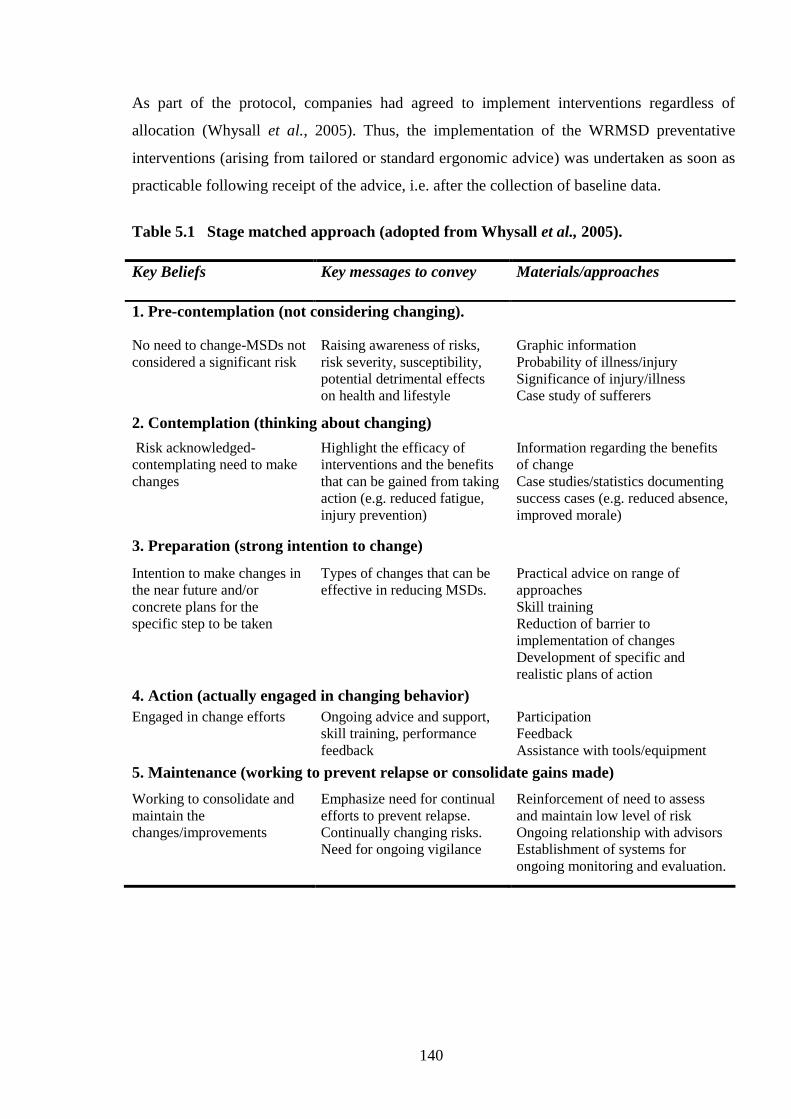
140
As part of the protocol, companies had agreed to implement interventions regardless of
allocation (Whysall et al., 2005). Thus, the implementation of the WRMSD preventative
interventions (arising from tailored or standard ergonomic advice) was undertaken as soon as
practicable following receipt of the advice, i.e. after the collection of baseline data.
Table 5.1 Stage matched approach (adopted from Whysall et al., 2005).
Key Beliefs Key messages to convey Materials/approaches
1. Pre-contemplation (not considering changing).
No need to change-MSDs not
considered a significant risk
Raising awareness of risks,
risk severity, susceptibility,
potential detrimental effects
on health and lifestyle
Graphic information
Probability of illness/injury
Significance of injury/illness
Case study of sufferers
2. Contemplation (thinking about changing)
Risk acknowledged-
contemplating need to make
changes
Highlight the efficacy of
interventions and the benefits
that can be gained from taking
action (e.g. reduced fatigue,
injury prevention)
Information regarding the benefits
of change
Case studies/statistics documenting
success cases (e.g. reduced absence,
improved morale)
3. Preparation (strong intention to change)
Intention to make changes in
the near future and/or
concrete plans for the
specific step to be taken
Types of changes that can be
effective in reducing MSDs.
Practical advice on range of
approaches
Skill training
Reduction of barrier to
implementation of changes
Development of specific and
realistic plans of action
4. Action (actually engaged in changing behavior)
Engaged in change efforts Ongoing advice and support,
skill training, performance
feedback
Participation
Feedback
Assistance with tools/equipment
5. Maintenance (working to prevent relapse or consolidate gains made)
Working to consolidate and
maintain the
changes/improvements
Emphasize need for continual
efforts to prevent relapse.
Continually changing risks.
Need for ongoing vigilance
Reinforcement of need to assess
and maintain low level of risk
Ongoing relationship with advisors
Establishment of systems for
ongoing monitoring and evaluation.
141
Intervention recommendations (tailored or standard) for each company were developed by an
experienced ergonomist following direct observation of work activities and informal
discussions with workers and managers. As a minimum, each workgroup manager was
provided with a written report detailing the observations undertaken, the recommended
ergonomics change as well as (publicly available) supplementary guidance for MSD
prevention, such as brochures. The recommendations of the intervention for both groups are
summarised in Table 5.2. A sample report for the standard group is given in Appendix 7, and
a sample report for the tailored group is given in Appendix 8.
In total, twenty-five interventions (13 standard and 12 tailored treatments) were recommended
within a range of 21 companies and 8 industrial sectors.
Table 5.2 is a large table reporting on:
Workgroup allocation (to tailored or standard intervention),
The company description and process
Tasks observed by the ergonomist
Advice given to management (ergonomics advice only for the Standard workgroup;
ergonomics and SOC-based advice for the Tailored workgroup)

142
Table 5.2. The intervention / recommendation detail.
Standard/Tailored Process Tasks Observed Recommendation detail
Standard Hospital - Nursing Ward
Duties
Patient handling, Patient
transfers/ transport.
Ergonomic advice: Manual Handling Equipment - audit of existing manual
handling equipment; In the short-term the provision of sufficient numbers and
types of slings should be considered along with a review of existing maintenance
schedules; Beds – If not already scheduled a planned replacement schedule for all
manual and partially manual beds should be developed; Patient Chairs & Over-
ways – In addition to the audit of manual handling equipment it is recommended
that this process should include other patient furniture including chairs and over-
ways; Pause Exercises ; Patient transport – Additional budgeting should be
considered to allow for the purchase of additional Stamina lifts (or other powered
bed movers); The fitting of castors to all patient lockers should be considered.
Alternatively a sack-truck may provide a short-term solution. During any
refurbishment the laying of vinyl flooring should be considered to reduce forces
during patient transports; Lighting – It is recommended that an audit of existing
lighting levels be undertaken; Worksite Inspections – If not already planned or in
place the development of a formal worksite inspection program for clinical areas
should be considered.
Standard Computer Workstations Standard computer workstations
with both single and dual
monitor configurations
Ergonomic advice: Desks – In any future redesign of this area the purchase and
provision of appropriate corner-style desks with suitable accommodation for
computer “towers” should be considered; A trial and evaluation of appropriate
seating (i.e. fully adjustable and commercially rated) should be undertaken in
consultation with staff and appropriately trained OHS personnel; Office
Ergonomics Training –It is recommended that general training in office
ergonomics be provided to staff both at induction and periodically thereafter ;
Pause Exercises – Office ergonomics training should include education in the use
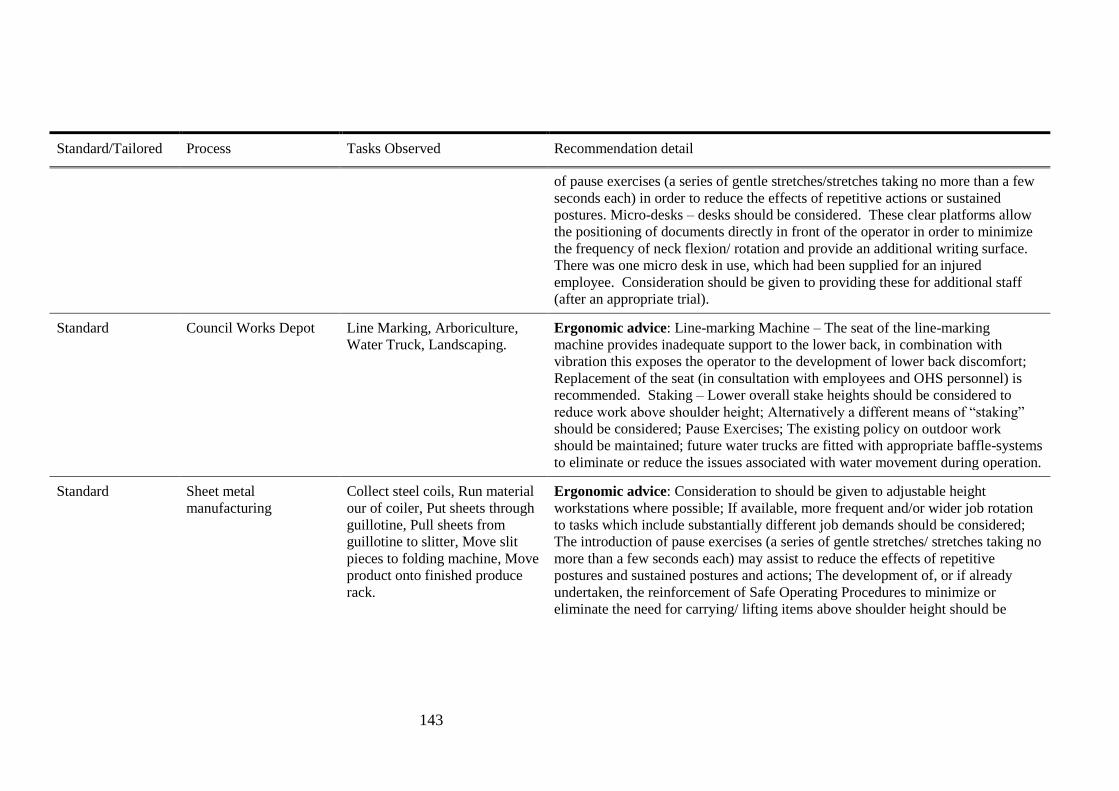
143
Standard/Tailored Process Tasks Observed Recommendation detail
of pause exercises (a series of gentle stretches/stretches taking no more than a few
seconds each) in order to reduce the effects of repetitive actions or sustained
postures. Micro-desks – desks should be considered. These clear platforms allow
the positioning of documents directly in front of the operator in order to minimize
the frequency of neck flexion/ rotation and provide an additional writing surface.
There was one micro desk in use, which had been supplied for an injured
employee. Consideration should be given to providing these for additional staff
(after an appropriate trial).
Standard Council Works Depot Line Marking, Arboriculture,
Water Truck, Landscaping.
Ergonomic advice: Line-marking Machine – The seat of the line-marking
machine provides inadequate support to the lower back, in combination with
vibration this exposes the operator to the development of lower back discomfort;
Replacement of the seat (in consultation with employees and OHS personnel) is
recommended. Staking – Lower overall stake heights should be considered to
reduce work above shoulder height; Alternatively a different means of “staking”
should be considered; Pause Exercises; The existing policy on outdoor work
should be maintained; future water trucks are fitted with appropriate baffle-systems
to eliminate or reduce the issues associated with water movement during operation.
Standard Sheet metal
manufacturing
Collect steel coils, Run material
our of coiler, Put sheets through
guillotine, Pull sheets from
guillotine to slitter, Move slit
pieces to folding machine, Move
product onto finished produce
rack.
Ergonomic advice: Consideration to should be given to adjustable height
workstations where possible; If available, more frequent and/or wider job rotation
to tasks which include substantially different job demands should be considered;
The introduction of pause exercises (a series of gentle stretches/ stretches taking no
more than a few seconds each) may assist to reduce the effects of repetitive
postures and sustained postures and actions; The development of, or if already
undertaken, the reinforcement of Safe Operating Procedures to minimize or
eliminate the need for carrying/ lifting items above shoulder height should be
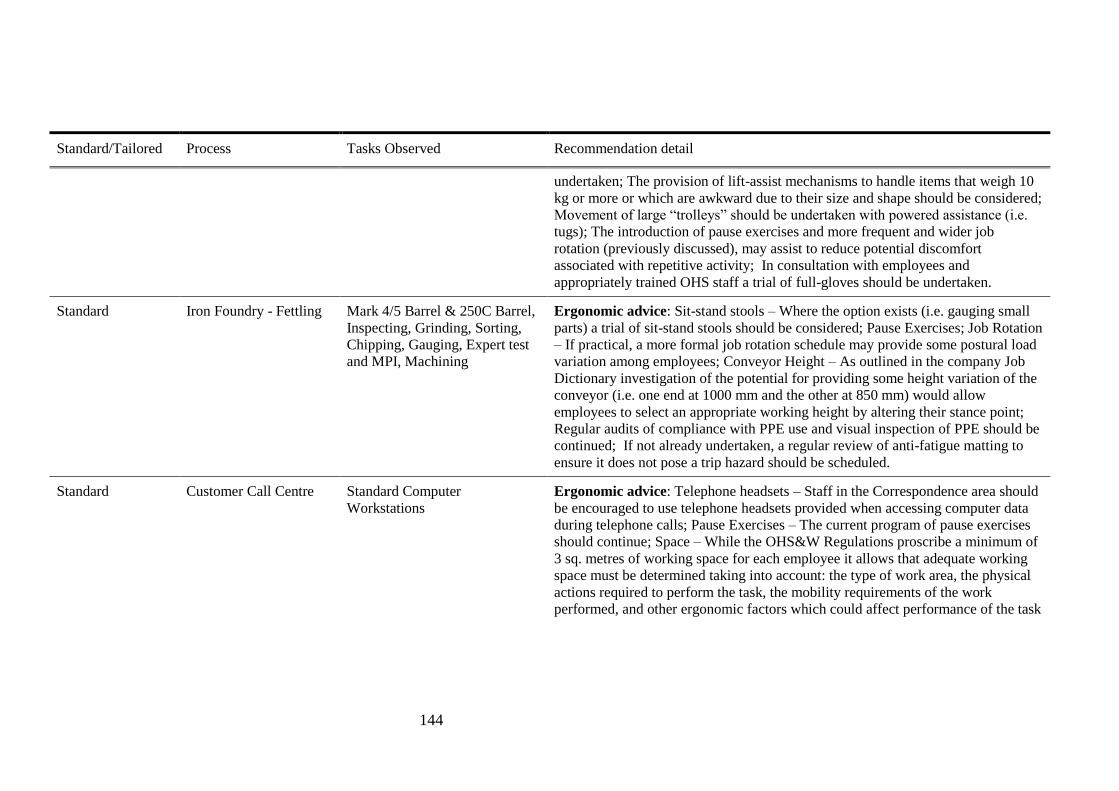
144
Standard/Tailored Process Tasks Observed Recommendation detail
undertaken; The provision of lift-assist mechanisms to handle items that weigh 10
kg or more or which are awkward due to their size and shape should be considered;
Movement of large “trolleys” should be undertaken with powered assistance (i.e.
tugs); The introduction of pause exercises and more frequent and wider job
rotation (previously discussed), may assist to reduce potential discomfort
associated with repetitive activity; In consultation with employees and
appropriately trained OHS staff a trial of full-gloves should be undertaken.
Standard Iron Foundry - Fettling Mark 4/5 Barrel & 250C Barrel,
Inspecting, Grinding, Sorting,
Chipping, Gauging, Expert test
and MPI, Machining
Ergonomic advice: Sit-stand stools – Where the option exists (i.e. gauging small
parts) a trial of sit-stand stools should be considered; Pause Exercises; Job Rotation
– If practical, a more formal job rotation schedule may provide some postural load
variation among employees; Conveyor Height – As outlined in the company Job
Dictionary investigation of the potential for providing some height variation of the
conveyor (i.e. one end at 1000 mm and the other at 850 mm) would allow
employees to select an appropriate working height by altering their stance point;
Regular audits of compliance with PPE use and visual inspection of PPE should be
continued; If not already undertaken, a regular review of anti-fatigue matting to
ensure it does not pose a trip hazard should be scheduled.
Standard Customer Call Centre Standard Computer
Workstations
Ergonomic advice: Telephone headsets – Staff in the Correspondence area should
be encouraged to use telephone headsets provided when accessing computer data
during telephone calls; Pause Exercises – The current program of pause exercises
should continue; Space – While the OHS&W Regulations proscribe a minimum of
3 sq. metres of working space for each employee it allows that adequate working
space must be determined taking into account: the type of work area, the physical
actions required to perform the task, the mobility requirements of the work
performed, and other ergonomic factors which could affect performance of the task

145
Standard/Tailored Process Tasks Observed Recommendation detail
in a safe manner; Lighting – A cost effective means of allowing staff to control
local lighting levels may be to provide task lighting (i.e. a desk lamp) as requested.
Standard Warehouse Receive deliveries, Transport
items inside using sack truck/
trolley, Checking of received
goods/data entry, Repacking
goods, Loading into containers
for transport, Forklift operation
Ergonomic advice: Workflow – There is an existing plan to redesign workflow
arrangements based on ergonomic advice already received; This redesign will have
a significant positive impact on working postures and loads and should aim to
provide some consistency with working heights, minimise “double-handling” and
provide maximum benefit from “rolling conveyor” systems; Pallet lifters - The
provision of pallet lifters to raise working height is currently under consideration
and should be prioritised; Shelf storage height - While infrequent, storage of
archive boxes should be limited to shoulder height, alternatively a step-stool
should be provided; Sit-stand-stools – Any redesign of the work area should
consider the provision of a clear space immediately underneath to allow for the use
of sit-stand stools. In addition to providing relief from relatively static standing
positions they also allow staff to adjust their working height at otherwise fixed
height workstations; Micro-desks – Consider the trial of micro-desks at computer
workstations. These clear platforms allow the positioning of documents etc.;
directly in front of the operator in order to minimize the frequency of neck
flexion/rotation; Pause Exercises; An audit of anti-fatigue matting should be
considered to determine the level of employee satisfaction with the extent of
current supply.
Standard Patient Care Workers Personal Care, Assistance with
Meal Preparation, Assistance
with Activities, Patient
Transport – to/from home
Ergonomic advice: Transport Vehicle - It is recommended that during any
planned replacement consideration be given to the purchase of vehicles with
greater interior capacity, increased roof height and modified ramp system which
may eliminate or reduce the step height; Personal Care – If not already planned or
routinely undertaken a Manual Handling Equipment; Needs Analysis should be
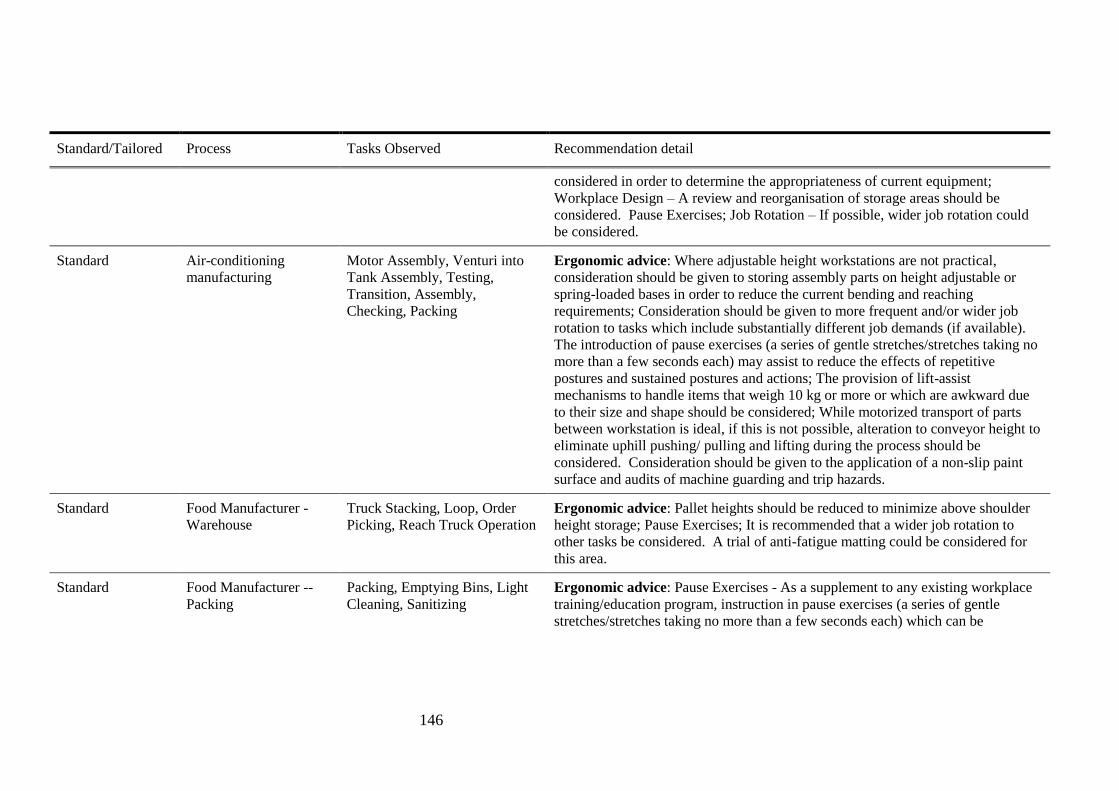
146
Standard/Tailored Process Tasks Observed Recommendation detail
considered in order to determine the appropriateness of current equipment;
Workplace Design – A review and reorganisation of storage areas should be
considered. Pause Exercises; Job Rotation – If possible, wider job rotation could
be considered.
Standard Air-conditioning
manufacturing
Motor Assembly, Venturi into
Tank Assembly, Testing,
Transition, Assembly,
Checking, Packing
Ergonomic advice: Where adjustable height workstations are not practical,
consideration should be given to storing assembly parts on height adjustable or
spring-loaded bases in order to reduce the current bending and reaching
requirements; Consideration should be given to more frequent and/or wider job
rotation to tasks which include substantially different job demands (if available).
The introduction of pause exercises (a series of gentle stretches/stretches taking no
more than a few seconds each) may assist to reduce the effects of repetitive
postures and sustained postures and actions; The provision of lift-assist
mechanisms to handle items that weigh 10 kg or more or which are awkward due
to their size and shape should be considered; While motorized transport of parts
between workstation is ideal, if this is not possible, alteration to conveyor height to
eliminate uphill pushing/ pulling and lifting during the process should be
considered. Consideration should be given to the application of a non-slip paint
surface and audits of machine guarding and trip hazards.
Standard Food Manufacturer -
Warehouse
Truck Stacking, Loop, Order
Picking, Reach Truck Operation
Ergonomic advice: Pallet heights should be reduced to minimize above shoulder
height storage; Pause Exercises; It is recommended that a wider job rotation to
other tasks be considered. A trial of anti-fatigue matting could be considered for
this area.
Standard Food Manufacturer --
Packing
Packing, Emptying Bins, Light
Cleaning, Sanitizing
Ergonomic advice: Pause Exercises - As a supplement to any existing workplace
training/education program, instruction in pause exercises (a series of gentle
stretches/stretches taking no more than a few seconds each) which can be

147
Standard/Tailored Process Tasks Observed Recommendation detail
undertaken during “natural” production breaks, may assist to reduce the effects of
repetitive postures and actions; The Packing task has recently been partially
redesigned to position flat-packed cartons in front of the operator. The new area
may be further improved by a modification to the carton storage area to angle this
surface towards the operator and providing a “lip” at the front edge. Such a
modification may make the cartons easier to access while maintaining visual
clearance.
Standard Retail Store - Customer
Service
Customer Service, Stocking
Shelves, Cleaning/ Maintenance
Ergonomic advice: Sit-stand-stools – Consideration should be given to a trial of
sit-stand stools for tasks requiring prolonged standing. In addition to provide relief
from relatively static standing positions they also allow staff to adjust their
working height at otherwise fixed height workstations; Pushing/pulling of trolleys
– It is recommended that a consistent method be adopted; Although pushing is
generally “easier” than pulling the trolley height exceeds the “line-of-sight” of
some staff members; Consequently this would need to be a 2-person task. The end-
range pronation position observed is not recommended. In order to eliminate or
minimize the issue of finger/hand trapping in narrow stores areas a guard or other
modification to the trolley handles is recommended. Sit-stand stool; Price
Markdown – Stock should be placed on a small trolley during price markdown.
During replacement a review of the castor diameter/design should be undertaken
with consideration given to purchase of larger diameter castors. Consideration
should be given to the establishment of a trolley “register” where each trolley is
allocated a number and regular preventative maintenance inspection is recorded;
The weight of all stock boxes should be clearly marked; Pause Exercises;
Consideration should be given to a redesign of the checkout counter to
accommodate customer supplied “reusable” bags.
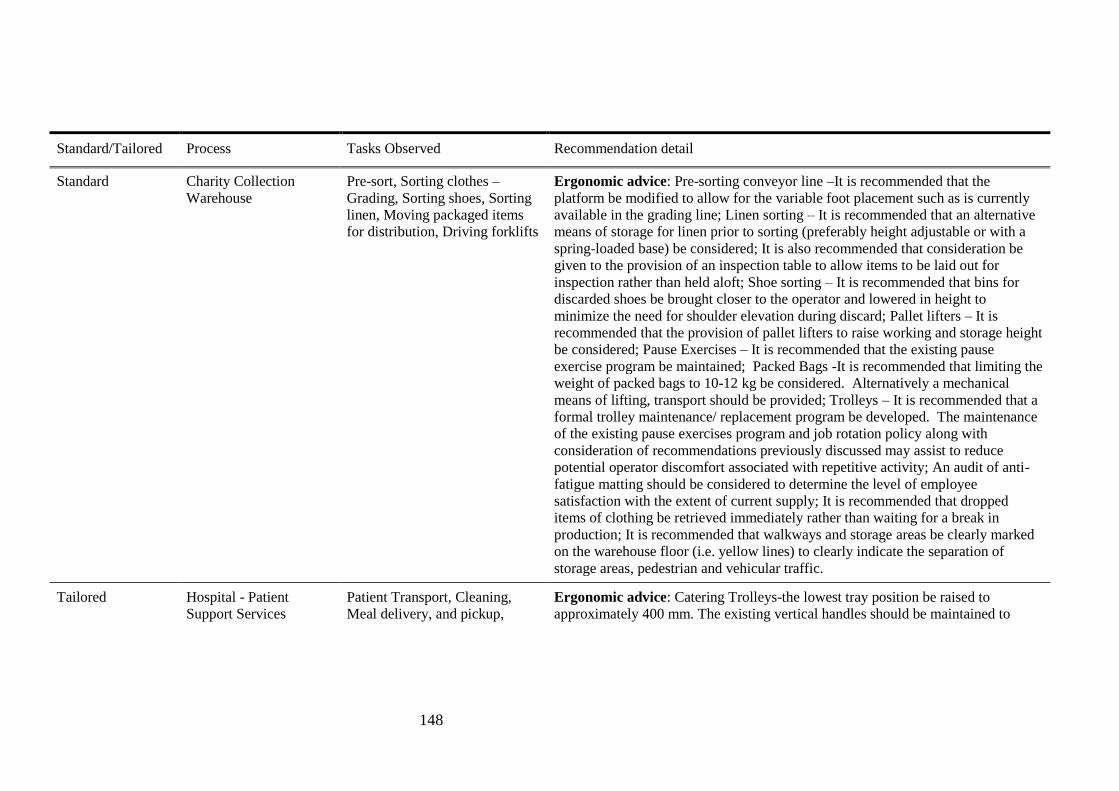
148
Standard/Tailored Process Tasks Observed Recommendation detail
Standard Charity Collection
Warehouse
Pre-sort, Sorting clothes –
Grading, Sorting shoes, Sorting
linen, Moving packaged items
for distribution, Driving forklifts
Ergonomic advice: Pre-sorting conveyor line –It is recommended that the
platform be modified to allow for the variable foot placement such as is currently
available in the grading line; Linen sorting – It is recommended that an alternative
means of storage for linen prior to sorting (preferably height adjustable or with a
spring-loaded base) be considered; It is also recommended that consideration be
given to the provision of an inspection table to allow items to be laid out for
inspection rather than held aloft; Shoe sorting – It is recommended that bins for
discarded shoes be brought closer to the operator and lowered in height to
minimize the need for shoulder elevation during discard; Pallet lifters – It is
recommended that the provision of pallet lifters to raise working and storage height
be considered; Pause Exercises – It is recommended that the existing pause
exercise program be maintained; Packed Bags -It is recommended that limiting the
weight of packed bags to 10-12 kg be considered. Alternatively a mechanical
means of lifting, transport should be provided; Trolleys – It is recommended that a
formal trolley maintenance/ replacement program be developed. The maintenance
of the existing pause exercises program and job rotation policy along with
consideration of recommendations previously discussed may assist to reduce
potential operator discomfort associated with repetitive activity; An audit of anti-
fatigue matting should be considered to determine the level of employee
satisfaction with the extent of current supply; It is recommended that dropped
items of clothing be retrieved immediately rather than waiting for a break in
production; It is recommended that walkways and storage areas be clearly marked
on the warehouse floor (i.e. yellow lines) to clearly indicate the separation of
storage areas, pedestrian and vehicular traffic.
Tailored Hospital - Patient
Support Services
Patient Transport, Cleaning,
Meal delivery, and pickup,
Ergonomic advice: Catering Trolleys-the lowest tray position be raised to
approximately 400 mm. The existing vertical handles should be maintained to

149
Standard/Tailored Process Tasks Observed Recommendation detail
Removing rubbish, Removing
soiled linen.
allow for variability in pushing height; Linen Storage Height -soiled linen not be
stored on the top shelf; Old-style linen skips should be upgraded to the most
recently purchased “dual” design. This new version helps limit over-filling while
providing a stable base and appropriate push-handle. Pause exercises; The existing
trolley maintenance program should be reviewed and it is recommended that
trolley push forces are formally assessed. The linen skip storage access area is in
need of redesign; Linen Skips – Older style linen skips should be replaced with the
newer version in order to minimise the potential for over-filling; Patient Transports
– Additional budgeting should be considered to allow for the purchase of
additional Stamina lifts (or other powered bed movers). In the longer-term a
redesign of the powered bariatric wheelchair should be considered to improve
operator comfort. The provision of a small compressor in addition to hand pumps
may improve the maintenance of wheelchairs.
SOC advice: Further training in activities such as hazard & risk identification and
assessment. Ongoing active participation in workplace changes and continuous
improvement strategies; Continual reinforcement (i.e. feedback) of their efforts in
order to prevent relapse, for example regular posting of OHS&W Committee
Meeting Minutes; Ongoing involvement/consultation in monitoring workplace
practices and any proposed changes should be encouraged; An ongoing and
collaborative relationship with OHS advisors.
Tailored Commercial Laundry Counting in, Washing and
drying, Hanging garments,
Ironing, Folding
Ergonomic advice: Counting in – Linen bags should be loaded directly onto
trolleys to minimise double- handling. It is also recommended that these should be
weight-limited; Washroom – The current process is in need of redesign to
eliminate or minimise the repetitive forward bending/ reaching and overhead
activity; Workbenches – It is recommended that consideration be given for the use
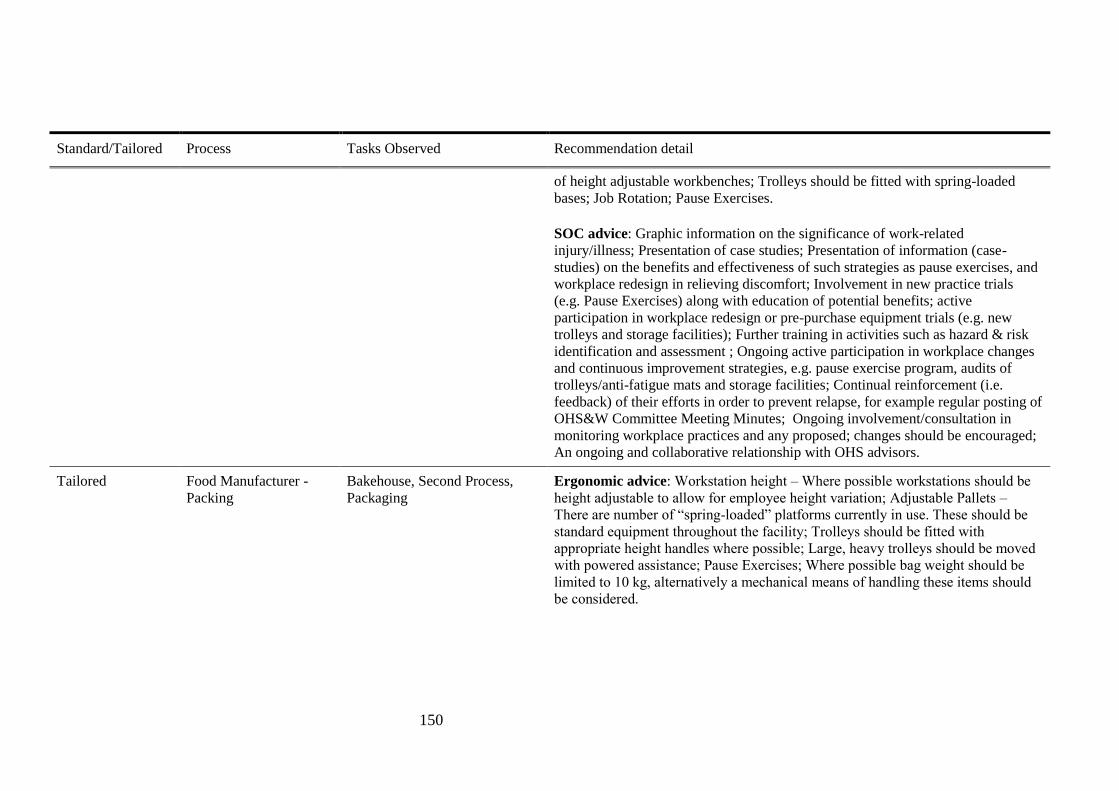
150
Standard/Tailored Process Tasks Observed Recommendation detail
of height adjustable workbenches; Trolleys should be fitted with spring-loaded
bases; Job Rotation; Pause Exercises.
SOC advice: Graphic information on the significance of work-related
injury/illness; Presentation of case studies; Presentation of information (case-
studies) on the benefits and effectiveness of such strategies as pause exercises, and
workplace redesign in relieving discomfort; Involvement in new practice trials
(e.g. Pause Exercises) along with education of potential benefits; active
participation in workplace redesign or pre-purchase equipment trials (e.g. new
trolleys and storage facilities); Further training in activities such as hazard & risk
identification and assessment ; Ongoing active participation in workplace changes
and continuous improvement strategies, e.g. pause exercise program, audits of
trolleys/anti-fatigue mats and storage facilities; Continual reinforcement (i.e.
feedback) of their efforts in order to prevent relapse, for example regular posting of
OHS&W Committee Meeting Minutes; Ongoing involvement/consultation in
monitoring workplace practices and any proposed; changes should be encouraged;
An ongoing and collaborative relationship with OHS advisors.
Tailored Food Manufacturer -
Packing
Bakehouse, Second Process,
Packaging
Ergonomic advice: Workstation height – Where possible workstations should be
height adjustable to allow for employee height variation; Adjustable Pallets –
There are number of “spring-loaded” platforms currently in use. These should be
standard equipment throughout the facility; Trolleys should be fitted with
appropriate height handles where possible; Large, heavy trolleys should be moved
with powered assistance; Pause Exercises; Where possible bag weight should be
limited to 10 kg, alternatively a mechanical means of handling these items should
be considered.

151
Standard/Tailored Process Tasks Observed Recommendation detail
SOC advice: Presentation of information (case-studies) on the benefits and
effectiveness of such strategies as pause exercises and broad job rotation in
relieving discomfort; Involvement in new equipment trials prior to purchase along
with education of potential benefits; Further training in activities such as hazard &
risk identification and assessment; Ongoing active participation in workplace
changes and continuous improvement strategies, e.g. development of trolley
register, equipment trials (spring-loaded pallets, powered trolley mover) and job
rotation initiatives; Continual reinforcement (i.e. feedback) of their efforts in order
to prevent relapse, for example regular posting of OHS&W Committee Meeting
Minutes; Ongoing involvement/consultation in monitoring workplace practices
and any proposed changes should be encouraged; An ongoing collaborative
relationship with the onsite physiotherapist/ergonomist.
Tailored Hospital -
Catering/Housekeeping
Catering, Housekeeping Ergonomic advice: Catering Trolleys-the lowest tray position be raised to
approximately 400 mm. Trolleys should be also be fitted with additional vertical
handles to allow for variability in pushing height; Storage Height-an alternative
storage location be provided for kitchen trays; While the sink is fitted with a spacer
to reduce the depth (to 240 mm), considerable reaching and sustained lumbar
flexion is still required (picture 5). It is recommended that modification to the
spacer to decrease the sink “length,” and the reach distance required, be
considered; Pause Exercises; The weight of received food goods is limited to 15 kg
with items of this weight stored appropriately in the dry goods, cold room and
freezer; Linen skips are fitted with a “fixed bottom” in order to minimise over-
filling.
SOC advice: Presentation of information (case-studies) on the benefits and
effectiveness of such strategies as pause exercises, and workplace redesign in
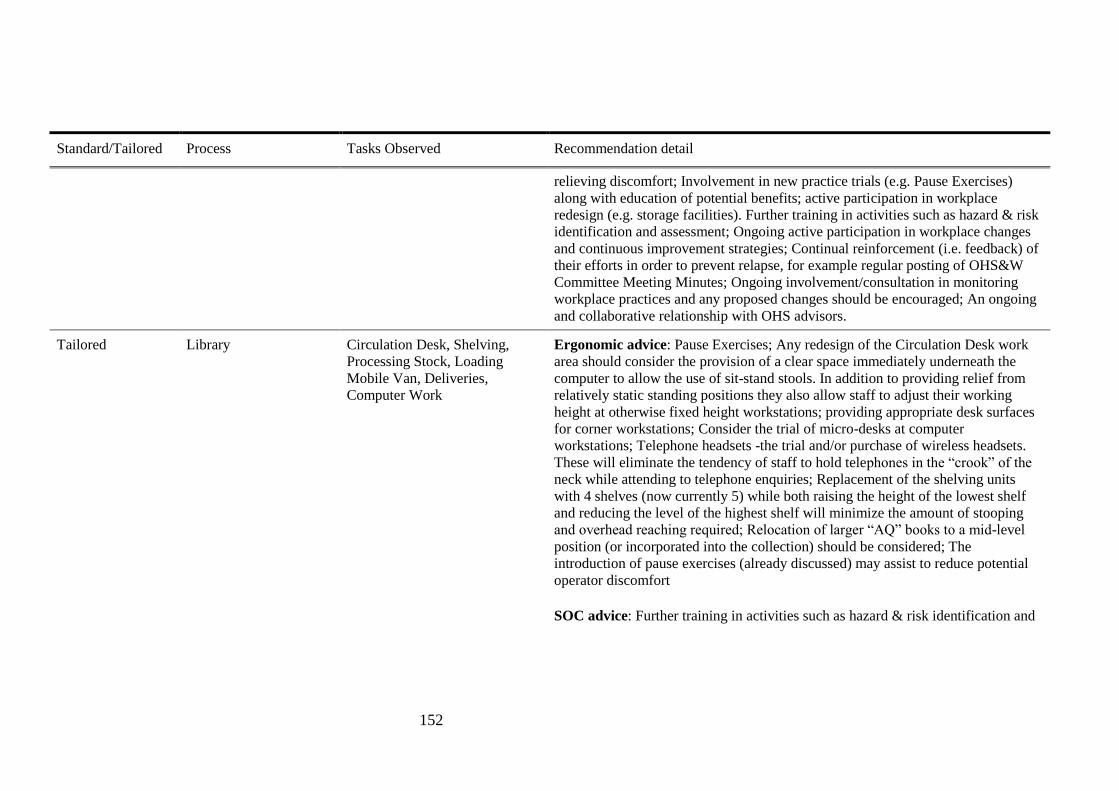
152
Standard/Tailored Process Tasks Observed Recommendation detail
relieving discomfort; Involvement in new practice trials (e.g. Pause Exercises)
along with education of potential benefits; active participation in workplace
redesign (e.g. storage facilities). Further training in activities such as hazard & risk
identification and assessment; Ongoing active participation in workplace changes
and continuous improvement strategies; Continual reinforcement (i.e. feedback) of
their efforts in order to prevent relapse, for example regular posting of OHS&W
Committee Meeting Minutes; Ongoing involvement/consultation in monitoring
workplace practices and any proposed changes should be encouraged; An ongoing
and collaborative relationship with OHS advisors.
Tailored Library Circulation Desk, Shelving,
Processing Stock, Loading
Mobile Van, Deliveries,
Computer Work
Ergonomic advice: Pause Exercises; Any redesign of the Circulation Desk work
area should consider the provision of a clear space immediately underneath the
computer to allow the use of sit-stand stools. In addition to providing relief from
relatively static standing positions they also allow staff to adjust their working
height at otherwise fixed height workstations; providing appropriate desk surfaces
for corner workstations; Consider the trial of micro-desks at computer
workstations; Telephone headsets -the trial and/or purchase of wireless headsets.
These will eliminate the tendency of staff to hold telephones in the “crook” of the
neck while attending to telephone enquiries; Replacement of the shelving units
with 4 shelves (now currently 5) while both raising the height of the lowest shelf
and reducing the level of the highest shelf will minimize the amount of stooping
and overhead reaching required; Relocation of larger “AQ” books to a mid-level
position (or incorporated into the collection) should be considered; The
introduction of pause exercises (already discussed) may assist to reduce potential
operator discomfort
SOC advice: Further training in activities such as hazard & risk identification and

153
Standard/Tailored Process Tasks Observed Recommendation detail
assessment; Ongoing active participation in workplace changes and continuous
improvement strategies, e.g. equipment trials (sit-stand stools, micro-desks,
telephone headsets), job rotation initiatives, shelf redesign and the introduction of
pause exercises; These employees will benefit from continual reinforcement (i.e.
feedback) of their efforts in order to prevent relapse. Ongoing
involvement/consultation in monitoring workplace practices and any proposed
changes should be encouraged.
Tailored Council Works Depot Kerbing, Tree Pruning, Road
Reconstruction, Paving, Recycle
Waste Collection, Quick
Response, Horticulture
Ergonomic advice: Pause Exercises; Elevated Work Platform-consideration
should be given to the purchase of an additional “Hydralada” when funding
becomes available; PPE-Protective kneepads should be considered as standard PPE
during repetitive or prolonged kneeling tasks (subject to an appropriate work trial
and consultation). Although it is understood that these are available their use is
optional; If formal job rotation is not practical, then the current emphasis on self-
paced work should continue to be encouraged; Regular audits of compliance with
PPE should be undertaken
SOC advice: Presentation of information (case-studies) on the benefits and
effectiveness of such strategies as pause exercises and broad job rotation in
relieving discomfort; Involvement in new equipment trials prior to purchase along
with education of potential benefits; These employees will benefit from continual
reinforcement (i.e. feedback) of their efforts in order to prevent relapse; Ongoing
involvement/ consultation in monitoring workplace practices and any proposed
changes should be encouraged.
Tailored Optical Lens
Manufacture
Blocker, Tools, Fining,
Polishing, Cleaning & Grinding,
Ergonomic advice: Pause Exercises; a series of gentle stretches/stretches taking
no more than a few seconds each may assist to reduce the effects of repetitive
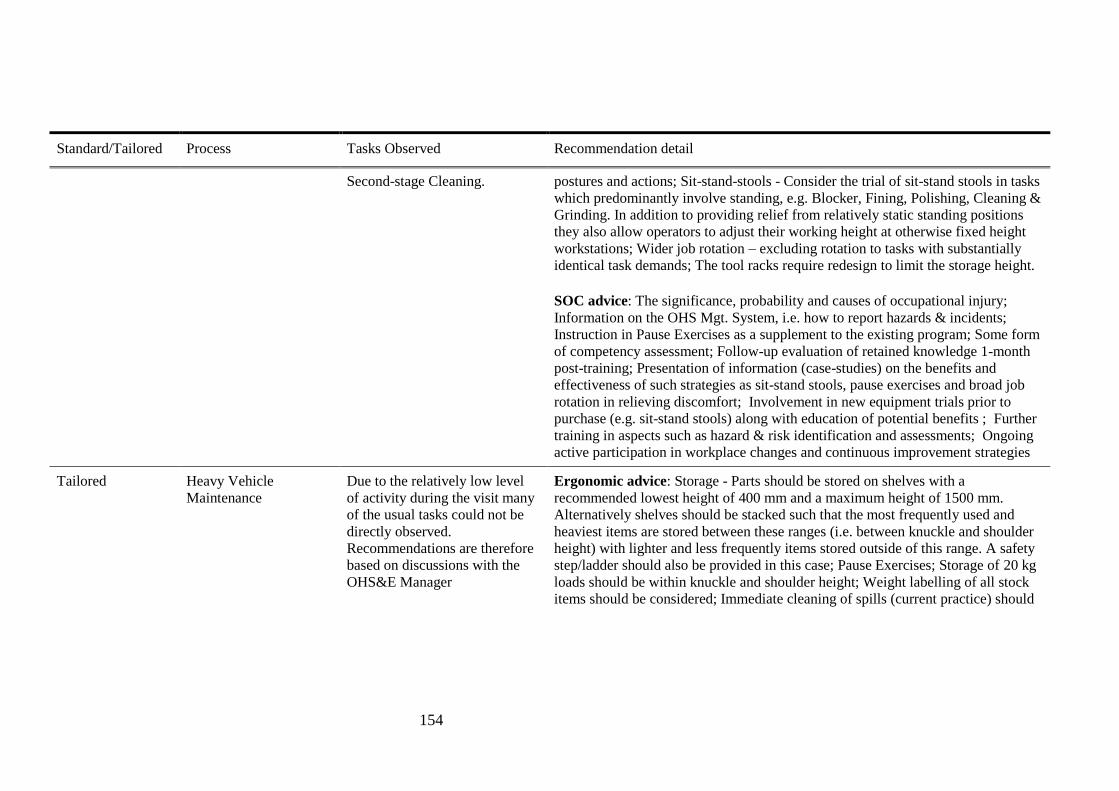
154
Standard/Tailored Process Tasks Observed Recommendation detail
Second-stage Cleaning. postures and actions; Sit-stand-stools - Consider the trial of sit-stand stools in tasks
which predominantly involve standing, e.g. Blocker, Fining, Polishing, Cleaning &
Grinding. In addition to providing relief from relatively static standing positions
they also allow operators to adjust their working height at otherwise fixed height
workstations; Wider job rotation – excluding rotation to tasks with substantially
identical task demands; The tool racks require redesign to limit the storage height.
SOC advice: The significance, probability and causes of occupational injury;
Information on the OHS Mgt. System, i.e. how to report hazards & incidents;
Instruction in Pause Exercises as a supplement to the existing program; Some form
of competency assessment; Follow-up evaluation of retained knowledge 1-month
post-training; Presentation of information (case-studies) on the benefits and
effectiveness of such strategies as sit-stand stools, pause exercises and broad job
rotation in relieving discomfort; Involvement in new equipment trials prior to
purchase (e.g. sit-stand stools) along with education of potential benefits ; Further
training in aspects such as hazard & risk identification and assessments; Ongoing
active participation in workplace changes and continuous improvement strategies
Tailored Heavy Vehicle
Maintenance
Due to the relatively low level
of activity during the visit many
of the usual tasks could not be
directly observed.
Recommendations are therefore
based on discussions with the
OHS&E Manager
Ergonomic advice: Storage - Parts should be stored on shelves with a
recommended lowest height of 400 mm and a maximum height of 1500 mm.
Alternatively shelves should be stacked such that the most frequently used and
heaviest items are stored between these ranges (i.e. between knuckle and shoulder
height) with lighter and less frequently items stored outside of this range. A safety
step/ladder should also be provided in this case; Pause Exercises; Storage of 20 kg
loads should be within knuckle and shoulder height; Weight labelling of all stock
items should be considered; Immediate cleaning of spills (current practice) should
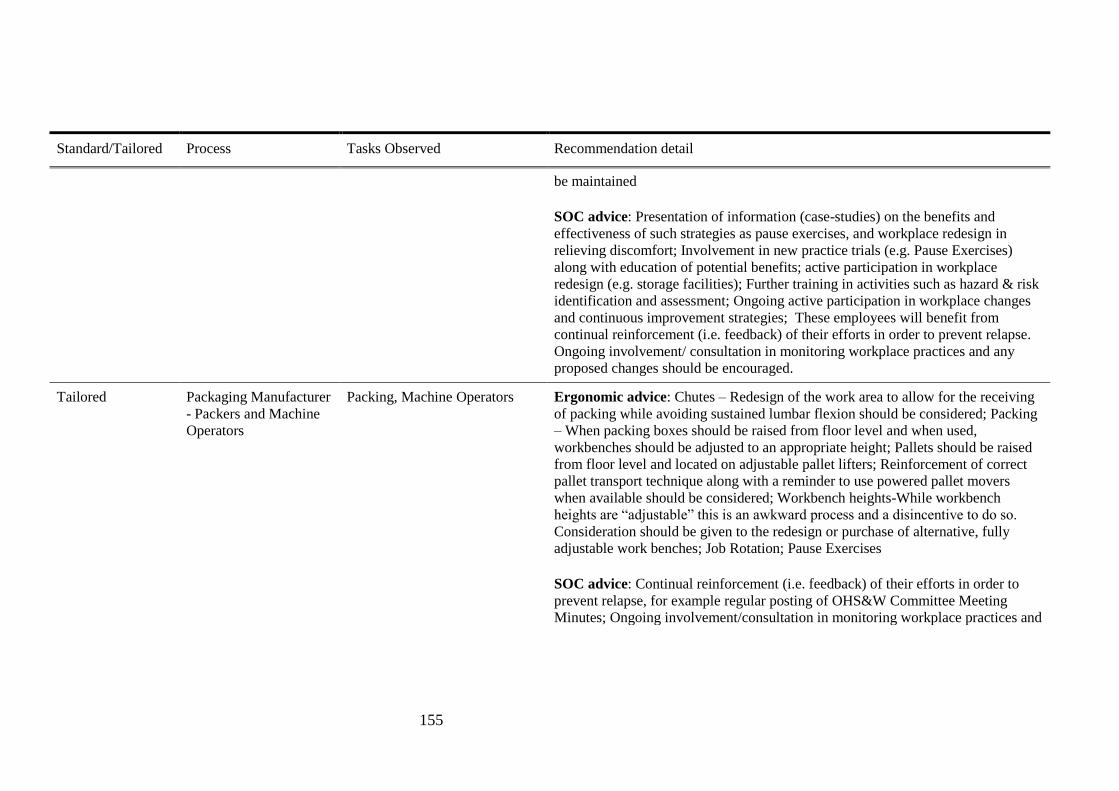
155
Standard/Tailored Process Tasks Observed Recommendation detail
be maintained
SOC advice: Presentation of information (case-studies) on the benefits and
effectiveness of such strategies as pause exercises, and workplace redesign in
relieving discomfort; Involvement in new practice trials (e.g. Pause Exercises)
along with education of potential benefits; active participation in workplace
redesign (e.g. storage facilities); Further training in activities such as hazard & risk
identification and assessment; Ongoing active participation in workplace changes
and continuous improvement strategies; These employees will benefit from
continual reinforcement (i.e. feedback) of their efforts in order to prevent relapse.
Ongoing involvement/ consultation in monitoring workplace practices and any
proposed changes should be encouraged.
Tailored Packaging Manufacturer
- Packers and Machine
Operators
Packing, Machine Operators Ergonomic advice: Chutes – Redesign of the work area to allow for the receiving
of packing while avoiding sustained lumbar flexion should be considered; Packing
– When packing boxes should be raised from floor level and when used,
workbenches should be adjusted to an appropriate height; Pallets should be raised
from floor level and located on adjustable pallet lifters; Reinforcement of correct
pallet transport technique along with a reminder to use powered pallet movers
when available should be considered; Workbench heights-While workbench
heights are “adjustable” this is an awkward process and a disincentive to do so.
Consideration should be given to the redesign or purchase of alternative, fully
adjustable work benches; Job Rotation; Pause Exercises
SOC advice: Continual reinforcement (i.e. feedback) of their efforts in order to
prevent relapse, for example regular posting of OHS&W Committee Meeting
Minutes; Ongoing involvement/consultation in monitoring workplace practices and

156
Standard/Tailored Process Tasks Observed Recommendation detail
any proposed changes should be encouraged; An ongoing and collaborative
relationship with OHS advisors.
Tailored Retail Store - Customer
Service
Customer Service, Stocking
Shelves
Ergonomic advice: Goods Lift -a means of reducing the reach height be explored
along with an examination of the glide mechanism in order to reduce the forces
involved; Customer Service Counters redesign be should be considered. This
should include elevation of the Ultra-label scanner to an appropriate height and
modification of the counter-top to incorporate a “chute” for disposal of the security
tags; Fixing Security Tags – Redesign of the bench-top to reduce forward reaching
is recommended; Ladders should be marked with their SWL. If possible ladders
should be stored so as to be more easily accessible when required; Pause Exercises;
Received goods – All containers of received goods should be marked with their
weight; Training-OHS&W training should be provided by appropriately qualified
staff; Worksite Inspections – If it is not already done so, worksite inspections
should be formalised with input from relevant staff; Consultation-If it is not
already done so a formal staff consultation process should be established. This
should include such activities as worksite inspection programs, pre- purchase
assessments of new equipment and the development of training programs.
SOC advice: Presentation of information (case-studies) on the benefits and
effectiveness of such strategies as pause exercises, and workplace redesign in
relieving discomfort; Involvement in new practice trials (e.g. Pause Exercises)
along with education of potential benefits; Active participation in workplace
redesign (e.g. customer service counters); Further training in activities such as
hazard & risk identification and assessment; Ongoing active participation in
workplace changes and continuous improvement strategies.
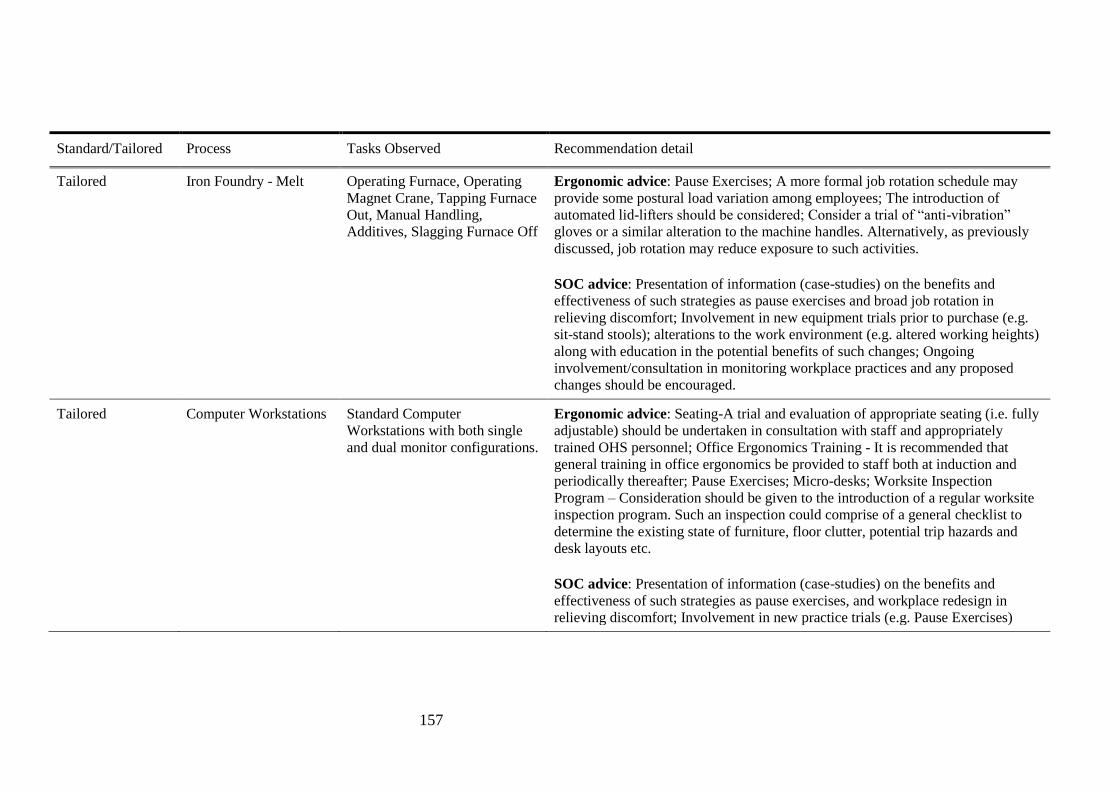
157
Standard/Tailored Process Tasks Observed Recommendation detail
Tailored Iron Foundry - Melt Operating Furnace, Operating
Magnet Crane, Tapping Furnace
Out, Manual Handling,
Additives, Slagging Furnace Off
Ergonomic advice: Pause Exercises; A more formal job rotation schedule may
provide some postural load variation among employees; The introduction of
automated lid-lifters should be considered; Consider a trial of “anti-vibration”
gloves or a similar alteration to the machine handles. Alternatively, as previously
discussed, job rotation may reduce exposure to such activities.
SOC advice: Presentation of information (case-studies) on the benefits and
effectiveness of such strategies as pause exercises and broad job rotation in
relieving discomfort; Involvement in new equipment trials prior to purchase (e.g.
sit-stand stools); alterations to the work environment (e.g. altered working heights)
along with education in the potential benefits of such changes; Ongoing
involvement/consultation in monitoring workplace practices and any proposed
changes should be encouraged.
Tailored Computer Workstations Standard Computer
Workstations with both single
and dual monitor configurations.
Ergonomic advice: Seating-A trial and evaluation of appropriate seating (i.e. fully
adjustable) should be undertaken in consultation with staff and appropriately
trained OHS personnel; Office Ergonomics Training - It is recommended that
general training in office ergonomics be provided to staff both at induction and
periodically thereafter; Pause Exercises; Micro-desks; Worksite Inspection
Program – Consideration should be given to the introduction of a regular worksite
inspection program. Such an inspection could comprise of a general checklist to
determine the existing state of furniture, floor clutter, potential trip hazards and
desk layouts etc.
SOC advice: Presentation of information (case-studies) on the benefits and
effectiveness of such strategies as pause exercises, and workplace redesign in
relieving discomfort; Involvement in new practice trials (e.g. Pause Exercises)
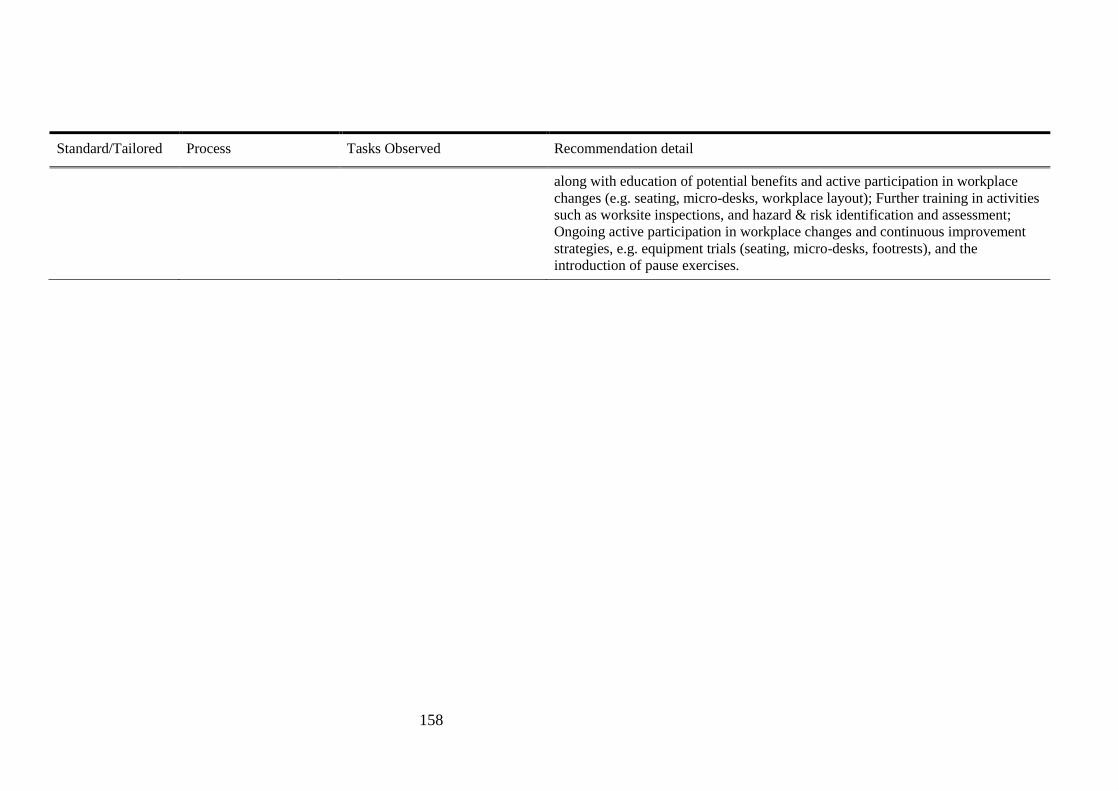
158
Standard/Tailored Process Tasks Observed Recommendation detail
along with education of potential benefits and active participation in workplace
changes (e.g. seating, micro-desks, workplace layout); Further training in activities
such as worksite inspections, and hazard & risk identification and assessment;
Ongoing active participation in workplace changes and continuous improvement
strategies, e.g. equipment trials (seating, micro-desks, footrests), and the
introduction of pause exercises.
159
5.1.1.1 Protocol for the Standard Group
The standard intervention group managers received ergonomics recommendations based on
the worksite observations and were not tailored on SOC.
5.1.1.2 Protocol for the Tailored Group
The tailored intervention group managers received additional information on the stage of
change (SOC) of the workers in the workgroup and its relevance to the choice of possible
interventions. In this process, de-identified aggregated SOC information for workers was
provided to the manager.
For example in a hypothetical workgroup “X”, the distribution of SOC of the workers was as
follows: two workers in pre-contemplation stage, six in contemplation/preparation, zero in
action and four in maintenance. The written recommendations for WRMSD prevention took
account of all 3 stages present in that workgroup (pre-contemplation,
contemplation/preparation, and maintenance). Next, the ergonomist and managers discussed
which of the recommendations would be worthwhile approaches for all the workers in that
workgroup. The manager then made a decision based on the practicability and affordability
of the proposed interventions for the company and its employees. The managers to whom the
reports were provided were responsible for the implementation of the chosen changes.
It should be noted that the recommendations for stage-matched interventions in this research
were different from the previous UK study (Whysall et al., 2005) where the recommended
SOC approach was based on the most common stage. In this research the intervention was
based on the workgroup SOC profile. Hence, for example, awareness rising was included as
part of the advice so long as there was at least one member of the workgroup in pre-
contemplation. Interventions addressed various kinds of recommendations to control MSD,
including redesign of tools, workstations, work processes, purchase of new equipment, job
rotation, worksite inspection programs, manual handling training, and exercises (see Table
5.2). Interventions were implemented via manager (or trainer etc.) to the workers.
160
The ergonomist followed up the interventions every three months by asking the manager
through a phone call, about the progress of the implementation.
5.1.2 Research Questions
A range of questions are addressed in this Chapter.
1. a. What are the overall changes in MSPD before and after the interventions?
b. Comparing standard and tailored groups, what are the changes in MSPD?
- Does MSPD stay the same, reduce, or increase?
-What is the extent of the change (using the baseline data as a reference)?
2. In terms of MSPD what is the relative effectiveness of tailored interventions versus
standard interventions?
3. a. What is the association between overall changes in MSPD and individual, occupational,
and organisational characteristics?
b. Comparing the standard and tailored groups, what is the association between changes in
the MSPD and individual, occupational and organisational characteristics?
4. Comparing the standard and tailored groups, what is the change in safety climate, job
satisfaction, and SOC?
5. Comparing the standard and tailored groups, what are the workers’ perceptions of the
interventions?

161
5.2 Overall Changes in MSPD Before and After the Interventions and
Association with Risk Factors
This section presents the basic “before and after” evaluation. It will be observed that the
prevalence of MSPD increased in both the standard and tailored groups and that safety
climate, SOC and job dissatisfaction were associated with MSPD.
5.2.1 Methods
Basic repeated measurement analyses were conducted. Wilcoxon Signed Rank tests and
McNemar’s tests were utilised to determine the changes from baseline to follow-up (Pallant,
2011). Bivariate and multivariate regression analyses were also carried out to determine the
association of changes in MSPD with risk factors.
5.2.1.2 Sampling
The detailed sampling method was described in Chapter 3, Section 3.3.2.
5.2.1.3 Study Instrument (Intervention Study)
The same survey instruments were used for the baseline and the follow-up surveys and
included the MSPD, MSPD in body areas questionnaire, demography, and occupational and
organisational characteristics. (See Chapter 3, Section 3.2.4, and Appendix 1).
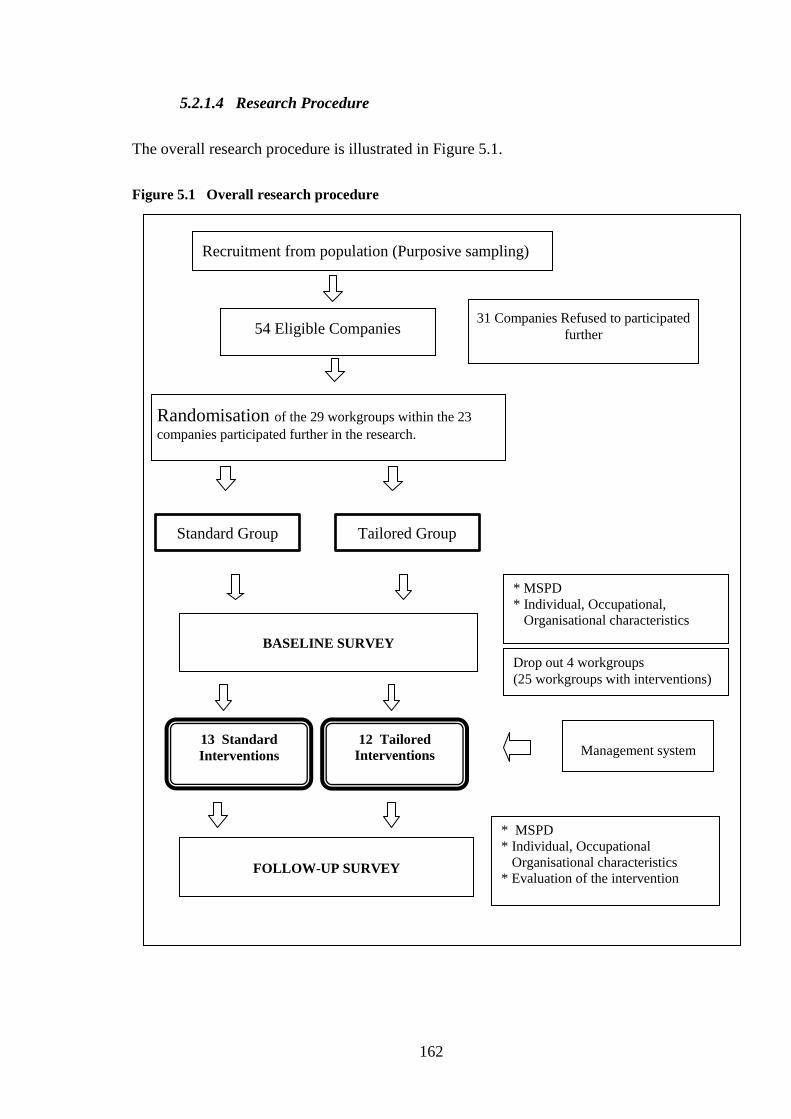
162
5.2.1.4 Research Procedure
The overall research procedure is illustrated in Figure 5.1.
Figure 5.1 Overall research procedure
Randomisation of the 29 workgroups within the 23
companies participated further in the research.
54 Eligible Companies
Recruitment from population (Purposive sampling)
Standard Group Tailored Group
31 Companies Refused to participated
further
BASELINE SURVEY
FOLLOW-UP SURVEY
13 Standard
Interventions
12 Tailored Interventions
Management system
Drop out 4 workgroups
(25 workgroups with interventions)
* MSPD
* Individual, Occupational,
Organisational characteristics
* MSPD
* Individual, Occupational
Organisational characteristics
* Evaluation of the intervention

163
5.2.1.5 Data Analysis
5.2.1.5.1 The Proportion of Workers within each Categorisation in the Standard
Group and the Tailored Group (Univariate analysis)
The distributions of workers’ individual, occupational, and organisational characteristics are
presented as percentages and medians. Since only the paired participants (participants who
completed both the baseline and follow-up surveys) were included, only the baseline
distribution for age, length of employment, working hours/week, ESB, company size and
company type are presented. The medians were calculated for age, length of employment,
working hours/week, and total score of safety climate. Due to the skewed distribution of most
of the variables, the median was used, instead of the mean. Missing data were managed by
using pair wise exclusion in SPSS (Pallant, 2011).
5.2.1.5.2 Changes in the Prevalence of MSPD after the Interventions within each
Category: Comparing Standard and Tailored Groups
Changes in MSPD, severe MSPD, neck, shoulder and back MSPD, from time 1(T1) or
baseline to time 2 (T2) or follow-up were calculated initially using the McNemar’s test for
dichotomous variables (Pallant, 2011, Elwood, 2007) - since the McNemar’s test does not
control for other variables that might influence the change in MSPD (Pallant, 2011, Elwood,
2007).
In the more advanced analysis (see Section 5.3.6.5) the Generalised Estimation Equation for
repeated measures was used to examine the difference over time within the intervention
groups.
Only certain body areas including neck, shoulder, and lower back MSPD were utilised in the
analysis since they were the most frequently reported pain/discomfort areas.
164
5.2.1.5.3 Change in Other Variables after the Interventions, including Safety
Climate, Job Satisfaction and SOC
Analysis was undertaken of changes in job satisfaction, safety climate, and the stage of
change. The Wilcoxon signed rank test was performed to analyse changes in the overall job
satisfaction items (Question JS.1 – JS.16, with a 7-point Likert scale) and overall safety
climate score. Spider web charts and Wilcoxon analyses are presented to examine the
difference between the groups for the safety climate dimension, comparing the standard and
the tailored groups.
The magnitude of the difference between groups was obtained by calculating the effect size
using Cohen’s d (Pallant, 2011, Cohen, 1988). Cohen’s d criteria were used as follows: 0.10
= small effect, 0.30= medium effect and 0.50=large effect. The formula for the effect size
was d = Z/ N, where N= total number of cases (Pallant, 2011).
This research also analysed the changes in SOC. Firstly, the dichotomous variable (Yes/No)
for each stage (pre-contemplation, contemplation/preparation, action and maintenance) was
generated. Then the difference in each new dichotomous variable, baseline and follow-up
data was run using the McNemar’s test. The McNemar’s test was used for each stage because
it was necessary to know if there was any difference in every single stage.
5.2.1.5.4 The Association between Changes in MSPD and Individual/
Occupational/ Organisational Characteristics (Bivariate and Multivariate
Analysis): Comparing Standard and Tailored Groups
The changes in MSPD were ascribed to several categories: New cases (T1 = No MSPD and
T2= Yes MSPD); Chronic cases (T1 = yes MSPD and T2= yes MSPD); Recovered cases (T1
= yes MSPD and T2= no MSPD) and Free of MSPD cases (T1 = no MSPD and T2= no
MSPD) (de Zwart et al., 1997b).

165
The association of the changes in MSPD with other variables (using the baseline individual/
occupational/ organisational characteristics) were evaluated. The analyses were run for the
overall paired participants (regardless of the intervention groups), as well as the paired
participants in the standard and tailored groups.
Those analyses with significant Chi square test associations were reported, including their
effect size using the phi coefficient value, due to the small number of subgroups in several
variables, which were found. It was considered important to ensure that the difference was
meaningful by calculating the effect size (Pallant, 2011).
For regression analysis, changes in MSPD in the standard and tailored groups were
dichotomised by merging new and chronic cases as one categorisation and recovered cases
and free of MSPD complaint cases in another categorisation. Individual subgroups were
otherwise too small for regression analysis. Multivariate logistic regression modelling was
performed by including all the association of change in MSPD with p value < 0.2 in the
model, except for those with very small sample size in sub-groups such as job satisfaction
(Pallant, 2011). However, age and gender were entered in the model even though they did not
show a significant relationship with the outcome variables of MSPD.
166
5.2.2 Results
This section firstly presents a univariate analysis of workers’ individual/ occupational/
organisational characteristics for standard and tailored groups. Secondly, there is a
description of the changes in the prevalences of MSPD (undifferentiated MSPD, severe
MSPD, neck, shoulder, and lower back MSPD).
Following this, the association between the changes in MSPD and individual/ occupational/
organisational characteristics are examined using bivariate and multivariate analyses.
Finally, the results of simple multivariate logistic regression are presented.
5.2.2.1 The Distribution of Participants based on Individual / Occupational/
Organisational Characteristics and Changes in Prevalence of MSPD (Univariate
Analysis): Comparing Standard and Tailored Groups
This subsection summarised the observed changes in the prevalence of MSPD and other
important variables (safety climate, job satisfaction and stage of change).
5.2.2.1.1 The Distribution of Participant Individual/ Occupational/
Organisational Characteristics
The distributions of individual characteristics in the tailored and standard groups are given in
Table 5.3. There were 242 paired workers with 109 workers in the standard group and 133 in
the tailored group. The table shows that the median age, length of employment and working
hours in tailored and standard groups were quite similar. The distribution of gender was also
similar in both groups. Job satisfaction, both in tailored and standard groups were similar.
The percentage of workers who were satisfied with their jobs decreased after the intervention.
With regard to safety climate score, the mean of the total score was slightly decreased from
the baseline to follow-up in both groups. Workers’ stages of change in the standard and
tailored groups also showed minor changes.
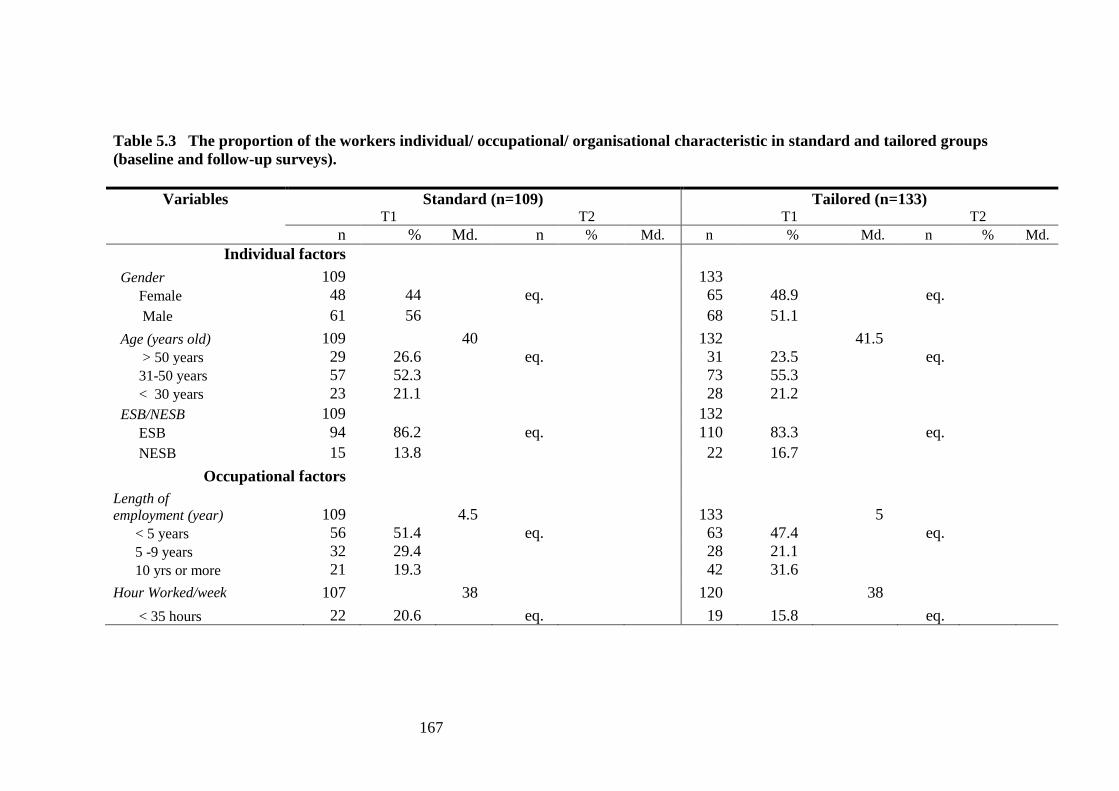
167
Table 5.3 The proportion of the workers individual/ occupational/ organisational characteristic in standard and tailored groups
(baseline and follow-up surveys).
Variables Standard (n=109) Tailored (n=133) T1 T2 T1 T2
n % Md. n % Md. n % Md. n % Md.
Individual factors
Gender 109 133
Female 48 44 eq. 65 48.9 eq.
Male 61 56 68 51.1
Age (years old) 109 40 132 41.5
> 50 years 29 26.6 eq. 31 23.5 eq.
31-50 years 57 52.3 73 55.3
< 30 years 23 21.1 28 21.2
ESB/NESB 109 132
ESB 94 86.2 eq. 110 83.3 eq.
NESB 15 13.8 22 16.7
Occupational factors
Length of
employment (year) 109 4.5 133 5
< 5 years 56 51.4 eq. 63 47.4 eq.
5 -9 years 32 29.4 28 21.1
10 yrs or more 21 19.3 42 31.6
Hour Worked/week 107 38 120 38
< 35 hours 22 20.6 eq. 19 15.8 eq.
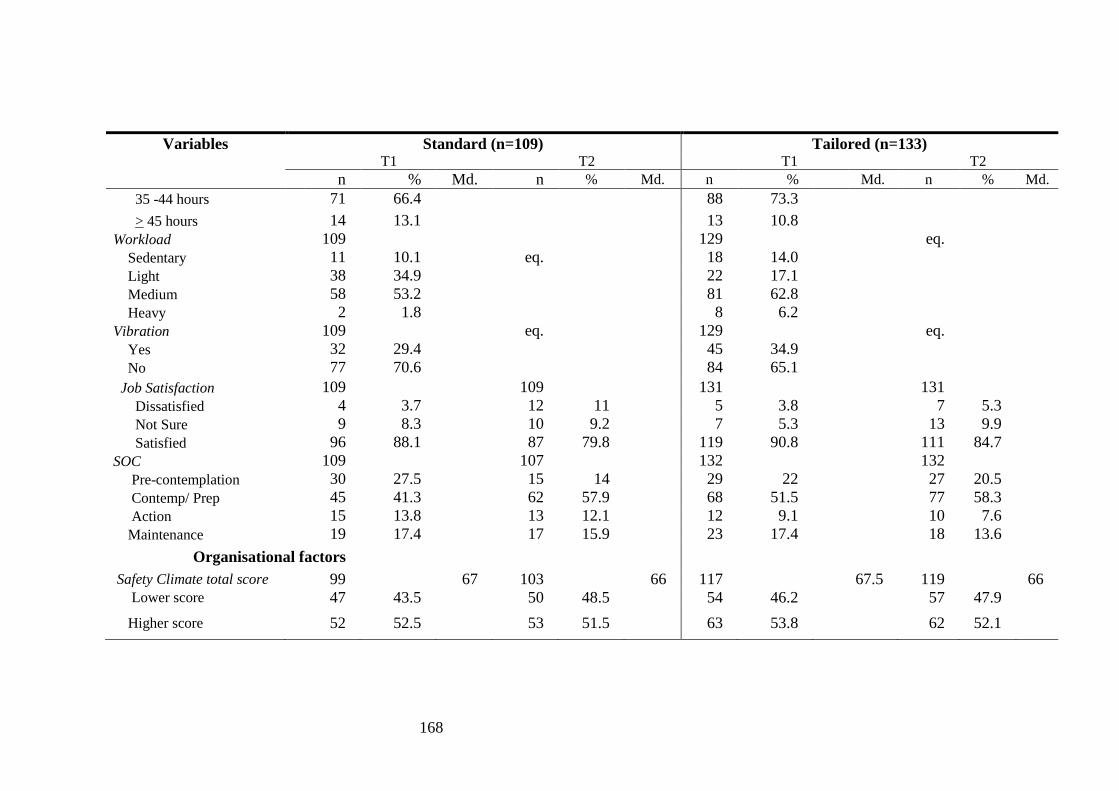
168
Variables Standard (n=109) Tailored (n=133) T1 T2 T1 T2
n % Md. n % Md. n % Md. n % Md.
35 -44 hours 71 66.4 88 73.3
> 45 hours 14 13.1 13 10.8
Workload 109 129 eq.
Sedentary 11 10.1 eq. 18 14.0
Light 38 34.9 22 17.1
Medium 58 53.2 81 62.8
Heavy 2 1.8 8 6.2
Vibration 109 eq. 129 eq.
Yes 32 29.4 45 34.9
No 77 70.6 84 65.1
Job Satisfaction 109 109 131 131
Dissatisfied 4 3.7 12 11 5 3.8 7 5.3
Not Sure 9 8.3 10 9.2 7 5.3 13 9.9
Satisfied 96 88.1 87 79.8 119 90.8 111 84.7
SOC 109 107 132 132
Pre-contemplation 30 27.5 15 14 29 22 27 20.5
Contemp/ Prep 45 41.3 62 57.9 68 51.5 77 58.3
Action 15 13.8 13 12.1 12 9.1 10 7.6
Maintenance 19 17.4 17 15.9 23 17.4 18 13.6
Organisational factors
Safety Climate total score 99 67 103 66 117 67.5 119 66
Lower score 47 43.5 50 48.5 54 46.2 57 47.9
Higher score 52 52.5 53 51.5 63 53.8 62 52.1

169
Variables Standard (n=109) Tailored (n=133) T1 T2 T1 T2
n % Md. n % Md. n % Md. n % Md.
Company Size 102 132 Large 86 84.3 eq. 86 65.2 eq. Medium 16 15.7 46 34.8 Company Type 110 132 Manufacturing /mining 43 39.1 eq. 48 36.4 eq. Services 67 60.9 84 63.6
Note: T1=Baseline, T2=Follow-up, eq. = equal since paired individuals were used; Md. =median; Where totals do not total 242 (Standard (N=109),
The tailored group (N=133)), data are missing for those variables.
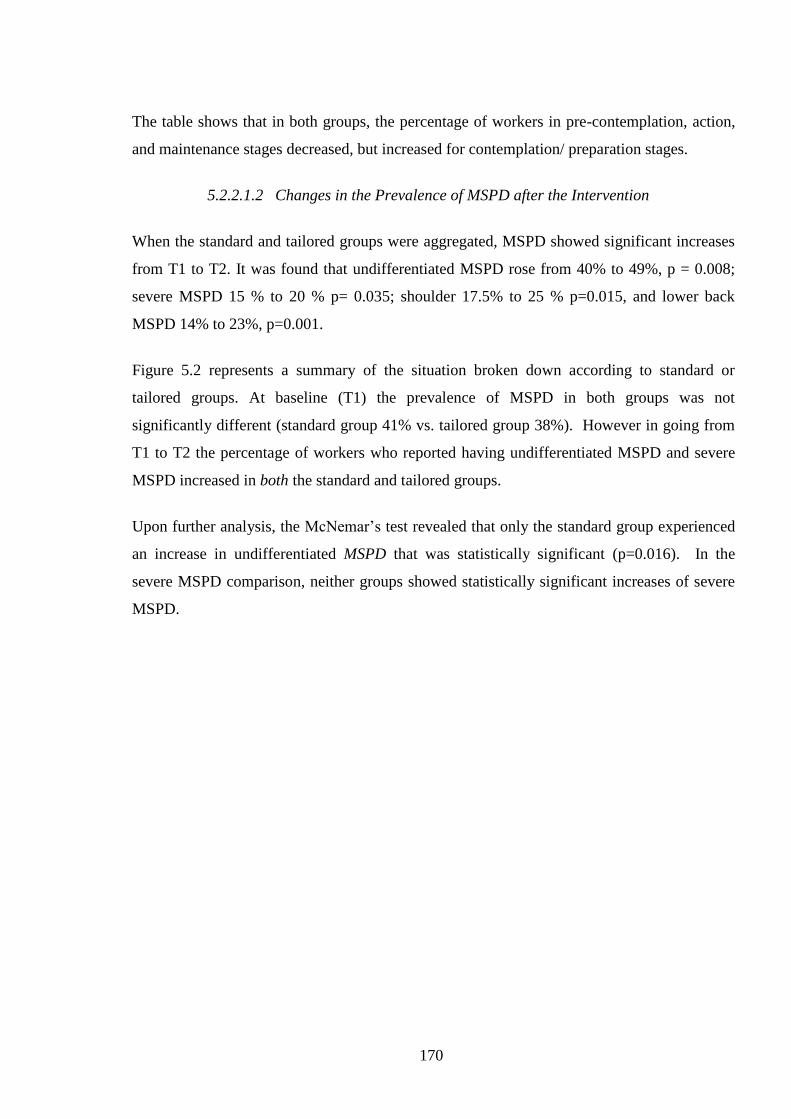
170
The table shows that in both groups, the percentage of workers in pre-contemplation, action,
and maintenance stages decreased, but increased for contemplation/ preparation stages.
5.2.2.1.2 Changes in the Prevalence of MSPD after the Intervention
When the standard and tailored groups were aggregated, MSPD showed significant increases
from T1 to T2. It was found that undifferentiated MSPD rose from 40% to 49%, p = 0.008;
severe MSPD 15 % to 20 % p= 0.035; shoulder 17.5% to 25 % p=0.015, and lower back
MSPD 14% to 23%, p=0.001.
Figure 5.2 represents a summary of the situation broken down according to standard or
tailored groups. At baseline (T1) the prevalence of MSPD in both groups was not
significantly different (standard group 41% vs. tailored group 38%). However in going from
T1 to T2 the percentage of workers who reported having undifferentiated MSPD and severe
MSPD increased in both the standard and tailored groups.
Upon further analysis, the McNemar’s test revealed that only the standard group experienced
an increase in undifferentiated MSPD that was statistically significant (p=0.016). In the
severe MSPD comparison, neither groups showed statistically significant increases of severe
MSPD.
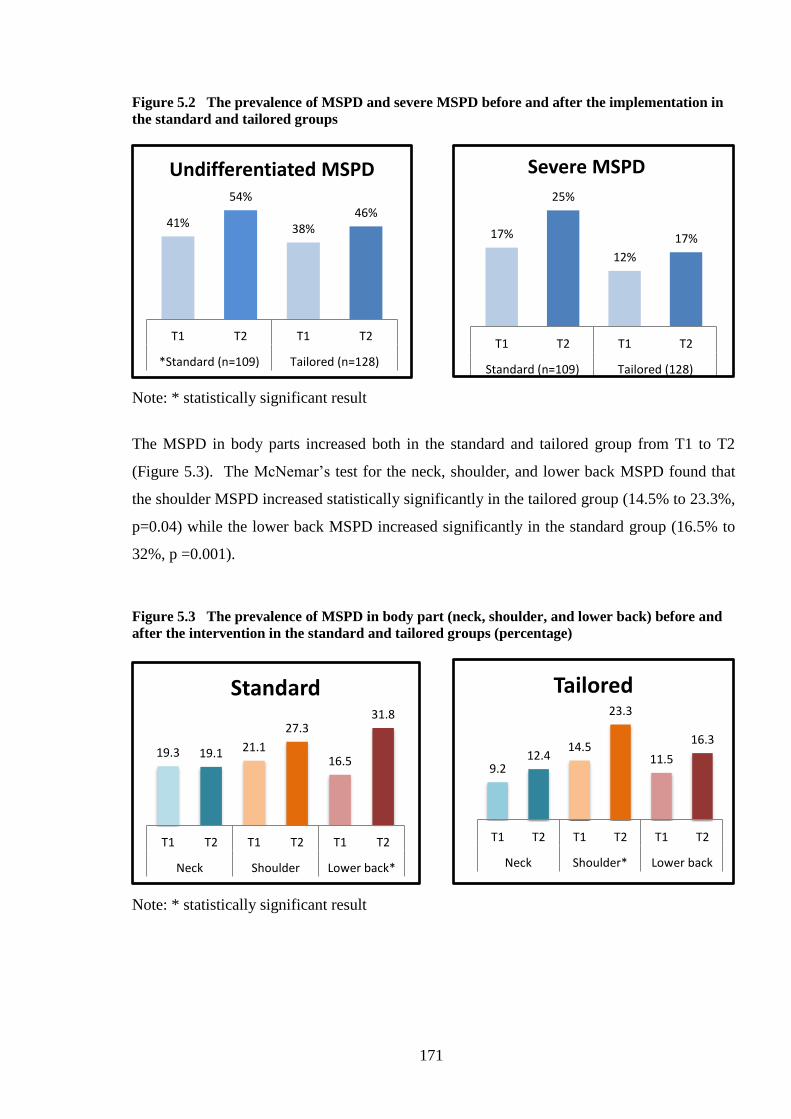
171
Figure 5.2 The prevalence of MSPD and severe MSPD before and after the implementation in
the standard and tailored groups
Note: * statistically significant result
The MSPD in body parts increased both in the standard and tailored group from T1 to T2
(Figure 5.3). The McNemar’s test for the neck, shoulder, and lower back MSPD found that
the shoulder MSPD increased statistically significantly in the tailored group (14.5% to 23.3%,
p=0.04) while the lower back MSPD increased significantly in the standard group (16.5% to
32%, p =0.001).
Figure 5.3 The prevalence of MSPD in body part (neck, shoulder, and lower back) before and
after the intervention in the standard and tailored groups (percentage)
Note: * statistically significant result
41%
54%
38% 46%
T1 T2 T1 T2
*Standard (n=109) Tailored (n=128)
Undifferentiated MSPD
17%
25%
12%
17%
T1 T2 T1 T2
Standard (n=109) Tailored (128)
Severe MSPD
19.3 19.1 21.1
27.3
16.5
31.8
T1 T2 T1 T2 T1 T2
Neck Shoulder Lower back*
Standard
9.2 12.4
14.5
23.3
11.5
16.3
T1 T2 T1 T2 T1 T2
Neck Shoulder* Lower back
Tailored
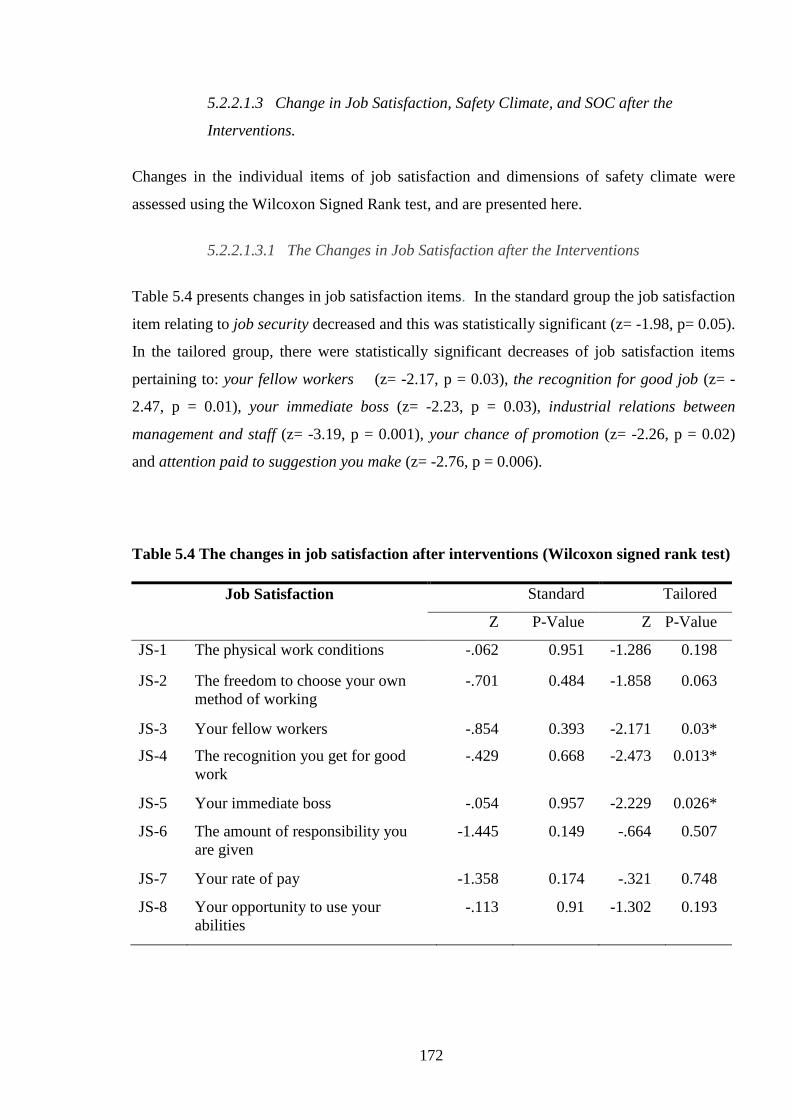
172
5.2.2.1.3 Change in Job Satisfaction, Safety Climate, and SOC after the
Interventions.
Changes in the individual items of job satisfaction and dimensions of safety climate were
assessed using the Wilcoxon Signed Rank test, and are presented here.
5.2.2.1.3.1 The Changes in Job Satisfaction after the Interventions
Table 5.4 presents changes in job satisfaction items. In the standard group the job satisfaction
item relating to job security decreased and this was statistically significant (z= -1.98, p= 0.05).
In the tailored group, there were statistically significant decreases of job satisfaction items
pertaining to: your fellow workers (z= -2.17, p = 0.03), the recognition for good job (z= -
2.47, p = 0.01), your immediate boss (z= -2.23, p = 0.03), industrial relations between
management and staff (z= -3.19, p = 0.001), your chance of promotion (z= -2.26, p = 0.02)
and attention paid to suggestion you make (z= -2.76, p = 0.006).
Table 5.4 The changes in job satisfaction after interventions (Wilcoxon signed rank test)
Job Satisfaction Standard Tailored
Z P-Value Z P-Value
JS-1 The physical work conditions -.062 0.951 -1.286 0.198
JS-2 The freedom to choose your own
method of working
-.701 0.484 -1.858 0.063
JS-3 Your fellow workers -.854 0.393 -2.171 0.03*
JS-4 The recognition you get for good
work
-.429 0.668 -2.473 0.013*
JS-5 Your immediate boss -.054 0.957 -2.229 0.026*
JS-6 The amount of responsibility you
are given
-1.445 0.149 -.664 0.507
JS-7 Your rate of pay -1.358 0.174 -.321 0.748
JS-8 Your opportunity to use your
abilities
-.113 0.91 -1.302 0.193

173
Job Satisfaction Standard Tailored
Z P-Value Z P-Value
JS-9 Industrial relations between
management and staff
-.649 0.516 -3.197 0.001*
JS-10 Your chance of promotion/
reclassification
-1.563 0.118 -2.261 0.024*
JS-11 The way the organisation is
managed
-1.411 0.158 -.782 0.434
JS-12 The attention paid to suggestions
you make
-.321 0.748 -2.757 0.006*
JS-13 Your hours of work -.178 0.859 -1.096 0.273
JS-14 The amount of variety in your job -1.224 0.221 -1.081 0.28
JS-15 Your job security -1.976 0.048* -.755 0.45
Note: * significant result for the Wilcoxon test
Table 5.5 shows the changes in the overall job satisfaction (JS16) and the total safety climate
score. In the Standard groups the Wilcoxon Signed Rank Test showed there was a
statistically significant difference in overall job satisfaction before and after the intervention z
= -2.44, p < 0.05 with the very small effect size d = 0.16. Similarly, in the tailored groups
there was a statistically significant reduction on the score of job satisfaction after the
intervention z = -3.49, p < 0.001 with the small effect size d = 0.2.
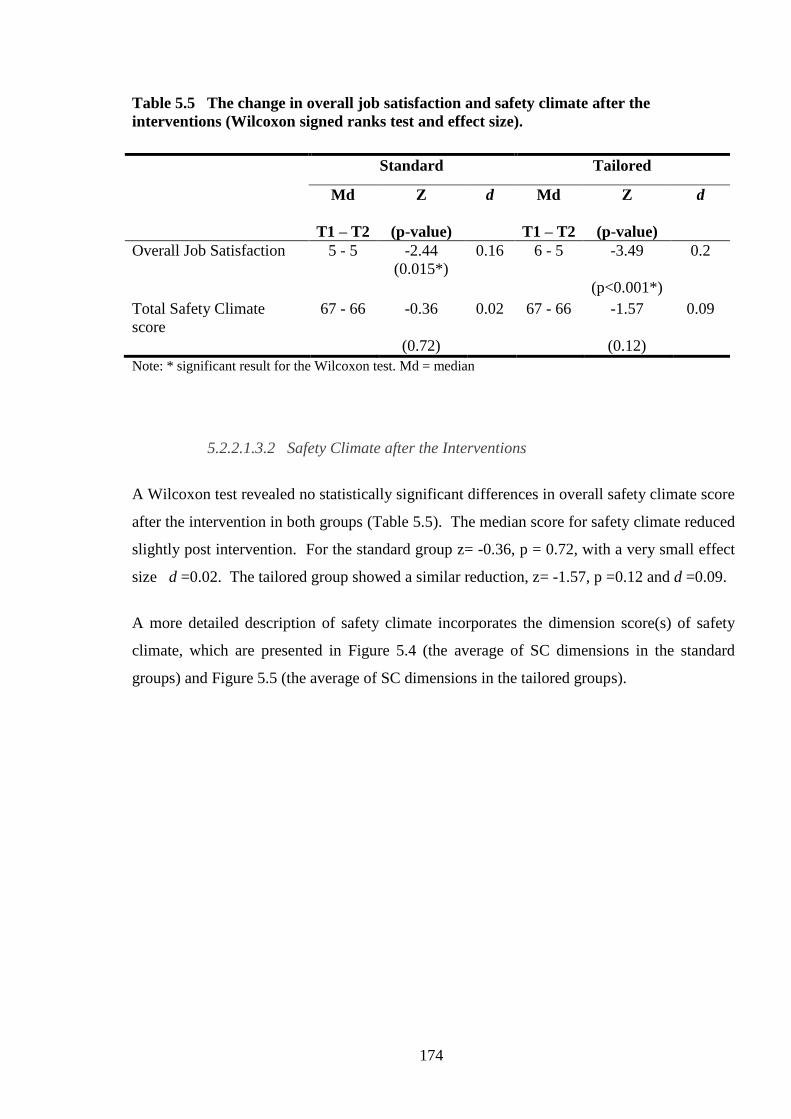
174
Table 5.5 The change in overall job satisfaction and safety climate after the
interventions (Wilcoxon signed ranks test and effect size).
Note: * significant result for the Wilcoxon test. Md = median
5.2.2.1.3.2 Safety Climate after the Interventions
A Wilcoxon test revealed no statistically significant differences in overall safety climate score
after the intervention in both groups (Table 5.5). The median score for safety climate reduced
slightly post intervention. For the standard group z= -0.36, p = 0.72, with a very small effect
size d =0.02. The tailored group showed a similar reduction, z= -1.57, p =0.12 and d =0.09.
A more detailed description of safety climate incorporates the dimension score(s) of safety
climate, which are presented in Figure 5.4 (the average of SC dimensions in the standard
groups) and Figure 5.5 (the average of SC dimensions in the tailored groups).
Standard Tailored
Md
T1 – T2
Z
(p-value)
d Md
T1 – T2
Z
(p-value)
d
Overall Job Satisfaction 5 - 5 -2.44
(0.015*)
0.16 6 - 5 -3.49
(p<0.001*)
0.2
Total Safety Climate
score
67 - 66 -0.36
(0.72)
0.02 67 - 66 -1.57
(0.12)
0.09
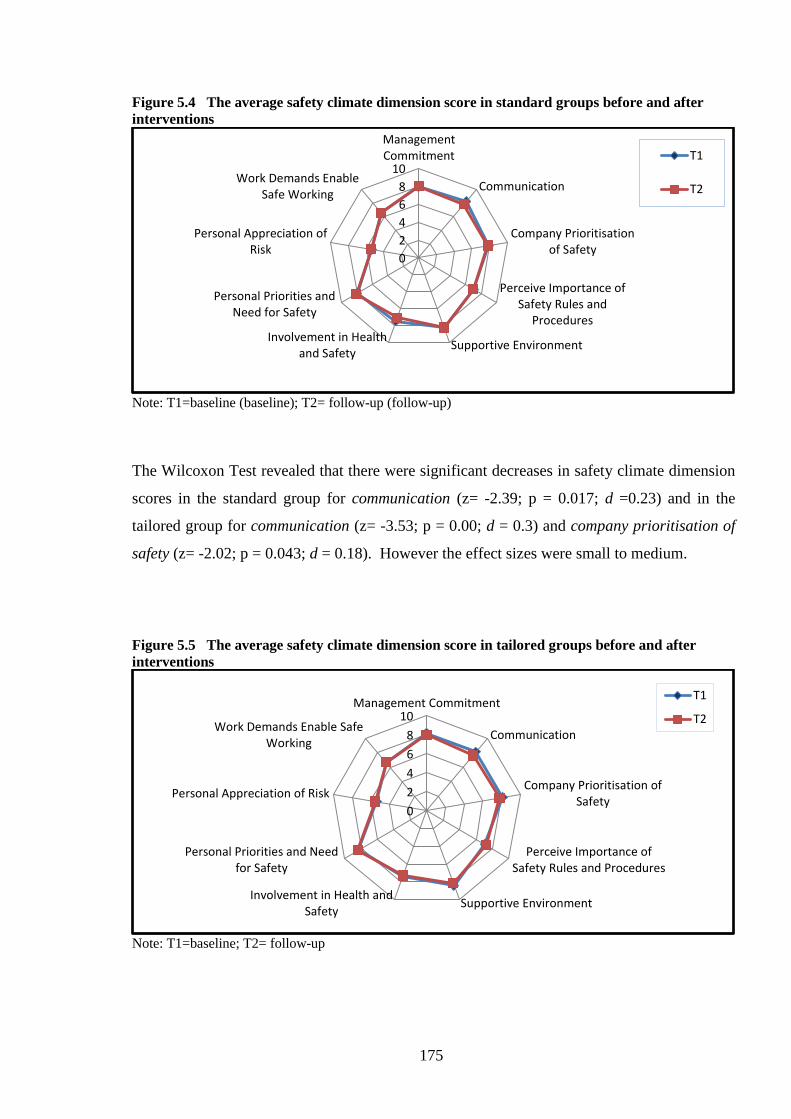
175
Figure 5.4 The average safety climate dimension score in standard groups before and after
interventions
Note: T1=baseline (baseline); T2= follow-up (follow-up)
The Wilcoxon Test revealed that there were significant decreases in safety climate dimension
scores in the standard group for communication (z= -2.39; p = 0.017; d =0.23) and in the
tailored group for communication (z= -3.53; p = 0.00; d = 0.3) and company prioritisation of
safety (z= -2.02; p = 0.043; d = 0.18). However the effect sizes were small to medium.
Figure 5.5 The average safety climate dimension score in tailored groups before and after
interventions
Note: T1=baseline; T2= follow-up
0
2
4
6
8
10
ManagementCommitment
Communication
Company Prioritisationof Safety
Perceive Importance ofSafety Rules and
Procedures
Supportive EnvironmentInvolvement in Health
and Safety
Personal Priorities andNeed for Safety
Personal Appreciation ofRisk
Work Demands EnableSafe Working
T1
T2
0
2
4
6
8
10Management Commitment
Communication
Company Prioritisation ofSafety
Perceive Importance ofSafety Rules and Procedures
Supportive EnvironmentInvolvement in Health and
Safety
Personal Priorities and Needfor Safety
Personal Appreciation of Risk
Work Demands Enable SafeWorking
T1
T2

176
5.2.2.1.3.3 The Change in SOC after the Interventions
The changes in SOC, before and after interventions are presented in Table 5.6 and assessed
using the McNemar’s test. In both standard and tailored groups the percentages of workers
were reduced at follow-up in pre-contemplation, action and maintenance stages.
Table 5.6 The variation in SOC after the interventions (assessed using McNemar’s test).
Standard groups Tailored groups
Stage of Change
T1
(%)
T2
(%) (p-value)
T1
(%)
T2
(%) (P-value)
Pre-contemplation 27.8 13.9 0.008 * 22.3 20.8 0.87
Contemplation/preparation 39.8 58.3 0.008 * 51.5 58.5 0.31
Action 13.9 12 0.82 9.2 7.7 0.82
Maintenance 18.5 15.5 0.68 16.9 13.1 0.47
Note: T1=baseline (pre intervention); T2= follow-up (post intervention); *statistically significant result
The McNemar’s test revealed that the percentage of workers at the pre-contemplation stage in
the standard groups was significantly reduced after the interventions (p=0.008).
Conversely, the percentage of workers in contemplation/preparation increased significantly
(p=0.008). No statistically significant changes were noted for the Tailored groups.
177
5.2.2.2 The Association between Changes in MSPD and Individual/ Occupational/
Organisational Characteristics: Paired Participants (overall) and Paired
Participants by Standard and Tailored Groupings
This section presents the results of bivariate and multivariate analysis for the association
between changes in MSPD and individual, occupational, and organisational factors. As
mentioned, there were 4 possibilities of changes in MSPD namely:
- No complaint: Do not report MSPD in the baseline and follow-up survey
- Chronic MSPD: Report MSPD in the baseline and follow-up survey
- New MSPD case: Do not report MSPD in the baseline but report it in follow-up survey
- Recovered from MSPD: Report MSPD in the baseline but do not report it in follow-up
survey.
The results are presented in 3 subsections namely overall paired participants (regardless of
intervention group), paired participants in the standard group and paired participants in the
tailored group.
5.2.2.2.1 The Changes in Undifferentiated MSPD and Associations with
Workers’ Individual/ Occupational/ Organisational Characteristics for overall
Paired Participants.
Table 5.7 presents the change in undifferentiated MSPD and its association with individual,
occupational, and organisational characteristics in the overall paired participants (standard and
tailored groups combined). It can be seen that length of employment, job satisfaction, stage
of change and safety climate were statistically significantly associated with the changes in
MSPD.
The bivariate analysis showed that workers with > 5 years employment were more likely to
have chronic MSPD than those who had < 5 years employment On the other hand, a higher
percentage of workers with < 5 years employment were free of complaint, compared to those
with > 5 years. The percentage of workers in the advanced SOC was higher in the chronic
case, and recovered case, than those in the early SOC. The workers in the early stage of SOC
were more likely to be ‘free of complaint’ compared with those in advanced stage.

178
Table 5.7 Bivariate analysis: The changes in undifferentiated MSPD and associations
with individual/ occupational/ organisational characteristics in overall paired
participants.
Individual/ Occupational/
Organisational
Characteristics
All matched participants (N=242)
P value
No complaint Chronic New case Recovered
n (%) N (%) n (%) n (%)
Change in MSPD a 93(11.4) 68(28.7) 49(20.7) 27(11.4)
Individual factors
Age group
≥40 years
<40years
48 (39.3)
45 (39.5)
40 (32.8)
28 (24.6)
19 (15.6)
29 (25.4)
15 (12.3)
12 (10.5) 0.23
Gender
Female/
Male
45 (40.9)
48 (37.8)
32 (29.1)
36 (28.3)
20 (18.2)
29 (22.8)
13 (11.8)
14 (11.0)
0.85
English speaking background
NESB
ESB
17 (47.2)
75 (37.5)
7 (19.4)
61 (30.5)
6 (16.7)
43 (21.5)
6 (16.7)
21 (10.5) 0.33
Occupational factors
Length employment
>=5yrs
< 5 years
40 (33.6)
53 (44.9)
45 (37.8)
23 (19.5)
18 (15.1)
31 (26.3)
16 (13.4)
11 (9.3) 0.004 *
Worked hours
>45 hours/week
<45 hours
9 (32.1)
80 (40.6)
11 (39.3)
55 (27.9)
5 (17.9)
41 (20.8)
3 (10.7)
21 (10.7) 0.65
Workload
Medium-heavy
Sedentary- light
59 (40.4)
33 (37.1)
41 (28.1)
27 (30.3)
31 (21.2)
18 (20.2)
15 (10.3)
11 (12.4) 0.92
Vibration
Exposed
No Exposed
31 (40.8)
61 (38.4)
24 (31.6)
44 (27.7)
14 (18.4)
35 (22.0)
7 (9.2)
19 (11.9) 0.79
SOC
Advanced
Early stage
17 (25.8)
75 (44.1)
30 (45.5)
38 (22.4)
14 (21.2)
35 (20.6)
30 (45.5)
38 (22.4) 0.003 *
Overall job satisfaction
Dissatisfied or not sure
Satisfied
5 (20.0)
88 (41.5)
14 (56.0)
54 (25.5)
4 (16.0)
45 (21.2)
2 (8.0)
25 (11.8) 0.015*
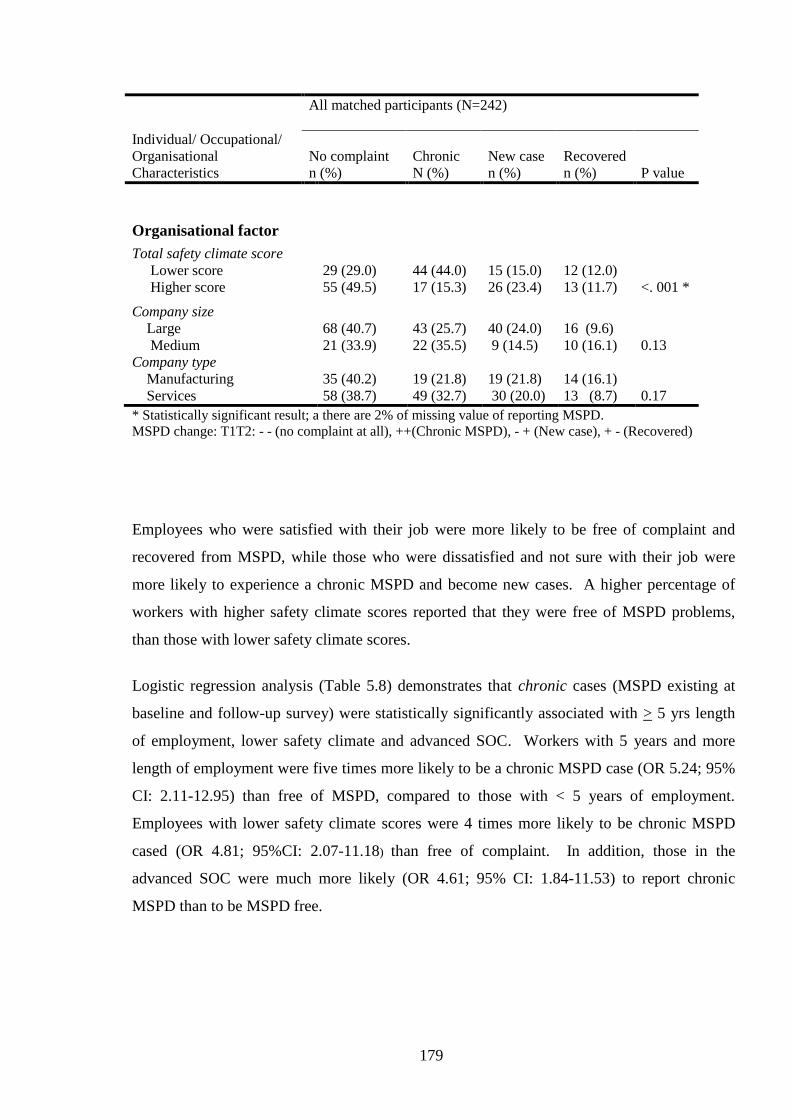
179
Individual/ Occupational/
Organisational
Characteristics
All matched participants (N=242)
P value
No complaint Chronic New case Recovered
n (%) N (%) n (%) n (%)
Organisational factor
Total safety climate score
Lower score
Higher score
29 (29.0)
55 (49.5)
44 (44.0)
17 (15.3)
15 (15.0)
26 (23.4)
12 (12.0)
13 (11.7)
<. 001 *
Company size
Large
Medium
68 (40.7)
21 (33.9)
43 (25.7)
22 (35.5)
40 (24.0)
9 (14.5)
16 (9.6)
10 (16.1) 0.13
Company type
Manufacturing
Services
35 (40.2)
58 (38.7)
19 (21.8)
49 (32.7)
19 (21.8)
30 (20.0)
14 (16.1)
13 (8.7) 0.17
* Statistically significant result; a there are 2% of missing value of reporting MSPD.
MSPD change: T1T2: - - (no complaint at all), ++(Chronic MSPD), - + (New case), + - (Recovered)
Employees who were satisfied with their job were more likely to be free of complaint and
recovered from MSPD, while those who were dissatisfied and not sure with their job were
more likely to experience a chronic MSPD and become new cases. A higher percentage of
workers with higher safety climate scores reported that they were free of MSPD problems,
than those with lower safety climate scores.
Logistic regression analysis (Table 5.8) demonstrates that chronic cases (MSPD existing at
baseline and follow-up survey) were statistically significantly associated with > 5 yrs length
of employment, lower safety climate and advanced SOC. Workers with 5 years and more
length of employment were five times more likely to be a chronic MSPD case (OR 5.24; 95%
CI: 2.11-12.95) than free of MSPD, compared to those with < 5 years of employment.
Employees with lower safety climate scores were 4 times more likely to be chronic MSPD
cased (OR 4.81; 95%CI: 2.07-11.18) than free of complaint. In addition, those in the
advanced SOC were much more likely (OR 4.61; 95% CI: 1.84-11.53) to report chronic
MSPD than to be MSPD free.
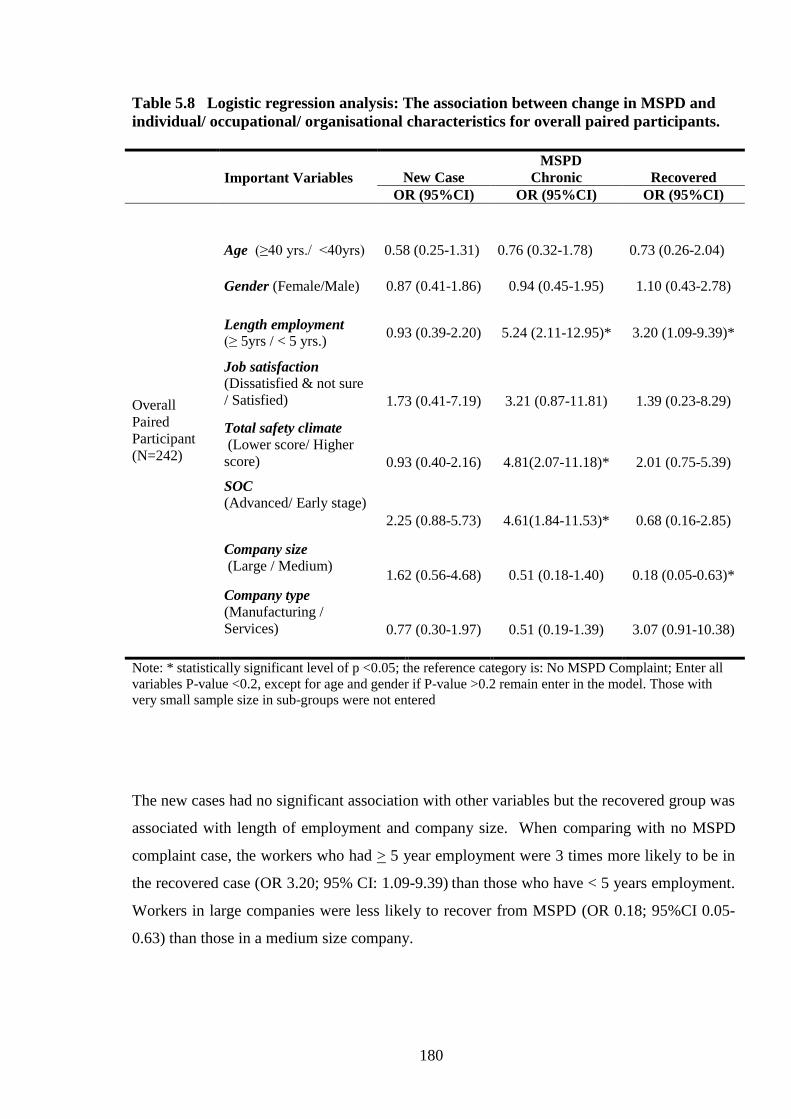
180
Table 5.8 Logistic regression analysis: The association between change in MSPD and
individual/ occupational/ organisational characteristics for overall paired participants.
Important Variables
MSPD
New Case Chronic Recovered
OR (95%CI) OR (95%CI) OR (95%CI)
Overall
Paired
Participant
(N=242)
Age (≥40 yrs./ <40yrs)
0.58 (0.25-1.31)
0.76 (0.32-1.78)
0.73 (0.26-2.04)
Gender (Female/Male) 0.87 (0.41-1.86) 0.94 (0.45-1.95) 1.10 (0.43-2.78)
Length employment (≥ 5yrs / < 5 yrs.)
0.93 (0.39-2.20) 5.24 (2.11-12.95)* 3.20 (1.09-9.39)*
Job satisfaction
(Dissatisfied & not sure
/ Satisfied)
1.73 (0.41-7.19)
3.21 (0.87-11.81)
1.39 (0.23-8.29)
Total safety climate
(Lower score/ Higher
score)
0.93 (0.40-2.16)
4.81(2.07-11.18)*
2.01 (0.75-5.39)
SOC
(Advanced/ Early stage)
2.25 (0.88-5.73)
4.61(1.84-11.53)*
0.68 (0.16-2.85)
Company size
(Large / Medium)
1.62 (0.56-4.68)
0.51 (0.18-1.40)
0.18 (0.05-0.63)*
Company type (Manufacturing /
Services)
0.77 (0.30-1.97)
0.51 (0.19-1.39)
3.07 (0.91-10.38)
Note: * statistically significant level of p <0.05; the reference category is: No MSPD Complaint; Enter all
variables P-value <0.2, except for age and gender if P-value >0.2 remain enter in the model. Those with
very small sample size in sub-groups were not entered
The new cases had no significant association with other variables but the recovered group was
associated with length of employment and company size. When comparing with no MSPD
complaint case, the workers who had > 5 year employment were 3 times more likely to be in
the recovered case (OR 3.20; 95% CI: 1.09-9.39) than those who have < 5 years employment.
Workers in large companies were less likely to recover from MSPD (OR 0.18; 95%CI 0.05-
0.63) than those in a medium size company.

181
5.2.2.2.2 The Change in MSPD and Associations with Workers’ Individual/
Occupational/ Organisational Characteristics in the Standard Groups.
Table 5.9 presents the change in MSPD and associations with each characteristic in the
standard groups. The distribution of MSPD changes was as follows: chronic case (34%); new
case (20%), recovered case (7%) and free of MSPD case (38.5%).
In the bivariate analysis, English-speaking background (X2 (3, n=109) = 9.23, p = 0.02, phi
=0.3), length of employment (X2 (3, n=109) = 15.74, p = 0.001, phi =0.38), SOC (X
2 (3,
n=109) = 7.66, p = 0.05, phi =0.26), job satisfaction (X2 (3, n=109) = 17.03, p = 0.001, phi
=0.39), safety climate (X2 (3, n=98) = 20.78, p < 0.001, phi =0.46) were statistically
significantly associated with changes in MSPD. Some of the variables had a small number in
subgroups such as English-speaking background and job satisfaction; however the effect size
values indicated that they still had a medium strength of association.
Table 5.9 Bivariate analysis: The change in MSPD prevalence and associations with
individual/ occupational/ organisational characteristics in the standard group.
Standard Group (N= 109 pairs)
Individual/ Occupational/
Organisational Characteristics
P value
No complaint Chronic New case Recovered
n (%) n (%) n (%) n (%)
Change in MSPD 42 (38.5) 37 (33.9) 22 (20.2) 8 (7.3)
Individual factors
Age group
≥40 years
<40years
16 (28.1)
26 (50)
24 (42.1)
13 (25)
3 (22.8)
9 (17.3)
4 (7)
4 (7.7) 0.10
Gender a
Female
Male
16 (33.3)
26 (42.6)
20 (41.7)
17 (27.9)
9 (18.8)
13 (21.3)
3 (6.3)
5 (8.2) 0.51
English speaking background a
NESB
ESB
11 (73.3)
31 (33)
2 (13.3)
35 (37.2)
1 (6.7)
21 (22.3)
1 (6.7)
7 (7.4) 0.026 *
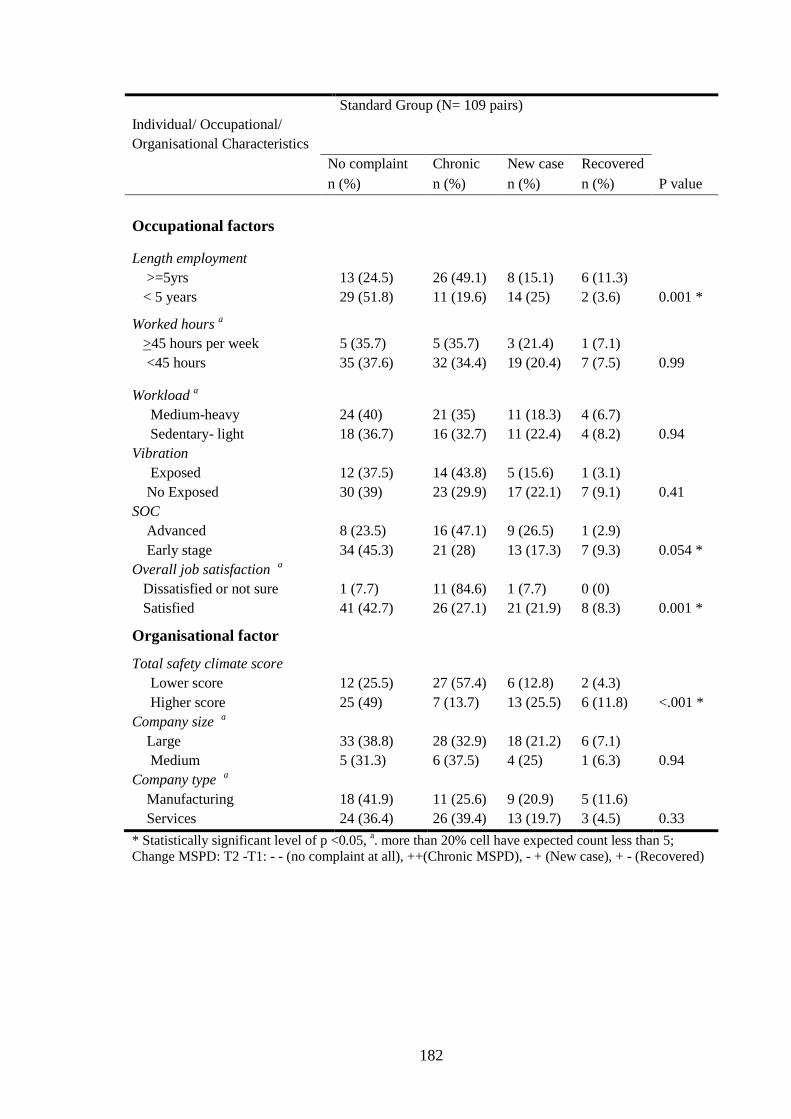
182
Standard Group (N= 109 pairs)
Individual/ Occupational/
Organisational Characteristics
P value
No complaint Chronic New case Recovered
n (%) n (%) n (%) n (%)
Occupational factors
Length employment
>=5yrs
< 5 years
13 (24.5)
29 (51.8)
26 (49.1)
11 (19.6)
8 (15.1)
14 (25)
6 (11.3)
2 (3.6) 0.001 *
Worked hours a
>45 hours per week
<45 hours
5 (35.7)
35 (37.6)
5 (35.7)
32 (34.4)
3 (21.4)
19 (20.4)
1 (7.1)
7 (7.5) 0.99
Workload a
Medium-heavy
Sedentary- light
24 (40)
18 (36.7)
21 (35)
16 (32.7)
11 (18.3)
11 (22.4)
4 (6.7)
4 (8.2) 0.94
Vibration
Exposed
No Exposed
12 (37.5)
30 (39)
14 (43.8)
23 (29.9)
5 (15.6)
17 (22.1)
1 (3.1)
7 (9.1) 0.41
SOC
Advanced
Early stage
8 (23.5)
34 (45.3)
16 (47.1)
21 (28)
9 (26.5)
13 (17.3)
1 (2.9)
7 (9.3) 0.054 *
Overall job satisfaction a
Dissatisfied or not sure
Satisfied
1 (7.7)
41 (42.7)
11 (84.6)
26 (27.1)
1 (7.7)
21 (21.9)
0 (0)
8 (8.3) 0.001 *
Organisational factor
Total safety climate score
Lower score
Higher score
12 (25.5)
25 (49)
27 (57.4)
7 (13.7)
6 (12.8)
13 (25.5)
2 (4.3)
6 (11.8) <.001 *
Company size a
Large
Medium
33 (38.8)
5 (31.3)
28 (32.9)
6 (37.5)
18 (21.2)
4 (25)
6 (7.1)
1 (6.3) 0.94
Company type a
Manufacturing
Services
18 (41.9)
24 (36.4)
11 (25.6)
26 (39.4)
9 (20.9)
13 (19.7)
5 (11.6)
3 (4.5) 0.33
* Statistically significant level of p <0.05, a. more than 20% cell have expected count less than 5;
Change MSPD: T2 -T1: - - (no complaint at all), ++(Chronic MSPD), - + (New case), + - (Recovered)

183
Seventy-three present of NESB people reported that they were free of MSPD complaints.
Forty-nine percent of with >= 5 years length of employment were classified as chronic MSPD
cases. On the other hand, the majority of workers with <5 years of employment (52%) were
classified as free of MSPD. Workers who were in advanced SOC, who were dissatisfied with
their job or who had lower safety climate scores were more likely to be chronic cases and less
likely to be classified as free of MSPD.
Even though there was no statistically significant difference within age groups, 42 % of older
workers (≥40 years) were chronic MSPD cased, whereas 50% of younger workers were
classified as free of MSPD.
The logistic regression analysis (Table 5.10) revealed that safety climate and SOC were
statistically significantly associated with change in MSPD (within 2 groups: New & Chronic
case vs. Free of MSPD & Recovered). Gender had correspondingly borderline (p=0.06)
association. Workers with lower safety climate score were 4 times more likely to be new and
chronic MSPD cases than Free of MSPD and Recovered. Those in advanced SOC were 6
times (and female workers were 2 times more likely) to be new and chronic MSPD than Free
of MSPD and Recovered.
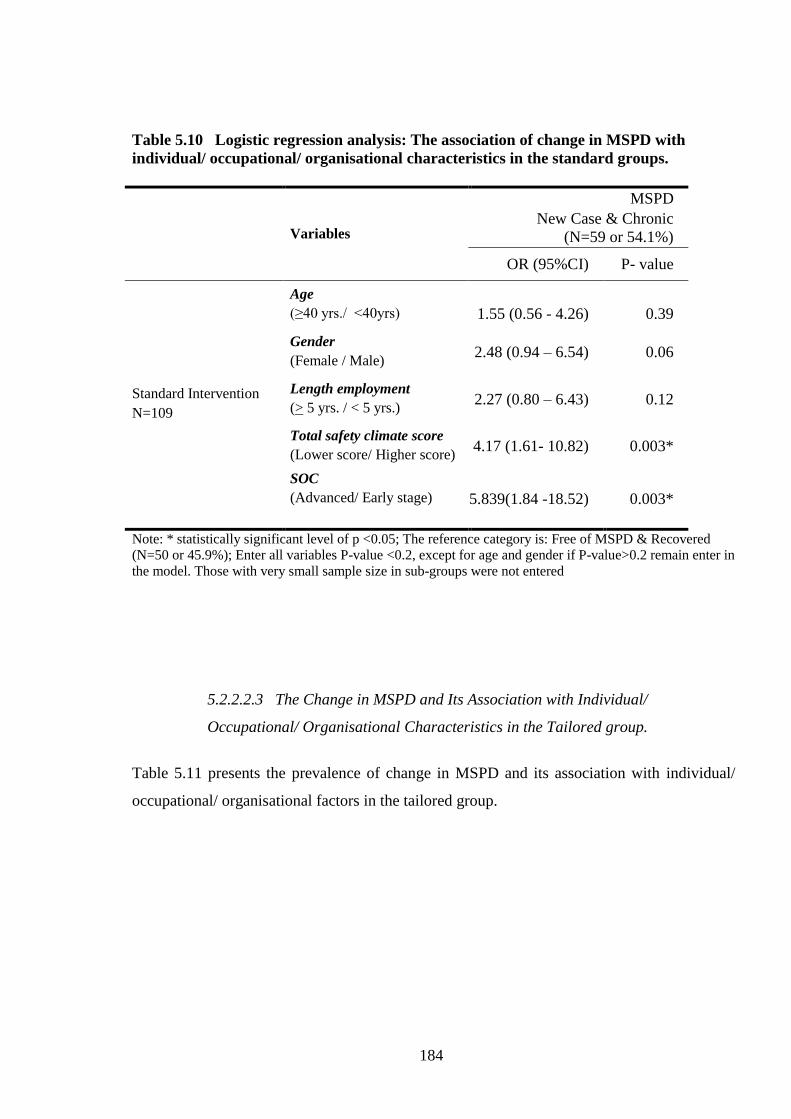
184
Table 5.10 Logistic regression analysis: The association of change in MSPD with
individual/ occupational/ organisational characteristics in the standard groups.
Variables
MSPD
New Case & Chronic
(N=59 or 54.1%)
OR (95%CI) P- value
Standard Intervention
N=109
Age
(≥40 yrs./ <40yrs)
1.55 (0.56 - 4.26)
0.39
Gender
(Female / Male) 2.48 (0.94 – 6.54) 0.06
Length employment
(> 5 yrs. / < 5 yrs.) 2.27 (0.80 – 6.43) 0.12
Total safety climate score
(Lower score/ Higher score) 4.17 (1.61- 10.82) 0.003*
SOC
(Advanced/ Early stage)
5.839(1.84 -18.52) 0.003*
Note: * statistically significant level of p <0.05; The reference category is: Free of MSPD & Recovered
(N=50 or 45.9%); Enter all variables P-value <0.2, except for age and gender if P-value>0.2 remain enter in
the model. Those with very small sample size in sub-groups were not entered
5.2.2.2.3 The Change in MSPD and Its Association with Individual/
Occupational/ Organisational Characteristics in the Tailored group.
Table 5.11 presents the prevalence of change in MSPD and its association with individual/
occupational/ organisational factors in the tailored group.

185
Table 5.11 Bivariate analysis: The change in MSPD and associations with individual/
occupational/ organisational characteristics in tailored group.
Tailored group (N= 128)
Individual/ Occupational/
Organisational Characteristics
P value
No complaint Chronic New case Recovered
n (%) n (%) n (%) n (%)
Change MSPD b 51 (39.8) 31 (24.2) 27 (21.1) 19 (14.8)
Individual factors
Age group
≥40 years
<40years
32 (49.2)
19 (30.6)
16 (24.6)
15 (24.2)
6 (9.2)
20 (32.3)
11 (16.9)
8 (12.9) 0.01 *
Gender
Female/
Male
29 (46.8)
22 (33.3)
12 (19.4)
19 (28.8)
11 (17.7)
16 (24.2)
10 (16.1)
9 (14.8) 0.33
English speaking background
NESB
ESB
6 (28.6)
44(41.5)
5 (23.8)
26 (24.5)
5 (23.8)
22 (20.8)
5 (23.8)
14 (13.2) 0.54
Occupational factors
Length employment
>=5years
< 5 years
27 (40.9)
24 (38.7)
19 (28.8)
12 (19.4)
10 (15.2)
17 (27.4)
10 (15.2)
9 (14.5) 0.32
Worked hours a
>45 hours/ week
<45hours
4 (28.6)
45 (43.3)
6 (42.9)
23 (22.1)
2 (14.3)
22 (21.2)
2 (14.3)
14 (13.5) 0.38
Workload
Medium-heavy
Sedentary- light
35 (40.7)
15 (37.5)
20 (23.3)
11 (27.5)
20 (23.3)
7 (17.5)
11 (12.8)
7 (17.5) 0.77
Vibration
Exposed
No Exposed
19 (43.2)
31 (37.8)
10 (22.7)
21 (25.6)
9 (20.5)
18 (22)
6 (13.6)
12 (14.6) 0.95
SOC
Advanced
Early stage
9 (28.1)
41 (43.2)
14 (43.8)
17 (17.9)
5 (15.6)
22 (23.2)
4 (12.5)
15 (15.8) 0.03 *
Overall job satisfaction a
Dissatisfied or not sure
Satisfied
4 (33.3)
47(40.5)
3 (25)
28 (24.1)
3 (25)
24 (20.7)
2 (16.7)
17 (14.7) 0.96
Organisational factors
Total safety climate score
Lower score
Higher score
17 (32.1)
30 (50)
17 (32.1)
10 (16.7)
9 (17)
13 (21.7)
10 (18.9)
7 (11.7) 0.10
Company size
Large
Medium
35 (42.7)
16 (34.8)
15 (18.3)
16 (34.8)
22 (26.8)
5 (10.9)
10 (12.2)
9 (19.6) 0.04 *
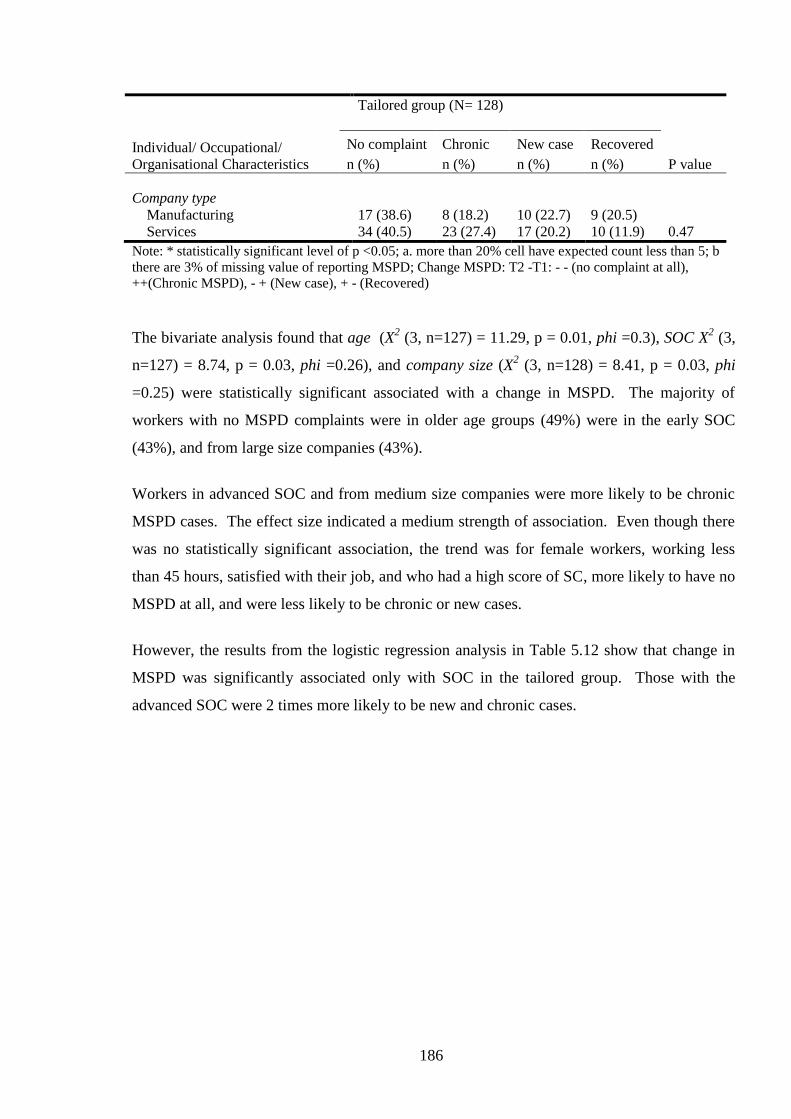
186
Tailored group (N= 128)
Individual/ Occupational/
Organisational Characteristics
P value
No complaint Chronic New case Recovered
n (%) n (%) n (%) n (%)
Company type
Manufacturing
Services
17 (38.6)
34 (40.5)
8 (18.2)
23 (27.4)
10 (22.7)
17 (20.2)
9 (20.5)
10 (11.9) 0.47
Note: * statistically significant level of p <0.05; a. more than 20% cell have expected count less than 5; b
there are 3% of missing value of reporting MSPD; Change MSPD: T2 -T1: - - (no complaint at all),
++(Chronic MSPD), - + (New case), + - (Recovered)
The bivariate analysis found that age (X2 (3, n=127) = 11.29, p = 0.01, phi =0.3), SOC X
2 (3,
n=127) = 8.74, p = 0.03, phi =0.26), and company size (X2 (3, n=128) = 8.41, p = 0.03, phi
=0.25) were statistically significant associated with a change in MSPD. The majority of
workers with no MSPD complaints were in older age groups (49%) were in the early SOC
(43%), and from large size companies (43%).
Workers in advanced SOC and from medium size companies were more likely to be chronic
MSPD cases. The effect size indicated a medium strength of association. Even though there
was no statistically significant association, the trend was for female workers, working less
than 45 hours, satisfied with their job, and who had a high score of SC, more likely to have no
MSPD at all, and were less likely to be chronic or new cases.
However, the results from the logistic regression analysis in Table 5.12 show that change in
MSPD was significantly associated only with SOC in the tailored group. Those with the
advanced SOC were 2 times more likely to be new and chronic cases.
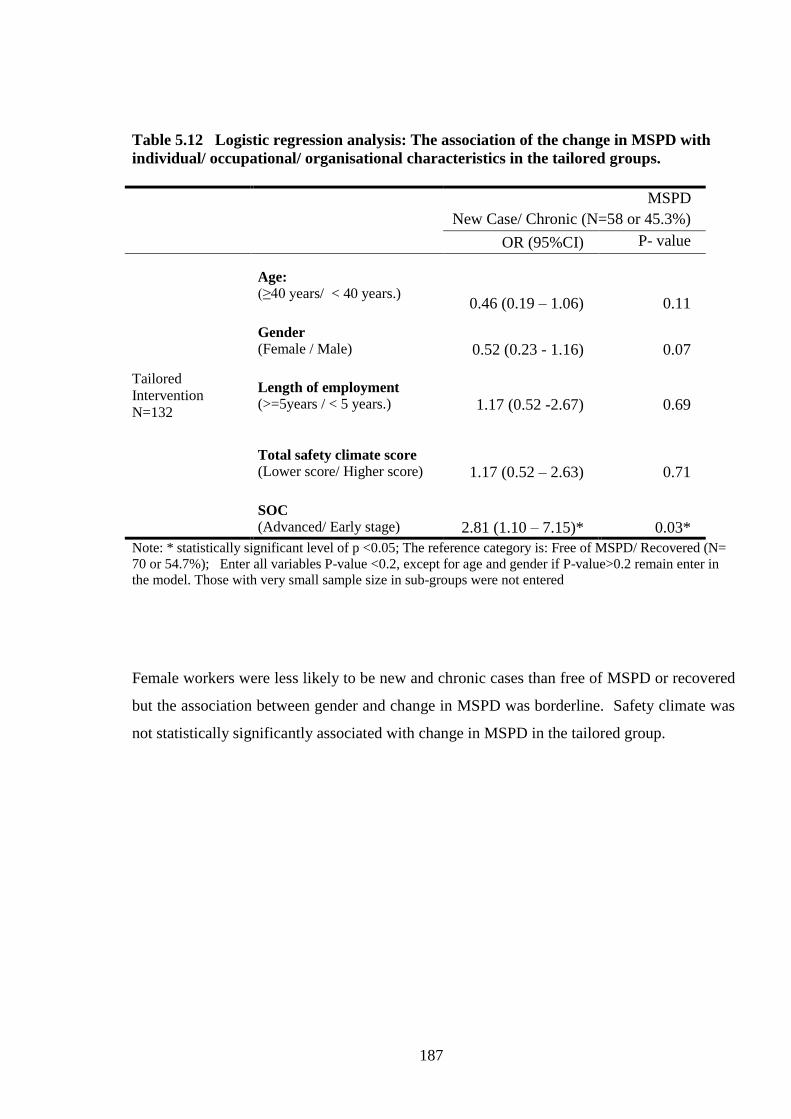
187
Table 5.12 Logistic regression analysis: The association of the change in MSPD with
individual/ occupational/ organisational characteristics in the tailored groups.
MSPD
New Case/ Chronic (N=58 or 45.3%)
OR (95%CI) P- value
Tailored
Intervention
N=132
Age:
(≥40 years/ < 40 years.)
0.46 (0.19 – 1.06)
0.11
Gender
(Female / Male)
0.52 (0.23 - 1.16)
0.07
Length of employment
(>=5years / < 5 years.)
1.17 (0.52 -2.67)
0.69
Total safety climate score
(Lower score/ Higher score)
1.17 (0.52 – 2.63)
0.71
SOC
(Advanced/ Early stage)
2.81 (1.10 – 7.15)*
0.03*
Note: * statistically significant level of p <0.05; The reference category is: Free of MSPD/ Recovered (N=
70 or 54.7%); Enter all variables P-value <0.2, except for age and gender if P-value>0.2 remain enter in
the model. Those with very small sample size in sub-groups were not entered
Female workers were less likely to be new and chronic cases than free of MSPD or recovered
but the association between gender and change in MSPD was borderline. Safety climate was
not statistically significantly associated with change in MSPD in the tailored group.

188
5.3 Cluster Randomised Trial Analysis – Comparison of Tailored
Interventions with Standard Interventions
Repeated cross sectional studies allow for straightforward “before and after analyses” as
described earlier in this Chapter. Using these analyses, it was found that the prevalence of
MSPD increased over time within the standard and the tailored groups. The standard group
showed a higher increase in MSPD than the tailored group, however, there were no significant
differences in change in MSPD in both groups, except for lower back MSPD.
However, the research design allowed for a more advanced statistical treatment, and beyond
what has been published (Shaw et al., 2007). That is, a cluster-randomised trial analysis of
the SOC approach versus a “standard” intervention based solely on conventional ergonomic
advice to management.
As these data were collected as if in a cluster-randomised trial, Generalized Estimating
Equations (Liang & Zeger, 1986) are an appropriate choice for statistical analysis (Dahmen &
Ziegler, 2004).
First, the data are clustered, and as such GEEs allow for the estimation of regression
parameters in the presence of correlation due to clustering. Accounting for clustering results
in estimates of population parameters that show lower variability; that is the estimate is more
efficient. With more efficient estimation of regression parameters, standard errors and
confidence intervals are smaller (Hanley et al., 2003).
GEEs allow results to be generalised to the overall population, rather than a cluster-specific
generalisation. The overall population effect of the SOC treatment intervention was the focus
of the study. Thus, rather than using a model with allows the modelling of individual-specific
slopes and intercepts, such as multilevel modelling, a GEE approach was undertaken to
examine population-level change in MSPD over time.
189
The findings of the advanced statistical treatment are presented in this section, based on two
research questions:
1. What is the relative advantage/disadvantage of a stage-matched intervention compared
with standard ergonomic intervention?
2. What characteristics of the individual or organisation affect the outcome?
The first question relates to the planned comparison, whereas the second question is more
exploratory.
5.3.1 Methods
5.3.1.1 Study Design (Cluster Randomised Trial study)
The research design was a cluster randomised trial nested within repeated two cross sectional
studies (Ukoumunne and Thompson, 2001). The cluster design, used in this research, has
been widely used (Lazovich et al., 2002) in occupational settings in order to account for the
effect of the workgroup on individual behaviour.
5.3.1.2 Sampling (Cluster Randomised Trial study)
The detailed sampling method was described in Chapter 3, Section 3.3.2. Twenty five
workgroups (N=242) that encompassed 13 standard workgroups (n=109) and 12 tailored
workgroups (n=133) were included in the final analysis. This sample size is comparable to the
UK HSE/Loughborough study, which had a maximum sample size for each group of 162
workers for the 4-6 months follow-up (Whysall et al., 2006), and 114 workers for the 15
months follow-up (Shaw et al., 2007).
190
5.3.1.3 Randomisation Procedure and Blinding
This research used cluster randomisation with a workgroup within a company as a cluster. To
allow for the intervention to be implemented continuously (specifically during the recruitment
process), block randomisation was used. Following recruitment of each consecutive block of
5 to 10 clusters (workgroups), an equal number of workgroups were assigned to either the
standard or tailored group. Randomisation in each block was carried out by an independent
researcher using a randomising function in Excel.
Both ergonomist and managers were blind to the allocation of each workgroup at the stage
when the ergonomist undertook the worksite observation and developed ergonomic
recommendations for the workgroups. However, during implementation of the intervention
blinding (of group allocation) of the ergonomist and the managers was not possible.
The randomisation process is presented in Figure 5.6.
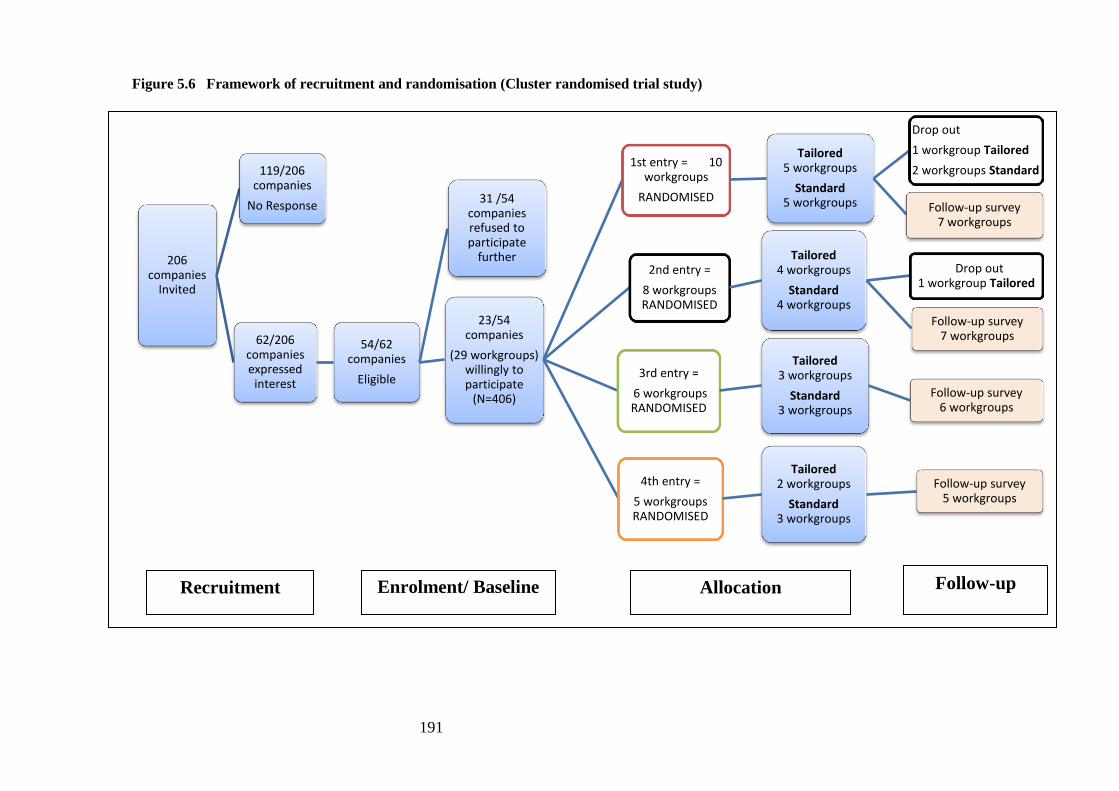
191
Figure 5.6 Framework of recruitment and randomisation (Cluster randomised trial study)
206 companies
Invited
119/206 companies
No Response
62/206 companies expressed
interest
54/62 companies
Eligible
31 /54 companies refused to participate
further
23/54 companies
(29 workgroups) willingly to participate
(N=406)
1st entry = 10 workgroups
RANDOMISED
Tailored 5 workgroups
Standard 5 workgroups
Drop out
1 workgroup Tailored
2 workgroups Standard
Follow-up survey 7 workgroups
2nd entry =
8 workgroups RANDOMISED
Tailored 4 workgroups
Standard 4 workgroups
Drop out 1 workgroup Tailored
Follow-up survey 7 workgroups
3rd entry =
6 workgroups RANDOMISED
Tailored 3 workgroups
Standard 3 workgroups
Follow-up survey 6 workgroups
4th entry =
5 workgroups RANDOMISED
Tailored 2 workgroups
Standard 3 workgroups
Follow-up survey 5 workgroups
Recruitment Enrolment/ Baseline
Allocation Follow-up
192
5.3.1.4 Study Analysis (Cluster Randomised Trial study)
A generalised estimation equation analysis for repeated measurement was carried out to
evaluate the effectiveness of the SOC-based intervention. The GEE analysis was undertaken
by a statistician who was informed by the research questions in Section 5.1.2: *what is the
effectiveness of the tailored intervention versus the standard intervention (MSPD as an
outcome)? *What is the association between changes in the MSPD from the baseline and
individual characteristics, occupational characteristics, and organisational characteristics?
Specifically, generalised estimating equations with binomial distribution and logit link and
response clustered within the individual were used to account for repeated measures (Liang
and Zeger, 1986, Zeger and Liang, 1986). The main research question was whether the
tailored intervention affected the odds of reported MSPD over time. However, there were a
number of relevant variables, which were also examined, including state of change; job
satisfaction; safety climate; and number of years employed. Age and gender were always
included as main effects in every model, but there were no hypotheses that involved them. In
order to obtain the most parsimonious model for each of the outcomes, the same model
building procedure was followed. In the first step, models predicting the outcome with time,
intervention, the covariates and all interactions were performed. Then non-significant 3-way
and 2-way interactions were removed, with the restriction that the time by intervention
interaction always remained. The final model for each outcome was then run, consisting of
time, intervention time by intervention, and any significant main effects or interactions with
covariates.
The binomial outcome measures including undifferentiated MSPD, shoulder, neck and lower
back MSPD were utilised. The reason for including shoulder, neck and lower back MSPD
was because they have been reported as the most common MSPD in this research. Shoulder
and neck MSPD were combined in this GEE model because there was a small number of
participants in each subgroup that meant the model could not be analysed. Similarly, as
severe MSPD had a small size, its analysis could not be run.

193
Group level tests are recommended in cluster randomised intervention studies (Ukoumunne
and Thompson, 2001), since the individuals in each group may depend or interact with each
other, which then might influence the outcome result at the group level. However, the analysis
described above was at the individual level. The workgroup level analysis was not carried out
because some workgroups (clusters) had a small number of participants, and that this research
did not have an equal cluster size. The previous study (Ukoumunne and Thompson, 2001),
p.340) stated that “…the equality of estimated odd ratios from GEE’s methods with an
exchangeable correlation matrix and ordinary logistic regression would not be produced
when cluster sizes are unequal. …In multilevel models, a limited number of cluster leads to
imprecise estimates of the between-cluster variance components”.
5.3.2 Results of the GEE statistical treatment
5.3.2.1 The Effect of a Tailored Intervention compared with Standard Intervention
The adjusted odds ratios derived from the generalised estimating equation analysis are
presented in Table 5.13. The adjusted odds ratios refer to the final models, for the
intervention effect as well as the time effect for tailored and standard groups.
What is the effect of the Tailored Intervention? There was a net benefit of the tailored
intervention compared with standard intervention but was not statistically significant except
in the case of lower back MSPD (ORs: 0.64, 0.67, and 0.40). Workers in Tailored group were
less likely to report lower back MSPD than those in the standard group. The GEE analysis
also found an increase in MSPD at follow-up, which was not statistically significant except
for lower back MSPD for the standard group. Moreover, the lower back MSPD increased
significantly in standard group (OR 2.43, 95%CI. 1.35-4.38), whereas in tailored group the
increase was not significant.
Severe MSPD findings were not presented due to a small numbers in the subgroups.
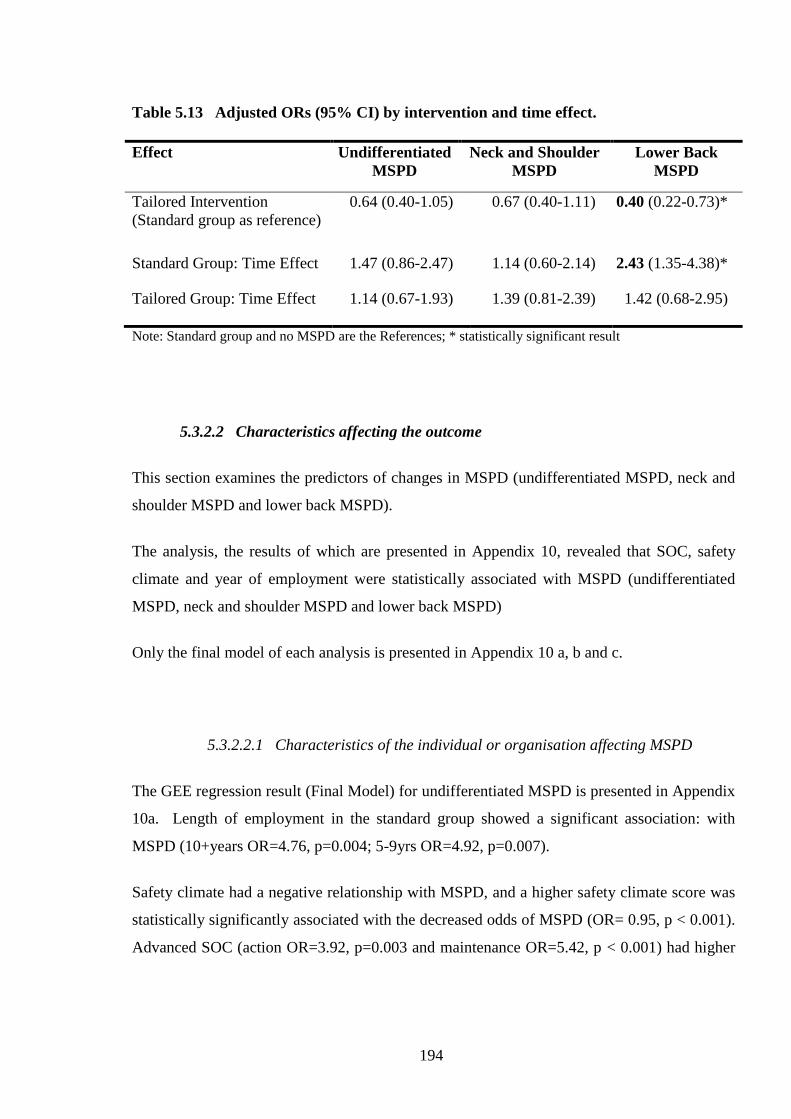
194
Table 5.13 Adjusted ORs (95% CI) by intervention and time effect.
Effect Undifferentiated
MSPD
Neck and Shoulder
MSPD
Lower Back
MSPD
Tailored Intervention
(Standard group as reference)
0.64 (0.40-1.05) 0.67 (0.40-1.11) 0.40 (0.22-0.73)*
Standard Group: Time Effect 1.47 (0.86-2.47) 1.14 (0.60-2.14) 2.43 (1.35-4.38)*
Tailored Group: Time Effect 1.14 (0.67-1.93) 1.39 (0.81-2.39) 1.42 (0.68-2.95)
Note: Standard group and no MSPD are the References; * statistically significant result
5.3.2.2 Characteristics affecting the outcome
This section examines the predictors of changes in MSPD (undifferentiated MSPD, neck and
shoulder MSPD and lower back MSPD).
The analysis, the results of which are presented in Appendix 10, revealed that SOC, safety
climate and year of employment were statistically associated with MSPD (undifferentiated
MSPD, neck and shoulder MSPD and lower back MSPD)
Only the final model of each analysis is presented in Appendix 10 a, b and c.
5.3.2.2.1 Characteristics of the individual or organisation affecting MSPD
The GEE regression result (Final Model) for undifferentiated MSPD is presented in Appendix
10a. Length of employment in the standard group showed a significant association: with
MSPD (10+years OR=4.76, p=0.004; 5-9yrs OR=4.92, p=0.007).
Safety climate had a negative relationship with MSPD, and a higher safety climate score was
statistically significantly associated with the decreased odds of MSPD (OR= 0.95, p < 0.001).
Advanced SOC (action OR=3.92, p=0.003 and maintenance OR=5.42, p < 0.001) had higher

195
ORs of MSPD over time than the earlier stages (pre-contemplation and contemplation/
preparation).
5.3.2.2.2 Characteristics of the individual or organisation affecting Neck and
Shoulder MSPD
The neck and shoulder MSPD final model GEE regression results are presented in Appendix
10b. It was found that SOC, safety climate, and length of employment were associated with
neck and shoulder MSPD. The advanced stage workers were twice as likely (OR=1.97,
p=0.008) to report neck and shoulder MSPD than those in the early stages. Workers who had
the lowest and middle score of safety climate were more likely to report neck and shoulder
MSPD than those with the highest score. However, only those with middle score (OR= 2.47,
p=0.05) showed a statistically significant result. In addition, only those in the standard group
showed significant changes, where those who had the lowest SC score (OR= 3.16, p= 0.049)
reported this MSPD 3 times more frequently than those with the highest scores. The longer
the employment of the participants the more frequently they reported MSPD.
5.3.2.2.3 Characteristics of the individual or organisation affecting Lower Back
MSPD
The lower back MSPD GEE final regression model is shown in Appendix 10c. This result
revealed that the change over time of the back MSPD was associated with safety climate,
SOC, and length of employment.
For Safety Climate, the lowest tertile showed higher odds of back MSPD (OR=6.28, p
<0.001) than either the upper or mid tertile groups. Mid and upper tertiles were not
significantly different. The odds of back MSPD for workers in the advanced state of change
were 2.09 times those in the early stage (p=0.012).
In the standard group, those who had worked 5-9 years and 10+ years showed increased odds
of back MSPD compared to those with <5yrs experience (OR (5-9 years) = 6.02, p =0.012);
OR (10+ years) =3.30, p =0.104). In the tailored groups, there were no significant
differences.
196
5.4 Workers’ Perceptions Concerning the Implementation of the SOC
Intervention
5.4.1 Method
5.4.1.1 Instruments for the evaluation Workers’ Perception of the Implementation
of the Stage of Change Intervention
Additional questions to evaluate the implementation of the interventions were developed and
administrated in the follow-up survey (Appendix 6). The questionnaires asked the workers
about the changes made and training/information provided by the employer in the
intervention.
5.4.1.2 Analysis of Workers’ Perception of the Implementation of the Stage of
Change Intervention
Chi square analysis was performed to examine the difference of workers’ perception in
tailored and standard intervention groups.

197
5.4.2 Results
This section provides the results of workers’ perceptions of the implementation of the
intervention, i.e. addressing research question 5. .
5.4.2.1 Worker’s Perception of Changes Made by Employer to Prevent WRMSD
Table 5.14 shows that workers in the standard group (60%) were more likely report that their
employers had made changes in the last 6-12 months compared with the tailored group (45%)
(p=0.02).
On the other hand, this table shows the similarities between the intervention groups. In both
groups, approximately 80% of the workers who were aware of the changes made stated ‘yes’
to the question about the consultation prior to the introduction of the changes.
More than 85 percent of those who were aware of the changes agreed that the changes made
a difference to the way they and others did their work. In addition more than 90% of the
participants in the standard group (n=50) and tailored group (n=47) agreed that the changes
also made a difference to the way others in their group did their work. Although, it was not
statistically significant, the trend was that workers in the tailored group were more aware of
the future changes planned by their employer than those in the standard group (18.8% vs.
11.2%).
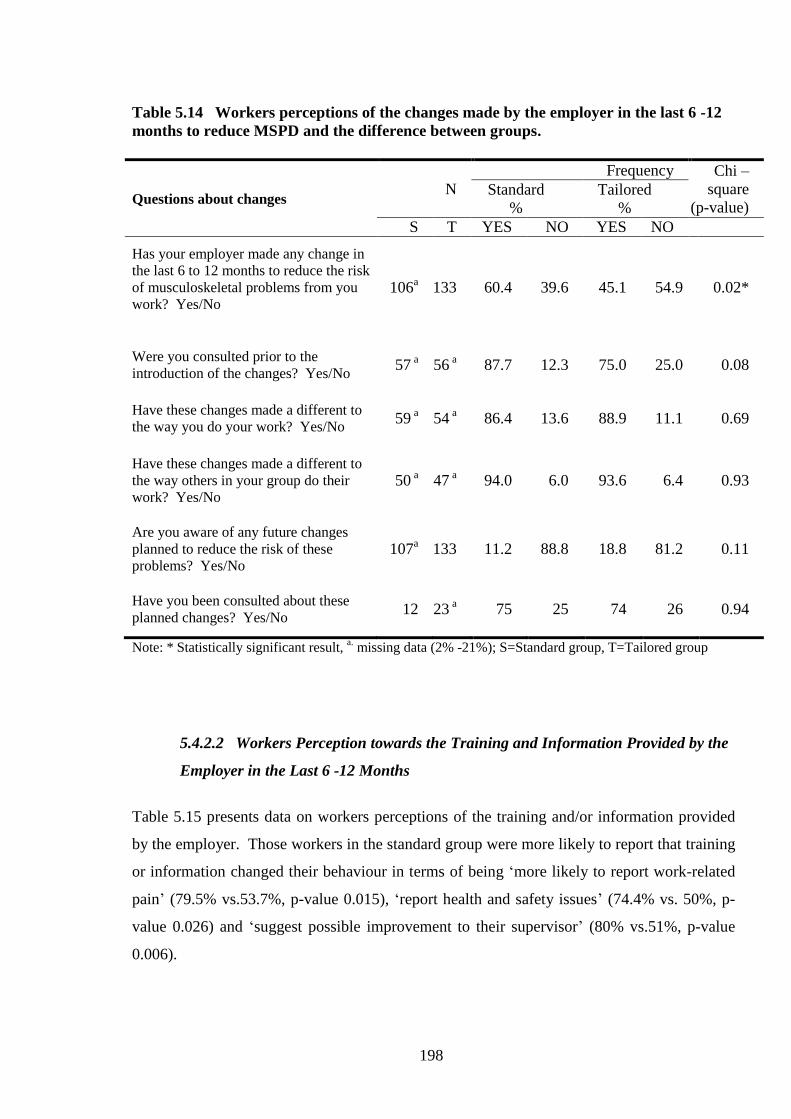
198
Table 5.14 Workers perceptions of the changes made by the employer in the last 6 -12
months to reduce MSPD and the difference between groups.
Questions about changes N
Frequency Chi –
square
(p-value) Standard
%
Tailored
%
S T YES NO YES NO
Has your employer made any change in
the last 6 to 12 months to reduce the risk
of musculoskeletal problems from you
work? Yes/No
106a 133 60.4 39.6 45.1 54.9 0.02*
Were you consulted prior to the
introduction of the changes? Yes/No 57
a 56
a 87.7 12.3 75.0 25.0 0.08
Have these changes made a different to
the way you do your work? Yes/No 59
a 54
a 86.4 13.6 88.9 11.1 0.69
Have these changes made a different to
the way others in your group do their
work? Yes/No
50 a 47
a 94.0 6.0 93.6 6.4 0.93
Are you aware of any future changes
planned to reduce the risk of these
problems? Yes/No
107a 133 11.2 88.8 18.8 81.2 0.11
Have you been consulted about these
planned changes? Yes/No 12 23
a 75 25 74 26 0.94
Note: * Statistically significant result, a. missing data (2% -21%); S=Standard group, T=Tailored group
5.4.2.2 Workers Perception towards the Training and Information Provided by the
Employer in the Last 6 -12 Months
Table 5.15 presents data on workers perceptions of the training and/or information provided
by the employer. Those workers in the standard group were more likely to report that training
or information changed their behaviour in terms of being ‘more likely to report work-related
pain’ (79.5% vs.53.7%, p-value 0.015), ‘report health and safety issues’ (74.4% vs. 50%, p-
value 0.026) and ‘suggest possible improvement to their supervisor’ (80% vs.51%, p-value
0.006).
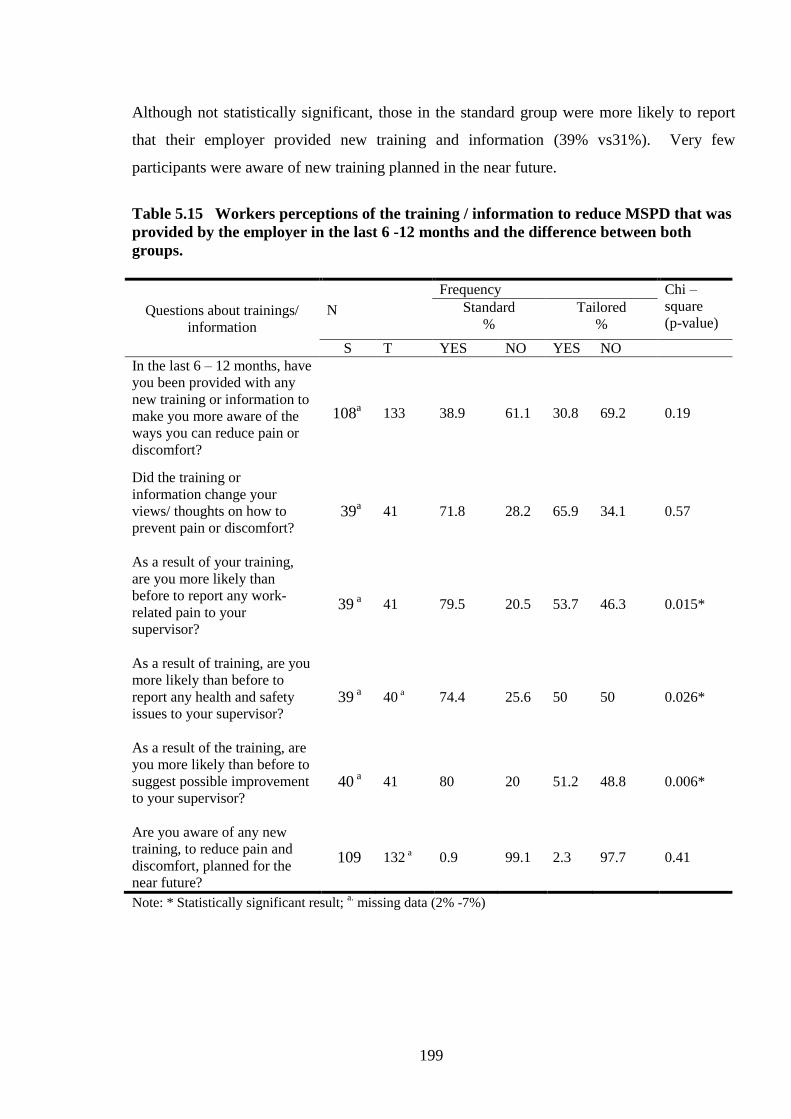
199
Although not statistically significant, those in the standard group were more likely to report
that their employer provided new training and information (39% vs31%). Very few
participants were aware of new training planned in the near future.
Table 5.15 Workers perceptions of the training / information to reduce MSPD that was
provided by the employer in the last 6 -12 months and the difference between both
groups.
Questions about trainings/
information
N
Frequency Chi –
square
(p-value) Standard
% Tailored
%
S T YES NO YES NO
In the last 6 – 12 months, have
you been provided with any
new training or information to
make you more aware of the
ways you can reduce pain or
discomfort?
108a 133 38.9 61.1 30.8 69.2 0.19
Did the training or
information change your
views/ thoughts on how to
prevent pain or discomfort?
39a 41 71.8 28.2 65.9 34.1 0.57
As a result of your training,
are you more likely than
before to report any work-
related pain to your
supervisor?
39 a 41 79.5 20.5 53.7 46.3 0.015*
As a result of training, are you
more likely than before to
report any health and safety
issues to your supervisor?
39 a 40
a 74.4 25.6 50 50 0.026*
As a result of the training, are
you more likely than before to
suggest possible improvement
to your supervisor?
40 a 41 80 20 51.2 48.8 0.006*
Are you aware of any new
training, to reduce pain and
discomfort, planned for the
near future?
109 132 a 0.9 99.1 2.3 97.7 0.41
Note: * Statistically significant result; a. missing data (2% -7%)
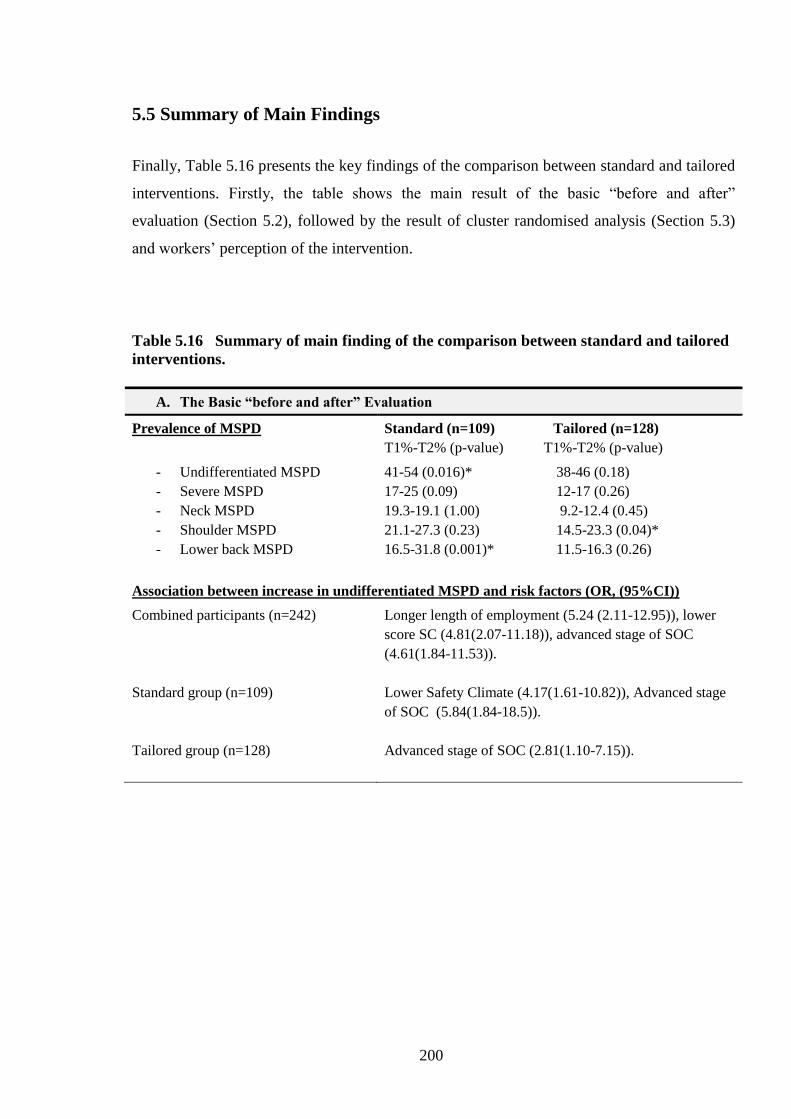
200
5.5 Summary of Main Findings
Finally, Table 5.16 presents the key findings of the comparison between standard and tailored
interventions. Firstly, the table shows the main result of the basic “before and after”
evaluation (Section 5.2), followed by the result of cluster randomised analysis (Section 5.3)
and workers’ perception of the intervention.
Table 5.16 Summary of main finding of the comparison between standard and tailored
interventions.
A. The Basic “before and after” Evaluation
Prevalence of MSPD Standard (n=109) Tailored (n=128)
T1%-T2% (p-value) T1%-T2% (p-value)
- Undifferentiated MSPD
- Severe MSPD
- Neck MSPD
- Shoulder MSPD
- Lower back MSPD
41-54 (0.016)* 38-46 (0.18)
17-25 (0.09) 12-17 (0.26)
19.3-19.1 (1.00) 9.2-12.4 (0.45)
21.1-27.3 (0.23) 14.5-23.3 (0.04)*
16.5-31.8 (0.001)* 11.5-16.3 (0.26)
Association between increase in undifferentiated MSPD and risk factors (OR, (95%CI))
Combined participants (n=242)
Standard group (n=109)
Tailored group (n=128)
Longer length of employment (5.24 (2.11-12.95)), lower
score SC (4.81(2.07-11.18)), advanced stage of SOC
(4.61(1.84-11.53)).
Lower Safety Climate (4.17(1.61-10.82)), Advanced stage
of SOC (5.84(1.84-18.5)).
Advanced stage of SOC (2.81(1.10-7.15)).

201
Change in Job Satisfaction (Overall Job satisfaction decreased significantly in both
group)
Standard group
Tailored group
Decrease in Your job security (p=0.04)
Decrease in Your fellow workers (p=0.03), The
recognition you get for good work (p=0.01), Your
immediate boss (p=0.02), Industrial relations between
management and staff (p=0.001), Your chance of
promotion/ reclassification (p=0.02), The attention
paid to suggestions you make (p=0.006)
Change in Safety climate dimensions (No significant changes in total score of safety
climate in both groups)
Standard group
Tailored group
Decrease in Communication (p=0.017)
Decrease in Communication (p=0.00) and Company
prioritisation of safety (p=0.04)
Change in SOC
Standard group
Tailored group
Decrease in percentage of workers in Pre-
contemplation (p=0.008)
Increase in percentage of workers in
Contemplation/preparation (p=0.008)
No significant changes in SOC.
B. Cluster Randomised Trial Analysis (GEE analysis)
Changes in Prevalence of MSPD:
- MSPD (undifferentiated MSPD, neck& shoulder MSPD) increased slightly in both
intervention groups, except the lower back MSPD showed a significant increase in
standard group.
- Comparing the intervention groups, the MSPD in both groups increase but standard
group shows slightly larger increase than tailored group (insignificant difference). In
the case of lower back MSPD, the standard group shows significant increase.
Association between increase in undifferentiated MSPD and risk factors
Increase in undifferentiated MSPD associated with:
Overall Advanced SOC, Lower safety climate score, Longer
length of employment.
Standard Longer length of employment
Tailored No significant differences

202
Increase in Neck & shoulder MSPD associated with:
Overall Longer length of employment, Advanced SOC, Lower
score of safety climate.
Standard Longer length of employment, Lowest score of safety
climate.
Tailored No significant differences
Increase in Lower back MSPD associated with:
Overall Longer length of employment, Advanced SOC, Lower
score of safety climate.
Standard Longer length of employment.
Tailored No significant differences.
C. Workers’ Perception
Changes Made by Employer to Reduce WRMSD
Has your employer made any change in the
last 6 to 12 months to reduce the risk of
musculoskeletal problems from you work?
• Answer: YES
Standard 60.4% - Tailored 45.1% (p=0.02)
Workers Perception towards the Training and Information Provided by the Employer
As a result of your training, are you more
likely than before to report any work-related
pain to your supervisor?
• Answer: YES
Standard 79.5% - Tailored 53.7% (p=0.015)
As a result of training, are you more likely
than before to report any health and safety
issues to your supervisor?
• Answer: YES
Standard 74.4% - Tailored 50% (p=0.026)
As a result of the training, are you more
likely than before to suggest possible
improvement to your supervisor?
• Answer: YES
Standard 80% - Tailored 51.2% (p=0.006)

203
5.6 Discussion
This research has used a similar methodology to that of Haslam and coworkers (Whysall et
al., 2006, Whysall et al., 2005, Shaw et al., 2007). It has used a more robust statistical
treatment in cluster randomised trial design. However, there is weaker evidence for the
effectiveness of SOC approach.
This finding is discussed below.
5.6.1 Main Results in Comparison with Other Studies
5.6.1.1 The Change in Prevalence of MSPD after the Intervention
Surprisingly, MSPD showed an increase after the implementation of the interventions, from
baseline to follow-up (2008/09 to 2009/10) in both standard and tailored groups (see Table
5.16).
The increase in MSPD after the intervention was found to be associated with lower safety
climate score, advanced SOC and longer length of employment. Such an increase in
prevalence may be associated with the reduction of job satisfaction shown at the follow-up
survey. The reduction in job satisfaction may have reflected the impact of the economic crisis
that occurred in 2009 (discussed later). Thus, there might be an indirect relationship between
the occupational health issues and the socio-economic situation (Halleröd and Gustafsson,
2011, Muntaner et al., 2010, Rios and Zautra, 2011).
An alternative explanation is a Hawthorne-like effect (McCarney et al., 2007) where workers
in both groups became more likely to report pain and discomfort, because of the internal and
external attention paid to the issue. This alternative is supported by the result concerning
workers’ perception of the intervention. It was found that a significantly higher percentage of
workers said ‘yes’ for the two questions of training: “As a result of your training, are you
more likely than before to report any work-related MSPD to your supervisor?” and “As a

204
result of training, are you more likely than before to report any health and safety issues to
your supervisor?” (Section 5.3.4.2). Thus, it is possible that after the intervention
implementation, companies were more willing to encourage their employees to report hazards
in the workplace.
5.6.1.2 The Effectiveness of SOC Approach in an Organisational Setting
This study revealed limited evidence to support the effectiveness of stage of change (SOC)
approach in organisations. MSPD in both groups increased. The advanced statistical analysis
(GEE analysis) concluded that there were no statistically significant differences between the
tailored and standard groups for change in undifferentiated MSPD, neck and shoulder MSPD.
However, there was a significant increase in lower back MSPD in the standard group.
Compared with the standard group, workers in the tailored groups were less likely to report
MSPD.
There were some unexpected changes in SOC: i.e. reduction in action and maintenance stage
and an increase in contemplation/ preparation. This finding was inconsistent with previous
studies (Whysall et al., 2005, Shaw et al., 2007, Prochaska et al., 2001, Prochaska, 2007).
The UK study (Whysall et al., 2006) using a simple statistical analysis, found that tailored and
standard groups had reduced MSPD slightly, and not statistically significant. However, they
found that there was a significant reduction in MSPD in several body areas and a reduction of
MSPD severity in several body areas in the tailored group, whereas the reduction in standard
group was not significant. They also found that the proportion of workers in the action and
maintenance stage in the tailored group increased.
It is necessary to interpret the results carefully, since there might be reasons for the apparent
ineffectiveness of the SOC method in the current research. There are also several
explanations for the differences in results between studies.
Although, this current study adapted some methods from the previous UK study the stage-
matched implementation method was different. In the current study the implementation was
based on a workgroup SOC profile, and focussed on common stages on each workgroup,

205
whereas Whysall’s study was based on only one of the most common stage in the workgroup.
The differences between both studies could not be exactly determined because detailed
implementation methods were not available from UK study’s published work.
In addition, Prochaska (2007) found that studies used a partial set of TTM variables were less
likely to present significant results than those who used all TTM variables.
5.6.1.3 The Changes in Job Satisfaction, Safety Climate and Stage of Change After
Intervention
Job satisfaction in both groups significantly decreased. As stated earlier, the decrease may
have been linked to the economic crisis at that time (see Chapter 6). In the standard group
one of the job satisfaction items (job security) significantly decreased. Thus, even though job
satisfaction may not have been directly associated with economic burden, the impact of the
economic crisis may have triggered psychological distress for workers in terms of job
uncertainty (Marchand et al., 2005). In the tailored group, it was found that some job
satisfaction items namely fellow workers, recognition you get for good work, their immediate
boss, a chance of promotion, and attention paid to suggestion you make were also
significantly decreased (Section 5.3.1.3.1). Such a decrease in these items showed that
industrial relations, especially between employees and manager could also create anxiety at
workplaces, which in turn might generate health problems.
This result supports a previous study (Muntaner et al., 2010), which suggested that
employment relations could be used to determine the association of an organisation social
mechanism with health problems.
This was also supported by the reduction in some dimensions of organisational safety climate.
Although there was only a slight reduction in the total safety climate score, there were some
significant reductions of safety climate dimensions including: communication and company
prioritisation of safety (Section 5.3.1.3.2). Whysall et al. (2005) found that communication
and supportive management was an important factor in facilitating a reduction of workplace
206
risks. Therefore, both dimensions should be considered when planning to prevent work-
related MSD risks or other safety issues.
5.6.1.4 The predictors of the Changes in MSPD - Individual and
Occupational/Organisation Factors.
The final GEE model confirmed that increases in all types of MSPD consistently related to a
lower safety climate score, longer length of work employment, and advanced SOC.
Comparing the standard and tailored groups, logistic regression found that lower safety
climate and advanced SOC were important for the increase in MSPD in the standard group.
On the other hand, only advanced SOC was important for the increase in MSPD in tailored
group. However, when included in a GEE model with these other predictors, the GEE analysis
revealed that in standard group, longer length of employment and lower score of safety
climate were important. Conversely, for the tailored group no significant association between
the increase in MSPD and the risk factors was found.
Individual Factors
Individual factors were not found to be associated with MSPD, which is inconsistent with
some previous studies. Age and gender were associated with work-related MSPD (Widanarko
et al., 2011, Scuffham et al., 2010, Safe Work Australia, 2011). However, this finding is
consistent with Daraiseh et al (2010) where age and gender were not associated with
WRMSD. The variation between studies may due to differences in methodology, study
population or other factors.
Occupational Factors
Workers with longer length of employment may have been more confident to report MSPD.
Possible reasons why workers with shorter length of employment may be less likely to MSPD
might include feeling insecure and fear of losing their job. This finding supports a previous
207
study (Alipour et al., 2008) but also contrasts with another study (Daraiseh et al., 2010).
Daraiseh et al. (2010) argue that with more work experience, the more employees adjusted to
their job, the less they reported musculoskeletal pain. Thus, there is an ambiguity in terms of
the association between length of employment and occupational illness. Consequently, the
more objective assessment of MSPD such as physical examination should be undertaken in
order to provide a more precise result.
There was no significant association between workload and vibration and MSPD, which was
in contrast with previous studies (Widanarko et al., 2011, Bernard, 1997). This may have
been partly due to differences in workload and vibration assessment methods or the
measurement of the pain. A more detailed discussion is presented in Chapter 3, Section
3.5.1.2.
The next important variable was job satisfaction, even though the significance of association
with the change in MSPD was not evident in some analyses. However, the direction of the
association was consistent. A previous study found that there was a relationship between job
insecurity and workplace distress (Marchand et al., 2005). Workplace anxiety may have
generated psychosomatic symptoms, including musculoskeletal pain. A previous study found
that job dissatisfaction could generate workplace illness (Scuffham et al., 2010).
Workers in the advanced stage may be more aware about the importance of reporting hazards,
thereby reporting MSPD more frequently. This result supports the Canadian study, where the
authors argue that pain might be a precursor of being in advanced stages, thereby prompting
prevention (Village and Ostry, 2010). However, if the pain is a precursor, studies that have
high pain prevalence should have a high percentage of workers in the advanced stage (action
and maintenance). In fact, the UK study with approximately 80% MSPD prevalence only had
a small number of employees in the advanced stages, which was similar to the Canadian study
where were only a few participants, were in advanced stages (Whysall et al., 2005, Village
and Ostry, 2010). So, the first alternative may be more suitable - that workers in advanced
stage are more aware about risk and more compliant with reporting hazards in workplace.
This was supported by the results in Section 5.3.2.1, which found that a higher percentage of
workers in the advanced stage than the early stage had experienced chronic MSPD and had
208
recovered from MSPD. A possible explanation is that workers in the advanced stage had
been more aware of the WRMSD risk, subsequently reporting MSPD to comply with OHS
rules. Moreover, workers in advanced stage had taken action to reduce MSPD.
Organisational Factors
The most important correlate of all types of MSPD was lower safety climate score.
Regarding the association between safety climate and MSPD; the results were consistent from
baseline to follow-up. Workers with higher scores for safety climate were more likely to be
“free of MSPD”, whereas workers with lower scores were more likely to report chronic
MSPD (Section 5.3.2). This result supports previous studies (Clarke, 2006, Huang et al.,
2007, Seo et al., 2004, Vinodkumar and Bhasi, 2009), which found that poor organisational
safety climate related to accident rate. Pousette and coworkers (2008) found that there was
positive relationship between safety climate and workers’ safety attitude.
5.6.1.5 Workers Perception of the Implementation of the Intervention
This section discusses workers’ perceptions about the implementation of the intervention.
Note that the recommendations were given to the site managers and it was managers’
responsibility to introduce interventions as applied to the workgroup.
The results (Section 5.4.4.1) show that the majority of workers in the tailored group were not
aware of the change made by the employer to reduce the risk of MSPD. Around 80% of those
who aware of the changes in both groups said ‘yes’ to the question about consultation before
the introduction of the changes. This does not necessarily mean that employers did not make
any changes. Workers who were not aware of the changes could have experienced a lack of
communication about the changes undertaken. Either the manager did not communicate the
changes properly, or the employees did not pay attention towards changes. The other
alternative reason might be because the changes were only made for particular tasks or
worksites; so only workers doing those tasks, or who were in those sites were informed about
the changes. This result supports the previous UK study, which found that workers were less
likely than their managers to report that changes had been undertaken (Whysall et al., 2007).

209
These authors speculated that managers might over-report that changes had been made, or the
workers had not recognised the changes/interventions.
This argument is also supported by the decrease in job satisfaction and safety climate (Section
5.3.1.3). In the tailored group the job satisfaction items concerning the immediate boss,
industrial relation between management and staff, and relation with co-workers were
decreased significantly. In the tailored group safety climates dimension in terms of
communication within the company and company prioritisation of safety were also decreased.
Moreover, in the baseline and follow-up survey the lowest safety dimension score of 6 were
the personal appreciation of risk (Figure 5.5 and 5.6).
Thus, the effectiveness of the SOC approach in organisations to reduce hazards in workplace
may not only depended on individual behaviour or the application of stage-matched approach
but also the relationships and communication between employees and the
employers/managers and co-workers (Barrett et al., 2005).
5.6.2 Strength and Weaknesses of the Research
5.6.2.1 Strengths of this Research
Several strengths of the study have been discussed in Chapter 3, Section 3.4.2.1.
Workers’ characteristics in the tailored and standard groups at the baseline were very similar.
The block randomisation (Caria et al., 2011) allowed very similar number of workgroups in
each of tailored and standard groups.
Generalized estimating equations were used as the interest was in a marginal model rather
than modelling individual variation. That is, the overall population effect of the treatment
intervention was the focus of the study, rather than an examination of the individual variation
in change in MSPD over time.

210
In addition, the data were clustered, and the clusters themselves were not of equal size. GEEs
can be used in this situation (Dahmen and Zeigler, 2004).
5.6.2.2 Weaknesses of this Research
The participants’ attrition rate from the baseline to follow-up surveys was 33.5% - larger
compared with a previous study of around 20% (Whysall et al., 2006). However the final
number of participants in each intervention group (tailored 133 and standard 109) was
comparable. Additionally, paired participants who were participated in both surveys were
used in the study analysis.
Another limitation was the usage of individual level tests to evaluate the change in MSPD and
other variables. It was recommended to analyse the study with cluster randomisation based
on the cluster level (Eldridge et al., 2004). However, the cluster level could not be carried out
with GEE due to the unequal cluster size (Ukoumunne and Thompson, 2001) in this research.
Additionally, GEEs were developed for use with data with the number of clusters of about 15
or larger. If the sample size within the clusters is not small, then bias in the coefficient
estimates is not a concern (Prentice, 1988).
The GEE has a focus on the population mean effect of the predictors on the outcome.
Therefore, statements about the variability of individual changes are not available. However,
since the focus of this research was the effect of the intervention on the odds of showing
MSPD, and individual variability was not of interest.
There was no control group – i.e. no intervention at all. It was considered impractical to
recruit into such a control group. Companies would not allow an external organisation to
conduct repeat face to face questionnaire surveys with no benefit to the organisation.
211
5.7 Conclusions
The research in this thesis aimed to describe the relationship between a range of factors and
MSPD experience in workplace settings, and to evaluate the effectiveness of the
implementation of a stage of change approach to WRMSD prevention. Psychosocial
variables such safety climate were significantly correlated with MSPD and increase in
MSPD. This is consistent with an aetiological model of WRMSD where psychosocial factors
make a significant contribution. Compared with standard ergonomic advice to management,
there was some evidence of a benefit of stage-matched interventions for WRMSD
prevention.
212
CHAPTER 6
GENERAL DISCUSSION
6.1 Introduction
MSPD in South Australian workplaces was assessed and factors associated with MSPD
determined. The study also evaluated workplace interventions using the Stage of Change
approach, and compared them with interventions based solely on ergonomic advice to
management. Psychosocial factors including safety climate were found to be important
correlates of MSPD. There was some evidence for the benefit of the SOC approach.
This chapter discusses the significance of the research, considers its main findings in the
context of other literature, and summarises its overall strengths and limitations.
6.2 Significance of the Research
Research addressing MSPD is justified since workplace musculoskeletal problems are
common worldwide and potentially have a large impact on productivity, quality of life,
sickness absence and overall economic burden (National Research Council, 2001).
This research examined a range of individual, occupational and organisational factors
including psychosocial factors. The inclusion of such variables was intended to increase
knowledge of their relevance and relationships with respect to MSPD.
213
Compared with other studies, the current research has been more inclusive and used a more
sophisticated statistical analysis within a randomised trial design. Consequently, the findings
in this research may be useful to health and safety practitioners, researchers, healthcare
providers and managers who are interested in risk factors for MSPD/WRMSD and
interventions to reduce their occurrence in the workplace. The findings with respect to
specific dimensions of safety climate and items of job satisfaction may provide useful
strategic insights for organisations.
Whilst the SOC approach was considered in the literature to be potentially useful it is
necessary to evaluate stage-matched interventions in different organisational cultures and in
different countries. To the author’s knowledge, this research is the first in Australia to
evaluate the effectiveness of a stage of change (SOC) approach in an organisational setting.
This research also evaluated the process of the implementation of the intervention by
examining employee perceptions about workplace and training changes made by employers.
6.3 Summary of Main Findings in the Context of Other Research.
The main findings are as follows:
Prevalence of MSPD
In the baseline and follow-up surveys, MSPD was found to be common, and mostly observed
in the neck, shoulder and lower back.
The prevalence of MSPD increased from baseline to the follow-up in both tailored and
standard groups
Associations of MSPD and the risk factors
Psychosocial variables such as safety climate and job satisfaction were important risk factors
for work-related MSPD in this research. Safety climate scores were significantly associated
with MSPD (undifferentiated MSPD, severe MSPD, neck, shoulder and lower back MSPD),

214
followed by the advanced stage of change (SOC) and job satisfaction. Length of employment
was also significantly associated with MSPD. On the other hand, workload and vibration
were not found to be significantly associated with MSPD.
Implementation of the intervention
Workers in both tailored and standard groups perceived a similar implementation of the
interventions.
Relative benefit of SOC approach
There was some evidence of benefit for the SOC approach for mitigation of MSPD, especially
for the lower back.
6.3.1 The Prevalence of MSPD
The literature review and this research found that work-related musculoskeletal pain and
discomfort is common. The 7-day period prevalences of MSPD of 40% (baseline) and 49%
(follow-up) were lower than the Safe Work Australia’s reported value of 72.2% (Safe Work
Australia., 2011). The MSPD prevalence was also lower than that from the UK of 78%
(Whysall et al., 2005) but the follow-up result was similar to the Canadian study of 49%
(Village and Ostry, 2010). Unfortunately, a valid comparison cannot not be made with other
studies since different methods were used. In addition, the authors of the Safe Work Australia
report (Safe Work Australia., 2011) acknowledged that the reported prevalence of
musculoskeletal pain was not representative of the Australian population, as, for example, it
only included certain industries. A more appropriate comparison could be made with the UK
and Canadian studies, which used similar questions addressing MSPD. However, these
studies still had differences in their methods of data collection. Another alternative reason for
the variation in prevalence of MSPD across countries might be different regulatory
environments.

215
In this research, increases in MSPD were observed and were associated with various factors
e.g. lower safety climate, and advanced SOC. A possible explanation for increased MSPD
might be a Hawthorne effect as a treatment response (McCarney et al., 2007) where workers
in both groups became more likely to report pain and discomfort after the intervention.
Figure 6.1 summarises, diagrammatically, the overall trend of MSPD, severe MSPD, job
satisfaction, safety climate and state of change, before and after the interventions.
Figure 6.1 General trends of MSPD, severe MSPD, job satisfaction, and safety climate.
Note: Not to scale. T1= Baseline survey, T2=Follow-up survey, JS= job satisfaction, SC= safety climate,
MSPD=musculoskeletal pain/discomfort, SOC-Ear. = stage of change-early stage,
SOC-Adv.=advanced stage, Sev. MSPD = severe MSPD
It is possible that economic circumstances during the life of the research may have had some
influence on a range of measured variables. Figure 6.2 illustrates the economic cycle and in
particular the economic downturn in 2009 when the follow-up survey was conducted. This
situation may have impacted on job satisfaction and the development of job stress.
MSPD
Sev.Pain
J S
SC
SOC-Ear
SOC-Adv
T1 T2
Tailored
MSPD
Sev.Pain
JS
SC SOC-Ear
SOC-Adv
T1 T2
Standard
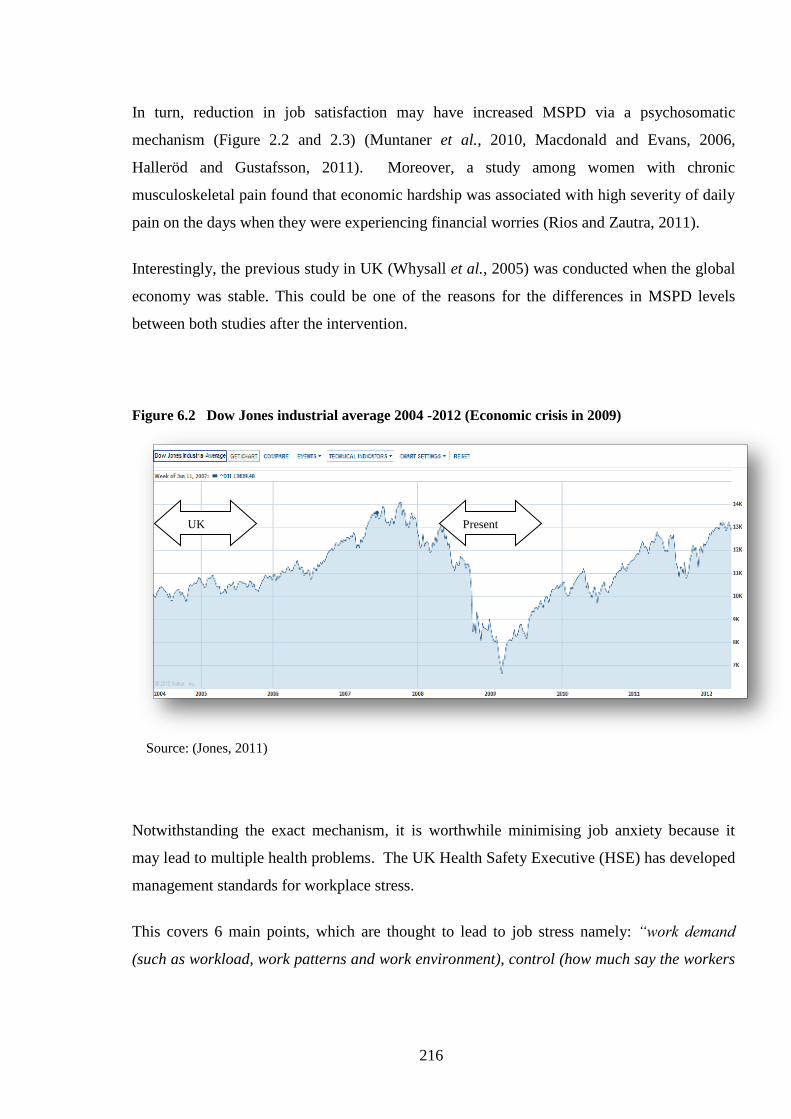
216
In turn, reduction in job satisfaction may have increased MSPD via a psychosomatic
mechanism (Figure 2.2 and 2.3) (Muntaner et al., 2010, Macdonald and Evans, 2006,
Halleröd and Gustafsson, 2011). Moreover, a study among women with chronic
musculoskeletal pain found that economic hardship was associated with high severity of daily
pain on the days when they were experiencing financial worries (Rios and Zautra, 2011).
Interestingly, the previous study in UK (Whysall et al., 2005) was conducted when the global
economy was stable. This could be one of the reasons for the differences in MSPD levels
between both studies after the intervention.
Figure 6.2 Dow Jones industrial average 2004 -2012 (Economic crisis in 2009)
Source: (Jones, 2011)
Notwithstanding the exact mechanism, it is worthwhile minimising job anxiety because it
may lead to multiple health problems. The UK Health Safety Executive (HSE) has developed
management standards for workplace stress.
This covers 6 main points, which are thought to lead to job stress namely: “work demand
(such as workload, work patterns and work environment), control (how much say the workers
UK
study
Present
study study

217
has in the way they do their work), support (this includes organisation, management and co-
workers providing encouragement, sponsorship and resources to the worker), relationships
(for example promoting positive working conditions to avoid conflict and dealing with
unacceptable behaviour), role (whether workers understand their role and whether
organisation guarantee that the worker does not have conflicting roles), change (such as how
organisation change is managed and corresponded in the organisation)” (Health and Safety
Executive, 2010).
6.3.2 The Association of MSPD with Psychosocial Factors
Psychosocial factors have been reported to be important risk factors for MSPD, which is
consistent with conceptual models of MSD (National Research Council, 2001 & Macdonald
and Evans, 2006). Widanarko et al.’s (2012a) cross sectional study of coal mining workers in
Indonesia found that psychosocial factors were associated with low back symptoms (LBS).
The combination of high physical demand and high stress increased the risk of LBS, however
the combination of high physical and low psychosocial or vice versa was not increasing the
LBS (Widanarko et al., 2012a). A longitudinal study of Dutch workers also found that a good
psychosocial environment (communication and social support) buffered the negative effect of
high physical workload on the risk of MSD (Joling et al., 2008). Another study by
Widanarko et al. (2012b) found that psychosocial factors including dissatisfaction with
contact and cooperation with management was associated with LBS for females.
Safety climate as a psychosocial factor and an organisational factor was found to be the most
consistent risk factor in the development of musculoskeletal pain and discomfort. Lower
scores for safety climate were significantly associated with higher prevalences of MSPD,
which is in line with previous studies (Clarke, 2006, Huang et al., 2007, Seo et al., 2004,
Vinodkumar and Bhasi, 2009). While, these previous studies were quite different from the
current study, since they did not evaluate MSPD per se, the direction of the association
between safety climate and work-related health problems is similar.
218
In both surveys (at baseline and follow-up), it was found that personal appreciation of risk
has the lowest score among safety dimension items, and that a low score was associated with
a high prevalence of undifferentiated MSPD and severe MSPD. Participants with a lower
score for management commitment were more likely to report MSPD than those with a higher
score. The perceived importance of safety rules and procedures (in the baseline survey) was
also an important factor for predicting MSPD. Thus, in order to reduce the prevalence of
MSPD not only should the workers’ attitudes towards health and safety problems be
considered but also the managements’ commitment towards safety in the workplace should be
taken into account.
Two cross-sectional studies by Torp et al. (1999 and 2001), also found that a good
psychosocial environment, including high social support and involvement of manager,
supervisors, health and safety deputy, trade union representative and workers in health and
safety work, was associated with active coping strategies to reduce musculoskeletal problems.
Seo and coworkers (2004) found that workers’ perceptions of safety were influenced by
managements’ commitment and supervisor support. This indicates that improvements in
management commitment and supervisor support toward safety may lead to greater
appreciation by workers of workplace health risks.
Job satisfaction had a negative association with MSPD; workers who were dissatisfied with
their job were more likely to report MSPD. This result is consistent with either job
dissatisfaction being a precursor to MSPD, or MSPD being a precursor to job dissatisfaction.
Scuffham et al. (2010) asserted job dissatisfaction could generate illness in workplaces.
Marchand and coworkers (2005) identified a relationship between job insecurity and
workplace distress, which in turn may generate psychosomatic symptoms, including
musculoskeletal pain (Figure 2.3). In this research, the notion of job dissatisfaction as a
precursor of MSPD is supported by the increase in prevalence of MSPD being associated with
economic deterioration and potential loss of confidence amongst workers.
219
6.3.3 Workers’ Perception of the Implementation of the Intervention
The workers were asked about the implementation of the interventions. The standard group
seemed to have been more aware of workplace changes made by employers to reduce MSPD
risk. However, it does not mean that the employers of the workers in the tailored group did
not make any changes. A possible explanation is that the changes were only made in
particular workstations. In this way, workers who were not in these workstations did not
know about them. Managers might only communicate changes to those workers who were in
targeted workstations.
Another possibility is that the communication of the changes by the employer was
insufficient. A majority of workers who were aware of the changes stated that their employer
had consulted them about the changes before their implementation. Therefore, it could be that
either a manager did not adequately communicate about workplace changes or workers did
not pay attention towards safety.
The arguments above are consistent with a reduction in job satisfaction items related to the
immediate boss, industrial relations between management and staff and relations with co-
workers, in the tailored group after the intervention. Safety climate in terms of
communication within the company and company prioritisation of safety also decreased in the
tailored group. In addition it was found that in both surveys, the personal appreciation of
safety had the lowest score.
Thus, the effectiveness of a stage-matched approach in an organisational setting may also
depend on the relationship and communication between employees and manager and co-
workers. Barrett et al. (2005, p.884) argued, “When applying the SOC model in an
organisational context, it is important to remember that employees’ behaviour is not just the
product of individual attitudes and beliefs but can also be influenced by interaction with peers
and social norms of the working environment”. Their study also highlighted the importance
of encouraging senior and middle management commitment toward health and safety issues,
and improving communication and motivation amongst workers (Barrett et al., 2005).
220
6.3.4 The Effectiveness of SOC Approach in an Organisational Context.
The stage of change construct has been traditionally applied to individuals to improve health
outcomes. Only recently has it been applied in organisational settings (Prochaska, 2007).
There has been little research on how SOC is influenced by workplace arrangements and
norms.
The current research generated limited evidence to support the SOC approach in an
organisational context, and this result might be viewed as inconsistent with the UK study
(Whysall et al., 2005). However, Weinstein et al. (1998) argued that if studies failed to
demonstrate the effectiveness of SOC, it did not mean that a SOC strategy is unsuitable. The
unexpected result may be found if a study had failed to assess the SOC and apply the stage-
matched approach adequately in organisations (Weinstein et al., 1998). In this research, it was
not feasible to investigate the final form of interventions - i.e. to examine the actual changes.
There are a number of differences between this research and other studies. The first is that the
recommendations to management were based on SOC profile, which could have been
interpreted differently from recommendations made solely on the most common stage within
each workgroup (Whysall et al., 2005, Shaw et al., 2007). The former approach potentially
affects all workers, including those in pre-contemplation (Prochaska, 2001). It was
considered practical and appropriate to target more than one SOC of workers in each
workgroup.
A second factor is the variation in safety climate. In both the baseline and follow-up surveys,
it was found that the safety climate dimension of personal appreciation of risk had the lowest
score and also that there was a reduction of communication score and company prioritisation
of safety score over time. Harris and Cole (2007) found that a lower organisational
commitment was related to the pre-contemplation stage. Therefore, a lack of company and
employee commitment to safety and a lack of communication between management and
employees may interfere with the implementation of any intervention including a stage-
matched intervention. Whysall et al. (2005) and Shaw et al. (2007) also noted that
managerial commitment; changing employee behaviour, supportive management, and
communication were important barriers or facilitating factors in reducing workplace risk.

221
Another important issue for workplaces is the economic environment. An intervention should
meet a company’s budget (Burdorf, 2007, Feuerstein and Harrington, 2006). One possible
limitation of the effectiveness of the interventions in this research is that companies may not
have been able to afford all the recommended changes.
6.4 Strengths and Weaknesses of the Research
6.4.1 The Strengths of this Research
Participants’ individual characteristics, such as age and gender, were similar to those in the
Australian and South Australian population, Moreover, a wide range of industry types
participated in this study including manufacturing, food industries, health care services
company, mining, professional sectors, and other services. The findings, therefore, are likely
to be generalisable to medium and large companies.
The questionnaire was administered in workplaces, one on one in a closed room to ensure
confidentiality. This interview method was considered to be appropriate in order to reduce
over and/or under reporting of MSPD and for confidential issues, such as job satisfaction and
safety climate. Additionally, the face-to-face method allowed the interviewer to give an
explanation of the meaning of questions or terms. Closed room interviews enabled
participants to report MSPD and other sensitive issues with a degree of assurance. The issue
of “insecure feeling” as an effect of undertaking interviews in workplace (Pransky et al.,
1999) was minimised.
The definition of MSPD as occurring within the past 7 days was used to reduce recall bias.
The current research also addressed several variables that were the main plausible risks of
MSPD in order to identify the association between MSPD and the risk factors.
Paired participants, i.e. those who had participated in both surveys, were utilised for the
before and after intervention analysis and GEE analysis. Such an approach improves rigour.

222
6.4.2 The Weaknesses of this Research
A potential limitation was that this research might not be generalisable to small companies
since they did not participate. A previous study found that smaller companies were less likely
to have health promotion programs than larger companies (Linnan et.al, 2008 in Hughes et
al., 2001).
Participants may have reported the severity of MSPD subjectively. However, some
researchers have argued that self-reporting of WRMSD symptoms is similar to self-
assessment of other diseases, a well-established approach (Punnett and Wegman, 2004).
Recent studies have used questionnaires like the Standardised Nordic questionnaire (Kuorinka
et al., 1987, Öztürk and Esin, Scuffham et al., 2010, Glover et al., 2005) and the Netherland
Periodical Occupational Health survey (POHS) (de Zwart et al., 1997b). These have their own
limitations, e.g. a 12 month time frame for self reported MSD symptoms might lead to recall
bias unless the symptoms were severe. A gold standard measurement of MSD has been
recommended by Roquelaure, et al. (2006), including physical examination by an
occupational physician or a combination physical examination and self-reporting. While this
kind of measurement may generate more precise results, it is costly to use in a study with a
large sample size.
The increases in MSPD in both groups should be interpreted with caution since it could be a
Hawthorne-like effect, where workers are more likely to report MSPD as a result of
observation (McCarney et al., 2007).
223
There was no control group in this intervention research. It was impractical to recruit
workers into a control group where there was no intervention at all. Companies might not
allow an external organisation to conduct repeat face to face questionnaire surveys with no
benefit to the organisation.
Workload categorisation in this research was based on the Dictionary of Occupational Titles
(Cain and Treiman, 1981, Miller et al., 1980, Fletcher et al., Lee and Chan, 2003, National
Academic Science Commitee on Occupational Classification and Analysis, 2003). This
method might be imprecisely referred to as individual workload. However, onsite
observations were undertaken by an ergonomist, reducing the likelihood of spurious
categorisation. For practical reasons, direct and systematic observations and bio-
measurement were not undertaken, e.g. RULA OWAS, EMG, heart rate monitoring during
work (Roja et al., 2006, Garet et al., 2005b), perceived physical exertion (PPE), and physical
isometric workload.
Another limitation of this study was participant attrition of 33.5% from baseline to follow-up.
It was higher than the UK study (20%) (Whysall et al., 2006). However, the final sample size
was very similar. In addition, paired participants were used in the randomised trial analysis.

224
CHAPTER 7
CONCLUSIONS AND RECOMMENDATIONS
7.1 Conclusions
Musculoskeletal disorders represent one of the most common and costly concerns for
workplaces. This is evident from Australian and South Australian workers compensation data.
Prevalences of work related MSPD are also significant, but comparisons of MSPD data are
limited and problematic due to variations in the methods used.
There is a need to improve prevention strategies. Tailoring of interventions based on the
SOC approach may improve the effectiveness and longevity of interventions. This thesis
presents some evidence for the benefit of the SOC approach. Workers receiving SOC-tailored
interventions were less likely to report MSPD than workers receiving interventions based
solely on ergonomic advice. A statistically significant benefit for the SOC approach was
found for low back pain.
Safety climate was the most consistent correlate of MSPD, suggesting that improvements in
safety climate can reduce the occurrence of MSPD.
7.2 Implications and Recommendations
7.2.1 For workplaces:
Organisational safety climate is an important predictor of MSPD and should be improved in
order to minimise MSPD. Specifically, the dimension of communication and company
prioritisation of safety should be addressed.
225
In line with the conceptual model of the development of MSD, a range of psychosocial and
individual/occupational factors should also be taken into account when planning prevention
programs. It is recommended that SOC, safety climate and job satisfaction be surveyed as
part of any comprehensive strategy for the control of WRMSD.
Communication was found to be important in respect of the implementation of interventions.
Thus prior to, and during, implementation of any intervention, there should be consultation
with the workforce in order to maximise benefits.
7.2.2 For Future research:
Further research is recommended to identify the time trends of psychosocial and
organisational factors, and their influence on both pain and injury outcomes. Economic
factors should be considered.
Standardised measures should be used, including objective measures, where feasible.
226
REFERENCES
Aas, R. W., Tuntland, H., Holte, K. A., Roe, C., Lund, T., Marklund, S. & Moller, A., 2011.
Workplace interventions for neck pain in workers (Review). Cochrane Database
Systematic Review, 4.
Adams, J. & White, M., 2005. Why don't stage-based activity promotion interventions work?
Health Education Research, 20 (2), 237-243.
Al-Hemoud, A. M. & Al-Asfoor, M. M., 2006. A behavior based safety approach at a Kuwait
research institution. Journal of Safety Research, 37, 201-206.
Alipour, A., Ghaffari, M., Shariati, B., Jensen, I. & Vingard, E., 2008. Occupational neck and
shoulder pain among automobile manufacturing workers in Iran. American Journal of
Industrial Medicine, 51, 372-379.
Australian Bureau of Statistics, 2010. Population by Age and Sex, Australian States and
Territories, June 2010. ABS : 3201.0, Australian Capital Territory.
http://www.abs.gov.au/ausstats/[email protected]/mf/3201.0 (Accessed: April 25, 2009).
Australian Bureau of Statistics, 2002. Labour Force, Australia. ABS:1321.0, Australian
Bureau of Statistics, Australian Capital Territory.
http://www.abs.gov.au/AUSSTATS/[email protected]/Lookup/1321.0Main+Features12001
(Accessed: April 20, 2011).
Australian Bureau of Statistics & Statistics New Zealand, 2006. Australian and New Zealand
standard industrial classification (ANZSIC). ABS:1292.0 Australia and New Zealand.
http://www.abs.gov.au/ausstats/[email protected]/mf/1292.0 (Accessed: April 20, 2011).
Australian Bureau of Statistics., 2006. Australian Social Trends 2006. ABS:4102.0 Australian
Capital Territory.
http://www.abs.gov.au/AUSSTATS/[email protected]/DetailsPage/4102.02006 (Accessed:
April 20, 2011).
Barrett, J. H., Haslam, R. A., Lee, K. G. & Ellis, M. J., 2005. Assessing attitude and beliefs
using the stage of change paradigm-case study of health and safety appraisal within a
manufacturing company. International Journal of Industrial Ergonomics, 35, 871-887.
Bernard, B. P. 1997. Musculoskeletal disorders and workplace factors. National Institute for
Occupational Safety and Health.Cincinnati. U.S Department of Health and Human
Services: DHHS (NIOSH) Publication No. 97B141.

227
Berry, T. R., Plotnikoff, R. C., Raine, K., Anderson, D. & Naylor, P. J., 2007. An examination
of the stage of change construct for health promotion within organization. Journal of
Health Organization and Management, 21 (2), 121-135.
Bohle, P. & Quinlan, M., 2000. Managing occupational health and safety: A multidisciplinary
approach.2nd ed, Macmillan Publishers Australia South Yarra.
Bongers, P. M. & Boshuizen, H. C., 1992. Back disorders and exposure to whole-body
vibration: Thesis summary. Clinical Biomechanics, 7 (3), 185-186.
Boocock, M. G., Collier, J. M. K., McNair, P. J., Simmonds, M., Larmer, P. J. & Armstrong,
B., 2009. A framework for the classification and diagnosis of work-related upper
extremity conditions: Systematic review. Seminars in Arthritis and Rheumatism, 38
(4), 296-311.
Burdorf, A., 2007. Economic evaluation in occupational health - Its goals, challenges, and
opportunities. Scandinavian Journal of Work, Environment & Health, 33 (3), 161-164.
Bureau of Labor Statistics, U. S., 2011. Nonfatal occupational injuries and illnesses requiring
days away from work, 2010. http://www.bls.gov/news.release/osh2.nr0.htm.
Cain, P. S. & Treiman, D. J., 1981. The dictionary of occupational titles as a source of
occupational data. American Sociological Review, 46 (3), 253-278.
Carayon, P., Smith, M. J. & Haims, M. C., 1999. Work organization, job stress, and work-
related musculoskeletal disorders. Human Factors: The Journal of the Human Factors
and Ergonomics Society, 41 (4), 644-663.
Caria, M., Faggiano, F., Bellocco, R. & Galanti, M., 2011. The influence of socioeconomic
environment on the effectiveness of alcohol prevention among European students: a
cluster randomized controlled trial. BMC Public Health, 11 (1), 312.
Carlo, C. D., 2007. Mechanisms, determinants and processes of change in the modification of
drinking behavior. Alcoholism: Clinical and Experimental Research, 31 (s3), 13s-20s.
Choi, B. K. L., Verbeek, J. H., Tam, W. W. S. & Jiang, J. Y., 2010. Exercises for prevention
of recurrences of low-back pain (Review). Cochrane Database Systematic Review, 1.
Cohen, J., 1988. Statistical power analysis for the behavioural sciences. 2nd ed.
Lawrence Erlbaum Associates, Inc.
http://books.google.com.au/books?id=Tl0N2lRAO9oC&printsec=frontcover&dq=%2
2jacob+cohen%22&hl=en&ei=GfE4TNSZHMK6cai36foO&sa=X&oi=book_result&c
t=result#v=onepage&q=%22jacob%20cohen%22&f=false (Accessed: June 25, 2011).
Cole, D. C. & Rivilis, I., 2004. Individual factors and musculoskeletal disorders: A
framework for their consideration. Journal of Electromyography and Kinesiology, 14
(1), 121-127.
228
Corlett, E. N. & Bishop, R. P., 1976. A technique for assessing postural discomfort.
Ergonomics, 19 (2), 175-182.
Cox, S. J. & Cheyne, A. J. T., 2000. Assessing safety culture in offshore environments. Safety
Science, 34, 111-129.
Cristancho, M. Y. L., 2012. Participatory ergonomics among female cashiers from a
department store. Work: A Journal of Prevention, Assessment and Rehabilitation, 41,
2499-2505.
Dahlberg, R., Karlqvist, L., Bildt, C. & Nykvist, K., 2004. Do work technique and
musculoskeletal symptoms differ between men and women performing the same type
of work tasks? Applied Ergonomics, 35 (6), 521-529.
Dahmen, G. & Zeigler, A., 2004. Generalized estimating equations in controlled clinicaltrials:
Hypotheses testing. Biometrical Journal, 46, 214-232.
Daraiseh, N. M., Cronin, S. N., Davis, L. S., Shell, R. L. & Karwowski, W., 2010. Low back
symptoms among hospital nurses, associations to individual factors and pain in
multiple body regions. International Journal of Industrial Ergonomics, 40 (1), 19-24.
David, G., Woods, V., Li, G. & Buckle, P., 2008. The development of the Quick Exposure
Check (QEC) for assessing exposure to risk factors for work-related musculoskeletal
disorders. Applied Ergonomics, 39 (1), 57-69.
Davies, H. T., Crombie, I. K. & Tavakoli, M., 1998. When can odds ratios mislead? British
Medical Journal, 316 (7136), 989-991.
De Oliveira Sato, T. & Cote Gil Coury, H. J., 2009. Evaluation of musculoskeletal health
outcomes in the context of job rotation and multifunctional jobs. Applied Ergonomics,
40 (4), 707-12.
de Zwart, B. C. H., Broersen, J. P. J., Frings-Dresen, M. H. W. & van Dijk, F. J. H., 1997a.
Muskoloskeletal complaints in the Netherlands in relation to age, gender and
physically demanding work. International Archives Occupational Environmental
Health, 70, 352-360.
de Zwart, B. C. H., Broersen, J. P. J., Frings-Dresen, M. H. W. & van Dijk, F. J. H., 1997b.
Repeated survey on changes in musculoskeletal complaints relative to age and work
demands. Occupational and Environmental Medicine, 54, 793-799.
Dembe, A. E., Erickson, J. B., Delbos, R. G. & Banks, S. M., 2005. The impact of overtime
and long work hours on occupational injuries and illnesses: New evidence from the
United States. Occupational and Environmental Medicine, 62 (9), 588-597.
229
Denis, D., St-Vincent, M., Imbeau, D., Jetté, C. & Nastasia, I., 2008. Intervention practices in
musculoskeletal disorder prevention: A critical literature review. Applied Ergonomics,
39 (1), 1-14.
DiClemente, C. C., Prochaska, J. O., Fairhurst, S. K., Velicer, W. F., Velasquez, M. M. &
Rossi, J. S., 1991. The process of smoking cessation: An analysis of precontemplation,
contemplation, and preparation stages of change. Journal of Consulting and Clinical
Psychology, 59 (2), 295-304.
Driessen, M., Groenewoud, K., Proper, K., Anema, J., Bongers, P. & van der Beek, A., 2010.
What are possible barriers and facilitators to implementation of a participatory
ergonomics programme? Implementation Science, 5 (1), 64.
Driessen, M. T., Proper, K. I., Anema, J. R., Knol, D. L., Bongers, P. M. & van der Beek, A.
J., 2011. The effectiveness of participatory ergonomics to prevent low-back and neck
pain - results of a cluster randomized controlled trial. Scandinavian Journal of Work,
Environment & Health, 37 (5), 383.
Eldridge, S. M., Ashby, D., Feder, G. S., Rudnicka, A. R. & Ukoumunne, O. C., 2004.
Lessons for cluster randomized trials in the twenty-first century: A systematic review
of trials in primary care. Clinical Trials, 1 (1), 80-90.
Elwood, J. M., 2007. Clinical apprisal of epidemiology studies and clinical trials.3rd ed,
Oxford University Press, Oxford.
Eurofound. 2007. Fourth European Working Conditions Survey. Publications Office of the
European Union, Luxembourg. European Foundation for the Improvement of Living
and Working Conditions: p.62.
Fatimah, O., Noraishah, D., Nasir, R. & Khairuddin, R., 2012. Employment security as
moderator on the effect of job security on worker’s job satisfaction and well being.
Asian Social Science, 8 (9), 50.
Feuerstein, M. & Harrington, C., 2006. Secondary prevention of work-related upper extremity
disorders: Recommendations from the annapolis conference. Journal of Occupational
Rehabilitation, 16 (3), 393-401.
Fisher, T. & Gibson, T., 2008. A measure of university employees' exposure to risk factors for
work-related musculoskeletal disorders. American Association of Occupational Health
Nurses Journal, 56 (3), 107-114.
Fletcher, J. M., Sindelar, J. L. & Yamaguchi, S., 2011. Cumulative effects of job
characteristics on health. Health Economics, 20 (5), 553-570.
Franco, G. & Fusetti, L., 2004. Bernardino Ramazzini's early observations of the link between
musculoskeletal disorders and ergonomic factors. Applied Ergonomics, 35 (1), 67-70.
230
Fry, A. C., 2004. The role of resistance exercise intensity on muscle fibre adaptations. Sports
Medicine, 34 (10), 663-679.
Garet, M., Boudet, G., Montaurier, C., Vermorel, M., Coudert, J. & Chamoux, A., 2005.
Estimating relative physical workload using heart rate monitoring: A validation by
whole-body indirect calorimetric. European Journal of Applied Physiology, 94 (1),
46-53.
Gershon, R. R. M., Stone, P. W., Zeltser, M., Faucett, J., Macdavitt, K. & Chou, S. S., 2007.
Organizational climate and nurse health outcomes in the United States: A systematic
review. Industrial Health, 45 (5), 622-636.
Glover, W., McGregor, A., Sullivan, C. & Hague, J., 2005. Work-related musculoskeletal
disorders affecting members of the Chartered Society of Physiotherapy.
Physiotherapy, 91 (3), 138-147.
Griffin, M. A. & Neal, A., 2000. Perceptions of safety at work: A framework for linking
safety climate to safety performance, knowledge, and motivation. Journal of
Occupational Health Psychology, 5 (3), 347-358.
Grosch, J. W., Caruso, C. C., Rosa, R. R. & Sauter, S. L., 2006. Long hours of work in the
U.S.: Associations with demographic and organizational characteristics, psychosocial
working conditions, and health. American Journal of Industrial Medicine, 49 (11),
943-952.
Haines, H., Wilson, J. R., Vink, P. & Koningsveld, E., 2002. Validating a framework for
participatory ergonomics (the PEF). Ergonomics, 45 (4), 309-327.
Hakkanen, M., Juntura, E. V. & Takala, E. P., 1997. Effect of change in work methods on
musculoskeletal load. An interventon study in the trailer assembly. Applied
Ergonomics, 28 (2), 99 - 108.
Halleröd, B. & Gustafsson, J. E., 2011. A longitudinal analysis of the relationship between
changes in socio-economic status and changes in health. Social Science & Medicine,
72 (1), 116-123.
Hamberg-van Reenen, H. H., van der Beek, A. J., Blatter, B. M., van der Grinten, M. P., van
Mechelen, W. & Bongers, P. M., 2008. Does musculoskeletal discomfort at work
predict future musculoskeletal pain? Ergonomics, 51 (5), 637-648.
Hanley, J.A., Negassa, A. Edwardes, M.D., Forrester, J.E. (2003). Statistical analysis of
correlated data using Generalized Estimating Equations: An orientation. American
Journal of Epidemiology, 157(4), 364-375.
Harris, S. G. & Cole, M. S., 2007. A stages of change perspective on managers’ motivation to
learn in a leadership development context. Journal of Organizational Change
Management, 20 (6), 774-793.

231
Haslam, R. A., 2002. Targeting ergonomics interventions-learning from health promotion.
Applied Ergonomics, 33 (3), 241-249.
Hasler, G., Delsignore, A., Milos, G., Buddeberg, C. & Schnyder, U., 2004. Application of
Prochaska's transtheoritical model of change to patients with eating disorders. Journal
of Psychosomatic Research, 57, 67-72.
Haukka, E., Pehkonen, I., Leino-Arjas, P., Viikari-Juntura, E., Takala, E. P., Malmivaara, A.,
Hopsu, L., Mutanen, P., Ketola, R., Virtanen, T., Holtari-Leino, M., Nykanen, J.,
Stenholm, S., Ojajarvi, A. & Riihimaki, H., 2010. Effect of a participatory ergonomics
intervention on psychosocial factors at work in a randomised controlled trial.
Occupational and Environmental Medicine, 67 (3), 170-177.
Health and Safety Executive, 1997. Safety Climate Measurement User Guide and Toolkit.
http://www.lboro.ac.uk/departments/sbe/downloads/pmdc/safety-climate-assessment-
toolkit.pdf.
Health and Safety Executive. 2010. How to tackle work-related stress. The management
standards. Health and Safety Executive. www.hse.gov.uk/pubns/indg430.pdf.
Health and Safety Executive. 2011. Musculoskeletal Disorders (MSDs) in Great Britain (GB).
United Kingdom. Health and Safety Executive: 2.
http://www.hse.gov.uk/statistics/causdis/musculoskeletal/index.htm.
Herberts, P., Kadefors, R. & Broman, H., 1980. Arm positioning in manual tasks An
electromyographic study of localized muscle fatigue. Ergonomics, 23 (7), 655-665.
Herzog, T. A., 2008. Analysing the transtheoretical model using the framework of Weinstein,
Rotman and Sutton (1998): The example of smoking cessation. Health Psychology,
27, 548-556.
Hignett, S. & McAtamney, L., 2000. Rapid entire body assessment (REBA). Applied
Ergonomics, 31 (2), 201-205.
Hikman, J. S. & Geller, E. S., 2003. A safety self-management intervention for mining
operation. Journal of Safety Research, 34, 299-308.
Hoe, V. C. W., Urquhart, D. M., Kelsall, H. L. & Sim, M. R., 2012. Ergonomic design and
training for preventing work-related musculoskeletal disorders of the upper limb and
neck in adults (Review). Cochrane Database Systematic Review, 8.
Hoover, H. C. & Hoover, L. H. (Ed.). (1950). Georgius Agricola De Re Metallica. Dover
Publications. http://www.tms.org/pubs/Books/PDFs/09-1001-e/09-1001-0.pdf
(accessed March 15, 2014).
Hopkins, A., 2006. Studying organisational cultures and their effects on safety. Safety
Science, 44 875–889.

232
Huang, Y. H., Chen, J. C., De Armond, S., Cigularov, K. & Chen, P. Y., 2007. Roles of safety
climate and shift work on perceived injury risk: A multi-level analysis. Accident
Analysis and Prevention, 39 (6), 1088-1096.
Hughes, M. C., Patrick, D. L., Hannon, P. A., Harris, J. R. & Ghosh, D. L., 2011.
Understanding the decision-making process for health promotion programming at
small to midsized businesses. Health Promotion Practice, 12 (4), 512-521.
Hunter, M. S., 1990. Psychological and somatic experience of the menopause: a prospective
study [corrected]. Psychosomatic Medicine, 52 (3), 357-67.
Hush, J. M., Michaleff, Z., Maher, C. G. & Refshauge, K., 2009. Individual, physical and
psychological risk factors for neck pain in Australian office workers: A 1-year
longitudinal study. European Spine Journal, 18 (10), 1532-1540.
Ijmker, S., Blatter, B. M., Van der Beek, A., Van Mechelen, W. & Bongers, P. M., 2006.
Prospective research on musculoskeletal disorders in office workers ( PROMO): Study
protocol. BMC Musculoskeletal Disorders, 7 (55).
ILO-OSH., 2001. Guidelines on occupational safety and health management systems.
International Labour Office, Geneva. www.ac.infn.it/sicurezza/ILO%202001.pdf
(Accessed: April 15, 2011).
Isabel, C. & Rodríguez, R., 2012. Participatory ergonomics and design of technical assistance.
Work: A Journal of Prevention, Assessment and Rehabilitation, 41, 804-808.
Isla Diaz, R. & Diaz Cabrera, D., 1997. Safety climate and attitude as evaluation measures of
organizational safety. Accident Analysis & Prevention, 29 (5), 643-650.
Jehn, K. A. & Bezrukova, K., 2004. A field study of group diversity, workgroup context, and
performance. Journal of Organizational Behavior, 25 (6), 703-729.
Johnson, S. E., 2007. The predictive validity of safety climate. Journal of Safety Research, 38
(5), 511-521.
Joling, C. I., Blatter, B. M., Ybema, J. F. & Bongers, P. M., 2008. Can favorable psychosocial
work conditions and high work dedication protect against the occurrence of work-
related musculoskeletal disorders? Scandinavian Journal of Work, Environment &
Health, 345-355.
Jones, D., 2011. Dow Jones Industrial Average.
http://finance.yahoo.com/charts?s=^DJI#symbol=^dji;range=20040430,20120511;co
mpare=;indicator=volume;charttype=area;crosshair=on;ohlcvalues=0;logscale=off;sou
rce=undefined (Accessed: April 15, 2011).

233
Karasek, R., Brisson, C., Kawakami, N., Houtman, I., Bongers, P. & Amick, B., 1998. The
Job Content Questionnaire (JCQ): An instrument for internationally comparative
assessments of psychosocial job characteristics. Journal of Occupational Health
Psychology, 3 (4), 322-355.
Karhu, O., Kansi, P. & Kuorinka, I., 1977. Correcting working postures in industry: A
practical method for analysis. Applied Ergonomics, 8 (4), 199-201.
King, T. K., Marcus, B. H., Pinto, B. M., Emmons, K. M. & Abrams, D. B., 1996. Cognitive-
behavioral mediator of changing mutiple behaviors: Smoking and a sedentary
lifestyle. Preventive Medicine, 25 (0107), 684-691.
Krause, T. R., Seymour, K. J. & Sloat, K. C. M., 1999. Long-term evaluation of behavior-
based method for improving safety performance: A meta-analysis of 73 interrupted
time-seris replications. Safety Science, 32, 1-18.
Kumar, S., 2008a. Biomechanics in ergonomics. CRC Press,Taylor & Francis group, New
York.
Kumar, S., 2008b. Theories of occupational musculoskeletal injury causation. In: Kumar, S.
(ed.) Biomechanics in Ergonomics. 2nd ed.: CRC press, Taylor & Francis group, New
York..
Kuorinka, I., Jonsson, B., Kilbom, A., Vinterberg, H., Biering-Sorensen, F., Andersson, G. &
Jorgensen, K., 1987. Standardised Nordic questionnaires for the analysis of
musculoskeletal symptoms. Applied Ergonomics, 18 (3), 233-237.
Laitinen, H., Saari, J. & Kuusela, J., 1997. Innitiating an innovative change process for
improved working conditions and ergonomics with participation and performance
feedback : A case study in an engineering workshop. International Journal of
Industrial Ergonomics, 19, 299-305.
Lazovich, D., Murray, D. M., Brosseau, L. M., Parker, D. L., Milton, F. T. & Dugan, S. K.,
2002. Sample size considerations for studies of intervention efficacy in the
occupational setting. The Annals of Occupational Hygiene, 46 (2), 219-227.
Lee, G. K. L. & Chan, C. C. H., 2003. Use of dictionary of occupational titles (DOT) on
formwork carpentry - A comparison between the United States and Hong Kong.
Work: A Journal of Prevention, Assessment and Rehabilitation, 20 (2), 103-110.
Lee, J. & Chia, K. S., 1993. Estimation of prevalence rate ratios for cross sectional data: an
example in occupational epidemiology. British Journal of Industrial Medicine, 50,
861-864.
234
Levesque, D. A., Prochaska, J. M., Prochaska, J. O., Dewart, S. R., Hamby, L. S. & Weeks,
W. B., 2001. Organizational stages and processes of change for continuous quality
improvement in health care. Consulting Psychology Journal: Practice and Research,
53 (3), 139-153.
Liang, K. Y. & Zeger, S. L., 1986. Longitudinal data analysis using generalized linear
models. Biometrika, 73 (1), 13-22.
Lingard, H. & Rowlinson, S., 1997. Bahavior-based safety management in Hong kong's
construction industry. Journal of Safety Research, 28 (4), 243-255.
Lu, H., Barriball, K. L., Zhang, X. & While, A. E., 2012. Job satisfaction among hospital
nurses revisited: A systematic review. International Journal of Nursing Studies, 49
(8), 1017-1038.
Macdonald, W. & Evans, O., 2006. Research on the prevention of work related
musculoskeletal disorders : Stage 1 - Literature review. Australian Safety
and Compensation Council, Canberra.
http://www.safeworkaustralia.gov.au/sites/SWA/about/Publications/Documents/512/R
esearch_Prevention_Workrelated_Musculoskeletal_Disorders_Stage_1_Literature_rev
iew.pdf (Accessed: April 15, 2011).
Macdonald, W., Evans, O., Armstrong, R., 2007. Research on the prevention of work-related
musculoskeletal disorders: Stage 2 - A study of a small sample of workplaces in high
risk industries. La Trobe University, Melbourne, Victoria.
Maniadakis, N. & Gray, A., 2000. The economic burden of back pain in the UK. Pain, 84 (1),
95-103.
Marchand, A., Demers, A. & Durand, P., 2005. Do occupation and work conditions really
matter? A longitudinal analysis of psychological distress experiences among Canadian
workers. Sociology of Health & Illness, 27 (5), 602-627.
Marine, A., Ruotsalainen, J., Serra, C. & Verbeek, J., 2009. Preventing occupational stress in
healthcare workers (reviews). Cochrane Database Systematic Review, 1.
Mathiassen, S. E., 2006. Diversity and variation in biomechanical exposure: why is it, and
why would we like to know? Applied Ergonomics, 37, 419-427.
Matthews, S., Hertzman, C., Ostry, A. & Power, C., 1998. Gender, work roles and
psychosocial work characteristics as determinants of health. Social Science &
Medicine, 46 (11), 1417-1424.
McAtamney, L. & Corlett, E. N., 1993. RULA: a survey method for the investigation of
work-related upper limb disorders. Applied Ergonomics, 24 (2), 91-99.

235
McCarney, R., Warner, J., Iliffe, S., van Haselen, R., Griffin, M. & Fisher, P., 2007. The
hawthorne effect: A randomised, controlled trial. BMC Medical Research
Methodology, 7 (1), 30.
Miller, A. R., Treiman, D. J., Cain, P. S. & Roos, P. A., 1980. Use of dictionary of
occupational titles outside the U.S employment service. In: Committee on
Occupational Classification Analysis Assembly of Behavioral and Social Sciences
National Research Council. (ed.) Work, jobs, and occupations: A critical review of the
dictionary of occupational titles. The National Academies Press, Washington D.C.
http://www.nap.edu/openbook.php?record_id=92&page=45 (Accessed: Juli 31, 2010).
Morse, T., Dillon, C., Weber, J., Warren, N., Bruneau, H. & Fu R., 2004. Prevalence and
reporting of occupational illness by company size: Population trends and regulatory
implications. American Journal of Industrial Medicine, 45 (4), 361-370.
Muntaner, C., Borrell, C., Vanroelen, C., Chung, H., Benach, J., Kim, I. H. & Ng, E., 2010.
Employment relations, social class and health: A review and analysis of conceptual
and measurement alternatives. Social Science & Medicine, 71 (12), 2130-2140.
National Academic Science Commitee on Occupational Classification and Analysis, 2003.
Dictionary of occupational titles (DOT). 4th (Rev), Washington DC.
http://www.occupationalinfo.org/ (Accessed: Juli 31, 2010).
National Research Council, 2001. Musculoskeletal disorders and the workplace: Low back
and upper extremities. National Academy Press, Washington, D.C.
www.nap.edu/books/0309072840/html/ (Accessed: August 7, 2010).
Neal, A. & Griffin, M. A., 2006. A study of the lagged relationships among safety climate,
safety motivation, safety behavior, and accidents at the individual and group levels.
Journal of Applied Psychology, 91 (4), 946-953.
Nierkens, V., Stronks, K. & De Vries, H., 2006. Attitudes, social influences and self-efficacy
expectations across different motivational stages among immigrant smokers:
replication of the O pattern. Preventive Medicine, 43, 306-311.
Nordander, C., Ohlsson, K., Ãkesson, I., Arvidsson, I., Balogh, I., Hansson, G.-Ã.,
Stromberg, U., Rittner, R. & Skerfving, S., 2009. Risk of musculoskeletal disorders
among females and males in repetitive/constrained work. Ergonomics, 52 (10), 1226 -
1239.
Opsteegh, L., Soer, R., Reinders-Messelink, H. A., Reneman, M. F. & van der Sluis, C. K.,
2010. Validity of the Dictionary of Occupational Titles for Assessing Upper Extremity
Work Demands. PLoS ONE [Online], 5 (12), e15158
http://dx.doi.org/10.1371%2Fjournal.pone.0015158 (Accessed: January 20, 2009).

236
Ozturk, N. & Esin, M. N., 2011. Investigation of musculoskeletal symptoms and ergonomic
risk factors among female sewing machine operators in Turkey. International Journal
of Industrial Ergonomics, 41 (6), 585-591.
Pallant, J., 2011. SPSS Survival Manual.4th ed, Allen & Unwin, Crows Nest, NSW.
Paoli, P. & Merllie, D. 2001. Third European survey on working conditions 2000. European
Foundation for the Improvement of Living and Working Conditions. Office for
Official Publications of the European Communities, Luxembourg: p. 31-32.
www.eurofound.europa.eu/pubdocs/2001/21/en/1/ef0121en.pdf (Accessed: April 20,
2011).
Pascual, S. A. & Naqvi, S., 2008. An investigation of ergonomics analysis tools used in
industry in the identification of work-related musculoskeletal disorders. International
Journal of Occupational Safety and Ergonomics, 14 (2), 237-245.
Podniece, Z. 2008. Work-related musculoskeletal disorders: Prevention report. European
Agency for Safety and Health at Work. Luxembourg.
http://osha.europa.eu/en/publications/reports/en_TE8107132ENC.pdf (Accessed:
January 2, 2011).
Pousette, A., Larsson, S. & Törner, M., 2008. Safety climate cross-validation, strength and
prediction of safety behaviour. Safety Science, 46 (3), 398-404.
Pransky, G., Snyder, T., Dembe, A. & Himmelstein, J. A. Y., 1999. Under-reporting of work-
related disorders in the workplace: A case study and review of the literature.
Ergonomics, 42 (1), 171-182.
Prentice, R. L., 1988. Correlated binary regression with covariates specific to each binary
observation. Biometrics, 44, 1033-1048.
Probst, T. M. & Brubaker, T. L., 2001. The effects of job insecurity on employee safety
outcomes: Cross-sectional and longitudinal explorations. Journal of Occupational
Health Psychology, 6 (2), 139-159.
Prochaska, J. M., 2007. The transtheoretical model applied to the community and the
workplace. Journal of Health Psychology, 12 (1), 198-200.
Prochaska, J. M., Prochaska, J. O. & Levesque, D. A., 2001. A transtheoretical approach to
changing organizations. Administrative and Policy in Mental Health, 28 (4), 247-261.
Prochaska, J. O. & DiClemente, C. C., 1982. Transtheoretical therapy: Toward a more
integrative model of change. Psychotherapy: Theory Research and Practice, 19, 276-
288.

237
Prochaska, J. O. & DiClemente, C. C., 1983. Stage and processes of self-change of smoking:
Toward an integrative model of change. Journal of Consulting and Clinical
Psychology, 51 (3), 390-395.
Prochaska, J. O., DiClemente, C. C., Velicer, W. F. & Rossi, J. S., 1993. Standardized,
indiviualized, interactive and personalized self-help program for smoking cessation.
Health Psychology, 12 (5), 399-405.
Prochaska, J. O. & Norcross, J. C., 2007. Systems of Psychotherapy, A transtheoretical
analysis. 6th ed, Thomson Brooks/Cole, Belmont.
Prochaska, J. O., Wright J. A. & Velicer W. F., 2008. Evaluating Theories of Health Behavior
Change: A Hierarchy of Criteria Applied to the Transtheoretical Model. Applied
Psychology: An International Review, 57 (4), 561-588.
Punnett, L., 1996. Adjusting for the healthy worker selection effect in cross-sectional studies.
International Journal of Epidemiology, 25 (5), 1068-1076.
Punnett, L. & Wegman, D. H., 2004. Work-related musculoskeletal disorders: The
epidemiologic evidence and the debate. Journal of Electromyography and
Kinesiology, (14), 13-23.
Quine, S., 1998. Sampling in non-numerical research. In: Kerr, C., Taylor, R. & Heard, G.
(eds.) Handbook of public health methods. The McGraw-Hill Companies Inc, Sydney.
Quintlan, K. B. & McCaul, K. D., 2000. Matched and mismatched intervention with young
adult smokers: Testing a stage teory. Health Psychology, 19 (2), 165-171.
Rakowski, W., Ehrich, B., Goldstein, M. G., Rmer, B. K., Pearman, D. N., Clark, M. A.,
Velicer, W. F. & Woolverton, H., 1998. Increasing mammography among women
aged 40-74 by use of a stage-matched tailored intervention. Preventive Medicine, 27,
748-756.
Ray, P. S., Bishop, P. A. & Wang, M. Q., 1997. Efficacy of the components of a behaviour
safety program. International Journal of Industrial Ergonomics, 19, 19-29.
Ray, P. S., Purswell, J. L. & Bowen, D., 1993. Behavior safety program: Creating a new
corporate culture. International Journal of Industrial Ergonomics, 12, 193-198.
Rios, R. & Zautra, A. J., 2011. Socioeconomic disparities in pain: The role of economic
hardship and daily financial worry. Health Psychology, 30 (1), 58-66.
Rivilis, I., Van Eerd, D., Cullen, K., Cole, D. C., Irvin, E., Tyson, J. & Mahood, Q., 2008.
Effectiveness of participatory ergonomic interventions on health outcomes: A
systematic review. Applied Ergonomics, 39 (3), 342-358.
238
Roja, Z., Kalkis, V., Vain, A., Kalkis, H. & Eglite, M., 2006. Assessment of skeletal muscle
fatigue of road maintenance workers based on heart rate monitoring and
myotonometry. Journal of Occupational Medicine and Toxicology, 1 (1), 20.
Roquelaure, Y., Catherine, H. A., Leclerc, A., Touranchet, A., Sauteron, M., Melchior, M.,
Imbernon, E. & Goldberg, M., 2006. Epidemiologic surveillance of upper-extremity
musculoskeletal disorders in the working population. Arthritis & Rheumatism
(Arthritis Care & Research), 55 (5), 765-778.
Rosen, C. S., 2000. Is the sequencing of stage of change process by stage consistent across
health problems? A meta analysis. Health Psychology, 19 (6), 593-604.
Ryan, C. G., Grant, P. M., Dall, P. M., Gray, H., Newton, M. & M.H., G., 2009. Individual
with chronic low back pain have a lower level, and an altered pattern, of physical
activity compared with matched controls: An observational study. Australian Journal
of Physiotherapy, 55, 53-58.
Safe Work Australia. 2011. National hazard exposure worker surveillance: Exposure to
biomechanical demands, pain and fatigue symptoms and the provision of controls in
Australia workplaces. Canberra. Safe Work Australia
http://www.safeworkaustralia.gov.au/swa/AboutUs/Publications/2008ResearchReport
s.htm. (Accessed: January 20, 2009).
Safe Work Australia. 2012. Compendium of worker's compensation statistics Australia
2009-10. Canberra. Safe Work Australia,:
http://www.safeworkaustralia.gov.au/sites/SWA/AboutSafeWorkAustralia/WhatWeD
o/Publications/Documents/661/Compendium%202009_10%20report.pdf. (Accessed:
January 20, 2009).
Schneider, E. & Irastorza, X. 2010. OSH in figures:Work-related musculoskeletal disorders in
the EU - Facts and figures. Publications Office of the European Union, Luxembourg
European Agency for Safety and Health at Work (EU-OSHA).
Scuffham, A. M., Legg, S. J., Firth, E. C. & Stevenson, M. A., 2010. Prevalence and risk
factors associated with musculoskeletal discomfort in New Zealand veterinarians.
Applied Ergonomics, 41 (3), 444-453.
Senge, P., Kleiner, A., Roberts, C., Ross, R., Roth, G. & Smith, B., 2007. The dance of
change : The challenges of sustaining momentum in learning organisations.,
Nicholoas Brealey Publishing Limited, London.
Seo, D.-C., Torabi, M. R., Blair, E. H. & Ellis, N. T., 2004. A cross-validation of safety
climate scale using confirmatory factor analytic approach. Journal of Safety Research,
35 (4), 427-445.

239
Shaw, K., Haslam, C. & Haslam, R. 2007. A staged approach to reducing musculoskeletal
disorders (MSDs) in the workplace : A long term follow-up. Leicestershire. Health and
Safety Executive, Department of Human Sciences, Loughborough University.
www.hse.gov.uk/research/rrpdf/rr545.pdf (Accessed: October 20, 2008).
Silverstein, M., 2008. Meeting the challenges of an aging workforce. American Journal of
Industrial Medicine, 51, 269-280.
Smith, D. R., Leggat, P. A. & Speare, R., 2009. Musculoskeletal disorders and psychosocial
risk factors among veterinarians in Queensland, Australia. Australian Veterinary
Journal, 87 (7), 260-265.
Smith, D. R., Mihashi, M., Adachi, Y., Koga, H. & Ishitake, T., 2006. A detailed analysis of
musculoskeletal disorder risk factors among Japanese nurses. Journal of Safety
Research, 37, 195-200.
Smith, J. P. & Tran, G. Q., 2007. Does negative affect increase change readiness among
college hazardus drinkers? Addictive Behaviors, 32, 2281-2285.
Straker, L., Burgess-Limerick, R., Pollock, C. & Egeskov, R., 2004. A randomized and
controlled trial of a participative ergonomics intervention to reduce injuries associated
with manual tasks: Physical risk and legislative compliance. Ergonomics, 47 (2), 166-
188.
Torres, Y., Rodriguez, Y. & Vina, S., 2011. Preventing work-related musculoskeletal disorder
in Cuba, an indusrially developing country. Work: A Journal of Prevention,
Assessment and Rehabilitation, 38 (3), 301-306.
Tourangeau, R., 2004. Survey Research and Societal Change. Annual Review of Psychology,
55 (1), 775-801.
Trinkoff, A. M., Le, R., Geiger-Brown, J., Lipscomb, J. & Lang, G., 2006. Longitudinal
relationship of work hours, mandatory overtime, and on-call to musculoskeletal
problems in nurses. American Journal of Industrial Medicine, 49 (11), 964-971.
Torp, S., Riise, T. & Moen, B. E., 1999. How the psychosocial work environment of motor
vehicle mechanics may influence coping with musculoskeletal symptoms. Work &
Stress, 13 (3), 193-203.
Torp, S., Riise, T. & Moen, B. E., 2001. The impact of social and organizational factors on
workers' coping with musculoskeletal symptoms. Physical Therapy, 81 (7), 1328-
1338.
U.S Bureau Of Labor Statistics, 2007. Occupational injuries and illnesses: counts, rates, and
characteristics 2004. Injuries, Illnesses and Fatalities. U.S. Bureau of Labor Statistics
OCWC/OSH Washington DC. http://www.bls.gov/iif/ . (Accessed: January 20,
2010).
240
Ukoumunne, O. C. & Thompson, S. G., 2001. Analysis of cluster randomized trials with
repeated cross-sectional binary measurements. Statistics in Medicine, 20 (3), 417-433.
Urlings, I. J. M., Nuboer, I. D. & Dul, J., 1990. A method for changing the attitudes and
behaviour of management and employees to stimulate the implementation of
ergonomic improvements. Ergonomics, 33 (5), 629-637.
Verbeek, J. H., Martimo, K. P., Karppinen, J., Kuijer, P., Viikari-Juntura, E. & Takala, E. P.,
2011. Manual material handling advice and assistive devices for preventing and
treating back pain in workers. Cochrane Database Systematic Review, 6.
Village, J. & Morrison, J. B., 2008. Whole body vibration In: Kumar, S. (ed.) Biomechanics
in Ergonomics. 2nd ed.: Taylor & Francis group.
Village, J. & Ostry, A., 2010. Assessing attitudes, beliefs and readiness for musculoskeletal
injury prevention in the construction industry. Applied Ergonomics, 41 (6), 771-778.
Vinodkumar, M. N. & Bhasi, M., 2009. Safety climate factors and its relationship with
accidents and personal attributes in the chemical industry. Safety Science, 47, 659-
667.
Walters, T., Collins, J., Galinsky, T. & Caruso, C., 2006. NIOSH research efforts to prevent
musculoskeletal disorders in the healthcare industry. Orthopaedic Nursing, 25 (6),
380-389.
Warr, P., Cook, J. & Wall, T., 1979. Scales for the measurement of some work attitudes and
aspects of psychological wellbeing. Journal of Occupational Psychology, 52, 129-148.
Waters, T. R., Putz-Anderson, V., Garg, A. & Fine, L. J., 1993. Revised NIOSH equation for
the design and evaluation of manual lifting tasks. Ergonomics, 36, 749-776.
Weinstein, N. D., Rothman, A. J. & Sutton, S. R., 1998. Stage theories of health behavior:
Conceptual and methodological issues. Health Psychology, 17, 290-299.
Wells, R., Moore, A., Potvin, J. & et al., 1994. Assessment of risk factor for development of
work-related musculoskeletal disorders (RSI). Applied Ergonomics, 25, 157-164.
Wells, R., Norman, R., Frazer, M., Laing, A., Cole, D. & Kerr, M., 2003. Participative
ergonomic blueprint [Online]. Toronto: Institute for Work & Health. Available:
http://www.iwh.on.ca/system/files/documents/pe_blueprint_2003.pdf (Accessed:
January 20, 2009).
Whysall, Z., Haslam, C. & Haslam, R. 2005. A staged approach to reducing musculoskeletal
disorders (MSDs) in the workplace. Health and Safety Ergonomics Unit, Department
of Human Sciences, Loughborough University, Loughborough, Leicestershire
http://www.hse.gov.uk/research/rrpdf/rr379.pdf (Accessed: October 20, 2008).
241
Whysall, Z., Haslam, C. & Haslam, R., 2006. A stage of change approach to reducing
occupational ill health. Preventive Medicine, 43, 422–428.
Whysall, Z. J., Haslam, C. & Haslam, R. A., 2007. Developing the stage of change approach
for the reduction of work-rlate muculoskeletal disorders. Journal Health Psychology,
12, 184-197.
Widanarko, B., Legg, S., Stevenson, M., Devereux, J., Eng, A., Mannetje, A., Cheng, S.,
Douwes, J., Ellison-Loschmann, L., McLean, D. & Pearce, N., 2011. Prevalence of
musculoskeletal symptoms in relation to gender, age, and occupational/industrial
group. International Journal of Industrial Ergonomics, 41, 561-572.
Widanarko, B., Legg, S., Stevenson, M. & Devereux, J., 2012a. Interaction between physical,
psychosocial, and organisational work factors for low back symptoms and its
consequences amongst Indonesian coal mining workers. Work: A Journal of
Prevention, Assessment and Rehabilitation, 41, 6112-6119.
Widanarko B., Legg, S., Stevenson, M., Devereux, J., Eng, A., Mannetje, A., Cheng, S. &
Pearce, N., 2012b. Gender differences in work-related risk factors associated with low
back symptoms. Ergonomics, 55 (3), 327-342.
Wong, E. Y., Ray, R., Gao, D. L., Wernli, K. J., Li, W., Fitzgibbons, E. D., Camp, J. E.,
Heagerty, P. J., De Roos, A. J., Holt, V. L., Thomas, D. B. & Checkoway, H., 2010.
Physical activity, physical exertion, and miscarriage risk in women textile workers in
Shanghai, China. American Journal of Industrial Medicine, 53, 497-505.
WorkCover SA. 2007. Statistical Review part 1, 2006-07. www.workcover.com. (Accessed:
January 20, 2009).
WorkCover SA. 2010. Statistical review part 1, 2008-09. Adelaide. WorkCover SA: 20.
http://www.workcover.com/site/home.aspx. (Accessed: January 20, 2009).
Zeger, S. L. & Liang, K.-Y., 1986. Longitudinal data analysis for discrete and continuous
outcomes. Biometrics, 42, 121-130.
Zocchetti, C., Consonn, D. & Bertazzi, P. A., 1997. Relationship between Prevalence rate
ratio and odd ratios in cross sectional studies. International Journal of Epidemiology,
26, 220-223
Zohar, D., 1980. Safety climate in industrial organizations: Theoretical and applied
implications. Journal of Applied Psychology, 65, 96-102.

242
APPENDICES
APPENDIX 1. Questionnaires
Appendix 1a. Demographic Information
GENERAL INFORMATION
1. Age:...........years
2. Position held:………………………………………………………………………
3. Length of time with current (a) employer:…………… (b) position:……………………….
4. Hours worked per week:…………….

243
Appendix 1b. Stage of Change Assessment Surveys
EMPLOYEE STAGE OF CHANGE ASSESSMENT
1. Are you concerned about developing musculoskeletal problems from your work? Y/ N
If your answer is yes go to number 2
2. Do you think changes should be made to reduce the risk of musculoskeletal problems from
your work in the next few months? Y / N
If your answer is yes go to number 3
3. Are you doing or have you done anything to reduce the risk? Y / N
(Circle as appropriate)
If your answer is yes go to number 4
4. How long ago did you make these changes?…………………………….. weeks / months /
years (Circle as appropriate)
5. If more than 6 months ago, do you intend to do anything more? Y / N
If your answer is No go back to number 1
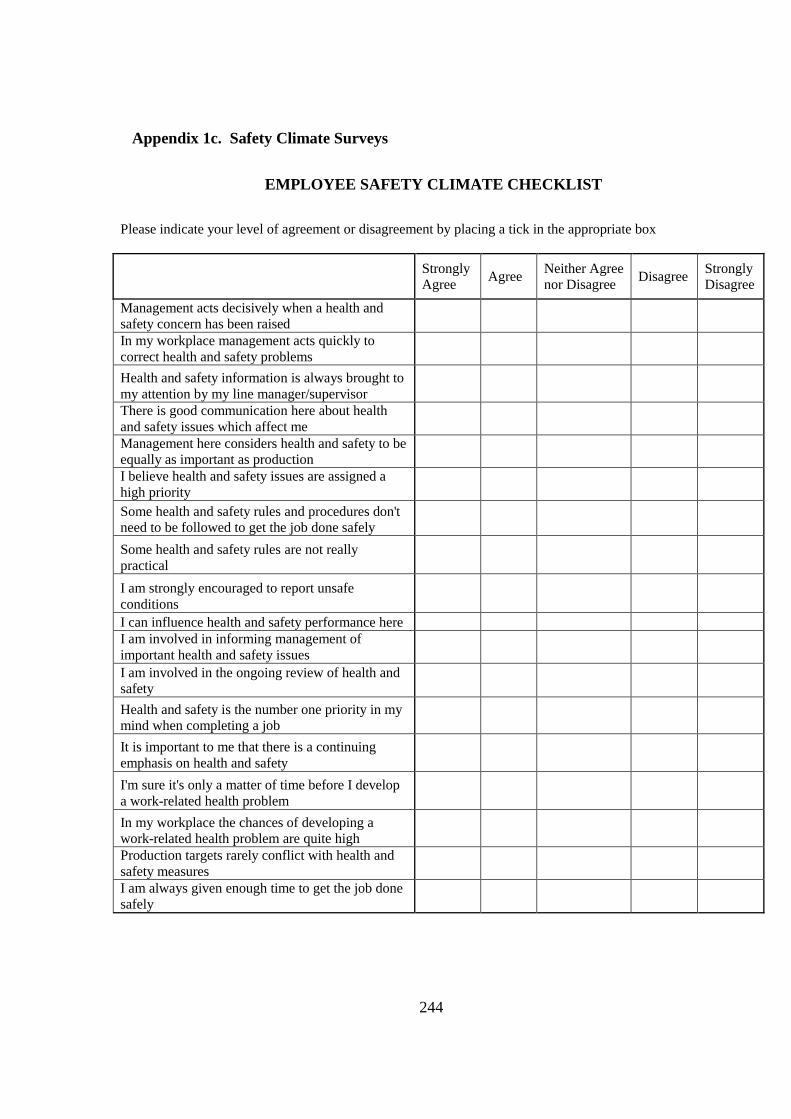
244
Appendix 1c. Safety Climate Surveys
EMPLOYEE SAFETY CLIMATE CHECKLIST
Please indicate your level of agreement or disagreement by placing a tick in the appropriate box
Strongly
Agree Agree
Neither Agree
nor Disagree Disagree
Strongly
Disagree
Management acts decisively when a health and
safety concern has been raised
In my workplace management acts quickly to
correct health and safety problems
Health and safety information is always brought to
my attention by my line manager/supervisor
There is good communication here about health
and safety issues which affect me
Management here considers health and safety to be
equally as important as production
I believe health and safety issues are assigned a
high priority
Some health and safety rules and procedures don't
need to be followed to get the job done safely
Some health and safety rules are not really
practical
I am strongly encouraged to report unsafe
conditions
I can influence health and safety performance here
I am involved in informing management of
important health and safety issues
I am involved in the ongoing review of health and
safety
Health and safety is the number one priority in my
mind when completing a job
It is important to me that there is a continuing
emphasis on health and safety
I'm sure it's only a matter of time before I develop
a work-related health problem
In my workplace the chances of developing a
work-related health problem are quite high
Production targets rarely conflict with health and
safety measures
I am always given enough time to get the job done
safely
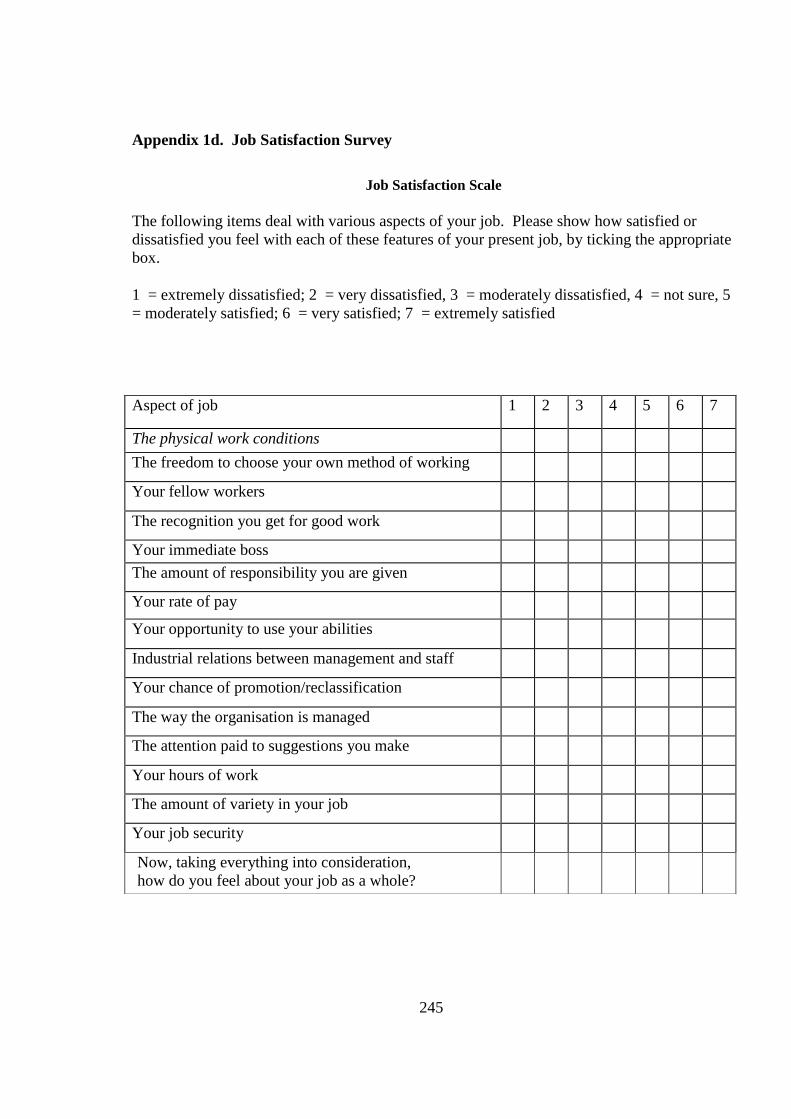
245
Appendix 1d. Job Satisfaction Survey
Job Satisfaction Scale
The following items deal with various aspects of your job. Please show how satisfied or
dissatisfied you feel with each of these features of your present job, by ticking the appropriate
box.
1 = extremely dissatisfied; 2 = very dissatisfied, 3 = moderately dissatisfied, 4 = not sure, 5
= moderately satisfied; 6 = very satisfied; 7 = extremely satisfied
Aspect of job 1 2 3 4 5 6 7
The physical work conditions
The freedom to choose your own method of working
5.2 (1.3) 5.6 (1.
Your fellow workers 5.3 (1.2) 5.4 (1.2)
The recognition you get for good work 4.2 (1.7) 4.5 (1.6)
Your immediate boss 4.8 (1.8) 5.2 (1.6)
The amount of responsibility you are given
Your rate of pay 4.0 (1.7) 4.3 (1.6)
Your opportunity to use your abilities 4.5 (1.6) 5.0 (1.4)
Industrial relations between management and staff 3.6 (1.5) 4.3 (1.5)
Your chance of promotion/reclassification 3.4 (1.6) 3.4 (1.6)
The way the organisation is managed
The attention paid to suggestions you make
Your hours of work 4.2 (1.7) 5.1 (1.4)
The amount of variety in your job 5.0 (1.4) 5.5 (1.2)
Your job security 4.4 (1.7) 4.5 (1.8)
Now, taking everything into consideration,
how do you feel about your job as a whole?
you feel about your job as a whole? 4.6 (1.4) 5.0 (1.2)

246
Appendix 1e. Pain and Discomfort Rating Survey
PAIN/DISCOMFORT RATING
1. Have you felt any pain/discomfort in the last 7 days? Y / N
2. If yes, please mark a cross on the diagram below where you have felt pain/discomfort in the
last 7 days.
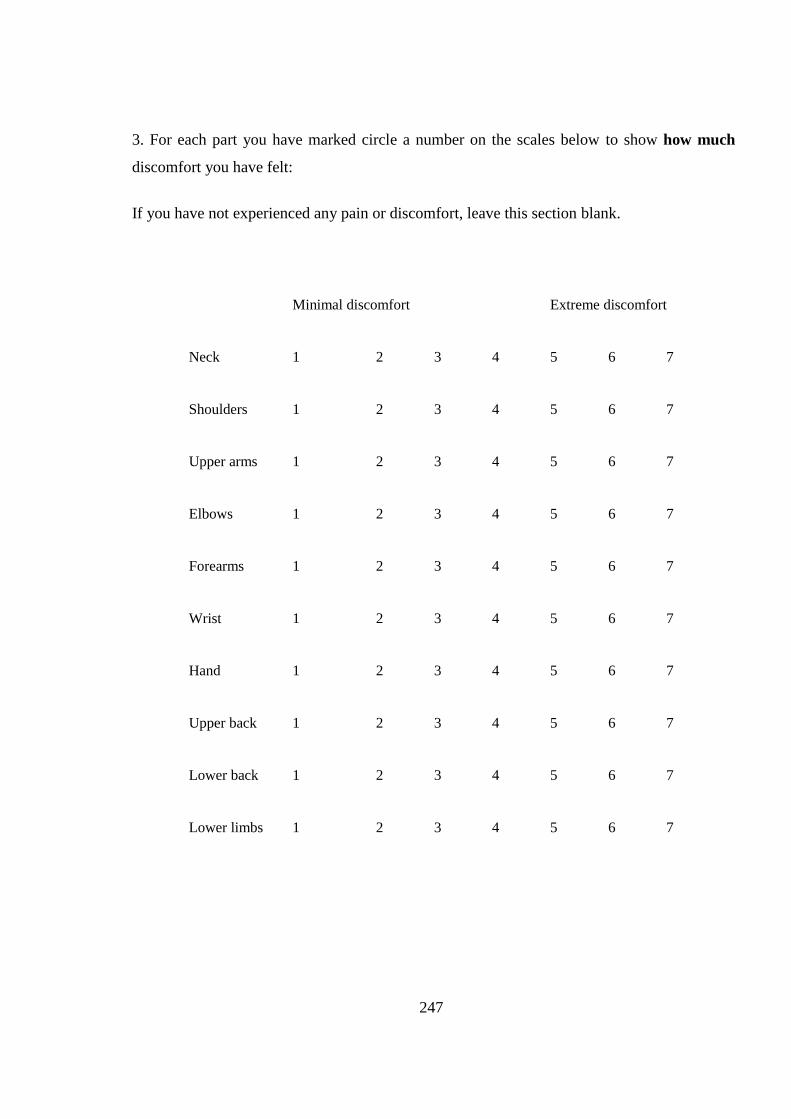
247
3. For each part you have marked circle a number on the scales below to show how much
discomfort you have felt:
If you have not experienced any pain or discomfort, leave this section blank.
Minimal discomfort
Extreme discomfort
Neck
1 2 3 4 5 6 7
Shoulders
1 2 3 4 5 6 7
Upper arms
1 2 3 4 5 6 7
Elbows
1 2 3 4 5 6 7
Forearms
1 2 3 4 5 6 7
Wrist
1 2 3 4 5 6 7
Hand
1 2 3 4 5 6 7
Upper back
1 2 3 4 5 6 7
Lower back
1 2 3 4 5 6 7
Lower limbs 1 2 3 4 5 6 7
248
APPENDIX 2. Information Sheet, Consent Form and Independent
Complaints Form
Appendix 2a. Information Sheet
INFORMATION SHEET
EMPLOYEES
Improving Enterprise-Level Interventions Designed to Reduce Musculoskeletal
Disorders in the Workplace
The University of Adelaide is conducting a study looking at attitudes towards work-related
musculoskeletal problems and their management.
The term ‘musculoskeletal problems’ refers to a range of problems affecting the muscles,
tendons, and other supporting structures of the body – that is, those affecting the arms, wrists,
back, neck, shoulders, legs and feet. Examples include problems caused by repetitive tasks,
awkward postures or movements, and application of high force (e.g. lifting, pushing, and
pulling). Please DO NOT include injuries that are the direct result of an accident, e.g. a fall or
being struck by an object or caught in equipment.
The survey should take approximately 10 - 20 minutes, consisting of demographic questions,
a Stage of Change Assessment (assessing attitudes to musculoskeletal problems), a Safety
Climate checklist, a Job Satisfaction survey and a Pain and Discomfort Rating. The
Participants will not be identifiable, and personal details will remain confidential.
This study should improve the evidence relating to MSD interventions with potential
application in the wider industry.
If you would like further information or need assistance, please contact: Discipline of Public
Health, University of Adelaide. Ph: 8313 1043
249
Appendix 2b. Consent Form
Discipline of Public Health
CONSENT TO PARTICIPATE IN STUDY
1 ………………………………………………………………… (Please print name)
consent to take part in the University of Adelaide research project called:
Improving Enterprise-Level Interventions Designed to Reduce Musculoskeletal Disorders in
the Workplace
2. I acknowledge that I have read and understood the Information Sheet called:
Surveys: Improving Enterprise-Level Interventions Designed to Reduce Musculoskeletal
Disorders in the Workplace. Even though this study aims to improve the occupational health
and safety of workers, I have been informed that I may not gain any direct benefit. I
understand that information from interviews will be used for research by the University team.
I have been given the right to refuse any information I don’t want to give.
I have the right to withdraw from this study at any time. I understand and have been told that
information from the surveys will not be used by anyone except members of the University
study team and individuals will not be identifiable in the final report. I’m aware that a copy
of this form will be stored by the Discipline of Public Health at the University of Adelaide. I
acknowledge that the above information was verbally presented to me - I understood it and
had time to query anything I didn’t understand.
……………………………………………………………………………………………
(Please sign here) (Please print date)
Witness Position Date
A/Prof.. Dino Pisaniello
Discipline of Public Health, University of Adelaide - Level 9, Tower Building, 10 Pulteney Street,
Mail Drop 207 Phone: 8303 3571

250
Appendix 2c. Independent Complaints Form
INDEPENDENT COMPLAINTS FORM
THE UNIVERSITY OF ADELAIDE HUMAN RESEARCH ETHICS COMMITTEE
Document for people who are subjects in a research project:
CONTACTS FOR INFORMATION ON PROJECT AND INDEPENDENT COMPLAINTS PROCEDURE
The Human Research Ethics Committee is obliged to monitor approved research projects. In conjunction with
other forms of monitoring it is necessary to provide an independent and confidential reporting mechanism to
assure quality assurance of the institutional ethics committee system. This is done by providing research
subjects with an additional avenue for raising concerns regarding the conduct of any research in which they are
involved.
The following study has been reviewed and approved by the University of Adelaide Human Research Ethics
Committee:
Project title: Improving Enterprise-Level Interventions Designed to Reduce Musculoskeletal Disorders in
the Workplace
1. If you have questions or problems associated with the practical aspects of your participation in the
project, or wish to raise a concern or complaint about the project, then you should consult the project
coordinator:
Name: Dr Dino Pisaniello, Discipline of Public Health, University of Adelaide
Telephone: 8303 3571
2. If you wish to discuss with an independent person matters related to
making a complaint, or
raising concerns on the conduct of the project, or
the University policy on research involving human subjects, or your rights as a
participant
Contact the Human Research Ethics Committee’s Secretary on phone (08) 8303 6028

251
Appendix 2d. Ethics Approval – Baseline Survey
252
Appendix 2e. Ethics Approval – Follow-Up Survey

253
APPENDIX 3. Confirmatory Factor Analysis and Cronbach Alpha of Job
Satisfaction data.
Appendix 3a. Cronbach’s Alpha for Job Satisfaction data:
For Job Satisfaction, Cronbach’s alpha is above .8, which is good. Also, individual alphas
indicate that removing each item will not increase alpha substantially, which means that there
is no item that reduces the reliability of the scale as a whole. Reliability is good.
Test scale = mean (unstandardized items)
Average
Item-test item-rest inter-item
Item | Obs Sign correlation correlation covariance alpha
Js1 | 240 + 0.4946 0.4199 .6974466 0.8891
Js2 | 240 + 0.6487 0.5819 .6613619 0.8829
Js3 | 239 + 0.3596 0.2877 .7247382 0.8928
Js4 | 240 + 0.7470 0.6840 .6237118 0.8782
Js5 | 240 + 0.7181 0.6570 .6408897 0.8796
Js6 | 240 + 0.6856 0.6372 .6729898 0.8819
Js7 | 239 + 0.4676 0.3556 .6844472 0.8948
Js8 | 240 + 0.6805 0.6181 .6552381 0.8815
Js9 | 240 + 0.7128 0.6538 .6466725 0.8799
Js10 | 238 + 0.7646 0.7088 .6281252 0.8774
Js11 | 239 + 0.7832 0.7314 .6228157 0.8761
Js12 | 239 + 0.7305 0.6779 .6484968 0.8792
Js13 | 240 + 0.4389 0.3541 .7042334 0.8917
Js14 | 239 + 0.6293 0.5571 .6639625 0.8842
Js15 | 240 + 0.5583 0.4838 .6816096 0.8868
Test scale | .6637809 0.8908

254
Appendix 3b. Confirmatory Factor Analysis
A confirmatory factor analysis was run on the job satisfaction data. Solutions involving 1, 2
and 3 factors were tested. Warr et al. (1979) discussed only the 2 and 3 factor solutions, but
this analysis included the one factor as well, for completeness.
All model fit indices indicate that the 3-Factor solution fits the data best, though the two-
factor solution was not a bad fit either. In any case, there is no evidence to suggest that this
sample shows a different factor structure for the job satisfaction survey than that reported by
Warr et al. (1979).
Comparison of Model fits for 1, 2 and 3 factor solutions
Fit statistic One Two Three Comment
Likelihood
ratio
Chi2_ms 208.791 208.660 158.486
p > chi2 <0.001 <0.001 <0.001
Chi2_bs(105) 1417.921 1417.921 1417.921
p > chi2 <0.001 <0.001 <0.001
Population error
RMSEA 0.075 0.076 0.059 Lower is better
90% CI,
Lower bound 0.062 0.062 0.044
<0.05 is good fit and
if the lower bound of the CI <0.05,
Upper bound 0.088 0.089 0.074
suggests that the 3-factor solution is the
best fitting.
P close 0.001 0.001 0.145
Information criteria
AIC 10943.504 10945.373 10899.199
A smaller value for both is these is
better
BIC 11098.993 11104.318 11065.054
Suggests that the 3-factor solution is the
best fitting.

255
Baseline comparison
CFI 0.910 0.909 0.946 >0.90 for both is best
TLI 0.894 0.892 0.934
Suggests that the 3-factor solution is the
best fitting.
Size of residuals
SRMR 0.051 0.051 0.044 Smaller is better: 3 factor is best
CD 0.917 0.913 0.961 Larger is better: 3 factor is best
Two Factor Solutiona
Unstandardised Solution Standardised Solution
Item
Factor 1:
Intrinsic
Factor 2:
Extrinsic
Factor 1:
Intrinsic
Factor 2:
Extrinsic
2 0.82 (0.08) 0.61 (0.04)
4 1.18 (0.09) 0.74 (0.03)
6 0.70 (0.07) 0.65 (0.04)
8 0.87 (0.08) 0.65 (0.04)
10 1.13 (0.09) 0.75 (0.03)
12 0.97 (0.08) 0.74 (0.03)
14 0.79 (0.09) 0.57 (0.05)
1 0.53 (0.08) 0.44 (0.06)
3 0.31 (0.07) 0.31 (0.06)
5 1.02 (0.09) 0.70 (0.04)
7 0.61 (0.11) 0.36 (0.06)
9 1.00 (0.08) 0.73 (0.04)
11 1.18 (0.08) 0.79 (0.03)
13 0.43 (0.08) 0.34 (0.06)
15 0.63 (0.08) 0.49 (0.05)
Factor Covariance
2 1.00 (0.02) a RMSEA=0.076, 95% CI=(0.06, 0.09); CFI=0.91; TLI=0.89

256
Three Factor Solutiona
Unstandardised Solution Standardised Solution
Item
Factor 1:
Intrinsic
Factor 2:
Extrinsic
Factor 3:
Employee
Relations
Factor 1:
Intrinsic
Factor 2:
Extrinsic
Factor 3:
Employee
Relations
2 0.86 (0.08)
0.64 (0.05)
6 0.78 (0.07)
0.72 (0.04)
8 0.96 (0.08)
0.71 (0.04)
14 0.88 (0.09)
0.64 (0.05)
1
0.53 (0.08)
0.45 (0.06)
3
0.32 (0.07)
0.31 (0.07)
5
1.05 (0.09)
0.72 (0.04)
13
0.45 (0.09)
0.35 (0.06)
15
0.65 (0.09)
0.50 (0.06)
4
1.21 (0.09)
0.75 (0.03)
10
1.14 (0.09)
0.75 (0.03)
7
0.63 (0.11)
0.37 (0.06)
9
1.03 (0.08)
0.75 (0.03)
11
1.24 (0.08)
0.82 (0.03)
12
1.00 (0.08)
0.77 (0.03)
Factor Covariances
2 0.97 (0.05)
3 0.82 (0.04) 0.91 (0.04) a RMSEA=0.059, 95% CI=(0.04, 0.07); CFI=0.95; TLI=0.93
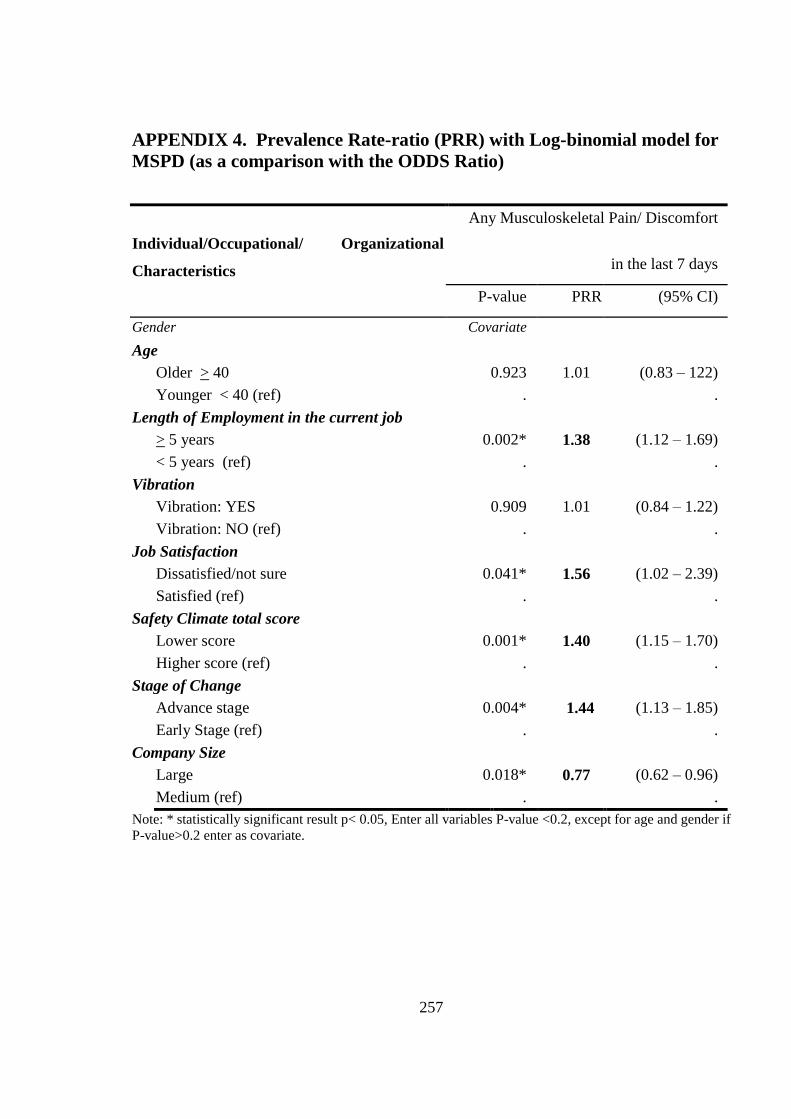
257
APPENDIX 4. Prevalence Rate-ratio (PRR) with Log-binomial model for
MSPD (as a comparison with the ODDS Ratio)
Individual/Occupational/ Organizational
Characteristics
Any Musculoskeletal Pain/ Discomfort
in the last 7 days
P-value PRR (95% CI)
Gender Covariate
Age
Older > 40 0.923 1.01 (0.83 – 122)
Younger < 40 (ref) . .
Length of Employment in the current job
> 5 years 0.002* 1.38 (1.12 – 1.69)
< 5 years (ref) . .
Vibration
Vibration: YES 0.909 1.01 (0.84 – 1.22)
Vibration: NO (ref) . .
Job Satisfaction
Dissatisfied/not sure 0.041* 1.56 (1.02 – 2.39)
Satisfied (ref) . .
Safety Climate total score
Lower score 0.001* 1.40 (1.15 – 1.70)
Higher score (ref) . .
Stage of Change
Advance stage 0.004* 1.44 (1.13 – 1.85)
Early Stage (ref) . .
Company Size
Large 0.018* 0.77 (0.62 – 0.96)
Medium (ref) . .
Note: * statistically significant result p< 0.05, Enter all variables P-value <0.2, except for age and gender if
P-value>0.2 enter as covariate.

258
APPENDIX 5. Additional Results of Baseline Survey
Appendix 5a. Table of the Multivariate Regression of the Association between
Undifferentiated MSPD and Safety Climate Dimensions
MSPD in the last 7 days
Sig. OR
95% Confidence Interval
for OR
Lower
Bound
Upper
Bound
MSPD Intercept .000
Gender=Female .163 1.450 .860 2.446
Gender=Male . . . .
JS1=Dissatisfied .183 .417 .115 1.513
JS2=not sure .126 2.099 .812 5.423
JS3=Satisfied . . . .
SOC=Advance stage .010 2.022 1.185 3.451
SOC=Early stage . . . .
SCCPS= Low score .234 2.150 .609 7.590
SCCPS=Middle .035 1.986 1.051 3.755
SCCPS=High score . . . .
SCMC= Low score .424 1.965 .375 10.298
SCMC= Middle .072 .542 .278 1.056
SCMC= High score . . . .
SCPISRP = Low score .028 2.340 1.096 4.999
SCPISRP= Middle .969 1.011 .591 1.728
SCPISRP = High score . . . .
SCPAR= Low score .000 8.696 3.997 18.922
SCPAR= Middle .170 1.681 .801 3.528
SCPAR=High score . . . .
Vibration=Yes .215 1.418 .817 2.464
Vibration=NO . . . .
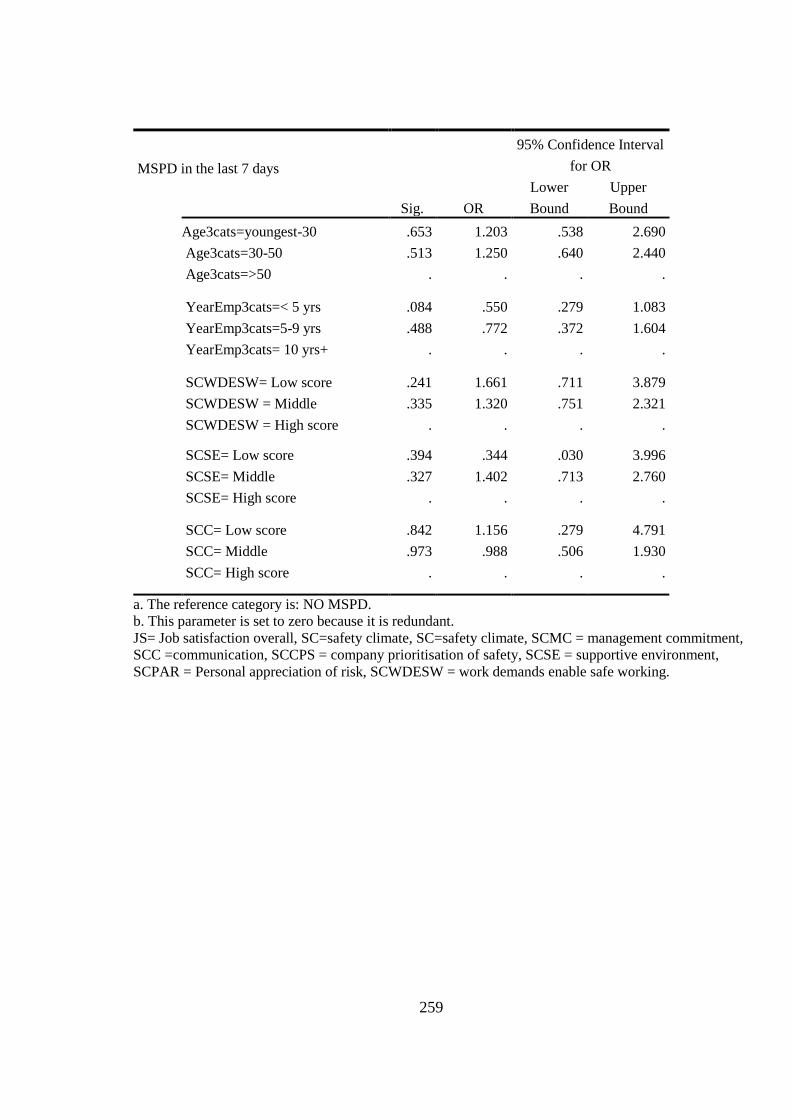
259
MSPD in the last 7 days
Sig. OR
95% Confidence Interval
for OR
Lower
Bound
Upper
Bound
Age3cats=youngest-30 .653 1.203 .538 2.690
Age3cats=30-50 .513 1.250 .640 2.440
Age3cats=>50 . . . .
YearEmp3cats=< 5 yrs .084 .550 .279 1.083
YearEmp3cats=5-9 yrs .488 .772 .372 1.604
YearEmp3cats= 10 yrs+ . . . .
SCWDESW= Low score .241 1.661 .711 3.879
SCWDESW = Middle .335 1.320 .751 2.321
SCWDESW = High score . . . .
SCSE= Low score .394 .344 .030 3.996
SCSE= Middle .327 1.402 .713 2.760
SCSE= High score . . . .
SCC= Low score .842 1.156 .279 4.791
SCC= Middle .973 .988 .506 1.930
SCC= High score . . . .
a. The reference category is: NO MSPD.
b. This parameter is set to zero because it is redundant.
JS= Job satisfaction overall, SC=safety climate, SC=safety climate, SCMC = management commitment,
SCC =communication, SCCPS = company prioritisation of safety, SCSE = supportive environment,
SCPAR = Personal appreciation of risk, SCWDESW = work demands enable safe working.

260
Appendix 5b. Multivariate Regression of the Association between Undifferentiated
MSPD and Job Satisfaction Items
MSPDa Sig. OR
95% Confidence Interval for OR
Lower Bound Upper Bound
MSPD Intercept .001
Gender .586 .878 .551 1.401
Age .293 1.191 .860 1.648
JS1–Dissatisfied * .017 2.280 1.162 4.474
Not sure .055 .351 .120 1.022
Satisfied . . . .
JS2- Dissatisfied .266 1.492 .737 3.020
Not sure .570 .747 .273 2.042
Satisfied . . . .
JS3- Dissatisfied .713 1.258 .370 4.275
Not sure .230 1.728 .707 4.226
Satisfied . . . .
JS4- Dissatisfied * .050 1.997 .999 3.991
Not sure .785 1.121 .493 2.546
Satisfied . . . .
JS5- Dissatisfied .979 1.012 .417 2.457
Not sure .582 .758 .282 2.036
Satisfied . . . .
JS7- Dissatisfied .251 1.362 .804 2.309
Not sure .079 2.236 .911 5.486
Satisfied . . . .
JS8- Dissatisfied .723 1.145 .540 2.427
Not sure .296 1.596 .664 3.837
Satisfied . . . .
JS9- Dissatisfied .992 .996 .451 2.198
Not sure .770 1.111 .548 2.252
Satisfied . . . .
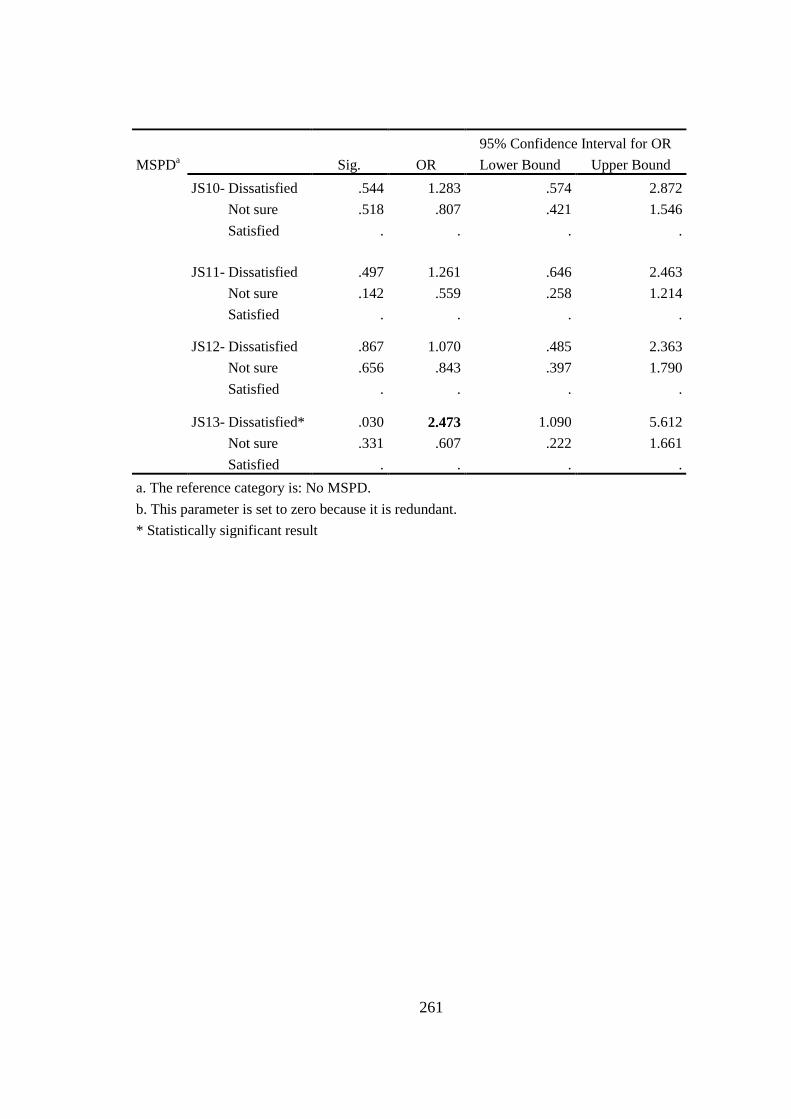
261
MSPDa Sig. OR
95% Confidence Interval for OR
Lower Bound Upper Bound
JS10- Dissatisfied .544 1.283 .574 2.872
Not sure .518 .807 .421 1.546
Satisfied . . . .
JS11- Dissatisfied .497 1.261 .646 2.463
Not sure .142 .559 .258 1.214
Satisfied . . . .
JS12- Dissatisfied .867 1.070 .485 2.363
Not sure .656 .843 .397 1.790
Satisfied . . . .
JS13- Dissatisfied* .030 2.473 1.090 5.612
Not sure .331 .607 .222 1.661
Satisfied . . . .
a. The reference category is: No MSPD.
b. This parameter is set to zero because it is redundant.
* Statistically significant result

262
APPENDIX 6. Additional Questions in Follow-Up Survey
Changes made by employer
1. Has your employer made any changes in the last 6 to 12 months to reduce the risk of
musculoskeletal problems from your work? YES / NO
IF YES,
a) Were you consulted prior to the introduction of the changes? YES / NO
b) Have these changes made a difference to the way you do your work?
□ YES / NO
2. Have these changes made a difference to the way others in your group do their work?
□ YES / NO
3. Are you aware of any future changes planned to reduce the risk of these problems?
□ YES / NO
IF YES,
a) Have you been consulted about these planned changes?
□ YES / NO
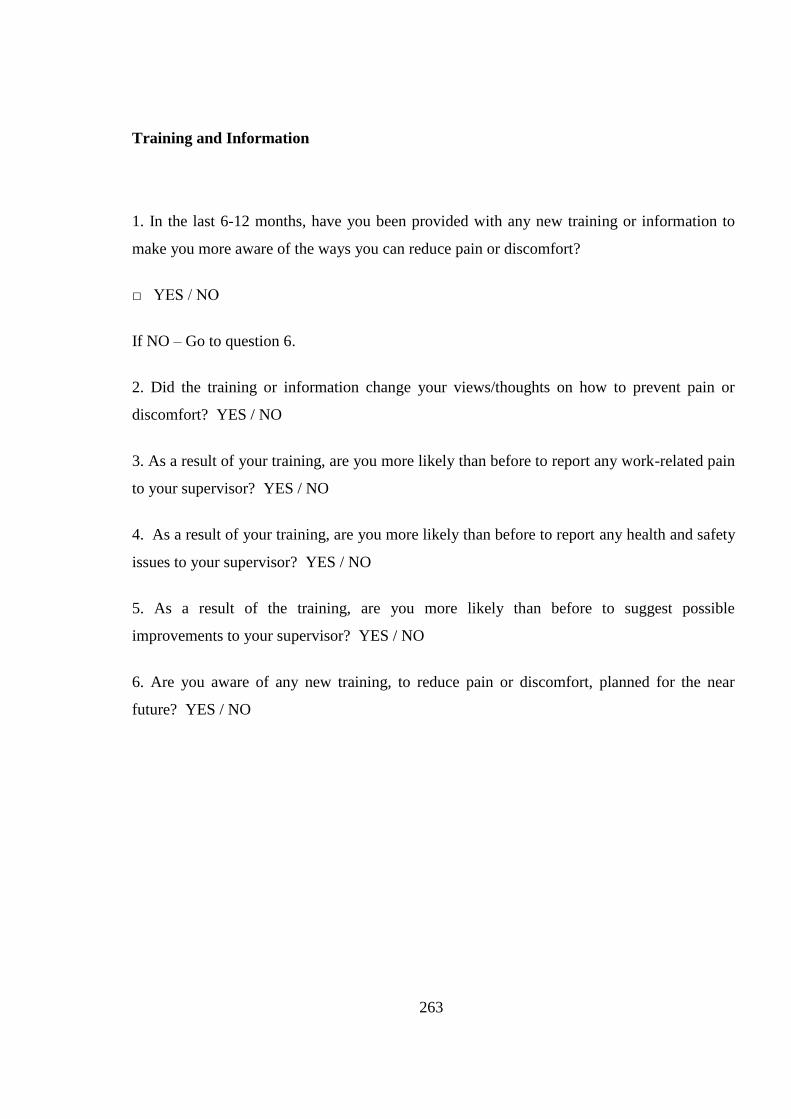
263
Training and Information
1. In the last 6-12 months, have you been provided with any new training or information to
make you more aware of the ways you can reduce pain or discomfort?
□ YES / NO
If NO – Go to question 6.
2. Did the training or information change your views/thoughts on how to prevent pain or
discomfort? YES / NO
3. As a result of your training, are you more likely than before to report any work-related pain
to your supervisor? YES / NO
4. As a result of your training, are you more likely than before to report any health and safety
issues to your supervisor? YES / NO
5. As a result of the training, are you more likely than before to suggest possible
improvements to your supervisor? YES / NO
6. Are you aware of any new training, to reduce pain or discomfort, planned for the near
future? YES / NO
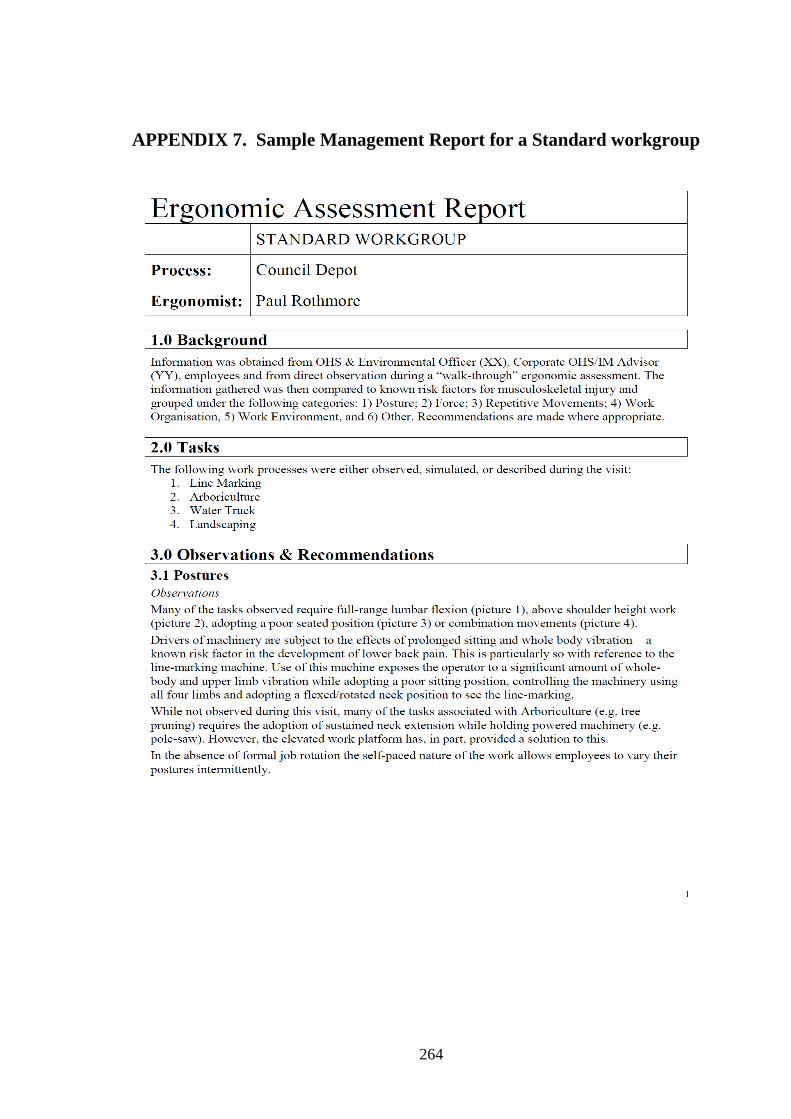
264
APPENDIX 7. Sample Management Report for a Standard workgroup

265

266
267
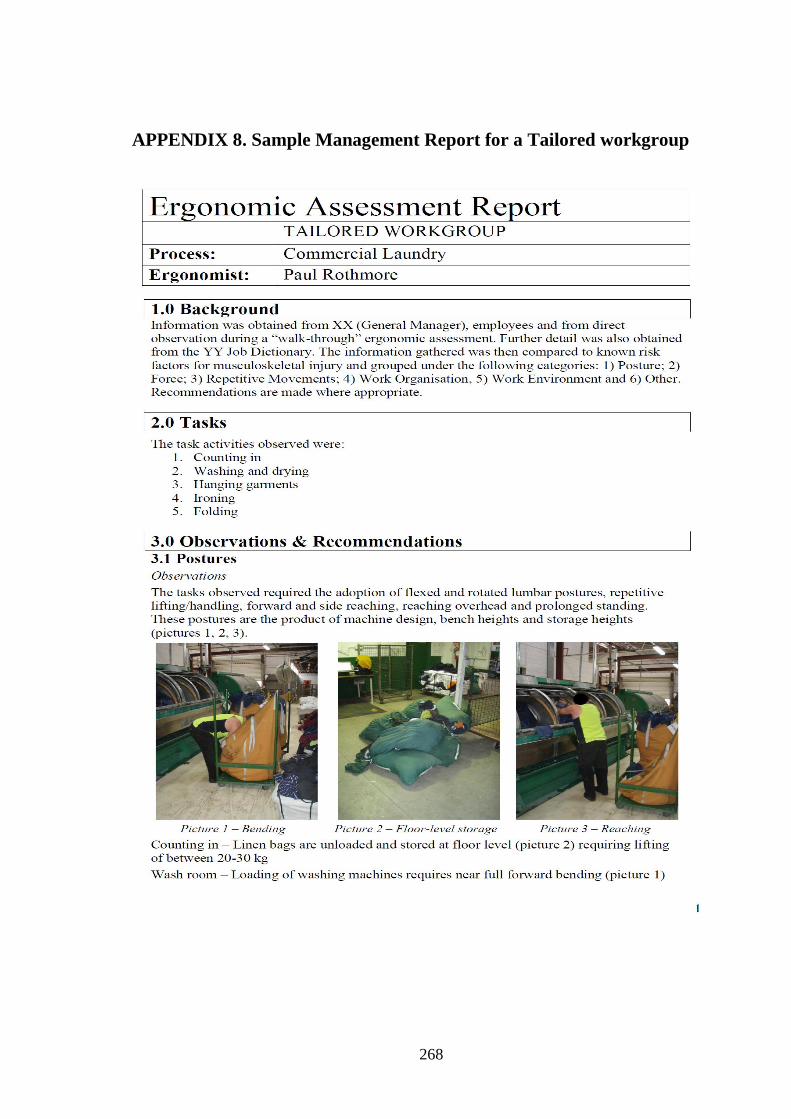
268
APPENDIX 8. Sample Management Report for a Tailored workgroup

269

270

271
272
273
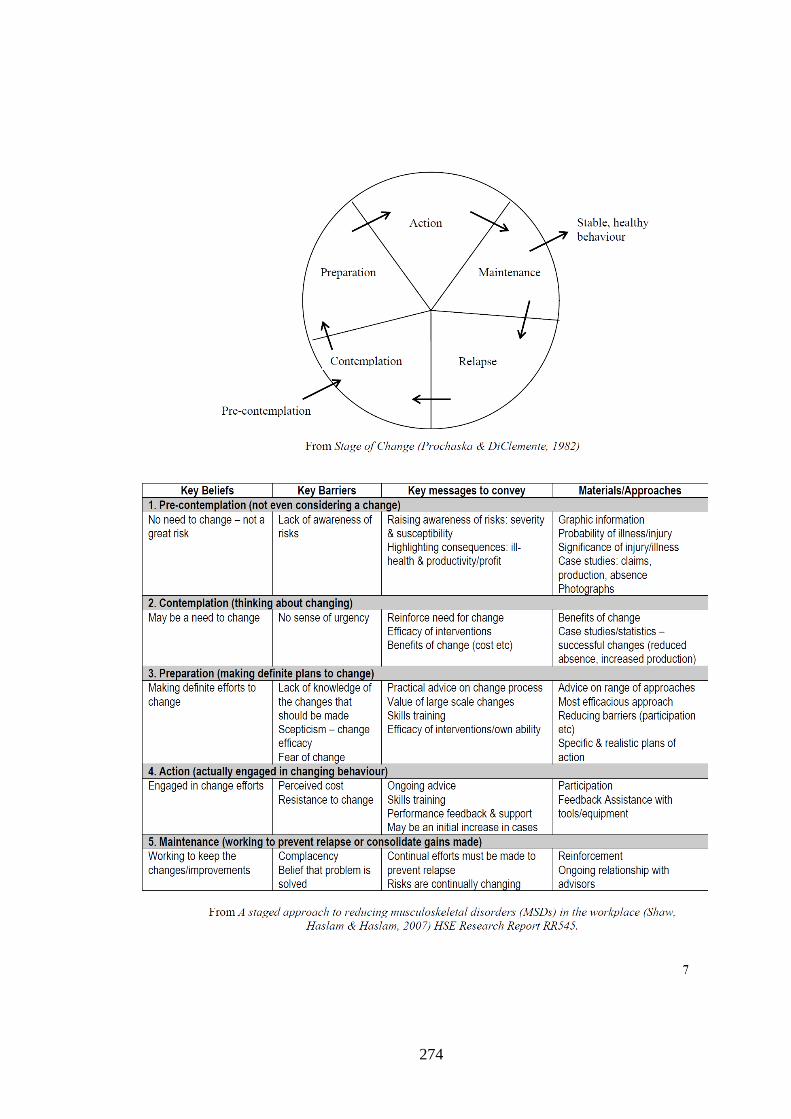
274

275
APPENDIX 9. Additional Results of Follow-Up Survey
Appendix 9a. The Multivariate Regression Result of the Association between
undifferentiated MSPD and Safety Climate Dimensions (Follow-Up survey)
MSPDa Sig. OR
95% Confidence Interval for Exp. (B)
Lower Bound Upper Bound
MSPD Intercept .038
Age .491 .810 .444 1.477
Gender .998 1.001 .551 1.818
SCC – Lower score .288 .449 .102 1.966
Medium score .916 .957 .418 2.187
Higher score . . . .
SCCPS – Lower score .484 1.833 .336 9.991
Medium score .520 1.347 .543 3.342
Higher score . . . .
SCSE – Lower score .830 1.378 .074 25.649
Medium score .277 1.602 .685 3.745
Higher score . . . .
SCPAR – Lower score * .003 4.005 1.601 10.019
Medium score .832 1.093 .481 2.484
Higher score . . . .
SCDESW – Lower score .964 1.025 .348 3.020
Medium score .200 1.578 .785 3.174
Higher score . . . .
SCMC – Lower score .317 2.617 .398 17.203
Medium score * .033 2.492 1.077 5.767
Higher score . . . .
SCPISRP – Lower score .349 1.713 .556 5.276
Medium score .631 1.170 .616 2.224
Higher score . . . .
SOC - Early stage .007 2.464 1.287 4.719
Advance stage . . . .
a. The reference category is: No MSPD.
b. This parameter is set to zero because it is redundant.
* Statistically Significant result
SC=safety climate, SCMC = management commitment, SCC =communication,
SCCPS = company prioritisation of safety, SCSE = supportive environment, SCPAR = Personal
appreciation of risk, SCWDESW = work demands enable safe working

276
Appendix 9b. The Multivariate Regression Result of the Association between
undifferentiated MSPD and Job satisfaction Items (Follow-Up survey)
95% Confidence Interval
MSPDT2a Sig. OR Lower Bound Upper Bound
Intercept .411
Gender .861 .953 1.640 .861
Age group .334 .885 1.134 .334
JS1: Dissatisfied * .015 2.557 5.430 .015
Not sure .473 1.492 4.449 .473
Satisfied . . . .
JS5: Dissatisfied .173 1.974 5.254 .173
Not sure .321 .621 1.593 .321
Satisfied . . . .
JS6: Dissatisfied .350 1.706 5.229 .350
Not sure .760 .849 2.433 .760
Satisfied . . . .
JS7: Dissatisfied .326 1.365 2.539 .326
Not sure .600 1.322 3.756 .600
Satisfied . . . .
JS8 Dissatisfied .816 1.109 2.647 .816
Not sure .429 1.575 4.861 .429
Satisfied . . . .

277
95% Confidence Interval
MSPDT2a Sig. OR
Lower Bound Upper
Bound
JS9:
Dissatisfied
.
.660
1.206
2.782
.660
Not sure .480 .757 1.640 .480
Satisfied . . . .
JS10: Dissatisfied .873 1.070 2.450 .873
Not sure .442 1.337 2.802 .442
Satisfied . . . .
JS11: Dissatisfied .275 .631 1.443 .275
Not sure .829 .907 2.194 .829
Satisfied . . . .
JS12: Dissatisfied .185 1.809 4.349 .185
Not sure * .012 2.779 6.153 .012
Satisfied . . . .
a. The reference category is: No MSPD. b. This parameter is set to zero because it is redundant
c. Only Job satisfaction items that show statistically significant association in bivariate were entered
in the model. * Statistically significant result

278
APPENDIX 10. Result of Cluster Randomised Trial GEE analysis
Appendix 10a. The table of undifferentiated MSPD final model result
Regression
Effect OR (95%CI) p-value
Time Baseline 0.61 (0.31-1.22) 0.161 Intervention Standard 0.62 (0.29-1.29) 0.198 Time
xIntervention Baseline Standard 0.78 (0.37-1.62) 0.497
State of Change a Action 3.92 (1.59-9.65) 0.003*
Contemp / Prep 2.32 (1.22-4.42) 0.01* Maintenance 5.42 (2.47-11.92) < 0.001* Safety Climate
a 0.95 (0.92-0.97) < 0.001*
Job Satisfaction Dissatisfied 1.37 (0.72-2.61) 0.339 Time
x Years Employed Baseline 10+ years 1.89 (0.72-4.96) 0.197
Baseline 5-9 years 1.57 (0.71-3.47) 0.262 Intervention
xYears
Employed a
Standard 10+ years 4.76 (1.64-13.81) 0.004*
Standard 5-9 years 4.92 (1.54-15.74) 0.007* Age 0.98 (0.96-1.00) 0.111 Gender 0.81 (0.51-1.28) 0.363
Note: References: Tailored group, follow-up, preparation stage, <5 years employment, satisfied with job.
*Statistically significant result; x interaction;
a Type 3 effect p-value <0.05

279
Appendix 10b. The Table of Neck and Shoulder MSPD Final Model Results
Regression
Effect OR (95%CI) p-value
Time Baseline 0.37 (0.12-1.11) 0.075
Intervention Standard 0.33 (0.10-1.10) 0.075
Time x Intervention 1.22 (0.54-2.76) 0.625
State of Change a
Advanced 1.97 (1.19-3.26) 0.008*
Safety Climate a Lowest Tertile 1.65 (0.63-4.33) 0.311
Mid Tertile 2.47 (0.99-6.19) 0.053*
Time x Safety Climate Baseline Lowest Tertile 1.46 (0.45-4.72) 0.530
Baseline Mid Tertile 0.60 (0.18-2.04) 0.417
Intervention x Safety
Climate
Standard Lowest Tertile 3.16 (1.00-9.98) 0.049*
Standard Mid Tertile 1.88 (0.58-6.09) 0.290
Job Satisfaction Dissatisfied 1.29 (0.65-2.53) 0.465
Time x Years Employed
a Baseline 10+ years 4.52 (1.66-12.31) 0.003*
Baseline 5-9 years 1.84 (0.74-4.57) 0.189
Intervention x Years
Employed
Standard 10+ years 4.57 (1.26-16.58) 0.021*
Standard 5-9 years 2.68 (0.82-8.74) 0.103
Age 1.00 (0.98-1.02) 0.985
Gender 0.56 (0.34-0.93) 0.026
Note: a safety climate was categorised into tertiles as the model with the continuous variable failed to
converge. References: Tailored group, follow-up, preparation stage, <5 years of employment, satisfied with
job. *Statistically significant result; x interaction;
a Type 3 effect p-value <0.05
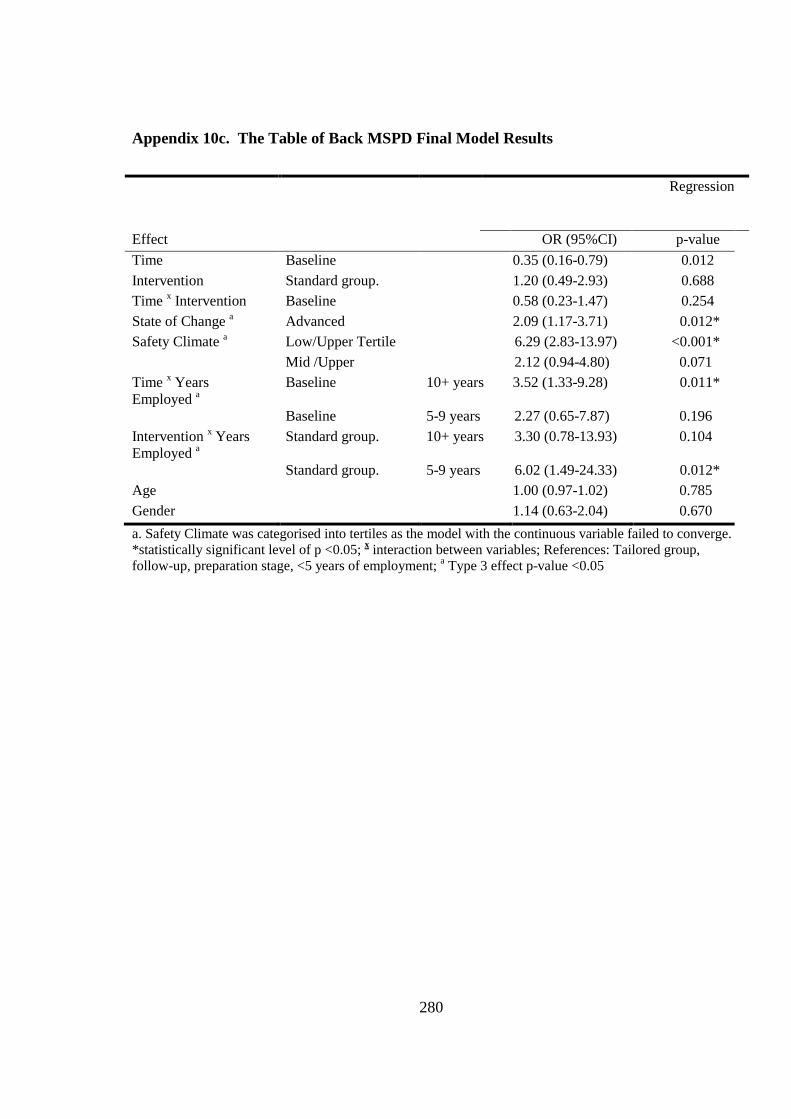
280
Appendix 10c. The Table of Back MSPD Final Model Results
Regression
Effect OR (95%CI) p-value
Time Baseline 0.35 (0.16-0.79) 0.012
Intervention Standard group. 1.20 (0.49-2.93) 0.688
Time x Intervention Baseline 0.58 (0.23-1.47) 0.254
State of Change a Advanced 2.09 (1.17-3.71) 0.012*
Safety Climate a Low/Upper Tertile 6.29 (2.83-13.97) <0.001*
Mid /Upper 2.12 (0.94-4.80) 0.071
Time x Years
Employed a
Baseline 10+ years 3.52 (1.33-9.28) 0.011*
Baseline 5-9 years 2.27 (0.65-7.87) 0.196
Intervention x Years
Employed a
Standard group. 10+ years 3.30 (0.78-13.93) 0.104
Standard group. 5-9 years 6.02 (1.49-24.33) 0.012*
Age 1.00 (0.97-1.02) 0.785
Gender 1.14 (0.63-2.04) 0.670
a. Safety Climate was categorised into tertiles as the model with the continuous variable failed to converge.
*statistically significant level of p <0.05; x interaction between variables; References: Tailored group,
follow-up, preparation stage, <5 years of employment; a Type 3 effect p-value <0.05