did the 2007 welfare reforms for low income parents in
TRANSCRIPT

Did the 2007 welfare reforms for low income parents in Australiaincrease welfare exits?
Fok, Y. K., & McVicar, D. (2013). Did the 2007 welfare reforms for low income parents in Australia increasewelfare exits? IZA Journal of Labor Policy, 2(3), [2:3]. https://doi.org/10.1186/2193-9004-2-3
Published in:IZA Journal of Labor Policy
Document Version:Publisher's PDF, also known as Version of record
Queen's University Belfast - Research Portal:Link to publication record in Queen's University Belfast Research Portal
Publisher rights© 2013 Fok and McVicar; licensee Springer. This is an open access article published under a Creative Commons Attribution License(https://creativecommons.org/licenses/by/4.0/), which permits unrestricted use, distribution and reproduction in any medium, provided theauthor and source are cited.
General rightsCopyright for the publications made accessible via the Queen's University Belfast Research Portal is retained by the author(s) and / or othercopyright owners and it is a condition of accessing these publications that users recognise and abide by the legal requirements associatedwith these rights.
Take down policyThe Research Portal is Queen's institutional repository that provides access to Queen's research output. Every effort has been made toensure that content in the Research Portal does not infringe any person's rights, or applicable UK laws. If you discover content in theResearch Portal that you believe breaches copyright or violates any law, please contact [email protected].
Download date:03. Dec. 2021

Fok and McVicar IZA Journal of Labor Policy 2013, 2:3http://www.izajolp.com/content/2/1/3
ORIGINAL ARTICLE Open Access
Did the 2007 welfare reforms for low incomeparents in Australia increase welfare exits?Yin King Fok and Duncan McVicar*
* Correspondence: [email protected] Institute of AppliedEconomic and Social Research,University of Melbourne, Melbourne,Vic 3010, Australia
©Am
Abstract: This paper examines the impacts of recent Australian welfare to workreforms for low-income parents of school-aged children who had been in receipt ofParenting Payment – the main welfare payment for this group – for at least oneyear. Specifically, the reforms introduced a requirement to engage in at least15 hours of work-related activity per week from the youngest child’s seventhbirthday. As was the case for similar reforms introduced by US states in the 1990s,these reforms had large, statistically significant and positive impacts on the hazardrates for exiting the welfare payment. Two thirds of these exits were exits fromwelfare altogether and one third were exits to other welfare payments.
JEL: I38, J22
Keywords: Welfare reform, Welfare to Work, Activation, Lone parents, Labour supply,Australia
1. IntroductionA long standing concern with means-tested social welfare payments for low income
families with school-age children is that they can reduce incentives to participate in
the labour market, potentially leading to long episodes of welfare dependence, depreci-
ation of human capital, and ultimately exacerbating rather than alleviating poverty.
Policy makers across the OECD have responded to this concern by reforming pro-
grams to encourage or compel welfare-recipient parents of all but the youngest chil-
dren to either re-enter the labour market or to engage in activities aimed at
maintaining or improving their employability (see Carcillo and Grubb, 2006). For ex-
ample, widespread reforms along these lines were introduced across US states in the
1990s. These US welfare reforms have been extensively evaluated, and the bulk of evi-
dence suggests they resulted in large and statistically significant falls in welfare case-
loads along with increases in employment (see Blank, 2002; Grogger and Karoly, 2005;
Moffitt, 2008). 1Evidence on the impact of similar types of reforms introduced outside
of the US, however, is less extensive (Finn and Gloster, 2010).
This paper examines the impact of recent (2007) welfare reforms for low-income
parents in Australia (mostly but not only single mothers) on the hazard rates for
exiting welfare and for switching between welfare payments. By setting a requirement
to engage in 15 hours per week of paid work or work-related activity for those in re-
ceipt of Parenting Payment (PP) – the main income support payment for this group –
with a youngest child aged seven or older, the reforms involved a substantial tightening
2013 Fok and McVicar; licensee Springer. This is an Open Access article distributed under the terms of the Creative Commonsttribution License (http://creativecommons.org/licenses/by/2.0), which permits unrestricted use, distribution, and reproduction in anyedium, provided the original work is properly cited.

Fok and McVicar IZA Journal of Labor Policy 2013, 2:3 Page 2 of 21http://www.izajolp.com/content/2/1/3
of payment conditionality, broadly in line with the additional conditionality introduced
by a number of US states as part of the 1990s welfare reforms.2
Ours is the first study of the impact of these 2007 reforms, and because welfare re-
form for low-income parents continues to be very high on the policy agenda both in
Australia and across the OECD, the paper makes a contribution to both the Australian
and the international welfare reform evidence base. What was the impact of these US-style
welfare reforms in the rather different labour market context offered by Australia,
where minimum wages are comparatively high (see OECD, 2012) and employment
rates for mothers of pre-school-age children are comparatively low (see OECD, 2007)?
The welfare system is also rather different in Australia compared to the US welfare
system of the 1990s, with other welfare payments, not all of which have similar activity
requirements, also potentially available (e.g. see DEEWR, 2008). This raises the possi-
bility that tightening one part of the welfare system may end up shifting claimants onto
other forms of welfare payment.
Further, the age-based coverage of these reforms enables credible identification of
their impacts using a simple difference-in-differences approach. We find a large impact
on the hazard rates for both exiting welfare and switching from PP to other welfare
payments. For low-income parents covered by the new participation requirements
when their youngest child turned seven, our estimates suggest that the welfare exit haz-
ard increased by 48 percent and the welfare switching hazard more than doubled, albeit
from a lower base, increasing by 114 percent. As a consequence, over the first year of
the new regime the caseload for those parents with a youngest child aged 6 at the start
of the year fell by 23.5 percent; without activation we estimate it would have fallen by
18.5 percent. Almost two thirds of this impact is accounted for by exits from welfare
rather than welfare switches. Note also that these impacts appear larger for partnered
parents than for single parents – unusually for evaluation studies both groups were
covered by the same set of reforms3 – although not statistically significantly so.
The remainder of this paper is set out as follows. The following section provides fur-
ther details on PP, the pre-reform welfare regime and the 2007 reforms. Section 3
briefly discusses evaluations of earlier reforms for low income parents in Australia and
elsewhere. Section 4 summarises the data used for the analysis, which are taken
from an administrative database longitudinally tracking welfare recipients over time
(the Research Evaluation Dataset, or RED), and presents preliminary estimates of the
reform impacts. Section 5 presents the econometric model and discusses identifica-
tion. Section 6 presents and discusses the estimation results and section 7 concludes.
2. Parenting payment and the 2006 and 2007 welfare reforms
The main means-tested social welfare payment for low-income families with young
children in Australia is known as Parenting Payment (PP), either Parenting Payment
Single (PPS) for lone parents, or Parenting Payment Partnered (PPP) for partnered par-
ents where the combined household income falls below a given threshold. These pay-
ments are part of the overall Income Support (IS) system, which includes welfare
payments for unemployed workers, for the disabled and for a variety of other groups.
Prior to 2003, receipt of PP was not conditioned on any form of participation for
those with a child under 16 years, although voluntary programs were available,
Fok and McVicar IZA Journal of Labor Policy 2013, 2:3 Page 3 of 21http://www.izajolp.com/content/2/1/3
including the Jobs, Education and Training (JET) Program, which combined an initial
interview with a Centrelink4 advisor with other measures including career counselling,
job search assistance, and short training courses (for details see Banks, 2005). Limited
conditionality – compulsory attendance at an annual interview with a Centrelink ad-
visor – was introduced in 2003 for those whose youngest child was aged six years or
older.5 More demanding participation conditions for those with a youngest child aged
13–15 years – compulsory Mutual Obligation participation in 150 hours of approved
activities such as work schemes, job search or training every 26 weeks of PP receipt,
and a requirement to report activity every three months – were also introduced in 2003
(Banks, 2005). This was the regime in place until the 2006 welfare to work reforms.
Since 1st July 2006 new claimants only qualify for PP if their youngest child is aged
under eight years (PPS) or under six years (PPP). New claimant parents whose youngest
child is older, or with a youngest child who turns six/eight during a welfare episode, are
no longer eligible for PP but may be eligible for (less generous) unemployment benefits
(New Start Allowance (NSA)). Receipt of NSA for this group is conditional on meeting
part-time participation requirements of 15 hours per week in paid employment, training
or employment-related activities such as job search, in addition to NSA Mutual Obliga-
tion requirements after 26 weeks. New entrant PPS recipients with a youngest child aged
six years or older have also been required to meet similar part-time participation require-
ments since the 2006 reforms. Within the overall guidelines the precise nature of the
requirements can be tailored to the particular PP recipient and are set out in a semi-
contractual form known as an Activity Agreement, drawn up between the individual and
the Centrelink advisor.6 Failure to comply with these requirements, in the absence of any
temporary exemption which may be granted for reasons such as ill health of the recipient
or of a child, triggers a series of warnings and ultimately, suspension of payments.
This paper focuses not on new entrants to PP, however, but on the cohort of low-
income parents already in receipt of PP as of 30th June 2006, i.e. the stock of existing
PP recipients at the time of the 2006 reforms. This group – consisting of around
600,000 individuals – were ‘grandfathered’ and, provided they continued to meet the
means-testing requirements for PP, and provided they didn’t lose their grandfathered
status by exiting IS or by changing their partnered status, remained eligible for PP until
their youngest child turned 16.7
This grandfathered cohort of parents was granted a grace period before being re-
quired to meet the new part-time participation requirements. The original intention
was that this grace period would be for one year, with the new part-time participation
requirements introduced for those whose youngest child was aged seven years or older,
on 1st July 2007.8 In practice, however, participation requirements were phased in, for
those with a youngest child already aged seven or older, over a period of around twelve
months from July 2007, with those deemed furthest from the labour market ‘activated’
first. Activation involved a call to interview with a Centrelink advisor during which the
new participation requirements were explained and, in most cases, an Activity Agree-
ment setting out how the individual would meet the requirements drawn up and signed
there and then.9 The rest of this group either signed an Activity Agreement at a later
date (e.g. because of a temporary exemption)10, exited PP following the interview but
before signing an Activity Agreement, or were yet to sign an Activity Agreement by the
last date for which we have data (30th June 2009).11

Fok and McVicar IZA Journal of Labor Policy 2013, 2:3 Page 4 of 21http://www.izajolp.com/content/2/1/3
Unfortunately, this non-random phasing-in of the participation requirements, to-
gether with inaccuracies and missing values in the recording of interview and agree-
ment dates, makes identification of the impact of the reforms difficult for those in the
grandfathered group with children already aged seven years or older as of 1st July 2007.
Instead we primarily exploit information on those in the grandfathered group with a
youngest child aged under seven as of 1st July 2007, but who then subsequently turned
seven within our sample period. All parents in this category were called to interview
within two weeks of the child’s seventh birthday, which has two advantages for evalu-
ation purposes. First, to the best of our knowledge, the child’s date of birth is recorded
accurately for all recipients. Second, the timing of the ‘treatment’ – which we take as
commencing on the child’s seventh birthday – is determined solely by the child’s age. A
similar proportion of this particular group signed Activity Agreements, and with similar
timing relative to the interview date, as for the wider group.12
Before moving on, it is worth briefly setting out some additional details on payment
rates and taper rates for those with other income, since these may differ from welfare
payments to low-income parents in other countries. There are also differences in these
characteristics between PPS and PPP which may help to explain any differences in the
impacts of the reforms by payment type. These were not changed as part of the 2006
or 2007 reforms, although they have been periodically updated since. The figures given
below refer to fortnightly periods and are those in place as of March 2011. The
maximum PPS payment, for those earning no more than $170.60 (plus $24.60 for each
additional child), is $611.90. Payments are reduced by 40 cents in the dollar for those
earning above this threshold, with parents no longer eligible for part payments once
their income exceeds $1,673.85 (again plus $24.60 for each additional child). In contrast,
the maximum PPP payment is $424.00. Eligibility for the maximum payment is
dependent on whether the individual’s partner also receives a pension (e.g. PPP or other
IS pension, Age Pension). If this is the case, then combined income must be less than
$124 for maximum payment, with taper rates for combined income above this threshold
initially 25 cents in the dollar (up to $500) and then 30 cents in the dollar, up to a
maximum combined income of $1,579. If the partner does not receive a pension,
then own income must be less than $62 and partner’s income less than $790 for
maximum payment. Taper rates are 60 cents in the dollar for own income (50 cents
below $250) and partner’s income, up to a maximum of $789.50 (own income), and
$1,486.17 (partner’s income) and $1,589.50 (combined income). In summary, PPS pay-
ments are higher than PPP payments at all eligible income levels for those whose part-
ners receive a pension, although PPP taper rates are lower. For those whose partners do
not receive a pension, PPP can be more generous than PPS for partners earning less
than $1,100, but taper rates are higher.
3. Existing evaluations of related reforms
Most welfare to work reforms in most countries set out with the aims of reducing welfare
caseloads and boosting labour force participation, whether for lone or low-income par-
ents, for the long-term unemployed or for other groups of welfare recipients. Typically,
these reforms consist of increased activity requirements (e.g. compulsory job search or
training, with sanctions for those that are not sufficiently active) and provision of

Fok and McVicar IZA Journal of Labor Policy 2013, 2:3 Page 5 of 21http://www.izajolp.com/content/2/1/3
additional or improved employment-related assistance (e.g. with job search, training or
child care).13 Grogger and Karoly (2005) show how these kinds of reforms can be
expected to increase incentives to work in a simple static model of labour supply. Others
have used search models to show similar incentive effects (e.g. Johnson and Klepinger,
1994; Fredriksson and Holmlund, 2005; Manning, 2009).
The international empirical evidence suggests that different measures work to diffe-
rent extents for different groups and in different contexts, with exit from a particular
payment not necessarily synonymous with welfare exit, and welfare exit not necessarily
synonymous with labour force participation. For general cross-country reviews see
Heckman et al. (1999), Martin and Grubb (2001) and Carcillo and Grubb (2006). For
reviews of welfare to work reforms specifically for low-income parents see Blank
(2002), Grogger and Karoly (2005), and Moffitt (2008) for the US, and Finn and Gloster
(2010) across countries (including earlier Australian reforms).
Here we briefly discuss the evidence from the 1990s US welfare reforms– associated
with the replacement of Aid to Families with Dependent Children (AFDC) with Temporary
Assistance for Needy Families (TANF) in 1996, and the preceding period of state-level
experimentation with different approaches to welfare under the waiver system – in part
because they have been extensively evaluated, but also because some of the key characte-
ristics of these reforms at both the Federal and state level were similar to the Australian
welfare to work reforms of interest here. TANF is a Federal program, which among other
things, mandates participation in work or work-related activities of up to 30 hours per
week, after an initial period, for lone parents whose youngest child is six years or older
(although with some exemptions). Individual states have had considerable discretion in
the timing and nature of its implementation and the resulting variation in the program
along with the preceding period of state-level waivers, is one reason for the extensive
evaluation literature on the US reforms over this period.
The weight of evidence from this body of evaluation studies, using a variety of
methods and data sources, points to significant caseload-reduction impacts from the
introduction of TANF (through both increased exits and reduced entry14), significant
positive impacts on job entry for those exiting welfare and on employment for the tar-
get group overall, and significant increases in participation in paid work for those
remaining on welfare. In terms of particular reform components, according to Grogger
and Karoly (2005) there were more studies of mandatory activity requirements – the
aspect of the reforms that is closest to the Australian reforms – than any other type of
reform. (There were also more studies of impacts on welfare use – the outcome we
study in this paper – than on any other outcome variable). In terms of magnitude,
experiment-based estimates of the decline in welfare rolls as a result of the mandatory
participation requirements introduced under the state-level waivers suggest an average
reduction of 5.1 percentage points over two years (Grogger and Karoly, 2005). We keep
this estimate in mind when interpreting the magnitude of the impacts of the Australian
welfare reform on caseload, although we stop short of drawing conclusions regarding
direct comparisons of magnitudes.
One reason why we might expect different impacts of welfare reforms introducing
mandatory activity requirements in Australia compared to the US is that labour force
participation among mothers of young children is comparatively low in Australia.
Bergemann and van den Berg (2008) argue that ALMP impacts for women may be

Fok and McVicar IZA Journal of Labor Policy 2013, 2:3 Page 6 of 21http://www.izajolp.com/content/2/1/3
higher in labour markets with low female participation rates because such labour mar-
kets may imply higher wage elasticity and because they imply female welfare recipients
who are more highly skilled on average. They present evidence that suggests such a
pattern in the magnitude of ALMP impacts for women may exist. Australia’s high mini-
mum wages (and other labour market rigidities) might act against this, however, by
constraining labour demand for low-skilled workers among this group of welfare recipi-
ents, with any off-setting impact on labour supply itself constrained by the high mar-
ginal tax rates facing those on PP.
The potential availability of other welfare payments, and the relative ease with which
one can switch between payments, may also be an important point of difference be-
tween Australia and the US for this group. Mandatory activity requirements for one
type of payment are likely to reduce the utility of welfare recipients on that payment, at
least in the short run, and a rational response would be to try to avoid these require-
ments by switching to alternative payments where possible. So exit from PP may not
always correspond with exit from welfare altogether or entry to the labour market.
Evidence that reforms to one particular welfare benefit can lead to ‘benefit shift’
between payments is becoming increasingly common. For a recent example from a
reform to UK unemployment benefits see Petrongolo (2009).15
What can we learn about the possible impacts of the 2007 reforms from evaluations of
earlier Australian welfare reforms for low-income parents? An early small-scale pilot ex-
tension of the JET interview program has been the subject of a couple of studies, both
finding evidence of statistically significant impacts on various outcomes (see Barrett and
Cobb-Clark, 2000; Dockery and Stromback, 2004). Perhaps more useful for our particular
purposes, however, is the in-house evaluation of the 2006 welfare to work reforms for
low-income parents by the relevant government department (DEEWR, 2008). In the
absence of random experimental evidence, the DEEWR study adopts a combination of
before and after comparisons and unconditional difference-in-differences (comparing
changes in means) – with identification based on age of youngest child – to estimate the
impacts of introducing the package of activation measures for new claimant low-income
parents, as described in Section 2, on a variety of outcomes. The resulting evidence sug-
gests that for those low-income parents whose youngest child was school aged, the 2006
reforms reduced inflows to IS, increased transfers from PP to other non-activity tested IS
payments such as Disability Support Pension (DSP), increased participation in employ-
ment services, decreased the duration on IS16, and, at least for partnered parents or
single parents with a youngest child aged six or seven years, increased participation in
paid employment for those still on IS.
4. Data and preliminary estimates
The RED records all episodes of IS receipt, along with details required to administer
payment (e.g. earnings from paid employment) and some others, from the late 1990s
onwards. It is longitudinal in the sense that individuals are tracked across multiple epi-
sodes, although it contains no information on individuals for periods outside of IS. Its
main advantages are that it contains information on the full population of PP recipi-
ents, is continuous in time (IS ‘events’ are recorded to the day) and that data are
reported accurately at least for information required to administer payments. Its main

Fok and McVicar IZA Journal of Labor Policy 2013, 2:3 Page 7 of 21http://www.izajolp.com/content/2/1/3
disadvantages are the lack of information outside of IS episodes and lack of detail and
potential unreliability of information that is not required to administer IS payment.
Specifically, we know nothing about labour force participation once off welfare, and
although we do observe some information on hours of paid work while on welfare,
such data are only reliable following activation (when they are required for administra-
tion of the welfare payment). This limits the outcomes we can study here to welfare
exit and switching between welfare payments.
Because of its size and complexity we take a ten percent random sample of the rele-
vant RED population – all grandfathered PP recipients as of 30th June 2006 – and track
them for all IS episodes from the beginning of the episode which was ongoing on 30th
June 2006 until 30th June 2009. This gives us information on 90,664 IS episodes cover-
ing 59,490 individuals. By 30th June 2009 the stock of recipients from this ten percent
sample that were still receiving PP was down to just over 30,000 individuals, with some
no longer receiving IS and others receiving other IS payments. Note that, by definition,
there are no inflows to the grandfathered cohort beyond 30 June 2006, only outflows.
Over the same period the total number of PP recipients – including new entrants to PP
outside of the grandfathered group – fell by around twenty percent (see Figure 1).
For each IS episode we have (time-varying) data on type of benefit claimed, episode
start and end dates (right-censored if ongoing), benefit history of the individual, num-
ber of children and age of youngest child, age of the recipient parent, country of birth
of the recipient parent, the Labour Force Statistical Region (LFSR) for each individual
with which we assign local unemployment rates to individuals, along with information
on the date of the initial activation interview with the Centrelink advisor (for those acti-
vated) and the signing date for any subsequent (compulsory) Activity Agreement. We
treat these episodic data as continuous in time and use them to analyse the duration of
PP episodes and to estimate hazard functions for the daily probabilities of exiting PP,
exiting PP to other IS payments and exiting IS.
Table 1 presents summary information for our grandfathered sample, separately by
benefit type. The mean duration of a completed PP episode is 1716 days, i.e. between
four and five years, but many episodes – around 40% – are still ongoing at the last
point of observation (30th June 2009), so that these mean completed episode durations
understate the mean duration of all PP episodes for the grandfathered cohort. PPS
020
0000
4000
0060
0000
01jan2000 01jan2002 01jan2004 01jan2006 01jan2008 01jan2010date
Parenting Payments PPSPPP
Figure 1 Number of PP recipients, Jan 2000 - July 2010.

Table 1 Durations and covariate sample means (Standard Deviations), full sample
All PP PPS PPP
Completed PP episode duration, days 1716 (1156) 1870 (1149) 1392 (1104)
Episode duration including right-censored episodes 2019 (1172) 2157 (1144) 1649 (1169)
Elapsed duration in current episode to 30 June 2006, days 1218 (1035) 1343 (1039) 954 (975)
Male .101 .096 .110
Age of parent 36.7 (9.24) 36.9 (9.26) 36.0 (9.18)
Immigrant .264 .215 .369
Number of children <16 1.67 (.927) 1.55 (.823) 1.94 (1.07)
LFSR Unemployment Rate, % 4.85 (1.31) 4.80 (1.31) 4.97 (1.31)
Previous IS episodes duration (prior to current episode), years 3.96 (3.56) 4.03 (3.58) 3.80 (3.52)
Proportion of episodes ending within window 62.9% 58.4% 74.8%
Note: covariates are measured at end episode or right-censoring date.
Fok and McVicar IZA Journal of Labor Policy 2013, 2:3 Page 8 of 21http://www.izajolp.com/content/2/1/3
episodes are longer on average than PPP episodes. By definition no episodes can end
before 30 June 2006 – either the individual concerned would not be in the
grandfathered group or the episode ending prior to 30 June 2006 would be excluded
from the sampling frame – but we have information on the elapsed duration of the
current episode prior to this cut-off date, which again tends to be higher for PPS recipi-
ents compared to PPP recipients. We also have information on previous IS episodes,
which on average sum to four years duration across both benefit types. Around 90% of
grandfathered PP recipients are women. The average age of grandfathered PP recipients
is around 36 years. Around one quarter of grandfathered PP recipients were born out-
side of Australia. Grandfathered PP recipients have an average of two children under
16 and they face an average local unemployment rate of around 5%.
Before turning to discussion of the hazard models we take a first pass at the data by pre-
senting simple unconditional difference-in-differences estimates that compare mean out-
comes before and after the 2007 reforms for those covered by the new requirements
(i.e. with a youngest child aged seven years or older) and for those not covered by the new
requirements (i.e. those with a youngest child aged under seven years). This kind of age-
of-youngest-child based approach to identification is common in the non-experimental
evaluation literature on welfare reforms for low-income parents (e.g. Grogger and
Michalopoulos, 2003; Grogger, 2004; Cebulla et al., 2008), and was adopted by the
DEEWR (2008) study of the earlier 2006 Australian reforms. For simplicity we treat the
period prior to 1st July 2007 as pre-activation and the period from 1st July 2007 as post-
activation (i.e. we initially ignore the phasing in of activation).
Tables 2, 3 and 4 give the relevant mean durations of completed episodes. Note that
because of the way the sample is constructed, episodes ending after 1st July 2007 are,
by definition, longer on average than those ending prior to 1st July 2007, both for those
with a youngest child under seven and those with a youngest child aged seven or older.
But by comparing the change in mean durations of completed episodes, before and
after 1st July 2007 for the two age groups, we can get a simple unconditional
difference-in-differences estimate of the impact of activation on completed PP episode
duration. From Table 2 we can see that the average duration of PP episodes completed
after 1st July 2007 for those with youngest child under seven is 86% longer than those
completed prior to 1st July 2007; whereas for those with youngest child aged seven or

Table 2 Mean durations (Standard Deviations) and exit rates, all PP, before and after 1st
July 2007 by age of youngest child
Child under 7 at endof episode, episode,
ends before1st July 2007
Child 7+ at end ofepisode, episode
ends before1st July 2007
Child under 7 at endof episode, episode
ends after30th June 2007
Child 7+ at end ofepisode, episode
ends after30th June 2007
Completed PPepisodeduration, days
834 (723) 1568 (1118) 1554 (815) 2436 (1117)
Episodedurationincludingright-censoredepisodes
722 (954) 1171 (1369) 1310 (1058) 1709 (1414)
Proportion ofepisodesending withinwindow
13.9% 13.3% 12.9% 22.7%
Notes: Episode durations refer to complete episodes only and are measured in days. ‘Episode duration including right-censored episodes’ for the period up to 1st July 2007 takes this date as the right-censoring date. The denominator for‘proportion of episodes ending within window’ is the total number of episodes.
Fok and McVicar IZA Journal of Labor Policy 2013, 2:3 Page 9 of 21http://www.izajolp.com/content/2/1/3
older it is 55%. The corresponding unconditional difference-in-differences estimate is
therefore that activation has led to or has coincided with a reduction in mean duration of
completed PP episodes, for those covered by the new requirements, of 31%. The corre-
sponding unconditional difference-in-differences estimates for PPS and PPP recipients are
a reduction of 15% in mean PPS episode duration (see Table 3) and a reduction of 49% in
mean PPP episode duration (see Table 4). A similar unconditional difference-in-differ-
ences estimate of the impact of activation on episode duration including right-censored
episodes, where the right-censoring date is treated as the end date, suggests duration falls
by 36% for those covered by the new participation requirements. The equivalent figures
for PPS and PPP durations are falls of 34% and 65% respectively.
Tables 2, 3 and 4 also report the fraction of episodes that end before and after
30thJune 2007 for each of the age-of-youngest-child groups. We can use this infor-
mation in similar fashion to obtain rough, unconditional, difference-in-differences
Table 3 Mean durations (Standard Deviations) and exit rates, PPS only, before and after1st July 2007 by age of youngest child
Child under 7 at endof episode, episode
ends before1st July 2007
Child 7+ at end ofepisode, episode
ends before1st July 2007
Child under 7 at endof episode, episode
ends after30th June 2007
Child 7+ at end ofepisode, episode
ends after30th June 2007
Completed PPepisodeduration, days
983 (760) 1665 (1102) 1610 (829) 2485 (1101)
Episodedurationincludingright-censoredepisodes
901 (986) 1897 (1123) 1515 (1061) 2547 (1155)
Proportion ofepisodesending withinwindow
10.3% 13.3% 10.8% 23.9%
Notes: Episode durations refer to complete episodes only and are measured in days. ‘Episode duration including right-censored episodes’ for the period up to 1st July 2007 takes this date as the right-censoring date. The denominator for‘proportion of episodes ending within window’ is the total number of episodes.

Table 4 Mean durations (Standard Deviations) and exit rates, PPP only, before and after1st July 2007 by age of youngest child
Child under 7 at endof episode, episode
ends before1st July 2007
Child 7+ at end ofepisode, episode
ends before1st July 2007
Child under 7 at endof episode, episode
ends after30th June 2007
Child 7+ at end ofepisode, episode
ends after30th June 2007
Completed PPepisodeduration, days
658 (633) 1305 (1110) 1465 (786) 2274 (1155)
Episodedurationincludingright-censoredepisodes
505 (852) 1706 (1190) 1032 (977) 2379 (1243)
Proportion ofepisodesending withinwindow
23.6% 13.3% 18.5% 19.4%
Notes: Episode durations refer to complete episodes only and are measured in days. ‘Episode duration including right-censored episodes’ for the period up to 1st July 2007 takes this date as the right-censoring date. The denominator for‘proportion of episodes ending within window’ is the total number of episodes.
Fok and McVicar IZA Journal of Labor Policy 2013, 2:3 Page 10 of 21http://www.izajolp.com/content/2/1/3
estimates of the impact of activation on the probability of completing an episode by a
certain date. In this case the suggestion is that activation led to or coincided with an in-
crease in the proportion of episodes ending beyond 30thJune 2007 but prior to 30thJune
2009 of 9.4 percentage points for the treatment group, with a corresponding fall of one
percentage point for the comparison group, suggesting a difference-in-differences esti-
mate of a 10.4 percentage point increase in the proportion of episodes ending within
the period. The corresponding difference-in-differences estimates for PPS and PPP are
10.1 percentage points and 11.2 percentage points.
Figure 2 presents Kaplan-Meier (KM) hazard functions17 before and after ‘activation’,
separately for PPS and PPP recipients and by age group of youngest child, first for exits
to other IS payments and then for exits from IS altogether. Hazards for exit from both
PPS and PPP to other IS payments have increased for the grandfathered cohort follow-
ing 1st July 2007 whether the youngest child is aged seven or older or aged under seven,
but the increase in the hazard for those with older children is noticeably larger than
the increase in the hazard for those with younger children. For PPP recipients the in-
crease in the KM hazard for those with youngest child aged seven or older is particu-
larly pronounced. There is a similar picture for exits from IS, again with the impact on
PPP recipients particularly pronounced. Note that such exits are more common than
exits to other IS payments both before and after activation.
On balance the suggestion from both the simple unconditional difference-in-differences
estimates and the KM hazard plots is that the 2007 reforms coincided with a relative in-
crease in the hazard rate for exiting PP for those covered by the new requirements, both
to other IS payments and exiting IS altogether, and for both PPS and PPP recipients. The
result is shorter PP episode durations and fewer ongoing episodes relative to those not
covered by the new requirements.18 Activation also appears to have coincided with a lar-
ger relative increase in the hazard rate for covered PPP recipients compared to covered
PPS recipients (we return to this point later). In the following section we extend this age-
of-youngest based approach to try to better pin down the causal impact of activation on
outcomes in a proportional hazard model framework.

0.0
001
.000
2.0
003
.000
4.0
005
.000
6
0 100 200 300 400
duration since 30 June 2006, days
youngest child under 7 youngest child 7+
0.0
001
.000
2.0
003
.000
4.0
005
.000
6
0 100 200 300 400
duration since 30 June 2007, days
youngest child under 7 youngest child 7+
0.0
001
.000
2.0
003
.000
4.0
005
.000
6
0 100 200 300 400
duration since 30 June 2006, days
youngest child under 7 youngest child 7+
0.0
001
.000
2.0
003
.000
4.0
005
.000
6
0 100 200 300 400
duration since 30 June 2007, days
youngest child under 7 youngest child 7+
0.0
002
.000
4.0
006
.000
81 00.
.001
2
0 100 200 300 400
duration since 30 June 2006, days
youngest child under 7 youngest child 7+
0.0
002
.000
4.0
006
.000
81 00.
.001
2
0 100 200 300 400
duration since 30 June 2007, days
youngest child under 7 youngest child 7+
0.0
002
.000
4.0
006
.000
8100.
.001
2
0 100 200 300 400
duration of spell since 30 June 2006, days
youngest child under 7 youngest child 7+
0.0
002
.000
4.0
006
.000
8100.
.001
2
0 100 200 300 400
duration since 30 June 2007, days
youngest child under 7 youngest child 7+
PPS, exit to other IS, before activation PPS, exit to other IS, after activation
PPP, exit to other IS, before activationPPP, exit to
other IS, after
activation
PPS, exit from IS, before activation PPS, exit from IS, after activation
PPP, exit from IS, before activation
PPP, exit
from IS, after
activation
Figure 2 Kaplan-Meier daily hazard rates, by age of youngest child on 30 June 2006, by paymenttype, before and after activation. Note: Duration is measured from 30 June 2006 (before activation) or 30June 2007 (after activation) and episodes are treated as right-censored on 30 June 2007 (before activation)or 30 June 2008 (after activation) respectively.
Fok and McVicar IZA Journal of Labor Policy 2013, 2:3 Page 11 of 21http://www.izajolp.com/content/2/1/3
5. Econometric model and identification
We require that the probability of being treated is independent of outcomes, condi-
tional on observed characteristics and other control variables. One potential problem
related to the non-random phasing-in of the participation requirements for PP recipi-
ents with a child already aged seven years or older as of 1st July 2007 – with those

Fok and McVicar IZA Journal of Labor Policy 2013, 2:3 Page 12 of 21http://www.izajolp.com/content/2/1/3
deemed furthest from the labour market treated up to one year earlier than those
deemed closer to the labour market – is that those with unobserved characteristics as-
sociated with higher hazard rates are less likely to survive until treatment compared to
those with less favourable characteristics. There are also reasons to be concerned about
missing values and inaccuracies in the recording of activation interview dates in the
data. We therefore restrict the sample to focus on those in the grandfathered group
with a youngest child aged under seven as of 1st July 2007, but who then subsequently
turned seven during the following year. In other words we focus on parents on PP with
a youngest child aged six years old on 1st July 2007. Parents in this category were called
to interview within two weeks of the child’s seventh birthday, which is measured accur-
ately. Our treatment variable is therefore equal to zero for the period prior to the
child’s seventh birthday and equal to one following the child’s seventh birthday.
For a comparison group we take the equivalent cohort one year earlier, i.e. those
grandfathered parents with a youngest child aged six years old on 1st July 2006. The
youngest children of the parents in this group will turn seven during the subsequent
year running up to 30th June 2007, but this will not trigger activation because of the
grace period for grandfathered parents. Individuals are assumed to be at risk of exit
from the 30th June 2006 (comparison group) or the 30th June 2007 (treatment group),
with ongoing episodes treated as right-censored as of 30th June 2007 (comparison
group) or 30th June 2008 (treatment group).
Our outcomes of interest are the single risk hazard rate for exit from PP (including exit
to other IS payments) and competing risk hazard rates for exits from PP to other IS bene-
fits and exits from PP off IS altogether.19 We take a reduced form Cox Proportional
Hazards (CPH) approach to estimation (see van den Berg, 2001) as given below:
h tð Þ ¼ h0 tð Þ expðαDþ β1x1 þ…þ βNxN þ γ1treatmentgroup
þγ2turned7þ δturned7�treatmentgroupÞ ð1Þ
In (1), h(t) is the hazard rate for the relevant outcome, h0(t) is the baseline hazard, D is
elapsed duration in the current episode prior to 30thJune 2006 (for the comparison group)
or 30th June 2007 (for the treatment group), x1…xN are observed individual characteristics
of the parent, e.g. gender, number of children, and whether born outside Australia,
treatmentgroup is a binary dummy indicating whether the individual is in the treatment
group (those with a six year old child on 1st July 2007), and turned7 is a binary dummy
equal to zero for parents with a youngest child aged six and equal to one with a youngest
child aged seven. We interpret the interaction of these last two terms as the treatment in-
dicator, withour estimate of the treatment effect therefore given by δ̂ .
Specified in this way, the treatmentgroup dummy controls for differences in (observed
and unobserved) characteristics between the treatment and control groups (which in any
case look similar in terms of observed characteristics), and the turned7 dummy controls
for any differences in PP claiming associated with the child turning seven that are not re-
lated to activation (which in any case are likely to be small because all six and seven year
olds are required to attend school throughout Australia). Differential trends over the one-
year periods in question for these two groups can be plausibly ruled out given their high
degree of similarity. It’s also difficult to think of any plausible candidate for an empirically
important asymmetric shock during these one-year periods. For example, the labour

Fok and McVicar IZA Journal of Labor Policy 2013, 2:3 Page 13 of 21http://www.izajolp.com/content/2/1/3
market impacts of the global financial crisis, which in any case were more muted in
Australia than in many other OECD countries, were not felt until late 2008/early 2009,
after the period of interest here.
Even in the absence of phasing in of treatment for this restricted sample, however, it
is still possible for PP recipients in either the comparison or treatment groups to exit
PP before their youngest child turns seven. In other words those still on PP when their
youngest child turns seven may form a select group. But because we are looking at a
relatively short window (most individuals in both groups survive until this point) and
because the groups are observationally so similar, this is unlikely to impart a large
selection bias. Our results are also robust to adding a (gamma-distributed) unobserved
heterogeneity term to (1).20
All told we believe we have a compelling identification strategy, at least compared to
many of the non-experimental estimates of the impacts of the 1990s US reforms.21
Having said that, our estimates are for rather narrowly drawn outcomes, and for a rela-
tively narrow group of parents (although arguably the most interesting group), so we
trade-off a high degree of internal validity for potentially lower external validity.22
6. Estimated impacts of activation on hazard rates
First consider the single risk hazard model for exits from PP presented in Table 5.
Controls generally take expected signs (e.g. see Gregory and Klug, 2003; Gong, 2004),
although coefficients are not always statistically significant: males have higher hazards;
older parents have marginally lower hazards for PPS; immigrant PPP recipients have
lower hazards; PPS recipients with more children have lower hazards; and the unemploy-
ment rate is negatively related to the hazard. Elapsed duration in the current episode prior
to being at risk is negatively related to the hazard, consistent with the standard finding of
a downward sloping hazard function for welfare exit. Hazards are also lower for those in
the treatment group, given activation status, capturing differences in characteristics be-
tween the two groups not otherwise controlled for. The zero coefficients on the dummy
for youngest child turning seven, both here and in the competing risks estimates, can be
interpreted as placebo tests: for those in the comparison group this has no impact on
either the single risk hazard or the competing risks hazards.
Turning to the estimated treatment effects, when the model is estimated on all
grandfathered PP recipients, the coefficient on the treatment dummy is large, positive
and highly statistically significant, with the single risk hazard 64% higher following
treatment than prior to treatment, other things being equal. As a consequence, over
the first year of the new regime the caseload for those grandfathered parents with a
youngest child aged 6 at the start of the year fell by 23.5%;without activation it would
have fallen by 18.5%, i.e. a difference of 5 percentage points.23 If we extrapolate this es-
timated impact for two years and assume that everyone is treated on day 1 of the first
year, then the estimated caseload for this group falls by 45% compared to an estimated
34% under the counterfactual, i.e. an additional drop of 11 percentage points.
So, like the earlier US reforms, the Australian reforms had large, positive, and statisti-
cally significant impacts on welfare exit. At first glance the caseload impact of these
Australian reforms appears to be around twice as large as the average reduction in
caseload attributed to the introduction of work requirements in the US reported by

Table 5 Cox proportional hazard model, single risk (All Exits from PP), restricted sample,coefficients (Standard Errors)
All GrandfatheredPP recipients
GrandfatheredPPP recipients
GrandfatheredPPS recipients
Activation .639*** .882*** .511***
(.104) (.183) (.127)
Treatment group -.232*** -.195 -.204**
(.075) (.134) (.091)
Youngest child 7 years old -.021 -.034 .003
(.076) (.131) (.093)
Male .234*** .135 .144
(.083) (.127) (.111)
Age of parent -.007* .006 -.017***
(.004) (.007) (.005)
Immigrant parent -.020 -.390*** -.026
(.060) (.097) (.079)
Number of children under 16 years .021 .003 -.066*
(.026) (.040) (.037)
LFSR unemployment rate, % -.054*** -.079** -.053**
(.020) (.036) (.024)
Past IS duration, years -.007 -.007 -.006
(.007) (.014) (.009)
Elapsed duration of current episode prior to 30June 2006 (control group) and 30 June 2007(treatment group), years
-.145*** -.140*** -.142***
(.011) (.018) (.014)
No. Individuals 6490 1486 5004
No. Failures 1552 517 1035
Log (pseudo) likelihood −13284 −3603 −8616
Notes: ***, ** and * denote statistical significance at 99%, 95% and 90% respectively. The restricted sample combinesthose with a youngest child aged 6 years on the 30th June 2006 (control group) and those with a youngest child aged6 years on 30th June 2007 (treatment group). Returners to PP after 30 June 2006 are omitted. The treatment groupdummy is equal to 1 for those in the latter group and 0 for those in the former group. The youngest child aged 7dummy is equal to one for those with a youngest child aged 7 years and 0 otherwise. Activation is a binary dummyequal to the product of the treatment group and youngest child aged 7 dummies. Age of parent is expressed in years.Past IS episode duration is expressed in years (since 1st January 1998) as is elapsed duration of current episode. Resultsare presented in coefficient form, i.e. the βs, γs and δs from Equation (1), and are interpretable as semi-elasticities. Robuststandard errors in parentheses.
Fok and McVicar IZA Journal of Labor Policy 2013, 2:3 Page 14 of 21http://www.izajolp.com/content/2/1/3
Grogger and Karoly (2005). But there are several important caveats to note which make
any such comparison of magnitudes difficult to interpret. First, this is an estimate of a
local average treatment effect for a particular group of existing claimants. Second, we
have assumed no re-entry (given that grandfathered status is lost on exit). Third, it is
not straightforward to compare the ‘toughness’ of the Australian participation require-
ment to the average toughness of such requirements in the US covered by the experi-
mental studies cited by Grogger and Karoly (2005).
Estimating the model separately on PPS and PPP recipients suggests the positive im-
pact is common to both payment types, although the impact of activation appears to
belarger for PPP recipients (the hazard increases by 88%) compared to PPS recipients
(the hazard increases by 51%). PPP recipients may respond more strongly to activation
than PPS recipients for a number of reasons. First, working 15 hours per week in paid
employment is more likely to render a PPP recipient ineligible for PP on income

Fok and McVicar IZA Journal of Labor Policy 2013, 2:3 Page 15 of 21http://www.izajolp.com/content/2/1/3
grounds than is the case for PPS recipients. Second, although increased participation
requirements may make PP less attractive for both PPS and PPP recipients – we can
think of this as a harassment effect –PPPrecipients may be better able to compensate
at a household level for lost PP income (if they exit) by increasing partner income, e.g.
through increased earnings.24 There may also be compositional differences between PPS
and PPP recipients in terms of unobservables – we know from Table 1 that there are diffe-
rences in observables between the two groups – which could drive differences between the
groups in the average impact of activation, although this could work in either direction.
Now consider the competing risks estimates for leaving PP for another IS payment
presented in Table 6.25 Few characteristics controls are statistically significant, but
where they are they generally take signs as we would expect: males (PPS recipients
only), immigrants, those with more children under 16 and those with more previous
time in receipt of IS prior to the current spell all have higher hazards for switching be-
tween payments, other things being equal. Elapsed duration in the current episode has
a marginally significant negative impact on the hazard for exit to other IS payments,
but of much smaller magnitude than in the single risk case. Again the treatment group
dummy takes a negative sign and the dummy for youngest child turning 7 has no im-
pact on the hazard.
Turning to the estimated treatment effects, for both PPS and PPP recipients there is
a large, positive and highly statistically significant impact of activation on the hazard
for exit to other IS payments, with the hazard more than doubling in each case. In
other words, consistent with earlier evidence for Australia (e.g. DEEWR, 2008) and
elsewhere (e.g. Petrongolo, 2009), tightening the conditionality of PP in 2007 had a sig-
nificant impact in terms of displacement onto other IS payments. This may partly re-
flect the ‘hard-to-help’ nature of this group, many of whom had been on IS for several
years prior to activation. Of course those moving to NSA or other ‘active’ IS payments
may subsequently be more likely to exit IS than would otherwise have been the case,
but those moving to DSP and other less active payments may be less so, or may take
longer to do so than they would have in the absence of the reforms. The net effect of
these reform impacts may therefore be to increase IS dependency. Note that in this
case the estimated treatment effects appear very similar in magnitude for PPP recipi-
ents and PPS recipients. The implication is that the apparent PPP-PPS gap in the single
risk case is being driven by exits from IS rather than switches between IS payments.
Next consider exits from IS (Table 7). Again controls are either insignificant or take
expected signs: males and younger parents have higher hazards; immigrants, those in
high unemployment labour markets and those with more previous time in receipt of IS
have lower hazards. Again, elapsed duration in the current spell has a large negative
impact on the hazard, the treatment group dummy takes a negative sign, and the
dummy for youngest child turning 7 has no impact.
The estimated treatment effects, for both PPS and PPP recipients, again suggest a
large, positive and highly statistically significant impact of activation. So the 2007 re-
forms did shift low income parents off IS, at least in the short term. These impacts are
smaller in proportional terms than the impacts on switches between IS payments, but
because the baseline hazard for welfare switches is lower than that for exits from IS,
exits to other IS payments only constitute just over one third of the overall impact on
caseload.26 The activation impact on exits from IS is again larger (more than double)

Table 6 Cox proportional hazard model, exit to other IS, restricted sample, coefficients(Standard Errors)
All GrandfatheredPP recipients
GrandfatheredPPP recipients
GrandfatheredPPS recipients
Activation 1.14*** 1.23*** 1.07***
(.223) (.362) (.282)
Treatment group -.489*** -.473* -.446**
(.171) (.285) (.217)
Youngest child 7 years old -.057 -.064 -.027
(.163) (.261) (.210)
Male .231 -.208 .386*
(.174) (.283) (.218)
Age of parent .004 .007 -.004
(.010) (.017) (.013)
Immigrant parent .252** .049 .061
(.120) (.183) (.175)
Number of children under 16 years .098* -.047 .083
(.054) (.083) (.078)
LFSR unemployment rate, % .050 .046 .027
(.042) (.071) (.053)
Past IS duration .101*** .114*** .107***
(.012) (.027) (.014)
Elapsed duration of current episode prior to 30June 2006 (control group) and 30 June 2007(treatment group), years
-.039* -.008 -.048*
(.022) (.034) (.029)
No. Individuals 6490 1486 5004
No. Failures 358 136 222
Log (pseudo)likelihood −3029 −944 −1821
Notes: ***, ** and * denote statistical significance at 99%, 95% and 90% respectively. The restricted sample combinesthose with a youngest child aged 6 years on the 30th June 2006 (control group) and those with a youngest child aged6 years on 30th June 2007 (treatment group). Returners to PP after 30 June 2006 are omitted. The treatment groupdummy is equal to 1 for those in the latter group and 0 for those in the former group. The youngest child aged 7dummy is equal to one for those with a youngest child aged 7 years and 0 otherwise. Activation is a binary dummyequal to the product of the treatment group and youngest child aged 7 dummies. Age of parent is expressed in years.Past IS episode duration is expressed in years (since 1st January 1998) as is elapsed duration of current episode. Resultsare presented in coefficient form, i.e. the βs, γs and δs from Equation (1), and are interpretable as semi-elasticities. Robuststandard errors in parentheses.
Fok and McVicar IZA Journal of Labor Policy 2013, 2:3 Page 16 of 21http://www.izajolp.com/content/2/1/3
for PPP recipients than for PPS recipients, likely to reflect some combination of tighter
income tests for PPP recipients, better ‘outside options’ for PPP recipients and compos-
itional differences between the two groups.
Finally, anticipation effects – in the spirit of Black et al. (2003) – for those whose
youngest child is aged six after 1st July 2007, could impart bias. We test robustness to
this by including a dummy for the youngest child being between 6 years and 9 months
and 7 years old, together with the interaction between this dummy and the treatment
group dummy, with the latter intended to capture anticipation effects. The estimated
treatment effects from this augmented model are presented in Table 8. In all cases the
anticipation term is statistically insignificant, suggesting that parents are not exiting PP
in anticipation of activation. The estimated treatment effects are also generally robust
to this extension (slightly larger in the case of exits to other IS payments and slightly
smaller in the case of exits from IS).

Table 7 Cox proportional hazard model, exit from IS, restricted sample, coefficients(Standard Errors)
All GrandfatheredPP recipients
GrandfatheredPPP recipients
GrandfatheredPPS recipients
Activation .482*** .758*** .346**
(.118) (.213) (.143)
Treatment group -.166** -.095 -.151
(.083) (.152) (.100)
Youngest child 7 years old -.006 -.017 .015
(−.086) (.154) (.103)
Male .243*** .215 .081
(.094) (.145) (.129)
Age of parent -.012*** .004 -.023***
(.005) (.08) (.006)
Immigrant parent -.103 -.551*** -.052
(.068) (.115) (.088)
Number of children under 16 years -.001 .019 -.110***
(.031) (.045) (.041)
LFSR unemployment rate, % -.084*** -.130*** -.073***
(.023) (.043) (.027)
Past IS duration, years -.046*** -.049*** -.048***
(.008) (.016) (.010)
Elapsed duration of current episode prior to 30June 2006 (control group) and 30 June 2007(treatment group), years
-.173*** -.188*** -.170***
(.013) (.022) (.016)
No. Individuals 6490 1486 5004
No. Failures 1194 381 813
Log (pseudo)likelihood −10186 −2633 −6742
Notes: ***, ** and * denote statistical significance at 99%, 95% and 90% respectively. The restricted sample combinesthose with a youngest child aged 6 years on the 30th June 2006 (control group) and those with a youngest child aged6 years on 30th June 2007 (treatment group). Returners to PP after 30 June 2006 are omitted. The treatment groupdummy is equal to 1 for those in the latter group and 0 for those in the former group. The youngest child aged 7dummy is equal to one for those with a youngest child aged 7 years and 0 otherwise. Activation is a binary dummyequal to the product of the treatment group and youngest child aged 7 dummies. Age of parent is expressed in years.Past IS episode duration is expressed in years (since 1st January 1998) as is elapsed duration of current episode. Resultsare presented in coefficient form, i.e. the βs, γs and δs from Equation (1), and are interpretable as semi-elasticities. Robuststandard errors in parentheses.
Fok and McVicar IZA Journal of Labor Policy 2013, 2:3 Page 17 of 21http://www.izajolp.com/content/2/1/3
Estimates are also robust to estimating on females only, to extending the sample to in-
clude those with youngest child aged 6 on 30th June 2008 (censored at 30th June 2009),
and to inclusion in (1) of a (gamma-distributed) term for unobserved heterogeneity.
7. ConclusionsThe evidence presented here shows that the welfare to work reforms for Australian low
income parents introduced in 2007 led to an increase in exits from PP and a further re-
duction in PP caseload on top of that caused by the first round of reforms in 2006. Fol-
lowing activation, grandfathered low-income parents were more likely to exit PP, driven
by increases in the hazards for both switching from PP to another IS payment and for
exiting IS altogether. These estimated impacts are large in magnitude, suggesting that
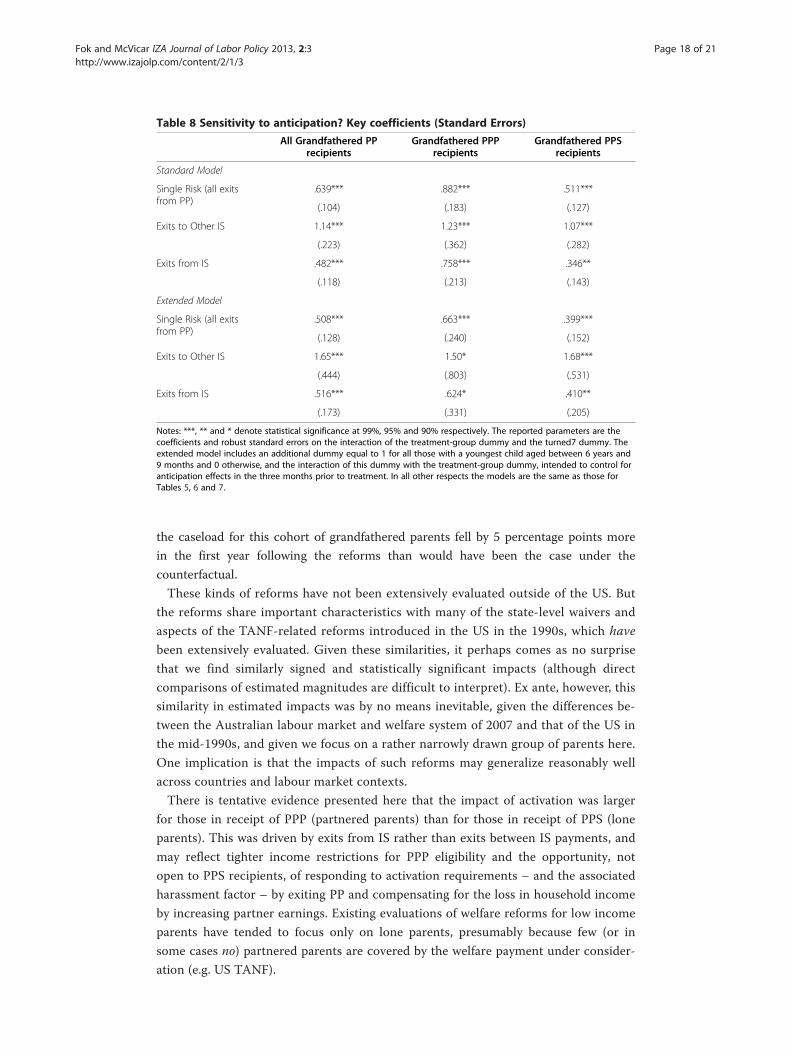
Table 8 Sensitivity to anticipation? Key coefficients (Standard Errors)
All Grandfathered PPrecipients
Grandfathered PPPrecipients
Grandfathered PPSrecipients
Standard Model
Single Risk (all exitsfrom PP)
.639*** .882*** .511***
(.104) (.183) (.127)
Exits to Other IS 1.14*** 1.23*** 1.07***
(.223) (.362) (.282)
Exits from IS .482*** .758*** .346**
(.118) (.213) (.143)
Extended Model
Single Risk (all exitsfrom PP)
.508*** .663*** .399***
(.128) (.240) (.152)
Exits to Other IS 1.65*** 1.50* 1.68***
(.444) (.803) (.531)
Exits from IS .516*** .624* .410**
(.173) (.331) (.205)
Notes: ***, ** and * denote statistical significance at 99%, 95% and 90% respectively. The reported parameters are thecoefficients and robust standard errors on the interaction of the treatment-group dummy and the turned7 dummy. Theextended model includes an additional dummy equal to 1 for all those with a youngest child aged between 6 years and9 months and 0 otherwise, and the interaction of this dummy with the treatment-group dummy, intended to control foranticipation effects in the three months prior to treatment. In all other respects the models are the same as those forTables 5, 6 and 7.
Fok and McVicar IZA Journal of Labor Policy 2013, 2:3 Page 18 of 21http://www.izajolp.com/content/2/1/3
the caseload for this cohort of grandfathered parents fell by 5 percentage points more
in the first year following the reforms than would have been the case under the
counterfactual.
These kinds of reforms have not been extensively evaluated outside of the US. But
the reforms share important characteristics with many of the state-level waivers and
aspects of the TANF-related reforms introduced in the US in the 1990s, which have
been extensively evaluated. Given these similarities, it perhaps comes as no surprise
that we find similarly signed and statistically significant impacts (although direct
comparisons of estimated magnitudes are difficult to interpret). Ex ante, however, this
similarity in estimated impacts was by no means inevitable, given the differences be-
tween the Australian labour market and welfare system of 2007 and that of the US in
the mid-1990s, and given we focus on a rather narrowly drawn group of parents here.
One implication is that the impacts of such reforms may generalize reasonably well
across countries and labour market contexts.
There is tentative evidence presented here that the impact of activation was larger
for those in receipt of PPP (partnered parents) than for those in receipt of PPS (lone
parents). This was driven by exits from IS rather than exits between IS payments, and
may reflect tighter income restrictions for PPP eligibility and the opportunity, not
open to PPS recipients, of responding to activation requirements – and the associated
harassment factor – by exiting PP and compensating for the loss in household income
by increasing partner earnings. Existing evaluations of welfare reforms for low income
parents have tended to focus only on lone parents, presumably because few (or in
some cases no) partnered parents are covered by the welfare payment under consider-
ation (e.g. US TANF).

Fok and McVicar IZA Journal of Labor Policy 2013, 2:3 Page 19 of 21http://www.izajolp.com/content/2/1/3
Endnotes1 For a related review of European Active Labour Market Policy (ALMP) impacts on
women see Bergemann and van den Berg (2008).2 For example, Indiana’s IMPACT program introduced a work or related activity re-
quirement of 20 hours per week (see Grogger and Karoly, 2005). The UK introduced
similar requirements for lone parents with a youngest child aged seven years or older
in 2010 (see Lane et al., 2011).3 For example, very few partnered parents were ever part of the AFDC program and
payments to partnered parents were abolished with the introduction of TANF in 1996
(see Moffitt, 2008). Evaluations tend to focus on lone parents as a result.4 Centrelink is the agency that administers welfare payments and assigns welfare re-
cipients to assistance programs in Australia.5 There is some variation across states in the school entry age, but all six year olds in
all states are required to be in school.6 Activity Agreements are similar in nature to UK Jobseeker’s Agreements (for more
details see Manning, 2009).7 The 2011-12 Federal Budget announced an incremental reduction in this upper age
limit but one that falls outside the period of our study.8 The existing requirement (since 2003) to attend an annual interview remained for
those with a youngest child aged six.9 75% of this group had been interviewed by the end of December 2007 and 99% by the
end of June 2008. The first group of interviewees included those not engaged in any paid
work and not registered with Job Network (the umbrella organization for providers of job
search assistance and other employment services). The second group included those work-
ing less than 15 hours per week but not registered with Job Network or those registered
with Job Network but not in paid work. Those in the third group – activated last – were
already working 15 or more hours per week.10 81.5% of those that signed an Activity Agreement did so on the interview date. For the
remainder, the mean gap between interview and signing an Activity Agreement was 93 days.11 16% attended an interview but did not subsequently sign an Activity Agreement in
the same PP episode.12 Grandfathered PP recipients whose youngest child is aged under seven have no
participation requirements but may voluntarily access employment services.13 They may also be accompanied by measures to improve financial incentives to
work, e.g. in-work tax credits or back to work bonuses.14 Moffitt (2008), p21 suggests that “a large fraction, if not the majority, arose from
decreased entry to the program rather than increased exit”.15 Also see Gregory and Klug (2003) for earlier Australian evidence on switches be-
tween welfare payments for low income parents.16 For example, they estimate that 23% of new PPS claimants with a youngest child
aged 6-7 years had left IS after 6 months compared to 12% under the counterfactual.
For those new claimants (re-)directed to NSA, the equivalent estimates were 38% ver-
sus 27% (lone parents) and 45% versus 32% (partnered parents), i.e. a similar propor-
tional increase for lone and partnered parents.17 KM hazards show the daily probability of exiting PP to a particular ‘destination’
given the parent has remained on PP until that day. Note that the daily hazards are very
Fok and McVicar IZA Journal of Labor Policy 2013, 2:3 Page 20 of 21http://www.izajolp.com/content/2/1/3
low – typically fewer than one in a thousand parents in receipt of PP on 30th June
2006 or 30th June 2007 exit on any given day subsequently – reflecting the long aver-
age duration of PP episodes (see Table 1).18 If anything these preliminary estimates may understate the impact of the reforms
because they treat the implementation date as 1st July 2007 (for many it was later) and
because some of those assigned to the comparison group on age of youngest grounds
will themselves receive the ‘treatment’ when their youngest child turns seven.19 For tractability we assume independent competing risks.20 One model with unobserved heterogeneity fails to converge because of a flat likeli-
hood function. We therefore present the estimates from the models not including un-
observed heterogeneity, for which the full set are available.21 A common approach in this literature was to estimate state level panels with state
and time fixed effects, with welfare reform packages captured by policy dummies. Blank
(2002) sets out some of the potential problems with this approach, not least of which is
the possibility that asymmetric state-level shocks or differential state-level trends may
bias estimated treatment effects. Some studies in this literature adopted an identifica-
tion strategy based on age of youngest child (e.g. Grogger, 2004), and in this respect are
closer to our own strategy.22 For example, if treatment effects are heterogeneous by age of youngest child then
our estimates may not generalize well for those with youngest child aged eight years
or above.23 Assuming a uniform distribution of child birthdays throughout the year, on average
individuals are treated from halfway through this first year.24 Although our data do not include information on labour force participation fol-
lowing exit from IS, it seems likely that at least some former PP recipients, and par-
ticularly former PPP recipients, move to non-claimant inactivity as a result of this
harassment effect. (Manning 2009) suggests something similar happened in the UK as
a result of reforms to unemployment benefits). The extent to which we might interpret
this as a positive outcome of the reforms depends on the relative weights we give to
the twin objectives of reducing benefit expenditures and increasing labour force
participation.25 Such exits include switches to NSA, to DSP, and some switches from PPP to PPS.
(Activated PPS recipients cannot switch to PPP because they would be treated as a new
claimant and therefore re-directed to another payment, most likely NSA).26 The closest we can get to a comparison between the magnitude of this ‘exits from
IS’ impact with that estimated by DEEWR (2008) for new claimant lone parents with
youngest children aged 6-7 years is to compare the proportion of each group off IS
after six months under the actual and counterfactual scenarios in each case. DEEWR
(2008) suggest 23% of the new claimants had left IS after 6 months compared to 12%
under the counterfactual. Our estimates suggest 12% of the grandfathered cohort had
left IS after 6 months compared to 8% under the counterfactual. (Note that this as-
sumes none of those that exit IS re-enter within the 6 months, so this is likely to over-
estimate the reduction in IS caseload).
Competing interestsThe IZA Journal of Labor Policy is committed to the IZA Guiding Principles of Research Integrity. The authors declarethat they have observed these principles.

Fok and McVicar IZA Journal of Labor Policy 2013, 2:3 Page 21 of 21http://www.izajolp.com/content/2/1/3
AcknowledgementsThis paper is based on research commissioned by the Australian Government Department of Education, Employmentand Workplace Relations (DEEWR) under the Social Policy Research Services Agreement (2010–2012) with theMelbourne Institute of Applied Economic and Social Research. Thanks to all those who offered useful advice duringthe course of the project. Thanks also to seminar participants at the Melbourne Institute and the 2012 EconometricSociety Australasian Meeting for helpful comments. The views expressed are those of the authors alone and do notrepresent those of DEEWR or the Melbourne Institute.
Responsible editor: David Neumark.
Received: 06 December 2012 Accepted: 23 February 2013
References
Published: 19 April 2013
Banks M (2005) Parents, social security and the JET Active Labour Market Program in Australia: fitting the needs of themarket or marketing the need to fit? Paper presented to Transitions and Risk: New Directions in Social Policyconference. University of Melbourne
Barrett GF, Cobb-Clark D (2000) The labour market plans of Parenting Payment recipients: information from arandomised social experiment. Australian J Labour Econ 4(3):192–205
Bergemann A, van den Berg G (2008) Active labor market policy effects for women in Europe: a survey. Annalesd’Economieet de Statistique 91/92:377–399
Black DA, Smith JA, Berger MC, Noel BJ (2003) Is the threat of reemployment services more effective than the servicesthemselves? Evidence from random assignment in the UI system. Am Econ Rev 93(4):1313–1327
Blank RM (2002) Evaluating welfare reform in the United States. J Econ Lit 40(4):1105–1166Carcillo S, Grubb D (2006) From inactivity to work: the role of Active Labour Market Policies. OECD Social, Employment
and Migration Working Papers No. 36. OECD, ParisCebulla A, Flore G, Greenberg D (2008) The New Deal for Lone Parents, lone parent Work Focused Interviews and Working
Families Tax Credits: a review of impacts. Department for Work and Pensions Research Report No. 484, LondonDEEWR (2008) Welfare to Work Evaluation Report. Department of Education, Employment and Workplace Relations,
CanberraDockery AM, Stromback T (2004) An evaluation of a Parenting Payment intervention program. Australian J Soc Issues
39(4):431–442Finn D, Gloster R (2010) Lone parent obligations: A review of recent evidence on the work-related requirements within
the benefit systems of different countries. Department for Work and Pensions Research Report No. 632. HMSO,Norwich
Fredriksson P, Holmlund B (2005) Optimal unemployment insurance design: time limits, monitoring, or workfare?Institute for Labor Market Policy Evaluation Working Paper 2005:13
Gong X (2004) Transition patterns for the welfare reliance of low-income mothers in Australia. IZA Discussion PaperNo. 1047. IZA, Bonn
Gregory RG, Klug E (2003) A picture book primer: welfare dependency and the dynamics of female lone parent spells.Australian National University, Canberra
Grogger J (2004) Time limits and welfare use. J Hum Resour 39(2):405–424Grogger J, Michalopoulos C (2003) Welfare dynamics under time limits. J Polit Econ 111(3):530–554Grogger J, Karoly LA (2005) Welfare Reform: Effects of a Decade of Change. Harvard University Press, Cambridge, MAHeckman JJ, Lalonde RJ, Smith JA (1999) The Economics and Econometrics of Active Labour Market Programs.
In: Ashenfelter O, Card D (eds) Handbook of Labour Economics Volume 3A. Elsevier, AmsterdamJohnson TR, Klepinger DH (1994) Experimental evidence on Unemployment Insurance work-search policies.
J Hum Resour 29(3):695–717Lane P, Casebourne J, Lanceley L, Davies M (2011) Lone parent obligations: work, childcare and the Jobseeker’s
Allowance regime. Department for Work and Pensions, Research Report 782. HMSO, NorwichManning A (2009) ‘You can’t always get what you want: the impact of the UK Jobseeker’s Allowance. Labour Econ
16:239–250Martin JP, Grubb D (2001) What works for whom? A review of OECD countries experiences with active labour market
policies. OECD Working Paper 14. OECD, ParisMoffitt R (2008) Institute for Labor Market Policy Evaluation Working Paper 2008–13. UppsalaOECD (2007) Babies and Bosses: Reconciling Work and Family Life. OECD, ParisOECD (2012) OECD Stat Abstracts: Real Hourly Minimum Wages. OECD, Paris, http://stats.oecd.org/Petrongolo B (2009) What are the long term effects of UI? Evidence from the UK JSA reforms. J Public Econ
93:1234–1253Van den Berg GJ (2001) Duration models: specification, identification and multiple durations. In: Heckman J, Leamer E (eds)
Handbook of Econometrics Volume 5. Elsevier/North Holland, Amsterdam
doi:10.1186/2193-9004-2-3Cite this article as: Fok and McVicar: Did the 2007 welfare reforms for low income parents in Australia increasewelfare exits?. IZA Journal of Labor Policy 2013 2:3.