did the coal phase-out reduce ontario air pollution? - … · · 2017-01-16to the phasing out of...
TRANSCRIPT

fraserinstitute.org
fraserinstitute.org / i
Contents
Executive summary / iii
Introduction / 1
Data and modeling / 9
Results / 15
Discussion / 19
References / 21
About the authors / 23
Acknowledgments / 23
Publishing information / 24
Supporting the Fraser Institute / 25
Purpose, funding, & independence / 25
About the Fraser Institute / 26
Editorial Advisory Board / 27

fraserinstitute.org
fraserinstitute.org / iii
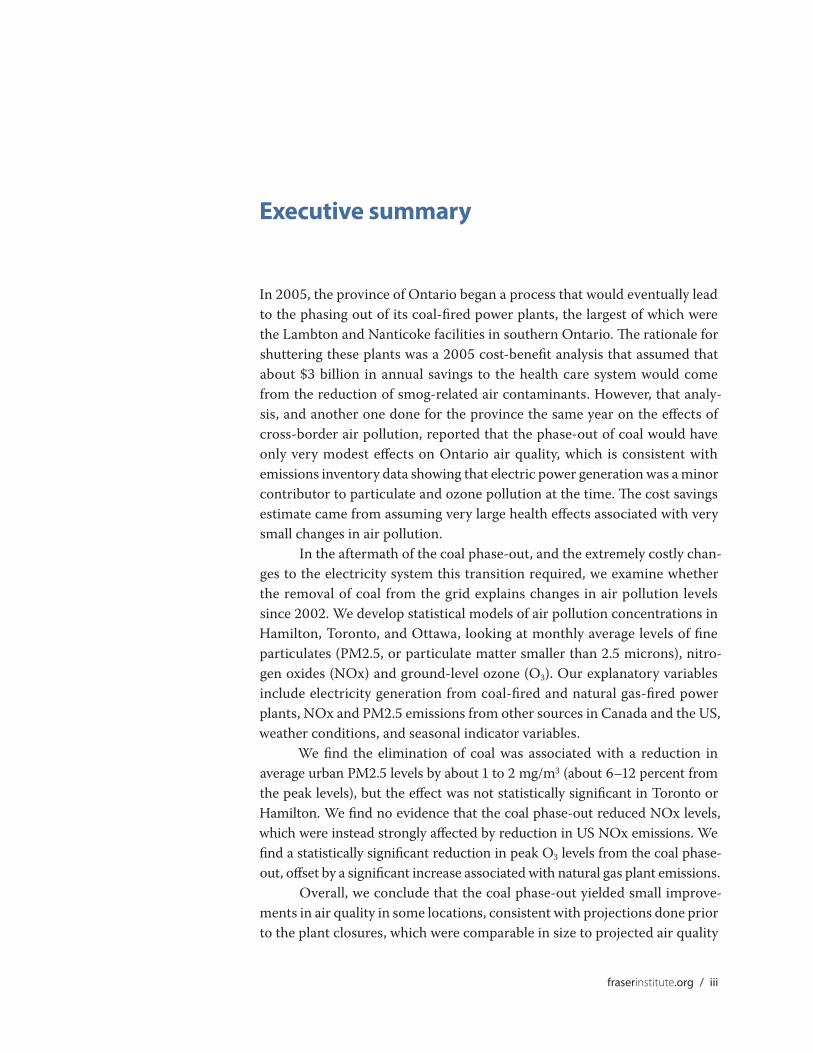
Executive summary
In 2005, the province of Ontario began a process that would eventually lead to the phasing out of its coal-fired power plants, the largest of which were the Lambton and Nanticoke facilities in southern Ontario. The rationale for shuttering these plants was a 2005 cost-benefit analysis that assumed that about $3 billion in annual savings to the health care system would come from the reduction of smog-related air contaminants. However, that analy-sis, and another one done for the province the same year on the effects of cross-border air pollution, reported that the phase-out of coal would have only very modest effects on Ontario air quality, which is consistent with emissions inventory data showing that electric power generation was a minor contributor to particulate and ozone pollution at the time. The cost savings estimate came from assuming very large health effects associated with very small changes in air pollution.
In the aftermath of the coal phase-out, and the extremely costly chan-ges to the electricity system this transition required, we examine whether the removal of coal from the grid explains changes in air pollution levels since 2002. We develop statistical models of air pollution concentrations in Hamilton, Toronto, and Ottawa, looking at monthly average levels of fine particulates (PM2.5, or particulate matter smaller than 2.5 microns), nitro-gen oxides (NOx) and ground-level ozone (O3). Our explanatory variables include electricity generation from coal-fired and natural gas-fired power plants, NOx and PM2.5 emissions from other sources in Canada and the US, weather conditions, and seasonal indicator variables.
We find the elimination of coal was associated with a reduction in average urban PM2.5 levels by about 1 to 2 mg/m3 (about 6–12 percent from the peak levels), but the effect was not statistically significant in Toronto or Hamilton. We find no evidence that the coal phase-out reduced NOx levels, which were instead strongly affected by reduction in US NOx emissions. We find a statistically significant reduction in peak O3 levels from the coal phase-out, offset by a significant increase associated with natural gas plant emissions.
Overall, we conclude that the coal phase-out yielded small improve-ments in air quality in some locations, consistent with projections done prior to the plant closures, which were comparable in size to projected air quality

iv / Did the coal phase-out reduce Ontario air pollution?
fraserinstitute.org
improvements that could have been achieved through installation of new pol-lution control systems rather than closing the plants. This has implications for understanding the costs and benefits of a coal phase-out, such as the one being contemplated in Alberta.

fraserinstitute.org / 1
Introduction
Background
In 2005, the province of Ontario began a process that would eventually lead to the phasing out of its coal-fired power plants. While the plan included three smaller plants, two of which were in Northern Ontario (at Thunder Bay and Atikokan), the main component involved the two largest plants which were located in Southern Ontario, namely the Lambton and Nanticoke thermal generating stations, which at the time accounted for about a quarter of the province’s generating capacity. The Ontario government has long maintained that these closures were necessary to reduce air pollution and protect public health. For instance, the 2010 Ontario Long Term Energy Plan refers to the plant closure as follows:
Worst of all, Ontario relied heavily on five air-polluting coal plants. This wasn’t just polluting our air, it was polluting our lungs. Doctors, nurses and researchers stated categorically that coal generation was having an impact on health increasing the incidence of various respira-tory illnesses. A 2005 study prepared for the government found that the average annual health-related damages due to coal could top $3 billion. For the sake of our well-being, and our children’s well-being, we had to put a stop to coal. (Ontario, Ministry of Energy, 2010: 2)
However, there was evidence at the time to suggest that these claims were implausible. Some of this evidence was reviewed in a 2005 Fraser Institute report entitled Pain Without Gain: Shutting Down Coal-Fired Power Plants Would Hurt Ontario. While acknowledging that the plants contributed to Ontario air pollution, it concluded, among other things, that:
Our review of the evidence suggests that the coal-fired plants have a relatively small environmental impact … Coal-fired power plants play a small role at present in the formation of pollution and smog. (McKitrick et al., 2005: 2, 7)

2 / Did the coal phase-out reduce Ontario air pollution?
fraserinstitute.org
While controversial at the time, this idea was supported by ample evi-dence. One purpose of this report is to make use of data available as a result of the coal phase-out to evaluate the impact on Ontario air pollution. As will be shown, the claim in McKitrick et al. (2005) has subsequently been borne out in the data. Other evidence available in 2005 that contradicted the gov-ernment’s claim include the following.
Coal was only a minor proportion of particulate emissionsData from Environment Canada1 shows that in the years leading up to the 2005 decision, power generation was only a small contributor to fine par-ticulate (PM2.5)2 emissions in Ontario. In Ontario in 2005, Electric Power Generation (EPG) was responsible for just under 2,000 tonnes of PM2.5 emis-sions, which is only seven-tenths of one percent of the total and far less than other sources which were not being blamed for air quality issues at the time (figure 1).
1. Available online at <http://www.ec.gc.ca/inrp-npri/donnees-data/ap/index.cfm?lang=En>.2. PM2.5 refers to Particulate Matter smaller than 2.5 microns diameter, and is measured in micrograms per cubic meter (mg/m3).
Figure 1: Fine particulate matter (PM2.5) emissions by source in Ontario, 2005
Note: Agriculture, Construction and Road Dust are referred to elsewhere as ‘Open Sources’.
Source: Environment Canada Air Pollution Emissions Inventory, <http://ec.gc.ca/inrp-npri/donnees-data/ap/index.cfm?lang=En>.
0
20,000
40,000
60,000
80,000
100,000
Dust fro
m Unpaved Roads
Dust fro
m Paved Roads
Constructio
n Operatio
n
Agricultu
re
Meat Cooking
Transporta
tion
Residentia
l Fuel W
ood Combustion
Residentia
l Fuel C
ombustion
Electric P
ower Generatio
n
Total In
dustrial
2005
em
issi
ons
(ton
nes)
Did the coal phase-out reduce Ontario air pollution? / 3
fraserinstitute.org
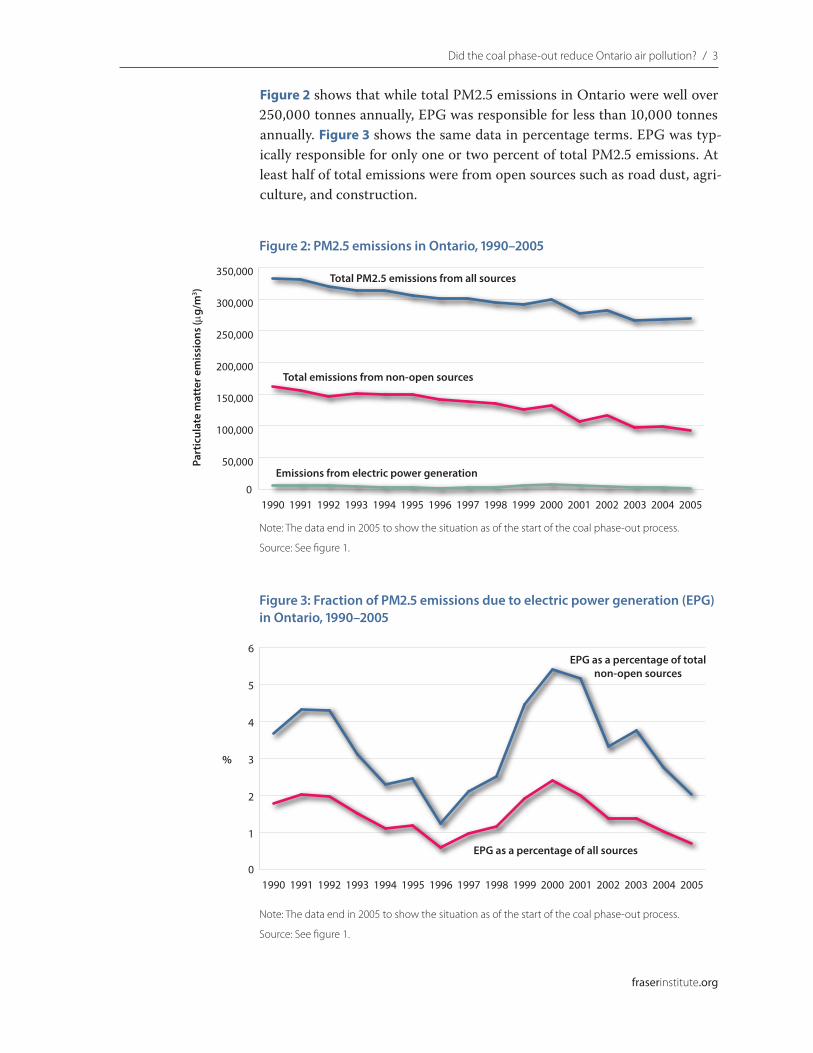
Figure 2 shows that while total PM2.5 emissions in Ontario were well over 250,000 tonnes annually, EPG was responsible for less than 10,000 tonnes annually. Figure 3 shows the same data in percentage terms. EPG was typ-ically responsible for only one or two percent of total PM2.5 emissions. At least half of total emissions were from open sources such as road dust, agri-culture, and construction.
Figure 2: PM2.5 emissions in Ontario, 1990–2005
Note: The data end in 2005 to show the situation as of the start of the coal phase-out process.
Source: See figure 1.
0
50,000
100,000
150,000
200,000
250,000
300,000
350,000
2005200420032002200120001999199819971996199519941993199219911990
Part
icul
ate
mat
ter e
mis
sion
s (µ
g/m
3 )
Total PM2.5 emissions from all sources
Emissions from electric power generation
Total emissions from non-open sources
Figure 3: Fraction of PM2.5 emissions due to electric power generation (EPG) in Ontario, 1990–2005
Note: The data end in 2005 to show the situation as of the start of the coal phase-out process.
Source: See figure 1.
0
1
2
3
4
5
6
2005200420032002200120001999199819971996199519941993199219911990
%
EPG as a percentage of total non-open sources
EPG as a percentage of all sources
4 / Did the coal phase-out reduce Ontario air pollution?
fraserinstitute.org
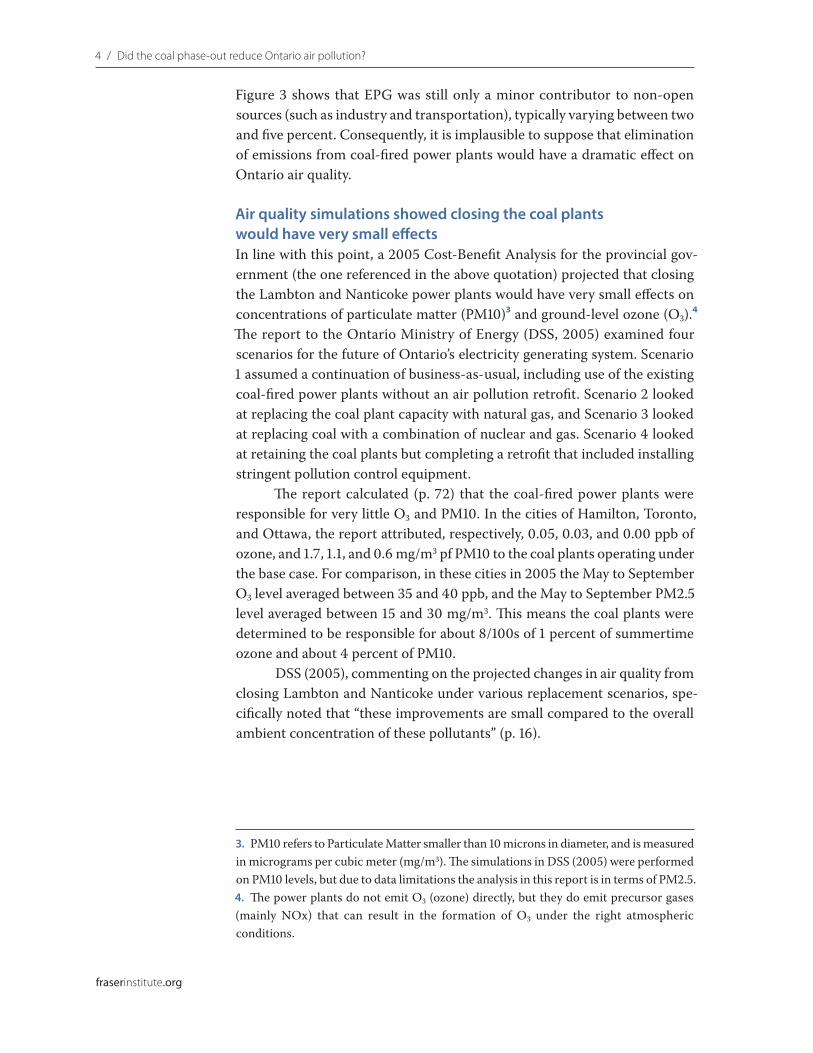
Figure 3 shows that EPG was still only a minor contributor to non-open sources (such as industry and transportation), typically varying between two and five percent. Consequently, it is implausible to suppose that elimination of emissions from coal-fired power plants would have a dramatic effect on Ontario air quality.
Air quality simulations showed closing the coal plants would have very small effectsIn line with this point, a 2005 Cost-Benefit Analysis for the provincial gov-ernment (the one referenced in the above quotation) projected that closing the Lambton and Nanticoke power plants would have very small effects on concentrations of particulate matter (PM10)3 and ground-level ozone (O3).4 The report to the Ontario Ministry of Energy (DSS, 2005) examined four scenarios for the future of Ontario’s electricity generating system. Scenario 1 assumed a continuation of business-as-usual, including use of the existing coal-fired power plants without an air pollution retrofit. Scenario 2 looked at replacing the coal plant capacity with natural gas, and Scenario 3 looked at replacing coal with a combination of nuclear and gas. Scenario 4 looked at retaining the coal plants but completing a retrofit that included installing stringent pollution control equipment.
The report calculated (p. 72) that the coal-fired power plants were responsible for very little O3 and PM10. In the cities of Hamilton, Toronto, and Ottawa, the report attributed, respectively, 0.05, 0.03, and 0.00 ppb of ozone, and 1.7, 1.1, and 0.6 mg/m3 pf PM10 to the coal plants operating under the base case. For comparison, in these cities in 2005 the May to September O3 level averaged between 35 and 40 ppb, and the May to September PM2.5 level averaged between 15 and 30 mg/m3. This means the coal plants were determined to be responsible for about 8/100s of 1 percent of summertime ozone and about 4 percent of PM10.
DSS (2005), commenting on the projected changes in air quality from closing Lambton and Nanticoke under various replacement scenarios, spe-cifically noted that “these improvements are small compared to the overall ambient concentration of these pollutants” (p. 16).
3. PM10 refers to Particulate Matter smaller than 10 microns in diameter, and is measured in micrograms per cubic meter (mg/m3). The simulations in DSS (2005) were performed on PM10 levels, but due to data limitations the analysis in this report is in terms of PM2.5.4. The power plants do not emit O3 (ozone) directly, but they do emit precursor gases (mainly NOx) that can result in the formation of O3 under the right atmospheric conditions.
Did the coal phase-out reduce Ontario air pollution? / 5
fraserinstitute.org
Engineering studies showed that similar effects could be achieved by retrofitting the coal plantsThe DSS study showed that the planned installation of electrostatic precipita-tors (“scrubbers”) on the Lambton and Nanticoke power plant smokestacks would have eliminated 95 percent of their particulate emissions (2005: 55, 63). Installation of low-NOx burners would have reduced NOx emissions (thus reducing a key ozone precursor) by 75 percent. Hence the reductions in pollu-tion attributable to the coal phase-out—especially particulates—could largely have been achieved by completing the air pollution retrofit then underway.
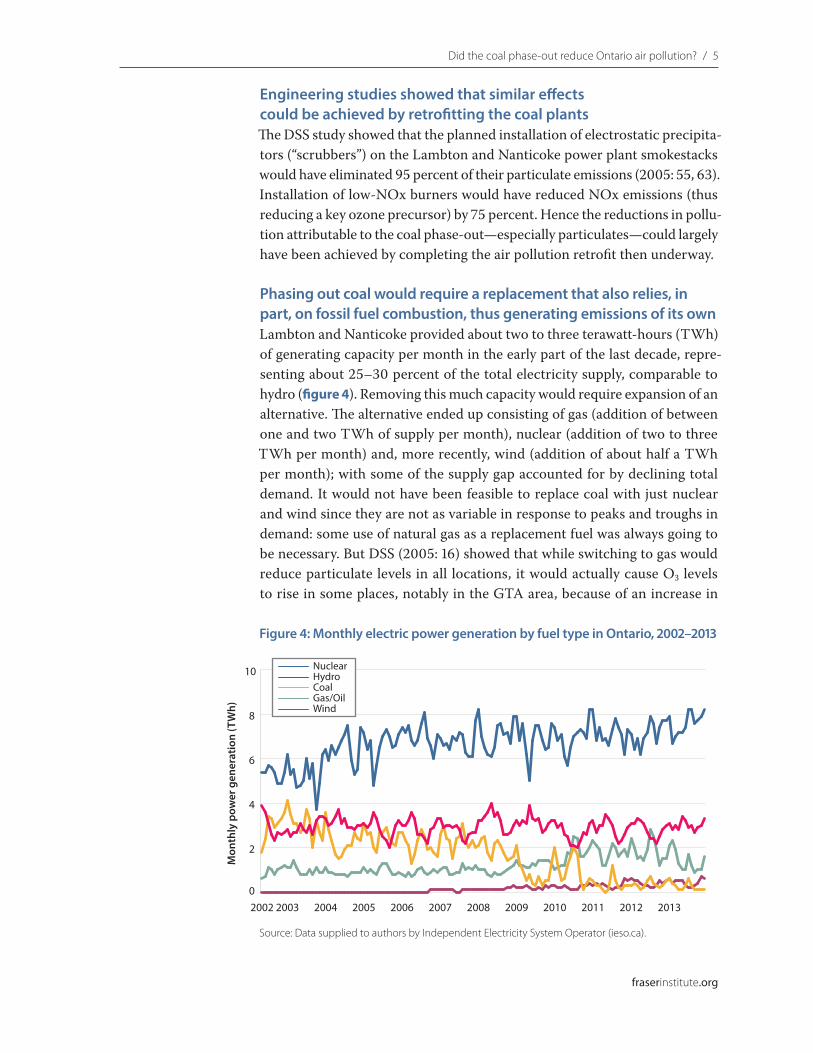
Phasing out coal would require a replacement that also relies, in part, on fossil fuel combustion, thus generating emissions of its ownLambton and Nanticoke provided about two to three terawatt-hours (TWh) of generating capacity per month in the early part of the last decade, repre-senting about 25–30 percent of the total electricity supply, comparable to hydro (figure 4). Removing this much capacity would require expansion of an alternative. The alternative ended up consisting of gas (addition of between one and two TWh of supply per month), nuclear (addition of two to three TWh per month) and, more recently, wind (addition of about half a TWh per month); with some of the supply gap accounted for by declining total demand. It would not have been feasible to replace coal with just nuclear and wind since they are not as variable in response to peaks and troughs in demand: some use of natural gas as a replacement fuel was always going to be necessary. But DSS (2005: 16) showed that while switching to gas would reduce particulate levels in all locations, it would actually cause O3 levels to rise in some places, notably in the GTA area, because of an increase in
Figure 4: Monthly electric power generation by fuel type in Ontario, 2002–2013
Source: Data supplied to authors by Independent Electricity System Operator (ieso.ca).
0
2
4
6
8
10
201320122011201020092008200720062005200420032002
Mon
thly
pow
er g
ener
atio
n (T
Wh)
NuclearHydroCoalGas/OilWind

6 / Did the coal phase-out reduce Ontario air pollution?
fraserinstitute.org
total NOx emissions relative to those experienced under the base case with the unimproved coal plants operating. Thus, taking into account the likely replacement capacity for coal, the health effects attributable to removing coal were ambiguous, and depended on the alternate generating source.
Air pollution analyses showed that transboundary sources mattered far more than domestic coal consumptionThe Ontario Ministry of the Environment and Climate Change undertook a special analysis of the role of US emissions in Ontario air quality in 2005, which showed that a majority of O3 and PM2.5 in Ontario was due to US-based emissions and would not be reduced by cutting emissions in Ontario (Yap et al., 2005). The study simulated a smog episode based on data collected during 1998. The model was then re-run after setting all Ontario emissions to zero. The results (pp. 47–50) showed that O3 levels would have only declined by 1 percent in Windsor, 9 percent in the GTA, and 7 percent in Kingston. The highest reduction would have been in Oshawa at 16 percent. PM2.5 would have dropped more, by about 50 percent in the GTA, but by very little in Windsor and by only about 25 percent in Ottawa. Consequently, though not noted in the report, since coal plant emissions only accounted for a small fraction of total emissions, cutting them would have had even smaller effects.
If taken at face value, the alleged health care spending on illnesses due to fine particulate emissions from all sources would likely exceed the total provincial health care budgetDSS (2005) asserted that phasing out coal would save the province a lot of money. This was not because the power plants were expensive to operate. The ordinary operating costs clearly favoured keeping them going. The base case was projected to cost about $1 billion annually, with the retrofit option the next cheapest at $1.4 billion and the phase-out options costing over $1.5 billion annually (DSS, 2005: v). However, the ranking of the options was reversed by incorporating putative health care costs attributable to air pol-lution of over $3 billion annually in the base case, compared to $1 billion in the retrofit option and under $400 million in the phase-out options. In other words the calculations depended on a modeling step that attributed $3 bil-lion in health care spending to an emissions source responsible for under one percent of fine particulate emissions. According to Statistics Canada, Ontario spent $35.2 billion on health care in 2005.5 The province’s analysis implies that about ten percent of the entire health care budget at that time was spent on illnesses caused by coal plant emissions. Since the coal plants were respon-sible for only one percent of PM2.5 emissions, all PM sources taken together must have caused many times that amount, potentially exceeding what the
5. See CANSIM Table 385-0001.
Did the coal phase-out reduce Ontario air pollution? / 7
fraserinstitute.org
province actually spent on all forms of health care. The attribution of $3 bil-lion in health care costs to the coal plant emissions is therefore implausible.
Summary of this study
The purpose of this study is to evaluate the environmental and economic effi-cacy of recently popular programs to accelerate the phase out of coal elec-tric power production. We will make this evaluation by examining whether improvements in air quality since the early part of the last decade in three Ontario cities (Hamilton, Toronto, and Ottawa) can reasonably be attributed to reductions in usage of coal in Ontario. Note that in this paper we focus only on conventional air contaminants, not greenhouse gases (GHG). GHG reductions can be achieved not only by plant shutdown but also by purchasing carbon offsets, a point made in McKitrick (2013), a previous Fraser Institute study that concluded there were much cheaper ways to achieve environ-mental goals, including GHG reductions, than phasing out coal. That study also made a point that will be reiterated herein, namely that completion of a relatively inexpensive pollution abatement retrofit on the Lambton and Nanticoke power plants could have achieved reductions in conventional air pollution comparable to those achieved by shutting the plants down.
The results of this study are as follows.
• Consistent with the DSS (2005) simulations and Yap et al. (2005) analysis, we find that the effects on PM2.5 of phasing out coal were small, varied by location, and were mostly statistically insignificant. In Toronto, the reduction in coal use is associated with PM2.5 reductions of about 0.8 mg/m3 for every TWh reduction in coal power, an effect that was statistically insignificant. This would imply a reduction of about 1.6–2.4 ppb as a result of eliminating 2–3 TWh of coal fired generation, in line with but slightly above the predictions from the DSS (2005) study, which projected a 1.1 mg/m3 reduction.6 Coal plant emissions were associated with a reduction in PM2.5 of about 1.1 ppb per TWh in Hamilton and 0.9 ppb per TWh in Ottawa, the latter of which was statistically significant.
• In contrast to projections in Yap et al. (2005), US PM2.5 emissions had an insignificant impact on Ontario PM2.5 levels, although wind speed does play a strong role, which may account for cross-border effects.
6. The DSS (2005) study projected PM10 changes, which is a broader category than PM2.5.

8 / Did the coal phase-out reduce Ontario air pollution?
fraserinstitute.org
• Consistent with both DSS (2005) and Yap et al. (2005), we find no significant effects from eliminating coal on NOx levels in Hamilton, Toronto or Ottawa.
• Consistent with the DSS (2005) analysis, in both Toronto and Ottawa, a tradeoff of 1 TWh coal power for natural gas power would result in a slight increase in NOx levels.
• Consistent with Yap et al. (2005) we find US NOx emissions exert a positive and statistically significant effect on NOx levels in Toronto and Ottawa. The effect in Hamilton was positive but not statistically significant.
• In contrast to those studies, we find a statistically significant reduction in peak O3 levels of about 2 ppb per TWh in all three cities, though this is offset by a slightly larger increase (per TWh) from natural gas plants. Eliminating 3 TWh of coal output implies a reduction of about 6 ppb in ozone levels, a sizeable change. But this would be partially offset to the extent gas-fired power is brought online.
• Consistent with the DSS (2005) report, we find use of natural gas as a replacement for coal is associated with small net increases in O3. In all three cities, natural gas usage is associated with a positive and statistically significant increase in peak O3 levels, with the effect slightly larger than the corresponding effect for coal. A one TWh swap of coal to gas would increase O3 in Hamilton and Ottawa by about 0.5 ppb.
• Consistent with the two studies mentioned, as well as numerous other reports by the Ontario government, weather conditions strongly influence Ontario air pollution levels.

fraserinstitute.org / 9
Data and modeling
Data
We will present models of urban air pollution levels, explaining them with combinations of electrical generating sources (coal and natural gas), other pol-lution sources (industrial and mobile emissions in Canada and the US north-east), and weather variables (temperature, wind, precipitation, and solar flux). The latter measure is important because the concentrations of the pollutants we consider are affected by the intensity of sunlight, which is not always the same as temperature.
There are some important limitations on data quality that readers need to take into account. A major one is that different data are available at differ-ent frequencies, but they all need to be converted to the same frequency in order to conduct the analysis. Air pollution data are available hourly, electri-city generation monthly, and some emissions data at annual levels. We will work at the intermediate monthly level, which means averaging up the pollu-tion data while interpolating the emissions data. Each of these steps involves some degradation of the information. By averaging up the pollution measures we smooth out some of the daily fluctuations. By interpolating the emissions data we are introducing errors that arise from using the annual average as an approximation for each month’s observation. This step in particular makes the emissions effect noisier and harder to measure.
Data on provincial monthly average electric generation from coal and natural gas (in Terawatt-hours or TWh) for the period May 2002 to the end of 2014 were requested and obtained from the Independent Electricity System Operator (IESO).7
Air pollution data were obtained from the National Air Pollution Surveillance (NAPS) archive at Environment Canada.8 Daily data on con-centrations of PM2.5 (mg/m3), NOx (ppb), and Ozone (ppb) for three stations associated with downtown Toronto, Ottawa, and Hamilton were collected.
7. <http://www.ieso.ca/>8. <http://maps-cartes.ec.gc.ca/rnspa-naps/data.aspx?lang=en>

10 / Did the coal phase-out reduce Ontario air pollution?
fraserinstitute.org
These daily series were converted to monthly averages over the period of 2002 to 2014. With respect to PM2.5 data, the Ontario Ministry of Environment and Climate Change has relied on several different instruments (respectively called TEOM, dichotomous samplers, and SHARP monitors). We selected the dichotomous sampling data, as it provided the longest consistently-measured data series over the period of interest. However it is not a complete record as the Toronto data only begin in 2004 and the Hamilton data end in 2012, so these regressions are on smaller samples.
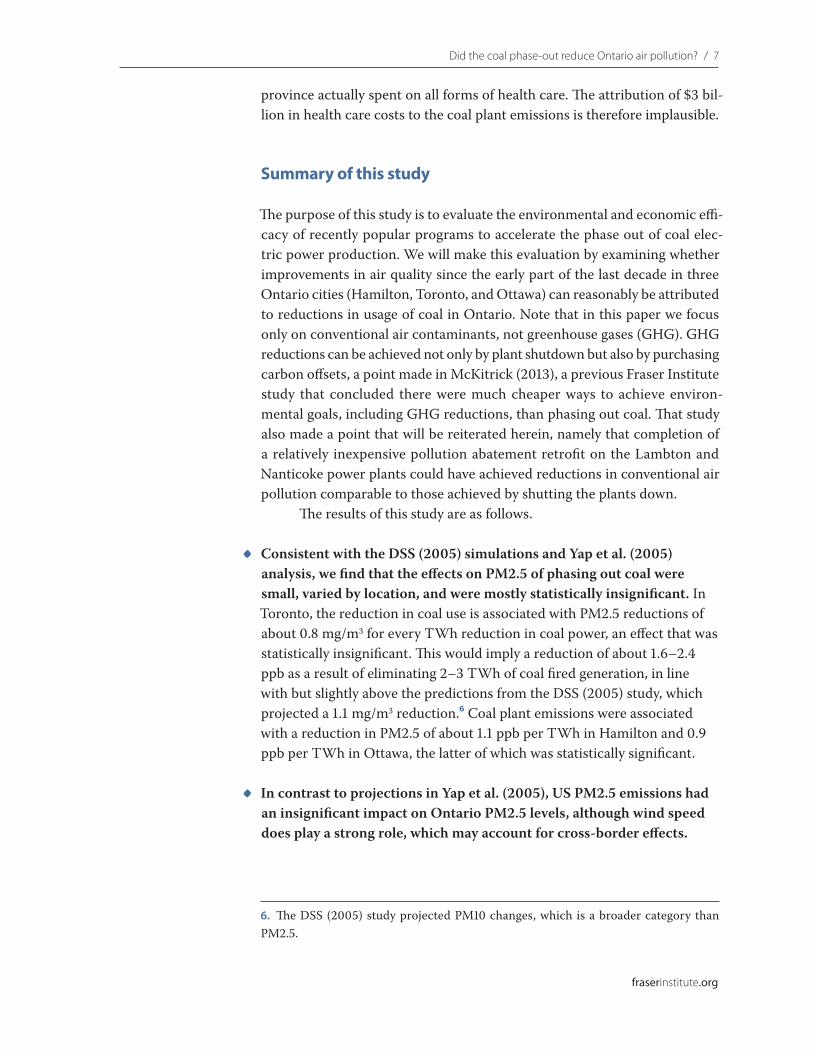
Figures 5–7 show the sample air contaminants across the 2002–2014 interval. Figure 5 shows monthly average PM2.5 levels, which fell during the 2002–2008 interval and held roughly constant thereafter. Figure 6 shows monthly average NOx levels and figure 7 shows peak (95th percentile) ozone. There are clear seasonal cycles in both series with O3 peaks in the summer. The latter series is tightly clustered around a common mean in each city, whereas in the former, Hamilton and Toronto trend about 10 ppb above Ottawa.
It should be noted that O3 is not emitted directly, it is formed through secondary chemical reactions involving NOx and volatile organic compounds (VOCs) in the air under intense UV light. O3 levels tend to vary seasonally with peaks in the summer and little trend over time (figure 7). They are sub-ject to occasional spikes when weather conditions are right, namely when stationary air masses trap precursor gases in place and strong sunlight is available at the ground level. For regulatory purposes, governments focus on peak O3 levels rather than average levels, so in our analysis we select the 95th percentile O3 level each month rather than the mean.
Daily data on weather related variables—temperature (°C), maximum temperature (°C), and precipitation (mm)—for the stations associated with Toronto, Ottawa, and Hamilton, and over the period 2002–2014, were taken from the climate data site at Environment Canada.9 These daily series were used to calculate monthly averages of the specified variables. Surface wind speed data for different stations located in Ontario is also available through Environment Canada. Homogenized monthly mean of hourly wind speeds (km/h) over the period 2002—2014 for Toronto, Ottawa, and Hamilton were obtained.10
Since ozone levels are sensitive to the strength of sunlight, we need a measure of solar energy impinging on the Earth’s surface at the ground level, which is called solar flux. We used 10.7 cm flux measurements pub-lished by Natural Resources Canada, which are available as daily and monthly averages.11
9. <http://climate.weather.gc.ca/>10. <http://ec.gc.ca/dccha-ahccd/default.asp?lang=en&n=71CB3873-1>11. <ftp://ftp.geolab.nrcan.gc.ca/data/solar_flux/>
Did the coal phase-out reduce Ontario air pollution? / 11
fraserinstitute.org
Figure 5: Monthly average PM2.5 levels for Hamilton, Toronto, and Ottawa
Source: Environment Canada National Air Pollution Monitoring System, <http://maps-cartes.ec.gc.ca/rnspa-naps/data.aspx>.
0
5
10
15
20
25
2014201320122011201020092008200720062005200420032002
Mg/m3
HamiltonTorontoOttawa
0
10
20
30
40
50
60
2014201320122011201020092008200720062005200420032002
Part
s pe
r bill
ion
HamiltonTorontoOttawa
Figure 6: Monthly average NOx levels for Hamilton, Toronto, and Ottawa
Source: See figure 5.

12 / Did the coal phase-out reduce Ontario air pollution?
fraserinstitute.org
Total annual industrial, non-industrial, and mobile emissions (tonnes) of PM2.5 and NOx in Ontario, excluding emissions from power genera-tion, were obtained from the online emissions inventory from Environment Canada.12 These were summed to yield Ontario PM2.5 and NOx emissions. These series were converted to monthly data by repeating the annual obser-vation (divided by 12) for each month in the year.
US emissions of NOx and PM2.5 were obtained from the US Environmental Protection Agency.13 The northeastern states of Ohio, Pennsylvania, Michigan, Wisconsin, Illinois, Indiana, Kentucky, Minnesota, and Tennessee were selected based on the evidence in Yap et al. (2005) iden-tifying these states as the key sources for transboundary pollution incursions into Ontario. Emissions were aggregated across fuel combustion in indus-try and electrical generation, other industrial activity, motor vehicle usage, and miscellaneous sources. These series were converted to monthly data by repeating the annual observation (divided by 12) for each month in the year. A deficiency in the US data is that in most regions the data are held constant from 2011 onwards, so the last few years of these series are of questionable accuracy.14
12. <http://www.ec.gc.ca/inrp-npri/donnees-data/ap/index.cfm?lang=En>13. <https://www.epa.gov/air-emissions-inventories/air-pollutant-emissions-trends-data>14. We confirmed with the US EPA that this is intentional and reflects the unavailability of recent data.
Figure 7: Monthly 95th percentile ozone levels for Hamilton, Toronto, and Ottawa
Source: See figure 5.
10
20
30
40
50
60
70
80
2014201320122011201020092008200720062005200420032002
Part
s pe
r bill
ion
HamiltonTorontoOttawa
Did the coal phase-out reduce Ontario air pollution? / 13
fraserinstitute.org
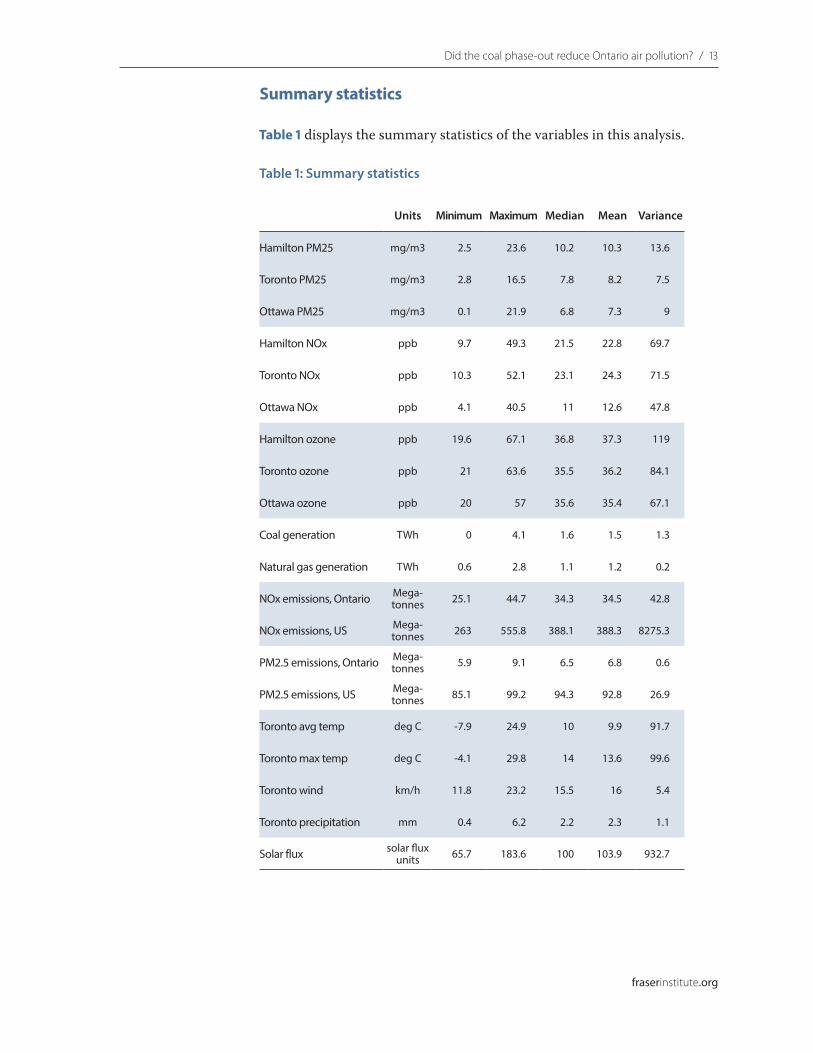
Summary statistics
Table 1 displays the summary statistics of the variables in this analysis.
Units Minimum Maximum Median Mean Variance
Hamilton PM25 mg/m3 2.5 23.6 10.2 10.3 13.6
Toronto PM25 mg/m3 2.8 16.5 7.8 8.2 7.5
Ottawa PM25 mg/m3 0.1 21.9 6.8 7.3 9
Hamilton NOx ppb 9.7 49.3 21.5 22.8 69.7
Toronto NOx ppb 10.3 52.1 23.1 24.3 71.5
Ottawa NOx ppb 4.1 40.5 11 12.6 47.8
Hamilton ozone ppb 19.6 67.1 36.8 37.3 119
Toronto ozone ppb 21 63.6 35.5 36.2 84.1
Ottawa ozone ppb 20 57 35.6 35.4 67.1
Coal generation TWh 0 4.1 1.6 1.5 1.3
Natural gas generation TWh 0.6 2.8 1.1 1.2 0.2
NOx emissions, Ontario Mega-tonnes 25.1 44.7 34.3 34.5 42.8
NOx emissions, US Mega-tonnes 263 555.8 388.1 388.3 8275.3
PM2.5 emissions, Ontario Mega-tonnes 5.9 9.1 6.5 6.8 0.6
PM2.5 emissions, US Mega-tonnes 85.1 99.2 94.3 92.8 26.9
Toronto avg temp deg C -7.9 24.9 10 9.9 91.7
Toronto max temp deg C -4.1 29.8 14 13.6 99.6
Toronto wind km/h 11.8 23.2 15.5 16 5.4
Toronto precipitation mm 0.4 6.2 2.2 2.3 1.1
Solar flux solar flux units 65.7 183.6 100 103.9 932.7
Table 1: Summary statistics

14 / Did the coal phase-out reduce Ontario air pollution?
fraserinstitute.org
Regression models
There were nine regressions altogether. Each was estimated using the gener-alized least squares routine in the statistical package R, applying a correction for first-order autocorrelation in the residuals.
PM2.5The explanatory variables for each city are electricity generation from Coal and Natural Gas/Oil, Ontario and US PM2.5 emissions, Average Temperature, Average Wind speed, Average Precipitation, Solar Flux, and a dummy vari-able for each month to control for monthly fixed effects.15
NOxThe explanatory variables were the same as for PM2.5 except that PM2.5 emis-sions were replaced with NOx emissions.
OzoneIt was more difficult to create a credible O3 model since, as noted, it is not emitted directly but depends on seasonal and meteorological conditions. Instead of monthly mean temperature we used the monthly average of daily maximum temperatures, since O3 production is strongly associated with heat-waves. Precipitation and solar flux were included as in the other regressions. We considered use of NOx and VOC emission series in the regression model but the relationships are highly nonlinear: under some conditions a reduction in either gas can lead to an increase in O3 levels and vice versa (Adamowicz et al., 2001: 83–87). Across various specifications we found highly unstable and generally insignificant emission coefficient estimates, so these variables were excluded. Instead, we included the local concentration of NOx as an explana-tory variable. NOx levels are plausibly explained by a regression model that includes US and Ontario NOx emission sources, so the relative influence of these emission sources is implicitly represented in the O3 model by using NOx concentrations. While formation of O3 depends on the availability of NOx, it depletes the NOx concentration, so we expect a negative coefficient on the NOx variable, which was the case in two of three cities.
15. The December dummy variable was omitted to avoid the twelve monthly dummies being collinear with the regression constant.
fraserinstitute.org / 15
Results
PM2.5 model
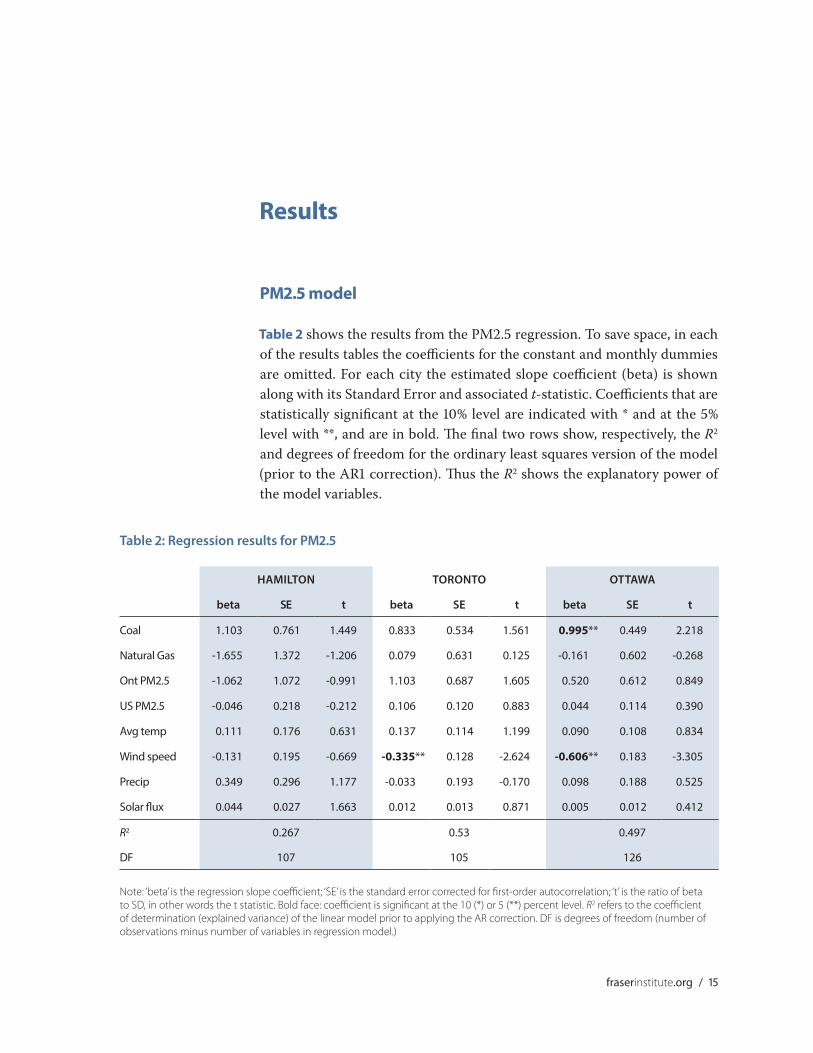
Table 2 shows the results from the PM2.5 regression. To save space, in each of the results tables the coefficients for the constant and monthly dummies are omitted. For each city the estimated slope coefficient (beta) is shown along with its Standard Error and associated t-statistic. Coefficients that are statistically significant at the 10% level are indicated with * and at the 5% level with **, and are in bold. The final two rows show, respectively, the R2 and degrees of freedom for the ordinary least squares version of the model (prior to the AR1 correction). Thus the R2 shows the explanatory power of the model variables.
HAMILTON TORONTO OTTAWA
beta SE t beta SE t beta SE t
Coal 1.103 0.761 1.449 0.833 0.534 1.561 0.995** 0.449 2.218
Natural Gas -1.655 1.372 -1.206 0.079 0.631 0.125 -0.161 0.602 -0.268
Ont PM2.5 -1.062 1.072 -0.991 1.103 0.687 1.605 0.520 0.612 0.849
US PM2.5 -0.046 0.218 -0.212 0.106 0.120 0.883 0.044 0.114 0.390
Avg temp 0.111 0.176 0.631 0.137 0.114 1.199 0.090 0.108 0.834
Wind speed -0.131 0.195 -0.669 -0.335** 0.128 -2.624 -0.606** 0.183 -3.305
Precip 0.349 0.296 1.177 -0.033 0.193 -0.170 0.098 0.188 0.525
Solar flux 0.044 0.027 1.663 0.012 0.013 0.871 0.005 0.012 0.412
R2 0.267 0.53 0.497
DF 107 105 126
Table 2: Regression results for PM2.5
Note: ‘beta’ is the regression slope coefficient; ‘SE’ is the standard error corrected for first-order autocorrelation; ‘t’ is the ratio of beta to SD, in other words the t statistic. Bold face: coefficient is significant at the 10 (*) or 5 (**) percent level. R2 refers to the coefficient of determination (explained variance) of the linear model prior to applying the AR correction. DF is degrees of freedom (number of observations minus number of variables in regression model.)
16 / Did the coal phase-out reduce Ontario air pollution?
fraserinstitute.org
Only in Ottawa was the reduction in coal use significantly associated with an improvement in particulates. The Hamilton R2 was relatively low, indi-cating a general lack of explanatory power, though it was higher for Toronto and Ottawa. Across all three cities, the coal coefficient ranged from about 0.8 to about 1.1, which indicates the reduction in PM2.5 in mg/m3 per TWh cut in powerplant output. The Toronto coefficient, for instance, indicates that a one TWh reduction in coal-fired power was associated with a 0.8 mg/m3 reduction in local PM2.5 levels. Since coal output averaged about 3 TWh per year at the start of the sample, this implies the coal phase-out reduced Toronto PM2.5 levels by about 2.4 mg/m3, though the effect is not statistically distinguishable from zero.
It is also important to note that installation of scrubbers on the coal plants would have eliminated 95 percent of their particulate emissions (DSS, 2005). So the regression results imply that completion of the air pollution retrofit would likely have reduced PM2.5 levels in Ontario cities by an amount nearly equivalent to the coal phase-out, namely 2–3 mg/m3.
US and Ontario PM2.5 emissions were insignificant in all cities, though in Toronto the coefficient on local emissions was over 1.0 and approached marginal significance.
The only other noteworthy coefficient was wind speed, which was nega-tive for each city and significant at 5% for Toronto and Ottawa. The negative sign implies that in months that are windier, on average, PM2.5 levels are lower.

Did the coal phase-out reduce Ontario air pollution? / 17
fraserinstitute.org
HAMILTON TORONTO OTTAWA
beta SE t beta SE t beta SE t
Coal 0.421 0.862 0.488 -0.078 0.772 -0.101 0.465 0.700 0.665
Natural Gas -0.195 1.067 -0.183 0.264 0.978 0.270 1.425 0.927 1.538
Ont NOx 0.179 0.463 0.387 -0.403 0.454 -0.888 -1.443** 0.476 -3.028
US NOx 0.04 0.034 1.175 0.092** 0.033 2.770 0.140** 0.034 4.101
Avg temp 0.033 0.183 0.182 0.038 0.171 0.221 0.158 0.136 1.160
Wind speed -1.086** 0.203 -5.351 -1.714** 0.184 -9.323 -0.757** 0.185 -4.101
Precip 0.171 0.306 0.560 0.292 0.269 1.085 0.313 0.200 1.563
Solar flux 0.027* 0.014 1.948 0.005 0.013 0.406 0.023* 0.014 1.718
R2 0.804 0.862 0.838
DF 132 131 132
Table 3: Regression results for NOx
See table 2 for explanation of codes.
NOx model
Neither coal nor natural gas have any explanatory power for NOx formation, although the natural gas coefficient for Ottawa is somewhat large. US NOx emissions significantly increase Toronto and Ottawa NOx levels. Ontario NOx emissions are associated with declines in Ottawa NOx levels, which is an anomalous result. A possible explanation is the inverse relationship between NOx and O3: if Ontario NOx emissions tend to be associated with times when conditions are favourable in Eastern Ontario for O3 formation then the extra NOx might be associated with depleted NOx concentrations. However this effect is not seen in Hamilton, so the explanation is only speculative.
US monthly average NOx emissions fell from about 556 megatonnes in 2002 to about 263 megatonnes in 2014, a reduction of 293 megatonnes. The esti-mated coefficient (about 0.1) indicates that this is associated with a 29 ppb reduction in Toronto NOx levels. But Toronto NOx levels only fell by about 15 ppb, from 33 ppb to 18 ppb, so either the model overestimates the effect of US sources, or other economic variables and weather factors caused an offsetting increase. In Ottawa none of the anthropogenic variables are significant. Wind speed is significant in all three cities, and solar flux is marginally significant in Toronto. It is also worth noting that this regression exhibits a high level of explanatory power (R2 > 0.8).
18 / Did the coal phase-out reduce Ontario air pollution?
fraserinstitute.org
HAMILTON TORONTO OTTAWA
beta SE t beta SE t beta SE t
Coal 1.929** 0.611 3.159 2.19** 0.602 3.637 2.018** 0.595 3.391
Natural Gas 2.428** 1.186 2.046 2.245** 1.129 1.988 2.740** 1.178 2.327
Local NOx -0.276** 0.092 -2.989 -0.077 0.091 -0.844 -0.204* 0.115 -1.772
Max temp 0.625** 0.191 3.273 0.627** 0.193 3.257 0.623** 0.188 3.309
Wind speed 0.325 0.258 1.259 0.326 0.270 1.207 0.323 0.306 1.059
Precip -0.479 0.353 -1.357 -0.789** 0.326 -2.419 -0.408 0.318 -1.284
Solar flux 0.012 0.015 0.797 0.042** 0.015 2.797 0.039** 0.016 2.482
R2 0.846 0.825 0.762
DF 133 132 133
Table 4: Regression results for Ozone
See table 2 for explanation of codes.
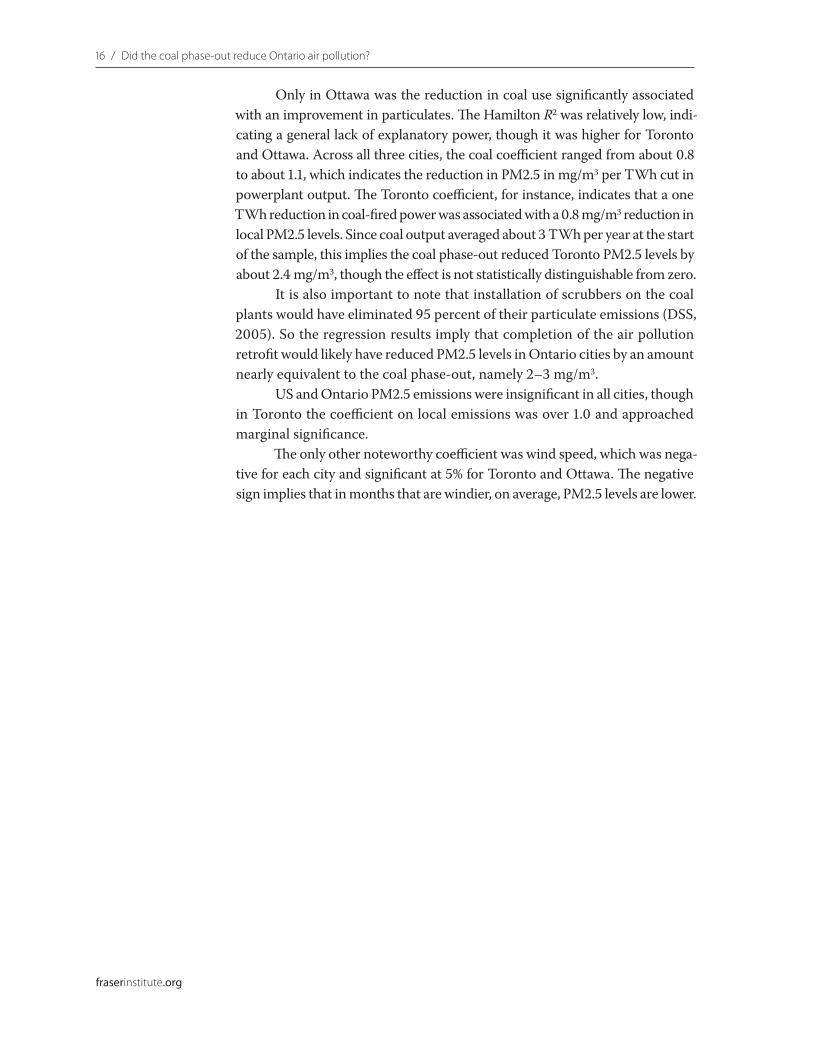
Ozone model
The ozone model shows the strongest effect of coal, notwithstanding the pre-diction of negligible effects in the DSS (2005) study and the absence of effects on NOx, which is one of the precursors of O3. The coefficient is positive and significant in each city, and the effects remained robust across numerous alternative specifications. A phase-out of 3 TWh of coal is associated with a reduction in peak O3 levels of about 6 ppb in each city. Note that monthly 95th percentile ozone levels were about 40 ppb at the start of the sample, so these effects are relatively sizeable. The reductions from coal were offset by larger effects from increasing natural gas usage. Ontario added about one TWh of monthly gas production, and the regression coefficients indicate this was associated with significant increases in O3 of between 2.2 to 2.7 ppb, depending on the city. Local NOx levels, as expected, vary inversely with ozone and the effect is significant in Hamilton and Ottawa.
Weather variables also play a significant role. In each city, maximum temperature positively affects O3 formation, as does wind speed in most cases, while precipitation depletes it. Solar flux has a positive and significant effect in Toronto and Ottawa.

fraserinstitute.org / 19
Discussion
The Government of Ontario has made some grandiose claims about the social benefits of phasing out coal, namely that it would yield large improvements in air quality and save billions annually in health care costs. The evidence from air pollution modeling work done prior to the phase-out, and inspection of the annual emissions inventory data for Ontario, indicated at the time that closing the Lambton and Nanticoke power plants would be unlikely to have a large effect on air quality across the province. With the phase-out now com-plete, we are able to use a statistical model to ask whether changes in Ontario air quality after 2002 can be attributed to eliminating coal.
Our results are generally consistent with the projections in the mod-eling work of DSS (2005) and Yap et al. (2005). Phasing out coal had a mod-erate effect on fine particulates that was statistically insignificant in Toronto and Hamilton. The same PM2.5 reduction likely could have been achieved by installation of scrubbers.
Phasing out coal had no significant effect on NOx levels in Hamilton, Toronto, or Ottawa. US emission reductions had large and significant effects in Toronto and Ottawa.
Phasing out coal was significantly associated with reductions in peak ground-level ozone concentrations in Hamilton, Toronto, and Ottawa, with the amounts much larger than those projected by the DSS (2005) analysis. However, the ozone reductions from phasing out coal were offset by increases attributable to natural gas usage. A one TWh tradeoff between these two fuels would yield a small net increase in ozone, consistent with the 2005 projections.
There are important implications for Alberta as it embarks on a coal phase-out similar to Ontario’s. First of all, glib assertions about the environ-mental effects of coal-fired power generation need to be rigorously tested against data. Coal-fired power generation in Alberta in 2014 yielded 2,514 tonnes of PM2.5 emissions, less than four-tenths of one percent of total PM2.5 emissions in the province.16 That means that coal power is an even smaller
16. Data from Environment Canada, <http://www.ec.gc.ca/inrp-npri/donnees-data/ap/index.cfm?lang=En>, November 11, 2016.
20 / Did the coal phase-out reduce Ontario air pollution?
fraserinstitute.org
relative emissions source in Alberta than it was in Ontario, and therefore it is reasonable to suppose that its phase-out will have equally small impacts on Alberta air quality. An analysis similar to this one ought to be done for Alberta to see whether there is evidence to substantiate any claims otherwise. Second, one of the findings herein is that replacement of coal with natural gas provides little if any net improvement overall, and potentially even a worsen-ing, of some ozone-related contaminants in some locations. Since Alberta proposes to replace a substantial portion of the coal capacity with natural gas, it may, like Ontario, find itself pursuing a strategy that yields little or no gain at a very high cost.
Overall our results show that phasing out coal in Ontario had small but detectable effects on particulates and ozone, but not NOx. Similar reduc-tions in particulates could have been accomplished at much lower cost by using scrubbers rather than closing the plants down, thereby also avoiding the increased ozone levels associated with the partial switch to natural gas. Our results are in line with expectations based on emissions data and air pol-lution modeling work. Grandiose claims about the effects of phasing out coal on Ontario air quality and health are not supported in the data.
fraserinstitute.org / 21
References
Written sources
Adamowicz, W. et al. (2001). A Review of the Socio-Economic Models and Related Components Supporting the Development of Canada-Wide Standards for Particulate Matter and Ozone. Royal Society of Canada.
DSS Management Consultants Inc. (2005). Cost-Benefit Analysis: Replacing Ontario’s Coal-Fired Electricity Generation. Closing the Coal-Fired Power Plants. Mimeo: Confidential Final Report to the Ontario Ministry of Energy.
McKitrick, Ross (2013). Environmental and Economic Consequences of Ontario’s Green Energy Act. Fraser Institute. <https://www.fraserinstitute.org/studies/environmental-and-economic-consequences-ontarios-green-energy-act>
McKitrick, Ross, Ken Green, and Joel Schwartz (2005). Pain Without Gain: Shutting Down Coal-Fired Power Plants Would Hurt Ontario. Fraser Institute. <https://www.fraserinstitute.org/sites/default/files/PainWithoutGain.pdf>
Ontario, Ministry of Energy (2010). Long-Term Energy Plan. Government of Ontario. <http://www.energy.gov.on.ca/en/ltep/ltep-foreword/>
Yap, David, Neville Reid, Gary De Brou, and Robert Bloxam (2005). Transboundary Air Pollution in Ontario 2005. Queen’s Printer. <http://www.airqualityontario.com/downloads/TransboundaryAirPollutionInOntario2005.pdf>
All websites retrievable as of December 6, 2016.
22 / Did the coal phase-out reduce Ontario air pollution?
fraserinstitute.org
Data sources
Environment Canada Air Pollution Emissions Inventory. <http://ec.gc.ca/inrp-npri/donnees-data/ap/index.cfm?lang=En>
Environment Canada Climate Data. <http://climate.weather.gc.ca/>
Environment Canada National Air Pollution Monitoring System. <http://maps-cartes.ec.gc.ca/rnspa-naps/data.aspx>
Natural Resources Canada Space Weather Monitoring Data. <ftp://ftp.geolab.nrcan.gc.ca/data/solar_flux/>
Ontario Independent Electricity System Operator. <ieso.ca>
US Environmental Protection Agency Air Emissions Data. <https://www.epa.gov/air-emissions-inventories/air-pollutant-emissions-trends-data>

Did the coal phase-out reduce Ontario air pollution? / 23
fraserinstitute.org
About the authors
Ross McKitrickRoss McKitrick is a Professor of Economics and CBE Fellow in Sustainable Commerce at the University of Guelph, where he specializes in environment, energy, and climate policy, and is a Senior Fellow of the Fraser Institute. He has published widely on the economics of pollution, climate change and public policy. His book Economic Analysis of Environmental Policy was pub-lished by the University of Toronto Press in 2010. His background in applied statistics has also led him to collaborative work across a wide range of top-ics in the physical sciences including paleoclimate reconstruction, malaria transmission, surface temperature measurement, and climate model evalu-ation. Professor McKitrick has made many invited academic presentations around the world, and has testified before the US Congress and committees of the Canadian House of Commons and Senate. He appears frequently in the media, and his research has been discussed in many prominent outlets including The New York Times, Nature, Science, The Economist, and The Wall Street Journal.
Elmira AliakbariElmira Aliakbari received her PhD in Economics from the University of Guelph in 2016 and her B.S. in Economics (2003) and an M.A. in Economics (2007) from the University of Tehran in Iran. She is a Senior Economist with the Fraser Institute.
Acknowledgments
The authors thank the anonymous reviewers for their comments, suggestions, and insights. Any remaining errors or oversights are the sole responsibility of the authors. As the researchers have worked independently, the views and conclusions expressed in this paper do not necessarily reflect those of the Board of Directors of the Fraser Institute, the staff, or supporters.

24 / Did the coal phase-out reduce Ontario air pollution?
fraserinstitute.org
Publishing information
DistributionThese publications are available from <http://www.fraserinstitute.org> in Portable Document Format (PDF) and can be read with Adobe Acrobat Pro® or Adobe Acrobat Reader®, versions 8/9 or later. Adobe Acrobat Reader DC®, the most recent version, is available free of charge from Adobe Systems Inc. at <http://get.adobe.com/reader/>. Readers having trouble viewing or printing our PDF files using applications from other manufacturers (e.g., Apple’s Preview) should use Adobe Acrobat Reader or Adobe Acrobat Pro.
Ordering publicationsTo order printed publications from the Fraser Institute, please contact the publications coordinator:
• e-mail: [email protected] • telephone: 604.688.0221 ext. 580 or, toll free, 1.800.665.3558 ext. 580 • fax: 604.688.8539.
MediaFor media enquiries, please contact our Communications Department:
• 604.714.4582 or our Media Specialist in Toronto: • 416.363.6575 ext. 238 • e-mail: [email protected].
CopyrightCopyright © 2017 by the Fraser Institute. All rights reserved. No part of this publication may be reproduced in any manner whatsoever without written permission except in the case of brief passages quoted in critical articles and reviews.
ISBN 978-0-88975-434-8
Date of issue January 2017
CitationMcKitrick, Ross, and Elmira Aliakbari (2015). Did the Coal Phase-Out Reduce Ontario Air Pollution? Fraser Institute. <http://www.fraserinstitute.org>
Did the coal phase-out reduce Ontario air pollution? / 25
fraserinstitute.org
Supporting the Fraser Institute
To learn how to support the Fraser Institute, please contact
• Development Department, Fraser Institute Fourth Floor, 1770 Burrard Street Vancouver, British Columbia, V6J 3G7 Canada
• telephone, toll-free: 1.800.665.3558 ext. 586
• e-mail: [email protected]
Purpose, funding, & independence
The Fraser Institute provides a useful public service. We report objective information about the economic and social effects of current public policies, and we offer evidence-based research and education about policy options that can improve the quality of life.
The Institute is a non-profit organization. Our activities are funded by charitable donations, unrestricted grants, ticket sales, and sponsorships from events, the licensing of products for public distribution, and the sale of publications.
All research is subject to rigorous review by external experts, and is conducted and published separately from the Institute’s Board of Directors and its donors.
The opinions expressed by the authors are those of the individuals themselves, and do not necessarily reflect those of the Institute, its Board of Directors, its donors and supporters, or its staff. This publication in no way implies that the Fraser Institute, its trustees, or staff are in favour of, or oppose the passage of, any bill; or that they support or oppose any particular political party or candidate.
As a healthy part of public discussion among fellow citizens who de-sire to improve the lives of people through better public policy, the Institute welcomes evidence-focused scrutiny of the research we publish, including verification of data sources, replication of analytical methods, and intelligent debate about the practical effects of policy recommendations.

26 / Did the coal phase-out reduce Ontario air pollution?
fraserinstitute.org
About the Fraser Institute
Our mis sion is to improve the quality of life for Canadians, their families, and future generations by studying, measuring, and broadly communicating the effects of government policies, entrepreneurship, and choice on their well-being.
Notre mission consiste à améliorer la qualité de vie des Canadiens et des générations à venir en étudiant, en mesurant et en diffusant les effets des poli-tiques gouvernementales, de l’entrepreneuriat et des choix sur leur bien-être.
Peer review —validating the accuracy of our researchThe Fraser Institute maintains a rigorous peer review process for its research. New research, major research projects, and substantively modified research conducted by the Fraser Institute are reviewed by experts with a recognized expertise in the topic area being addressed. Whenever possible, external review is a blind process. Updates to previously reviewed research or new editions of previously reviewed research are not reviewed unless the update includes substantive or material changes in the methodology.
The review process is overseen by the directors of the Institute’s re-search departments who are responsible for ensuring all research published by the Institute passes through the appropriate peer review. If a dispute about the recommendations of the reviewers should arise during the Institute’s peer review process, the Institute has an Editorial Advisory Board, a panel of scholars from Canada, the United States, and Europe to whom it can turn for help in resolving the dispute.

Did the coal phase-out reduce Ontario air pollution? / 27
fraserinstitute.org
Editorial Advisory Board
Members
Past members
* deceased; † Nobel Laureate
Prof. Terry L. Anderson
Prof. Robert Barro
Prof. Michael Bliss
Prof. Jean-Pierre Centi
Prof. John Chant
Prof. Bev Dahlby
Prof. Erwin Diewert
Prof. Stephen Easton
Prof. J.C. Herbert Emery
Prof. Jack L. Granatstein
Prof. Herbert G. Grubel
Prof. James Gwartney
Prof. Ronald W. Jones
Dr. Jerry Jordan
Prof. Ross McKitrick
Prof. Michael Parkin
Prof. Friedrich Schneider
Prof. Lawrence B. Smith
Dr. Vito Tanzi
Prof. Armen Alchian*
Prof. James M. Buchanan* †
Prof. Friedrich A. Hayek* †
Prof. H.G. Johnson*
Prof. F.G. Pennance*
Prof. George Stigler* †
Sir Alan Walters*
Prof. Edwin G. West*