did you survive - sedelco.org · · 2015-09-09what is the scientific method? it involves a series...
TRANSCRIPT

Did You Survive
1. A cosmetic mirror
2. 1 Topcoat per person
3. 1 quart of water per person
4. Flashlight
5. Red and white parachute
6. Jack knife
7. Plastic raincoat
8. Two pair of sunglasses
Sectional air map
The book
Bottle of salt tablets

9/9/2015 8:42:51 AM

What is the scientific
method?
It involves a series of
steps that are used to
investigate a natural
occurrence.

What are the steps in the scientific
method?
Problem/Question
Observation/Research
Formulate a Hypothesis
Experiment
Collect and Analyze Results
Conclusion
Communicate the Results 9/9/2015 8:42:51 AM

What is a problem?
It is a statement or a question in
which can be solved through
experimentation.
Problem/Question: Develop a
question or problem that can
be solved through
experimentation. 9/9/2015 8:42:51 AM

What is an Observation/
Research
It is orderly, direct information
gathering about a natural
phenomenon. Make
observations and research
your topic of interest.
9/9/2015 8:42:51 AM
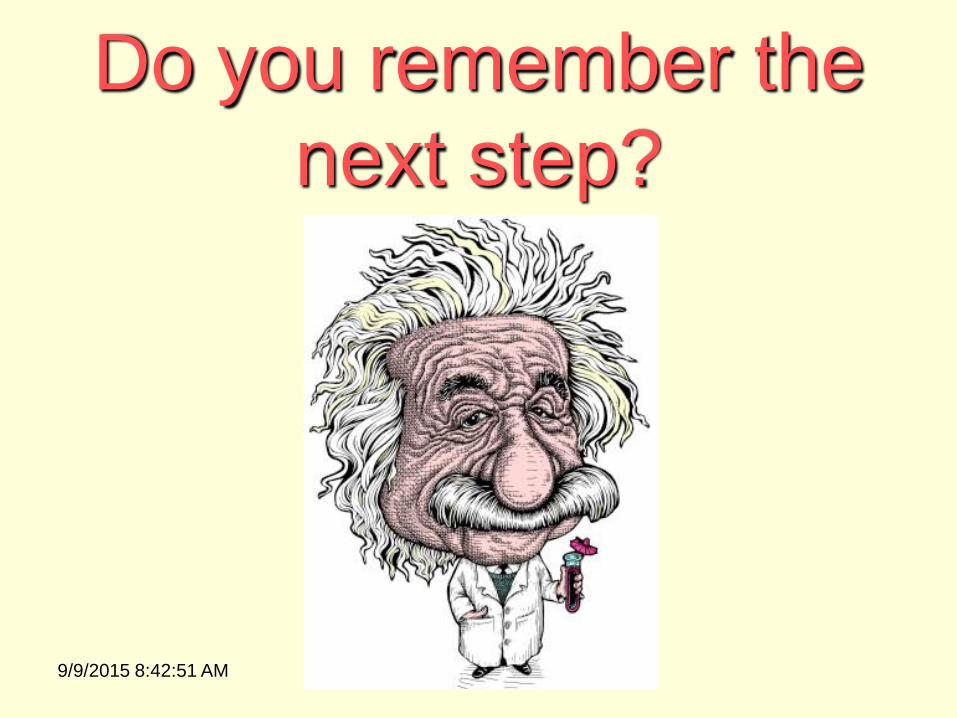
Do you remember the
next step?
9/9/2015 8:42:51 AM

What is a hypothesis? It is a testable explanation of a
situation. Predict a possible
answer to the problem or
question.
Example: If soil temperatures
rise, then plant growth will
increase. 9/9/2015 8:42:51 AM

What is an experiment?
It is a procedure performed in a
controlled setting to test a
hypothesis and collect precise
data. Experiment: Develop and
follow a procedure.
Include a detailed materials list.
The outcome must be measurable
(quantifiable). 9/9/2015 8:42:51 AM

What is collect data? It is quantitative or qualitative
information gained from
scientific investigation. Collect
and Analyze Data: Modify the
procedure if needed.
Confirm the results by retesting.
Include tables, graphs, and
photographs. 9/9/2015 8:42:51 AM

What is a conclusion? It is a summary of your result of
the investigation. Conclusion: Include a statement that
accepts or rejects the hypothesis.
Make recommendations for further study and possible
improvements to the procedure.
9/9/2015 8:42:51 AM

What is communication?
It involves the investigator to
articulate the result of the
investigation. It can be written
or verbal.
9/9/2015 8:42:51 AM

Think you can name all
seven steps?
Problem/Question Observation/Research Formulate a Hypothesis Experiment Collect and Analyze Results Conclusion Communicate the Results 9/9/2015 8:42:51 AM
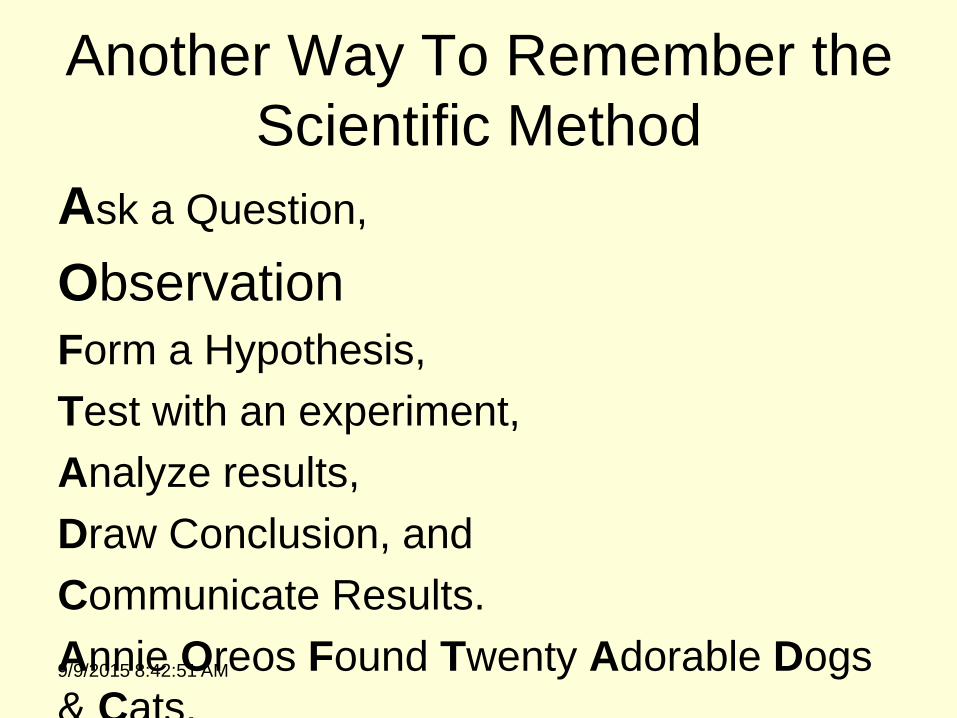
Another Way To Remember the
Scientific Method
Ask a Question,
Observation
Form a Hypothesis,
Test with an experiment,
Analyze results,
Draw Conclusion, and
Communicate Results.
Annie Oreos Found Twenty Adorable Dogs
& Cats. 9/9/2015 8:42:51 AM

Final Way to Look at Scientific
Method P Problem
I Introduction
H Hypothesis
E Experiment
R Results
C Conclusion
9/9/2015 8:42:51 AM

Let’s put our knowledge of the
Scientific Method to a realistic
example that includes some of the
terms you’ll be needing to use and
understand.
9/9/2015 8:42:51 AM
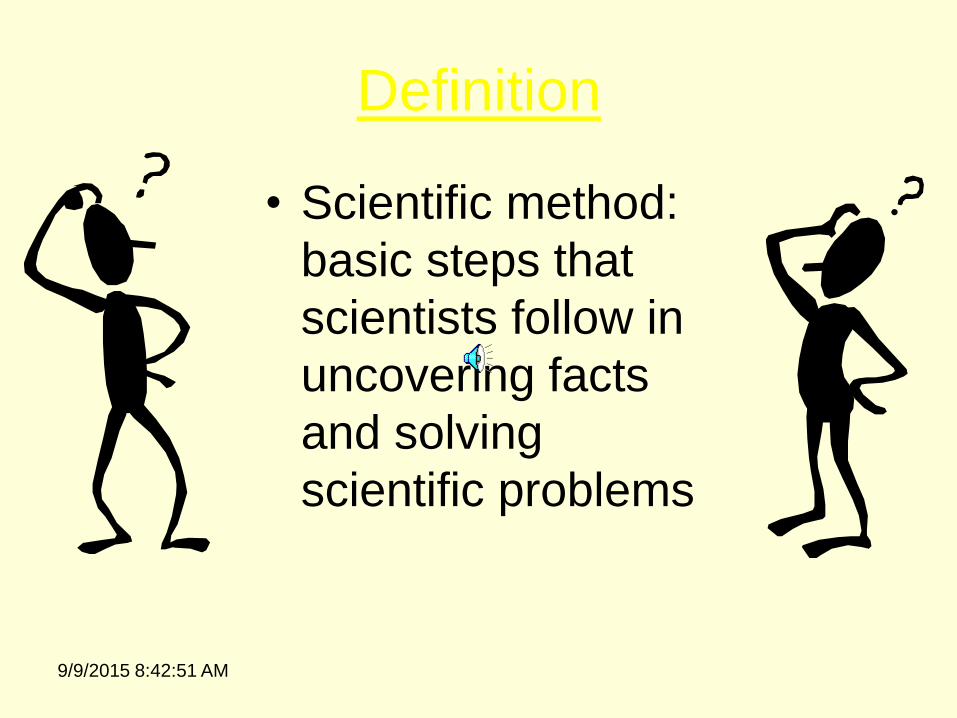
Definition
• Scientific method:
basic steps that
scientists follow in
uncovering facts
and solving
scientific problems
9/9/2015 8:42:51 AM

Basic Parts of Scientific Method
• Stating the problem
• Gathering information
• Suggesting an answer for the problem
• Performing an experiment to see whether
the suggested answer makes sense
• Recording and analyzing the results of
experiments or other observations
• Stating conclusions
9/9/2015 8:42:51 AM

Stating the Problem
• What invisible trail does a rattlesnake follow in tracking down its bitten prey?
9/9/2015 8:42:51 AM

Gathering Information
• A rattlesnakes eyes are only sensitive to visible
light
• A pair of organs located under the eyes detect
invisible light in the form of heat
• A rattler’s tongue “smells” certain odors in the air
• The sight or smell of an unbitten animal does not
trigger the rattler’s tracking action
9/9/2015 8:42:51 AM

Hypothesis
• After the snake wounds its victim,
the snake follows the smell of its
own venom to locate the animal
9/9/2015 8:42:51 AM
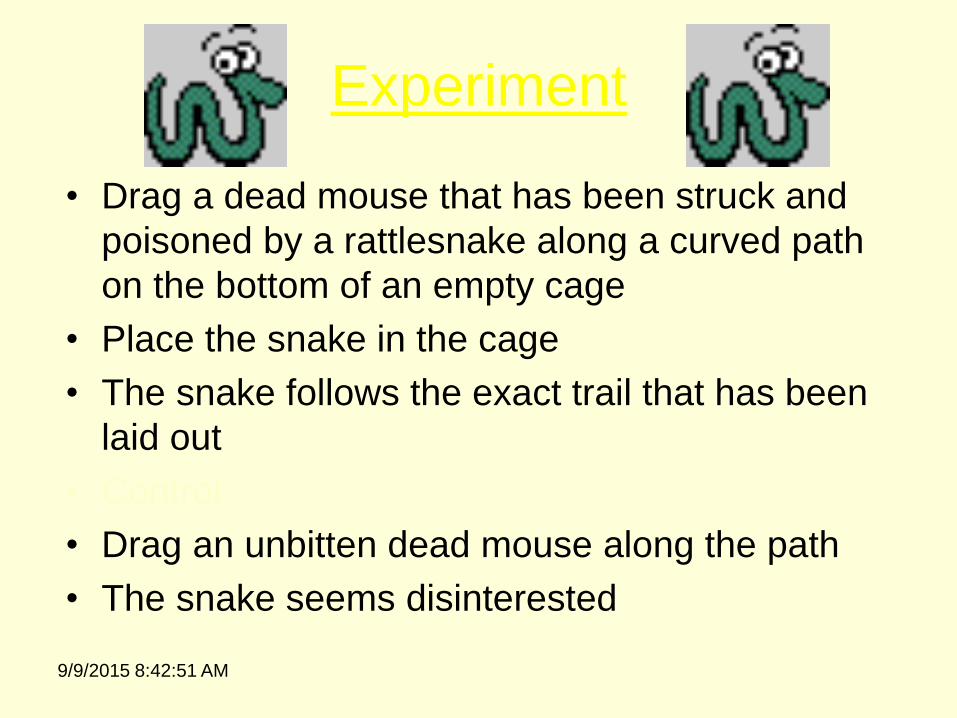
Experiment
• Drag a dead mouse that has been struck and
poisoned by a rattlesnake along a curved path
on the bottom of an empty cage
• Place the snake in the cage
• The snake follows the exact trail that has been
laid out
• Control
• Drag an unbitten dead mouse along the path
• The snake seems disinterested
9/9/2015 8:42:51 AM
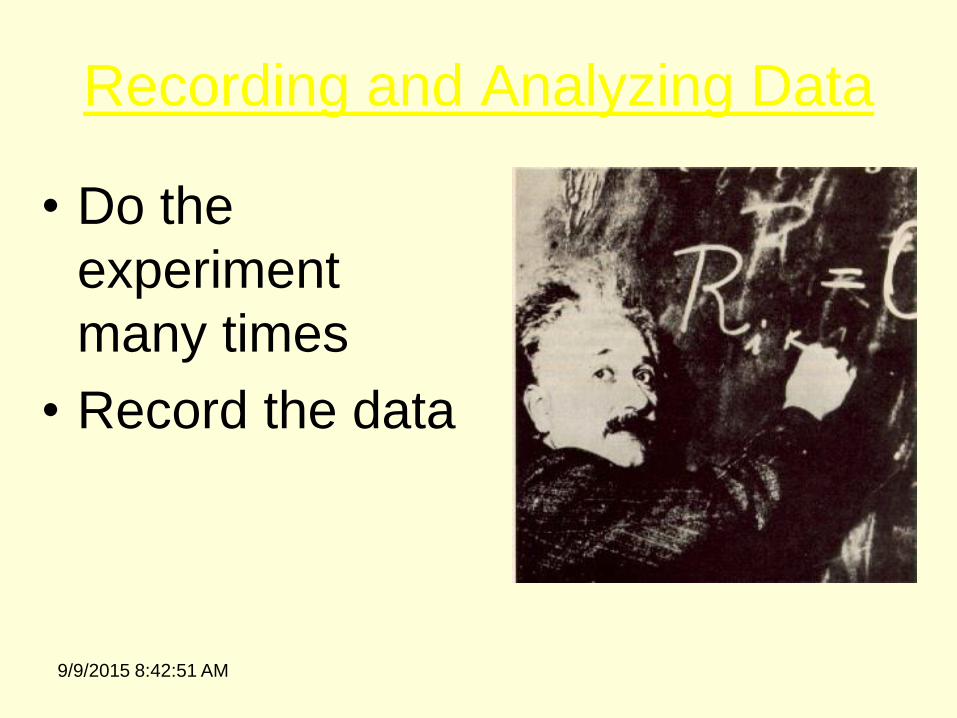
Recording and Analyzing Data
• Do the
experiment
many times
• Record the data
9/9/2015 8:42:51 AM

Conclusion
• The scent of venom was
the only factor that could
cause a rattlesnake to
follow its bitten victim.
9/9/2015 8:42:51 AM

Scientific Method Words
1. Hypothesis
2. Observation
3. Ask a Question
4. Prediction
5. Conclusion
6. Experiment
7. Data Analysis
8. Inference
9. Data
10. Responding variable
11. Experimental group
12. Control group
13. Statistics
14. Independent Variable
15. Probability
16. Mean
17. Dependent variable
18. Manipulated variable
19. Theory 9/9/2015 8:42:51 AM

Another Example
9/9/2015 8:42:51 AM

Problem/Question
Scott watches his
grandmother, Alicia,
bake bread. He ask
his grandmother what
makes the bread rise.
She explains that yeast
releases a gas as it
feeds on sugar. 9/9/2015 8:42:51 AM

Problem/Question
Scott wonders if the
amount of sugar used
in the recipe will affect
the size of the bread
loaf?
9/9/2015 8:42:51 AM

Caution!
Be careful how you use effect and affect.
Effect is usually a noun and affect, a verb.
“ The effect of sugar amounts on the rising of bread.”
“How does sugar affect the rising of bread?”
9/9/2015 8:42:51 AM

Observation/Research
Scott researches the
areas of baking and
fermentation and tries
to come up with a way
to test his question.
He keeps all of his
information on this
topic in a journal. 9/9/2015 8:42:51 AM

Scott talks with his
teacher and she gives
him a Experimental
Design Diagram to
help him set up his
investigation.
9/9/2015 8:42:51 AM
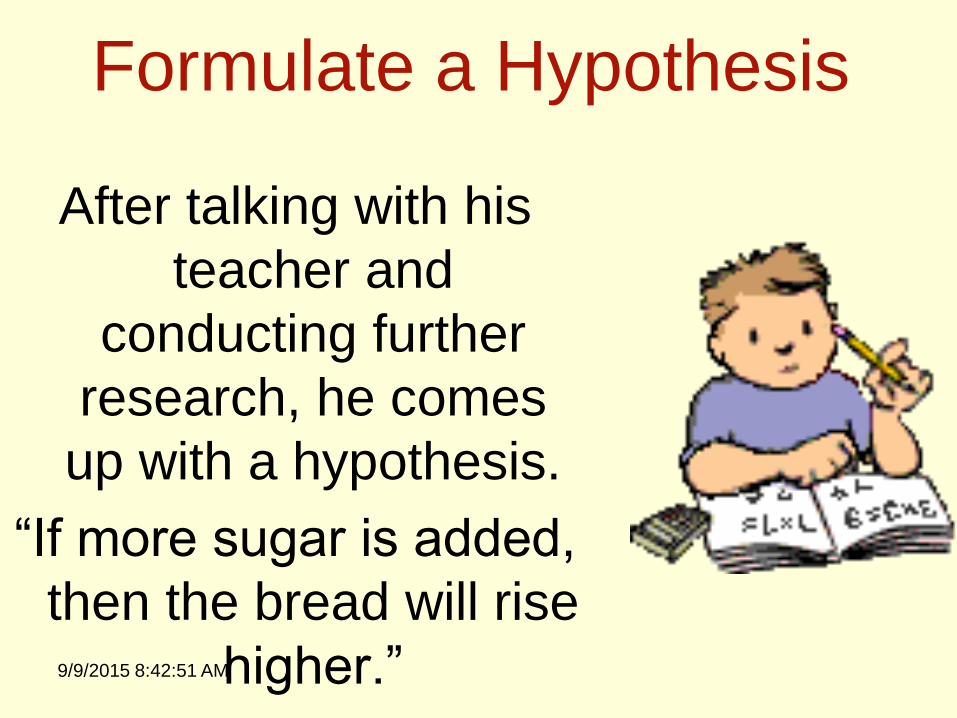
Formulate a Hypothesis
After talking with his
teacher and
conducting further
research, he comes
up with a hypothesis.
“If more sugar is added,
then the bread will rise
higher.” 9/9/2015 8:42:51 AM

Hypothesis
The hypothesis is an educated
guess about the relationship
between the independent and
dependent variables.
Note: These variables will be
defined in the next few slides.
9/9/2015 8:42:51 AM
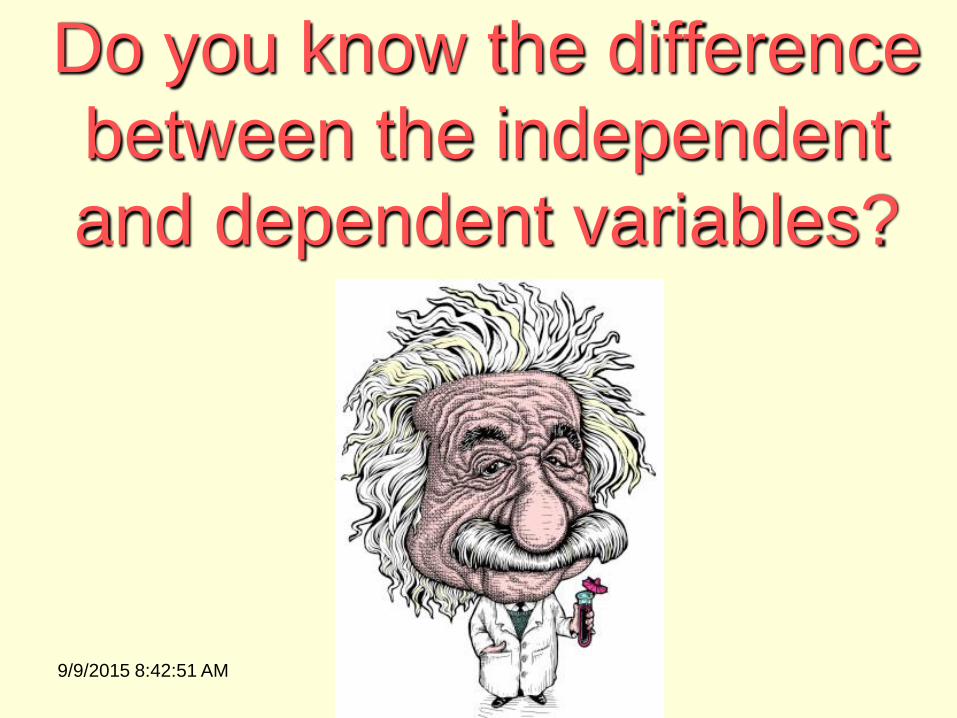
Do you know the difference
between the independent
and dependent variables?
9/9/2015 8:42:51 AM

Independent Variable
The independent, or manipulated variable, is a
factor that’s intentionally varied by the experimenter.
Scott is going to use 25g., 50g., 100g., 250g., 500g. of sugar in
his experiment. 9/9/2015 8:42:51 AM

Dependent Variable
The dependent, or responding variable, is the factor that may change as a result of changes
made in the independent variable.
In this case, it would be the size of the loaf of bread.
9/9/2015 8:42:51 AM

Experiment
His teacher helps him
come up with a
procedure and list of
needed materials.
She discusses with
Scott how to
determine the control
group. 9/9/2015 8:42:51 AM

Control Group
In a scientific experiment, the
control is the group that serves
as the standard of comparison.
The control group may be a “no
treatment" or an “experimenter
selected” group. 9/9/2015 8:42:51 AM
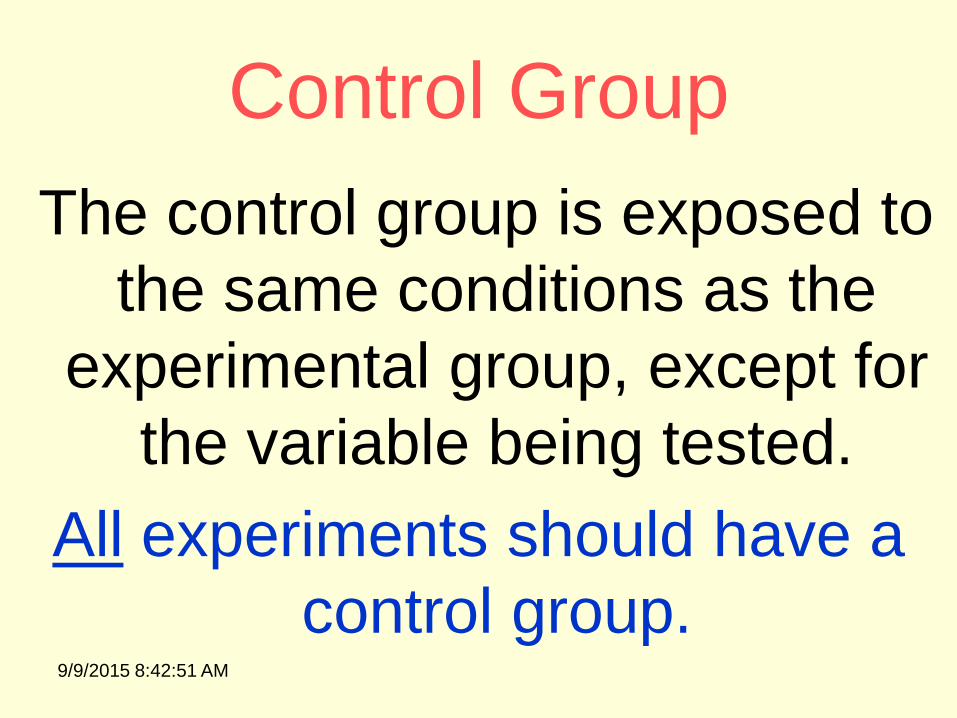
Control Group
The control group is exposed to
the same conditions as the
experimental group, except for
the variable being tested.
All experiments should have a
control group. 9/9/2015 8:42:51 AM

Control Group
Because his grandmother
always used 50g. of sugar in
her recipe, Scott is going to use
that amount in his control
group.
9/9/2015 8:42:51 AM
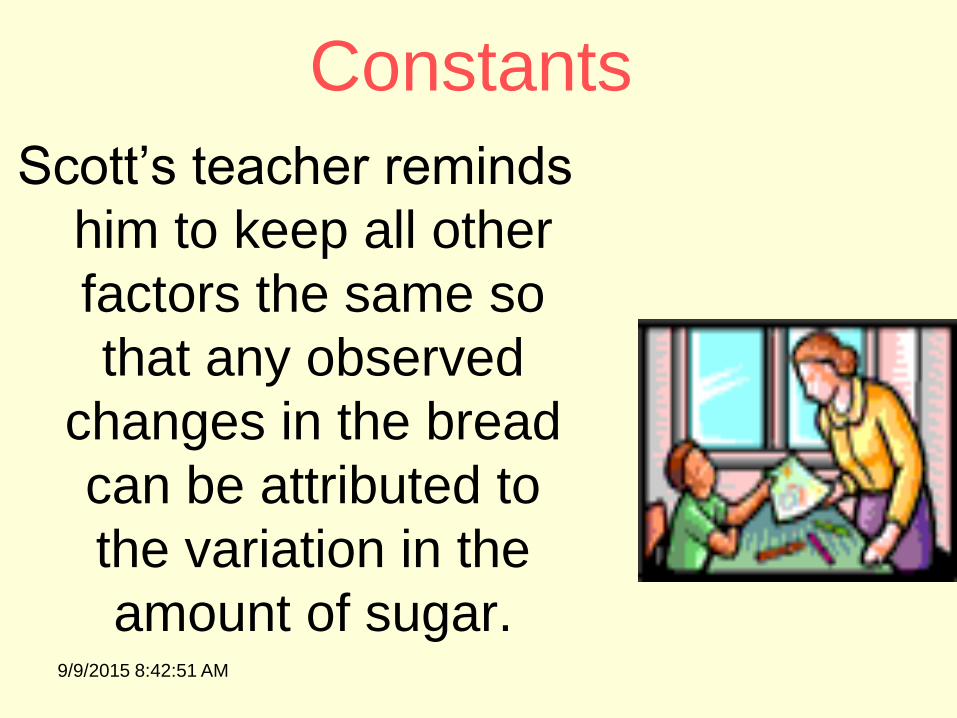
Constants
Scott’s teacher reminds
him to keep all other
factors the same so
that any observed
changes in the bread
can be attributed to
the variation in the
amount of sugar. 9/9/2015 8:42:51 AM

Constants
The constants in an
experiment are all the
factors that the
experimenter attempts
to keep the same.
9/9/2015 8:42:51 AM
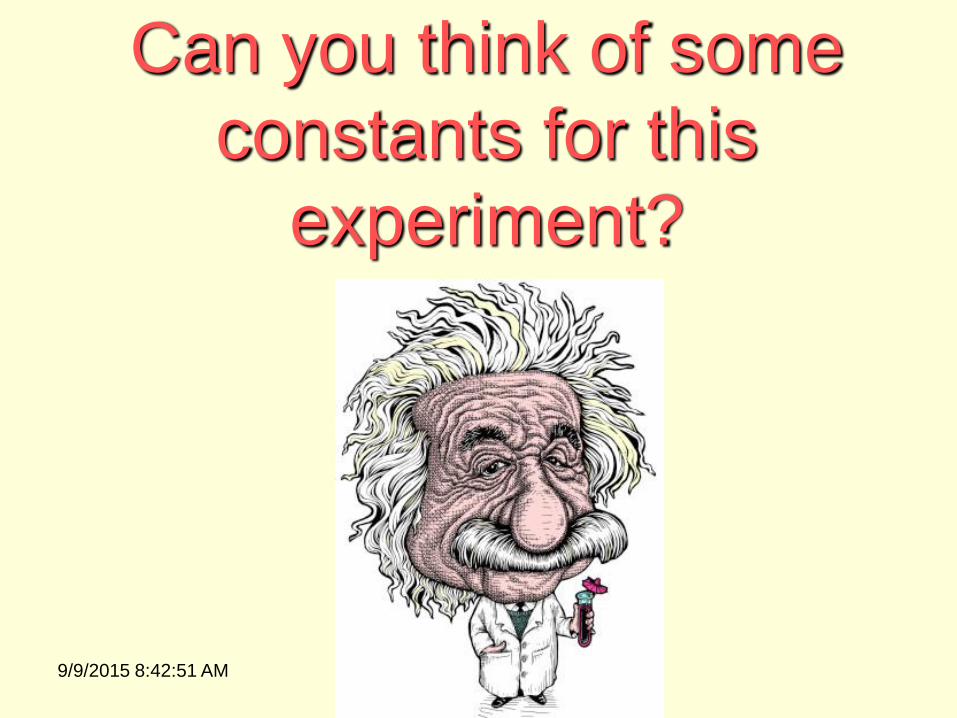
Can you think of some
constants for this
experiment?
9/9/2015 8:42:51 AM

Constants They might include:
Other ingredients to the bread recipe, oven used,
rise time, brand of ingredients, cooking time,
type of pan used, air temperature and humidity
where the bread was rising, oven temperature,
age of the yeast… 9/9/2015 8:42:51 AM

Experiment
Scott writes out his procedure for his
experiment along with a materials list in his
journal. He has both of these checked by his teacher where she
checks for any safety concerns.
9/9/2015 8:42:51 AM
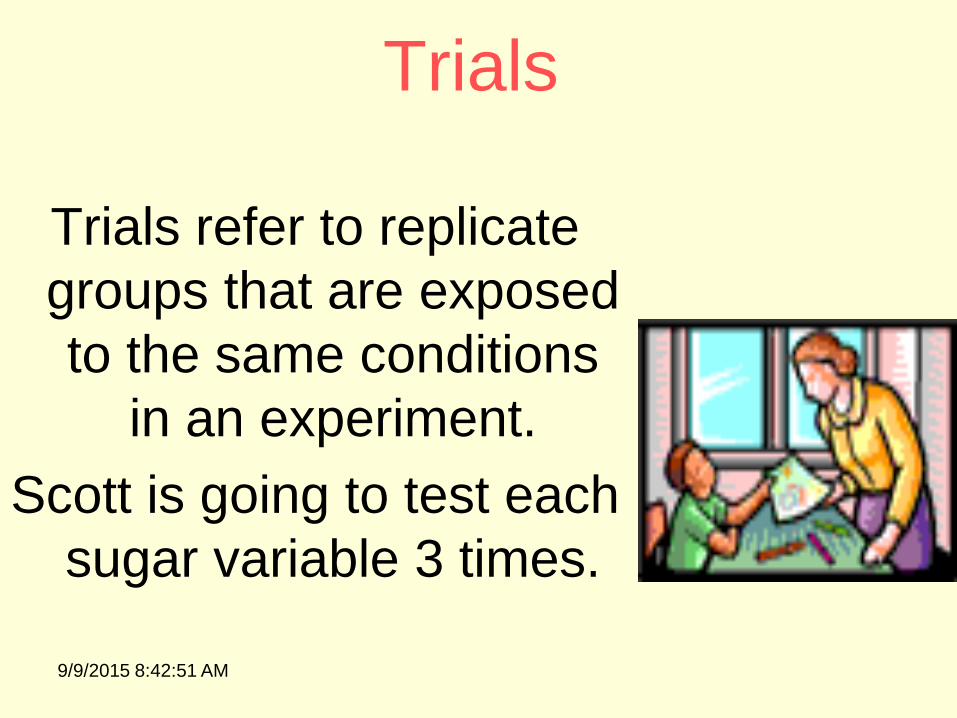
Trials
Trials refer to replicate
groups that are exposed
to the same conditions
in an experiment.
Scott is going to test each
sugar variable 3 times.
9/9/2015 8:42:51 AM

Collect and Analyze Results
Scott comes up with a table he can use to record his data.
Scott gets all his materials together and carries out his
experiment. 9/9/2015 8:42:51 AM
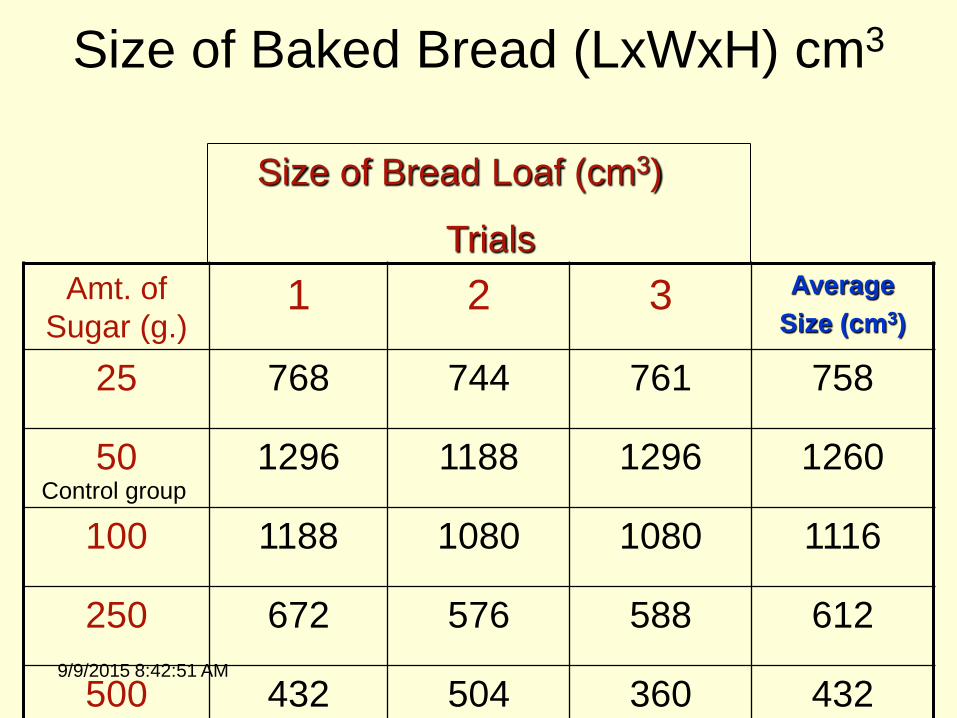
Size of Baked Bread (LxWxH) cm3
Amt. of
Sugar (g.) 1 2 3 Average
Size (cm3)
25 768 744 761 758
50 1296 1188 1296 1260
100 1188 1080 1080 1116
250 672 576 588 612
500 432 504 360 432
Size of Bread Loaf (cm3)
Trials
Control group
9/9/2015 8:42:51 AM

Collect and Analyze Results
Scott examines his
data and notices that
his control worked
the best in this
experiment, but not
significantly better
than 100g. of sugar. 9/9/2015 8:42:51 AM

Conclusion
Scott rejects his
hypothesis, but
decides to re-test
using sugar
amounts between
50g. and 100g.
50g,60,70,80,90 9/9/2015 8:42:51 AM
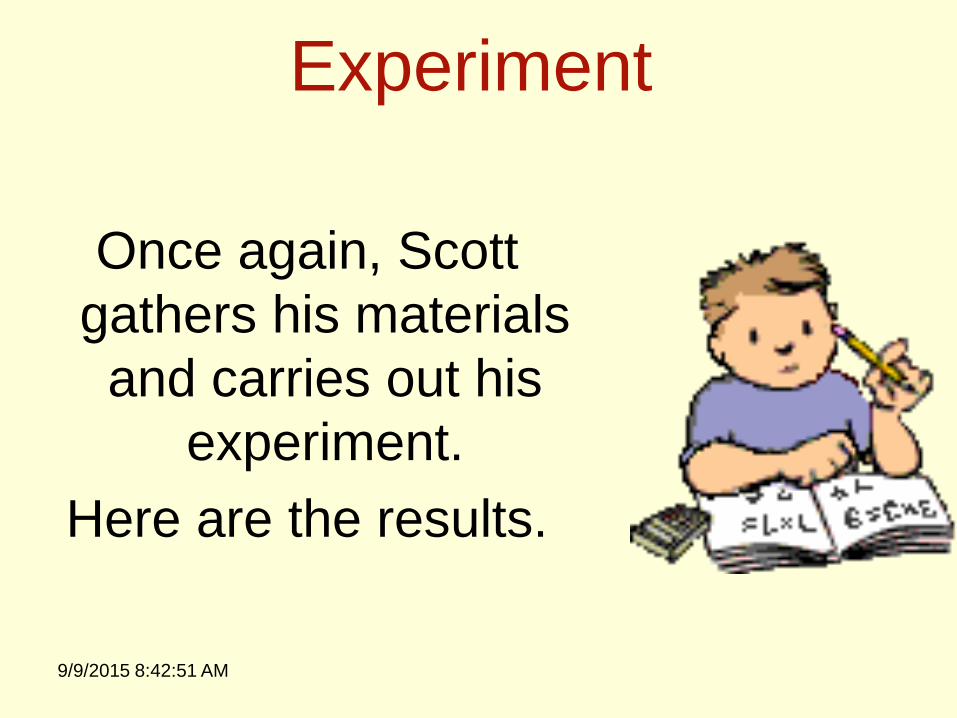
Experiment
Once again, Scott
gathers his materials
and carries out his
experiment.
Here are the results.
9/9/2015 8:42:51 AM

Can you tell which group
did the best?
9/9/2015 8:42:51 AM

Size of Baked Bread (LxWxH) cm3
Amt. of
Sugar (g.) 1 2 3 Average
Size (cm3)
50 1296 1440 1296 1344
60 1404 1296 1440 1380
70 1638 1638 1560 1612
80 1404 1296 1296 1332
90 1080 1200 972 1084
Size of Bread Loaf (cm3)
Trials
Control group
9/9/2015 8:42:51 AM

Conclusion
Scott finds that 70g.
of sugar produces
the largest loaf.
His hypothesis is
accepted.
9/9/2015 8:42:51 AM
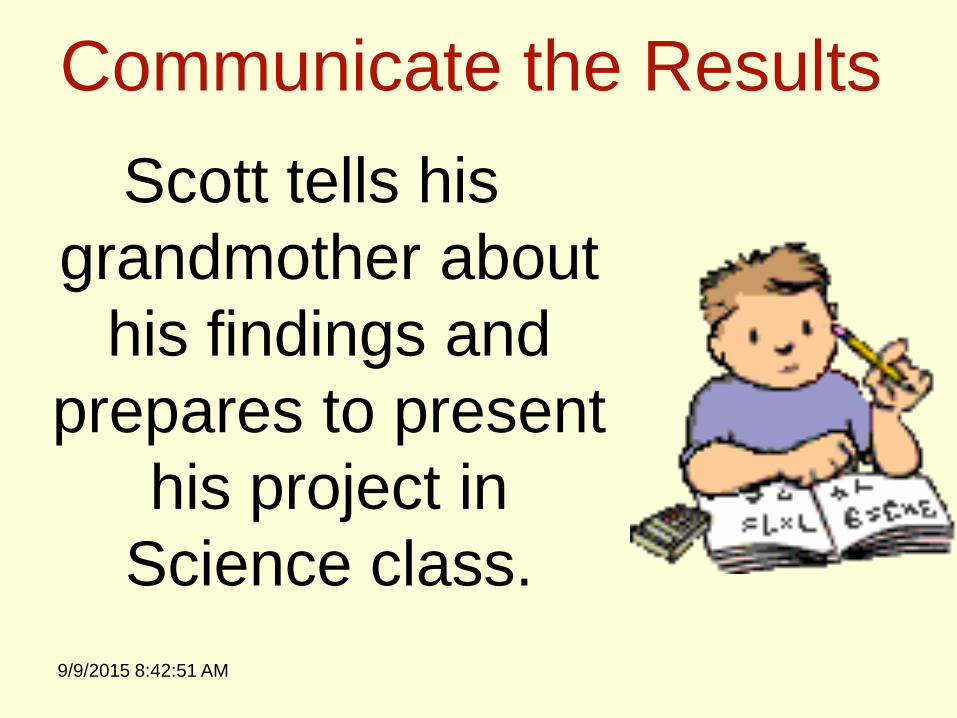
Communicate the Results
Scott tells his
grandmother about
his findings and
prepares to present
his project in
Science class.
9/9/2015 8:42:51 AM

9/9/2015 8:42:51 AM