didier serre actuarial associate
TRANSCRIPT

Milliman White Paper
Actuarial approaches to modelling and mitigating financial uncertainty in recommending new
drugs and health technologies
June 2016
An illustrative case study of hepatitis C antiviral therapies recently approved by NICE
Prepared by:
Joanne Buckle, FIA
Principal and Consulting Actuary
Didier Serre
Actuarial Associate
11 Old Jewry
London, EC2R 8DU, UK
Tel +44 (0)20 7847 1500
Fax +44 (0)20 7847 1501
uk.milliman.com

Milliman White Paper
ACKNOWLEDGMENT
We would like to thank the National Institute for Health and Care Excellence (NICE) for providing assistance and guidance in this project, and comments on preliminary draft versions. We also wish to thank Dr. Helen Blumen, MD, MBA for clinical guidance and Jill Van Den Bos, ASA, MAAA for technical peer review.
This white paper was funded entirely by Milliman.
Milliman White Paper
Actuarial approaches to modelling and mitigating financial uncertainty in recommending new drugs and health technologies
An illustrative case study of hepatitis C antiviral therapies recently approved by NICE
June 16, 2016
TABLE OF CONTENTS
I. EXECUTIVE SUMMARY ........................................................................................................................... 1
II. BACKGROUND ......................................................................................................................................... 2
III. THEORETICAL FRAMEWORK ................................................................................................................ 3
Considerations relevant to the current NICE appraisal process ...................................................................... 3 Proposed approaches: key elements .............................................................................................................. 3 Parametrising models with empirical data ....................................................................................................... 7
IV. SIMULATION RESULTS AND RECOMMENDATION .............................................................................. 8
ACTUARIAL COST MODEL AND BUDGET IMPACT ..................................................................................... 10
Model specificities .......................................................................................................................................... 10 Applications of the cost model ....................................................................................................................... 11
V. RISK SHARING AND UNCERTAINTY ................................................................................................... 13
Risk sharing and associated challenges in England ..................................................................................... 13 Examples of risk sharing from case study ..................................................................................................... 14
Population-wide or cohort-specific .......................................................................................................... 14 Patient-centric .......................................................................................................................................... 16
VI. CONCLUDING REMARKS AND NEXT STEPS ..................................................................................... 18
CAVEATS AND LIMITATIONS ......................................................................................................................... 19
APPENDIX A: DATA, METHODOLOGY AND ASSUMPTIONS ..................................................................... 20
Key parameter assumptions .......................................................................................................................... 20
Milliman White Paper
Actuarial approaches to modelling and mitigating financial uncertainty in recommending new drugs and health technologies 1
An illustrative case study of hepatitis C antiviral therapies recently approved by NICE
June 16, 2016
I. EXECUTIVE SUMMARY
Our analysis uses actuarial principles to illustrate a theoretical framework for handling uncertainty
and variability in modelling the financial impact of recommending new drugs and health technologies
for routine commissioning in England. Recognising the strong influence of the mean incremental
cost-effectiveness ratio (ICER) in current appraisals and reimbursement decision-making, we
consider some alternative approaches that build on the current analytical process of the National
Institute for Health and Care Excellence (NICE), considering risk and uncertainty in ultimate
decision-making.
Using the evidence from manufacturer submissions to NICE for treating chronic hepatitis C, we
replicate, within reasonability, the Markov disease state transition model for three of the treatment
regimens for ledipasvir-sofosbuvir, all recently recommended for reimbursement by the English
National Health Service (NHS), and use that as a basis to illustrate an actuarial theoretical
framework for handling uncertainty. We identify key assumptions from one-way sensitivity analysis
and model them stochastically.1 As the tolerance level for risk varies across the methodological
approaches that we explore, only one scenario results in an ICER above the current implicit
threshold for recommendation, as illustrated with cost-effectiveness acceptability curves. Through
simulation, we derive a distribution of ICER points for each treatment regimen and rely on key
statistics and other measures of variability to develop a basis for risk sharing. The risk mitigation
strategies presented are designed to reduce uncertainty around the ICER and the budget impact.
Particularly, we demonstrate examples of possible one-way and two-way risk sharing arrangements
developed around the assumptions that have the greatest effect on the potential financial impact,
split by population, treatment, and patient-specific levels.
We further propose an actuarial cost model as a robust tool to monitor the resource implications
and overall budget impact of new NICE guidance. This model, designed as a proof of concept, has
built-in capacity to integrate revised assumptions reflecting actual experience against projections,
provide key metrics against which to measure performance, and present various scenarios over
time and for specified subpopulations. It also allocates costs and gains to the various health and
social care payers within the NHS, both at a population level and specific to a treatment population.
Overall, this paper communicates a framework for assessing uncertainty in the ICER in a way that
the multidisciplinary stakeholders can understand. It ultimately relies on stochastic modelling and
simulation. It also demonstrates how key model assumptions can be derived empirically using ‘real-
world’ data of medical services utilisation to inform the NICE guidance review process.
1 In a health economics context, the term “probabilistic” may also be used interchangeably to refer to “stochastic”.

Milliman White Paper
Actuarial approaches to modelling and mitigating financial uncertainty in recommending new drugs and health technologies 2
An illustrative case study of hepatitis C antiviral therapies recently approved by NICE
June 16, 2016
II. BACKGROUND
The appraisal of new medical technologies is central to any value-based health system that seeks
to maximise health benefits given a fixed budget. Since 1999, NICE is responsible for producing
national guidance on new drugs and devices in England through its technology appraisal process
and clinical guidelines, using a well-defined and broadly accepted academic methodology.2 While
there is no explicit cost-effectiveness threshold for acceptance, in practice it is estimated to lie
somewhere between £20,000 and £30,000 per quality-adjusted life-year (QALY), with very few
technologies recommended above £30,000/QALY. Another of NICE’s responsibilities is to strike a
balance between timely access to innovative technologies and the relative cost-effectiveness of
different treatments. To this extent, NICE adopts the perspective of the NHS as a third-party payer,
yet does not typically take into account other direct costs (social care) or indirect costs (sickness
absence, or patient opportunity costs for instance).
Currently, the models produced by the manufacturer form the basis to evaluate the clinical and cost-
effectiveness evidence used by the NICE Appraisal Committee to inform the decision-making
process. The onus is on the manufacturer to provide clinical and cost-effectiveness evidence that
justifies premium pricing of the technology. In recent years, England, like many other countries in
Europe, has witnessed an increase in the number of submissions for new drugs and technologies
with no therapeutic alternative. These received regulatory approval, and sometimes even
reimbursement approval, on the basis of initially very promising evidence from mature Phase II
clinical data.3
In parallel, manufacturers can also apply for Patient Access Schemes (PAS) and other managed
entry agreements to secure access to high-cost drugs for patients. These usually involve
confidential pricing arrangements, and aim to improve the cost-effectiveness of new technologies.
Recent changes to the regulatory system and resulting expected increases in the number of
submissions based on less than perfect information are likely to require ongoing monitoring of
evidence. Risk mitigation strategies can offer to limit financial risks to the NHS (and potentially social
care budgets, as they become more interlinked with healthcare budgets).
The potential NHS budget impact of adopting a new technology is not considered explicitly in the
final Appraisal Committee's decision, although we recognise that it is considered implicitly.
However, more importantly, the explicit determination of the budget impact if key assumptions that
affect the financials turn out to be incorrect is not considered within a consistent framework that
highlights critical financial risks. Developing robust mechanisms for mitigating and monitoring
financial risks and uncertainties around outcome measures can therefore prove essential to whether
or not a technology actually meets cost-effectiveness criteria when in use.
While recognising that the actuarial contribution to medical and technology appraisals has
historically been limited, there exist nevertheless some opportunities for us to explore alternative
methodological approaches and perspectives. Precisely, this report will aim to illustrate some
applications of actuarial techniques in handling uncertainty and projecting future cost implications
in a context of health technology appraisals.
2 NICE (April 2013). Guide to the methods of technology appraisal 2013. Retrieved March 18, 2016, from https://www.nice.org.uk/article/pmg9/chapter/foreword.
3 Two common examples are the Early Access to Medicines Scheme, which allows access to drugs to patients before securing a full licence, and adaptive licensing, which initially grants authorisation to a small, well defined group of patients with the possibility to extend its use to wider groups.
The recent changes to
the regulatory system
and associated
expected increases in
the number of
submissions based on
less than perfect
information are likely to
require ongoing
monitoring of evidence
and mitigation
strategies which limit
the financial risk for the
NHS.
Milliman White Paper
Actuarial approaches to modelling and mitigating financial uncertainty in recommending new drugs and health technologies 3
An illustrative case study of hepatitis C antiviral therapies recently approved by NICE
June 16, 2016
III. THEORETICAL FRAMEWORK
CONSIDERATIONS RELEVANT TO THE CURRENT NICE APPRAISAL PROCESS
One of NICE’s ongoing challenges includes modelling and quantifying uncertainty around the
clinical and cost-effectiveness of technologies in a way that is both meaningful to the various
stakeholders and commensurate with the expected risk/benefit ratio. Where the expedited
regulatory approval process described previously is used to promote the preliminary adoption of
potentially very effective drugs, it can nevertheless be subject to high levels of uncertainty around
long-term outcomes such as survival and side effects, and around their associated costs. Note that
these estimates are usually extrapolated from clinical trial data with low sample size and projected
forward at a very early stage of the drug development. For treatments likely to offer a cure, for
instance, the levels of financial and clinical uncertainty can be quite considerable.
In addition, head-to-head comparisons are rarely carried out in clinical trials, thus relying on naïve
indirect comparison to assess the incremental cost-effectiveness of a technology or drug relative to
a comparator. Finally, despite NICE’s strongly stated preference for stochastic modelling in
estimating the ICER, many drug and technology manufacturers prefer to present their health
technology assessment (HTA) submission, and any modifications to it, using deterministic scenario
testing, which is due to the computationally demanding nature of the probabilistic model. The
deterministic approach precludes attributing probabilities to the economic and outcome metrics and
analysing the distribution of the ICER. Given the computing power now available, this argument
becomes increasingly invalid.
Other factors, such as the strength of supporting evidence, the robustness of the model, and the
plausibility of inputs, are also included into the final recommendation’s considerations, but they are
not considered with an objective framework in the same way as the mean ICER. Judgements about
the cost-effectiveness of new technologies are strongly influenced by a static central estimate as
the most plausible ICER. In this context, we consider some alternative approaches towards handling
uncertainty to support NICE’s decision-making process. All require assigning probability
distributions to cost and effectiveness metrics and focus on shielding the NHS budget from
downside risk.4 It is important to emphasise that, whatever the approach, consistency of
methodological approach and application remains critical to ensuring comparability across
appraisals.
PROPOSED APPROACHES: KEY ELEMENTS
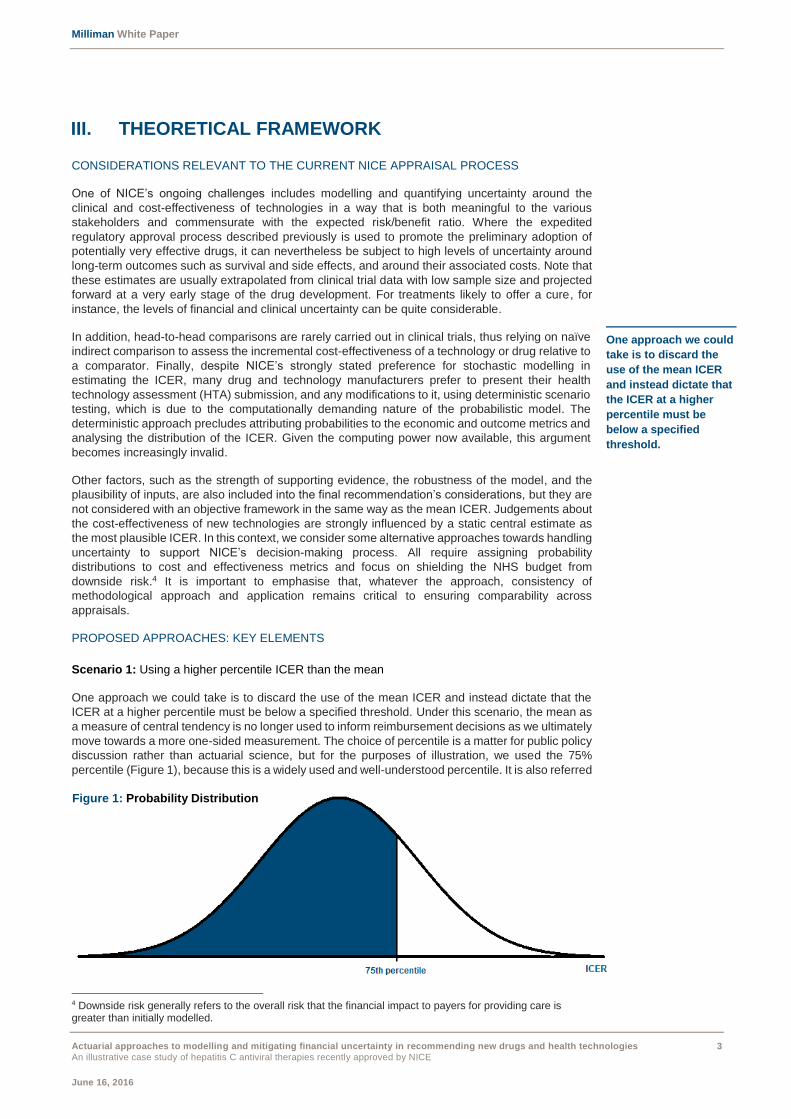
Scenario 1: Using a higher percentile ICER than the mean
One approach we could take is to discard the use of the mean ICER and instead dictate that the
ICER at a higher percentile must be below a specified threshold. Under this scenario, the mean as
a measure of central tendency is no longer used to inform reimbursement decisions as we ultimately
move towards a more one-sided measurement. The choice of percentile is a matter for public policy
discussion rather than actuarial science, but for the purposes of illustration, we used the 75%
percentile (Figure 1), because this is a widely used and well-understood percentile. It is also referred
4 Downside risk generally refers to the overall risk that the financial impact to payers for providing care is greater than initially modelled.
One approach we could
take is to discard the
use of the mean ICER
and instead dictate that
the ICER at a higher
percentile must be
below a specified
threshold.
Figure 1: Probability Distribution

Milliman White Paper
Actuarial approaches to modelling and mitigating financial uncertainty in recommending new drugs and health technologies 4
An illustrative case study of hepatitis C antiviral therapies recently approved by NICE
June 16, 2016
to as the upper quartile in probability distributions. This approach considerably reduces the amount
of uncertainty around the cost-effectiveness of the technology, because it leads to only
recommending those drugs and technologies for which at least three-quarters of the modelled ICER
distribution falls below a predetermined threshold. This approach will generally result in a higher
rejection level of new technology appraisals relative to the current NICE method, unless the
threshold for acceptance is also increased.
One of the applications of this approach can be illustrated with the following example. Using two
hypothetical mean ICERs of £15,000/QALY and £17,500/QALY, and a 75th percentile of
£21,000/QALY and £19,000/QALY respectively, we notice that the second treatment presented,
though associated with a higher mean ICER, represents a potentially smaller financial risk to the
NHS than its counterpart, which is due to the lower variability in the cost per QALY. It is possible,
though not always, that this treatment offers greater value for money for more patients than the
treatment showing the lowest mean ICER. Understandably, this variability cannot be observed by
simply looking at the mean ICER and requires a range of ICERs to be produced using a stochastic
method.
As we commented above, the choice of the 75% is arbitrary and depends on the NHS’s appetite for
risk—a higher percentile of say 90% or even 95% would limit downside risk further, but would have
the consequence that few highly uncertain technologies would ever be recommended. As
uncertainty is often linked with small patient populations, this approach is potentially discriminatory
against patients with rare diseases.
Scenario 2: Using a combination of median and a measure of variability
One other approach is to consider the median of the distribution in combination with a standardised
measure of variability to inform the decision-making process. Similar to the current NICE
methodology, the median ICER would be compared against a predefined threshold. This measure,
which can take many forms, is defined here for illustrative purposes as the ratio of the standard
deviation over the mean ICER, also commonly known as the coefficient of variation or relative
standard deviation. It provides an indication of the dispersion of the distribution of the ICER and
allows comparison of distributions with different means. For instance, in an insurance context, this
ratio can be used to classify treatment costs as low, medium, or high risk, in terms of 1) how
expensive they are (looking at average cost only), and 2) how variable that cost is likely to be. While
a high average cost and a high coefficient of variation is considered high risk, treatments with high
average cost, yet showing a low coefficient of variation, are deemed low or medium risk because,
although the cost is high, it is more predictable.
Measure of variability = Coefficient of variation = 𝝈
𝝁 (for illustrative purposes)
While the standardised measures for two or more technologies can be assessed relative to one
another, another application includes comparing them against a fixed value. Generally, this value is
industry-specific and can be adjusted up or down in accordance with the prespecified tolerance
level. Once it is set, consistency of use is fundamental. Note that lowering this threshold value will
impose stricter acceptance levels of variation in outcomes for a given technology (smaller variation
allowed per one unit of the mean), which should result in higher rejection rates. Alternatively, when
the measure of variability is above the fixed threshold value, recommending a new technology may
be tied to risk sharing agreements being implemented to limit financial downside risk. One of the
objectives of these arrangements is to bring the coefficient of variation within the mandated bounds,
seen in Figure 2.
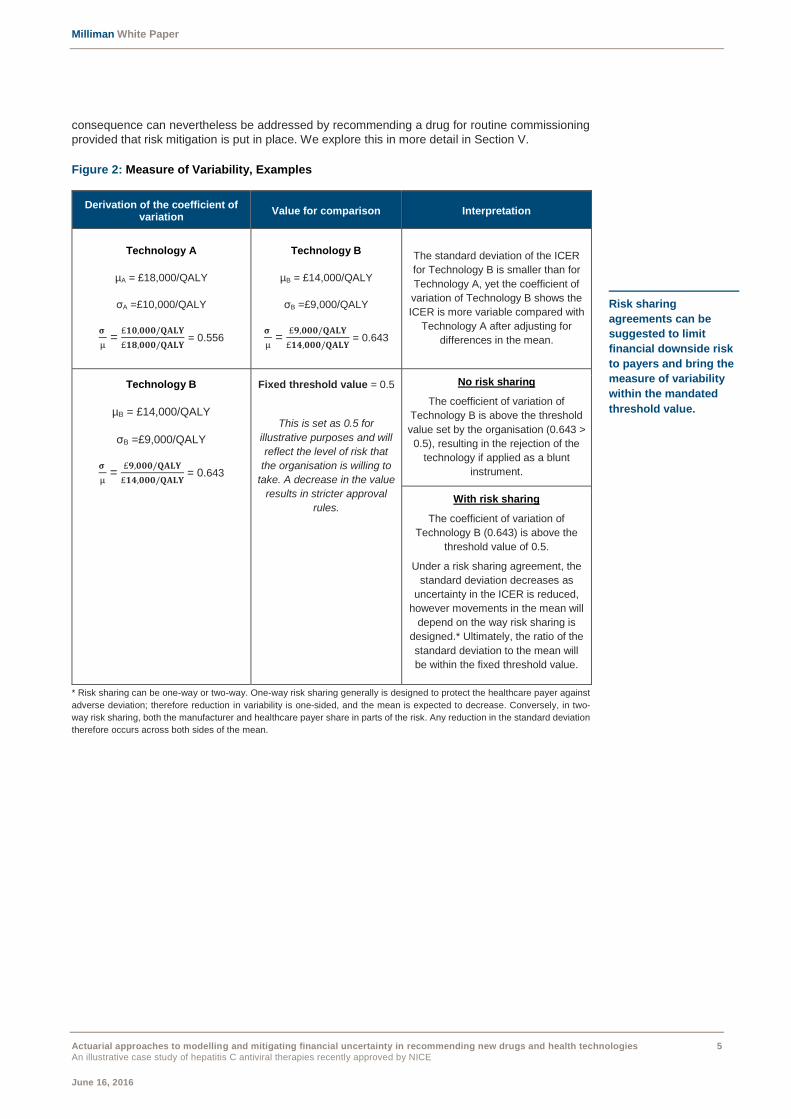
Scenario 3: Using a combination of mean and a measure of variability
In line with the current NICE framework, we present a variation to Scenario 2, which builds on the
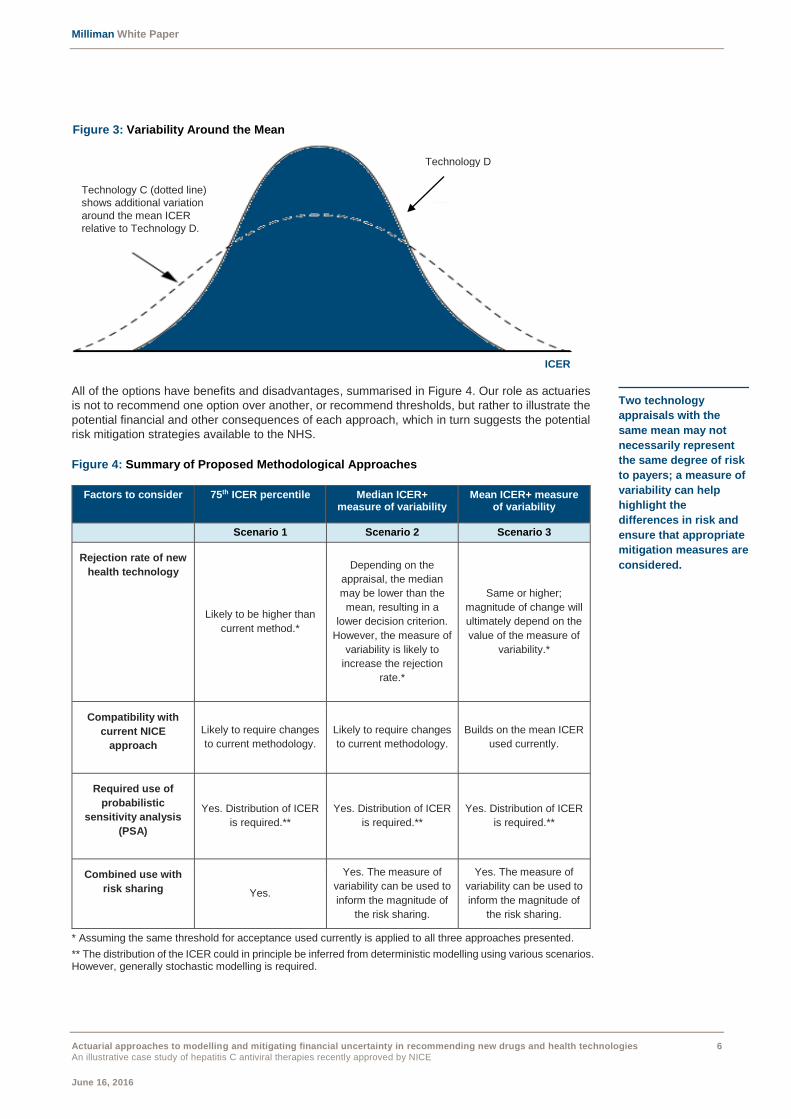
current methodology of relying on the mean ICER. As two technology appraisals with the same
mean may not necessarily represent the same degree of risk to payers (Figure 3), we also
incorporate a measure of variability in this approach and select the coefficient of variation for
illustrative purposes. Of the three options presented here, this approach is the most compatible with
the current NICE methodology; however, it represents a more stringent decision process relative to
the one currently in place, as the additional condition to be met (i.e., measure of variability to be
within bounds) is likely to reduce the number of technologies that are recommended. This
The coefficient of
variation provides an
indication of the
dispersion of the
distribution of the ICER
and allows comparison
of distributions with
different means.
Milliman White Paper
Actuarial approaches to modelling and mitigating financial uncertainty in recommending new drugs and health technologies 5
An illustrative case study of hepatitis C antiviral therapies recently approved by NICE
June 16, 2016
consequence can nevertheless be addressed by recommending a drug for routine commissioning
provided that risk mitigation is put in place. We explore this in more detail in Section V.
Figure 2: Measure of Variability, Examples
Derivation of the coefficient of variation
Value for comparison Interpretation
Technology A
µA = £18,000/QALY
σA =£10,000/QALY
𝛔
µ =
£𝟏𝟎,𝟎𝟎𝟎/𝐐𝐀𝐋𝐘
£𝟏𝟖,𝟎𝟎𝟎/𝐐𝐀𝐋𝐘 = 0.556
Technology B
µB = £14,000/QALY
σB =£9,000/QALY
𝛔
µ =
£𝟗,𝟎𝟎𝟎/𝐐𝐀𝐋𝐘
£𝟏𝟒,𝟎𝟎𝟎/𝐐𝐀𝐋𝐘 = 0.643
The standard deviation of the ICER
for Technology B is smaller than for
Technology A, yet the coefficient of
variation of Technology B shows the
ICER is more variable compared with
Technology A after adjusting for
differences in the mean.
Technology B
µB = £14,000/QALY
σB =£9,000/QALY
𝛔
µ =
£𝟗,𝟎𝟎𝟎/𝐐𝐀𝐋𝐘
£𝟏𝟒,𝟎𝟎𝟎/𝐐𝐀𝐋𝐘 = 0.643
Fixed threshold value = 0.5
This is set as 0.5 for
illustrative purposes and will
reflect the level of risk that
the organisation is willing to
take. A decrease in the value
results in stricter approval
rules.
No risk sharing
The coefficient of variation of
Technology B is above the threshold
value set by the organisation (0.643 >
0.5), resulting in the rejection of the
technology if applied as a blunt
instrument.
With risk sharing
The coefficient of variation of
Technology B (0.643) is above the
threshold value of 0.5.
Under a risk sharing agreement, the
standard deviation decreases as
uncertainty in the ICER is reduced,
however movements in the mean will
depend on the way risk sharing is
designed.* Ultimately, the ratio of the
standard deviation to the mean will
be within the fixed threshold value.
* Risk sharing can be one-way or two-way. One-way risk sharing generally is designed to protect the healthcare payer against
adverse deviation; therefore reduction in variability is one-sided, and the mean is expected to decrease. Conversely, in two-
way risk sharing, both the manufacturer and healthcare payer share in parts of the risk. Any reduction in the standard deviation
therefore occurs across both sides of the mean.
Risk sharing
agreements can be
suggested to limit
financial downside risk
to payers and bring the
measure of variability
within the mandated
threshold value.
Milliman White Paper
Actuarial approaches to modelling and mitigating financial uncertainty in recommending new drugs and health technologies 6
An illustrative case study of hepatitis C antiviral therapies recently approved by NICE
June 16, 2016
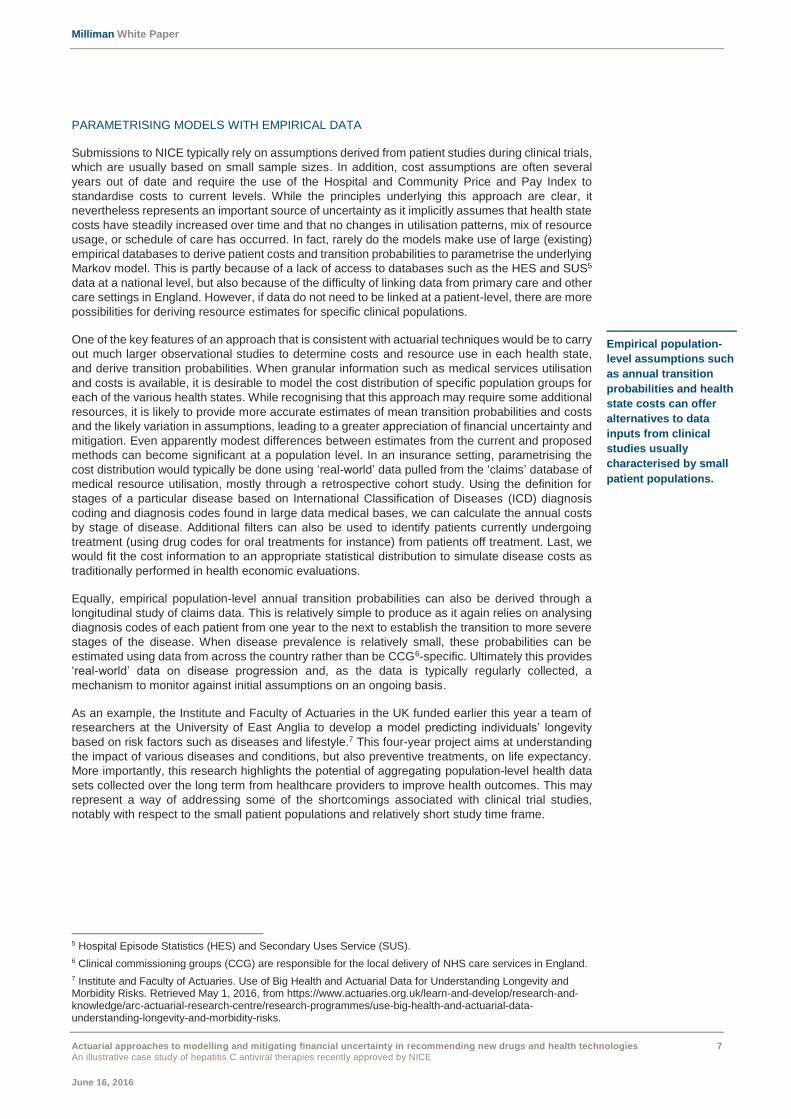
All of the options have benefits and disadvantages, summarised in Figure 4. Our role as actuaries
is not to recommend one option over another, or recommend thresholds, but rather to illustrate the
potential financial and other consequences of each approach, which in turn suggests the potential
risk mitigation strategies available to the NHS.
Figure 4: Summary of Proposed Methodological Approaches
Factors to consider 75th ICER percentile Median ICER+ measure of variability
Mean ICER+ measure of variability
Scenario 1 Scenario 2 Scenario 3
Rejection rate of new
health technology
Likely to be higher than
current method.*
Depending on the
appraisal, the median
may be lower than the
mean, resulting in a
lower decision criterion.
However, the measure of
variability is likely to
increase the rejection
rate.*
Same or higher;
magnitude of change will
ultimately depend on the
value of the measure of
variability.*
Compatibility with
current NICE
approach
Likely to require changes
to current methodology.
Likely to require changes
to current methodology.
Builds on the mean ICER
used currently.
Required use of
probabilistic
sensitivity analysis
(PSA)
Yes. Distribution of ICER
is required.**
Yes. Distribution of ICER
is required.**
Yes. Distribution of ICER
is required.**
Combined use with
risk sharing Yes.
Yes. The measure of
variability can be used to
inform the magnitude of
the risk sharing.
Yes. The measure of
variability can be used to
inform the magnitude of
the risk sharing.
* Assuming the same threshold for acceptance used currently is applied to all three approaches presented.
** The distribution of the ICER could in principle be inferred from deterministic modelling using various scenarios. However, generally stochastic modelling is required.
Two technology
appraisals with the
same mean may not
necessarily represent
the same degree of risk
to payers; a measure of
variability can help
highlight the
differences in risk and
ensure that appropriate
mitigation measures are
considered.
Technology D
Figure 3: Variability Around the Mean
Technology C (dotted line)
shows additional variation
around the mean ICER
relative to Technology D.
ICER
Milliman White Paper
Actuarial approaches to modelling and mitigating financial uncertainty in recommending new drugs and health technologies 7
An illustrative case study of hepatitis C antiviral therapies recently approved by NICE
June 16, 2016
PARAMETRISING MODELS WITH EMPIRICAL DATA
Submissions to NICE typically rely on assumptions derived from patient studies during clinical trials,
which are usually based on small sample sizes. In addition, cost assumptions are often several
years out of date and require the use of the Hospital and Community Price and Pay Index to
standardise costs to current levels. While the principles underlying this approach are clear, it
nevertheless represents an important source of uncertainty as it implicitly assumes that health state
costs have steadily increased over time and that no changes in utilisation patterns, mix of resource
usage, or schedule of care has occurred. In fact, rarely do the models make use of large (existing)
empirical databases to derive patient costs and transition probabilities to parametrise the underlying
Markov model. This is partly because of a lack of access to databases such as the HES and SUS5
data at a national level, but also because of the difficulty of linking data from primary care and other
care settings in England. However, if data do not need to be linked at a patient-level, there are more
possibilities for deriving resource estimates for specific clinical populations.
One of the key features of an approach that is consistent with actuarial techniques would be to carry
out much larger observational studies to determine costs and resource use in each health state,
and derive transition probabilities. When granular information such as medical services utilisation
and costs is available, it is desirable to model the cost distribution of specific population groups for
each of the various health states. While recognising that this approach may require some additional
resources, it is likely to provide more accurate estimates of mean transition probabilities and costs
and the likely variation in assumptions, leading to a greater appreciation of financial uncertainty and
mitigation. Even apparently modest differences between estimates from the current and proposed
methods can become significant at a population level. In an insurance setting, parametrising the
cost distribution would typically be done using ‘real-world’ data pulled from the ‘claims’ database of
medical resource utilisation, mostly through a retrospective cohort study. Using the definition for
stages of a particular disease based on International Classification of Diseases (ICD) diagnosis
coding and diagnosis codes found in large data medical bases, we can calculate the annual costs
by stage of disease. Additional filters can also be used to identify patients currently undergoing
treatment (using drug codes for oral treatments for instance) from patients off treatment. Last, we
would fit the cost information to an appropriate statistical distribution to simulate disease costs as
traditionally performed in health economic evaluations.
Equally, empirical population-level annual transition probabilities can also be derived through a
longitudinal study of claims data. This is relatively simple to produce as it again relies on analysing
diagnosis codes of each patient from one year to the next to establish the transition to more severe
stages of the disease. When disease prevalence is relatively small, these probabilities can be
estimated using data from across the country rather than be CCG6-specific. Ultimately this provides
‘real-world’ data on disease progression and, as the data is typically regularly collected, a
mechanism to monitor against initial assumptions on an ongoing basis.
As an example, the Institute and Faculty of Actuaries in the UK funded earlier this year a team of
researchers at the University of East Anglia to develop a model predicting individuals’ longevity
based on risk factors such as diseases and lifestyle.7 This four-year project aims at understanding
the impact of various diseases and conditions, but also preventive treatments, on life expectancy.
More importantly, this research highlights the potential of aggregating population-level health data
sets collected over the long term from healthcare providers to improve health outcomes. This may
represent a way of addressing some of the shortcomings associated with clinical trial studies,
notably with respect to the small patient populations and relatively short study time frame.
5 Hospital Episode Statistics (HES) and Secondary Uses Service (SUS).
6 Clinical commissioning groups (CCG) are responsible for the local delivery of NHS care services in England.
7 Institute and Faculty of Actuaries. Use of Big Health and Actuarial Data for Understanding Longevity and Morbidity Risks. Retrieved May 1, 2016, from https://www.actuaries.org.uk/learn-and-develop/research-and-knowledge/arc-actuarial-research-centre/research-programmes/use-big-health-and-actuarial-data-understanding-longevity-and-morbidity-risks.
Empirical population-
level assumptions such
as annual transition
probabilities and health
state costs can offer
alternatives to data
inputs from clinical
studies usually
characterised by small
patient populations.
Milliman White Paper
Actuarial approaches to modelling and mitigating financial uncertainty in recommending new drugs and health technologies 8
An illustrative case study of hepatitis C antiviral therapies recently approved by NICE
June 16, 2016
IV. SIMULATION RESULTS AND RECOMMENDATION
To illustrate the various theoretical approaches, we rely on three treatment regimens from the
recently recommended hepatitis C drug ledipasvir-sofosbuvir as a case study. For each of these
regimens, we replicate a time-dependent Markov model using the evidence from the manufacturer
submission to NICE. We also model uncertainty around key assumptions, which are presented here
but described in more detail in Appendix A. Deterministic scenario testing illustrated that the ICER
was particularly sensitive to changes in the transition probability from non-cirrhotic to cirrhotic stage,
to the discount rate applied to both costs and outcomes, and to the disease health state costs for
non-cirrhotic patients, and therefore we assigned each of these a probability distribution to model
stochastically.
The treatment arm consists of ledipasvir-sofosbuvir; the control arm does not have any treatment
assigned. In total, we simulate 1,000 runs for each of the treatment regimens below.
Treatment 1: Patients without cirrhosis; treatment naïve; eight-week treatment.
Treatment 2: Patients without cirrhosis; treatment experienced; 12-week treatment.
Treatment 3: Patients with cirrhosis; treatment naïve; 12-week treatment.
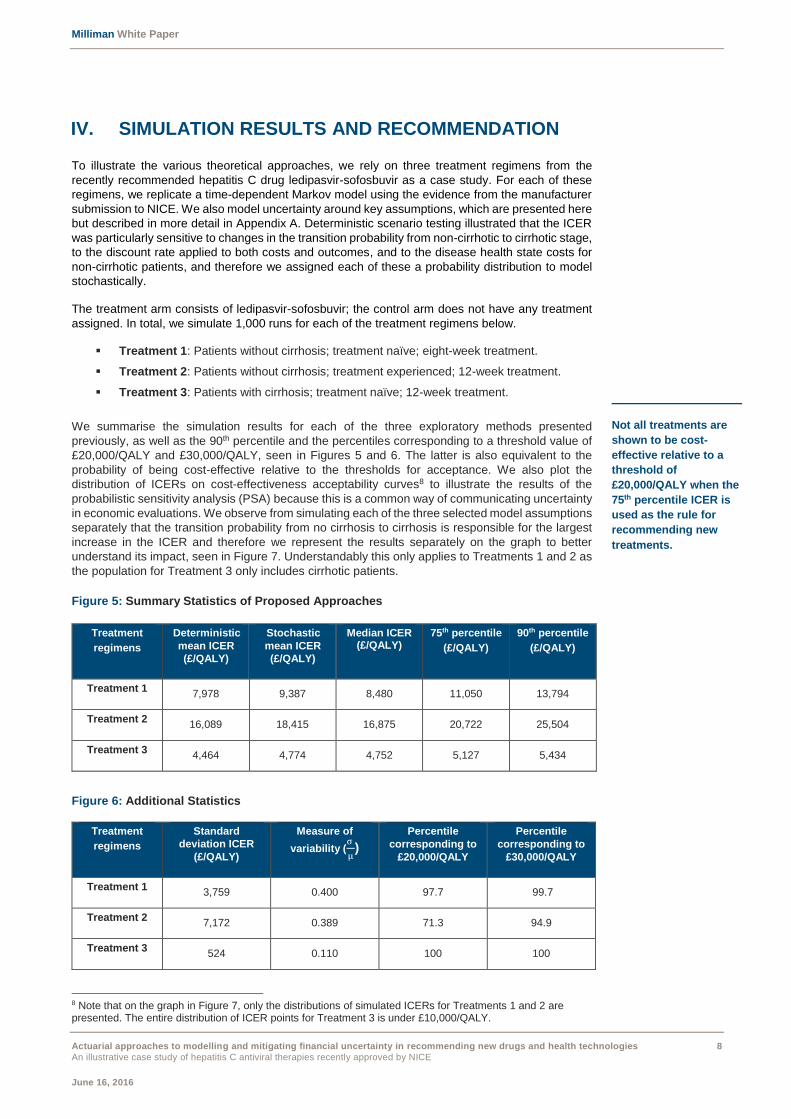
We summarise the simulation results for each of the three exploratory methods presented
previously, as well as the 90th percentile and the percentiles corresponding to a threshold value of
£20,000/QALY and £30,000/QALY, seen in Figures 5 and 6. The latter is also equivalent to the
probability of being cost-effective relative to the thresholds for acceptance. We also plot the
distribution of ICERs on cost-effectiveness acceptability curves8 to illustrate the results of the
probabilistic sensitivity analysis (PSA) because this is a common way of communicating uncertainty
in economic evaluations. We observe from simulating each of the three selected model assumptions
separately that the transition probability from no cirrhosis to cirrhosis is responsible for the largest
increase in the ICER and therefore we represent the results separately on the graph to better
understand its impact, seen in Figure 7. Understandably this only applies to Treatments 1 and 2 as
the population for Treatment 3 only includes cirrhotic patients.
Figure 5: Summary Statistics of Proposed Approaches
Figure 6: Additional Statistics
8 Note that on the graph in Figure 7, only the distributions of simulated ICERs for Treatments 1 and 2 are presented. The entire distribution of ICER points for Treatment 3 is under £10,000/QALY.
Treatment
regimens
Deterministic
mean ICER
(£/QALY)
Stochastic
mean ICER
(£/QALY)
Median ICER (£/QALY)
75th percentile
(£/QALY)
90th percentile
(£/QALY)
Treatment 1 7,978 9,387 8,480 11,050 13,794
Treatment 2 16,089 18,415 16,875 20,722 25,504
Treatment 3 4,464 4,774 4,752 5,127 5,434
Treatment
regimens
Standard
deviation ICER
(£/QALY)
Measure of
variability (σ
µ)
Percentile
corresponding to
£20,000/QALY
Percentile
corresponding to
£30,000/QALY
Treatment 1 3,759 0.400 97.7 99.7
Treatment 2 7,172 0.389 71.3 94.9
Treatment 3 524 0.110 100 100
Not all treatments are
shown to be cost-
effective relative to a
threshold of
£20,000/QALY when the
75th percentile ICER is
used as the rule for
recommending new
treatments.
Milliman White Paper
Actuarial approaches to modelling and mitigating financial uncertainty in recommending new drugs and health technologies 9
An illustrative case study of hepatitis C antiviral therapies recently approved by NICE
June 16, 2016
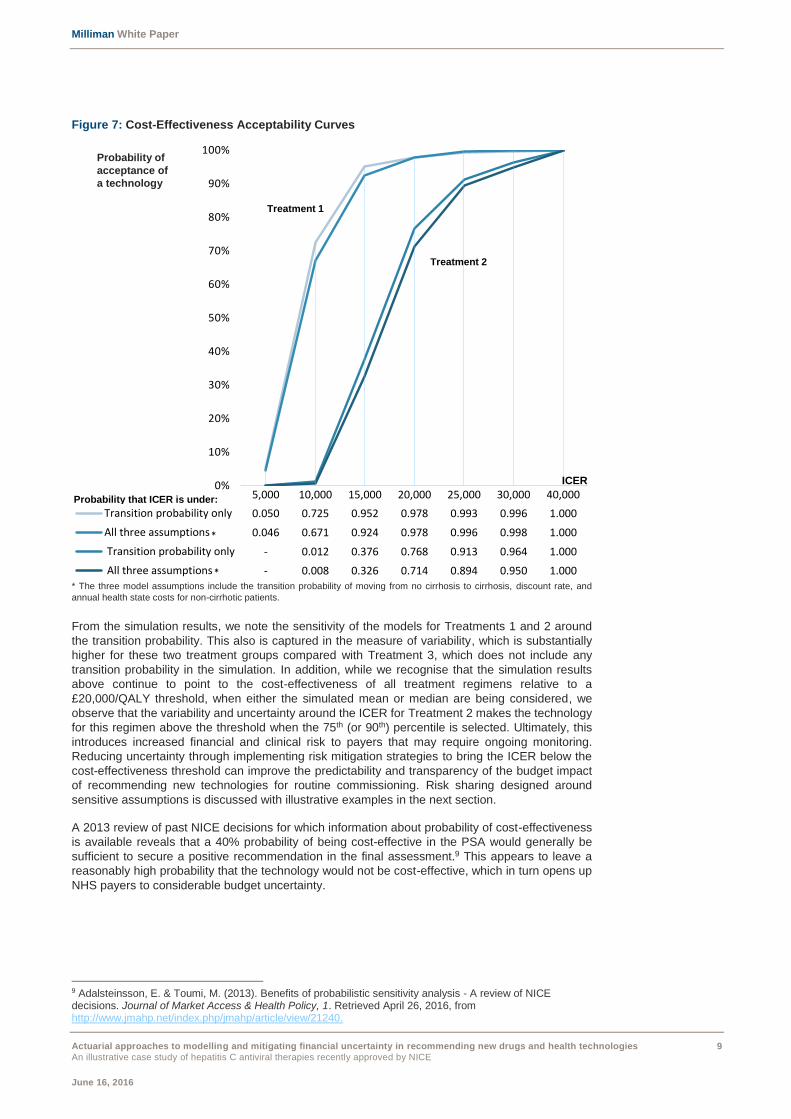
Figure 7: Cost-Effectiveness Acceptability Curves
* The three model assumptions include the transition probability of moving from no cirrhosis to cirrhosis, discount rate, and
annual health state costs for non-cirrhotic patients.
From the simulation results, we note the sensitivity of the models for Treatments 1 and 2 around
the transition probability. This also is captured in the measure of variability, which is substantially
higher for these two treatment groups compared with Treatment 3, which does not include any
transition probability in the simulation. In addition, while we recognise that the simulation results
above continue to point to the cost-effectiveness of all treatment regimens relative to a
£20,000/QALY threshold, when either the simulated mean or median are being considered, we
observe that the variability and uncertainty around the ICER for Treatment 2 makes the technology
for this regimen above the threshold when the 75th (or 90th) percentile is selected. Ultimately, this
introduces increased financial and clinical risk to payers that may require ongoing monitoring.
Reducing uncertainty through implementing risk mitigation strategies to bring the ICER below the
cost-effectiveness threshold can improve the predictability and transparency of the budget impact
of recommending new technologies for routine commissioning. Risk sharing designed around
sensitive assumptions is discussed with illustrative examples in the next section.
A 2013 review of past NICE decisions for which information about probability of cost-effectiveness
is available reveals that a 40% probability of being cost-effective in the PSA would generally be
sufficient to secure a positive recommendation in the final assessment.9 This appears to leave a
reasonably high probability that the technology would not be cost-effective, which in turn opens up
NHS payers to considerable budget uncertainty.
9 Adalsteinsson, E. & Toumi, M. (2013). Benefits of probabilistic sensitivity analysis - A review of NICE decisions. Journal of Market Access & Health Policy, 1. Retrieved April 26, 2016, from http://www.jmahp.net/index.php/jmahp/article/view/21240.
5,000 10,000 15,000 20,000 25,000 30,000 40,000
Transition probability only 0.050 0.725 0.952 0.978 0.993 0.996 1.000
All three assumptions 0.046 0.671 0.924 0.978 0.996 0.998 1.000
Transition probability only - 0.012 0.376 0.768 0.913 0.964 1.000
All three assumptions - 0.008 0.326 0.714 0.894 0.950 1.000
0%
10%
20%
30%
40%
50%
60%
70%
80%
90%
100%
Treatment 1
Treatment 2
ICER
Probability that ICER is under:
Probability of
acceptance of
a technology
*
*
Milliman White Paper
Actuarial approaches to modelling and mitigating financial uncertainty in recommending new drugs and health technologies 10
An illustrative case study of hepatitis C antiviral therapies recently approved by NICE
June 16, 2016
ACTUARIAL COST MODEL AND BUDGET IMPACT
Actuarial cost models are commonly used risk management tools for projecting future healthcare
costs. The modelling of cost per treatment and utilisation can be an effective way for payers (both
public and private) to estimate the financial impact of recommending a treatment for routine use.
While insurance plans are often interested in estimating the budget impact of adding a new drug or
treatment onto their formulary or benefit package, publicly financed systems similarly may want to
understand the implications of expanding the range of care services provided to their populations.
Often this can be achieved using already existing cost information from health payers.
MODEL SPECIFICITIES
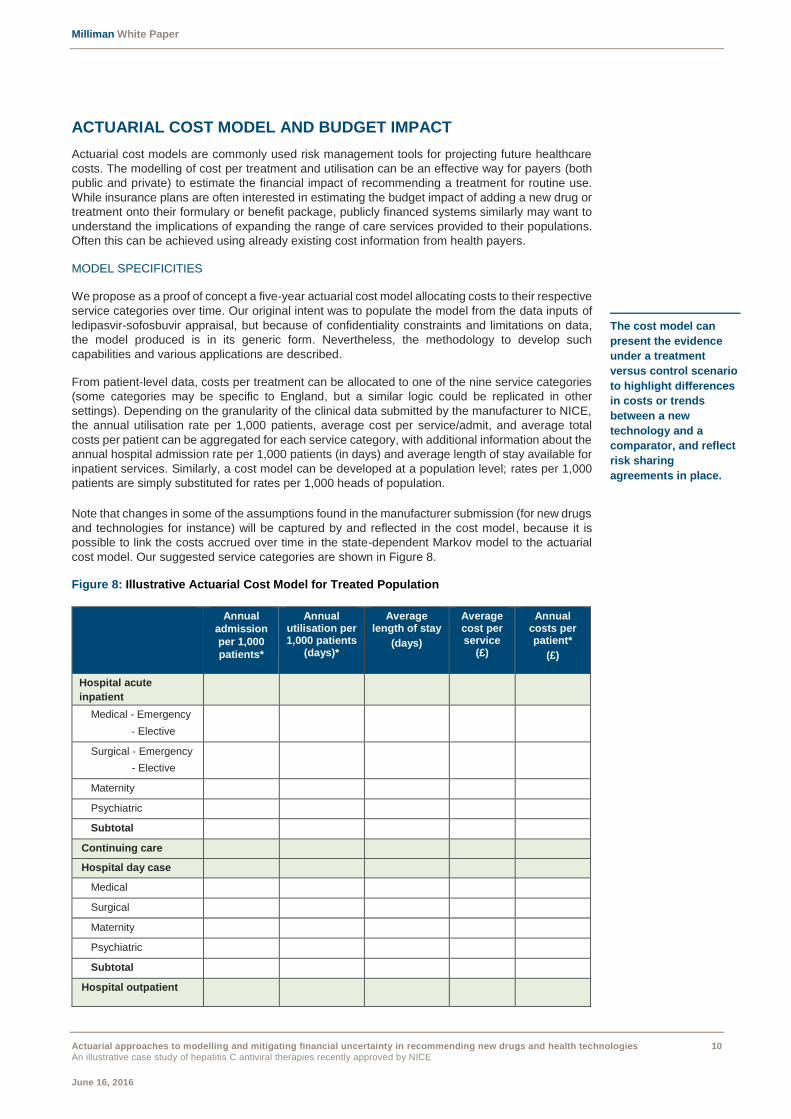
We propose as a proof of concept a five-year actuarial cost model allocating costs to their respective
service categories over time. Our original intent was to populate the model from the data inputs of
ledipasvir-sofosbuvir appraisal, but because of confidentiality constraints and limitations on data,
the model produced is in its generic form. Nevertheless, the methodology to develop such
capabilities and various applications are described.
From patient-level data, costs per treatment can be allocated to one of the nine service categories
(some categories may be specific to England, but a similar logic could be replicated in other
settings). Depending on the granularity of the clinical data submitted by the manufacturer to NICE,
the annual utilisation rate per 1,000 patients, average cost per service/admit, and average total
costs per patient can be aggregated for each service category, with additional information about the
annual hospital admission rate per 1,000 patients (in days) and average length of stay available for
inpatient services. Similarly, a cost model can be developed at a population level; rates per 1,000
patients are simply substituted for rates per 1,000 heads of population.
Note that changes in some of the assumptions found in the manufacturer submission (for new drugs
and technologies for instance) will be captured by and reflected in the cost model, because it is
possible to link the costs accrued over time in the state-dependent Markov model to the actuarial
cost model. Our suggested service categories are shown in Figure 8.
Figure 8: Illustrative Actuarial Cost Model for Treated Population
Annual
admission
per 1,000
patients*
Annual utilisation per 1,000 patients
(days)*
Average length of stay
(days)
Average cost per service
(£)
Annual costs per patient*
(£)
Hospital acute
inpatient
Medical - Emergency
- Elective
Surgical - Emergency
- Elective
Maternity
Psychiatric
Subtotal
Continuing care
Hospital day case
Medical
Surgical
Maternity
Psychiatric
Subtotal
Hospital outpatient
The cost model can
present the evidence
under a treatment
versus control scenario
to highlight differences
in costs or trends
between a new
technology and a
comparator, and reflect
risk sharing
agreements in place.
Milliman White Paper
Actuarial approaches to modelling and mitigating financial uncertainty in recommending new drugs and health technologies 11
An illustrative case study of hepatitis C antiviral therapies recently approved by NICE
June 16, 2016
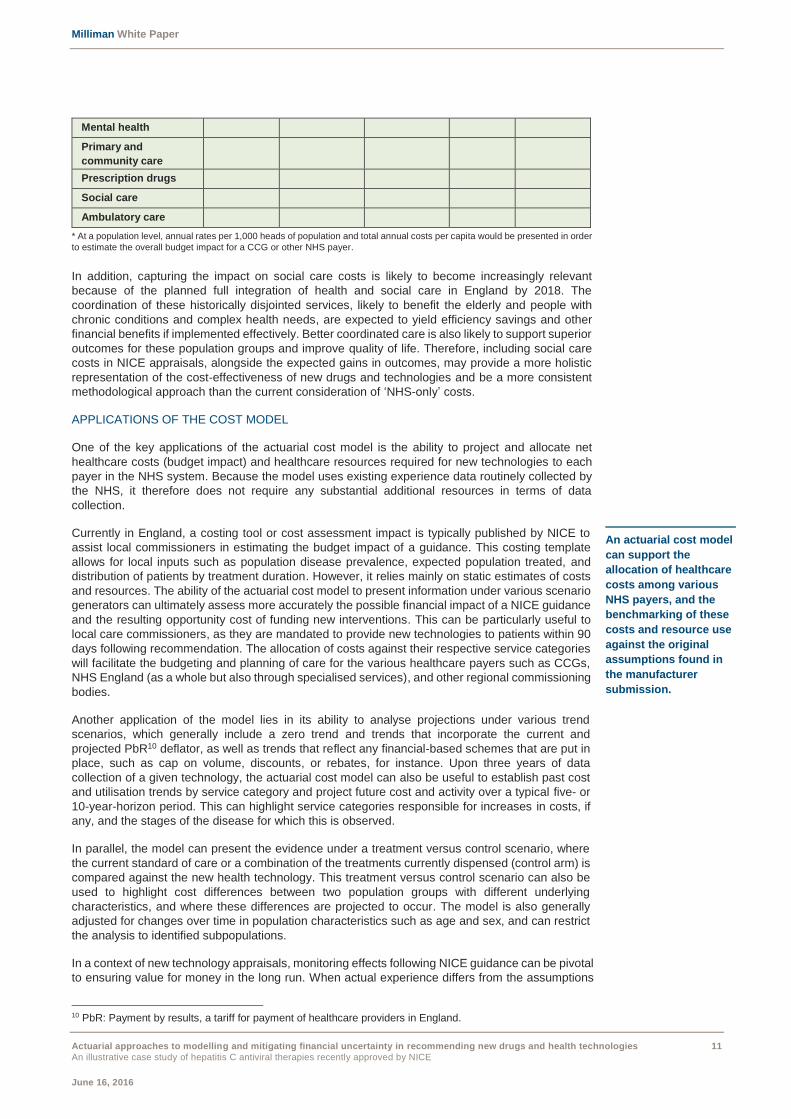
Mental health
Primary and
community care
Prescription drugs
Social care
Ambulatory care
* At a population level, annual rates per 1,000 heads of population and total annual costs per capita would be presented in order
to estimate the overall budget impact for a CCG or other NHS payer.
In addition, capturing the impact on social care costs is likely to become increasingly relevant
because of the planned full integration of health and social care in England by 2018. The
coordination of these historically disjointed services, likely to benefit the elderly and people with
chronic conditions and complex health needs, are expected to yield efficiency savings and other
financial benefits if implemented effectively. Better coordinated care is also likely to support superior
outcomes for these population groups and improve quality of life. Therefore, including social care
costs in NICE appraisals, alongside the expected gains in outcomes, may provide a more holistic
representation of the cost-effectiveness of new drugs and technologies and be a more consistent
methodological approach than the current consideration of ‘NHS-only’ costs.
APPLICATIONS OF THE COST MODEL
One of the key applications of the actuarial cost model is the ability to project and allocate net
healthcare costs (budget impact) and healthcare resources required for new technologies to each
payer in the NHS system. Because the model uses existing experience data routinely collected by
the NHS, it therefore does not require any substantial additional resources in terms of data
collection.
Currently in England, a costing tool or cost assessment impact is typically published by NICE to
assist local commissioners in estimating the budget impact of a guidance. This costing template
allows for local inputs such as population disease prevalence, expected population treated, and
distribution of patients by treatment duration. However, it relies mainly on static estimates of costs
and resources. The ability of the actuarial cost model to present information under various scenario
generators can ultimately assess more accurately the possible financial impact of a NICE guidance
and the resulting opportunity cost of funding new interventions. This can be particularly useful to
local care commissioners, as they are mandated to provide new technologies to patients within 90
days following recommendation. The allocation of costs against their respective service categories
will facilitate the budgeting and planning of care for the various healthcare payers such as CCGs,
NHS England (as a whole but also through specialised services), and other regional commissioning
bodies.
Another application of the model lies in its ability to analyse projections under various trend
scenarios, which generally include a zero trend and trends that incorporate the current and
projected PbR10 deflator, as well as trends that reflect any financial-based schemes that are put in
place, such as cap on volume, discounts, or rebates, for instance. Upon three years of data
collection of a given technology, the actuarial cost model can also be useful to establish past cost
and utilisation trends by service category and project future cost and activity over a typical five- or
10-year-horizon period. This can highlight service categories responsible for increases in costs, if
any, and the stages of the disease for which this is observed.
In parallel, the model can present the evidence under a treatment versus control scenario, where
the current standard of care or a combination of the treatments currently dispensed (control arm) is
compared against the new health technology. This treatment versus control scenario can also be
used to highlight cost differences between two population groups with different underlying
characteristics, and where these differences are projected to occur. The model is also generally
adjusted for changes over time in population characteristics such as age and sex, and can restrict
the analysis to identified subpopulations.
In a context of new technology appraisals, monitoring effects following NICE guidance can be pivotal
to ensuring value for money in the long run. When actual experience differs from the assumptions
10 PbR: Payment by results, a tariff for payment of healthcare providers in England.
An actuarial cost model
can support the
allocation of healthcare
costs among various
NHS payers, and the
benchmarking of these
costs and resource use
against the original
assumptions found in
the manufacturer
submission.
Milliman White Paper
Actuarial approaches to modelling and mitigating financial uncertainty in recommending new drugs and health technologies 12
An illustrative case study of hepatitis C antiviral therapies recently approved by NICE
June 16, 2016
underlying the original reimbursement decision (i.e., service utilisation), the model is updated to
reflect the new experience and compare against internal or external benchmarks. This forms an
integral part of the feedback loop process, a common feature in actuarial approaches, and would
assess in this particular situation whether a technology is delivering value as expected. Currently,
all NICE guidance is considered for review after three years of being issued, especially upon a
change in the inputs suspected to affect the outcome of the appraisal, or recommendation of a new
competing technology. Therefore, a potential feature of the actuarial cost model would be to inform
the first triannual review process and any subsequent ones, by providing metrics against which to
evaluate actual costs and utilisation by service categories.
Overall, we believe that the actuarial cost model, while sharing the same objective as the NICE’s
current cost template, goes one step further, in exploring variability and uncertainty around key
inputs and under various scenarios. It also allocates costs and gains to the current payers within
the NHS system, and can integrate the effect of potential risk sharing deals, which represent
improvements from the current approach. Lastly, it has the potential to inform NICE guidance
revision process using readily available cost information collected by the NHS, and at a minimal
additional cost to the healthcare system.
Milliman White Paper
Actuarial approaches to modelling and mitigating financial uncertainty in recommending new drugs and health technologies 13
An illustrative case study of hepatitis C antiviral therapies recently approved by NICE
June 16, 2016
V. RISK SHARING AND UNCERTAINTY
Actuarial approaches are often employed to inform risk sharing arrangements. They are usually
designed to mitigate the financial risk of uncertainty, with a particular focus on adverse experience
and extreme, more volatile, scenarios. Traditional actuarial involvement in these schemes involves
distributing uncertainty more productively, between local commissioners and providers, to those
parties best equipped to manage different sources of financial risk. Using a similar logic, this
expertise can also be used to better apportion the risk between the NHS and companies responsible
for marketing new health technologies.
RISK SHARING AND ASSOCIATED CHALLENGES IN ENGLAND
NHS England has developed in recent years some risk mitigation strategies that aim to reduce its
financial exposure to new treatments. Patient access schemes, presented in the opening section,
are commonly regarded in England, and other parts of the world, as alternative market access
agreements between healthcare payers and manufacturers that address risk in initially promising
technologies and for which the uncertainty around the ICER is large. They generally extend to
technologies likely to have a sizable budget impact. Currently in England, the majority of these
agreements are financial-based, merely consisting of discounts to the NHS or price/volume
agreements, as they are relatively simple to implement and maintain from an administrative
perspective. The move to more outcomes-based or performance-based schemes, which tie
reimbursement to superior outcomes, could benefit from actuarial and other risk mitigation
approaches in delivering value-for-money care, but ultimately require additional resources to
monitor and record clinical endpoints.
One of the main challenges with implementing risk sharing agreements for new drugs and
technologies is often the lack of historical data for treatments newly commissioned by NHS England.
The financial risk to payers following recommendation can be substantial, as approval usually
extends for a few years, or until a revised decision for funding is issued. In these situations, data
collected during clinical trials is normally extrapolated to predict future use of resources, but this
comes with some level of uncertainty. Instead, these data inputs could be augmented by ‘real-world’
NHS data from which empirical transition probabilities, treatment costs, and other health state costs
are estimated from claims data, using the process described previously. The confidence and
credibility around these cost and probability estimates will ultimately depend on the size of the
population utilising healthcare resources, with low-volume treatments or small population groups
requiring additional months or years of observation to meet these criteria.
Another area that we believe requires greater focus is the continuous monitoring of highly uncertain
initial assumptions, which have a disproportionate effect on the eventual financial and clinical
outcomes. We believe embedding model updates into a continuous feedback loop would improve
submitted models and better inform the NICE guidance review process. Generally, we advise
identifying the key assumptions with potentially large implications for the cost-effectiveness or
budget impact of the technology at an early stage of the appraisal. Monitoring actual performance
over time against inputs and assumptions found in the manufacturer submission can be crucial to
quantifying the magnitude of the discount, rebate or any other financial transfer to the NHS from the
manufacturer. This process may highlight resource levels that are different from the estimates used
in the technology appraisal. Note that this review should be carried out irrespective of whether a
risk sharing deal is put in place. It is also worth commenting that risk sharing can be retrospective,
or prospective, or a combination of the two, but it is critical that both parties to the deal understand
the level of financial and clinical risk they are exposed to under a variety of scenarios and agree in
detail on any methodology used to calculate the risk exposures. Despite the limitations and
challenges, entering into risk sharing agreements with the drug manufacturer at an early stage can
limit downside risk to the NHS.
The lack of historical
data characterised in
new drugs and
technologies stresses
the importance of
monitoring future
resource use and other
model assumptions
over time.
Milliman White Paper
Actuarial approaches to modelling and mitigating financial uncertainty in recommending new drugs and health technologies 14
An illustrative case study of hepatitis C antiviral therapies recently approved by NICE
June 16, 2016
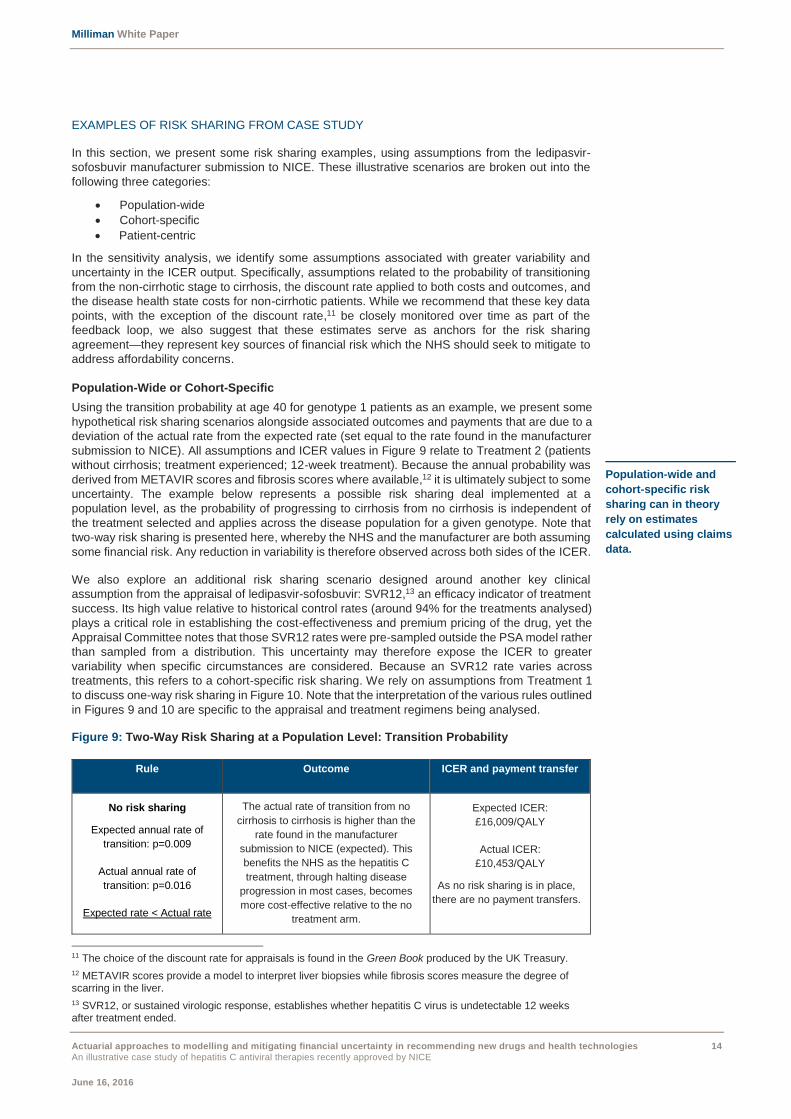
EXAMPLES OF RISK SHARING FROM CASE STUDY
In this section, we present some risk sharing examples, using assumptions from the ledipasvir-
sofosbuvir manufacturer submission to NICE. These illustrative scenarios are broken out into the
following three categories:
Population-wide
Cohort-specific
Patient-centric
In the sensitivity analysis, we identify some assumptions associated with greater variability and
uncertainty in the ICER output. Specifically, assumptions related to the probability of transitioning
from the non-cirrhotic stage to cirrhosis, the discount rate applied to both costs and outcomes, and
the disease health state costs for non-cirrhotic patients. While we recommend that these key data
points, with the exception of the discount rate,11 be closely monitored over time as part of the
feedback loop, we also suggest that these estimates serve as anchors for the risk sharing
agreement—they represent key sources of financial risk which the NHS should seek to mitigate to
address affordability concerns.
Population-Wide or Cohort-Specific
Using the transition probability at age 40 for genotype 1 patients as an example, we present some
hypothetical risk sharing scenarios alongside associated outcomes and payments that are due to a
deviation of the actual rate from the expected rate (set equal to the rate found in the manufacturer
submission to NICE). All assumptions and ICER values in Figure 9 relate to Treatment 2 (patients
without cirrhosis; treatment experienced; 12-week treatment). Because the annual probability was
derived from METAVIR scores and fibrosis scores where available,12 it is ultimately subject to some
uncertainty. The example below represents a possible risk sharing deal implemented at a
population level, as the probability of progressing to cirrhosis from no cirrhosis is independent of
the treatment selected and applies across the disease population for a given genotype. Note that
two-way risk sharing is presented here, whereby the NHS and the manufacturer are both assuming
some financial risk. Any reduction in variability is therefore observed across both sides of the ICER.
We also explore an additional risk sharing scenario designed around another key clinical
assumption from the appraisal of ledipasvir-sofosbuvir: SVR12,13 an efficacy indicator of treatment
success. Its high value relative to historical control rates (around 94% for the treatments analysed)
plays a critical role in establishing the cost-effectiveness and premium pricing of the drug, yet the
Appraisal Committee notes that those SVR12 rates were pre-sampled outside the PSA model rather
than sampled from a distribution. This uncertainty may therefore expose the ICER to greater
variability when specific circumstances are considered. Because an SVR12 rate varies across
treatments, this refers to a cohort-specific risk sharing. We rely on assumptions from Treatment 1
to discuss one-way risk sharing in Figure 10. Note that the interpretation of the various rules outlined
in Figures 9 and 10 are specific to the appraisal and treatment regimens being analysed.
Figure 9: Two-Way Risk Sharing at a Population Level: Transition Probability
Rule Outcome ICER and payment transfer
No risk sharing
Expected annual rate of
transition: p=0.009
Actual annual rate of
transition: p=0.016
Expected rate < Actual rate
The actual rate of transition from no
cirrhosis to cirrhosis is higher than the
rate found in the manufacturer
submission to NICE (expected). This
benefits the NHS as the hepatitis C
treatment, through halting disease
progression in most cases, becomes
more cost-effective relative to the no
treatment arm.
Expected ICER:
£16,009/QALY
Actual ICER:
£10,453/QALY
As no risk sharing is in place,
there are no payment transfers.
11 The choice of the discount rate for appraisals is found in the Green Book produced by the UK Treasury.
12 METAVIR scores provide a model to interpret liver biopsies while fibrosis scores measure the degree of scarring in the liver.
13 SVR12, or sustained virologic response, establishes whether hepatitis C virus is undetectable 12 weeks after treatment ended.
Population-wide and
cohort-specific risk
sharing can in theory
rely on estimates
calculated using claims
data.
Milliman White Paper
Actuarial approaches to modelling and mitigating financial uncertainty in recommending new drugs and health technologies 15
An illustrative case study of hepatitis C antiviral therapies recently approved by NICE
June 16, 2016
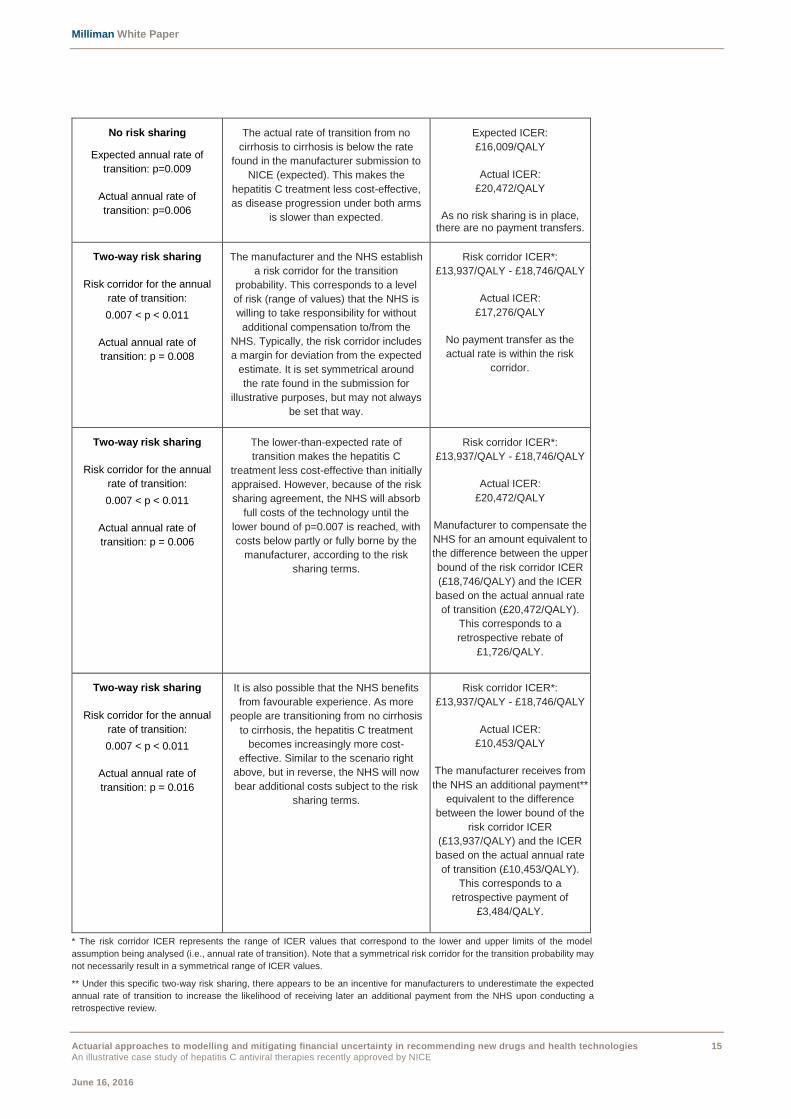
No risk sharing
Expected annual rate of
transition: p=0.009
Actual annual rate of
transition: p=0.006
The actual rate of transition from no
cirrhosis to cirrhosis is below the rate
found in the manufacturer submission to
NICE (expected). This makes the
hepatitis C treatment less cost-effective,
as disease progression under both arms
is slower than expected.
Expected ICER:
£16,009/QALY
Actual ICER:
£20,472/QALY
As no risk sharing is in place, there are no payment transfers.
Two-way risk sharing
Risk corridor for the annual
rate of transition:
0.007 < p < 0.011
Actual annual rate of
transition: p = 0.008
The manufacturer and the NHS establish
a risk corridor for the transition
probability. This corresponds to a level
of risk (range of values) that the NHS is
willing to take responsibility for without
additional compensation to/from the
NHS. Typically, the risk corridor includes
a margin for deviation from the expected
estimate. It is set symmetrical around
the rate found in the submission for
illustrative purposes, but may not always
be set that way.
Risk corridor ICER*:
£13,937/QALY - £18,746/QALY
Actual ICER:
£17,276/QALY
No payment transfer as the
actual rate is within the risk
corridor.
Two-way risk sharing
Risk corridor for the annual
rate of transition:
0.007 < p < 0.011
Actual annual rate of
transition: p = 0.006
The lower-than-expected rate of
transition makes the hepatitis C
treatment less cost-effective than initially
appraised. However, because of the risk
sharing agreement, the NHS will absorb
full costs of the technology until the
lower bound of p=0.007 is reached, with
costs below partly or fully borne by the
manufacturer, according to the risk
sharing terms.
Risk corridor ICER*:
£13,937/QALY - £18,746/QALY
Actual ICER:
£20,472/QALY
Manufacturer to compensate the
NHS for an amount equivalent to
the difference between the upper
bound of the risk corridor ICER
(£18,746/QALY) and the ICER
based on the actual annual rate
of transition (£20,472/QALY).
This corresponds to a
retrospective rebate of
£1,726/QALY.
Two-way risk sharing
Risk corridor for the annual
rate of transition:
0.007 < p < 0.011
Actual annual rate of
transition: p = 0.016
It is also possible that the NHS benefits
from favourable experience. As more
people are transitioning from no cirrhosis
to cirrhosis, the hepatitis C treatment
becomes increasingly more cost-
effective. Similar to the scenario right
above, but in reverse, the NHS will now
bear additional costs subject to the risk
sharing terms.
Risk corridor ICER*:
£13,937/QALY - £18,746/QALY
Actual ICER:
£10,453/QALY
The manufacturer receives from
the NHS an additional payment**
equivalent to the difference
between the lower bound of the
risk corridor ICER
(£13,937/QALY) and the ICER
based on the actual annual rate
of transition (£10,453/QALY).
This corresponds to a
retrospective payment of
£3,484/QALY.
* The risk corridor ICER represents the range of ICER values that correspond to the lower and upper limits of the model
assumption being analysed (i.e., annual rate of transition). Note that a symmetrical risk corridor for the transition probability may
not necessarily result in a symmetrical range of ICER values.
** Under this specific two-way risk sharing, there appears to be an incentive for manufacturers to underestimate the expected
annual rate of transition to increase the likelihood of receiving later an additional payment from the NHS upon conducting a
retrospective review.
Milliman White Paper
Actuarial approaches to modelling and mitigating financial uncertainty in recommending new drugs and health technologies 16
An illustrative case study of hepatitis C antiviral therapies recently approved by NICE
June 16, 2016
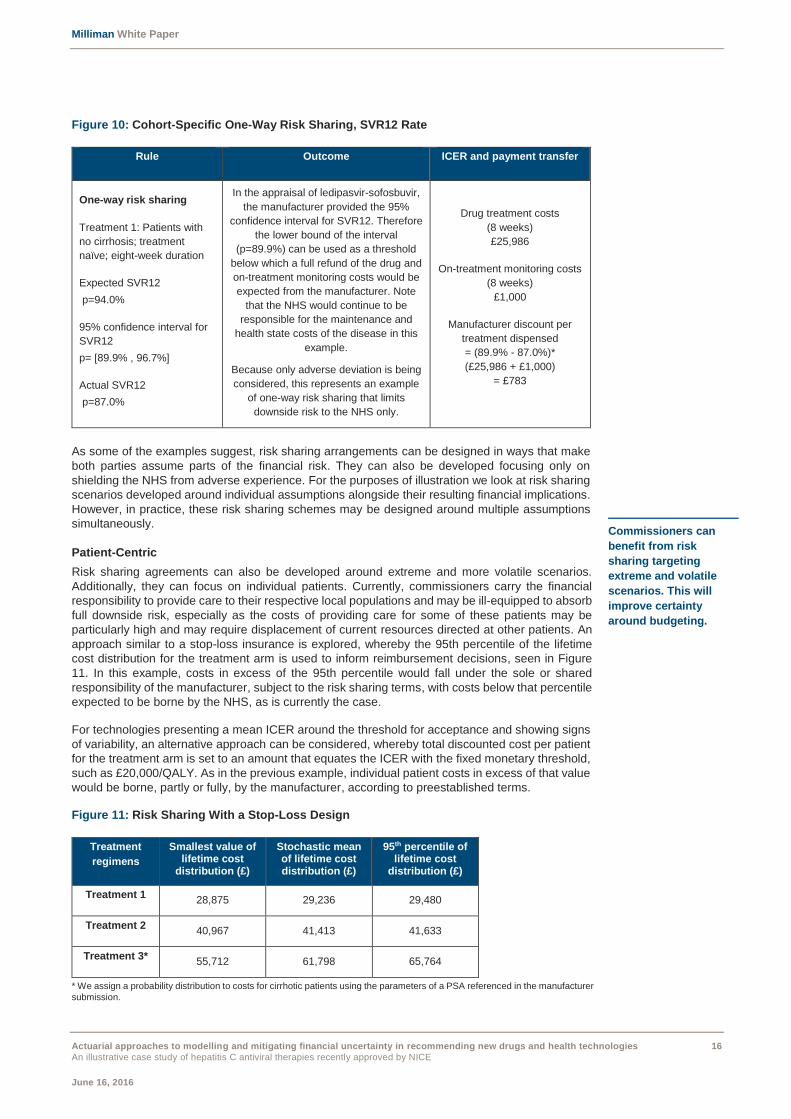
Figure 10: Cohort-Specific One-Way Risk Sharing, SVR12 Rate
Rule Outcome ICER and payment transfer
One-way risk sharing
Treatment 1: Patients with
no cirrhosis; treatment
naïve; eight-week duration
Expected SVR12
p=94.0%
95% confidence interval for
SVR12
p= [89.9% , 96.7%]
Actual SVR12
p=87.0%
In the appraisal of ledipasvir-sofosbuvir,
the manufacturer provided the 95%
confidence interval for SVR12. Therefore
the lower bound of the interval
(p=89.9%) can be used as a threshold
below which a full refund of the drug and
on-treatment monitoring costs would be
expected from the manufacturer. Note
that the NHS would continue to be
responsible for the maintenance and
health state costs of the disease in this
example.
Because only adverse deviation is being
considered, this represents an example
of one-way risk sharing that limits
downside risk to the NHS only.
Drug treatment costs
(8 weeks)
£25,986
On-treatment monitoring costs
(8 weeks)
£1,000
Manufacturer discount per
treatment dispensed
= (89.9% - 87.0%)*
(£25,986 + £1,000)
= £783
As some of the examples suggest, risk sharing arrangements can be designed in ways that make
both parties assume parts of the financial risk. They can also be developed focusing only on
shielding the NHS from adverse experience. For the purposes of illustration we look at risk sharing
scenarios developed around individual assumptions alongside their resulting financial implications.
However, in practice, these risk sharing schemes may be designed around multiple assumptions
simultaneously.
Patient-Centric
Risk sharing agreements can also be developed around extreme and more volatile scenarios.
Additionally, they can focus on individual patients. Currently, commissioners carry the financial
responsibility to provide care to their respective local populations and may be ill-equipped to absorb
full downside risk, especially as the costs of providing care for some of these patients may be
particularly high and may require displacement of current resources directed at other patients. An
approach similar to a stop-loss insurance is explored, whereby the 95th percentile of the lifetime
cost distribution for the treatment arm is used to inform reimbursement decisions, seen in Figure
11. In this example, costs in excess of the 95th percentile would fall under the sole or shared
responsibility of the manufacturer, subject to the risk sharing terms, with costs below that percentile
expected to be borne by the NHS, as is currently the case.
For technologies presenting a mean ICER around the threshold for acceptance and showing signs
of variability, an alternative approach can be considered, whereby total discounted cost per patient
for the treatment arm is set to an amount that equates the ICER with the fixed monetary threshold,
such as £20,000/QALY. As in the previous example, individual patient costs in excess of that value
would be borne, partly or fully, by the manufacturer, according to preestablished terms.
Figure 11: Risk Sharing With a Stop-Loss Design
Treatment
regimens
Smallest value of lifetime cost
distribution (£)
Stochastic mean of lifetime cost distribution (£)
95th percentile of lifetime cost
distribution (£)
Treatment 1 28,875 29,236 29,480
Treatment 2 40,967 41,413 41,633
Treatment 3* 55,712 61,798 65,764
* We assign a probability distribution to costs for cirrhotic patients using the parameters of a PSA referenced in the manufacturer
submission.
Commissioners can
benefit from risk
sharing targeting
extreme and volatile
scenarios. This will
improve certainty
around budgeting.
Milliman White Paper
Actuarial approaches to modelling and mitigating financial uncertainty in recommending new drugs and health technologies 17
An illustrative case study of hepatitis C antiviral therapies recently approved by NICE
June 16, 2016
As we note from Figure 11, Treatments 1 and 2 are showing limited variation in their respective
lifetime discounted costs, which could be partly explained by the effectiveness of the treatment in
halting progression to the cirrhosis stage. Treatment 3, however, is subject to greater variability, as
patients who achieve SVR12 continue to incur annual maintenance and health state costs after year
2, in contrast with Treatments 1 and 2. Therefore, such a method could be more appropriate for
treatment regimens with a larger range observed over the total cost distribution.
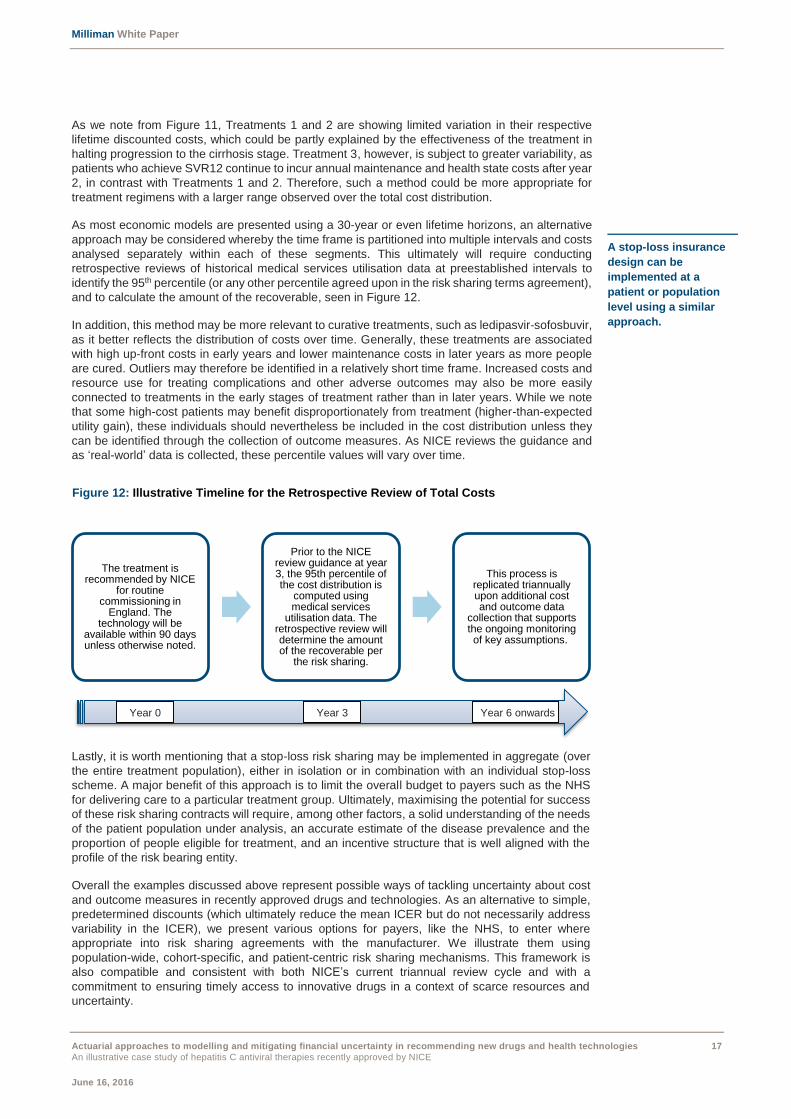
As most economic models are presented using a 30-year or even lifetime horizons, an alternative
approach may be considered whereby the time frame is partitioned into multiple intervals and costs
analysed separately within each of these segments. This ultimately will require conducting
retrospective reviews of historical medical services utilisation data at preestablished intervals to
identify the 95th percentile (or any other percentile agreed upon in the risk sharing terms agreement),
and to calculate the amount of the recoverable, seen in Figure 12.
In addition, this method may be more relevant to curative treatments, such as ledipasvir-sofosbuvir,
as it better reflects the distribution of costs over time. Generally, these treatments are associated
with high up-front costs in early years and lower maintenance costs in later years as more people
are cured. Outliers may therefore be identified in a relatively short time frame. Increased costs and
resource use for treating complications and other adverse outcomes may also be more easily
connected to treatments in the early stages of treatment rather than in later years. While we note
that some high-cost patients may benefit disproportionately from treatment (higher-than-expected
utility gain), these individuals should nevertheless be included in the cost distribution unless they
can be identified through the collection of outcome measures. As NICE reviews the guidance and
as ‘real-world’ data is collected, these percentile values will vary over time.
Lastly, it is worth mentioning that a stop-loss risk sharing may be implemented in aggregate (over
the entire treatment population), either in isolation or in combination with an individual stop-loss
scheme. A major benefit of this approach is to limit the overall budget to payers such as the NHS
for delivering care to a particular treatment group. Ultimately, maximising the potential for success
of these risk sharing contracts will require, among other factors, a solid understanding of the needs
of the patient population under analysis, an accurate estimate of the disease prevalence and the
proportion of people eligible for treatment, and an incentive structure that is well aligned with the
profile of the risk bearing entity.
Overall the examples discussed above represent possible ways of tackling uncertainty about cost
and outcome measures in recently approved drugs and technologies. As an alternative to simple,
predetermined discounts (which ultimately reduce the mean ICER but do not necessarily address
variability in the ICER), we present various options for payers, like the NHS, to enter where
appropriate into risk sharing agreements with the manufacturer. We illustrate them using
population-wide, cohort-specific, and patient-centric risk sharing mechanisms. This framework is
also compatible and consistent with both NICE’s current triannual review cycle and with a
commitment to ensuring timely access to innovative drugs in a context of scarce resources and
uncertainty.
The treatment is recommended by NICE
for routine commissioning in
England. The technology will be
available within 90 days unless otherwise noted.
Prior to the NICE review guidance at year 3, the 95th percentile of the cost distribution is
computed using medical services
utilisation data. The retrospective review will determine the amount of the recoverable per
the risk sharing.
This process is replicated triannually upon additional cost and outcome data
collection that supports the ongoing monitoring of key assumptions..
A stop-loss insurance
design can be
implemented at a
patient or population
level using a similar
approach.
Year 3 Year 0 Year 6 onwards
Figure 12: Illustrative Timeline for the Retrospective Review of Total Costs
Milliman White Paper
Actuarial approaches to modelling and mitigating financial uncertainty in recommending new drugs and health technologies 18
An illustrative case study of hepatitis C antiviral therapies recently approved by NICE
June 16, 2016
VI. CONCLUDING REMARKS AND NEXT STEPS
The recommendation in recent years of high-cost health technologies such as interferon-free
hepatitis C drug regimens heightens the importance to healthcare payers of addressing the
economic implications of recommending new treatments for routine commissioning. As some NICE
guidance involves diverting resources away from existing services, it is important to understand and
quantify the degree of uncertainty in each appraisal and design, where appropriate, mechanisms to
mitigate risk going forward. This is consistent with the view of delivering value-for-money care.
In this report we apply actuarial approaches to handling uncertainty to the health technology
appraisal process, using recent hepatitis C drug submissions to NICE as a basis to develop a proof
of concept. These new treatment regimens, undeniably characterised by increased adherence
levels that are due to a more favourable side effect profile, require however considerably more
economic resources, the level of which is relatively uncertain. Using the lens of health and social
care payers, we propose an actuarial cost model against which to monitor future resource use and
cost to better estimate the budget impact of new drugs and technologies. We also acknowledge that
this approach could be replicated for treatments currently commissioned within NHS England and
help commissioners and other relevant payers estimate their share of the cost.
In addition, we present a theoretical framework which aims to address some of the ongoing
challenges faced by NICE, particularly around the modelling and quantifying of uncertainty in
technology appraisals. The three approaches presented rely on stochastic modelling and the
attribution of probability distributions to sensitive model assumptions. While proposing the ongoing
monitoring of these assumptions over time, we also discuss how empirical data or ‘real-world’ data
can be used where applicable to model the effects of recommending a drug for routine
commissioning and inform the NICE review guidance process.
Finally, we explore some risk sharing arrangements which can limit downside risk to the NHS in
delivering new drugs and technologies to the population. Whether they are designed across the
whole disease population, specific to treatments, or at a patient level, they can assist commissioners
with budgeting, especially as more volatile and extreme scenarios are observed.
Quantifying uncertainty
around the ICER is
critical as new drugs
and technologies
eventually divert
resources away from
currently funded
treatments and health
services.

Milliman White Paper
Actuarial approaches to modelling and mitigating financial uncertainty in recommending new drugs and health technologies 19
An illustrative case study of hepatitis C antiviral therapies recently approved by NICE
June 16, 2016
CAVEATS AND LIMITATIONS
The findings reflect the research of the authors; Milliman does not intend to endorse any product or
organisation. Milliman does not intend to benefit or create a legal duty to any third party recipient of
its work. If this report is reproduced, it should be reproduced in its entirety as pieces taken out of
context can be misleading. As with any economic or actuarial analysis, it is not possible to capture
all factors that may be significant. Because we present illustrative data, the findings should be
interpreted carefully before they are applied to any particular situation.
In carrying out the modelling, we relied on data from publicly available sources and on actuarial
judgement. We have not audited or verified this data or other information. If the underlying data or
information is inaccurate or incomplete, the results of our analysis may likewise be inaccurate or
incomplete. The projections presented in this report are based on assumptions derived from
historical data and our actuarial judgement. If different assumptions were used, the projections
would be materially different. Actual experience will differ from our estimates, perhaps materially.

Milliman White Paper
Actuarial approaches to modelling and mitigating financial uncertainty in recommending new drugs and health technologies 20
An illustrative case study of hepatitis C antiviral therapies recently approved by NICE
June 16, 2016
APPENDIX A: DATA, METHODOLOGY AND ASSUMPTIONS
Using a recently approved hepatitis C drug as a case study, we develop a theoretical framework
from which we illustrate a potential handling of uncertainty and variability in the ICER. Rather than
critiquing the manufacturer model submitted to NICE, we replicate, within reasonability, a time-
dependent Markov model relying on the clinical and cost evidence of the drug produced as part of
the submission process. This was done using publicly available information and therefore does not
include any confidential price arrangements agreed between NHS England and the manufacturer.
In addition, the submission to NICE includes a weighted average base case analysis whereby the
cost-effectiveness of the drug is assessed jointly for both non-cirrhotic patients and patients with
cirrhosis, and across several treatment durations. In this report, we adopt the view of analysing the
two hepatitis C virus (HCV) population groups separately in order to remove some of the uncertainty
in estimating, for instance, the proportion of cirrhotic patients in the HCV population, or even the
allocation of patients between the different treatment durations, a view also shared by NICE. Last,
we rely on the assessment of the Appraisal Committee for further insights.
The treatment arm consists of ledipasvir-sofosbuvir; the control arm does not have any treatment
assigned. For simplicity we focus exclusively on a treatment HCV population with genotype 1, the
most common genotype in England, for the following treatment regimens (all approved by NICE):
Treatment 1: Patients without cirrhosis; treatment naïve; eight-week treatment.
Treatment 2: Patients without cirrhosis; treatment experienced; 12-week treatment.
Treatment 3: Patients with cirrhosis; treatment naïve; 12-week treatment.
The basis of this report consists of presenting actuarial techniques in a context of health technology
appraisals. We define the incremental cost-effectiveness ratio in the most traditional way,
represented by the formula below:
controlOutcometreatmentOutcome
controlCosttreatmentCost
(QALY)OutcomeΔ
(£)CostΔICER
KEY PARAMETER ASSUMPTIONS
We recognise that uncertainty can take many forms and that each requires relying on different
techniques. For instance, uncertainty around the choice of data sources typically arises when
alternative sets of plausible data on costs and outcomes are available and for which the variability
is significant. Sensitivity analysis of key assumptions is usually performed and their effects on the
ICER are usually monitored. However, in this report we focus more specifically on parameter
uncertainty, which is usually best handled through PSA. It has the advantage of showing the
probability that a technology is cost-effective at various thresholds, as it assigns a probability
distribution to key assumptions. It also provides the most accurate mean and other statistics
estimates, and ultimately allows uncertainty associated with key model parameters to be reflected
in the results. Under this method, a high probability of a technology being cost-effective should lead
to a higher probability of acceptance of the technology.
Per the company submission, the transition probability from non-cirrhotic to compensated cirrhosis
is age-specific, with estimates provided for ages 30, 40, and 50. Rather than simply conducting
sensitivity analysis on this probability using point estimates provided by the manufacturer, we use
a normal distribution to model this key assumption, as an illustration of the approach. Precisely we
assign the value of the lower and upper bounds for this probability to correspond to the 1st and 99th
percentile of the distribution, and run the simulation 1,000 times. We rely on the normal distribution
to reflect the symmetrical confidence interval provided in the submission but recognise nonetheless
that this could be replicated using other probability distributions, notably the beta distribution, which
is often used to model transition probability.
Similarly, under the different scenarios that we explore we observe that the ICER is very sensitive
to changes in the discount rate. As the rate increases the ICER progressively moves upwards and
becomes less cost-effective. This is expected, given that the benefits associated with treatment are
accrued over the long run.

Milliman White Paper
Actuarial approaches to modelling and mitigating financial uncertainty in recommending new drugs and health technologies 21
An illustrative case study of hepatitis C antiviral therapies recently approved by NICE
June 16, 2016
In line with the NICE guidance on technology appraisals, a discount rate of 3.5% is applied to both
costs and outcomes in the base case analysis, as this is the rate used by convention in economic
evaluations in England. However, to reflect uncertainty in the model, Figure 13 breaks out the
discount rate into three parts, using the methodology described by the UK Treasury in determining
this rate.14
Figure 13: Breakdown of the NICE Discount Rate
Components of NICE
discount rate
Description Percentage
Growth per capita Average growth rate per capita in the UK from 1950 to
1998.
2%
Catastrophe risk Likelihood that there will be some catastrophic event that
will radically eliminate all returns from policies or
programmes.
Examples include technological improvements, natural
disasters, and other major threats such as wars.
1%
Pure time preference Individuals’ preference for consumption now rather than
later.
0.5%
Total Discount rate used by NICE for costs and benefits. 3.5%
Acknowledging that the 1% and 0.5% loads represent catastrophe risk and pure time preference
respectively, we focus on the remaining 2% and model it using the normal distribution for the
purposes of illustration. We compute the standard deviation of the growth per capita in the UK from
1960 to 2010 using public data, validate that the mean growth rate over this period is around 2%,
and use both values in the simulation. The simulated discount rate therefore includes a simulated
value for the growth per capita in the UK and a fixed 1.5% load.
Last, we note that most of the health state costs referenced in the NICE technology appraisal of
ledipasvir-sofosbuvir (along with other previous appraisals related to hepatitis C) are featured in
2002-2003 and 2006-2007 studies, from which the Hospital and Community Price and Pay Index is
applied to standardise costs to current levels. Although we recognise the principles underlying this
approach and its widespread use in the face of imperfect information, it nevertheless represents an
important source of uncertainty, as it implicitly assumes that health state costs steadily increase
over time and that no changes in utilisation patterns, mix of resource usage, or schedule of care
has occurred. As these costs refer to annual maintenance costs for patients in each of the disease
stages, more recent, ‘real-world’ NHS data is available and could be used to derive empirical
estimates as presented in the main body of the text. Because of limitations on accessing these
inputs, we rely on the gamma distribution to model the initial, pre-inflated costs for non-cirrhotic
patients using the parameters from a PSA referenced in the manufacturer submission.15 We also
apply to the simulated costs the same inflation factor as the one found in the submission.
The high level of uncertainty of the cost parameters is recognised in the sensitivity analysis
conducted by the drug manufacturer, as total lifetime costs for non-cirrhotic patients are varied by
a seemingly arbitrary value of 25% above and below. Though we acknowledge that this represents
one potential way to look at variability in the ICER, we believe this is not informed by a robust data-
driven process but rather represents an attempt to define a crude, but ultimately arbitrary confidence
interval.
14 HM Treasury (2003). The Green Book: Appraisal and Evaluation in Central Government. Retrieved March 30, 2016, from https://www.gov.uk/government/uploads/system/uploads/attachment_data/file/220541/green_book_complete.pdf.
15 Shepherd, J., Jones, J., Hartwell, D., Davidson, P., Price, A., & Waugh, N. (March 2007). Interferon alpha (pegylated and non-pegylated) and ribavirin for the treatment of mild chronic hepatitis C: A systematic review and economic evaluation. Health Technol Assess; 11(11):1-205, iii.
ABOUT MILLIMAN
Milliman is among the world's largest providers of actuarial and related products and services. The firm has consulting practices in healthcare, property & casualty insurance, life insurance and financial services, and employee benefits. Founded in 1947, Milliman is an independent firm with offices in major cities around the globe. For further information, visit milliman.com
CONTACT
If you have any questions or comments on this paper, please contact:
Joanne Buckle
+44 20 7847 1630
Didier Serre
+44 20 7847 1507