die another day: housing shows british paradox - · pdf filedie another day: housing shows...
TRANSCRIPT
Berenberg Macro Views Economics
1 1
Die another day: housing shows British paradox
Pumping up house prices seems to be Chancellor Osborne’s less-than-secret mission. The BoE is helping. The good news is house prices are responding; monetary policy still has traction.
Gradual ascent: We expect the stimulus measures to lead prices to rise 15% in the two years to end-2014. The risks to our forecast are on the downside, because banks remain cautious about extending credit.
New incentives
o Help to buy, equity loan: available from April 2013. The government provides a five-year interest-free loan up to 20% of the property value. This is for new-build purchases only.
o Help to buy, mortgage guarantee: available from January 2014. Lenders can buy a guarantee from the government on part of the mortgage.
o Funding for lending scheme (FLS): The BoE has extended its cheap funding scheme to non-bank lenders (eg lenders to landlords) and massively ramped up the incentives to lend to SMEs (landlords can be an SME).
Help-to-buy may have only a modest impact: The equity loan part will fund about 6% of the flow of lending over the three years of the scheme. Lenders will pay a “commercial fee” for the guarantee. That is sensible, of course, but it will limit the scheme’s impact.
Funding for Lending important: mortgage rates have tumbled since the scheme was introduced last year and indicators of house prices have turned up sharply.
Consumption boost: Rising house prices help consumer confidence and make borrowing easier. Cheaper mortgages help households’ cash flow. But it is only new mortgages that are getting cheaper. Many homeowners pay the Standard Variable Rate, which has barely changed. That will limit the stimulus.
At what cost? Prices are now only 15% below their peak, so these schemes could take prices back to that peak. Supply constraints justify high prices. But boosting prices further now risks a painful future crash or interest rates being kept too low for too long.
Die another day: The housing market is centre stage in Britain’s policy paradox. Loose policy is needed to help growth now. But policy can only delay the inevitable adjustments of saving, spending and, yes, even house prices. With any luck, exports will soften the future blow in a way they cannot today.
Better solutions available: A macro-stimulus would be better delivered through more housebuilding. That would also tackle the housing shortage. Fixing the banks and helping housebuilders would be better done directly, rather than indirectly via higher house prices or subsidised funding.
Key Macro Reports
Euro-Plus Monitor 2012: Rocky road to balanced growth 29 November 2012
Tough love: the true nature of the euro crisis 20 August 2012
Groundhog day: the tough fiscal choices ahead for the UK 10 October 2012
Tomorrow never dies: do not underestimate UK productivity growth 21 December 2012 Carney puts the flexible into flexible inflation targeting 8 February 2013 UK Budget 2013: waiting for the Cavalry 21 March 2013 Diamonds are forever: windfalls and benefits are not 16 April 2013 To receive these and other reports, please contact your Berenberg sales representative
15 May 2013
Rob Wood Chief UK Economist +44 20 3207 7822 [email protected]

Berenberg Macro Views Economics
2
Pump it up
UK Chancellor of the Exchequer George Osborne seems to want to pump up house prices. It is a policy that seems likely to work. We expect prices to rise 15% over the two years to end-2014. The good news is that the price of credit matters: monetary policy still has traction.
Osborne has announced two schemes. The first, available now, provides buyers of new houses with a five-year interest-free loan for 20% of the property value. In the second, available from January next year, the government guarantees part of the mortgage.
The schemes will have an impact, but it is likely to be smaller than first impressions would suggest. The first part of the scheme will have a big impact on housebuilders, but it will fund only about 6% of the total annual flow of lending for house purchase. Lenders will pay a commercial fee for the second part. Charging banks the commercial cost of extending a mortgage seems unlikely to lead to a big change in behaviour.
The Bank of England’s (BoE) provision of ultra-cheap funding to banks that increase their lending – the Funding for Lending Scheme – is probably much more important. Since the measure was introduced in July, mortgage rates have tumbled and the housing market has turned. Together, the government and BoE schemes are likely to materially boost house prices.
The risks to our house price forecast are probably on the downside. Banks remain cautious and under pressure from the other, financial stability, arm of the now octopus-like BoE. Banks are being told to reduce leverage and raise capital ratios. That could blunt the effect of these stimulus measures.
Boosting house prices now will help consumption by raising confidence and making borrowing easier. Lower mortgage rates will help households’ cash flow. That should help economic growth rise to trend – or possibly even above – by 2015. But it will come at a cost. Prices are now only 15% below their peak. Supply constraints can justify that. But pumping them up further runs the risk of either a future price crash or interest rates being kept too low for too long to save some households from their own folly.
House prices thus reach the heart of Britain’s current policy paradox. Loose monetary policy works by boosting asset prices and encouraging households and firms to spend now and save later. That boost can prevent depression. But it can only delay the inevitable adjustments of saving, spending and house prices. To keep the economy alive today, policy has to do the opposite of what is needed to keep it alive tomorrow.
The positive way this plays out is that UK adjustment is less painful in the future. Eurozone austerity is due to ease off next year and the US will be through the fiscal cliff. With a stronger world, UK adjustment could be less difficult in the future. It is a risky strategy though.
There are better solutions available to Britain. A significant relaxation of planning restrictions to boost house building is one. Fixing the banks would be better done directly rather than indirectly by subsidising their lending.
Chancellor Osborne seems to want to pump up house prices
Two government schemes to subsidise lending
Their impact is likely to be smaller than first impressions would suggest
But the Funding for Lending Scheme is important
Risks to our house price forecast are on the downside
Boosting house prices will help consumption, at the risk of a future price crash
To keep the economy alive today, policy has to do the opposite of what is needed in the long term
This could play out positively, but it is a risky strategy
There are better solutions available

Berenberg Macro Views Economics
3
Not far from their peak
House prices may be a substantial margin below their peak or just a little, depending on which index is used (Chart 1). Our view, shared by the BoE, is that the average of the Halifax and Nationwide indices is the best measure, meaning prices are 14% below their peak.
Why the average of the Halifax and Nationwide?
House price indices weight prices. They do that because just reporting a simple average of house prices could be extremely misleading: if detached houses represented more sales one month, the price would appear to go up. One of the biggest differences in the indices is the weights they use.
The Department for Communities and Local Government (DCLG) index, the official National Statistic index, tracks the value of the total housing stock. That means it will go up more if a £1m house rises in value by 10% than if a £100k house does. This means that the DCLG index has followed price developments in the most expensive regions (ie London and the South East) the closest (compare Charts 1 and 2).
In contrast, the Nationwide and Halifax give houses equal weight, regardless of their price. In other words, the Halifax and Nationwide indices track the price of a typical house, rather than the value of the housing stock. The typical house the indices track depends on the precise weights they use. The Nationwide weights mean it has moved closely with “mid-priced regions” while the Halifax is a little closer to the cheaper regions (Chart 2).1
The bottom line is that the typical British home-owner has seen prices fall about 15% from their peak: the average of the Nationwide and Halifax indices. A Londoner will be doing better. On the Nationwide index, the typical homeowner there has seen prices rise by 1% since the crisis (Chart 3). Prices in the North West have performed the worst, if we ignore Northern Ireland. Prices in the latter are down 52%, but we need to exercise care because the sample size of transacted properties in Northern Ireland is small.
Average of the Halifax and Nationwide indices is the best measure of house prices
House prices are now about 15% below their peak, with big regional differences
Chart 1: House prices not far off peak Chart 2: Expensive regions have done better
Index, Jan 2008 = 100. DCLG observations shifted back six months Source: Halifax, Nationwide, DCLG
Index, Q12008 = 100. Regions split into terciles by price in Q1 2013. Source: Nationwide
1 Thwaites, G and Wood, R (2003), The Measurement of House Prices, Bank of England Quarterly Bulletin, Spring.
70
75
80
85
90
95
100
105
110
2004 2006 2008 2010 2012
Halifax
Nationwide
DCLG-5%
-11%
-18%
70
75
80
85
90
95
100
105
110
2006 2008 2010 2012
Expensive regions
Cheapest
Inbetween
-5%
-13%
-31%

Berenberg Macro Views Economics
4
Chart 3: London doing the best Chart 4: No UK construction boom
Price change: 2007-13 total change; 1995-2013, average annual change. Source: Nationwide.
Construction as % of GDP, nominal. Source: OECD
Supply constraints
A lack of building before and since the crisis has supported prices in the UK. Tight planning controls meant that construction activity did not rise much in the UK before the crisis, particularly compared to the reckless Spanish example (Chart 4). That is why real house prices, and house prices relative to earnings, remain well above their pre-boom trends (Chart 5).
Geoffrey Meen (2006),2 an authority on house prices, argues that the rise in house prices was not a bubble. Former BoE Economist Stephen Nickell told the House of Lords in 2008 that, if housebuilding continued at pre-crisis rates, the house price to income ratio would rise by 50% over the 20 years from 2008.3 Building new houses is particularly difficult in London, which is one reason why it saw the strongest price rises both before and after the crisis (Chart 3).
Low rates of housebuilding explain very high prices in the UK
Chart 5: Restrict supply pushed up prices
Real house prices are deflated by the RPI. Source: Nationwide, ONS, Berenberg calculations
2 Mean, G, (2006), Ten New Propositions in UK Housing Macroeconomics, ICHUE Discussion Paper No. 2. 3 Evidence to House of Lords Economic Affairs Committee, The Economic Impact of Immigration.
-20% -10% 0% 10% 20%
London
South East
Outer Met
South West
East Anglia
East Midlands
Wales
Yorks
West Midlands
North West
North
Scotland
1995-2013
2007-2013 4
6
8
10
12
14
2001 2003 2005 2007 2009 2011
Spain
UK
0
20
40
60
80
100
120
1955 1963 1971 1979 1987 1995 2003 2011
Real house prices
House prices/earnings
Trend, pre-2000s
Average, pre-2000s
Berenberg Macro Views Economics
5
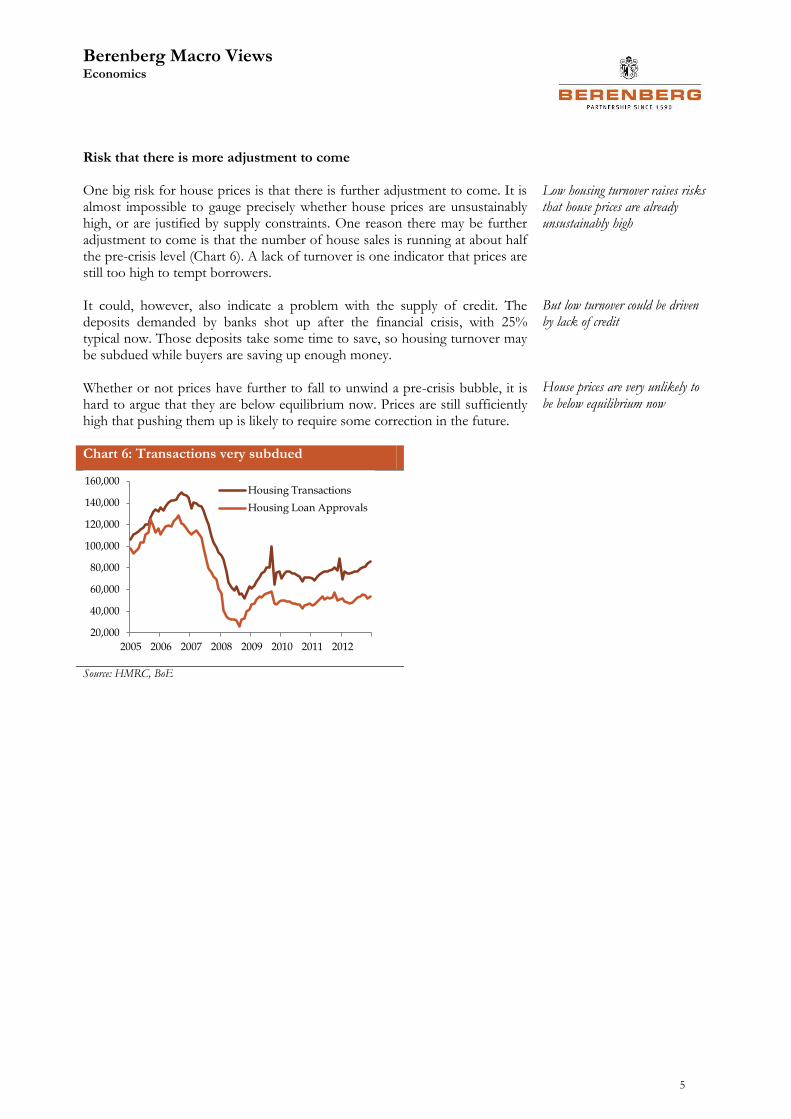
Risk that there is more adjustment to come One big risk for house prices is that there is further adjustment to come. It is almost impossible to gauge precisely whether house prices are unsustainably high, or are justified by supply constraints. One reason there may be further adjustment to come is that the number of house sales is running at about half the pre-crisis level (Chart 6). A lack of turnover is one indicator that prices are still too high to tempt borrowers. It could, however, also indicate a problem with the supply of credit. The deposits demanded by banks shot up after the financial crisis, with 25% typical now. Those deposits take some time to save, so housing turnover may be subdued while buyers are saving up enough money. Whether or not prices have further to fall to unwind a pre-crisis bubble, it is hard to argue that they are below equilibrium now. Prices are still sufficiently high that pushing them up is likely to require some correction in the future.
Low housing turnover raises risks that house prices are already unsustainably high
But low turnover could be driven by lack of credit
House prices are very unlikely to be below equilibrium now
Chart 6: Transactions very subdued
Source: HMRC, BoE
20,000
40,000
60,000
80,000
100,000
120,000
140,000
160,000
2005 2006 2007 2008 2009 2010 2011 2012
Housing Transactions
Housing Loan Approvals
Berenberg Macro Views Economics
6
New government incentives give boost
The message from the Chancellor’s March budget is pretty clear: get the housing market moving again. Growth has disappointed and austerity will continue much longer than originally planned, to at least FY 2017/18. With an election coming in May 2015, the government needs some good news to improve its chances. As well as creating a feel-good factor for many voters, rising house prices could boost growth a little.
The Chancellor announced a two-part scheme to boost the market. Part I, “Help to Buy: Equity Loan”, has been available since the start of April. It helps buyers put down a decent deposit. The government is offering a five-year interest-free loan of up to 20% of the value of the property to anyone buying a newly built house. The government has allocated £3.5bn over three years to the scheme, meaning it can fund £17.5bn of loans.
Part II, “Help to Buy: Mortgage Guarantee”, will be available from January 2014. The precise details are still being worked out. But the general offer is pretty clear. The government will guarantee part of a borrower’s mortgage. The borrower has to stump up at least 5% of the house price as a deposit, and the government will guarantee slightly less than another 15%, taking first loss after the buyer. The government will charge a “commercial fee” for that.
A boost, but how significant?
At first blush, those two schemes sound like they would really boost house prices. But the impact could be less significant. Splitting the funding evenly across the three years the equity loan scheme runs for, each year it could help fund mortgages worth 6% of the 2012 flow of lending for house purchase (lending was £91bn in 2012). Put another way, the government calculates it will support 25k sales a year, 3% of the total number of house sales in 2012. It will make a big difference to the new-build sector and for some buyers. But from a macro perspective, the impact will be small
The mortgage guarantee scheme is potentially more significant. The government has indicated it plans to make £12bn available, which it estimates will support £130bn of high loan-to-value mortgages. The government has not indicated how long the scheme will run for, but if it ran for three years as well and all the funding was taken up, it could each year help fund mortgages worth 15% of the flow of lending in 2012.
Here is the rub. Lenders will be charged a commercial fee for the mortgage guarantee scheme. That fee will compensate the government for “expected losses under the scheme; the cost of capital of providing the guarantee; and the administrative costs of the scheme”. Banks can already lend to households and charge them a commercial fee, so it is not obvious why the scheme would provide a huge boost to lending.
If the commercial fee is not quite commercial, ie the scheme ends up being a subsidy for banks, it could change behaviour. Otherwise, well-capitalised banks will not gain anything from the guarantee. The state-owned lenders might. But a much better plan would have been to simply inject more capital into banks and force write-downs of bad loans.
Get the housing market moving was the Budget’s message
The schemes announced in the budget are probably more show than substance
Mortgage guarantee potential most significant, but banks charged a “commercial fee”
Better options for helping the UK

Berenberg Macro Views Economics
7
Funding for Lending important
The BoE’s Funding for Lending scheme (FLS) is probably the most significant factor boosting prices. The BoE’s scheme offers banks four-year funding at 25bp above the BoE base rate. Banks deliver collateral to the BoE and receive Treasury bills in return. They can then use those to raise funding. Banks could get funding worth 5% of their loan stock as of last June plus any change in their net lending over the period the scheme operates for.
An update to the scheme last month added a supercharger. If banks lend £1 to a small business between now and the end of the year, they will be eligible for another £10 of funding from the BoE. If they lend in 2014, they can get £5 of extra funding. Lending to other sectors continues to attract the same terms as originally.
Specialist lenders, such as the buy-to-let lender Paragon, can now access the generous scheme as well. Importantly, landlords can be classed as a small business. So the supercharged scheme opens the door to more BTL lending.
FLS has had a big impact already
Since the FLS was introduced last July, new mortgage rates have fallen sharply (Chart 7). The average 75% LTV 2-year fixed rate mortgage is down 90bp. For 90% LTVs, the rate has fallen 115bp. A large chunk of that improvement in mortgage rates is due to the Euro-crisis easing, but bank funding costs have fallen more in the UK than the Eurozone, suggesting a role for the FLS.
According to the Council of Mortgage Lenders, BTL lending has been rising rapidly in recent quarters. In Q1 2013, 20% of new mortgage advances were for BTL. BTL lending has risen from 12.9% of the stock of mortgages in Q1 2012 to 13.4% now.
The fall in mortgage rates has been reflected in a sharp improvement in survey indicators (Chart 8). The good news then is that lowering the cost of credit boosts demand for it: the UK is not in a deleveraging liquidity trap.
BoE’s Funding for Lending Scheme is having a significant impact
Mortgage rates have fallen since the FLS was introduced
Lending to landlords has risen sharply
Survey indicators of house prices have risen sharply
Chart 7: Mortgage rates falling fast Chart 8: Indicators rose immediately
Source: HMRC, BoE Source: RICS
0
2
4
6
8
10
1995 1997 1999 2001 2003 2005 2007 2009 2011 2013
2 year fxd, 75% LTV
5 year fxd, 75% LTV
2 year fxd, 90% LTV
SVR-40
-30
-20
-10
0
10
20
30
Jan-11 Jul-11 Jan-12 Jul-12 Jan-13
New buyer enquiries
RICS price expectations
RICS price change
FLS introduced

Berenberg Macro Views Economics
8
House prices responding
We expect house prices to rise 15% over the next two years. For 2013 we can base that forecast on leading indicators. A range of survey questions signal price inflation rising to 2% qoq in the next three months (Chart 9). Those with a longer lead time on price changes point to that momentum continuing for the rest of the year. Growth in loans for house purchase gives a six-month lead on house price inflation, for instance (Chart 10). Loan approval growth has slowed recently because of weather disruptions. Looking through that, approvals point to continued strong price inflation. The forecast beyond this year is necessarily more speculative. The question is whether 2% qoq rises this year will exhaust the stimulus. Some back-of-the-envelope calculations can help. Meen (2006) estimates: a 1pp fall in real mortgage rates would raise house prices by 4% in the long run; a rise in expected house price inflation would have the same effect as interest rate cuts; a reduction in mortgage rationing, as high LTV mortgages are increasingly available, could also add to prices. So there is scope for further rises beyond 2013. These estimates suggest a 10-20% rise over two years is not implausible. The risks to our forecast are probably to the downside, because banks are under pressure from the BoE to raise more capital and lower leverage. So they may not have the appetite to fund the rise in prices. For London, safe haven flows into property could reverse as the Eurozone stabilises. Demand boost The Chancellor’s ambitions may well be heavily political. Rising house prices could create a feel-good factor among core voters just in time for the next election. There will probably be a boost to GDP growth as well. We expect the rise in house prices, and the stimulus measures causing it, to add 0.5% to consumption over the next two years. Why? House price inflation has been closely associated with consumption growth in the UK (Chart 11). Rising house prices probably boost consumer confidence, lead people to feel wealthier and thereby increase their spending.
We expect house prices to rise 15% over the two years to end-2014
Forecast beyond this year is more speculative
Risks to our forecast are probably to the downside
House price rises should boost GDP growth
Chart 9: Leading indicators rising Chart 10: Momentum to continue in H2 2013
Principal component of RICS prices, expectations, buyer enquiries, sales to stocks ratio, sales expectations, new instructions, Rightmove and Hometrack indices. Source: RICS, Rightmove, Hometrack, Halifax, Nationwide
Loan approvals for house purchase, right hand axis. Source: BoE, Halifax, Nationwide
-8
-6
-4
-2
0
2
4
6
8
10
2002 2004 2006 2008 2010 2012
Principal component indicator, 3 month lead
Halifax, Nationwide average 3m on 3m %
-50-40-30-20-1001020304050
-8
-6
-4
-2
0
2
4
6
8
10
2002 2004 2006 2008 2010 2012Halifax, Nationwide average, qoq%Loan approvals, qoq%, 6 month lead
Berenberg Macro Views Economics
9
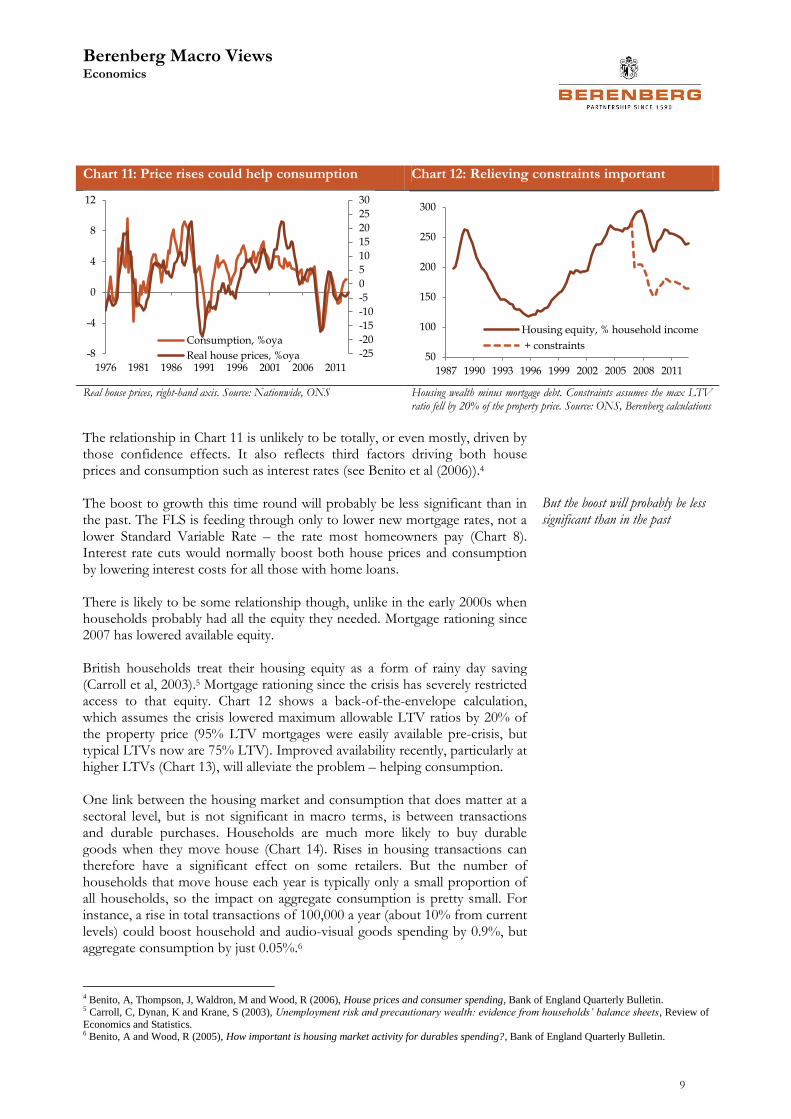
Chart 11: Price rises could help consumption Chart 12: Relieving constraints important
Real house prices, right-hand axis. Source: Nationwide, ONS Housing wealth minus mortgage debt. Constraints assumes the max LTV ratio fell by 20% of the property price. Source: ONS, Berenberg calculations
The relationship in Chart 11 is unlikely to be totally, or even mostly, driven by those confidence effects. It also reflects third factors driving both house prices and consumption such as interest rates (see Benito et al (2006)).4 The boost to growth this time round will probably be less significant than in the past. The FLS is feeding through only to lower new mortgage rates, not a lower Standard Variable Rate – the rate most homeowners pay (Chart 8). Interest rate cuts would normally boost both house prices and consumption by lowering interest costs for all those with home loans. There is likely to be some relationship though, unlike in the early 2000s when households probably had all the equity they needed. Mortgage rationing since 2007 has lowered available equity. British households treat their housing equity as a form of rainy day saving (Carroll et al, 2003).5 Mortgage rationing since the crisis has severely restricted access to that equity. Chart 12 shows a back-of-the-envelope calculation, which assumes the crisis lowered maximum allowable LTV ratios by 20% of the property price (95% LTV mortgages were easily available pre-crisis, but typical LTVs now are 75% LTV). Improved availability recently, particularly at higher LTVs (Chart 13), will alleviate the problem – helping consumption. One link between the housing market and consumption that does matter at a sectoral level, but is not significant in macro terms, is between transactions and durable purchases. Households are much more likely to buy durable goods when they move house (Chart 14). Rises in housing transactions can therefore have a significant effect on some retailers. But the number of households that move house each year is typically only a small proportion of all households, so the impact on aggregate consumption is pretty small. For instance, a rise in total transactions of 100,000 a year (about 10% from current levels) could boost household and audio-visual goods spending by 0.9%, but aggregate consumption by just 0.05%.6
But the boost will probably be less significant than in the past
4 Benito, A, Thompson, J, Waldron, M and Wood, R (2006), House prices and consumer spending, Bank of England Quarterly Bulletin. 5 Carroll, C, Dynan, K and Krane, S (2003), Unemployment risk and precautionary wealth: evidence from households’ balance sheets, Review of
Economics and Statistics. 6 Benito, A and Wood, R (2005), How important is housing market activity for durables spending?, Bank of England Quarterly Bulletin.
-25
-20
-15
-10
-5
0
5
10
15
20
25
30
-8
-4
0
4
8
12
1976 1981 1986 1991 1996 2001 2006 2011
Consumption, %oya
Real house prices, %oya 50
100
150
200
250
300
1987 1990 1993 1996 1999 2002 2005 2008 2011
Housing equity, % household income
+ constraints

Berenberg Macro Views Economics
10
Chart 13: Mortgage availability improving Chart 14: Consumption and moving house
Percentage balances. Source: BoE Source: British Household Panel Survey 1992-2002, results reported in Benito and Wood (2005).
Aim a little below standard consumption function The multipliers in a standard consumption model (see Diamonds are forever) imply the rise in house prices and the stimulus measures driving that would add 0.8% to consumption by end-2014. The lack of pass-through to SVR rates means we would expect the actual effect to be lower. As a result, we expect these stimulus schemes to add 0.5% to consumption. That is one reason why we expect consumption growth to improve markedly next year, averaging annualised growth of 1.8% compared to 0.4% in 2013 and 0.2% in 2012.
Boost from house prices is one reason consumption growth should improve next year
-15
-10
-5
0
5
10
15
20
25
30
35
2010Q1 2011Q1 2012Q1 2013Q1
Change in credit availability, past 3months, LTV < 75%
… LTV > 75%
0% 5% 10% 15% 20% 25%
Freezer
Washing machine
TV
Tumble Dryer
Dishwasher
% of other households that purchased
% of house movers that purchased

Berenberg Macro Views Economics
11
Storing up trouble
House prices are at the heart of Britain’s current policy paradox. The economy is struggling to grow. Households, firms and the government are all trying to save simultaneously, while the Eurozone is implementing austerity. So monetary stimulus is needed. But that stores up problems for the future.
Monetary policy works by raising asset prices and encouraging households to spend now and save later. So it will push up house prices. But any rise in asset prices and borrowing to fund that spending needs to be paid for tomorrow. Monetary policy can only delay the inevitable adjustments of saving, spending and house prices. The stimulus will keep the UK alive to die another day.
The positive way this plays out is that UK adjustment is less painful in the future because some of the weakness can be exported. Fiscal austerity and deleveraging are that much harder when everyone is trying to do it at the same time. Eurozone fiscal austerity is due to ease off after this year, and the US will be through the fiscal cliff (Chart 15). In the meantime, keeping the economy ticking along will have saved an even more damaging rise in long-term unemployment. The long-term unemployed find it difficult to get another job, so a shake-out can permanently reduce the capacity of the economy. With exports taking some of the slack, the UK may be able to manage decent growth through austerity - repeating the experience of the early 1990s (Chart 16).
The bad way this could play out is if the stimulus measures pump up a house price bubble too big to be gradually deflated in the future. One way that might happen is if interest rates remain too low for too long to save some households from excessive debt loads. Another sharp correction of house prices and households desire to deleverage would be damaging. On balance, we think the risks are manageable, because banks do not have the appetite to raise lending enough to fund a really damaging house price bubble.
Better solutions to the UK’s problems exist than pumping up house prices. A significant relaxation of planning restrictions, boosting house building, would be one. Fixing the banks would be better done directly through recapitalisation than subsidising their funding costs.
Monetary stimulus, which boosts house prices, stores up problems
Monetary policy works by raising asset prices
This can play out positively by delaying the necessary adjustments until a time when some of the pain can be exported
The bad way this could play out is if house prices rise too much
Better solutions to the UK’s problems exist
Chart 15: Austerity plans Chart 16: Paradox of thrift
Percentage balances. Source: BoE Net lending/borrowing. Source: ONS
-2.0
-1.5
-1.0
-0.5
0.0
0.5
2011 2012 2013 2014 2015 2016 2017
UK, % GDP, change
Euro-area, % GDP change
-12
-8
-4
0
4
8
12
1987 1990 1993 1996 1999 2002 2005 2008 2011
Households Government
External Firms

Berenberg Macro Views Economics
12
Contacts: Investment Banking
Equity Research E-mail: [email protected]; Internet www.berenberg.de
BANKS ECONOMICS MID-CAP GENERAL
Nick Anderson +44 (0) 20 3207 7838 Dr. Holger Schmieding +44 (0) 20 3207 7889 Gunnar Cohrs +44 (0) 20 3207 7894
James Chappell +44 (0) 20 3207 7844 Dr. Christian Schulz +44 (0) 20 3207 7878 Bjoern Lippe +44 (0) 20 3207 7845
Andrew Lowe +44 (0) 20 3465 2743 Robert Wood +44 (0) 20 3207 7822 Anna Patrice +44 (0) 20 3207 7863
Eoin Mullany +44 (0) 20 3207 7854 Alexandra Schlegel +44 (0) 20 3207 7896
Eleni Papoula +44 (0) 20 3465 2741 FOOD MANUFACTURING Stanislaus von Thurn und Taxis +44 (0) 20 3207 2631
Fintan Ryan +44 (0) 20 3465 2748
BEVERAGES Andrew Steele +44 (0) 20 3207 7926 REAL ESTATE
Philip Morrisey +44 (0) 20 3207 7892 James Targett +44 (0) 20 3207 7873 Kai Klose +44 (0) 20 3207 7888
Josh Puddle +44 (0) 20 3207 7881 Estelle Weingrod +44 (0) 20 3207 7931
GENERAL RETAIL & LUXURY GOODS
BUSINESS SERVICES Bassel Choughari +44 (0) 20 3465 2675 TECHNOLOGY
William Foggon +44 (0) 20 3207 7882 John Guy +44 (0) 20 3465 2674 Adnaan Ahmad +44 (0) 20 3207 7851
Simon Mezzanotte +44 (0) 20 3207 7917 Sebastian Grabert +44 (0) 20 3207 7834
Arash Roshan Zamir +44 (0) 20 3465 2636 HEALTHCARE Daud Khan +44 (0) 20 3465 2638
Konrad Zomer +44 (0) 20 3207 7920 Scott Bardo +44 (0) 20 3207 7869 Ali Khwaja +44 (0) 20 3207 7852
Alistair Campbell +44 (0) 20 3207 7876 Tammy Qiu +44 (0) 20 3465 2673
CAPITAL GOODS Charles Cooper +44 (0) 20 3465 2637
Frederik Bitter +44 (0) 20 3207 7916 Louise Hinds +44 (0) 20 3465 2747 TELECOMMUNICATIONS
Benjamin Glaeser +44 (0) 20 3207 7918 Adrian Howd +44 (0) 20 3207 7874 Wassil El Hebil +44 (0) 20 3207 7862
William Mackie +44 (0) 20 3207 7837 Tom Jones +44 (0) 20 3207 7877 Usman Ghazi +44 (0) 20 3207 7824
Margaret Paxton +44 (0) 20 3207 7934 Stuart Gordon +44 (0) 20 3207 7858
Alexander Virgo +44 (0) 20 3207 7856 HOUSEHOLD & PERSONAL CARE Laura Janssens +44 (0) 20 3465 2639
Felix Wienen +44 (0) 20 3207 7915 Jade Barkett +44 (0) 20 3207 7937 Paul Marsch +44 (0) 20 3207 7857
Seth Peterson +44 (0) 20 3207 7891 Barry Zeitoune +44 (0) 20 3207 7859
CHEMICALS
Asad Farid +44 (0) 20 3207 7932 INSURANCE TOBACCO
John Philipp Klein +44 (0) 20 3207 7930 Tom Carstairs +44 (0) 20 3207 7823 Erik Bloomquist +44 (0) 20 3207 7870
Jaideep Pandya +44 (0) 20 3207 7890 Peter Eliot +44 (0) 20 3207 7880 Kate Kalashnikova +44 (0) 20 3465 2665
Kai Mueller +44 (0) 20 3465 2681
CONSTRUCTION Matthew Preston +44 (0) 20 3207 7913 UTILITIES
Chris Moore +44 (0) 20 3465 2737 Sami Taipalus +44 (0) 20 3207 7866 Robert Chantry +44 (0) 20 3207 7861
Robert Muir +44 (0) 20 3207 7860 Andrew Fisher +44 (0) 20 3207 7937
Michael Watts +44 (0) 20 3207 7928 MEDIA Oliver Salvesen +44 (0) 20 3207 7818
Robert Berg +44 (0) 20 3465 2680 Lawson Steele +44 (0) 20 3207 7887
DIVERSIFIED FINANCIALS Emma Coulby +44 (0) 20 3207 7821
Pras Jeyanandhan +44 (0) 20 3207 7899 Laura Janssens +44 (0) 20 3465 2639
Sarah Simon +44 (0) 20 3207 7830
SalesSpecialist Sales Sales E-mail: [email protected]; Internet www.berenberg.de
BANKS LONDON BENELUX
Iro Papadopoulou +44 (0) 20 3207 7924 John von Berenberg-Consbruch +44 (0) 20 3207 7805 Miel Bakker (London) +44 (0) 20 3207 7808
Matt Chawner +44 (0) 20 3207 7847 Susette Mantzel (Hamburg) +49 (0) 40 350 60 694
CONSUMER Toby Flaux +44 (0) 20 3465 2745 Alexandra Wace (London) +44 (0) 20 3465 2670
Rupert Trotter +44 (0) 20 3207 7815 Sean Heath +44 (0) 20 3465 2742
Zubin Huber +44 (0) 20 3207 7885 SCANDINAVIA
INSURANCE David Hogg +44 (0) 20 3465 2628 Ronald Bernette (London) +44 (0) 20 3207 7828
Trevor Moss +44 (0) 20 3207 7893 Ben Hutton +44 (0) 20 3207 7804 Marco Weiss (Hamburg) +49 (0) 40 350 60 719
James Matthews +44 (0) 20 3207 7807
HEALTHCARE David Mortlock +44 (0) 20 3207 7850
Frazer Hall +44 (0) 20 3207 7875 Peter Nichols +44 (0) 20 3207 7810 Sales Trading
Richard Payman +44 (0) 20 3207 7825 HAMBURG
TECHNOLOGY George Smibert +44 (0) 20 3207 7911 Paul Dontenwill +49 (0) 40 350 60 563
Jean Beaubois +44 (0) 20 3207 7835 Paul Walker +44 (0) 20 3465 2632 Christian Endras +49 (0) 40 350 60 359
Zubin Hubner +44 (0) 20 3207 7885 Gregor Labahn +49 (0) 40 350 60 571
UTILITIES Chris McKeand +49 (0) 40 350 60 798
Benita Barretto +44 (0) 20 3207 7829 FRANKFURT Fin Schaffer +49 (0) 40 350 60 596
Michael Brauburger +49 (0) 69 91 30 90 741 Lars Schwartau +49 (0) 40 350 60 450
INDUSTRIALS Nina Buechs +49 (0) 69 91 30 90 735 Marvin Schweden +49 (0) 40 350 60 576
Chris Armstrong +44 (0) 20 3207 7809 André Grosskurth +49 (0) 69 91 30 90 734 Tim Storm +49 (0) 40 350 60 415
Kaj Alftan +44 (0) 20 3207 7879 Boris Koegel +49 (0) 69 91 30 90 740 Philipp Wiechmann +49 (0) 40 350 60 346
Joachim Kopp +49 (0) 69 91 30 90 742
CRM Joerg Wenzel +49 (0) 69 91 30 90 743 LONDON
LONDON Stewart Cook +44 (0) 20 3465 2752
Greg Swallow +44 (0) 20 3207 7833 PARIS Simon Messman +44 (0) 20 3465 2754
Laura Cooper +44 (0) 20 3207 7806 Christophe Choquart +33 (0) 1 5844 9508 Stephen O'Donohoe +44 (0) 20 3465 2753
Dalila Farigoule +33 (0) 1 5844 9510
CORPORATE ACCESS Clémence La Clavière-Peyraud +33 (0) 1 5844 9521 PARIS
LONDON Olivier Thibert +33 (0) 1 5844 9512 Sylvain Granjoux +33 (0) 1 5844 9509
Patricia Nehring +44 (0) 20 3207 7811
ZURICH
EVENTS Stephan Hofer +41 (0) 44 283 2029 Sovereign Wealth Funds
LONDON Carsten Kinder +41 (0) 44 283 2024 LONDON
Natalie Meech +44 (0) 20 3207 7831 Gianni Lavigna +41 (0) 44 283 2038 Max von Doetinchem +44 (0) 20 3207 7826
Charlotte Kilby +44 (0) 20 3207 7832 Benjamin Stillfried +41 (0) 44 283 2033
Charlotte Reeves +44 (0) 20 3465 2671
Hannah Whitehead +44 (0) 20 3207 7922
US Sales E-mail: [email protected]
BERENBERG CAPITAL MARKETS LLC
Member FINRA & SIPC Andrew Holder +1 (617) 292 8222 Kelleigh Faldi +1 (617) 292 8288
Colin Andrade +1 (617) 292 8230 Kieran O'Sullivan +1 (617) 292 8292
Cathal Carroll +1 (646) 445 7206 Emily Mouret +1 (646) 445 7204
Burr Clark +1 (617) 292 8282 Jonathan Saxon +1 (646) 445 7202
Julie Doherty +1 (617) 292 8228
Berenberg Macro Views Economics
13
Disclaimer This document was compiled by the above mentioned authors of the economics department of Joh. Berenberg, Gossler & Co. KG (hereinafter referred to as “the Bank”),. The Bank has made any effort to carefully research and process all information. The information has been obtained from sources which we believe to be reliable such as, for example, Thomson Reuters, Bloomberg and the relevant specialised press. However, we do not assume liability for the correctness and completeness of all information given. The provided information has not been checked by a third party, especially an independent auditing firm. We explicitly point to the stated date of preparation. The information given can become incorrect due to passage of time and/or as a result of legal, political, economic or other changes. We do not assume responsibility to indicate such changes and/or to publish an updated document. The forecasts contained in this document or other statements on rates of return, capital gains or other accession are the personal opinion of the author and we do not assume liability for the realisation of these. This document is only for information purposes. It does not constitute a financial analysis within the meaning of § 34b or § 31 Subs. 2 of the German Securities Trading Act (Wertpapierhandelsgesetz), no investment advice or recommendation to buy financial instruments. It does not replace consulting regarding legal, tax or financial matters. Remarks regarding foreign investors The preparation of this document is subject to regulation by German law. The distribution of this document in other jurisdictions may be restricted by law, and persons, into whose possession this document comes, should inform themselves about, and observe, any such restrictions. United Kingdom This document is meant exclusively for institutional investors and market professionals, but not for private customers. It is not for distribution to or the use of private investors or private customers.
United States of America This document has been prepared exclusively by Joh. Berenberg, Gossler & Co. KG. Although Berenberg Capital Markets LLC, an affiliate of the Bank and registered US broker-dealer, distributes this document to certain customers, Berenberg Capital Markets LLC does not provide input into its contents, nor does this document constitute research of Berenberg Capital Markets LLC. In addition, this document is meant exclusively for institutional investors and market professionals, but not for private customers. It is not for distribution to or the use of private investors or private customers. This document is classified as objective for the purposes of FINRA rules. Please contact Berenberg Capital Markets LLC (+1 617.292.8200), if you require additional information.
Copyright The Bank reserves all the rights in this document. No part of the document or its content may be rewritten, copied, photocopied or duplicated in any form by any means or redistributed without the Bank’s prior written consent. © May 2013 Joh. Berenberg, Gossler & Co. KG