dielectric response analysis of real insulation … response analysis of real insulation systems uno...
TRANSCRIPT

Dielectric Response Analysis of Real Insulation Systems
Uno Gäfvert
ABB AB, Corporate Research* SE-721 78 Västerås, Sweden
E-mail: [email protected]
* Also at Kungliga Tekniska Högskolan, Stockholm
Abstract: Real insulation systems are often heterogeneous and sometimes non-linear. In this paper we discuss the application of dielectric frequency response methods to a number of such practically important systems.
Important examples of composite insulation systems are the oil/cellulose insulation of power transformers and the glass-mica-epoxy system of machine insulation.
A few examples of non-linear effects and their implication for dielectric response analysis are discussed. These include narrow liquid ducts in transformer insulation, exhibiting a voltage dependent conductivity, polymer cables with water trees exhibiting non-linear behaviour that is the basis for diagnosis . The relation between partial discharges and dielectric response is elucidated and finally the special problems of measuring non-linear field grading material is discussed.
INTRODUCTION
Dielectric response stands for a family of methods used for characterisation of dielectric materials as well as practical insulation systems. Classical methods of measuring dielectric response include (power frequency) capacitance-Tan(?) and insulation resistance. More recently extensions such as measurements of dielectric frequency response, polarisation and de-polarisation currents and return voltage have found increasing popularity. Several authors have pointed out that all of these methods are “in principle” equivalent [1, 2, 3] and that may be true in the ideal case. In this paper the discussion is based on dielectric frequency response where capacitance and loss are measured as a function of frequency. In case of non-linear response, the harmonics in the response are important for the analysis.
The ideal sample for a dielectric response measurement consists of a single, linear, homogenous material in parallel plate capacitor geometry. “Real” systems are generally composite and often non-linear and may have a complex geometry. In this paper a number of such “real” situations, typical of practical insulation systems, are discussed. Important examples of heterogeneous insulation are the oil/cellulose insulation in power
transformers and the glass-mica-epoxy system of machine insulation.
Most real systems are, in fact, to some extent non-linear. The linear behaviour can only be considered as a low field limit. Examples of such non-linear dielectric systems are dielectric liquids in narrow ducts and insulation in cross-linked polyethylene (XLPE) cables with water trees.
Partial discharge and dielectric response measurements are two complementary methods for assessment of high voltage insulation. Important relations between the two methods are discussed in the final section of this paper.
COMPOSITE SYSTEMS
Many practical insulation materials are composites or combination of two or more materials. The structure of the insulation has fundamental influence on its dielectric response. For (more or less) random mixtures there are established formulas [4] and modelling schemes [5, 6] for calculation of the response. The general problem is to calculate the response of the composite from knowledge of the properties of its constituents.
Two examples from “the real world”, transformer and machine insulation, are used to illustrate the study of insulating systems consisting of several components. In spite of their complexity the overall behaviour can be reasonably well understood based on geometric considerations and knowledge of the dielectric properties of the constituent materials.
Moisture in power transformer insulation
An important application of dielectric response analysis is to assess the moisture content in the cellulose in transformer insulation [7, 8]. High moisture content accelerates ageing and lowers the breakdown strength of the insulation. In a power transformer the combination of materials is, of course, far from random. The oil cellulose insulation system of a power transformer is an example of an inhomogeneous insulation system where the structure has a major influence on the dielectric response.
The basic structure of this insulation is illustrated in Fig.

1. The barriers and spacers consist of oil impregnated cellulose material and the whole structure is immersed in oil.

Outer Winding
Inner Winding
Spacers
BarriersOuter Winding
Inner Winding
Spacers
Barriers
Fig. 1 Section of the insulation duct between transformer windings with cylindrical barriers and axial spacers.
For modelling purposes we can use the simplified “insulation module” (Fig. 2). The parameter X is the relative amount of solid insulation (barriers) in the radial direction and Y is the relative amount of spacers.
X
1-X
Y 1-Y
Oil
Barrier
Spacer
X
1-X
Y 1-Y
Oil
Barrier
Spacer
Fig. 2 XY-model: Insulation module used for calculating the response of transformer insulation.
With knowledge of the dielectric properties of the solid material (barriers and spacers) and that of the oil one can easily calculate the response of the transformer insulation. We refer to this simple model as the XY model(1).
barrieroilbarrierspacer
duct XXY
XXY
T
????
?????
???
?1
11
),( (1)
It is important to note that ?oil, ?spacer and ?barrier, are, in general, complex frequency dependent quantities. The influence of temperature and moisture must be known. The oil can, for low voltages, simply be characterised by its relative permittivity, ?´oil (typically 2,2) and its DC conductivity, ? (2).
0
)(??
????
????? oil
oiloil i (2)
The crude XY-model can be used for diagnostic purposes [7, 8]. To determine the moisture in the solid insulation the procedure is to calculate the response of XY-model (1), with materials data inserted from earlier measurements on pressboard for different moisture levels. In Fig. 3 the output of this fit ting procedure is presented. By inserting earlier measured material data into the model the moisture content was determined to 3 % moisture in the solid insulation and the oil conductivity to 6 pS/m.
10- 2
10- 1
100
101
102
103
10- 3 10-2 10-1 100 101 102 103
C' Meas.
C'' Meas
C' XY-mod
C'' XY-mod
C' FEM
C'' FEM
C' &
C''
[nF]
Frequency [Hz]
Fig. 3 Frequency dependent capacitance and loss modelled with the XY-model and frequency dependent FEM calculation compared with measured data.
The four capacitors in the XY-model do not provide a true representation of the electric field distribution. A finite element (FEM) calculation [9] can be used to get a more realistic field pattern. Instead of four elements the mesh now contains a few thousand elements. In Fig. 4 the field patterns calculated at 50 Hz and at 0,005 Hz are shown. The same dispersive materials properties (?oil, ?spacer and ?barrier) are used as in the XY-model. At 50 Hz the permittivities (the real parts) control the field distribution. The field in the barrier is therefore lower than in the oil. At 0,005 Hz the field is controlled by the conductivities and it is concentrated in the solid insulation.
a)
b)
Fig. 4 Distribution of equipotential lines in XY model at a) 50 Hz and at b) 0,005 Hz.
In most parts of the insulation the field is homogenous but in particular at 0,005 Hz, the field is significantly inhomogeneous at the corner of the spacer.
Fig. 3 also shows a comparison between the full frequency dependent FEM calculation, the calculation based on simple XY-model and the measured data.
The agreement is very good so, in this particular case, the simple XY-model is sufficient, but clearly the frequency dependent FEM calculations can be used as a tool for analysing the dielectric response of systems with more complex geometries.

Curing of machine insulation
Another practically important composite system is insulation of electrical machines. To achieve optimum quality, the curing process must be finely tuned. Too much or uneven curing may lead to a brittle insulation and poor adhesion to the conductors. Too little curing will result in high dielectric losses. Dielectric response can be used to study the curing process [10, 11].
Fig. 5 shows the layer structure of tape insulation in the machine stator.
Fig. 5 Cross section of a stator bar showing different layers of insulation. Picture provided by Alstom Power.
In a resin pre-impregnated (resin-rich) system [12] the main insulation consists of layers of tape consisting of a mixture of mica flakes and epoxy resin on a glass fibre carrier (Fig. 6).
Fig. 6 Cross section of one layer of the insulation tape with glass carrier at the top and the epoxy-mica mixture below [13] ? 2004 IEEE.
Fig. 7 shows a typical curing process cycle.
20
T [?C]
Time [s]
TMax
8080
10
1200 t=f(TMax)
(I)
(II) (III)
(IV)
Fig. 7 Temperature profile, T=T? (t), to cure samples of machine insulation to different degrees. [13] ? 2004 IEEE..
Fig. 8 shows the measured Tan(?) as a function of time and frequency during a process cycle. In the beginning (Phase I) the temperature is rapidly increased to 80 C°, the resin is melting and the losses increase rapidly. In Phase II the temperature is further increased but the onset of cross-linking eventually limits the motion of the molecules and also the losses.
Fig. 8 Variation of loss factor Tan(?) during curing of the epoxy-mica tape according to the temperature profile in Fig. 7,Tmax=135 ?C [13]. ? 2004 IEEE.
As the temperature is lowered (Phase III) the losses drop sharply but the characteristic dipolar peak moves from higher to lower frequencies. The dynamic situation during the real process is of course complex. To study the different stages, samples were pre-cured to a defined degree of curing (? ) and then measured under isothermal conditions. The degree of curing (? ) was determined by and based on analyses using differential scanning calorimetry (DSC) [14].
Fig. 9 shows the frequency responses of the resin-rich mica tape with different degrees of curing, i.e. between ? =0 (no curing) and ? =1 (fully cured).
10-3
10-2
10-1
100
101
10-2 10-1 100 101 102 103 104 105 106
? =0? =0.2? =0.4? =0.6? =0.8? =1
Tan
-Del
ta
Frequency [Hz]
T=20 °Cp=1 MPa
Fig. 9 Frequency dependence of loss factor tan(?) at T=20 ?C when the epoxy-mica tape has been cured to different degrees, ? [13]. ? 2004 IEEE.
The ? =0 curve displays a broad dipolar peak around 100 Hz and in the low frequency end, a behaviour that can be interpreted as DC conduction. As the curing progresses, the peak rapidly shifts towards lower
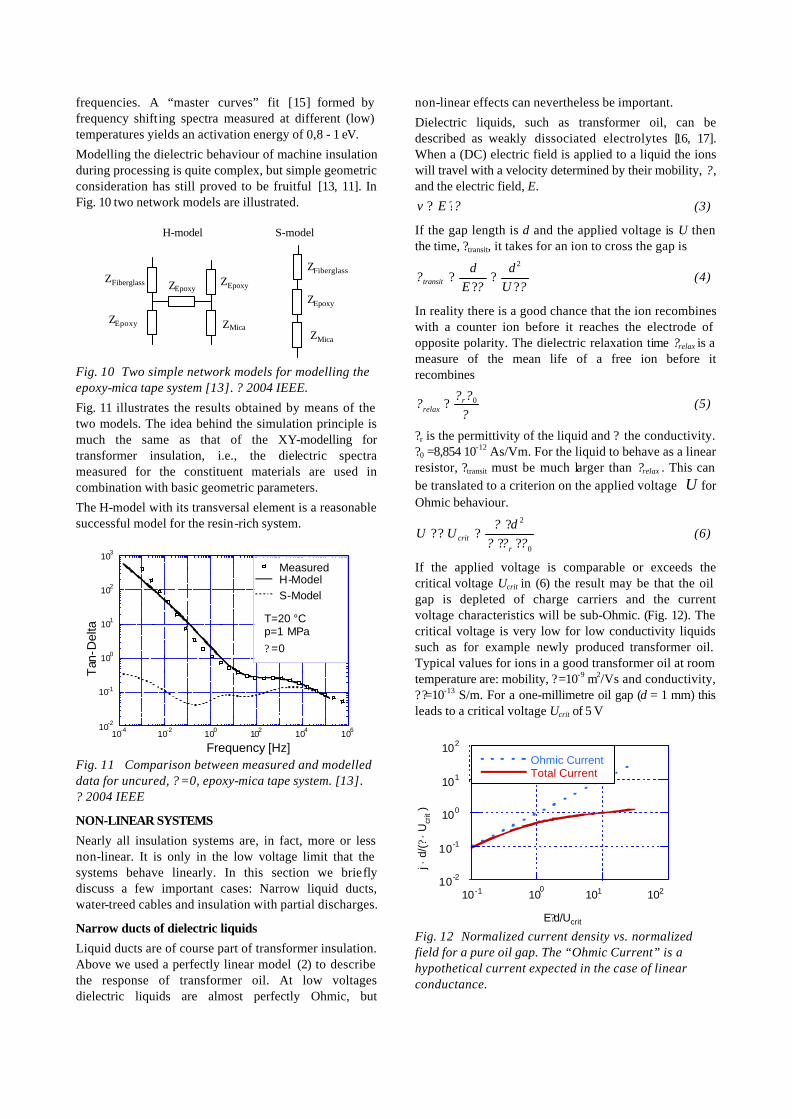
frequencies. A “master curves” fit [15] formed by frequency shifting spectra measured at different (low) temperatures yields an activation energy of 0,8 - 1 eV.
Modelling the dielectric behaviour of machine insulation during processing is quite complex, but simple geometric consideration has still proved to be fruitful [13, 11]. In Fig. 10 two network models are illustrated.
ZEpoxyZEpoxy
ZEpoxy ZMica
ZFiberglass
ZEpoxy
ZMica
ZFiberglass
S-modelH-model
Fig. 10 Two simple network models for modelling the epoxy-mica tape system [13]. ? 2004 IEEE.
Fig. 11 illustrates the results obtained by means of the two models. The idea behind the simulation principle is much the same as that of the XY-modelling for transformer insulation, i.e., the dielectric spectra measured for the constituent materials are used in combination with basic geometric parameters.
The H-model with its transversal element is a reasonable successful model for the resin-rich system.
10-2
10-1
100
101
102
103
10-4 10-2 100 102 104 106
MeasuredH-Model S-Model
Tan
-Del
ta
Frequency [Hz]
T=20 °Cp=1 MPa? =0
Fig. 11 Comparison between measured and modelled data for uncured, ? =0, epoxy-mica tape system. [13]. ? 2004 IEEE
NON-LINEAR SYSTEMS
Nearly all insulation systems are, in fact, more or less non-linear. It is only in the low voltage limit that the systems behave linearly. In this section we briefly discuss a few important cases: Narrow liquid ducts, water-treed cables and insulation with partial discharges.
Narrow ducts of dielectric liquids
Liquid ducts are of course part of transformer insulation. Above we used a perfectly linear model (2) to describe the response of transformer oil. At low voltages dielectric liquids are almost perfectly Ohmic, but
non-linear effects can nevertheless be important.
Dielectric liquids, such as transformer oil, can be described as weakly dissociated electrolytes [16, 17]. When a (DC) electric field is applied to a liquid the ions will travel with a velocity determined by their mobility, ? , and the electric field, E.
??? Ev (3)
If the gap length is d and the applied voltage is U then the time, ?transit, it takes for an ion to cross the gap is
???
??
??
Ud
Ed
transit
2
(4)
In reality there is a good chance that the ion recombines with a counter ion before it reaches the electrode of opposite polarity. The dielectric relaxation time ?relax is a measure of the mean life of a free ion before it recombines
???? 0r
relax ? (5)
?r is the permittivity of the liquid and ? the conductivity. ?0 =8,854 10-12 As/Vm. For the liquid to behave as a linear resistor, ?transit must be much larger than ?relax . This can be translated to a criterion on the applied voltage U for Ohmic behaviour.
0
2
????
???
???r
critd
UU (6)
If the applied voltage is comparable or exceeds the critical voltage Ucrit in (6) the result may be that the oil gap is depleted of charge carriers and the current voltage characteristics will be sub-Ohmic. (Fig. 12). The critical voltage is very low for low conductivity liquids such as for example newly produced transformer oil. Typical values for ions in a good transformer oil at room temperature are: mobility, ?=10-9 m2/Vs and conductivity, ??=10-13 S/m. For a one-millimetre oil gap (d = 1 mm) this leads to a critical voltage Ucrit of 5 V
Ohmic CurrentTotal Current
10-2
10-1
100
101
102
10-1 100
101 102
j ·d/
(?·
Ucr
it )
E?d/Ucrit Fig. 12 Normalized current density vs. normalized field for a pure oil gap. The “Ohmic Current” is a hypothetical current expected in the case of linear conductance.

So, if DC voltage is used for measuring e.g. the oil conductivity very low voltages should always be used.
If an AC voltage is applied to a liquid the ions will oscillate back and forth. The amplitude of the oscillation, ? x, will be (7)
dfUx
?????
??
(7)
where f is the frequency of the AC voltage. The criterion for linearity is now that the oscillation amplitude ? x will be much smaller than the gap length d. This gives a new critical field, Ucrit,AC , that
?? 2
,df
UU ACcrit??
??? . (8)
At a very low frequencies, e.g. at f=0,001 Hz, Ucrit,AC is only 3V. Clearly very low voltages are to be recommended if one measures on insulation with small oil gaps, in particular with highly resistive oils.
At 50 Hz, Ucrit,AC is very high for a gap as big as 1 mm, however for very small gaps, such as those in liquid impregnated systems [18], the non-linear effect can be significant also at power frequencies. Ions that are swept out of the liquid phase are immobilized. The result is that the losses will decrease as the voltage is increased (“The Garton effect”).
At very high fields the losses may increase again due to, for example, field enhanced dissociation and charge injection [19, 20].
XLPE with water trees
Water treeing is an ageing mechanism in polymer isolated cables for medium voltage. A water tree [21] is a tree or bush like structure that can develop in polymeric insulation under the influence of moisture and electric field. Ageing due to water treeing significantly reduces the electric breakdown strength of the insulation.
Fig. 13 Water trees found in a field-aged XLPE cable.
Dielectric response methods can be used to diagnose water tree infested cables [22, 23, 24, 25]. The voltage dependence of both capacitance and loss is a clear indication of water tree aging. Fig. 14 shows the results of measurements on a 12 kV cross-linked polyethylene (XLPE) cable from the 70-ies.
In the graph the real part value of the permittivity at low voltage, ?? (2,3) has been subtracted and the difference, ? ????is shown.
10-1 100
1: 3 kV2: 4.5 kV
10-4
10-3
10-2
10-1
Frequency (Hz)
? ?'
10-1 100
3: 6 kV4: 3 kV
10-4
10-3
10-2
10-1
Frequency (Hz)
?"
Fig. 14 Voltage dependent responses of a water tree aged XLPE cable [22].? 2004 IEEE
Both the real part ? ???and the loss ??? show clear voltage dependence. One may notice that for the highest voltages the slope of the loss curve approaches –1 in the log-log coordinates. This indicates that there are water trees that penetrate the whole insulation and a DC like leakage current develops at high voltages. Such behaviour is a sign of severe degradation and significant risk of breakdown exists if the cable is left in service.
The relation between breakdown strength and dielectric loss ??? at 0,1 Hz is shown in Fig. 15 for lightning impulse (LI) strength and in Fig. 16 for AC step test. The breakdown voltage Ubd is normalised in both graphs with the nominal service voltage, U0.
10-5
10-4
10-3
10-2
10-1
100
0 5 10 15 20 25 30 35 40U
bd/U
0
? " at U0 and 0.1 Hz
Fig. 15 Loss ? ?? as a function of Ubd/U0 for aged XLPE cables. (LI test) From [22].? 2004 IEEE

10-5
10-4
10-3
10-2
10-1
100
0 2 4 6 8 10 12
? " at U0 and 0.1 Hz
Ubd
/U0
Fig. 16 Loss ? ??as a function of normalised breakdown strength, Ubd/U0, (AC step). [22] ? 2004 IEEE
The non-linear response will manifest itself as containing harmonics in the response current. Also the harmonic content can be used as diagnostic indicators. For moderately aged cables the odd harmonics (3f, 5f, 7f …) dominate but for severely water-treed cables, with leakage current, the contribution from the even harmonics (2f, 4f, 6f, …) becomes significant [22].
Several models have been applied to explain the dielectric response of water trees. One approach is to use an equivalent circuit [26] in order to describe the water-treed insulation. The un-treed XLPE is represented by a loss-free capacitor. And the deteriorated region is modelled by a capacitor with a parallel resistor representing the increased conductivity within the water tree region. With this model it is possible to explain the increase in both capacitance and loss, but it is difficult to explain both the frequency dependence and the non-linearity.
A more physical approach is to [27, 28] assume that the water-treed region consists of water droplets forming “strings of pearls” interconnected by narrow channels of crazed insulation. This model explains, to some extent, the leakage current response of deteriorated XLPE by establishment of field dependent electric contacts between water droplets bridging the whole insulation thickness. The predicted frequency dependence is however in such a case not in complete agreement with experiments.
Dielectric response of insulation with partial discharges
Voltage dependence of capacitance and loss, “tip-up” measurements, are standard tools for quality assessment of high voltage rotating machine insulation.
Fig. 17 shows a typical result of tan(?) measurement vs. applied voltage for an aged stator bar removed from a hydro-generator.
0,005
0,01
0,015
0,02
0,025
0,03
0 5 10 15 20
Tan
-Del
ta
Applied Voltage [kV]
Fig. 17 Tan(?) “tip-up” measurement on an aged stator bar.
There is naturally a contribution from partial discharges (PD) to the non-linear dielectric response ?29, 30, 31, 32]. To a first approximation a single partial discharge, of induced charge, iq , can be represented by a delta
function like current pulse PDi? (9) in the outer circuit.
)()( iiPD ttqti ???? ? (9)
A PD pulse contributes both to the capacitance and loss. If a sinusoidal voltage of frequency f (U?sin(2?ft) ) is applied the contributions are (10):
ii
ii
i
ii
i
tfUqC
Uq
C
??
?????
????
??
?
?
2
)sin(
)cos(
(10)
In general numerous pulses exist and we therefore have to sum over index i in (9) and (10). The phase position of the discharge is important as well. Discharges near the peak of the voltage will have a maximum impact on the loss whereas discharges near the zero crossings will have the maximal impact on the capacitance.
Not only the fundamental components (10) but also higher harmonics in the response current will be affected by the discharge distribution. Fig. 18 shows the current from partial discharges in a small cavity bounded by dielectric walls (poly ethylene). The real and linear displacement current is outbalanced and only the non-linear component is recorded.

-90
-45
0
45
90
0 90 180 270 360
PD
-cur
rent
[10-
8A
]
Phase [Degrees]
-90
-45
0
45
90
0 90 180 270 360
PD
-cur
rent
[10-
8A
]
Phase [Degrees] Fig. 18 PD-current from an artificial cavity.
It is clear that the current contains a lot of harmonics and Fig. 19 shows the first eight absolute harmonic values on the cosine components (an) and sinus components (bn) in the Fourier transform of the PD-current (11).
)2sin()2cos(2
)(1
0 tfbtfaa
ti nn
nPD ??????? ??
?
?? (11)
0 100
1 10-7
2 10-7
3 10-7
1 2 3 4 5 6 7 8
|an|
|bn|
Am
plitu
de [A
]
Harmonic number, n=f/fo
Fig. 19 First eight Fourier coefficients in the spectrum of the PD current in an insulated cavity from Fig. 18.
The fundamental components (a1 and b1) are the PD contributions to the capacitance and loss, as defined in (10). In this case a1 is, in fact, larger than b1. The symmetry, in the PD pattern, between the positive and negative half-periods is reflected in the harmonic distribution [31]. In this case harmonics with even n are in general much smaller than the odd ones.
Another canonical geometry is the point-plane gap. Fig. 20 shows the corona current from such a configuration In this case (Fig. 21) the loss contribution, b1, is much larger than the capacitance contribution a1.
-90
-45
0
45
90
0 90 180 270 360
PD
-cur
rent
[10-
8A
]
Phase [Degrees]
Fig. 20 Corona current from a point-plane gap.
0 10 0
4 10-8
8 10-8
1 10-7
1 2 3 4 5 6 7 8 9
|an|
|bn|
Am
plitu
de [A
]
Harmonic number, n=f/fo
Fig. 21 First eight Fourier coefficients in the spectrum of the point-plane corona current from Fig. 20.
Again, the symmetry of the PD pattern is reflected in the Fourier components. The loss contribution b1 is much larger than the capacitance contribution a2 and both odd and even harmonics are significant.
In fact, the harmonics in the dielectric response can be used for classification of PD spectra. In Table 1 a few idealised symmetry cases are listed [31].
The relations (9) and (10) do not indicate any dependence of the frequency of the applied voltage on the PD current. In reality there exists a significant frequency dependence [33, 34]. Fig. 22 shows the number of discharges per cycle as a function of the frequency of the applied voltage. The study object is an old bitumen-mica insulated stator bar. There are mechanisms that can, at least qualitatively, explain the frequency dependence. At the high frequency end (Fig. 22) the number of discharges drops sharply. This is most probably the effect of a statistical time lag. If time interval, when the voltage is above the inception level, becomes short enough, it happens that seed electrons are not available to start an avalanche [35].

Table 1 Relation between the shape of the PD pattern )(?q and coefficients of the Fourier harmonic
components.
Phase distribution )(?q
Influence on the Fourier coefficients
Odd around origin )()( ?? ??? qq
?
q(? )
nan ?? ,0
Even (symmetric) around
origin
?
q(? )
nbn ?? ,0
Symmetric around the voltage peaks but polarity dependent.
?
q(? )
evennbaspoddna
n
n
,00.;,0 1
???
?
q(? )
nevenba nn ??? ,0,0
Below the maximum at 5 Hz, the number of discharges decreases as well. This can be interpreted as a shielding effect by the conductivity, around walls of the many voids that reduce the field strength inside the voids. Finally, at very low frequencies the number of discharges increases again. Possibly this is as an effect of field concentration in a blocking de-lamination.
The behaviour is like that of a resistor in series with a capacitor and one gets a number of discharges per cycle inversely proportional to frequency.
Clearly this combination of PD detection and dielectric spectroscopy can be a great help in elucidating the
nature of material degradation.
0
200
400
600
800
1000
10-3 10-2 10-1 100 101 102
PD
s pe
r cy
cle
Frequency [Hz]
Fig. 22 Measured number of discharges per cycle for a bitumen-mica insulated machine bar. Applied voltage is 9 kVrms [33].
Field grading materials
Insulating materials filled by conducting or semi conducting particles are used for field grading purposes [36, 37, 38]. These materials often exhibits extreme dielectric properties in terms of both non-linearity and frequency dependence. A case of silicon carbide (SiC) in ethylene-propylene rubber (EPDM) is shown in Fig. 23. The SiC particles are much more conducting than the rubber matrix and the electric properties are controlled by the part icle-particle contacts [39]. This leads to a very sharp transition in properties in a critical (percolation) concentration range.
Fig. 23 Scanning electron micrograph of SiC particles in a rubber matrix.
At low voltages the materials behave as insulators but at higher voltages the material becomes conducting. In Fig. 24 is shown the current response on a sinusoidal voltage pulse. At this high field the current maxima are almost in phase with the voltage. In order to avoid thermal run away and breakdown the applied voltage is restricted to two cycles. This pulse technique for dielectric response measurement is very useful for non

linear materials. From the Fourier transform of the current and voltage one can calculate voltage dependent capacitance and

loss as well as higher harmonics that are characteristic of a nonlinear material.
-4000
-3000
-2000
-1000
0
1000
2000
3000
4000
-0.001
-0.0005
0
0.0005
0.001
-0.01 0 0.01 0.02 0.03 0.04 0.05 0.06 0.07
Voltage
Current
Time (sec) Fig. 24 Current response of a SiC filled EPED rubber
CONCLUSIONS
Dielectric frequency response is a versatile tool for assessing practical insulation systems. Real systems often consist of more than one material. Typical examples are oil-cellulose insulation systems in power transformers and epoxy -mica insulation in rotating machines. To properly analyse the dielectric response of such composite systems requires good knowledge of the geometrical structure involved as well as the dielectric properties of the constituent materials.
Voltage dependence is another real life complication. Liquid gaps exhibit non-linear current voltage characteristics even at low electric fields, and in particular, with small gaps at low conductivities.
Partial discharges affect both the real part (capacitance) and the imaginary part (loss) of the fundamental response. The PD phase distribution is reflected in the content of higher harmonics in the response. The measurement of PD’s as a function of frequency of the applied voltage is a new technique that can provide more information about the nature of the PD source.
Strongly non-linear field grading materials can be characterised with special pulse dielectric response technique where the applied voltage consists of only one or two cycles.
ACKNOWLEDGEMENTS
First I want to thank my former research students at KTH: Dr. Hans Edin, Dr. Anders Helgeson, Dr. Eva Mårtensson, Tech. Lic. Björn Holmgren and Dr. Peter Werelius who all contributed to the work presented in this paper.
My ABB colleagues Ms. Anna Christerson, Dr. Albert Jaksts and Dr. Carina Önneby are thanked for their contributions.
Professor Roland Eriksson, KTH and Professor Stanislaw Gubanski, Chalmers, are thanked for their
many suggested improvements on the final manuscript.
REFERENCES
[1] W. Zaengl, “Dielectric spectroscopy in time and frequency domain for HV power equipment. I. Theoretical considerations”, IEEE Electrical Insul. Mag., Vol. 19, No. 5 ,Sep-Oct 2003, p. 5–19 [2] U. Gäfvert: "Condition Assessment of Insulation Systems: Analysis of Dielectric Response Methods", Nordic Insulation Symposium (NORD-IS), Bergen, Norway, 1996 [3] P. Boss, G. Csépes, V. Der Houhanessian, J. Filippini, S.M. Gubanski (chair), P. Guuinic, U. Gäfvert, V. Karius, J. Lapworth, G. Urbani, P. Werelius, W. Zaengl.. “Dielectric Response Methods for Diagnostics of Power Transformers Report of the TF 15.01.09” ELECTRA, N°202 - June 2002, and Gubanski, S.M.; Boss, P.; Csepes, G.; Der Houhanessian, V.; Filippini, J.; Guuinic, P.; Gafvert, U.; Karius, V.; Lapworth, J.; Urbani, G.; Werelius, P.; Zaeng, W.;” Dielectric response methods for diagnostics of power transformers “, Electr. Ins. Mag., IEEE,Vol. 19 , Nr. 3 ,May-June 2003 pp. 12 - 18 [4] A. Sihvola: “Electromagnetic Mixing Formulas and Applications”, IEE Electromagnetic Waves Series London, U.K.: IEE, 1999 [5] Tuncer, E.; Serdyuk, Y.V.; Gubanski, S.M.: “Dielectric Mixtures: Electrical Properties and Modelling”, IEEE Trans. Dielectrics and El. Ins.,Vol. 9 No. 5 ,Oct. 2002, pp. 809 - 828 [6] Martensson, E.; Gafvert, U.: “Three-dimensional impedance networks for modelling frequency dependent electrical properties of composite materials”, J. Phys. D: Appl. Phys. 36 (2003) 1864-1872 [7] U. Gäfvert, L. Adeen, M. Tapper, P. Ghasemi and B. Jönsson: “Dielectric Spectroscopy in Time and Frequency Domain Applied to Diagnostics of Power Transformers” , 2000 IEEE 6th International Conference on Properties and Applications of Dielectric Materials (ICPADM), Xian, China, June 21-26, 2000 [8] U. Gäfvert, G. Frimpong and J. Fuhr: ”Modelling of Dielectric Measurements on Power Transformers”, paper 15:1.2 1998 CIGRÉ Session, Paris, August 1998 [9] FEMLAB® is a finite element package from COMSOL AB, Tegnérgatan 23, 111 40 Stockholm [10] S. Wu, S. Gedeon, R. A. Fouracre: “The measurement and Modeling of the Dielectric Response of Molecules During Curing of Epoxy Resin”, IEEE Transactions on Electrical Insulation, pp. 409-417, Vol. 23, No. 3, June 1988. [11] A. Helgeson. “Analysis of Dielectric Response Measurement Methods and Dielectric Properties of Resin-Rich Insulation During Processing”, Tech. Dr. Thesis, TRITA EEA -0002, Kungliga Tekniska Högskolan, Stockholm, 26 May, 2000, [12] R. Brammer, D. Rudolfsson, K. Bengtsson:

“Improved MICAREX® for High Voltage Rotating Machines”, Nordic Insulation Symposium, Bergen, pp. 339-346, June 1996 [13] A. Helgeson and U. Gäfvert: “Dielectric Response During Curing of a Resin-Rich Insulation System for Rotating Machines”, 1999 Conference on Electrical Insulation and Dielectric Phenomena, Austin, Texas, USA, October 17-21, 1999 [14] U. W. Gedde: ”Polymer Physics”, Chapman & Hall London, UK, 1995, ISBN 0-412-62640-3 [15]A.K Jonscher: "Dielectric Relaxation in Solids", Chelsea Dielectrics Press, London 1983. [16] A. Denat, B. Gosse, J. P. Gosse, "Ion Injection in Hydrocarbons", J. Electrostatics, Vol. 7, pp. 205-225, 1979. [17] Uno Gäfvert, Albert Jaksts, Christer Törnkvist and Lars Walfridsson:,"Electrical Field Distribution in Transformer Oil",IEEE Transaction El. Ins. June 92. p. 647 [18] C. G. Garton: “Dielectric Loss in Thin Films of Insulating Liquids”, Proc. IEE Vol. 88, 1941, pp. 23-40 [19] A. Denat, Etude de la Conduction Electrique dans les Solvants Non Polaires, Thesis L'Université Scientifique et Médicale et L'Institut National Polytechnique de Grenoble, 1982 [20] A. Denat, B. Gosse, J. P. Gosse, "High Field DC and AC Conductivity of Electrolyte Solutions in Hydrocarbons", J. Electrostatics, Vol. 11, pp. 179-194, 1982. [21] E. F. Stennis and F. H. Kreuger , “Water Treeing in Polyethylene Cables”, IEEE Transactions on Electrical Insulation Vol. 25 No. 5, pp. 989-1028, 1990. [22] Werelius, P.; Tharning, P.; Eriksson, R.; Holmgren, B.; Gafvert, U.: “Dielectric spectroscopy for diagnosis of water tree deterioration in XLPE cables”, IEEE Transactions on Dielectrics and Electrical Insulation,Vol. 8 , No. 1 , Feb 2001, pp. 27-42 [23] Björn Holmgren: “Dielectric Response, Breakdown Strength and Water Tree Content of Medium Voltage XLPE Cables”, Tech. Lic. Thesis Kungliga Tekniska Högskolan TRITA-EEA-9705, 1997. [24] Peter Thärning, “Water Tree Dielectric Spectroscopy”, Tech. Lic. Thesis Kungliga Tekniska Högskolan TRITA-EEA-9703, 1997 [25] P. Werelius: “Development and Application of High Voltage Dielectric Spectroscopy for Diagnosis of Medium Vo ltage XLPE Cables”, Tech. Dr. Thesis Kungliga Tekniska Högskolan TRITA-ETS-2001-02, 2001 [26] P- Romero, R. Patsch and A. Paximadakis, “The Influence of Water Trees on Loss Factor and Capacitance of Medium Voltage Cables”, 7th International Symposium on High Voltage Engineering (ISH), Dresden, Germany, Aug 26 - 30, paper 23.07, 1991. [27] S. Hvidsten, “Nonlinear Dielectric Response of Water Treed XLPE Cable Insulation”, Dr Ing thesis,
NTNU, Trondheim, Norway, 1999, ISBN 82-471-0433-4. [28] S. Hvidsten, E. Ildstad, J. Sletbak and H. Faremo, “Understanding Water Tree Mechanisms in the Development of Diagnostic Test Metohds”, IEEE Transactions on Dielectrics and Electrical Insulation, Vol. 5 No. 5, October 1998, pp. 754 - 760 [29] T.W. Dakin, “The Relation of Capacitance Increase with High Voltages to Internal Electric Discharges and Discharging Void Volume”, AIEE Trans. on Power App. and Sys., Vol. 79, No.3-A, Oct. 1959, pp.790 - 795. [30] A. Kelen, “Chritical Examination of the Dissapation Factor Tip-Up as Measure of Partial Discharge Intensity”, IEEE Trans. on El. Insil. Vol. 13 No. 1, Feb. 1978, pp. 14-24. [31] H. Edin: “Partial Discharges Studied with Variable Frequency of the Applied Voltage”, Tech. Dr. Thesis, Kungliga Tekniska Högskolan, Stockholm, TRITA-EEK-0102, 2001 [32] H. Edin and U. Gäfvert, “Harmonic Content in the Partial Discharge Current Measured with Dielectric Spectroscopy”, Conference on Electrical Insulation and Dielectric Phenomena (CEIDP), Atlanta, USA, 1998, pp. 394 - 98 [33] Gafvert, U.; Edin, H.; Forssen, C : “Modelling of partial discharge spectra measured with variable applied frequency”, Proceedings of the 7th International Conference on Properties and Applications of Dielectric Materials (ICPADM’03), 2003.,Volume: 3 , June 1-5, 2003, pp. 839-842 [34] R. Bodega, A. Cavallini, P.H.F. Morshuis and F.J. Wester, “The Effect of Voltage Frequency on Partial Discharge Activity”, CEIDP 2002, pp. 685 - 689. [35] B. Fruth and L. Niemeyer, ”The Importance of Statistical Characteristics of Partial Discharge Data”, IEEE Trans. on El. Insul., Vol. 27 No. 1, pp. 60 - 69, Feb. 2001 [36] G. Lupo, V. Tucci and M. Vitelli, “Stress control tubes for HV cable terminations with linear and non-linear characteristics: theoretical and experimental approaches”, Proc. ISH 95, Graz, Austria, 1995 [37] E. Mårtensson, B. Nettelblad, U. Gäfvert and L. Palmqvist, “Electrical properties of field grading materials with silicon carbide and carbon black”, Proc. Int. Conf. on Conduction and Breakdown in Solid Diel., Västerås, Sweden, 1998 [38] Carina Önneby, Eva Mårtensson, Uno Gäfvert, Anders Gustafsson and Lars Palmqvist, “Electrical Properties of Field Grading Materials -Influenced by the Silicon Carbide Grain Size” 7th IEEE International Conference on Solid Dielectrics (ICSD), Eindhoven, Netherlands, 2001 [39] Eva Mårtensson, “Modelling electrical properties of composite materials”, Tech. Dr. Thesis Kungliga Tekniska Högskolan, Stockholm, 2003, TRITA-ETS-2003-10