diesel engines and solar energy for electric and cooling
TRANSCRIPT

Diesel Engines and Solar Energy for Electric and Cooling
Applications
Vom Fachbereich Maschinenbau
der Universität Hannover
zur Erlangung des akademischen Grades
Doktor-Ingenieur
genehmigte Dissertation
von
M. Sc. Eng. Mohamed Morsy Abdel Meguid Salama El Gohary
geboren am 16. November 1969 in Alexandria
2004

Vorsitzender der Prüfungskommission : Dekan Prof. Dr.-Ing. habil. K. Poop
1. Referent: Prof. Dr.-Ing. habil. M. Gietzelt 2. Referent: Prof. Dipl.-Ing. G. Gütschow 3.Referentin: PD Dr.-Ing. habil. A. Luke Tag der Promotion: 09.09.2004

Vorwort Diese vorliegende Arbeit entstand während meiner Tätigkeit als wissenschaftlicher
Mitarbeiter am Institut für Energietechnik der Universität Hannover.
Mein besonderer Dank gilt Herrn Professor Dr.-Ing. M. Gietzelt, der die vorliegende Arbeit
angeregt, betreut und letztlich kritisch begutachtet hat. Professor Gietzelt war für mich nicht
nur ein Doktorvater sondern ein echter Vater, der mir unglaublich viel geholfen hat. Herrn
Professor Dipl.-Ing. G. Gütschow and Frau PD Dr. A Luke danke ich für die Übernahme des
Korreferates und Herrn Prof. Dr.-Ing K. Popp für die Übernehme des Vorsitzes der
Prüfungskommission.
Des Weiteren möchte ich allen Kollegen und Freunden, die mir während der Fertigstellung
dieser Dissertation mit Rat und Tat hilfreich zur Seite gestanden haben, meinen herzlichen
Dank.
Passende Worte des Dankes für meine Eltern zu finden, die meine Entwicklung stets mit
Geduld, Verständnis und vielen Freiheiten unterstützt haben, ist ebenso unmöglich wie die
Dankbarkeit gegenüber meiner Lebensgefährtin Hayam auszudrücken, die mir in all den
Monaten und Jahren immer wieder gezeigt hat, dass Arbeit alleine einen Menschen nicht
ausfüllen kann.
Hannover, im 09 September 2004

Keywords Diesel engines, Energy management, Absorption refrigeration, Solar collector

I
Abstract The coupled production of the earth energies power and heat from the assigned primary
energy is a measure for the reduction of the carbon dioxide emission state of the art of the
power supply. This technology of the power- heat coupling can take place in central or
decentralized systems. The power- heat -cooling coupling has been increasingly improved,
where cold out of heat in absorption refrigeration machine are operated either in single-stage
or in two- stage. The power- heat-cooling coupling participates in particular for the building
air conditioning in subtropical or tropical countries. These systems are the basis of frequent
decentralized application as energy transformation system of the diesel engine and also the
fuel cell in the future.
It offers at the same time to produce heat in solar thermal systems (solar heat collectors) since
thus the different cooling load demand can be compensated between day and night.
The engineer-scientific investigations must be both extended to the design and the
performance of such plants. As evaluation criterion, primary energy saving (fuel
consumption) and the working reliability (engine cooling water temperature) are consulted.
The diesel engines are characterized by characteristic values of the heat losses. The
conception of the absorption refrigeration (single-stage and/or two-stage) leads to different
characteristic diagrams, which affect on one hand the necessary cooling water temperatures
and on the other hand the efficiency of the solar heat collectors. From this requirements, the
thermal connection between cooling water heat exchanger , exhaust-gas heat exchanger and
solar collectors should be studied.
For different ambient temperatures and solar radiation conditions, whereby significant cities
in Egypt are consulted, the connection between fuel expenditure and collector surface is
quantitatively occupied. By means of a modified power characteristic number as quotient
from produced power and cooling the power feed- into the net and/or the power purchase
takes-out the net in dependence of the demand. Management strategies for the engine cooling
water system are developed, which serve at the same time as basis for the mass flow control
system.

II
Schlagworte
Dieselmotoren, Energiemanagement, Absorptionkältemaschine, Solarkollektor

III
Kurzfassung Die gekoppelte Erzeugung der Erdenergien Strom und Wärme aus der eingesetzten
Primärenergie ist als Maßnahme zur Reduktion der Kohlendioxid-Emission Stand der
Technik der Energieversorgung. Diese Technologie der Kraft-Wärme-Kopplung kann in
zentralen oder dezentralen Systemen erfolgen. In zunehmendem Maße gewinnt in
Erweiterung die Kraft-Wärme-Kälte-Kopplung an Bedeutung, bei der die Kälte aus Wärme in
Absorptionskältemaschinen, die einstufig oder zweistufig betrieben werden, erzeugt wird. Die
Kraft-Wärme-Kälte-Kopplung eröffnet sich insbesondere für die Gebäudeklimatisierung in
subtropischen oder tropischen Ländern. Diesen Systemen liegen wegen der oftmals
dezentralen Anwendung als Energiewandlungssystem der Dieselmotor und zukünftig auch die
Brennstoffzelle zugrunde.
Zugleich bietet es sich an, Wärme in solarthermischen (Solarkollektoren) zu erzeugen, da
somit der unterschiedliche Kältebedarf zwischen Tag und Nacht kompensiert werden kann.
Die ingenieurwissenschaftlichen Untersuchungen müssen sich sowohl auf die Auslegung als
auch den Betrieb derartiger Anlagen erstrecken. Als Bewertungskriterium werden die
Primärenergieeinsparung (Brennstoffverbrauch) und die Betriebssicherheit
(Kühlwassertemperatur) herangezogen.
Die Dieselmotoren werden durch Kennwerte der Abwärmeströme charakterisiert. Die
Konzeption der Absorptionkältemaschine (einstufig bzw. zweistufig) führt zu
unterschiedlichen Kennfeldern, die sich einerseits auf die erforderlichen
Kühlwassertemperaturen und andererseits auf die Effizienz der Solarkollektoren auswirken.
Hieraus ergeben sich zugleich Anforderungen an die Verschaltung zwischen Kühlwasser,
Abgaswärmetauscher und Solarkollektoren.
Für unterschiedliche Umgebungstemperaturen und solare Einstrahlungsverhältnisse, wobei
signifikante Städte in Ägypten herangezogen werden, wird der Zusammenhang zwischen
Brennstoffaufwand und Kollektorfläche quantitativ belegt. Mittels einer modifizierten
Stromkennzahl als Quotient aus erzeugter elektrischer Energie und Kälte ergeben sich in
Abhängigkeit des Bedarfs die Stromeinspeisung in das Netz bzw. der Strombezug aus dem
Netz. Es werden Betriebsführungsstrategien für das Motorkühlsystem entwickelt, die zugleich
als Basis für das Massenstrom-Regelsystem dienen.

IV
Contents
Abstract I
Contents IV
Nomenclatures VII
Chapter 1 1
Introduction 1
1 Objectives of the Research........................................................................................... 1
Chapter 2 4
Supply Systems of Power, Cooling and Heating 4
Chapter 3 8
Diesel engines 8
3.1 Construction and performance ........................................................................................ 8
3.1.1 Marine diesel engines power plant ....................................................................... 8
3.1.2 Electrical power generation on ships.................................................................. 12
3.1.3 Stationary diesel engines power plant ................................................................ 15
3.2 Energy system efficiency .............................................................................................. 17
3.2.1 Heat balance ........................................................................................................ 17
3.2.2 Standardized ambient temperature effect ......................................................... 20
3.2.3 Part load performance......................................................................................... 22
Chapter 4 25

V
Absorption Machine Simulation 25
4.1 Compression Cycle Performance .................................................................................. 25
4.2 Absorption machine....................................................................................................... 27
4.2.1 Principle of operation ......................................................................................... 27
4.2.2 Advantages of absorption refrigeration ............................................................... 28
4.2.3 A single- stage absorption refrigeration unit .............................................................. 28
4.2.4 Two Stage Absorption Refrigeration Unit ................................................................. 30
4.2.5 Heat balance ........................................................................................................ 31
4.2.6 Working Pairs in Absorption Refrigeration Units............................................... 33
4.2.7 Coefficient of performance.................................................................................. 35
Chapter 5 37
Combined Power – Cold Plant - A Parametric Analysis 37
5.1 Reference system........................................................................................................... 37
5.2 Diesel power plant ......................................................................................................... 40
5.2.1 Diesel engine and compression cooling unit ....................................................... 40
5.2.2 Diesel engine and absorption cooling unit .......................................................... 44
Chapter 6 70
Solar Energy Systems 70
6.1 Thermal solar energy utilization................................................................................... 70
6.1.1 Power Generation ................................................................................................ 71
6.1.1.1 Solar power-photovoltaic .......................................................................... 72
6.1.1.2 Solar thermal power plants....................................................................... 73
6.1.2 Heat generation.................................................................................................... 73
6.1.2.1 Active Solar heating systems .................................................................. 74
6.1.2.2 Passive solar energy .................................................................................. 75
VI
6.2 Thermodynamics of solar collectors .......................................................................... 76
6.3 Thermal solar utilization systems .............................................................................. 80
6.4 Solar Energy and cold generation (ARU) .................................................................. 83
Chapter 7 87
Combined Power- Cold Plant with Thermal Solar Energy - A parametric
Analysis 87
7.1 General aspects....................................................................................................... 87
7.2 Solar collector series connected to the Diesel engines .................................................. 91
7.2.1 Series -A .............................................................................................................. 91
7.2.2 Series –B.............................................................................................................. 97
7.3 Solar collector parallel connected to the Diesel engines ............................................. 102
7.4 Solar collector and Diesel engines part-series............................................................. 103
7.5 Summing up ............................................................................................................. 107
Chapter 8 111
Conclusions and Future Work 111
8.1 Conclusions ................................................................................................................. 111
8.2 Recommendations ....................................................................................................... 119
8.3 Future work .............................................................................................................. 121
REFERENCES 122

VII
Nomenclatures A Area
A/F Air fuel ratio
ARU Absorption refrigeration units
bmp Brake mean effective pressure
bsfc Brake specific fuel consumption
COP Coefficient of performance
Cp Specific heat at constant pressure
CRU Compression refrigeration unit
CV Calorific value of fuel
CW Water specific heat
D Difference
E Radiation coefficient
I Solar radiation
m Mass
P Power
PE Primary energy
Q Heat rate
Sc Solar collector
Sc Power-cooling ratio
SF Solar to engine heat energy factor
Sh Power-heating ratio
T Temperature
α Collector coefficient
η Collector thermal efficiency

VIII
ρ Density
δ Part load
∆ Difference
ωc Fuel utilization of cooling
ωh Fuel utilization of heating
Subscripts:
a Ambient
ab Absorber
ARM Absorption Refrigeration Machine
b Back
BHKW Total heat and power
br Brake
c Cooling
CHP Combined Heat and Power
co Condenser
col Cooling losses
coll Collector
con Convection
cus Customer
CRM Compression Refrigeration Machine
cw Cooling water
d Demand
de Diesel engine
e Evaporator

IX
eff Effective
el Electrical
g Generator
h Heating
HB Heating Boiler
in Inlet
kw Cooling water
lost Losses
m Mechanical
N Night
o Reference value
out Outlet
PP Power plant
ratio Ratio
rad radiation
ref Reference
s Supply
sol Solar
tr Transmission
th Thermal
t-out Take out
ven Ventilation
w Water

1
Chapter 1
Introduction
1 Objectives of the Research
mong various alternative energy sources to fossil fuels, a great advance has been
achieved in the use of solar collector to convert solar energy to heat energy or cooling
energy by using absorption refrigeration units. The coupled production of the earth energies
power and heat from the assigned primary energy is measured for the reduction of the carbon
dioxide emission state of the art of the power supply. This technology of the power- heat
coupling can take place in central or decentralized systems. The power- heat -cooling
coupling at meaning wins increasingly in extension, with which cold out of heat in absorption
refrigeration machine, which are operated single-stage or in two- stage, is produced. The
power- heat-cooling coupling participates in particular for the building air conditioning in
subtropical or tropical countries. These systems are the basis because of often decentralized
application as energy transformation system the diesel engine and in the future also the fuel
cell.
Thermally driven absorption refrigeration machine (ARM) can contribute for power supply
with cogeneration systems a better utilization in summer months. Clear ecological advantages
are to be expected by the cogeneration of electric and heat in relation to other versions of the
refrigeration supply. The supply temperature of (ARM) controls the type of this machines
which varied from single –stage can not be used diesel engine cooling water heat reason for
the high supply temperature range and two-stage can be used diesel engine cooling water
cause of lower supply temperature range.
The air conditioning defined as the temperature control humidity control, air filtering, air
purification ,air management and circulation. The end energy demand is varying from electric
,heating and cooling. The heating energy used in winter in Europe is very wide to use but in
the middle east and Africa the weather in winter don’t need to use heating energy. The large
A

2
demand in this area is air conditioning in summer months to overcome the high temperature
weather in this world area. Complete air conditioning provides automatic control of these
conditions for both summer and winter. The important point to be discussed in the current
study is the temperature control for summer which is the very important factor in the area of
the high temperature range in the summer (Middle east and Africa). Therefore, the current
study is concerned in this point the summer air conditioning. Temperature control for summer
cooling conditions requires automatic control for the refrigeration system to mention the
desired room temperatures. It is a very economical and ecological advantage to use the sun to
provide this cooling load, but the problem is if the solar energy can deliver electric load or
not. It is found many systems of supply electric heating and cooling loads, these system will
be illustrated in the next chapter to through the light of these systems.
Using diesel engines, electric efficiency can be changed by changing the ambient
temperatures referring to the designed engine performance. The engine electric efficiency
should be decreased by increasing ambient temperature. Therefore, the engine electric
efficiency should be changed by changing the ambient temperature. The fuel consumption
rate comparison will be studied in the current work, which takes into consideration that both
electric and cooling load must be the same for the selected cases mentioned before. Difference
engine cooling water rates, engine loads, solar collector areas, solar radiations and
refrigeration machines will be studied to produce a constant both cooling and electric load.
The engineer-scientific investigations must extend both to the design and the performance of
such plants. As valuation criterion primary energy saving and the working reliability (engine
cooling water temperature) are consulted. Both engine and solar collector performance
changed by changing the weather performance. Therefore, the change of the installation place
of the plant causing the change of the performance of the plant. Temperature control is very
important point, where the change of it produces a change of both engine and refrigeration
units as illustrated in the current study.
In the current study, the cooling load was studied at four cases namely: Compression
refrigeration units connected to electric power station, Compression refrigeration units
connected to diesel engine power plant, Absorption refrigeration units connected to diesel
engine power plant, Absorption refrigeration units connected to both diesel engine power
plant and solar collector. It is common in practice to assume that diesel engines and electric
power stations should behave in a fuel consumption similar. This assumption is justified only
when the engines are operating as electric power unit only, therefore both exhaust gas losses

3
and cooling water losses are not used . Generally, the interference between diesel engines and
electric power stations are taken in our considerations. These interference of the different
cases are systematically described and analyzed in the present work. The diesel engine
performance to use cooling water heat and control the cooling water temperature range (inlet
and outlet) to obtain the efficient performance of the engine.
All the possible arrangements of the named cases are grouped into two sections: compression
and absorption refrigeration units. The possible compression refrigeration units may be
classified in two categories: with and without diesel engines. These two categories are divided
by an interference fuel consumption. The interference may be either partial, when only one
the electric load is affected, or combined, when both electric and cooling load are constant.
The aim of the present work is to analyze and study the problem of the fuel consumption for
the case of use absorption refrigeration units, at constant heat load and cooling load, as well as
using solar energy to reduce fuel consumption . Engine parameters as well as solar parameters
are considered. In addition, results will be shown when the interference between the use of
engine losses and/or solar heat energy. The following information is specifically required:
Reference electric power station as a function of both electric and cooling load, Compression
refrigeration unit coefficient of performance, Absorption refrigeration unit coefficient of
performance and solar collector
In the current study , two cooling demand loads will be considered:
a- Night cooling load b- Day cooling load
The connection between solar collector and diesel engine was studied in four cases: parallel,
series –A, series –B and part –series to obtain the more efficient connection for both low solar
collector area and the minimum fuel utilized. The analyses were considered the different
parameters varying from solar radiation (500 and 1000 W/m2) and the ambient temperature
varied from (20°C to 40 °C). The more efficient connection ,temperature and solar radiation
will be studied in the current study.
All the above questions will be answered in the upcoming chapters. The investigation was
extend to include the variation of engine, collector and refrigeration units parameters. As
stated in the introduction, only absorption refrigeration units have the advantages of using
both engine losses and solar energy to achieve the cooling load demand.

4
Chapter 2
Supply Systems of Power, Cooling and Heating
iffrent systems of power- heat units are often divided into classes: central energy
systems and decentral heat – power systems. In many cases, particularly central power
systems produce the electric loads, which are used for domestic application such as lighting,
industry and cooling through compression refrigeration systems. The heating load in this case
can be obtained by separated heating boiler. The main types of this reference systems are
namely:
Steam turbine power station
Gas turbine power station
Combined gas and steam power station
Large engine power station
Nuclear power station
The primary energy used in this large systems are coal, oil, natural gas and nuclear primary
energy. The electrical efficiency this systems varies from 0.3 to 0.6. The high efficiency
occurs with the case of combined gas and stem turbine power plant[1].
Figure 2.1 shows the different two types of operation to feed electric, cooling and heating
loads. The cooling loads supplied in this case through the compression cooling unit using the
electrical power. In case a) the heat supplied through a separate heat boiler with additional
separate primary energy (PEHB) but the electric and cooling loads can be obtained directly in
the reference power station which used a primary energy of (PEPP). On the other hand, when
considering combined heat and power or cooling and power systems as shown in case b).
Three primaries energy are considered (PEPP),(PECHP) and (PEHB)[1,2].
D

5
Cogeneration systems are not limited to produce heat and power. Many systems have also
been developed that deliver chilled water for cooling loads. Absorption refrigeration units are
used in range of (+6 °C), and operate with water /Li Br. If temperature below about (6°C) are
required, absorption based on ammonia / water are available. This machines allow cooling
temperature of range down to (-40°C), which are often required in industry. The range and
performance of difference stages of absorption cooling units will be discussed in chapter 4.
Figure 2.2 considers the combined heat and power systems which used absorption cooling
machines (ARM) to produce the cooling load. The small size implies that power production
reference systems power station can be considered in connection to the small combined heat
and power (CHP) to take- out or feed –in depending on the demand loads.
Many decentralized (CHP) plants are furthermore equipped with one or more boilers. The
main function of these boiler is to provide heat in the case of high heat load. The operation of
boiler is determined only in the case of special heat loads.
The many forms of total energy systems(BHKW) matrices are
Engine +heat boiler
Gas turbine +heat boiler
In the current study , it can be used a solar energy system to produce both heat and cooling. In
this case to the last two cases can be added the following:
Engine +Solar collector
Engine +solar collector +heat boiler
Heat boiler +solar collectors
Gas turbine +solar collectors
Gas turbine +solar collectors +heat boilers
The system will be considered in the current study is engine + solar collector + ARM to
produce cooling load.

6
P P
C R M
P e l,d Q c o ld ,d
P e l ,p p
P e l ,C R M
P E p p
H B
Q h e a t , d
P E H B
a)Reference varieties (Separate feed)
P P
P e l,d
P e l ,p p
P e l ,C R M
P E p p P E C H P
C R M
Q c o ld ,d
C H P H B
Q h e a t ,d
P e l ,C H P
P E C H B
Q H ,C H B
b)CHP +CRM
Figure2.1 Different Supply verities of electricity and thermal energy (cold and heat)

7
P P
P e l , d
P e l , p p
P E p p P E C H P
Q c o l d , d
C H P H B
Q h e a t , d
P e l , C H P
P E C H B
Q H , C H B
A R M
a) CHP +ARM
P P
P e l , d
P e l , p p
P e l , C R M
P E p p P E C H P
C R M
Q c o l d , d
C H P H B
Q h e a t , d
P e l , C H P
P E C H B
Q H , C H B
A R M
b)CHP+ARM+CRM
Figure2.2 Different Supply varities of electricity and thermal energy (cold and heat)

8
Chapter 3
Diesel engines iesel engines are one of the most efficient types of heat engines and are widely used as
a prime mover for many applications such as marine diesel engine, marine
generators, stationary diesel engines and in the transportations. From this application, it is
find different forms in construction and maintenance. In the range of power more than 0.3
MW, marine and stationary diesel engines are close together in several parts.
3.1 Construction and performance
3.1.1 Marine diesel engines power plant
Basically, marine diesel engine can be divided into two main types. Large slow-speed direct
driven main engines operating exclusively on the two –stroke cycle and being of crosshead
construction. This category refers to engines operating at between 55 to 100 rpm.
Medium speed generally means between 400 and 1000 rpm, most of these are designed to
operate on the four-stroke cycle and are of trunk piston construction. They are much lighter
and smaller than equivalent slow-speed engines[4,5]. The disadvantage of use medium speed
diesel engine is that the engine must use a reduction gear. That means the reduction of cargo
space.
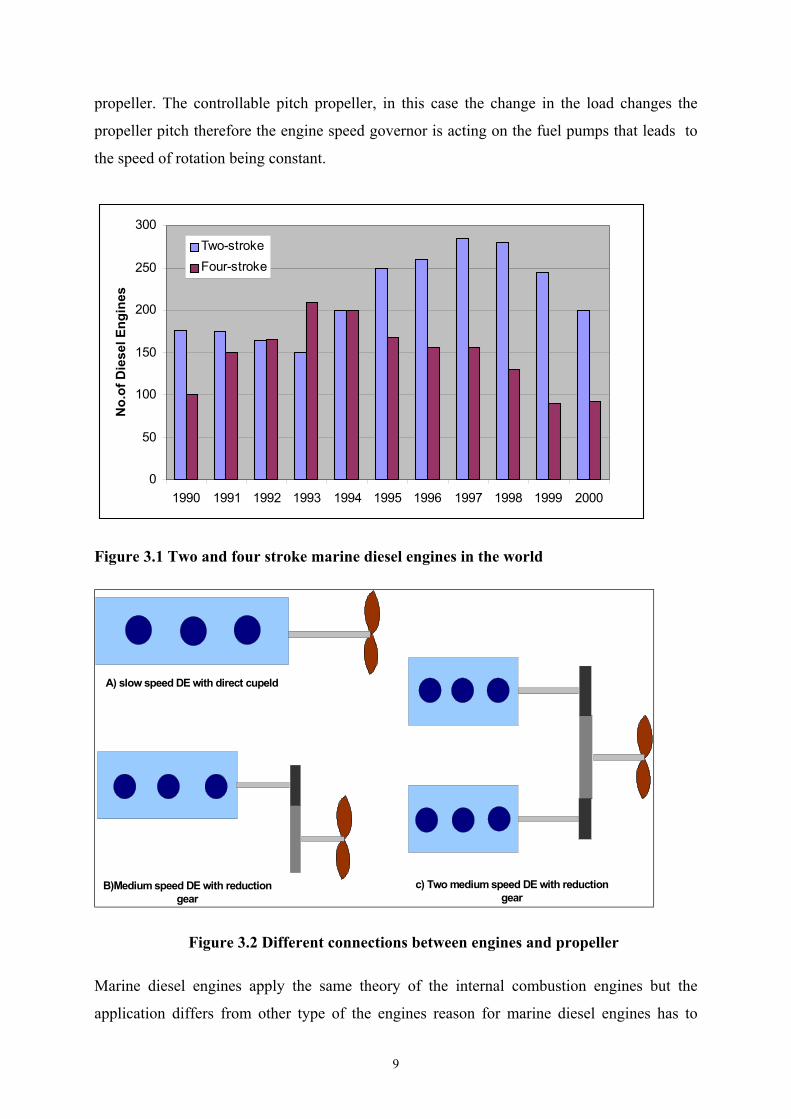
Figure 3.1 shows that the main production of diesel engines two and four stroke This figure
summaries the production of diesel engines in the world from 1990 to 2000 [10-17].
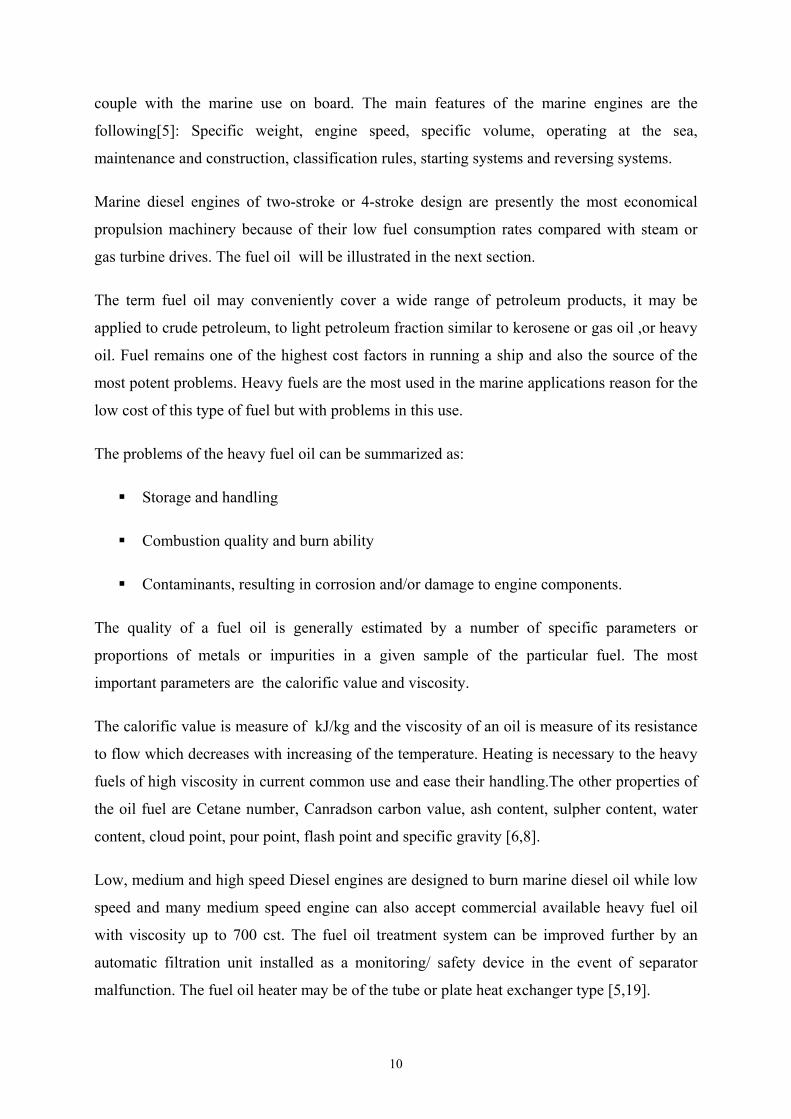
Figure3.2 shows the different connection between engine and propeller . The main difference
between the marine and stationary diesel engine is that the marine diesel operates at variable
speed depending on the load of the propeller and the type of this propeller such as fixed pitch
propeller or controllable pitch propeller. In case of fixed pitch propeller[3], power produced
by the engine under any condition must be at any time be equal to the power absorbed by the
D
9
propeller. The controllable pitch propeller, in this case the change in the load changes the
propeller pitch therefore the engine speed governor is acting on the fuel pumps that leads to
the speed of rotation being constant.
0
50
100
150
200
250
300
1990 1991 1992 1993 1994 1995 1996 1997 1998 1999 2000
No.
of D
iese
l Eng
ines
Two-strokeFour-stroke
Figure 3.1 Two and four stroke marine diesel engines in the world
A) slow speed DE with direct cupeld
B)Medium speed DE with reductiongear
c) Two medium speed DE with reductiongear
Figure 3.2 Different connections between engines and propeller
Marine diesel engines apply the same theory of the internal combustion engines but the
application differs from other type of the engines reason for marine diesel engines has to
10
couple with the marine use on board. The main features of the marine engines are the
following[5]: Specific weight, engine speed, specific volume, operating at the sea,
maintenance and construction, classification rules, starting systems and reversing systems.
Marine diesel engines of two-stroke or 4-stroke design are presently the most economical
propulsion machinery because of their low fuel consumption rates compared with steam or
gas turbine drives. The fuel oil will be illustrated in the next section.
The term fuel oil may conveniently cover a wide range of petroleum products, it may be
applied to crude petroleum, to light petroleum fraction similar to kerosene or gas oil ,or heavy
oil. Fuel remains one of the highest cost factors in running a ship and also the source of the
most potent problems. Heavy fuels are the most used in the marine applications reason for the
low cost of this type of fuel but with problems in this use.
The problems of the heavy fuel oil can be summarized as:
Storage and handling
Combustion quality and burn ability
Contaminants, resulting in corrosion and/or damage to engine components.
The quality of a fuel oil is generally estimated by a number of specific parameters or
proportions of metals or impurities in a given sample of the particular fuel. The most
important parameters are the calorific value and viscosity.
The calorific value is measure of kJ/kg and the viscosity of an oil is measure of its resistance
to flow which decreases with increasing of the temperature. Heating is necessary to the heavy
fuels of high viscosity in current common use and ease their handling.The other properties of
the oil fuel are Cetane number, Canradson carbon value, ash content, sulpher content, water
content, cloud point, pour point, flash point and specific gravity [6,8].
Low, medium and high speed Diesel engines are designed to burn marine diesel oil while low
speed and many medium speed engine can also accept commercial available heavy fuel oil
with viscosity up to 700 cst. The fuel oil treatment system can be improved further by an
automatic filtration unit installed as a monitoring/ safety device in the event of separator
malfunction. The fuel oil heater may be of the tube or plate heat exchanger type [5,19].

11
The recent development of marine propulsion systems for merchant ships has been mainly
influenced by the general energy situation and especially the costs, availability and quality of
marine fuels. Subsequently the fuel cost went up to about from 30 to 50% of the total
operating costs of merchant ships, in certain cases even higher. Due to this situation marine
engineering research works had been intensified and concentrated on reducing the necessary
propulsion power [ 21-22 ] and improving thermal efficiency [ 24 ].
The improving thermal efficiency of the marine diesel engine power plant can be done by the
following:
Improving the brake thermal efficiency
Waste heat recovery systems
The improving of the brake thermal efficiency can be done by improving the engine
performance such as improving the combustion efficiency, or increasing the compression
pressure. In the recent researches [25 ], the brake thermal efficiency is improved by using
long stroke engines. MAN-B&W diesel are now introducing a new generation of ship
propulsion engines with electronic injection and electronic control of all main parameters. The
new technology improves the fuel economy which improves thermal efficiency[26-27].
A considerable improvement of the overall diesel engine plant efficiency is achieved by waste
heat recovery. With an exhaust gas boiler a relatively high percentage of the exhaust gas
energy can be utilized for steam generation. Larger plants of this kind , as described for
example by Geisler and Gietzelt [7,9,21,22,28,29 ] in many research works not only provide
steam for heating purposes but also by means of turbo alternator ,the required electrical
energy for the ship’s operation.
The common utilized of the waste heat recovery can be done by:
1. Using part of the cooling water losses
The cooling water losses as mentioned before ranges between 20 to 30% of the total heat
added ,thus it is recommended to use part of this heat can be used for: Fresh water heating,
Air conditioning(use absorption refrigeration units ), Fresh water generation, Heating of fuel
and Domestic use of heating on board
2. Using the exhaust gas losses

12
The exhaust gas losses are mentioned before ranges between 25 to 35% of the total heat added
Exhaust gas boiler with natural circulation
This type of boilers is very simple and is generally used to produce steam for domestic uses
heating and services on board the ship, the most use of this boiler are the fire tube boilers
Exhaust gas boiler with forced circulation
This type of boilers is more complicated with forced circulation. The use of such boiler is to
produce steam not only for domestic use but also for power generation [18,20].
3.1.2 Electrical power generation on ships
To a great extent the total efficiency of a marine diesel engine plant also depends on the
economical generation and distribution of the electric energy on board. The following
different modes of power generation have therefore, been carefully investigated by [30]:
Heavy fuel operated diesel generators
Shaft generators
Exhaust gas boilers with turbo generators
A special problem in calculating the power demand is the rating of the time variant electrical
load resulting from discontinuous operation and load fluctuations of several units. So far the
load share of this units has been considered .
The measured course of the electrical load, shown in figure 3.3, indicates the range of time
variant power alterations on a container ship during different operation conditions. These
measurments carried by Geisler in TUHH [9] .
The shaft generators connection can be shown in figure 3.4, from this figure can be
summarized that the both cases a and b is used without reduction gears but the other two cases
use a reduction gears which increases the cost of installations . The reason for using shaft
generators is the economically point of view of the primary energy utilization. The
classifications of ship do not accepte the shaft generator as a main generator, only as an
auxiliary generators.
Figure 3.5 shows the exhaust gas boiler with turbo generator connected to the main engine.
This figure illustrated that the electric load generated on ship board need a complete steam

13
cycle which is not found in the stationary diesel electric power plant as mentioned in the next
sections.
0
100
200
300
400
500
0 10 20 30 40 50 60 70 80
duration of measurement (min)
elec
tric
load
(kW
)
turbo generatordiesel generator
Figure 3.3 Measured time –variant electric load on a container ship
M
M
M
M
A ) in s h a ft lin e
B ) o p p o s ite d riv e s id e
C ) th ro u g h g e a rin g in s h a ft lin e
D )th ro u g h g e a rin g in o p p s ite d riv e s id e
Figure3.4 Schema of shaft generators

14
Q lostE-1
M
Pum pCondenser
MainEngine
Propeller
Engine heatrecovery Q domestic heating
Turbine
Figure3.5 Exhaust gas boiler with turbo generator
Figure 3.6 shows that the heat recovery system can be economical for power generation at
about 15 MW main engine, where at power less than this range, the installation will not be
economical. At this power range the generated power from the waste heat recovery system
will be enough to cover the electric load requirements on the ship board. At main engine
power more than 19 MW ,the turbo generator develops excess power, this power can be used
for the propulsion of the ship.
0100200300400500600700800900
1000
0 5 10 15 20 25 30
Main engine power at MCR(MW)
Elec
tric
pow
er (k
W)
Required Pmin Required Pmax
Recovered Pmin Recovered pmax
Figure 3.6 Electric power recovered from exhaust gas for different ships

15
The operating costs for electric power generation depend , however, on the actual fuel oil
price. Thus the exhaust gas boiler/turbo generator system in use at a present certainly will not
be as economical as some years ago. Furthermore in many cases today the available exhaust
gas energy will not be sufficient for a single pressure exhaust gas boiler/generator system.
3.1.3 Stationary diesel engines power plant
In conventional power station only electric power is produced. The electric efficiency of
approximate 45% was obtained. The reminder waste heat is transferred to the environment. In
contrast ,in combined heat and power station ,the waste heat developed to use during the
generation of the electricity. Thus the overall efficiency increases up to 90% with total energy
systems (BHKW). They offer themselves everywhere, the requirement of electricity and heat
occurs at the same time.
An engine can operate with natural gas, liquid gas, diesel or rapes oil. Gas-diesel technology
allows to medium speed engines to be operated on heavy fuel and diesel oils, crude oil
directly from the well or natural gas[5,31]. Supply can be switched automatically from one
fuel to another with out shutdown. Conversions of existing engines from normal heavy fuel
mode to natural gas/diesel oil operation can be executed with small modifications[36,37].
Under certain conditions small combined heat and power can contribute to energy saving and
CO2 reduction[32]. Figure 3.7 shows that the comparison between the gas and diesel engine.
From this figure it can be notified that diesel engine has electric efficiency more than gas
engine but the thermal efficiency of gas engine is more. Figure 3.8 illustrates both thermal
and electrical efficiency of many engines of different loads[33-35].
The main features of the stationary electric generators which is generally medium speed diesel
engines and four stroke is the constant speed operation. Referring to the generator number of
pairs of poles , it can be found that the electric motor must run at 50, 25, 12.5 and 6.25 HZ in
the power net work in 50 HZ systems.

16
0
0,2
0,4
0,6
0,8
1
Diesel engine gas engine
engi
ne e
ffici
ency
(-)
El.efficiencyTh. Efficiencytotal efficiency
Figure 3.7 Efficiency comparison between diesel and gas engines (BHKW)
0
10
20
30
40
50
60
70
0 1000 2000 3000 4000 5000 6000 7000 8000
Engines electric loads (kW)
effic
ienc
y (-)
el. EfficiencyTh. Efficiency
Figure 3.8 Efficiency of engines total energy systems (BHKW)

17
3.2 Energy system efficiency
3.2.1 Heat balance
The power obtained from an engine is most frequently called brake power(Pbr) and shaft
power, delivered power or mechanical power. The total power actually delivered on the
pistons in the engine is called indicated power (Pin). The relation between the both powers
can be written as:
Pin =Pbr + Pfr (3.1)
The relation between the total delivered power and brake power can be written as:
in
brm P
P=η (3.2)
The electric power Pel as a function of fuel consumption can be also written as:
CV*mP
f
elel =η (3.3)
Therefore ,the electric power can be written as a function of heat added as:
Pel = CV * mf - Qlost (3.4)
The heat lost (Qlost )is a function of both cooling water and exhaust gas [38,39].
To increase the engine thermal efficiency, both cooling and exhaust losses should be used in
the power plant to produce heat or cooling load as investigated in chapter 5.
The relationship between heat added (Qadd) and the engine losses can be illustrated from
figure 3.9-a. From this figure, it can be notified that the Sankey diagram of an engine which
gives the useful electric load and the both effective exhaust and cooling energy.
The total thermal energy of an engine is around 82% as illustrated in the previous sections in
this chapter, The difference between added energy and the thermal energy is the lost energy
which is illustrated in Sankey diagram as Qlost.

18
Q e x
Q c w
Q lo s t
P e l
m f * C V
Figure 3.9-a Sankey diagram of diesel engine A heat balance is a necessary tool in the design of a marine power plant. Once the shaft
horsepower, engine losses, combustion conditions and basic cycle will be established in the
current study, a heat balance calculations can be made. From it, the various fuel, air, exhaust,
feed and condensate flows can be determined and used in selecting a suitable machinery and
equipment. Heat balance may also be prepared to determine optimum engine conditions and
cycle design or to analyze the performance of a power plant on both trials and service.
Heat balances should be a vital part of the economic evaluation of the power plant, many
variables such as fuels, loads and ambient conditions affect the calculation result.
The simple heat balance can be illustrated as:
fbth m*CV
BHP=η (3.5)
The remaining heat lost is the function of both cooling and exhaust losses can be written as:
radexcolfbthlost QQQCV*m*)(Q ++=−= η1 (3.6)
The cooling water losses heat (Qcol) will be:
colcolcol t*cw*mQ ∆= (3.7)
The exhaust losses heat (Qex) follows:
expexex t*c*mQ ∆= (3.8)
19
The radiation heat losses (Qrad) can be taken as a ratio of heat added to diesel engine range of
(2-5%). The heat balance depends on the type of diesel engine as well as the loading
conditions. The exhaust gas losses depends on the loading factor as well as the excess air
factor . In general the engine heat losses increase by reducing the loading of the engine as
shown in the previous section engine performance [21-24].
The exhaust gas losses represent about 30%of the total heat added. To improve the
performance of the diesel engine ,it should be use this gas losses. This gas losses weight is a
function of both fuel oil and air weight .The temperature of exhaust gases depend on the
engine type, it can be summarized this values as follows:
High speed diesel engine 330-600 °C
Medium speed diesel engine 300-400°C
The exhaust temperature of slow speed marine diesel engines are depend on the two or 4-
stroke engine. In general the exhaust gasses are used in a total energy system, which have a
high temperature content [40-42].
The low temperature rise of cooling water around 10 °C, make the use of cooling water to
produce steam for power generation is negligible. The cooling water losses as mentioned in
section 3.1.3ranges between 20 to 35 % of the total heat added. In marine diesel engines, it is
difficult to use this energy losses to improve the system efficiency in the normal conditions,
but in the stationary total energy system this energy used beside exhaust gas energy to operate
absorption heat pump. In chapter 5,this model can be investigated to produce cooling out of
engine heat losses[43-47].
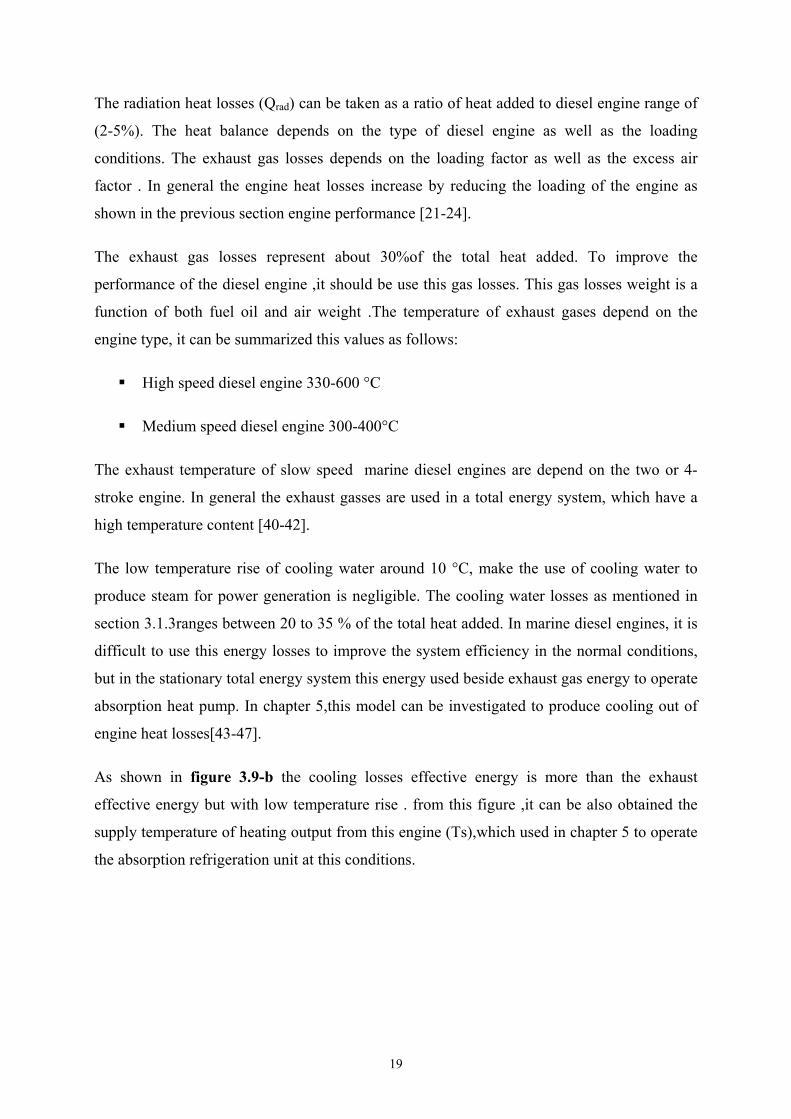
As shown in figure 3.9-b the cooling losses effective energy is more than the exhaust
effective energy but with low temperature rise . from this figure ,it can be also obtained the
supply temperature of heating output from this engine (Ts),which used in chapter 5 to operate
the absorption refrigeration unit at this conditions.
20
0
100
200
300
400
500
600
0 0,25 0,5 0,75 1
Engine heat gained (Q)
Tem
pera
tur (
°C)
Tex (H.speed)TcwTsTex (M.speed
Figure 3.9-b Engine exhaust and cooling water temperature
In conventional power stations 10% of the fuel input are lost in combustion, 59 % in cooling
towers or other cooling facilities,3% in transmission and only 28 % reach the consumer as
electrical power. Overall efficiency of total energy plant can be up to 85%.
The electric power generated from diesel engine as mentioned before around 40 % of the heat
added. The other 60% of the heat added is considered as waste heat in cooling and exhaust
losses. The system efficiency is improved by utilized the engine waste heat recovery system.
In the total energy system (BHKW) both cooling and exhaust losses are used. This system is
used to produce beside the electric load both heating and cooling by using absorption
refrigeration units[48-49] .
The efficiency of an energy unit supply should be analyzed in each individual case.
Cogeneration should not simultaneously result in the neglecting of economically prudent
rationalization of final energy consumption[32].
3.2.2 Standardized ambient temperature effect
Using diesel engines, electric efficiency can be changed by changing the ambient
temperatures referring to the designed engine performance. The engine electric efficiency
should be decreased by increasing ambient temperature.

21
Figure 3.10 shows that the affect of increasing of ambient temperature from 20 to 40 °C on
the standardized electric efficiency. It can be notified that the increase of the ambient
temperature from 20 to 30°C decrease the standardized electric efficiency from 1.0 to 0.975 at
the full load performance. The same effect can be obtain at the part load performance as
shown in the mentioned figure.
Figure 3.11 shows the performance of the standardized electric load, exhaust temperature and
exhaust gas weight at the study range of the ambient temperature. It can be from this figure
illustrated that both standardized electric load and exhaust weight decreases from 1 to0.94
and 0.96 respectively by increasing the ambient temperature from 20 to 40 °C but the
standardized exhaust gas temperature increases from 1 to1.04 by increasing the ambient
temperature. Both engine and solar collector performance changed by changing the weather
performance. Therefore, the change of the installation place of the plant causing the change of
the performance of the plant. Temperature control is a very important point, where the change
of the temperature produces a change of both engine and refrigeration units as illustrated in
the current study. It should be taken in our consideration that the place of the installations unit
where as affect on the performance. This factors will be study in chapter 5 with the total
energy system with solar collector and refrigeration units.
0
0,2
0,4
0,6
0,8
1
1,2
0 0,2 0,4 0,6 0,8 1 1,2
Engine Load (-)
Elec
tric
effi
cien
cy ra
tio η
/ηo
0 0,2 0,4 0,6 0,8 1 1,2
Ta=20Ta=30Ta=40
Figure 3.10 Standardized affect of ambient temperature on engine electric efficiency

22
0,8
0,85
0,9
0,95
1
1,05
1,1
20 25 30 35 40
Ambient temperature (°C)
Engi
ne p
erfo
rman
ce ra
tios
Pel/PeloTex/Texomex/mexo
Figure 3.11 Standardized affect of ambient temperature on engine electric load, exhaust
gas temperature and exhaust gas mass flow.
3.2.3 Part load performance
A two- stroke marine diesel engine(11MW) has been tested of the inflows scavenging and
constant pressure supercharging type in Technical University of Hamburg.
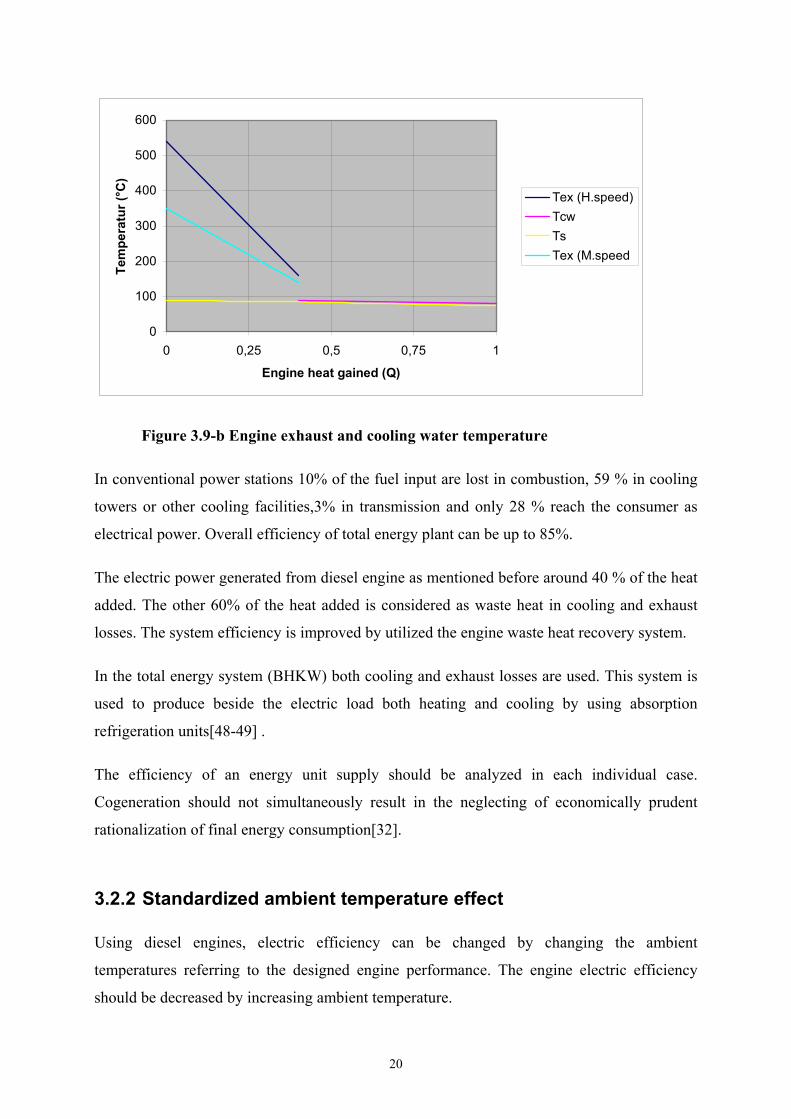
Figure 3.12-a shows that some of the result of this engine performance. It can be notified
from this figure that the engine rpm increases from82 to 110 by increasing the engine load
from 50 to 100% load and remain constant by increasing the engine load to 110% of the
maximum continuous rating load (MCR). Both the specific fuel consumption and the exhaust
gas temperature have the same behavior. The specific fuel consumption reduces from 190 to
180 g / kW.h by increasing the load from 50 to 75 %MCR but increases from 180 to 190 by
increasing the load to 110% MCR. The same result obtained for the exhaust gas temperature
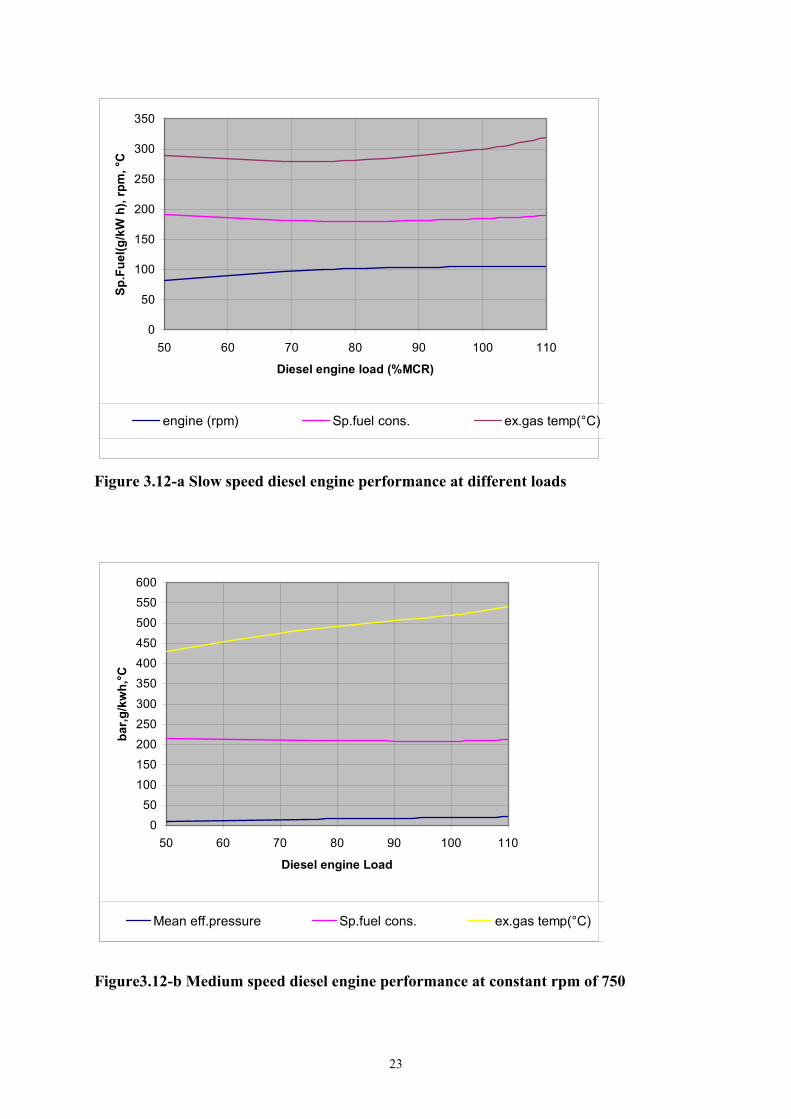
(290-280 and 320 °C). Figure 3.12-b shows the performance of medium speed diesel engines
at constant speed of 750 rpm.
23
0
50
100
150
200
250
300
350
50 60 70 80 90 100 110
Diesel engine load (%MCR)
Sp.F
uel(g
/kW
h),
rpm
, °C
engine (rpm) Sp.fuel cons. ex.gas temp(°C)
Figure 3.12-a Slow speed diesel engine performance at different loads
050
100150200250300350400450500550600
50 60 70 80 90 100 110
Diesel engine Load
bar,g
/kw
h,°C
Mean eff.pressure Sp.fuel cons. ex.gas temp(°C)
Figure3.12-b Medium speed diesel engine performance at constant rpm of 750

24
Figure 3.13 shows the diesel engine losses behavior at part loads . From this figure it can be
notified that the engine losses decreases from 1.6 to 1.4 for the first engine of Qex to Qcw of
1.4 and from o.9 to o.8 of the engine of ratio of losses 0.8. This two selected engines are
illustrated in chapter 5 and analyses both electric and fuel consumption at different loads
which are used to generat the cooling load with the use of absorption refrigeration units[9].
0,6
0,8
1
1,2
1,4
1,6
1,8
0,25 0,5 0,75 1
Engine load (-)
Coo
ling
to E
xhau
st ra
tio
Engine 1Engine 2
Figure 3.13 Diesel engines heat losses performance at part load

25
Chapter 4
Absorption Machine Simulation
4.1 Compression Cycle Performance
s illustrated in figure 4.1, the compression refrigeration cycle, the difference between
the compression refrigeration cycles and the absorption refrigeration cycle, is the
source of power. In compression systems, compressors activate the refrigerant by
compressing it to the higher pressure and higher temperature level after it has produced its
refrigeration effect. Figure 4.2 show that the performance of actual compression cycle shown
in figure 4.1, in this cycle it can be notified that the difference between the ambient
temperature and the evaporation temperature. The same difference is between the demand and
condensate temperature, the difference in two cases in the rang from 1 to 2 K.
T c o
T c u s .
T e v a p .
T a
Figure 4.1 Actual compression cooling unit with variable of both source and
sink Temperatures.
A
26
T
Q
T co
T cus
δ
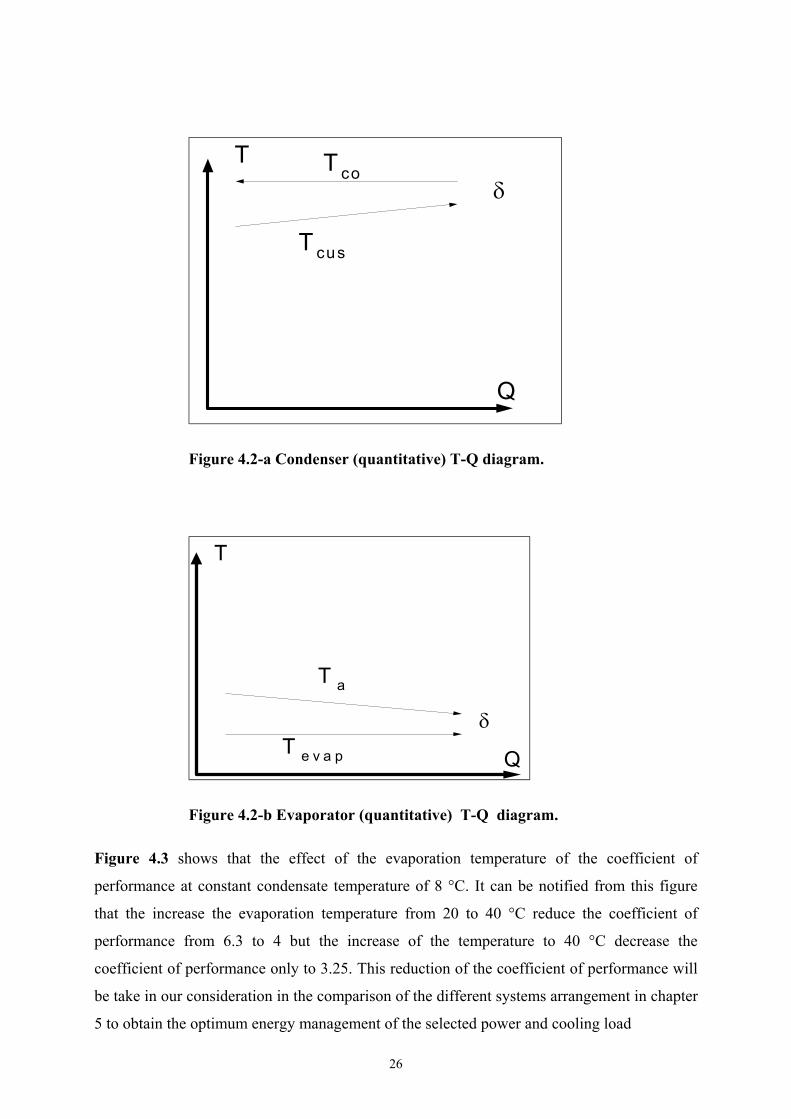
Figure 4.2-a Condenser (quantitative) T-Q diagram.
T
Q
T a
T e v a p
δ
Figure 4.2-b Evaporator (quantitative) T-Q diagram.
Figure 4.3 shows that the effect of the evaporation temperature of the coefficient of
performance at constant condensate temperature of 8 °C. It can be notified from this figure
that the increase the evaporation temperature from 20 to 40 °C reduce the coefficient of
performance from 6.3 to 4 but the increase of the temperature to 40 °C decrease the
coefficient of performance only to 3.25. This reduction of the coefficient of performance will
be take in our consideration in the comparison of the different systems arrangement in chapter
5 to obtain the optimum energy management of the selected power and cooling load

27
0
1
2
3
4
5
6
7
20 25 30 35 40
Evapouration temperature (°C)
Coe
ffice
nt o
f per
form
ance
(-)
Figure 4.3 Coefficient of performance of compression cooling unit at constant
condensate temperature of 8 °C
4.2 Absorption machine
4.2.1 Principle of operation
In the1950s and 1960s, both absorption chillers using steam as heat input to provide summer
cooling and centrifugal chillers driven by electric motors were widely used in central
refrigeration plants but the absorption process of producing cooling was first discovered by
Faraday in 1824[ 71].
After the energy crisis in 1973,the price of the natural gas and oil used to fuel steam boilers
drastically increased. The earliest single-stage indirect fired steam absorption chillers had a
coefficient of performance of only 0.6 to 0.7.They required more energy and could not
complete with electric centrifugal chillers. Many absorption chillers were replaced by
centrifugal chillers in the late 1970s and 1980s. In recent years two- stage direct fired
absorption chillers have been developed with a good coefficient of performance[72,73].
In many plants and buildings a ready supply of steam or hot flue gases are available as a by-
product of some process or as used capacity of heating system which is inoperative in off-
seasons. Absorption refrigeration systems have enjoyed renewed and growing in recent years

28
due to their potential in heat pumping applications such as refrigeration, heating and air
conditioning [77-80]. The essential difference between absorption and vapor -compression heat pump is that the
absorption systems converts heat of a given temperature to heat of another temperature
without any intermediate use of work as shown in figure (4.1). Absorption units used heat
rather than mechanical energy to produce cooling. Heat sources can be a number of types
including solar, natural gas, steam, hot water, or electrical energy [74,75,80].
4.2.2 Advantages of absorption refrigeration
The advantages of using absorption refrigeration units include the flowing:
1) Environment : Absorption units use refrigerants that have a zero ozone-depletion
factor
2) Power : units use heat rather than electrical energy, and therefore can be added
without increasing the power load which could be too expensive or impractical ,as in
the present study in chapter fife.
3) Service : Absorption units have few moving parts only.
4) Operating Cost : In areas where the ratio of gas cost to electrical cost is favorable,
units are purchased based on a lower operating cost.
In most areas, the larger sizes are more advantages than the smaller sizes. the
characteristics that make absorption units less attractive are:
1) absorption units are heavier than electric units of the same capacity.
2) Absorption unit costs more than electric unit having the same capacity.
4.2.3 A single- stage absorption refrigeration unit
Constant cold water temperature of 6/12 °C are considered in many studies, such as the
researches by FFI and institute of energy technology in Lower Saxony are carried by
Baumann[82], Gietzelt [83-84] and Kruse [89-90]. Utesch [85] studied the use of natural gas
performance with absorption cooling units and the advantages of use Li/Br pairs with block

29
heat and power plants and Ewe [86] studied the total energy systems (BHKW) powered by
absorption cooling units for the cooling of a sheet fed offset printing machine. Dittman [87-
88] studied the performance, restriction and the chance to use the absorption cooling units.
The performance and design of small single effect absorption chiller units for district heating
system are analyzed for the ambient temperature range only 29 to 32 °C, the maximum
coefficient of performance of 0.56 [89,90].Sager [91] studied the integration of absorption
refrigeration plants in district heating substations, but Margen [92] studied the developments
of the concept of the production of cooling energy district heat driven absorption chillers in
Sweden . Temperature control of district heating and cooling systems with absorption chiller
units are studied by Saether [93].Greiter [94] studied a 500 kW absorption heat pump for
heating at two temperature levels , Alefeld , Ziemann , Ahachad, Berkner and Salvako [95-99]
studied the absorption heat transformer applications to absorption refrigeration machine.
Figure 4.4 shows that the single-stage absorption refrigeration system which consists of
condenser, generator, evaporator and absorber. The high pressure level contains condenser
and generator and the low pressure level contains evaporator and absorber.
Condenser Generator
Evaporator Absorber
Qco
QeQex
Qh
P
Figure 4.4 principle of single-stage absorption refrigeration machine

30
4.2.4 Two Stage Absorption Refrigeration Unit
Langel and Schweigler [100,101] studied cold out of heat with use the two-stage absorption
refrigeration maschine. Xiaosng [102] studied the development of hest pump and Kahn [103]
studied an ammonia-water absorption cycle with high temperature lift. Bassios and Mohamed
[104,105] studied a 250 kW absorption pump with gas fired, thermal energy storage and co-
generation, Schwenger [106] and Baksas [107] studied absorption heat pumps and high
temperature absorption /compression heat pump for industrial waste heat. The use of
ammonia water pairs are only in the case of single effect refrigerator. Ustsch [85] represented
the advantages to use Lithium /Bromide in block heat and power system with single and
double effect and illustrated the disadvantages to use Ammonia water by the higher effect
stages absorption refrigeration systems.
In the current work, from this literature review, Lithium /Bromide water are the used pairs as
a refrigerant in single and two stage absorption with the range of supply and return
temperature of 8/12°C.
The use of two-stage absorption refrigeration unit is more efficient than a single-stage one
,while the possibility to use the lower supply temperature. Figure (4.5) shows the diagram of
the two-stage cycle which includes an absorber, an evaporator, a condenser, high pressure
generator, low pressure generator and solution pump.
Qex
Condenser H. P:Generator
Evaporator L.P. Absorber
5
Qco
H.P. Absorber L.P. Generator
Qh
Qe
P
P
Figure 4.5 Principle of two-stage absorption refrigeration machine

31
4.2.5 Heat balance
Heat is supplied from a high –temperature heat source and from a low temperature heat
source, and all this heat is released to a medium temperature heat sink. The heat flows of
generalized absorption cycle are shown in figure 4.5.
As shown in figure 4.6, the top part of the unit is the driving cycle, where heat is supplied to
the generator to boil off refrigerant that considered in the condenser. The main heat exchanges
with the environment are :
High temperature heat source (generator)
Medium-temperature heat sink (absorber and condenser)
Low temperature heat source (evaporator)
Hot water/steam
Qg
Qab
Cooling tower
Qco
Qe
Chilled water
Figure 4.6 Heat flows of an absorption cycle
By applying the first law of thermodynamics, The heat balance is:
abcoge QQQQ +=+ (4.1)

32
If the second law of thermodynamics is applied, the total generation of entropy will be zero as
in the case of ideal cycle:
ab
ab
co
co
g
g
e
e
TQ
TQ
T
Q
TQ
+=+ (4.2)
By the following assumptions[ 76,109,110]are:
Saturated liquid specific heat is negligible
Heat of evaporator is constant
Refrigerant expansion is isotropic; and
Superheated vapor specific heat is negligible
Then the vapor heat will be equal to the condenser heat
coe QQ = (4.3)
from equations 4.1 and 4.3 the absorber heat will equal to the generator heat
gab QQ = (4.4)
The coefficient of the performance can be written as:
g
e
COP = (4.5)
from the last three equations ,the coefficient of performance as a function of the four
temperature can be written as[76]:
coe
gab
TT
TTCOP 11
11
−
−
= (4.6)
In many studies by Alefeld and others [75-80]have been to assume that the absorber and
condenser have the same temperature, therefore the last equation can be simplified as:

33
eab
e
g
abg
TTT
*T
TTCOP
−
−= (4.7)
Therfore, it can be written the coficient of performance as:
carnotcarnot *COPCOP η= (4.8)
From the previous equation, it can be concluded that the coefficient of performance of
absorption refrigeration unit are dependent on Carnot efficiency and compression
refrigeration cycle operated at the same levels of temperature, that means coefficient of
performance of absorption should be less than compression refrigeration one.
4.2.6 Working Pairs in Absorption Refrigeration Units
The working fluid pairs to be used must be selected on the bases of the suitability under the
conditions in question, e.g. its thermodynamic performance, chemical and thermal stability
and toxicity[85,95].Examples of working fluid pairs and applications which have already been
extensively developed are as follows:
a)Aqua- ammonia has found application in air conditioning and refrigeration, Ammonia is the
cooling agent and water the solvent. The performance value of the process dependent on the
temperature, with temperature level arrive to (- 45 °C). The main area of utilization of
ammonia water was the large scale use in MW-area.
b)Aqua ammonia – hydrogen combination has found application domestic refrigerators
c)Aqua-LiBr solution has found application for domestic and commercial air-conditioning, a
performance value of 0.65 (single stage) and 1.10(two stage) can be reached the required
heating temperature lies between 90 and 115 °C the small temperature level arrive to (6 °C).
One of the two types of absorption chillers is normally applied, mostly depending on the
required cooling temperature[76]:
a. for cooling temperature more than 5 °C, water/LiBr absorption machine is
most frequently used, which must be water-cooled.
b. An ammonia /water machine can be used for cooling temperature less than 5
°C. It can be either air or water-cooled.

34
According to Perez. Blanco, the thermodynamic properties of a pair used in an absorption
cooling unit are[76,81]:
• high latent heat of vaporization of refrigerant,
• low vapor pressure of the refrigerant but above atmospheric level,
• heat mixing or reaction is low or negative,
• low sensible heat capacity of absorbent solutions compared to the latent heat of the
refrigerant,
• no crystallization or freezing with in the range of operating conditions,
• high solubility of refrigerant in the absorber .
The classification of absorption refrigerators and heat pump represented in [107] are shown in
table 4.1, from this table, it can be illustrated that the mostly use of refrigerant pairs is water
Lithium Bromide for both single and double effect
Classification Cooling Heating H2O LiBr NH3 H2O
Single effect __________ Chiller
Double effect __________
Single effect Without
Abs. cycle
Refrigerator
Chiller/Heater
double effect Without
Abs. cycle
_________
Chiller/Heater double effect Single effect __________
___________ Single effect __________ Heat Amplifier
___________ double effect __________
Heat pump
HeatTransformer ___________ Single effect __________
Table 4.1 Absorption machines for heating and cooling

35
The way energy is managed has major impact on environment. The combined heat and power
plays an important role by promoting further development for combined heat and power
systems. Sorption machines have gained increased interest in the recent decades. Sorption
systems are not only viewed as energy efficient cooling and heating methods when installed
in a properly systems but also as environmentally alternative to CFC,HFC or HCFC based
technology. Sorption systems can use almost any heat source, including cogeneration systems
power plants and solar energy systems [76,108]., as in the case of the current work use
absorption refrigeration systems cogeneration with diesel power plant and solar collectors,
will be illustrated in chapter 5.
4.2.7 Coefficient of performance
The coefficient of performance for a single –stage absorption refrigeration unit at various
supply and ambient temperatures are shown in figure 4.4. In this figure ,it can be noticed
that the increasing of the ambient temperature decreasing the coefficient of performance and
the same effect of the coefficient of performance with the supply temperatures.
Figure 4.7 shows the relation between the coefficient of performance and the chilled water
supply temperature at various of the ambient temperatures. The range of the coefficient of
performance in this type located between (0.25 and 0.5) lower than the coefficient of
performance of a single-stage unit, but the advantages is the use of low supply temperature
which is located between (55 and 100 °C).
Figure 4.8 shows that the relation between the temperature difference and the inlet
temperature at various ambient temperature. The temperature difference in this case is greater
than the case of a single-stage one which in the range of (18 to 50 k ) at 20 °C and 40 °C
ambient temperature respectively.

36
0,2
0,4
0,6
0,8
1
60 80 100 120 140
supply temperature(°C)
Cof
ficie
nt o
f per
form
ance
cop
(-)
Tkw=20 Tkw=25 Tkw=30 Tkw=35 Tkw=40
Figure4.7 Coefficient of performance of both single and two-stage absorption
refrigeration machines
0
10
20
30
40
50
60
60 70 80 90 100 110 120 130
Supplay Temperature (°C)
Tem
pera
ture
diff
renc
e (k
)
Tkw=20 Tkw=25 Tkw=30 Tkw=35 Tkw=40
Figure 4.8 Temperature difference Comparison between single and two-stage absorption
refrigeration machines
Single-stage
Two-stage
Two-stage
Single-stage

37
Chapter 5
Combined Power – Cold Plant - A Parametric Analysis
5.1 Reference system
It is aimed here to demonstrate the behavior of the compression cooling units connected to the
electric power station. In order to compare the fuel utilized in the electric power stations
results obtained in the next three cases . The cooling load was supplied with compression
refrigeration unit, the electric load demand in this refrigeration unit, can be obtained from the
stationary power station in the range of 150 to 300 MW.
The electric load delivered from the power station can be written as:
CV*m*P fppel η= (5.1)
Qc
ηPP
CRUPel,c
ηtr Pel,dPEel
PEc
Figure 5.1 Primary energy supplied to both power station and compression refrigeration
unit (CRU)
38
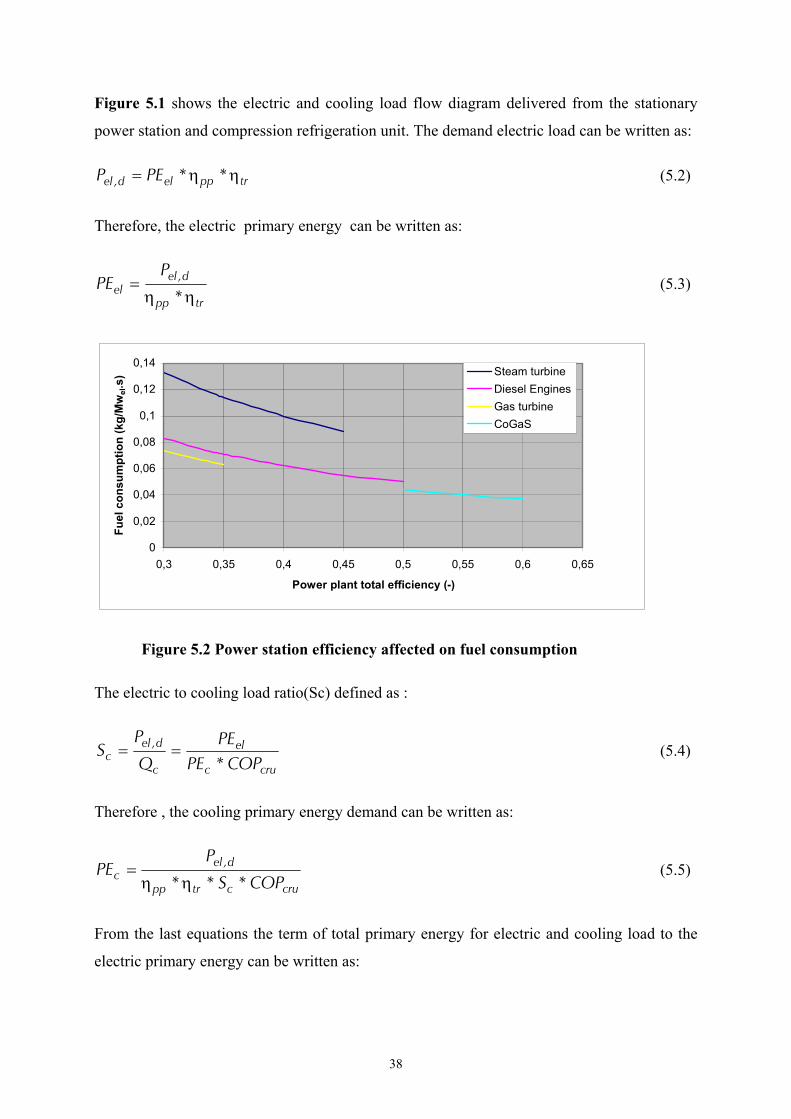
Figure 5.1 shows the electric and cooling load flow diagram delivered from the stationary
power station and compression refrigeration unit. The demand electric load can be written as:
trppeld,el **PEP ηη= (5.2)
Therefore, the electric primary energy can be written as:
trpp
d,elel *
PPE
ηη= (5.3)
0
0,02
0,04
0,06
0,08
0,1
0,12
0,14
0,3 0,35 0,4 0,45 0,5 0,55 0,6 0,65
Power plant total efficiency (-)
Fuel
con
sum
ptio
n (k
g/M
wel
.s) Steam turbine
Diesel EnginesGas turbineCoGaS
Figure 5.2 Power station efficiency affected on fuel consumption
The electric to cooling load ratio(Sc) defined as :
cruc
el
c
d,elc COP*PE
PEQ
PS == (5.4)
Therefore , the cooling primary energy demand can be written as:
cructrpp
d,elc COP*S**
PPE
ηη= (5.5)
From the last equations the term of total primary energy for electric and cooling load to the
electric primary energy can be written as:

39
)COP*S
(PE
PEPE
crucel
cel 11+=
+ (5.6)
The study of the compression cooling load will be discussed for two cases namely power
station and Diesel power plant. The estimation of the fuel utilized in the case of steam power
station used coal as a fuel will be calculated at electric efficiency varied from 0.3 to 0.45 and
in the case of gas and steam power station used gas as a fuel will be estimated at electric
efficiency varied from 0.3 to 0.35 for gas turbine power station and from 0.5 to 0.6 for
combined gas and steam power station. The Diesel engine power station will be taken in the
range of 0.3to0.5. The different primary energy can be illustrated in figure 5.2. The
coefficient of performance of the compression cooling unit used in this section is varied from
3 to 6.
It can be notified that the power station efficiency depend upon ambient temperature . In the
case of steam power station, the ambient temperature affected on the condenser pressure. The
increase in ambient temperature of 10 K decreases the efficiency around 3%. In the case of
gas turbine, ambient temperature affected on the compressor performance. The increase of
ambient temperature of 10 K decreases the efficiency around 5%. The same effect can be
notified in the case of combined gas and steam power station (CoGaS). In Diesel engines, the
ambient temperature affected on the air flow rate, the engine efficiency decreases around 2%
by increases the air temperature of 10K.
1
1,2
1,4
1,6
1,8
2
2,2
0 0,5 1 1,5 2 2,5 3
(Cooling/electric )load (1/Sc)
(PE e
l+PE
c)/PE
el (-
)
COP)CRU=3COP)CRU=4COP)CRU=5COP)CRU=6
40
Figure 5.3 primary energy ratio as a function of both coefficient of performance
(COPcru) and cold to power ratio (Sc)
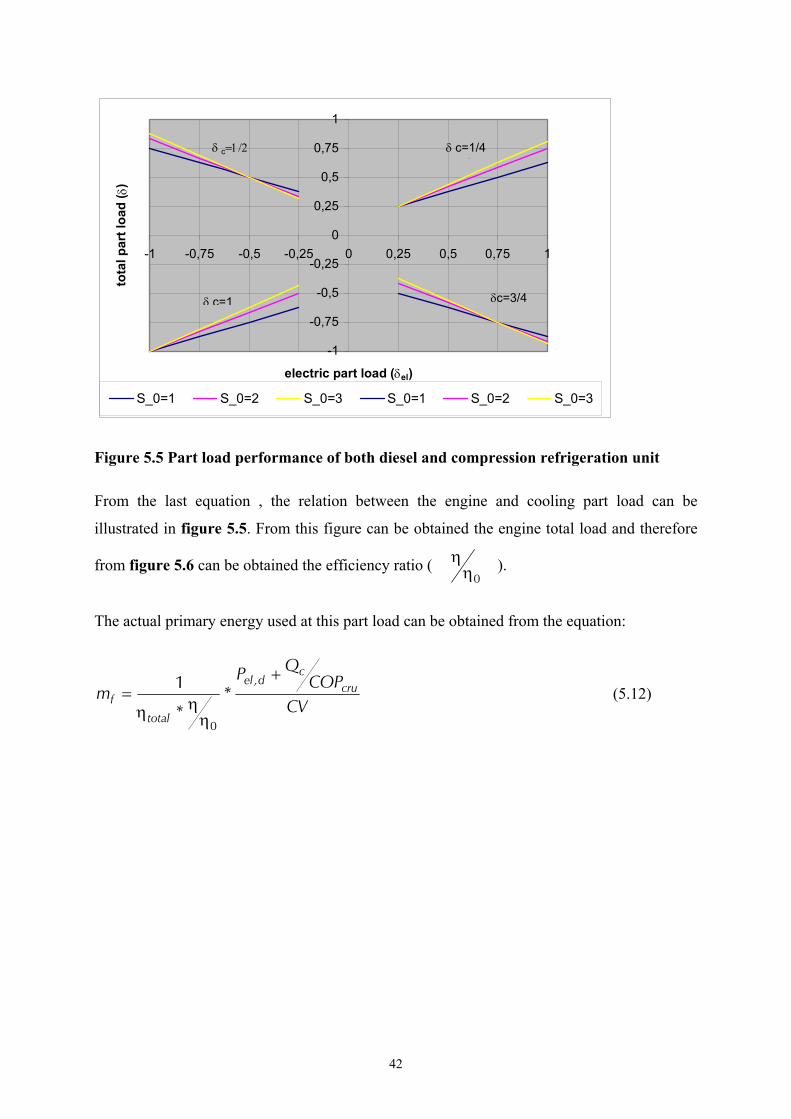
Figure 5.3 represents the fuel utilized ratio of both electric and cooling load to fuel utilized
to electric load against the variation of the cold – power ratio at different compression
coefficient of performance. It can be notified that the maximum fuel consumption ratio of
2.00 can be decreased to 1.33 by increasing the coefficient of performance from 3 to 6 . the
minimum value at ratio of 0 that means the total electric regenerated used as a power load as
shown in this figure.
5.2 Diesel power plant
5.2.1 Diesel engine and compression cooling unit
In this section , Diesel engine connected with the same compression cooling units in the
previous section will be analyzed and studied. The main difference between the diesel power
plant and the stationary power plant discussed in the last section that the performance at part
load. The engine performance at part load change the performance efficiency . That is the
reason for analyzing the next equations.
The full load performance of the engine to produce both electric and cooling load can be
defined as (X0 ) and can be written as:
X0=X10+X20 (5.7)
Where
X10 = Pel,,d and the electric load in this case:
X20= Qc / COPcru
Therefore the cold- power ratio at full load can be written as:
cruCOP*
XX
S1
20
100 = (5.8)
The cold- power ratio at part load can be written as:

41
cruCOP*
XX
S1
2
1= (5.9)
From figure 5.4, it can be defined the total part load as:
2010
21
XXXX
++
=δ (5.10)
Therefore the total engine load as a function of both power and cold load can be written as:
10
0
++
=S*S cel δδ
δ (5.11)
X 1 0 X 2 0
X 1 X 2
F u l l l o a d = X 1 0 + X 2 0
P a r t l o a d = X 1 + X 2
Figure 5.4 Part load chart of total engine plant
42
-1
-0,75
-0,5
-0,25
0
0,25
0,5
0,75
1
-1 -0,75 -0,5 -0,25 0 0,25 0,5 0,75 1
electric part load (δel)
tota
l par
t loa
d ( δ
)
S_0=1 S_0=2 S_0=3 S_0=1 S_0=2 S_0=3
δ c=1/2 δ c=1/4 /
δ c=1 δc=3/4
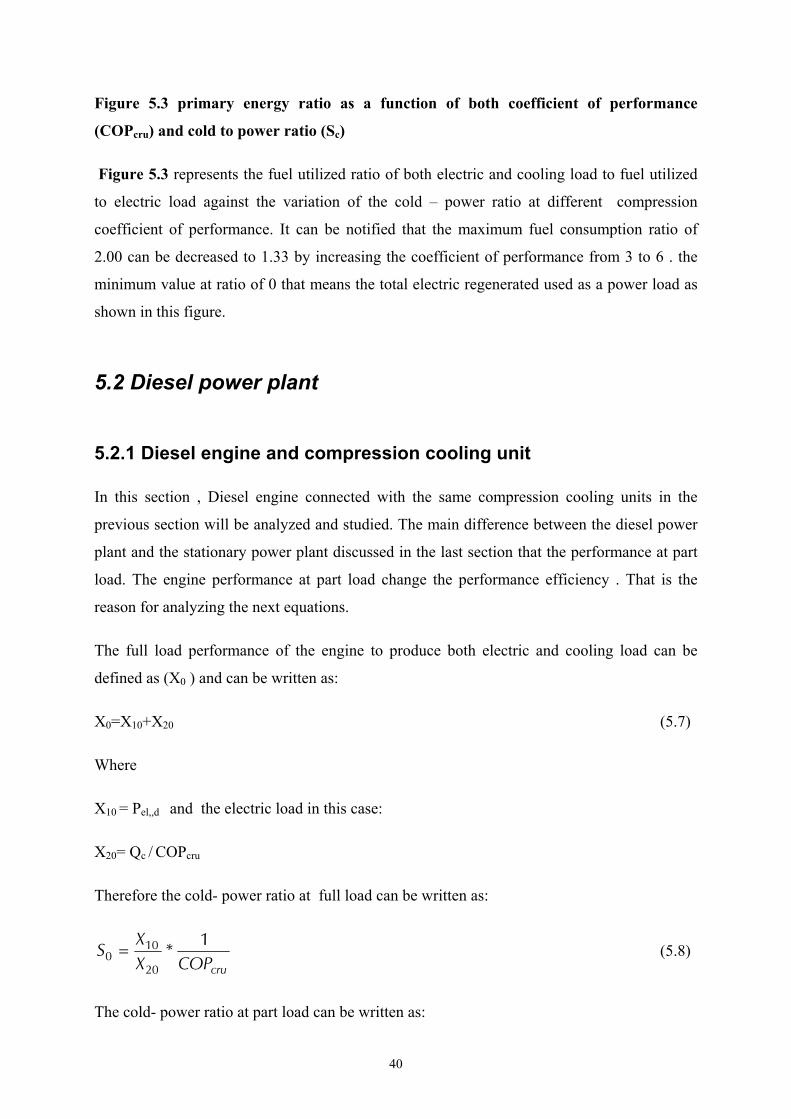
Figure 5.5 Part load performance of both diesel and compression refrigeration unit
From the last equation , the relation between the engine and cooling part load can be
illustrated in figure 5.5. From this figure can be obtained the engine total load and therefore
from figure 5.6 can be obtained the efficiency ratio ( 0η
η ).
The actual primary energy used at this part load can be obtained from the equation:
CVCOP
QP*
*m cru
cd,el
total
f
+=
0
1
ηηη
(5.12)

43
0,7
0,75
0,8
0,85
0,9
0,95
1
1,05
0,2 0,4 0,6 0,8 1
Engine load (δ)
Effic
ienc
y ra
tio ( η
/η0)
Figure 5.6 Efficiency ratio of diesel engine part load performance
The cooling and electric load are the same at 350 and 400 kW respectively as the case of the
electric power stations . It can be obtained from the last three figures the performance at full
load which has (1/S0) of 0.875 ,this load at the day performance. At the night performance
which operated at engine part load both the engine power and the cooling load operate at
difference part loads as discussed in the last figures.
The night part load will be chosen as:
The engine electric load is 240 kW
The cooling load of 100 kW
From these loads it can be obtained both part load of power as( 60.el =δ ) and the cooling
part load ( 2860.c =δ ) from this values and figure 5.4 ,it can be obtained the total part load
performance of (0.44 ,0.495 and 0.52) at the cooling – power ratio (1/S0) of (1 ,2 and 3)
respectively. From figure 5.6, it can be obtained the range of efficiency ratio from 0.92 to
0.945) and therefore from equation (5.11) can be also obtained the range of primary energy
used at this part load case of range from (0.0233 to 0.0240 kg/MWel.s).
The relation between engine losses and heat added to the diesel engine can be expressed as a
function of fuel consumption and calorific value were be discussed in chapter 3.
44
The full load performance of both reference and diesel power plant with compression
refrigeration units can be summarized as:
Reference system primary energy utilized is 0.0244 kg/s
Diesel engine primary energy utilized is 0.0400 kg/s
The part load performance of 240 kW electric and 100 kW cooling can be obtained from both
reference system and diesel engine as:
Reference system primary energy utilized is 0.0132 kg/s
Diesel engine primary energy utilized is 0.0233 kg/s
The effective cooling water losses and exhaust losses Qcw and Qex as combined to heat losses
Qh. The heat balance depends on the type of the engine as well as the engine load. Generally,
both cooling losses and exhaust losses increase by decreasing the engine load. It is important
here to study the effect of the different engines on the performance of the absorption cooling
units. The selected engines in this study has a different cooling to exhaust losses ratio. The
first group of engines involves a cooling to exhaust ratio of 2:3, the second group involves the
ratio of 1:1 but the third group has a ratio of 3:2. It is assumed that the cooling machines are
constant when operate with the three groups of engines to study the effect of temperature
difference supply and return temperature on both cooling water losses and average one.
5.2.2 Diesel engine and absorption cooling unit
In this section, the performance of single and double-stage absorption cooling units connected
to Diesel engines as shown in figure 5.7 will be studied. The demand cooling load will be
changed from 200 to 400 kW. Because of the high complexity of the problem, the effective
heat balance ratios will be fixed in this section at ηel = 0.3 , ηex = 0.225 and ηcw = 0.3 .The
ambient temperature and the absorption cooling units type will be the parameters under
consideration . The effect of changing effective heat balance ratios (Sankey diagrams) will be
discussed in the later sections in this chapter. It is a very complex aim to investigate the all
parameters affecting in the plant in one study. A detailed study is required to determine the
temperatures and maximum coefficient of performance of the named system to obtain an
optimal system for fuel utilization. Normally heating supply temperatures are varied in the
summer and winter time. The temperature control of the heating systems is very important

45
point, when the system operated at constant temperature process as the case of the two-stage
absorption cooling units.
ARUT sT b
T cw,inTcw,b T exh,1
Texh,2
Pel
=Ts+δ
Figure 5.7 An absorption cooling unit connected to diesel engine system
The main difference between ARU and CRU that in the case of ARU the cooling load depend
up on the electric load Figure 5.8 shows that the Sankey diagram operation of both diesel
engine and absorption cooling unit The fuel utilized in this figure can be divided in two loads
Electric and cooling load .Therefore, it will be obtained from figure 5.9 three cases between
engine load and cooling load. In this figure it is assumed that the main demand is the cooling
load. In the first case the engine developed both electric and cooling loads, in the second case
the engine electric load is less than the demand electric load in this case the rest electric load
can be obtained directly from the power station and in the third case the engine developed
excess electric load ,it can be transferred to the power station .
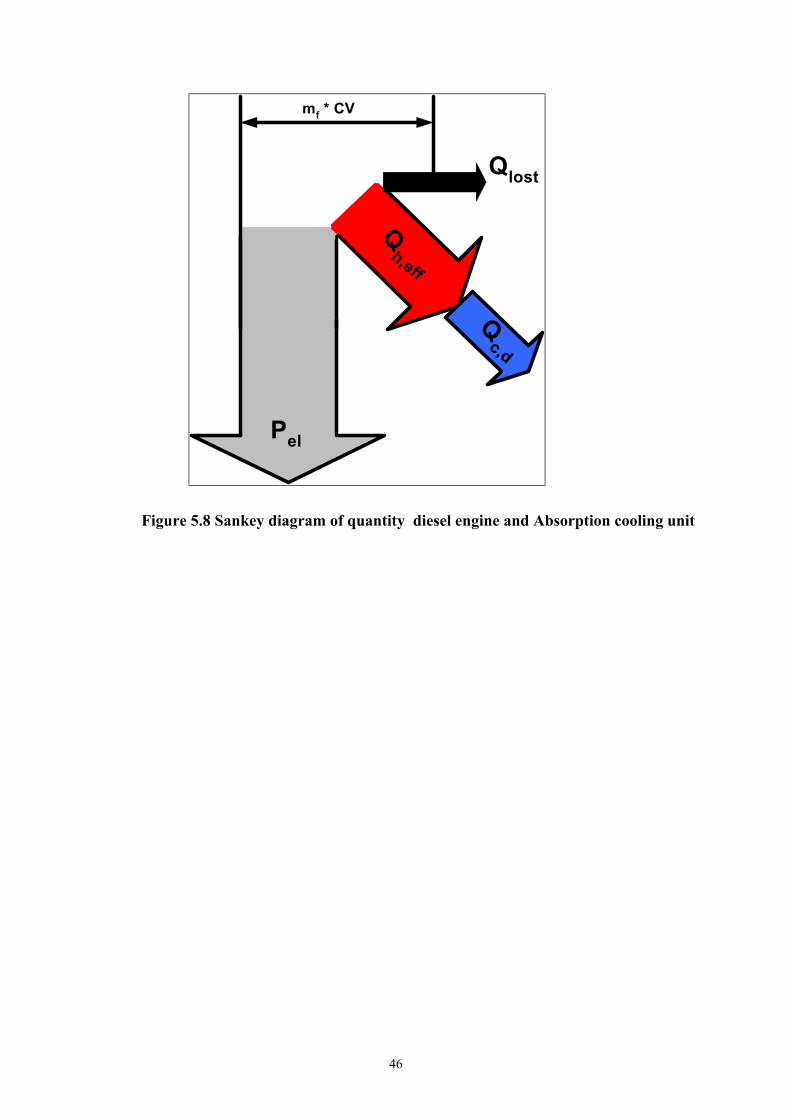
46
Qlost
Pel
mf * CV
Qh,eff
Qc,d
Figure 5.8 Sankey diagram of quantity diesel engine and Absorption cooling unit

47
I
II
III-a
III-b
Pel,de Qh,eff
Pel,d=Pel,de Qc,d
Pel,d<Pel,de Qc,d
Qc,dPel,d>Pel,de
COP
Qc,dPel,dePel,t-out
Sc,o
Sc<Sc,0
Sc>Sc,o
Figure 5.9 constant cooling load with difference electric engine loads (III-a Net work
take out, II Network feed-in)
To discuss this three customers possibility can be difference engine to select to compare the
different cases.
The fuel utilization ratio for heating can be written as follows:
h
elh Q
PS = (5.12)
and the fuel utilization ratio for cooling can be written as follows :

48
c
elc Q
PS = (5.13)
To illustrate the difference engine performance the fuel ratio of cooling can be written as:
effaru
d,elc *COPS
η
η= (5.14)
Figure 5.10 shows that the performance of diesel-absorption systems with different power-
cooling ratio, which affected on the engine electric loads. From this figure ,it can be obtained
that in case I the engine electric load and cooling load were equal to the demand loads. This is
an ideal case and difficult to obtained for different load performance day and night. The case
II which occurred diesel electric load more than the demand electric load this difference of
power can be feed- in network. In case III the demand electric load is more than the engine
load ,in this case the difference power can be taken out network and the comparison with
reference system was illustrated in figure 5.11.
Sco
IIIII
Qc,d=Qc,de
Pel,d <Pel,de
Netw
orkfeed-in
Pel,de -Pel,d
Qc,d=Qc,de
Pel,d >Pel,de
Netw
orkTake-out
Pel,d -Pel,de
I Sc
Figure 5.10 The affect of power –cooling ratio on the performance of both diesel
and network power station
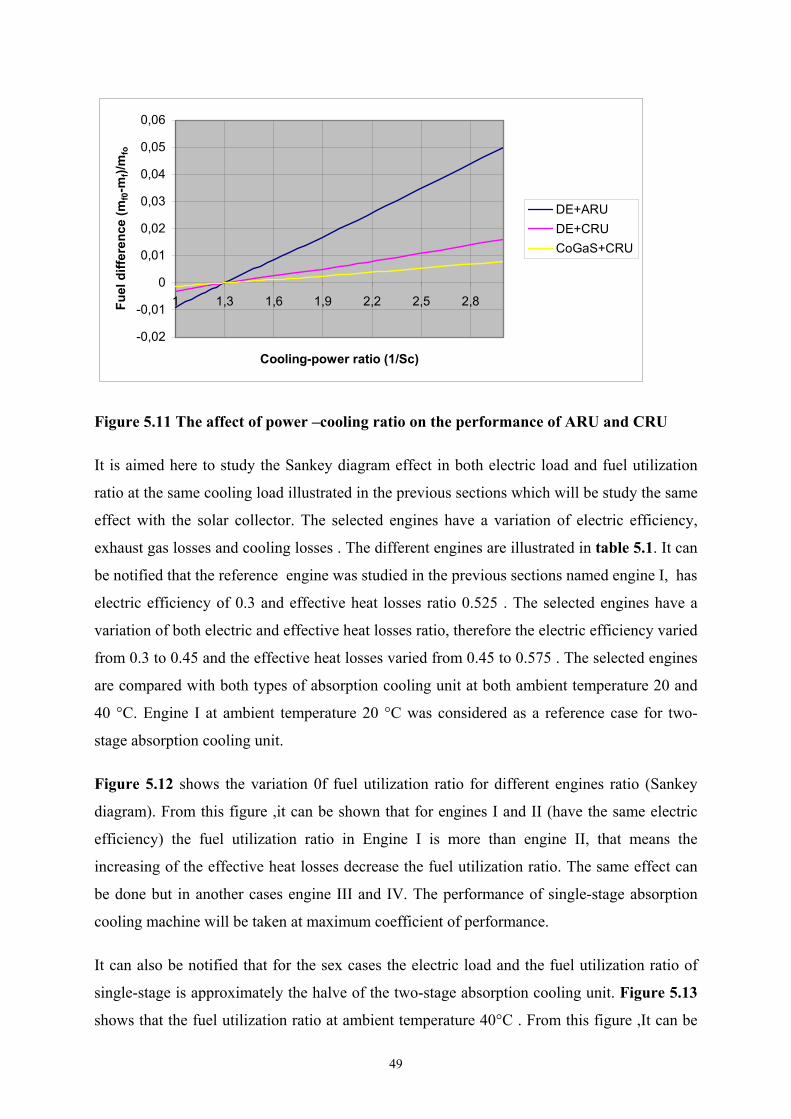
49
-0,02
-0,01
0
0,01
0,02
0,03
0,04
0,05
0,06
1 1,3 1,6 1,9 2,2 2,5 2,8
Cooling-power ratio (1/Sc)
Fuel
diff
eren
ce (m
f0-m
f)/m
fo
DE+ARUDE+CRUCoGaS+CRU
Figure 5.11 The affect of power –cooling ratio on the performance of ARU and CRU
It is aimed here to study the Sankey diagram effect in both electric load and fuel utilization
ratio at the same cooling load illustrated in the previous sections which will be study the same
effect with the solar collector. The selected engines have a variation of electric efficiency,
exhaust gas losses and cooling losses . The different engines are illustrated in table 5.1. It can
be notified that the reference engine was studied in the previous sections named engine I, has
electric efficiency of 0.3 and effective heat losses ratio 0.525 . The selected engines have a
variation of both electric and effective heat losses ratio, therefore the electric efficiency varied
from 0.3 to 0.45 and the effective heat losses varied from 0.45 to 0.575 . The selected engines
are compared with both types of absorption cooling unit at both ambient temperature 20 and
40 °C. Engine I at ambient temperature 20 °C was considered as a reference case for two-
stage absorption cooling unit.
Figure 5.12 shows the variation 0f fuel utilization ratio for different engines ratio (Sankey
diagram). From this figure ,it can be shown that for engines I and II (have the same electric
efficiency) the fuel utilization ratio in Engine I is more than engine II, that means the
increasing of the effective heat losses decrease the fuel utilization ratio. The same effect can
be done but in another cases engine III and IV. The performance of single-stage absorption
cooling machine will be taken at maximum coefficient of performance.
It can also be notified that for the sex cases the electric load and the fuel utilization ratio of
single-stage is approximately the halve of the two-stage absorption cooling unit. Figure 5.13
shows that the fuel utilization ratio at ambient temperature 40°C . From this figure ,It can be

50
notified that the increase of temperature from 20 to 40 °C increase both electric load and fuel
utilization ratio, for example at engine I at two-stage absorption cooling unit from 1 to1.2 and
for engine IV from 1.8 to 2.15. the same result obtained for the another cases. It can be
illustrated that the same engine performance of engine I and two-stage absorption cooling unit
at 20 °C can be obtained by engine IV at ambient temperature 40°C and single stage cooling
unit and when two-stage cooling unit will be used at 40 °C the load increased to 2.15.
Engine Electric efficiency Effective heat losses Rest losses
I 0.3 0.525 0.175
II 0.3 0.575 0.125
III 0.35 0.525 0.125
IV 0.35 0.55 0.10
V 0.4 0.50 0.10
VI 0.45 0.45 0.10
Table 5.1 Effective engine heat losses for different engines
0
0,5
1
1,5
2
2,5
I II III IV V VI
Different engines
S c,o
(-)
1-stage2-stage
Figure 5.12 Power-cooling ratio for different engines at 20 °C ambient temperature of
engine selected in table 5.3

51
0
0,5
1
1,5
2
2,5
I II III IV V VI
Different engines
S c, 0(
-)1-stage2-stage
Figure 5.13 Fuel utilization for different engines at 40 °C ambient temperature of engine
selected in table 5.1
From the heat transfer flow chart shown in figure 5.7, it can be illustrated in a heat-
temperature diagram as shown in figure 5.14, which shown that the different temperatures an
heat engine losses affected on both supply and back temperatures of absorption refrigeration
machine.
T
T e x h , 1
T e x h , 2
T c w , i nT c w , b
T b
T s
QQ e x Q c w
Figure5.14 T-Q diagram of Diesel engine heat losses temperatures and an absorption
cooling machine performance temperatures.

52
Figure 5.15-a illustrates the engine cooling water inlet temperature as a function of
absorption supply temperature and absorption temperature difference at cooling exhaust
engine losses ratio of 2:3. From this figure, it can be notified at 90 °C supply temperature that
the increasing of absorption temperature difference from 15 to 40 k decrease the cooling
water supply temperature from 86 to 71 °C. The same result can be obtained at 115 °C supply
temperature but in this case decreases the cooling water temperature from 11 to 96 °C. It is
important here to notify that the increase of the supply temperature increase the engine
cooling temperature. To control the engine supply cooling water temperature at 90°C can be
obtained the supply temperature as follows: 90 °C at 15=T∆ .90 and 100°C at 25=T∆
and 35 °C. Figure 5.15-b shows the same effect at another engine cooling to exhaust losses
ratio of 1:1 and figure 5.15-c illustrates the cooling water supply temperature for cooling to
exhaust losses ratio of 3:2 . From the last three figures, it can be obtained the range of
performance of absorption cooling unit for the controlled engine water temperature range.
Q cw =2/3 Q ex.
60
70
80
90
100
110
120
Dt=15 Dt=20 Dt=25 Dt=30 Dt=35 Dt=40
Engi
ne in
let c
oolin
g w
ater
tem
pera
ture
(°C
)
90100110115
a) Effective cooling heat losses =2/3 of Effective exhaust heat losses
Qcw=Qex.
60
70
80
90
100
110
120
Dt=15 Dt=20 Dt=25 Dt=30 Dt=35 Dt=40
Engi
ne in
letc
oolin
g w
ater
te
mpe
ratu
re(°
C)
90100110115
b) Effective cooling heat losses = Effective exhaust heat losses

53
Qcw=3/2Qex
60
70
80
90
100
110
120
Dt=15 Dt=20 Dt=25 Dt=30 Dt=35 Dt=40
Engi
ne in
let c
oolin
g w
ater
tem
pera
ture
(°C
)
90100110115
c) Effective cooling heat losses =3/2 of Effective exhaust heat losses
Figure 5.16 Absorption temperature difference affect on engine supply cooling water
temperature at difference absorption supply temperature
Figures 5.17 represents the engine average water temperature defined as ((Tcw,in+Tcw,b)/2) for
the cooling to exhaust losses of 2:3,1:1 and 3:2 respectively. The controlled average water
temperature of 85 °C gives tat at 3:2 engine losses and absorption supply temperature 90 °C ,
the temperature difference are available from15 to 40 K ,at 1:1 engine losses ratio and supply
temperature 100 °C the temperature difference are available from 30 to 40 K but at the ratio
of 2:3 and absorption temperature of 110 °C only the available value is 40 K.
It is difficult to operate the two-stage absorption unit at 115 °C while for the three engine
select groups the average temperature of 85 not occurred.
Q cw=2/3 Qex.
55
65
75
85
95
105
115
80 90 100 110 120
Absorption supply temperature (°C)
Engi
ne a
vera
ge c
oolin
g w
ater
tem
pera
ture
(°C
)
Dt=15Dt=20Dt=25Dt=30Dt=35Dt=40
a) Effective cooling heat losses =2/3 Effective exhaust heat losses

54
Qcw =Qex
55
65
75
85
95
105
115
80 90 100 110 120
Absorption supply temperature (°C)
Engi
ne a
vera
ge c
oolin
g w
ater
tem
pera
ture
(°C
)
Dt=15Dt=20Dt=25Dt=30Dt=35Dt=40
b) Effective cooling heat losses = Effective exhaust heat losses
Qcw=3/2 Q ex.
55
65
75
85
95
105
115
80 90 100 110 120
Absorption supply temperature (°C )
Engi
ne a
vera
ge c
oolin
g w
ater
tem
pera
ture
(°C
)
Dt=15Dt=20Dt=25Dt=30Dt=35Dt=40
c) Effective cooling heat losses =3/2 of Effective exhaust heat losses
Figure 5.17 Absorption temperature difference affect on engine average cooling water
temperature at difference absorption supply temperature
Figure 5.18 illustrates the affect of increasing of absorption supply temperatures on the inlet
cooling water at difference ambient temperatures of 20 and 40 °C. From this figure it can be
obtained the range of performance of both single and two-stage absorption refrigeration
machine. In the case of single stage the performance engine cooling water only operated at
20°C ambient temperature but in the case of two-stage it can be operated till 107 °C supply
temperature at ambient temperature of 40 °C.

55
60
70
80
90
100
110
120
130
70 80 90 100 110
ARU supply temperature (°C)
Engi
ne in
let c
oolin
g w
ater
te
mpe
ratu
re (°
C)
Ta=20°CTa=40°CEngine performance
Figure 5.18-a Engine inlet cooling water as a function of both supply and ambient
temperature of Two-stage ARU
60
70
80
90
100
110
120
130
75 80 85 90 95 100 105 110 115 120 125
ARU supply temperature (°C)
Engi
ne in
let c
oolin
g w
ater
te
mpe
ratu
re(°
C)
Ta=20°CTa=40°CEngine performance
Figure 5.18-b Engine inlet cooling water as a function of both supply and ambient
temperature of single-stage ARU
Figure 5.19-a shows the effect of the engine losses ratio of the two-stage absorption cooling
machine. The variation of the engine losses to produce a cooling water supply temperature of
maximum value 75 °C is shown in figure 5.18 ,in this case the variation of refrigeration
machine supply temperature from 70 to 85 °C corresponding to the engine losses ratio (0.66,1
and1.5) respectively . It can be notified from this figure that the increasing the losses ratio
56
from 0.66 to 1.5 increases the water losses temperature. Figure 5.18-b shows the increasing of
engine inlet cooling water temperature by increasing the engine heat ratio for the single-stage
absorption cooling unit. From figure 5.19 ,it can be obtained that the performance of the
cooling unit at maximum coefficient of performance can be obtained at the high temperature
range of engine cooling water. To use the performance engine cooling water values the cop
should be decreased, which increases the fuel consumption.
Figure 5.20-a shows that the increase the ambient temperature from 20 to 40 °C produce an
increasing in both absorption supply temperature and cooling water losses temperature. For
example, it can be indicate at 115 °C supply temperature that the increasing of cooling
exhaust ratio from 0.66 to 1.5 increase the cooling water temperature from 98 to 106.5 °C.
From figure 5.20-b,it can be notified that the inlet cooling water temperature reach to 124 °C
at 40 °C ambient temperature. This range of temperature is higher than the engine
performance value. In addition, to control the water temperature of range between 85 to 95 °C
of two stage ARU, the maximum supply temperature should be not exceed than100 °C. The
different cooling water temperature obtained at the case of equality between cooling water
and exhaust losses for different supply temperature90,100,110 and 115 °C are
84.5,92.25,96.75 and 102.25 respectively. It is important that to estimate the range of cooling
water rang before selection the type of absorption cooling machine to obtain the optimum
performance of the machine.
Figure5.21 shows the effect of ambient temperature on the engine cooling water supply
temperature. It can be notified from this figure that the increasing of ambient temperature
from 20 to 40 °C increase the engine cooling water temperature and the maximum cooling
water temperatures occurred at ambient temperature 40 °C as 106.25,100 ,96 at engine losses
ratio of 1.4, 0.8 and 0.66 respectively. To controlled the water losses temperature at 90 °C, the
ambient temperature increased from 30 °C for the case of 0.66. The maximum and the
minimum cooling water temperatures at constant ambient temperature of 30 °C, are 100 and
83 respectively.

57
40
50
60
70
80
0,5 0,7 0,9 1,1 1,3 1,5
Qcw/Qex (-)
Engi
ne in
let c
oolin
g w
ater
(°C
)
Ts=70Ts=80Ts=85
Figure 5.19-a Relationship between engines heat losses ratio and engine cooling supply
temperature at difference absorption supply temperature and 20°C ambient
temperature (Two-stage ARU)
70
75
80
85
90
95
100
0,5 0,7 0,9 1,1 1,3 1,5
Qcw/Qex
Engi
ne in
let c
oolin
g w
ater
te
mpe
ratu
re (°
C)
Ts=85Ts=90Ts=95
Figure 5.19-b Relationship between engines heat losses ratio and engine cooling supply
temperature at difference absorption supply temperature and 20°C ambient
temperature (Single-stage ARU).
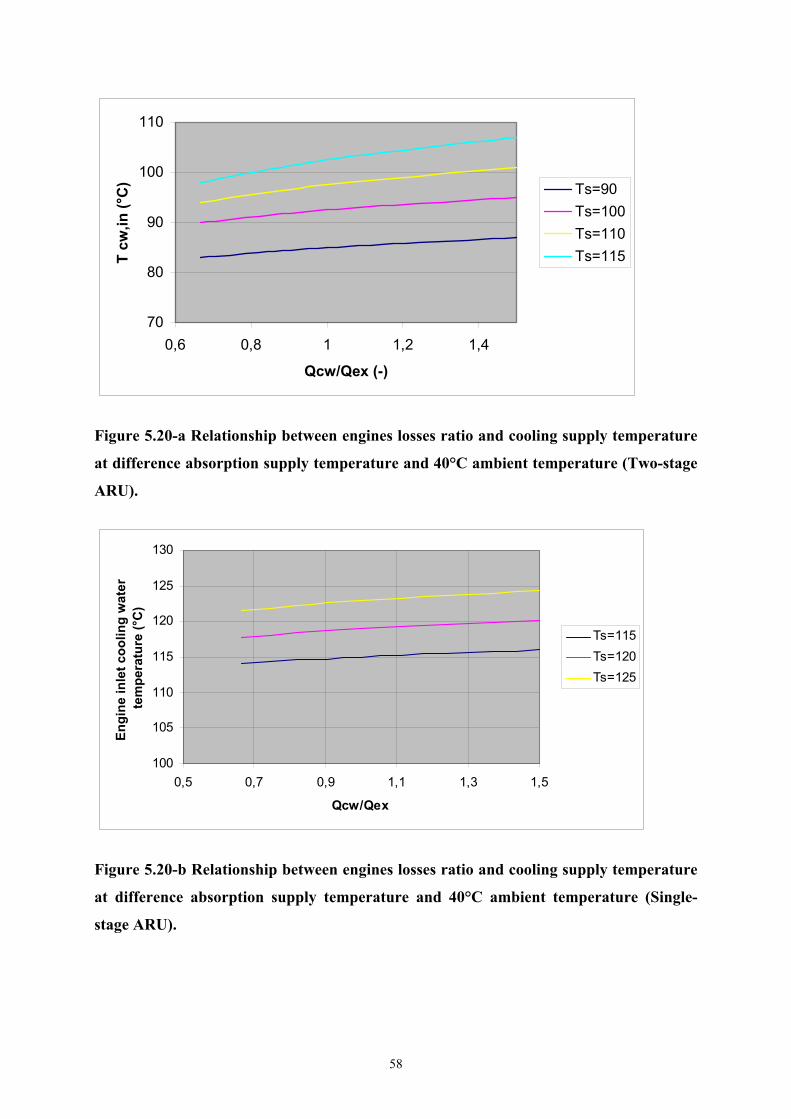
58
70
80
90
100
110
0,6 0,8 1 1,2 1,4
Qcw/Qex (-)
T cw
,in (°
C) Ts=90
Ts=100Ts=110Ts=115
Figure 5.20-a Relationship between engines losses ratio and cooling supply temperature
at difference absorption supply temperature and 40°C ambient temperature (Two-stage
ARU).
100
105
110
115
120
125
130
0,5 0,7 0,9 1,1 1,3 1,5
Qcw/Qex
Engi
ne in
let c
oolin
g w
ater
te
mpe
ratu
re (°
C)
Ts=115Ts=120Ts=125
Figure 5.20-b Relationship between engines losses ratio and cooling supply temperature
at difference absorption supply temperature and 40°C ambient temperature (Single-
stage ARU).

59
60
70
80
90
100
110
20 25 30 35 40
Ambient temperature(°C)
Tcw
,in (°
C) Qcw/Qex=,66
Qcw/Qex=,8
Qcw/Qex=1,4
Figure 5.21 Performance area of engines cooling water supply temperature as a function
of ambient temperature (Two-stage ARU).
Figure 5.22 represents the controlled supply temperature at constant range of cooling water
inlet temperature from 75 to 90 °C. At the engine losses ratio of 1.4 the maximum supply
temperature is 93.5 °C, for the engine losses ratio of 0.8 is 96.5 and for the engine losses ratio
of 0.66 is 100 °C. Figure 5.23 shows the effect of controlled supply temperature on the
absorption machine coefficient of performance. In the case of 0.66 losses ratio the coefficient
of performance decreased from 0.44 to 0.42 at 20 and 40 °C ambient temperature, decreased
from 0.44 t0 0.415 in the case of 0.8 and from 0.44 to 0.41 in the case of 1.4. from this result,
it can be obtained that the control of the cooling water temperature decreases the coefficient
of performance for the all range of losses studied ratio. The best condition of performance of
the two stage absorption machine is at the low ambient temperature range of 20 °C. the same
machine operating in Alexandria has advantages than operate in Cairo or Aswan.
84
88
92
96
100
104
20 25 30 35 40
Ambient temperature(°C)
Con
trol
led
supp
ly
tem
pera
ture
(°C
)
Qcw/ex=,66Qcw/ex=,80Qcw/ex=1,4
Figure 5.22 Controlled supply temperature as a function of difference engine ratios and
ambient temperature (Two-stage ARU)

60
0,4
0,41
0,42
0,43
0,44
0,45
20 25 30 35 40
Ambient temperature (°C)
Cof
ficie
nt o
f per
form
ance
(-)
Qcw/ex=,66Qcw/ex=,80Qcw/ex=1,4
Figure 5.23 Coefficient of performance at controlled supply temperature of Two-stage
absorption refrigeration unit (ARU)
The performance of single-stage absorption cooling unit is investigated in chapter 4 .Figure
5.24 illustrates the supply temperature against the ambient temperature at maximum
coefficient of performance ,while the supply temperature is considered to be not constant .The
current study in this section carried out at the assumption for the temperature level shows in
the named figure above . It can be shown that the supply temperature increased from 100 to
125 ° C when the ambient temperature increased from 20 to 40 °C and the required supply
temperature increased from Alexandria to Aswan . According to this performance the ambient
temperature and the coefficient of performance should be taken in our consideration in this
section.
80
90
100
110
120
130
140
20 25 30 35 40Ambient temperature (°C)
Supp
ly te
mpe
ratu
re (°
C)
Figure 5.24 Single-stage supply temperature at maximum coefficient of performance

61
0
0,2
0,4
0,6
0,8
1
1,2
1,4
1,6
20 25 30 35 40
Ambient temperature (°C)
Pow
er-c
oolin
g ra
tio S
c
Two-stageSingle-stage
Figure 5.25 Power and cooling ratio comparison between single and two stage ACU( case
of Two-stage supply temperature 90°C, single-stage maximum COP and engine I with Qcw= 4/3 Qex )
Figure 5.25 illustrates the comparison between single and two-stage absorption cooling unit,
it can be noticed that the power-cooling ratio is 1.28 in the case of the two-stage but in the
case of the single-stage one is 0.71 at the reference temperature 30 °C. The fuel utilization
ratio for heating can be written as follows:
CV.mQP
f
helh
+=ω (5.15)
and the fuel utilization ratio for cooling can be written as follows :
CV.mQP
f
celc
+=ω (5.16)
therefore, the fuel utilization ratio of cooling can be written as:
)*COP( effarud,elc ηηω += (5.17)
Figure 5.26 illustrates the comparison between single and two-stage absorption cooling unit,
it can be noticed that the cooling utilization efficiency is more efficient in the case of the
single-stage rather than in the case of the two-stage one. At the reference temperature 30°C
the fuel utilization ratio is 0.525 for two-stage and 0.74 for single-stage but in the case of
ambient temperature 40°C the vales of both cases are nearly the same difference of 0,24. It
can also be notified from figure 5.27 that single stage absorption cooling unit has allow

62
temperature difference than the single stage one. This figure shows that the temperature
difference are 17 and 26 K for both single and two stage at 30°C ambient temperature
respectively.
0
0,1
0,2
0,3
0,4
0,5
0,6
0,7
0,8
20 25 30 35 40
Ambient temperature (°C)
Fuel
utli
zatio
n ra
tio
c
Two-stageSingle-stage
Figure 5.26 Fuel utilization ratio comparison between single and two stage ACU( case of
Two-stage supply temperature 90°C, single-stage maximum COP and engine I with Qcw= 4/3 Qex )
10
15
20
25
30
35
40
20 25 30 35 40
Ambient temperature (°C)
Tem
pera
ture
diff
eren
ce ∆
t (k
)
Single-stageTwo-stage
Figure 5.27 Difference of supply and return temperature comparison between single and
two-stage absorption cooling units.
Figure 5.28 illustrates the affect of the change of supply temperature on power –cooling
ratio. From this figure, it can be obtained that the increase of supply temperature of 10 k
increase the power –cooling ratio from 0.68 to 0.72 at 20 °C ambient temperature by
increasing the supply temperatures reach to 20 k the ratio increased to 0.816. The same affect
can be notified at ambient temperatures 40 °C but the ratio increased from 0.72 to 0.84.

63
Figure 5.29 shows the restriction of use single stage absorption refrigeration machine for the
selected engine input cooling water, from this figure ,it can be notified that the ambient
temperature of 20 °C only can be used in this range of performance . Only the theoretical
extrapolation of the performance of 40 °C can be used with supply temperature difference of
28 K but in this case the absorption machine is not operated. To overcome of this problem.
0,5
0,6
0,7
0,8
0,9
1
0 5 10 15 20
Absorption supply temperature diffrence [∆Ts] (k)
Pow
er-c
oolin
g ra
tio[S
c] (-
)
Ta=20Ta=40
Figure 5.28 affected of change of absorption supply temperature on power –cooling ratio
60
70
80
90
100
110
120
130
0 10 20 30
Absorption supply temperature diffrence [∆Ts] (k)
Engi
ne in
lt co
olin
g w
ater
te
mpe
ratu
re (
°C)
Ta=20Ta=40TheoraticalEngine performance
Figure 5.29 restrictions of used single-stage absorption cooling machines for a selected
engine performance

64
Figure 5.30 shows that the range of performance of single –stage absorption cooling machine
as a function of ambient temperature. From this figure , it can be obtained that at maximum
COP only the machine operated in range of 22 °C (Alexandria winter). The range of ambient
temperature increased to 28°C by decreasing the supply temperatures of 10 k and reach to 35
at supply temperatures decreasing of 20 k. the problem of the last to cases is the decreasing of
COP, therefore increasing the primary energy used. This increased of primary energy can be
obtained from figure 5.31. This figure shows that the increased of both supply temperatures
and engine input cooling water increasing the primary energy. It can be obtained from this
figure that the increase of engine cooling input temperatures of 10 k increasing the primary
energy about (1.5 and 4.5 %) at ambient temperatures of (40 and 20 °C) respectively. The
increase of temperatures difference of 20 °C increase this ratio to (16 and 20%) respectively.
0
20
40
60
80
100
120
140
20 25 30 35 40
Ambient temperature (°C)
Engi
ne in
let c
oolin
g w
ater
te
mpe
ratu
re (°
C)
Max.COP
DTs=10
DTs=20
Design [Tcw,in]
Figure 5.30 Range of performance of single-stage absorption cooling unit affected on
changing supply temperatures.
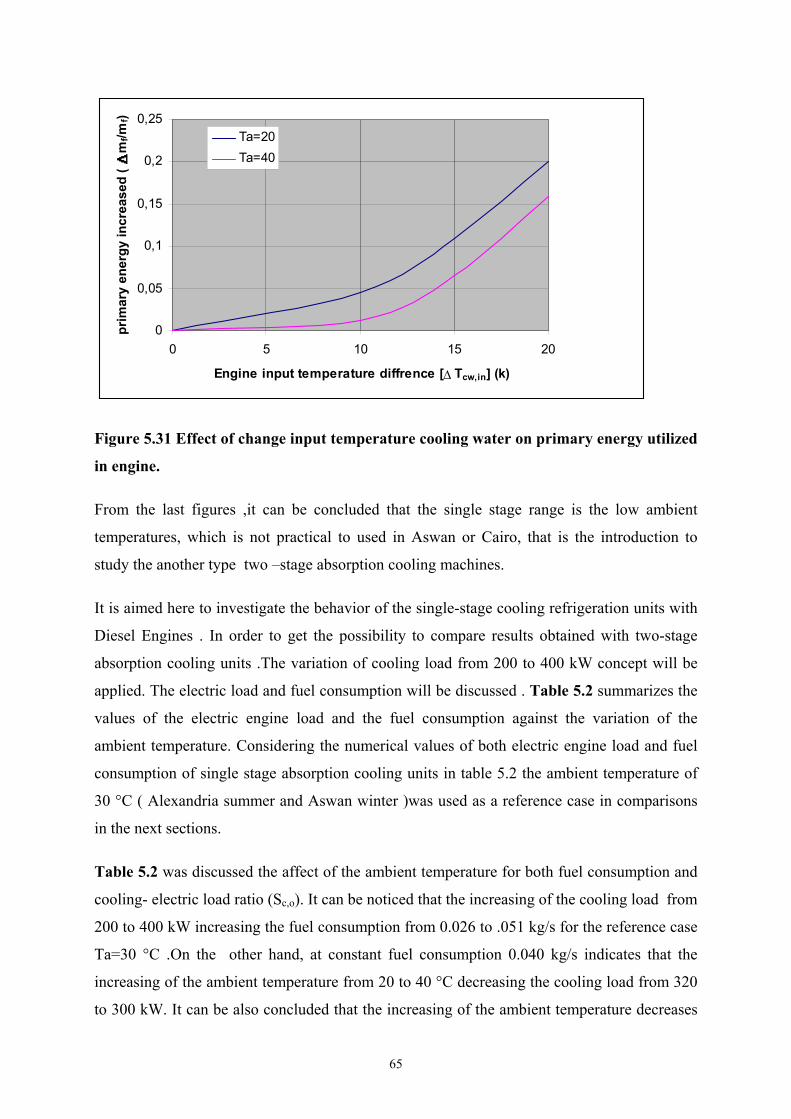
65
0
0,05
0,1
0,15
0,2
0,25
0 5 10 15 20
Engine input temperature diffrence [∆ Tcw,in] (k)
prim
ary
ener
gy in
crea
sed
(m
f/mf)
Ta=20Ta=40
Figure 5.31 Effect of change input temperature cooling water on primary energy utilized
in engine.
From the last figures ,it can be concluded that the single stage range is the low ambient
temperatures, which is not practical to used in Aswan or Cairo, that is the introduction to
study the another type two –stage absorption cooling machines.
It is aimed here to investigate the behavior of the single-stage cooling refrigeration units with
Diesel Engines . In order to get the possibility to compare results obtained with two-stage
absorption cooling units .The variation of cooling load from 200 to 400 kW concept will be
applied. The electric load and fuel consumption will be discussed . Table 5.2 summarizes the
values of the electric engine load and the fuel consumption against the variation of the
ambient temperature. Considering the numerical values of both electric engine load and fuel
consumption of single stage absorption cooling units in table 5.2 the ambient temperature of
30 °C ( Alexandria summer and Aswan winter )was used as a reference case in comparisons
in the next sections.
Table 5.2 was discussed the affect of the ambient temperature for both fuel consumption and
cooling- electric load ratio (Sc,o). It can be noticed that the increasing of the cooling load from
200 to 400 kW increasing the fuel consumption from 0.026 to .051 kg/s for the reference case
Ta=30 °C .On the other hand, at constant fuel consumption 0.040 kg/s indicates that the
increasing of the ambient temperature from 20 to 40 °C decreasing the cooling load from 320
to 300 kW. It can be also concluded that the increasing of the ambient temperature decreases
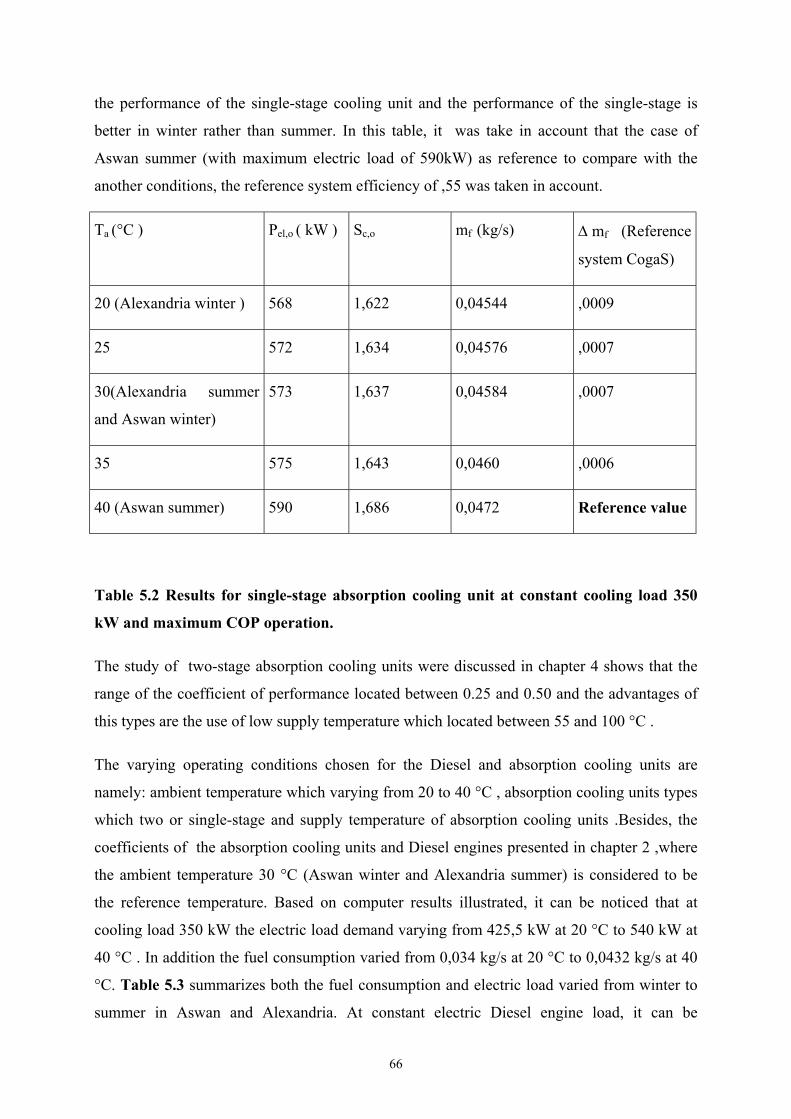
66
the performance of the single-stage cooling unit and the performance of the single-stage is
better in winter rather than summer. In this table, it was take in account that the case of
Aswan summer (with maximum electric load of 590kW) as reference to compare with the
another conditions, the reference system efficiency of ,55 was taken in account.
Ta (°C ) Pel,o ( kW ) Sc,o mf (kg/s) ∆ mf (Reference
system CogaS)
20 (Alexandria winter ) 568 1,622 0,04544 ,0009
25 572 1,634 0,04576 ,0007
30(Alexandria summer
and Aswan winter)
573 1,637 0,04584 ,0007
35 575 1,643 0,0460 ,0006
40 (Aswan summer) 590 1,686 0,0472 Reference value
Table 5.2 Results for single-stage absorption cooling unit at constant cooling load 350
kW and maximum COP operation.
The study of two-stage absorption cooling units were discussed in chapter 4 shows that the
range of the coefficient of performance located between 0.25 and 0.50 and the advantages of
this types are the use of low supply temperature which located between 55 and 100 °C .
The varying operating conditions chosen for the Diesel and absorption cooling units are
namely: ambient temperature which varying from 20 to 40 °C , absorption cooling units types
which two or single-stage and supply temperature of absorption cooling units .Besides, the
coefficients of the absorption cooling units and Diesel engines presented in chapter 2 ,where
the ambient temperature 30 °C (Aswan winter and Alexandria summer) is considered to be
the reference temperature. Based on computer results illustrated, it can be noticed that at
cooling load 350 kW the electric load demand varying from 425,5 kW at 20 °C to 540 kW at
40 °C . In addition the fuel consumption varied from 0,034 kg/s at 20 °C to 0,0432 kg/s at 40
°C. Table 5.3 summarizes both the fuel consumption and electric load varied from winter to
summer in Aswan and Alexandria. At constant electric Diesel engine load, it can be

67
maintained that the cooling load decreased from 342 to 240 kW , when the ambient
temperature increased from 20 to 40 °C . In addition , the performance of absorption cooling
units load depend on the ambient temperature. The reference value of single –stage ACU (590
kW engine electric load) was be taken here too.
Ta (°C ) Pel,o ( kW ) Sc,o mf (kg/s) ∆ mf (Reference
system CogaS)
20 (Alexandria winter ) 425,5 1,21 0,0340 ,0066
25 435 1,24 0,0340 ,0062
30(Alexandria summer
and Aswan winter)
450 1,29 0,0360 ,0056
35 525 1,50 0,0412 ,0026
40 (Aswan summer) 540 1,54 0,0432 ,0020
Table 5.3 Results for two-stage absorption cooling unit at constant cooling load 350 kW
and 90 °C supply temperature
Table 5.3 was discussed the affect of the ambient temperature for both fuel consumption and
engine electric load. It can be noticed that the increasing of the cooling load from 200 to 400
kW increasing the fuel consumption from 0.026 to .051 kg/s for the reference case Ta=30 °C
.On the other hand, at constant fuel consumption0.040 kg/s indicates that the increasing of
the ambient temperature from 20 to 40 °C decreasing the cooling load from 320 to 300 kW. It
can be also concluded that the increasing of the ambient temperature decreasing the
performance of the single-stage cooling unit and the performance of the single-stage is better
in winter rather than summer.
The establishment of single and two-stage absorption cooling units in what concerns the
fundamental principles for the determination of coefficient of performance and specification
to suit a current study systems for a specified Areas (Aswan and Alexandria) has urged
simulation to demonstrate both performance and temperature difference whose merits
overweigh those of absorption cooling units . the interest was extend too to the investigation
of comparison between single and two-stage absorption cooling units. It is aimed here to
illustrate the comparison between the two named both fuel consumption and electric load.

68
When absorption cooling units are used for cooling depend on the engine losses energy,
attention should be paid to the types of absorption cooling units .When covering the demand
cooling load of 350 kW, the use of single-stage increased the electric engine load from 450 to
580 kW and the fuel consumption from 0,031 to 0,045 kg/s. On the other hand, the constant
electric engine load at 400 kW illustrate that the cooling load at single-stage absorption
cooling unit but at two-stage absorption cooling unit is 320 kW. Figure 5.31 represent s the
affect of change the ambient temperature more than the design temperature. From this figure
it can be notified that the increase the ambient temperature more than the designed
temperature decreases the cooling load. At Design temperature of 40 C° , there is no affect
while it is the designed temperature. At design temperature of 30 °C , the affect appeared
when the ambient temperature increases more than 30 °C, for example the increasing of
ambient temperature to 40 °C decreases the cooling load to 85 % of the designed load. The
same affect can be obtained at ambient temperature of 20 °C , the increasing the ambient
temperature to 40 °C decreases the cooling load of 78 %. This affect should be taken in
account when selected the Absorption cooling machines. Figure 5.32 illustrates the same
affect discussed in the last figure but for fuel effected by change the ambient temperature
rather than the designed temperature . From this figure it can be seen that the affect of
decreasing the ambient temperature decreases the fuel consumption ratio. The decreases the
ambient temperature from 40 to 20 °C decreases this ratio to 72%.
0
0,2
0,4
0,6
0,8
1
1,2
20 25 30 35 40
Ambient temperature (°C)
Coo
ling
load
ratio
(Qc/Q
c,o)
Ta(design)=40Ta(design)=30Ta(design)=20
Figure 5.31 Operation of two-stage ACU depend on design temperature at constant
cooling load (Supply temperature of 90°C)

69
0
20
40
60
80
100
120
20 25 30 35 40
Ambient temperature (°C)
Red
uctio
n of
fuel
con
sum
ptio
n (%
)
T(design)=40T(design)=30
Figure 5.32 Reduction of fuel consumption depend on design temperature at constant
cooling load

70
Chapter 6
Solar Energy Systems
6.1 Thermal solar energy utilization
olar radiation incident upon the Earth is primary energy source by which the life of
mankind has developed. The basic concepts of the utilization of solar radiation for the
use of the present day’s energy economy should be considered: to heat ,to electric ,to
chemical energy carriers. Approximately 50 % of the gases responsible for global warming
consist of carbon dioxide CO2 .carbon dioxide is released during the combustion of fossil
fuels such as coal, oil and gas. It can be notified that CO2 ratio for the different fossil fuel as:
322.8 for coal energy source, 258.5 for oil energy source and 178 g/kWh for natural gas
energy source The potential of solar energy systems for reducing the CO2 emission in the
conversion of primary energy to electrical power and refrigeration is strongly dependent on
parameters like the conversion method, the efficiency of the power station and the coefficient
of performance of the refrigeration system. Carbon dioxide is currently to be for more than
50% of the greenhouse effect [58,59].
Only CO2 is considered above in relation to primary energy, but there are other emissions
such as NOx, SO2, CH4, particulate solids, nuclear waste ,etc, which also should be considered
when used the solar energy systems. The data obtained in 2001 by IEA heat pump center for
the approximate CO2 emissions and efficiency of electricity generation for 1995-1996 can be
concluded that the fossil energies should be decreased in the next decades.
Throughout the world in the current time and since 1980 , technology development will be
done to utilized renewable energy. In the foreground to use both solar energy and wind
energy and from the economic point of view, it is important to utilized of renewable energy.
Renewable energy industries are covering numerous energy sources and scale of operation.
While the increase in electricity generation may be significant in the past performance, the
relative scale of renewable energy generation will be quit small growing. On the other hand ,
S
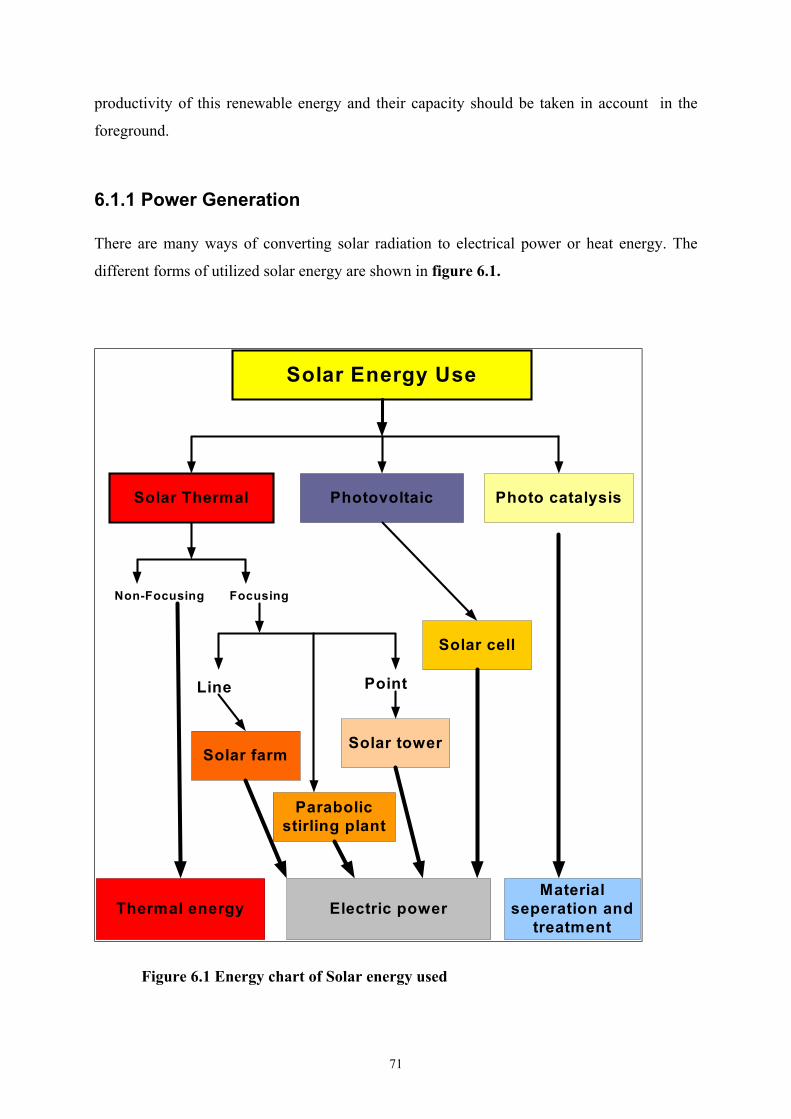
71
productivity of this renewable energy and their capacity should be taken in account in the
foreground.
6.1.1 Power Generation
There are many ways of converting solar radiation to electrical power or heat energy. The
different forms of utilized solar energy are shown in figure 6.1.
Solar Energy Use
Solar Thermal Photovoltaic Photo catalysis
Non-Focusing Focusing
Thermal energy
Line Point
Materialseperation and
treatmentElectric power
Solar farmSolar tower
Parabolicstirling plant
Solar cell
Figure 6.1 Energy chart of Solar energy used

72
6.1.1.1 Solar power-photovoltaic Only a few photo voltaic dimension system in the MW range were built in the last decade
table 6.1. The number of a new system will increase continuously within the next years
resulting in decreasing costs [53].
The generation of electric power directly from the sun is possible in two ways:
• Solar cells using photoelectric effect (photovoltaic)
• Concentrators and heat engines (solar-thermal)
Both systems have their advantages and disadvantages ,the advantages of photovoltaic can
be summarized as:
• Use both diffuse and direct radiation
• Long life time, maintenance-free
The disadvantages of the photovoltaic can be summarized as:
• Very expensive and low efficiency and Storage only in expensive and bulky batteries
Place of PV Installed capacity Start of operation
Toledo, Spain 1.0 MW 1994
Serre, Italy 3.3 MW 1994
Munich, Germany 1.0 MW 1998
Herne, Germany 1.0 MW 1999
Tudela, spain 1.2 MW 2001
Relzow, Germany 1.5 MW 2001
Relzow, Germany 3.5 MW 2002
Table 6.1 Examples of photovoltaic systems in the MW range.

73
6.1.1.2 Solar thermal power plants
Although solar thermal electricity is much more reasonable than photovoltaic electricity no
more commercial power plants have been erected since 1991. The situation for solar thermal
power plants is similar, although series production can reduce the electricity costs
significantly below 10 eurocents/kWh. Due to the higher direct solar irradiation in the south
they are most useful in southern Europe and north Africa where their potential is very high
[52]. The advantages of the solar-thermal can be summarized as [54,55]:
• High efficiency with respect to photovoltaic
• No storage needed
The disadvantages of solar –thermal can be summarized as:
• Use only direct radiation
• Tracking necessary
The efficiency ranges for both photovoltaic and solar thermal power plant are 0.10 and 0.25
respectively[60-62] , for both system the electricity production is more expensive and this will
be discussed in the economic section later.
The cost of solar energy should be estimated, the cost of power generation from solar systems
still more expensive than the traditional types of power generation as shown in table 6.2.
Solar energy form Investment cost Euro/kW Electricity costs Euro/kWh
Solar thermal power plant (3-5)*10^3 (0,12-0,20)
Photovoltaic (5-15)*10^3 (0,30-0,70)
Table 6.2 Investment and electricity costs of difference solar energy systems
6.1.2 Heat generation
Solar radiation incident upon the Earth is primary energy source by which the life of mankind
has developed. The basic concepts of the utilization of solar radiation for the use of the
present day’s energy economy should be considered: to heat ,to electric ,to chemical energy

74
carriers [50]. Of the various types of solar thermal systems, solar collectors, photovoltaic and
solar power plants are represents in last years.
The useful heat is related to flow rate, specific heat at constant pressure, and inlet and outlet
temperature to the system. The efficiency may depend on many factors, collector temperature,
ambient temperature, isolation, flow rate and solar radiation rate. In order to characterize a
collector, one must therefore specify carefully the conditions under which the efficiency has
been measured or calculated. In practice it is much easier to measure the temperature of the
heat transfer fluid in the collector than the temperature of the absorber surface [50-52].
6.1.2.1 Active Solar heating systems
Several methods for collection and conversion of solar radiation into heat are feasible.
Concentrating configuration in combination with liquids have been favored concepts in most
of thermal solar plants which exist today. The type of the heating systems used depend upon
the used of solar radiation, to use the all radiation direct and diffused solar collectors used but
in the case of concentration the direct radiation only will be used. The high temperature heat
achievable with radiation concentration is useful immediately for industrial process heat
purposes, and is attractive for driving chemical reactions. Furthermore, efficient
thermodynamic conversion becomes feasible in high temperature regimes, and prime movers
can be used which are established technology in conventional power plants. There are
basically three types of solar collectors:
1. Flat plate collector is still the most common type of collector
2. Evacuated-tube collectors, there are two types of this collector glass-glass or glass-
metal. The first one is widely used rather than the second.
3. Concentrating collectors are used for high temperature range.
The assembly of collectors, consisting of either point-focusing or non-concentrating collectors
are summarized in table 6.3.

75
Collector type Concentration factor Temperature Power range
Flat plate collector 1 < 200 °C <1.0 MW (thermal)
Solar pond 1 < 80 °C <5.0 MW (thermal)
Solar chimney 1 < 150 °C <2.0 MW (electric)
Vacuum tube collector 3 < 250 °C <1.0 MW (thermal)
Parabolic trough collector 40-80 < 400 °C <100 MW (electric)
Parabolic dish collector 100-250 < 1500°C <150 kW/unit (thermal)
Heliostat collectors 200-700 < 1500°C <200 MW (electric)
Table 6.3 Principle methods of solar radiation collection
6.1.2.2 Passive solar energy
Passive solar heating and cooling does not depend on pumps or fans or any other systems. It
relies on the natural ebb and flow of the energy of the sun through a building. In order to
obtain a substantial contribution from the sun and from persons in the building, three
important elements were included in the plan:
1. small losses of energy
2. planned solar insulation
3. temperature equalization
the house was placed on the site in such a manner that was not shaded during the spring or
autumn. Passive solar heating is improving with the following [56]:
1. house location
2. house orientation
3. the effect of heavy structure on energy consumption

76
It should be notified that when implementing solar energy features into building renovation,
some of the solar technologies have toward becoming cost effective, because of high initial
investment costs. It is important that solar concepts applied in building renovation serve other
purposes besides energy saving.
Passive systems generally reliable, easier to maintain, and possibly longer lasting than active
systems are often less expensive than active systems, but are also generally less efficient due
to slower water flow rates through the systems.
6.2 Thermodynamics of solar collectors
Many concentrator types are possible for increasing the flux of radiation on receivers are
summarized in table 6.3. From this table, it can be shown that, with concentration factor less
than 3, total irradiation is converted into thermal energy or electricity. With concentration
ratio more than 500, high temperature well above 1000 °C are achievable. Furthermore,
efficient thermodynamic conversion becomes feasible in high temperature ranges, and prime
movers can be used which are established technology in conventional power plant [50,57].
A simple flat plat collector consists of an absorber surface, a trap for radiation losses from
absorber surface, a heat transfer medium such as air, water, etc.; and some thermal insulation
behind the absorber surface. Flat plate collectors are used typically for temperature
requirements up to 75 °C although higher temperatures can be obtained from high efficiency
collectors. This collectors are of two basic types based on heat transfer fluid:
• Liquid type: where heat transfer fluid maybe water, mixture of water and antifreeze, or oil
• Air type: where the heat transfer medium is air
The air type used manly for drying and space heating requirements.
The main types of liquid solar collectors can be summarized as:
Coated flat plat collector
Simple flat plat collector
Evacuated collector

77
Figure 6.2 shows the comparison among three types of collectors, flat plate collector, coated
collector and vacuum collector. from this figure it can be illustrated that the evacuated tube
collector can be used in the case of high temperature difference more than 140 °C because of
the most expensive cost. Therefore, in the low temperature difference, the simple or coated
flat plate collector are favorite, cause of the less expensive cost. It can also be notified that for
the temperature difference less than 40 °C the simple flat plate is considered but by increasing
the temperature difference rather than 80 °C the collector is useless.
At temperature difference of 60 K, the range of the current study in the next chapters, the
coated collector efficiency are 0.46 and the simple flat collector are 0.25. For this reason, in
the current study, the coated flat collector are be considered.
The economic analysis of the different types of collector will be discussed in the next
sections, besides the cost analysis of the different solar systems illustrated in this chapter.
0
0,2
0,4
0,6
0,8
1
0 20 40 60 80 100 120
Temperature difference (K)
Col
lect
or E
ffici
ency
(-)
coated flatSimple flatevacuated
Figure 6.2 Performance of different collectors at solar radiation of 1000 W/m2
The flat plate collector and the coated flat collector with concentration factor of 1.0 can be
simulated in this section. In order to determine the efficiency of a solar collector, the rate of
heat transfer to the medium fluid must be calculated, the rate of heat transfer to the fluid
through a collector depends on the temperature of the collector surface from which heat is
transferred by convection to the fluid, and the heat transfer coefficient between the collector
and the fluid. The absorption heat of the solar collector can be written as:

78
)TT(*Cw*mQ inoutwabs −= (6.1)
In order to construct a model for thermal analysis of a flat plate collector ,the following
assumption will be taken in our consideration [55]:
• The collector is thermally in steady state
• The temperature drop is negligible
• Heat flow is one-dimensional through both the cover and the back insulation
• The irradiation on the collector plate is uniform
• The headers connecting the tubes cover only a small area
• The sky can be treated as through it were a black-body source for infrared radiation at an
equivalent sky temperature.
The efficiency of the collector is simply the ratio of the useful energy delivered to the total
incoming energy. The collector efficiency in a function of solar radiation, convection losses
and radiation losses can be written as:
00 I/)qq( conradcoll +−= ηη (6.2)
radq can be written as:
)TT(*E*q aabsrad44 −= σ (6.3)
where E is a function of collector temperature difference ( )tabsδ which equal to
aabsabs TTt −=δ and (6.4)
σ =5.7605*10-8 (W)
The convection collector losses can be written as:
)TT(*q aabsconvconv −= α (6.5)
where 0η can be written as:

79
coll
abs
A*IQ
00 =η (6.6)
The collector heat losses consists of convection, radiation and conductance, in order to obtain
an understanding of the parameter determining the thermal collector efficiency, it is important
to develop the concept of collector heat balance . The collector heat balance can be written as:
tr.convradabssol QQQQQ −−−= (6.7)
Where Qsol is the total solar energy radiation on the solar collector, can be written as:
collsol A*IQ 0= (6.8)
Limits of solar thermal collector efficiency and operating temperature are discussed in section
6.1 but the concentration ratio and the range of used power are shown in table 6.3.
Figure 6.3 shows that the collector efficiency against the temperature difference of coated flat
plat at different solar radiation range from 500 to 1000 W/m2. It can be notified that from this
figure, The same collector efficiency can be obtained at the difference solar radiation but at
high temperature difference range, for example, at collector efficiency of 0.40, the
temperature range increased from 40 to 70 K by increasing the solar radiation from 500 to
1000 W/m2.
At the current study the temperature difference range will be around 60 k the collector
efficiency covered by this collector are 0.13, 0.24, 0.32, 0.38, 0.42, and 0.46 at the solar
radiation coefficient of 500, 600, 700, 800, 900, and 1000 W/m2 respectively . this means that
the decreasing of the solar radiation from 1000 to 500 W/ m2 decreases the efficiency from
0.46 to 0.13. Therefore the performance of the solar collector reduced by 70%. For this
reason, it should be add the solar collector to fossil energy systems, in the current stud y the
solar collector add to the diesel engine power plant.

80
0
0,2
0,4
0,6
0,8
1
0 20 40 60 80 100 120
Temperature diffrence (K)
colle
ctor
effi
cien
cy (-
)
I_0=1000W/m2I_0=900W/m2I_0=800W/m2I_0=700W/m2I_0=600W/m2I_0=500W/m2
Figure 6.3 Performance of coated flat plate collector at different solar radiation.
6.3 Thermal solar utilization systems
Solar energy storage is an important term in the future utilization of solar energy. Without
storage, solar energy has to be used as soon as it is obtained. Solar energy cannot be stored in
electromagnetic form. It must be converted to another form. Figure 6.4 summarized the
possible forms of solar storage, the used form in the current study is the heat in storage
systems at low or medium temperature. The solar heat as a function of ambient temperature
was discussed for Hannover city [63] as an empirical equation which depend on building
place. A solar heating system for production of domestic hot water consists of collector
connected by a piping system to a storage tank. In the solar collector the solar radiance
transferred to heat and absorbed by a liquid in the solar collector channel as mentioned in the
previous sections [64]. This liquid transports the solar heat or the waste heat recovery heat
through a piping system to the storage tank.

81
Storage
Thermal
Solid-Liquid
Latentheat
Steam
ReactionHeat
Liquid-Gas
Chemical
Sensibleheat
Solid-Liquid
Hot water
Steam
Direct
Solid
Liquid DirectIndirect
Figure 6.4 Different forms of storage heat energy
There are basically two ways of achieving this. Figure 6.5 shows the first one, open loop
system ,where all of the fluid in the tank runs through the panels. Figure 6.6 shows the
second way , closed loop systems use a heat exchanger to separate the fluid from the potable
water and second pump to circulate the water in the storage tank .This systems are typically
filled to pressure of about 2 bar . Because they are pressurized they can use smaller pumps
than the open loop systems.

82
Storage tank
Pump Hot water
Cold water
Solar collector
Figure 6.5 Open loop storage tank diagram.
Hot water
Cold water
Pump
E-3
PumpStorage tank
Heat exchanger
Solar collector
Figure 6.6 Closed loop storage tank diagram.

83
The different types of long term storage are used in Germany. The aquifer storage stores the
heat in the under ground, supported by two wells and applicable only in approximate 5% of
the regions in Germany. It is suitable for large volumes and relatively low temperatures [65-
68].
The duct heat store, U-pipes are placed under ground and circulating water heats the soil. This
storage system is suitable for temperature up to 80°C.
For the Gravel water storage a pit is excavated and lined ,this type of storage requires 50%
more in the volume than pure water tank due to the lower heat store capacity of the gravel in
comparison to water.
The most effective type of storage is storage in pure water, because of excellent heat storage
capacity. Water is also cheap and presents no environmental hazard.
The main requirement for current study that water store range up to 95°C
6.4 Solar Energy and cold generation (ARU)
Water/ Lithium-bromide Absorption cooling units are most often operation in combination
with heat and power generation in Germany, but can also be assisted by vacuum tube solar
collectors to operate in range of temperature more than 80 °C. With coefficient of
performance range from 0.5 to 1.2 for single and two stage type. Because solar cooling is
based on thermally processes instead of the normal electrical cold production, the costs for the
used heat plays a central role: a fundamental produced by fossil fuel systems or waste
heat.[69,70]. Figure 6.7 shows this basics of cold generation out of solar energy used
absorption refrigeration systems. As mentioned before in chapter 4, the use of absorption
refrigeration machines decreases the ozone affected. Furthermore , the use of solar energy to
generate cooling load decreases carbon dioxide emissions.

84
Solar collector
ARUTs Tb
qrad
Figure 6.7 Cold out of solar Energy (ARU).
With the input of solar energy systems under special consideration of the heat, cooling and
power industry, there are interesting aspects which are serviceable for extension of the co-
generation , district heat and cooling supply.
It is important that in this section to study the specific collector area as a function of ambient
temperature for both types of cooling systems.
Figure 6.8 -a represents the advantages of the use of two-stage absorption cooling units at
low temperature 20°C, are the most advantages at the high temperature 40 °C at constant
radiation factor 500 and 1000 W/m2 respectively.
Figure 6.8-b represents the advantages of the use of single -stage absorption cooling units at
low temperature 20°C, are the most advantages at the high temperature 40 °C at constant
radiation factor 1000 W/m2 respectively. From the last figure it can be concluded that the use
of two-stage for low radiation and the single is more efficient for the high solar radiations.

85
8
12
16
20
20 25 30 35 40Ambient temperature (°C)
Spec
ific
area
(m2 /k
Wc)
single-stagetwo-stage
Figure 6.8-a Specific collector area Comparison between single and two-stage
absorption cooling unit type at solar radiation 500 W/m2.
2
2,5
3
3,5
4
4,5
20 25 30 35 40
Ambient temperature (°C)
Spec
ific
area
(m 2 /k
Wc)
single-stagetwo-stage
Figure 6.8-b Specific collector area Comparison between single and two-stage
absorption cooling unit type at solar radiation 1000 W/m2.

86
Figure 6.9 represents the specific collector area of single and two-stage absorption cooling
units. The obtained result are for single-stage at maximum coefficient of performance and at
constant supply temperature of 90 °C for the two-stage case. It can be notified that for the
two-stage the increasing of the solar radiation from 500 to 1000 W/ m2 decreases the specific
collector area from 10.2 to 4.2 m2/kWand from 8.3 to 3.2 m2/kW at ambient temperature 40
and 20 °C respectively. It can also be illustrated that the decreasing of the ambient
temperature will decrease the specific area at constant solar radiation. It can also be obtained
the fuel saved in the reference system from this figure. It shows the advantages of use solar
energy to reduced the fuel consumption at the reference system discussed in chapter 5. from
this figure it can be obtained that the value of fuel saved in the reference systems according to
the use of constant solar collector area of 500 m2. the comparison is carried out for two-stage
absorption refrigeration unit at supply temperature of 90 °C . the value of fuel saved obtained
from figure 5.2 for the case of combined gas and steam power station (CoGaS)as reference
case. The collector area can be obtained from this figure with the help of chosen the
absorption cooling unit.
-50
-40
-30
-20
-10
0
10
20
30
40
50
500 600 700 800 900 1000
Solar radiation (W/m2)
∆ m
f,PP *1
0 -4
(kg/
kWc)
==Sp
ecifi
c ar
ea (m
2 /kW
c)
2-stage&t=202-stage&t=401-stage&t=201-stage&t=40(Ta=20°C)(Ta=40°C)
Figure 6.9 Solar energy affected on fuel saved at the Reference power systems at
different ambient temperatures

87
Chapter 7
Combined Power- Cold Plant with Thermal Solar Energy - A parametric Analysis
7.1 General aspects
With the input of solar energy systems under special considerations of heat, cooling and
power industry, there are interesting aspects which are serviceable for extension of co-
generation , district heat and cooling supply. The addition of solar energy was tried to be
maximum utilization value. Figure 7.1 shows that the addition of solar energy decreases the
utilized fuel which discussed in chapter 5.
Qlost
Pel
mf,sol * CV
Qh,eff,sol
Qc,d
Qso
l
mf,PP ∆mf
Pel,ppPel,sol
Figure 7.1 Sankey diagram of cold generation of both diesel engine and solar energy
using absorption cooling machine (ARU)

88
The input of the solar thermal energy into combined diesel power system and absorption
cooling units will be discussed in two cases : parallel connection and series connection. It is
aimed in the next sections to investigate the advantages of using solar energy in diesel engine-
absorption cooling machine illustrated in chapter 5 to obtain the useful range of solar energy
to generate cooling load. The parallel and the series connections will be discussed in the next
section respectively. The power-cooling ratio estimated in chapter 5 in equation 5.13,can be
improved after adding the solar energy to the combined system and can be written as:
c
sol,elsol,c Q
PS = (7.1)
where the Pel,sol is defined as the engine electric load after adding the solar energy and the Qc
is the same cooling load estimated in chapter 5 in equation 5.13 as a function of effective
engine heating. In this section, cooling load is defined as a function of both solar heat and
engine effective heating and can be written as:
arusoleff,hc COP*)QQ(Q += (7.2)
The solar energy was estimated and discussed in equation 6.1. The heat balance after the
addition of solar energy can be written as:
CV*mQQP sol,flosteff,hsol,el =++ (7.3)
Therefore, engine electric load after adding solar energy can be written as:
de,elsol,fsol,el *)CV*m(P η= (7.4)
The fuel utilized in diesel engine after adding solar energy can be written as:
CV*
Pm
de,el
sol,elsol,f η
= (7.5)
The reduction of electric load can be obtained from the reference system discussed in chapter
5, the fuel utilized in this reference system can be estimated directly from figure 5.2 .
Therefore, the reduction in primary energy can be obtained from this equation as:
89
PP,fsol,fff mmmm −−=∆ (7.6)
The connection between diesel engine, absorption cooling unit and solar collector can be
obtained in the following ways:
Series A (Solar collector between cooling and exhaust heat)
Series B (Solar collector before cooling heat)
Parallel (Solar collector and engine heat parallel connection)
The last three ways can be illustrated in the next sections to obtain the maximum benefit of
solar heat energy and minimize the use of primary energy. The analysis in this chapter will
use two-stage absorption cooling machine to make use of the cooling water energy as
concluded in chapter 4 and for the security reason for using the water energy at maximum
temperature of 90°C. The use of single-stage made the cooling water inefficient to use. The
heat gained in this case can be defined as:
solsol,eff,hheat QQQ += (7.7)
From the last equation , a new factor can be defined as the ratio of solar heat to the engine
effective heat as:
sol,eff,h
sol
SF = (7.8)
The value of this factor illustrates the ratio of using solar energy, this factor could be ranged
from (0 to ∞ ). The first case has been discussed in chapter 5 and the other case has been
discussed in chapter 6. The other values of this case can be discussed in this chapter. To
discuss this factor in determined values ,it can be written as:
solsol,eff,h
solRatio QQ
QS
+= (7.9)
This ratio can be varied from 0.0 to 1.0 as shown in the next figures.
Figure 7.2-a shows the engine electric load decreasing after the addition of solar energy to
the engine and absorption cooling unit. From this figure, the ratio of solar energy to operate

90
the engine at a certain load can be estimated. Figure 7.2-b shows the affect of addition solar
energy to the engine on the electric –cooling load ratio discussed in chapter 5.
0
0,2
0,4
0,6
0,8
1
1,2
1,4
0 0,2 0,4 0,6 0,8 1
Qsol/Qh,eff,sol+Qsol
P el,s
ol/P
el,d
e
Ta=20°CTa=40°C
Figure 7.2-a Engine electric load after addition solar energy to the engine load to
produce the same cooling load.
0
0,2
0,4
0,6
0,8
1
1,2
1,4
1,6
1,8
0 0,2 0,4 0,6 0,8 1
Qsol/Qsol+Qh,eff,sol
S c,s
ol (-
)
Ta=20°CTa=40°C
Figure 7.2-b Engine electric load –Cooling load ratio after addition solar energy to the
engine load to produce the same cooling load.
Figure 7.3 shows the primary energy saved after adding the solar energy. This figure
indicates the fuel difference shown in figure 7.1 after electric load corrections from the
reference system discussed in chapter 5 in figure 5.2.

91
0
0,1
0,2
0,3
0,4
0,5
0,6
0 0,2 0,4 0,6 0,8 1
Qsol/Qh,effsol+Qsol
mf/m
f,o
Ta=20Ta=40
Figure 7.3 Fuel consumption saved after addition solar energy to produce the same
electric and cooling load
7.2 Solar collector series connected to the Diesel engines
7.2.1 Series -A
In this section there are two connections will be suggested . The first illustrates that the solar
collector maintained between the engine water cooling system and absorption cooling unit as
shown in figure 7.4.

92
T 2
T cw,in
Tcw,b
T exh,1
Texh,2
T b
T s
Pel
ARU
T 3Solar collector
Figure 7.4-a Series-A connection between solar collector and Diesel engine connected
with absorption cooling unit
From this figure, the absorber temperature in this case can be define as:
232 TT
Tabs+
= (7.10)
The solar heat gained in this case can be written as:
)TT(*C*mQ wwsol 23 −= (7.11)
The engine effective heat can be written as:
)TTTT(*C*mQ sbwwsol,eff,h 32 −+−= (7.12)

93
T
T2Tb
QQex QcwQsol
T3
Ts
Figure 7.4-b T-Q diagram of Series-A connection between solar collector and Diesel
engine connected with absorption cooling unit.
Figure 7.5 shows the collector efficiency of series –A connection at different solar ratios, this
figure shows the solar collector efficiency at cooling to exhaust ratio of 1:1.
0
0,1
0,2
0,3
0,4
0,5
0,6
0,7
0 0,2 0,4 0,6 0,8 1
Qsol/Qh,eff,sol+Qsol
Col
lect
or e
ffici
ency
(-)
Ta=20°C,Io=1000W/m2 Ta=40°C,Io=1000W/m2
Ta=20°C,Io=500W/m2 Ta=40°C,Io=500W/m2
Figure 7.5 Solar energy ratio affected on solar collector efficiency at difference solar
radiation and ambient temperatures

94
Figure 7.6 illustrates the ratio of collector area to cooling load related to this collector
efficiency discussed in figure 7.5 at different solar radiation and ambient temperatures to
obtain the collector area required to delivered the solar energy .
0
2
4
6
8
10
12
14
16
0 0,2 0,4 0,6 0,8 1
Qsol/Qh,eff,sol+Qsol
A col
l/Qc,
d (m
2 /kW
c)
Ta=20°C,Io=1000W/m2 Ta=40°C,Io=1000W/m2
Ta=20°C,Io=500W/m2 Ta=40°C,Io=500W/m2
Figure 7.6 Solar collector efficiency affected on solar collector area to cooling load ratio
at difference solar radiation and ambient temperatures.
The state of the art of absorption cooling units is introduced in chapter 4. it can be notified
that two-stage absorption cooling unit are frequently used with diesel engine . The same
results can be obtained from the previous section which introduced the advantages of use of
two-stage absorption cooling units over the single-stage with and without solar collector. In
chapter 5, that the use of two-stage rather than single stage which required more energy level
of high temperature range was discussed.
As stated in chapter 5 ,the present work is concerned with the two-stage absorption cooling
units rather than the single stage. For that reason, a computer results is developed for the
simulation of two-stage absorption refrigeration units according to the presented solution in
previous sections, it is extendable to make use of different collector area and solar radiation
described in this section according to the engine used. The advantage of using the same
engine models is the capability of varying the ambient temperature and the solar collector
parameters ,expressed in the previous sections, during the simulations. Thus different
parameters can be compared for specific fuel consumption and electric load reduction. Figure

95
7.7 shows the effect of solar energy to engine heat ratio on absorber temperature at
differentengine heat ratios.
40
45
50
55
60
65
70
75
0 0,2 0,4 0,6 0,8 1
Qsol/Qh,eff,sol+Qsol
T abs
(°C
) Qcw/Qex=2/3Qcw/Qex=1Qcw/Qex=3/2
Figure 7.7-a Engine heat ratio affected on solar collector absorber temperature at 20 °C
ambient temperature
60
65
70
75
80
85
0 0,2 0,4 0,6 0,8 1
Qsol/Qh,eff,sol+Qsol
T abs
(°C
) Qcw/Qex=2/3Qcw/Qex=1Qcw/Qex=3/2
Figure 7.7-b Engine heat ratio affected on solar collector absorber temperature at 40 °C
ambient temperature
Figure 7.8 shows the effect of solar energy to engine heat ratio absorber temperature of 40
°C, at this connection on the engine performance cooling water. From this figure it can be
obtained that the engine average temperature can be operated at lower values than the

96
designed one. This gives advantages of security to confirm that the engine cooling losses heat
should be used in this case or operated the engine in other conditions as discussed in the last
chapters. This effect increases with decreasing the ratio of cooling to exhaust engine heat as
shown in figure 7.8-b, in this case the engine average temperature can reach to 70°C, which
means long run of engine performance security to use the cooling heat. By increasing the
cooling to exhaust ratio, the engine average temperature should be increased to reach 80 °C.
However in this case ,it can be reduced the engine average temperature in range of 10 K.
Q
T c w ,in
T
T 2
T b
T c w ,b
Figure 7.8-a Relationship between Engine cooling water and solar collector of series A.
40
50
60
70
80
90
100
110
120
0 0,2 0,4 0,6 0,8 1
Qsol/Qh,eff,sol+Qsol
Engi
ne a
vera
ge c
oolin
g te
mpe
ratu
re °C
Qcw/Qex=2/3Qcw/Qex=1 Qcw/Qex=3/2Engine design
Push down
Figure 7.8-b Relationship between Engine average cooling water and solar collector
absorber temperature at 20 °C ambient temperature.

97
7.2.2 Series –B
In this connection, the solar collector was maintained between cooling water and exhaust gas
system as shown in figure 7.9 , the solar energy temperature level should be estimated to
obtain a more efficient system. The absorber temperature can be written as:
22 b
absTT
T+
= (7.13)
From figure 7.3, the solar heat gained in this case can be written as:
)TT(*C*mQ bwwsol −= 2 (7.14)
The engine effective heat can be written as:
)TT(*C*mQ swwsol,eff,h 2−= (7.15)
T 2
T cw,in
Tcw,b
T exh,1
Texh,2
Solar collector
T b
T s
Pel
ARU
T 3
Figure 7.9-a Series-B connection between solar collector and Diesel engine connected
with absorption cooling unit.

98
Ts
T
T2Tb
Qex QcwQso l
T3
Figure 7.9-b T-Q diagram of Series-B connection between solar collector and Diesel
engine connected with absorption cooling unit.
From figure 7.9-b, it can be shown that that the increased of solar energy ratio can be
affected on the solar absorber temperature in the case of heat engine ratio of as mentioned in
the next figures. The increasing of solar ratio increased the engine cooling water range and
decreasing the use of cooling water heat. To obtain the best connections between engine and
solar energy the same result obtained in the last section should be carried out in this section.
For that reason , computer results of the two-stage absorption refrigeration units were
simulated according to the presented solution in previous sections ,it is extendable to make
use of different collector area and solar radiation described in this section according to the
engine used. The advantage of used the same engine models is capability of varying the
ambient temperature and the solar collector parameters ,expressed in the previous sections,
during the simulations. Thus different parameters can be compared for specific fuel
consumption and electric load reduction.
Figure 7.10 and 7.11 show the solar collector to cooling water demand as a function of both
solar ratio and ambient temperature. From the comparison between this figure and the same
figure in series –A ,it can be notified that the star and end points are the same while that is the
same case discussed in chapter 5 and 6 respectively. From the last figure it can be concluded
that at the fraction ratio of solar ratio series –A is more efficient than series -B in both

99
collector efficiency and collector Area , therefore the performance of engine heat and engine
fuel consumption.
0
0,1
0,2
0,3
0,4
0,5
0,6
0,7
0,8
0 0,2 0,4 0,6 0,8 1
Qsol/Qsol+Qh,eff,sol
Col
lect
or e
ffici
ency
(-)
Ta=20°C,Io=1000W/m2 Ta=40°C,Io=1000W/m2
Ta=20°C,Io=500W/m2 Ta=40°C,Io=500W/m2
Figure 7.10 Solar energy ratio affected on solar collector efficiency at difference solar
radiation and ambient temperatures
0
2
4
6
8
10
12
14
16
0 0,2 0,4 0,6 0,8 1
Qsol/Qsol+Qh,eff,sol
A col
l/Qc,
d (m
2 /kW
c)
Ta=20°C,Io=1000W/m2 Ta=40°C,Io=1000W/m2Ta=20°C,Io=500W/m2 Ta=40°C,Io=500W/m2
Figure 7.11 Solar collector efficiency affected on solar collector area to cooling load ratio
at difference solar radiation and ambient temperatures.

100
Figure 7.12 shows that the series-A system is more efficient than series-B systems. It can also
be notified that the increasing of the collector area decreases the use of cooling water. It is
aimed here to estimate the critical solar collector area which cause the useless of the solar
energy in this system connection between solar collector and diesel engine. The estimation
carried out for two engine cooling water ranges namely (90/80) and (75/65).the second case
cannot be used in this connections reason for the high temperature range required. The main
reason of this disadvantage was decreasing the solar collector efficiency at high temperature
range. It can be used this connection but with increasing the engine average temperature more
than the designed vale as shown in this figure it should be pushed up. From this figure and the
last two figures it can be obtained that the more the use of cooling water range the more the
use of series –A connection. It can be compare this case with the third case in the next
sections. This affect increases with decreases the ratio of cooling to exhaust engine heat as
shown in figure 7.8-b, in this case can be the engine average temperature reach to 95°C this
means the engine performance security to use the cooling heat is less efficient than the series -
A. By increasing the cooling to exhaust ratio ,the engine average temperature should be
increased reach to 100 °C but in this case ,it should be increased the engine average
temperature in range of 10K.
From the last figure, it can be obtained that the use of this connection can be reduced the
collector to cooling load ratio but the disadvantages was increasing the engine performance
cooling water more than the designed value. Therefore, the use of engine and solar collector
in series connection should be in the first form discussed in section 7.2.1 to obtain more
security to use cooling engine heat in wide range of used.
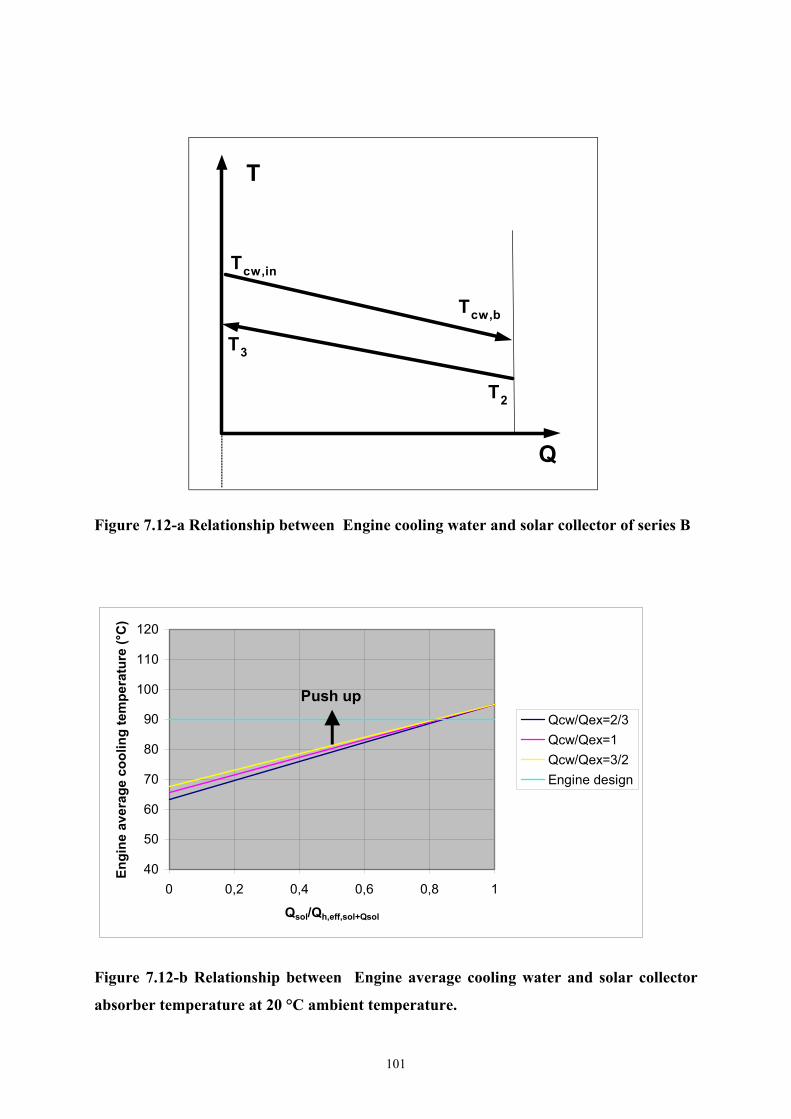
101
Q
Tcw,in
T
T3
T2
Tcw,b
Figure 7.12-a Relationship between Engine cooling water and solar collector of series B
40
50
60
70
80
90
100
110
120
0 0,2 0,4 0,6 0,8 1
Qsol/Qh,eff,sol+Qsol
Engi
ne a
vera
ge c
oolin
g te
mpe
ratu
re (°
C)
Qcw/Qex=2/3Qcw/Qex=1 Qcw/Qex=3/2Engine design
Push up
Figure 7.12-b Relationship between Engine average cooling water and solar collector
absorber temperature at 20 °C ambient temperature.

102
7.3 Solar collector parallel connected to the Diesel engines
Figure 7.13 shows the parallel connection between solar collector and diesel engine
connected with absorption cooling unit. In this case, the collector efficiency and collector area
are discussed in section 7.2.1 as shown in figures7.5 and 7.6 . The absorber temperature can
be from figure 7.13 defined as:
2bs
absTT
T+
= (7.16)
From figure 7.13, the solar heat energy can be written as:
)TT(*C*mQ bswsolsol −= (7.17)
The engine effective heat in this case can be defined as:
)TT(*C*mQ bswwsol,eff,h −= (7.18)
ARUT sT b
T cw,inTcw,b T exh,1
Texh,2
Solar collectorT b T s
Pel
Figure 7.13 Parallel connection between solar collector and Diesel engine connected with
absorption cooling unit.

103
Cooling load results are highly dependant on the types of the cooling units, solar collector
area and diesel engine load . Therefore, a cooling load is a good verification of the solar
collector area but not necessarily a guarantee. It becomes guaranteed when a good comparison
with engine load and ambient temperature of the areas is established. In this section ,fuel
consumption and electric load results for those cases studied in the previous section, will be
represented but with solar collector. All this results will be taken for the cases studied in the
previous section without solar collector.
7.4 Solar collector and Diesel engines part-series
In this section, the system illustrates that the solar collector maintained in parallel connection
with engine water cooling system. The mass flow rate in this case is not equal as shown in
figure 7.14-a. The total mass flow rate delivered in the engine exhaust gas system. Figure
7.14-b shows the T-Q diagram of this connection and the relationship between the different
temperatures as shown.
The absorber temperature in this connection can be written as:
22 b
absTT
T+
= (7.19)
The solar heat in this connection and from last figure can be written as:
)TT(*C*mQ bwsolsol −= 2 (7.20)
The engine effective heat in this case can be written as:
)TT(*C*m)TT(*C*mQ swbwcwsol,eff,h 22 −+−= (7.21)

104
T 2
T cw,in
Tcw,b
T exh,1
Texh,2T s
Pel
ARU
Solar collector
T b msol
mcw
m
Figure 7.14-a Solar collector and Diesel engines connected as part-series
T
T2
Tb
QQex Qcw Qsol
T2
Ts
Figure 7.14-b T-Q diagram of part-Series-connection between solar collector and Diesel
engine connected with absorption cooling unit

105
The relationship between the different mass flow rates can be written as:
solcw mmm += (7.22)
It can be illustrated that variation of engine heat ratio on the mass flow rate ratio. Figure 7.15
shows the effect of engine heat ratio on the solar mass flow rate as a function of the total mass
flow rate. From this figure it can be obtained that the increasing of the cooling water heat ratio
from 2/3 to 3/2 decreases the solar mass flow rate, for example, at solar ratio 0.5, decreasing
from 0.714 to 0.625. the start and end points are constant as shown in the figure.
0
0,2
0,4
0,6
0,8
1
0 0,2 0,4 0,6 0,8 1
Qsol/Qh,eff,sol+Qsol
mso
l/m (-
) Qcw/Qex=2/3Qcw/Qex=1Qcw/Qex=3/2
Figure 7.15 solar collector mass flow rate of part-Series-connection as a function of
engine heat ratio
Figure 7.16 shows the collector efficiency of part-series connection at different solar
radiations. This figure shows the solar collector efficiency at cooling to exhaust ratio of 1:1.
From this figure it can be shown that the collector efficiency is more efficient than the series –
A connection discussed in section 7.2.
Figure 7.17 illustrates the collector area ratio to cooling load related to this collector
efficiency discussed in figure 7.16 at different solar radiation and ambient temperatures to
obtain the collector area required to delivered the solar energy. This figure can be used with
the help of the figure of fuel saved in section 7.1 to obtain the required collector area for the
certain fuel values.

106
0
0,1
0,2
0,3
0,4
0,5
0,6
0,7
0,8
0 0,2 0,4 0,6 0,8 1
Qsol/Qh,eff,sol+Qsol
Col
lect
or e
ffici
ency
(-)
Ta=20°C,Io=1000W/m2 Ta=40°C,Io=1000W/m2
Ta=20°C,Io=500W/m2 Ta=40°C,Io=500W/m2
Figure 7.16 Solar energy ratio affected on solar collector efficiency at difference solar
radiation and ambient temperatures.
0
2
4
6
8
10
12
14
16
0 0,2 0,4 0,6 0,8 1
Qsol/Qh,eff,sol+Qsol
A col
l/Qc,
d (m
2 /kW
c)
Ta=20°C,Io=1000 Ta=40°C,Io=1000
Ta=20°C,Io=500 Ta=40°C,Io=500
Figure 7.17 Solar collector efficiency affected on solar collector area to cooling load ratio
at difference solar radiation and ambient temperatures.
Figure 7.18 illustrates the solar collector area at difference engine heat ratios. From this
figure ,it can be shown that the effect of engine heat ratios is slight on collector area. It can be
obtained from this figure the conclusion that the increasing the cooling heat to the exhaust
heat increases the solar collector area. The affect on the engine average cooling water
temperature has been discussed in the last section. The affect of this ratio can be maximum at

107
the solar heat ratio equal to the engine effective heat which can be decreases by increasing
and decreasing the solar heat ratio as shown in the figure.
0
0,5
1
1,5
2
2,5
3
3,5
4
0 0,2 0,4 0,6 0,8 1
Qsol/Qh,eff,sol+Qsol
A col
l/Qc,
d (m
2 /kW
c)
Qcw/Qex=2/3Qcw/Qex=1Qcw/Qex=3/2
Figure 7.18 Engine heat ratio affected on solar collector area at solar radiation of 1000
W/m2 and ambient temperature of 20°C.
7.5 Summing up
The different forms of connections between engine heats and solar energy can be summarized
in the block diagrams shown in figure 7.19. The four case can be operated in the range of the
absorption refrigeration machine (Ts and Tb) as shown in the block diagrams.
The different collector to cooling load ratio for this different forms discussed in the next
figures to obtain the difference collector area required to produce the solar heat at different
solar radiation of 500 and 1000 W/m2 respectively. The main advantage of the part series
connection that the reduce the average engine cooling water temperature than the series-B
connection but the collector required area is more slightly than this connection.

108
Ts
TsTs
IV-Part- series
Qcw QexT2
TsTb
Qsol
Qcw Qex
T2 TsTb
Qsol
III- Parallel
Qcw QexQsol
T2T3Tb
Qcw QexQsol
T2T3Tb
II-Series -B
Qsol QexQcw
T2T3Tb
I-Series -A
Figure7.19 Block diagrams of different engine and solar collector connections

109
The diesel engines without solar collector are discussed in the chapter 3, electric efficiency
can be changed by changing the ambient temperatures referring to the designed engine
performance as mentioned in the previous sections. Two fundamental basis should be taken
into account, the engine fuel consumption to produce the cooling load and the solar collector
area used. In order to build the correct comparison through the different electric plants and
refrigeration systems , the same fuel consumption or electric load should be take into account.
Figure 7.20 shows the collector area to the cooling load for the four cases of connection
discussed in figure 7.18 at constant radiation of 500 W/m2. Figure 7.21 discusses the same
effect but at another solar radiation of 1000 W /m2. In this case the difference is very small as
shown in the figure. From these figures ,it can be illustrated the advantages of both series –B
and part-series than the parallel and the series –A connection. To obtain the more efficient
connection the engine cooling water should be taken into account which is better for the part-
series than the series –B. it can be concluded that the best connection is the part-series for
both engine and solar collector area.
0
2
4
6
8
10
12
14
16
0 0,2 0,4 0,6 0,8 1
Qsol/Qh,eff,sol+Qsol
A col
l/Qc,
d (m
2 /kW
c)
Series-A&ParallelSeries-BPart-Series
Figure 7.20 Solar collector areas for different connections at solar radiation of 500W/ m2
and ambient temperature of 20 °C.

110
0
0,5
1
1,5
2
2,5
3
3,5
4
0 0,2 0,4 0,6 0,8 1
Qsol/Qh,eff,sol+Qsol
A col
l/Qc,
d (m
2 /kW
c)
Series-A&ParallelSeries-BPart-Series
Figure 7.21 Solar collector areas for different connections at solar radiation of 1000
W/m2 and ambient temperature of 20 °C
From figure7.22, the collector area required to obtain a certain saved fuel value for the part-
series connection discussed in the last section which indicated the fuel saved in the diesel
engine causing of using solar collector at the engine heat ratio of 1:1 was estimated.
-0,4
-0,2
0
0,2
0,4
0,6
0,8
0 0,2 0,4 0,6 0,8 1
Qsol/Qh,eff,sol+Qsol
∆m
f (kg
/kW
hc)--
Aco
ll/1
0*Q
c,d(m
2 /kW
c)
Ta=20°C Ta=40°C
Figure 7.22 Fuel saved and collector areas by using part-series connection at solar
radiation of 800 W/m2.

111
Chapter 8
Conclusions and Future Work
8.1 Conclusions
he following conclusions demonstrates on the behavior of the different loads used to
obtain the electric and cooling load from the total cooling and power systems used in the
current study. It was surprising to find that only the total cooling and power systems of this
problem took attention in the literature and no work concentrates on the solar energy side of
the problem although it is actually of great interest.
The cooling loads demand have different forms, the cooling load demand at night and day:
Night performance
The first case is the night performance, i.e., without both solar heat and solar collector. This
case has been discussed in chapter 5 but the demand cooling load required in this case can be
as a night cooling load which means the diesel engine is run alone without the solar collector.
The demand cooling load at night can be written as:
venintrN,c QQQQ ++= (8.1)
Figures 8.1 and 8.2 illustrates the relationship discussed in the last equation. It can be shown
that the total heat changes from day to night in value of solar heat. The actual system curve
can be obtained for different building systems which depend on the place of the building and
the values of both ambient and solar heat as discussed in equation 8.3.
T

112
Qc
Ta
Qin
Qtr
QvenQc,d,N
Figure 8.1 Diagram of building night heat balance
The air conditioning of the buildings should be taken into account referring to the different
heat generated. The different forms of building heat can be consisted of transmission,
internal, ventilation and solar energy. The value of the total heat can be obtained for different
buildings depending on the area, ventilation and solar energy of this building.
The design of the conditioning systems of a certain building should be divided into a two
main cases night and day operation of the system. The cooling –power ratio could be
represented as follows:
N,d,c
N,d,elc Q
PS = (8.2)
for this ratio the fuel consumption should be minimized. As mentioned in chapter 5 ,the
engine electric load can be in three forms:
1. Engine electric load = night electric load
2. Engine electric load > night electric load (Network feed-in)
3. Engine electric load < night electric load (Network take-out)
These three cases were illustrated in figures 5.9 and 5.10. The comparison between night and
day performance can be shown in figure 8.2.

113
Qlost
Pel
mf * CV
Qh,eff
Qc,d,N
Figure 8.2 Night performance of diesel engine and absorption cooling machine
Day performance
The solar radiation found at the day increases the cooling load demand at day more than the
cooling load at night, in this case the cooling load increases with the value of solar energy and
the cooling load demand can be written as after equation 8.1.
Q c
T a
Q in
Q tr
Q v e n
Q c ,s o l
Q c ,d ,N
Figure 8.3 Diagram of building day heat balance

114
The total heat required can be changed between night and day and this difference should be
taken into account. This relationship between the cooling load at day and night can be written
as:
sol,cN,cday,d,c QQQ += (8.3)
The day performance of the building can be divided into three cases depending on the solar
energy values which can be equal, more than or less than the difference between the day
performance and night performance as shown in figure 8.3. The three cases can be discussed
as follows:
1. solar heat covers the difference between day and night cooling load
Figure 8.4 shows the affect of increasing day cooling load than night cooling load. In this
case the solar energy cover the increasing in the cooling load demand at day than at night. The
solar energy required in this case should be equal to:
aru
N,d,cd,csol COP
)QQ(Q
−= (8.4)
The required collector area is depend on the engine –solar collector connection and the solar
energy radiation which discussed in chapter7 as a function of Qsol / (Qh,eff,sol + Qsol).
Qlost
Pel
mf * CV
Qh,eff
Qc,d,N
Qc,solQ
sol
Qc,d
Figure 8.4 Day performance of diesel engine and absorption cooling machine

115
2. solar heat is less than difference between day and night cooling load
Figure 8.5 shows the affect of decreasing the solar heat than the required heat in figure 8.3 .
In this case the difference of solar energy can be obtained by increasing the engine electric
load over the electric load discussed in the last two cases which increases the engine effective
heat .The solar energy in this case can be written as:
aru
N,cday,csol COP
)QQ(Q
−< (8.5)
The night and day cooling load illustrated in the last figures summarizes the performance of
both engine and solar collector for a certain building which has the solar energy covers the
increasing of the day cooling load ,less or more than the day cooling load. The first case can
be carried out only for a few number of buildings ,the second case can be done when the solar
radiation is more efficient than the designed one and the third case can be executed for some
buildings has a certain solar heat generated from restricted solar collector area. The less solar
energy rather than the difference of cooling load discussed in last equation, the more the both
electric and engine fuel consumption as illustrated in chapter 7.
Qlost
Pel
mf * CV
Qh,eff
Qc,d,NQ
c,sol
Qso
l
Qc,d
Figure 8.5 Day performance of diesel engine and absorption cooling machine (less solar
energy generated)

116
The third case can be obtained between night and day, which has a zero solar energy and the
demand cooling load is more than the night load. In this case, it is important to use a storage
tank, that could be of different capacities depending on the difference between day and night
load and the building type. The difference between night and day cooling load is a function of
both the building capacity and the time as shown in figure 8.6.
Q c
Ta
Qc,d,day
Qc,d,N
Time (day to night)
Figure 8.6 Diagram of cooling load depend on time variation
The charging of storage tank as discussed in chapter 6 can be in two forms
a. Direct as shown in figure 8.7-a
b. Indirect as shown in figure 8.7-b
The discharging of the storage tank used in the time between night and day when the solar
energy is equal to zero but the air is still warm. The demand of the storage heat can be varied
with the variation of time and the building capacity. Figure 8.8 shows the discharging
concept of the selected connection discussed in chapter 7 to compensate the difference
between the actual cooling load and the night cooling load without any increasing in the fuel
consumption.

117
T 2
T cw,in
Tcw,b
T exh,1
Texh,2T s
Pel
ARU
Solar collector
T b msol
mcw
m
Solar collector
Storage tank
Figure8.7-a Direct storage tank charging from part-series engine connection.
T 2
T cw,in
Tcw,b
T exh,1
Texh,2T s
Pel
ARU
Solar collector
T b msol
mcw
m
Solar collector
Figure 8.7-b Indirect storage tank charging from part-series engine connection.

118
The storage heat and the demand cooling load required for a certain building controlled the
collector area and should be taken into account that the collector area.
T 2
T cw,in
Tcw,b
T exh,1
Texh,2T s
Pel
ARU
Solar collector
T b
msol
mcw
m
Storage tank
Figure 8.8 Discharging of indirect storage tank in part-series engine connection.
3. solar heat is more than difference between day and night cooling load
Figure 8.9 shows the effect of increasing the solar heat than the required heat in figure 8.4 . In
this case the difference of solar energy can be saved in the storage tank to be used later on.
The engine electric load in this case should be equal to the electric load in the previous case as
shown in the last two figures. The solar energy balance can be in this case written as:
aru
N,cday,csol COP
)QQ(Q
−> (8.6)
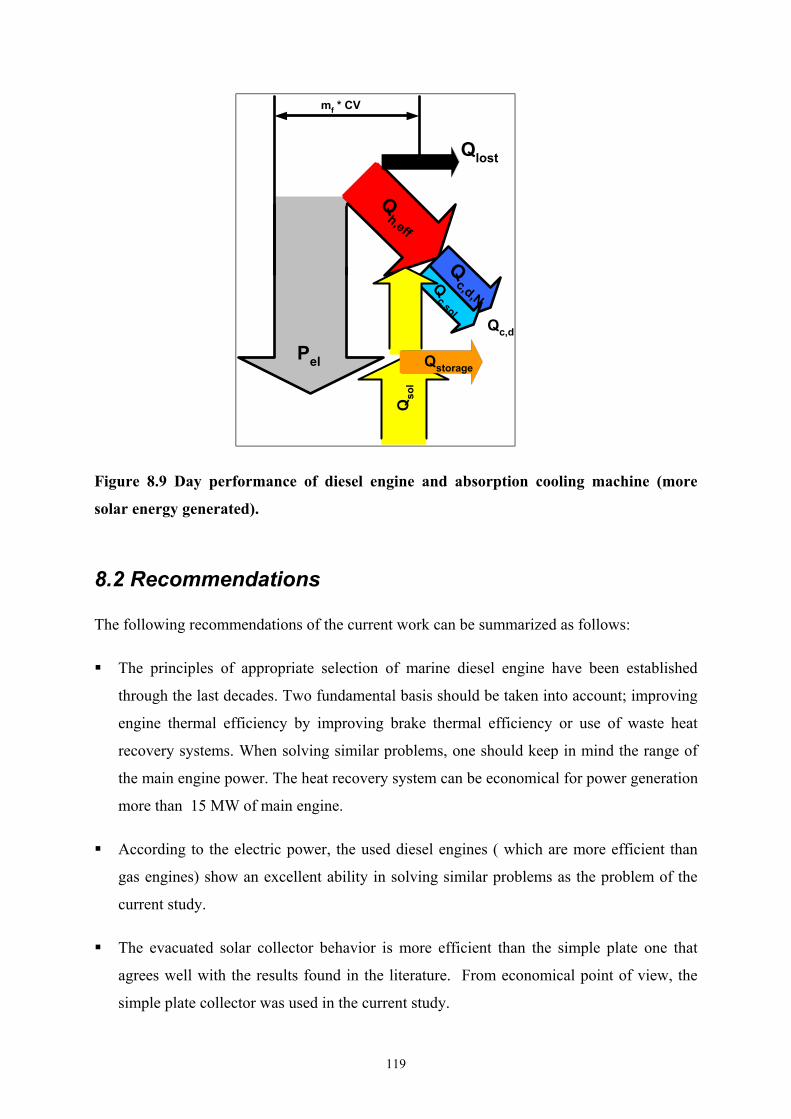
119
Qlost
Pel
mf * CV
Qh,eff
Qc,d,N
Qc,sol
Qso
l
Qc,d
Qstorage
Figure 8.9 Day performance of diesel engine and absorption cooling machine (more
solar energy generated).
8.2 Recommendations
The following recommendations of the current work can be summarized as follows:
The principles of appropriate selection of marine diesel engine have been established
through the last decades. Two fundamental basis should be taken into account; improving
engine thermal efficiency by improving brake thermal efficiency or use of waste heat
recovery systems. When solving similar problems, one should keep in mind the range of
the main engine power. The heat recovery system can be economical for power generation
more than 15 MW of main engine.
According to the electric power, the used diesel engines ( which are more efficient than
gas engines) show an excellent ability in solving similar problems as the problem of the
current study.
The evacuated solar collector behavior is more efficient than the simple plate one that
agrees well with the results found in the literature. From economical point of view, the
simple plate collector was used in the current study.
120
Water/ Lithium- Bromide absorption refrigeration units are the most used operation with
heat and power generation. Two-stage Absorption cooling units are mostly used reason
for low temperature range of engine waste heat recovery systems.
Absorption cooling units are not only viewed as energy efficient cooling and heating
methods but also as environmentally alternative to CFC, HFC or HCFC based technology.
A mathematical model for diesel engine with absorption refrigeration units was derived.
Two cases of connection between engine and solar collector were presented in the current
study.
Scanned solar and engine parameters were chosen as solar radiation, solar collector area,
Sankey diagram and cooling units types where other engine performance characteristics
vary accordingly. Results obtained, emphasize that the two-stage absorption refrigeration
units are more efficient than the single stage one.
The fuel consumption rate comparison studied in the current work, which takes into
account that both electric and cooling load must be the same for the selected cases
mentioned before.
The addition of the solar collector improves both fuel utilization and power ratio. By
increasing the solar radiation good result was obtained.
The control of absorption refrigeration supply temperature in the range from 75 to 90 °C
was studied in the current study.
The use of the solar energy not only decrease the fuel oil used in the diesel engines but
also improves the environmental affect by decreasing the CO2 emission.
The engine connection with the solar collector is decreased or increased both the collector
area and the primary energy utilized
The demand cooling load between night and day should be estimated to obtain the actual
storage tank volume and solar collector area.

121
8.3 Future work
At the end of this work, it is useful to draw some lines for any extension research to the
current study:
1. It would be very practical to extend the range of the collector types to cover different
collectors or solar energy forms. It might be very interesting to study the validity of
the result of the maximum average of utilized fuel for both gas turbines and fuel cell.
2. For the whole range of solar collector area under investigation, the best way to obtain
the most efficient combined heat and power systems economical analysis should be
carried out for the different types of solar energy. This result was found to be valid for
both renewable energies used. It may be a great necessity to compare results with
different power ranges in the future. Another renewable energy sources should be
taken in consideration when combined heat and power systems to be studied.
3. Using fuel cell in heat and power combined systems for buildings and industry energy
managements with solar energy as well as for the marine applications as a main and
auxiliary engines.

122
REFERENCES [1] Gietzelt , M. : Decentralize energy systems- lectures Manuscript , Hannover University, 2003.
[2] Baumann, D.: Energiewirtschaftliche Bewertung der dezentralen Kraft-Wärme-Kälte Kopplung. Dissertation, Universität Hannover, 2004.
[3]
N.N.: Internal combustion engines. Germanischer Lloyd register of shipping, part1, section 3,chapter 2, 2004.
[4] Wharton, A. J.: Diesel Engines. Marine Engineering series, Second edition, London,1986.
[5] Wood yard ,D. : Pounder’s Marine diesel Engines. Printed and bound in Great Britain, seventh edition,1998.
[6] Kuwabara, M. &et.al .: Effect of Fuel Property or SCR System on Harmful Exhaust Emissions such as N2O from Marine Diesel Engines., Bulletin of Marine engineering Society in Japan,vol.28 No.1, 2000, PP.1-7.
[7] Gietzelt, M.: Wärmetechnische Berechnung von Abgaskesseln Abwärmenutzung bei Dieselmotoren anlagen , TUHH ,1981.
[8] Joseph, G.: Combustion Fossil Power Combustion Engineering , INC.RAND , McNally printed in U.S.A 1991.
[9]
Geisler, O. J. Marine Propulsion Systems-Research for efficiency. Centenary year Conference, London, 1989.
[10] N.N.: Marine Engineering Progress in 1990.Bulletin of Marine engineering Society in Japan,vol.19 No.2,1991,PP.97-116.
[11] N.N.: Marine Engineering Progress in 1991.Bulletin of Marine engineering Society in Japan,vol.20 No.2,1992, PP.88-110.
[12] N.N. :Marine Engineering Progress in 1992.Bulletin of Marine engineering Society Japan,vol.21 No.2,1993, PP.86-102.
[13] N.N.: Marine Engineering Progress in 1993. Bulletin of Marine engineering Society in Japan,vol.22
No.2,1994, PP.93-111.
[14] N.N.: Marine Engineering Progress in 1994.Bulletin of Marine engineering Society in Japan,vol.23 No.2,1995, PP. 86/103
[15] N.N. : Marine Engineering Progress in 1995.Bulletin of Marine engineering Society in Japan,vol.24 No.2,1996, PP.76-88.
[16] N.N. :Marine Engineering Progress in 1998.Bulletin of Marine engineering Society in Japan,vol.27 No.2,1999,PP. 81-96.
[17] N.N. : Marine Engineering Progress in 1999.Bulletin of Marine engineering Society in Japan, vol. 28 No.2 ,2000 ,PP. 81-98.
[18] Gütschow, G. :Diesel Engines Systems .,lectures Manuscript ,(I&II) Hannover University,1996.

123
[19] Mau,g.: Handbuch Dieselmotoren im Kraftwerks- und Schiffsbetrieb. Printed in Germany Braunschweig , wiesbaden: Vieweg, 1984.
[20] Knne, A. B.: Marine Internal Combustion engines. Mir publisher,1984.
[21] Geisler,O, M.Gietzelt and W.Tischler: Wirkungsgrad von Abgaskessel anlagen auf Motorschiffen. Hansa - Schiffahrt- Schiffbau -Hafen, 1976, PP. 593-600.
[22] Geisler,o.: Energiebilanz auf geladener Schiffdieselmotoren. Abwärmenutzung bei Dieselmotorenanlagen ,TUHH ,1981.
[23] Fischer,G.: Wärmebedarf im Schiffsbetrieb bei Dieselmotorenanlagen. Abwärmenutzung bei Dieselmotorenanlagen ,TUHH ,1981.
[24] Archer, C.: Developments in marine propulsion systems. Centenary year Conference, London, 1989.
[25] N.,N.:MAN B&W L27/38 Propulsion Package .Shipbuilding Propulsion ,HANSA- schiffbau- Schiffart-Hafen ,136.Jg.,1999, ,No.12, PP.34-37.
[26] Köhler ,H.:MAN B&w -viertaktmotoren : Abgasemissionen ,Ihre Entstehung und Reduzierung ,MAN B&W,1999.
[27] Petersen, P. D.: Neue Generation von Langsamlaufenden Schiffsdieselmotoren. Schiff & Hafen. 7/2003.PP.39-49.
[28] Gietzelt , M. ,Energy systems- lectures Manuscript , Hannover University, 2002.
[29] Gietzelt ,M.and W. Rieß :Energy Economic Seminar ,Institute of Turbo machinery , Hannover University ,Hannover,1999.
[30] Yossef, S.: Heat Balance and Waste Heat Recovery Systems. Marine Engineering Study, Alexandria,1998.
[31] ASUE.: Blockheizkraftwerke –Grundlagen der Technik Anwendungsmöglichkeiten., Hamburg, 2002.
[32] Hoffmann, V. T.: Stromwirtschaftliche Einordnung von BHKW. Fernwärme international -FWI 23, 12/1994, PP.682-688.
[33] Pischinger, F. et. al.: Combined Heat and Power Energy supply with Combustion Engines Station .VDI, Aachen ,Teil IV ,1991.
[34] Pischinger,F.et.al.: BHKW Technical Energy supply with Combustion Engines Station. VDI , Aachen ,Teil II ,1987.
[35] Pischinger,F. et.al.: Combustion Engines as an Energy Transformation :.Energy supply with Combustion Engines Stations. VDI , Aachen, Teil I ,1988.
[36] ASUE.: Blockheizkraftwerke –Grundlagen., Hamburg, 2002.
[37] ASUE.: Blockheizkraftwerke – Fibel. (Energiesparende Technik für die Umwelt, Hamburg, 1999.
[38] Sen,S.: Internal Combustion Engine Theory and Practice. Howarth, west Bengal, second edition,delhi,1988.
[39] Merker, G. P.and U. Kessen.: Technische Verbrennung Verbrennungsmotoren., Stuttgart, Germany, 1999.

124
[40] Vogelsang,H. :Energie-Managementsystem zur optimalen Auslegung von Blockheizkraftwerken, VDI Verlag GmbH.Düsseldorf,1997.
[41] Postel, D.: Beitrag zur Auslegung von BHKW mit heißgekühlten Dieselmotoren. Dissertation, Universität Hannover, 1994.
[42] N.N.: Dokumentation –Gasmotoren BHKW und WKK- Anlagen, Deutz,Germany, 2000.
[43] Jungbluth , C.: Wärmetechnische Analyse von Kraft-Wärme-Kälte-Kopplungssystemen. Diplom- Arbeit ,Universitat Hannover, 1990.
[44] Jungbluth, C.: Wärmetechnische Analyse des Energieerzeugungssystems BHKW/ Solarkollektor unter Berücksichtigung von Wärme – und Kälteverbrauchern . Dissertation ,Universität Hannover,1996.
[45] Feldmann , H.: Parameterstudien Kraft-Wärme-Kälte-Kopplung auf der Basis von Gasmotoren und Absorptionkältemaschinen. Studienarbeit ,Uni. Hannover, 2003.
[46] N.,N.: MAN B&W Diesel ,Second Generation of the Intelligent Engine Concept . Schiff&Hafen, April, 2000, PP.41-44.
[47] Maurer, H.: Small Scale Combined Heat and Power Plants in Thames Water Provinces. Transactions of The Institution of diesel and Gas Turbine Engineers, publication 483, 1994.
[48] Bitsch,R .:Tomorrow’s Energy-Needs quire Intelligent Networks, reprint from Modern Power Systems ,volume 18 ,No.9 ,September 1998.
[49] Ward,C.: Combined Cycle CHP Power Station at Purfleet .Transactions of TheInstitution of diesel and Gas Turbine Engineers ,publication 479,1994.
[50] Winter, C; Sizmann, R; and Vant-Hull, L.: Solar Power Plants. Springer-verlag,Berlin,,1991.
[51] Quaschning, V.: Solar Power-Photovoltaics or Solar Thermal Power Plants. VGB Power Tech. 6/2002,PP.48/52.
[52] Alberg, M.: Prozessanalyse Solarthermischer Hybridkraftwerke auf der Basis Direktverdampfender ParabolrinnenKollektoren. Dissertation Universität Hannover,1997 Springer-Verlag, Berlin, 1991.
[53] Rabl, A.: Active Solar Collectors and Their Applications .Oxford University Press ,Inc., New York, 1985.
[54] Becker, M.; Funken, K-H.; and Schneider, G.: Solar Thermal Energy Utilization. VGB Volume 6,Final Reports 1990, Springer-Verlag, Berlin, 1992.
[55] Becker, M.: Solar Thermal Energy Utilization. VGB Volume 6,Solar Thermal Energy for Chemical prcesses, Springer-Verlag, Berlin, 1987.
[56] Eek, H.: Passive Solar Heating-low Energy consumption. Swedish Counsel for Building research, Stockholm, Sweden, 1987.
[57] www. focus-solar.com .: Solar Collection Systems . Focus Technolgy Co., Ltd, 2002.
[58] AET. Alternative Energy Technologies: Leading the Industry with Innovative Energy. Solar thermal Information. AET,LLC. USA, 2/2003.
[59] www. Solar server .de.: Costs of Solar Heating Systems . Solar Lexicon Index, Germany, October 2002.
[60] Riess, W.: Energieanlagen I- ( Energy systems- lectures Manuscript) , Hannover University, 2001 .

125
[61] Billman, A.: Advances in Solar Energy Submission-Renewable Energy cost Trends. 1/8/99 and www. Hawaii.Gov., USA, 2/2003.
[62] Lysko, D.: Solar water heating- Chapter 5,collector efficiency. Notes of Energy environmental physics, NTNU, Autumn semester, 2002.
[63] Diekmann, M.: Nutzen und Aufwandsanalyse der Gebäudeklimatisierung mit thermisch betrieben Systemen. Dissertation ,Universität Hannover,2004.
[64] Kruhl, J.: Beitrag zur Energiewirtschaft Bewertung des Brennstoffzelleinsatzes in der Gebäudeenergieversorgung.. Dissertation ,Universität Hannover,1999.
[65]
N.N.: Schweizer Kompetenz in Forschung und Entwicklung führen zur Herstellung einer neuen Gasmotorengeneration. KI Luft und Kältetechnik , 3/2004, PP. 88-90.
[66] Havgaard, h.: The largest solar Heating Plant in the World built by a small Danish district Heating company. Euro Heat & Power –Fernwärme International, 9/1997, PP. 432-435.
[67] Heller, A.: Solar energy- a realistic option for district Heating. Euro Heat & Power –Fernwärme International,1-2/2001, PP.46-51.
[68] Zschering, V.: Fernwärme und solarenergie- Ergänzung oder Einschränkung?. EuroHeat & Power –Fernwärme International,1-2/1997, PP. 23-35.
[69] www. Solar server .de.: Cooling with Solar Heat: Growing Interest in Solar Air conditioning . Solar Lexicon Index, Germany, June 2002.
[70] ASUE (Arbeitsgemeinschaft für Sparsamen und Umweltfreundlichen Energieverbrauch E.V.: Wärme macht Kälte- Kraft Wärme- Kopplung mit Absorptionskältemaschinen. Hamburg, Germany, 2002.
[71]
Althouse, A.;C., Turnquist and A., Braccian..: Modern Refrigeration and Air Conditioning .The Good heart -Wilcox Company, Inc. Publishers, ISBN 0-870066420, USA, 1988.
[72] Ohio, C.: Refrigeration and Air Conditioning .Third Edition, Prentice Hall, ,ISBN 0-13-323775-3, New Jersey ,USA, 1997.
[73] Wang, S. Handbook of Air Conditioning and Refrigeration. McGraw-Hill, Inc. ISBN 0-07-06890,New York, USA, 1994.
[74] Holman, J.: Thermodynamics. McGraw-Hill International Editions Mechanical Engineering series, 4th Edition.,1988.
[75] Alefeld, G. and R.,Radermacher.: Heat Conversion Systems. ISBN 0-8493-8928-3, printed by CRC press, Inc. , USA, 1994.
[76] Garland, P.; et.al.: Absorption Machines for Heating and cooling in Future energy systems. IEA Heat pump programme , Sweden, 2000.
[77] Alefeld, G., et. al.: Untersuchung fortgeschrittener Absorptionswärmepumpen ., IZW- Berichte, 3/1992.
[78]
Alefeld, G. and F., Ziegler.: Advanced Heat Pump and Air Conditioning Cycles for the Working Pairs H2O/LiBr:Domastic and Commercial Applications, München university,1986.
[79] Alefeld, G. and F., Ziegler .: Advanced Heat Pump and Air Conditioning Cycles for the Working Pairs H2O/LiBr:Industrial Applications, München university,1986.
[80] Alefeld, G. and G.,Grossmann.: Investigation of Heat and Mass Transfer in Absorption Heat Pump, München university,1996.
126
[81] Ahlby,L.: The Compression /Absorption Heat Pump Cycle System Simulations. ISBN 91-7032-710-6, Göteborg, Sweden, 1992.
[82] Baumann, D. and M., Diekmann.: Modifizierte Effizienzbewertung thermisch angetriebener Klimatisierungssysteme ,EuroHeat & Power – Fernwärme international 8-9/2000, PP.29-35.
[83] Fischer, F.; M., Gietzelt, C., Jungbluth; J. Kruhl and C., Kruse.: Kälte aus Wärme – eine wärmetechnische Analyse. EuroHeat & Power – Fernwärme international 4-5/1996, PP.230-242.
[84]
Baumann, D.; M., Diekmann, and M. Gietzelt.: Erzeugung ,Transport und Speicherung von Kälte für die Gebäudeklimatisierung. EuroHeat & Power – Fernwärme international 9/1998, PP. 18/27.
[85] Utesch, B. and K. Telges.: Erdgasbetriebene Absorptionskälteanlagen. EuroHeat & Power – Fernwärme international 8-9/2000, PP.42-49.
[86] Ewe, H. and T. Sippel.: BHKW – angetriebene Absorptionskälte-Maschine. EuroHeat & Power – Fernwärme international 8-9/2000, PP.36-41.
[87] Dittmann, A.: Auslegungs- und Betriebsführungsprobleme thermisch angetriebener Kälteanlagen. KI Luft- und Kältetechnik, 11/2000, PP. 546-551.
[88] Dittmann, A.: Chancen und Grenzen für die Kopplung von Fernwärme und Kälteversorgungssystemen. TU Dresden,1998.
[89] Kruse, C.: Betriebsverhalten von kleinen heißwasserbetriebenen Absorptionskälte-Maschinen. EuroHeat & Power – Fernwärme international 9/1998, PP. 45-51.
[90] Kruse, C.: Operating, Partial Load Performance and Design Criteria of Small Single-Stage Absorption Chiller Units for District Heating Substations. Proceedings of the 7th International Symposium on DISTRICT HEATING AND COOLING, Lund, Sweden, 18-20 may,1999.
[91]
Sager, J.: Integration of Absorption Refrigeration Plants in District Heating Substations. Proceedings the 7th International Symposium on DISTRICT HEATING AND COOLING, Lund, Sweden, 18-20 may, 1999.
[92] Margen,, P. and Hellberg, S.: The Production of Cooling Energy by Local District Heat Driven Absorption Chillers in Swede, and Recent Developments the Concept. Proceedings of the 7th International Symposium on DISTRICT HEATING AND COOLING, Lund, Sweden, 18-20 may,1999.
[93] Saether, S.: Temperature Control of District Heating and cooling Systems with Absorption Chiller units. Proceedings of the 7th International Symposium on DISTRICT HEATING AND COOLING, Lund, Sweden, 18-20 may,1999.
[94] Greiter, I.; C., Schweigler;G., Alefeld, and J., Scharfe, J.: A 500 kW Absorption Heat Pump for Heating at two Temperature levels: Experience of the first Heating season. AES-vol. 31, International Absorption Heat Pump Conference, pp. 85- 92, ASME 1993.
[ 95 ] Alefeld, G. ;Scharfe,J.: Absorptionswärmepumpentransformator. Kommission der Europäischen Gemeinschaften, Energie, Vertrag Nr.En3E-0032-D.,1993
[96] Ziemann, O., C., Schweigler and J. Scharfe.: Bessere Chancen für Kälte aus Fernwärme – Erste Betriebserfahrungen mit einem neuartigen Absorptions-Kaltwassersatz. EuroHeat & Power – Fernwärme international 12/1996, PP.22-29.
[97]
Ahachad, M., and Charia, M.: Absorption Heat Transformer Applications to Absorption Refrigeration Machine. AES-vol. 31, International Absorption Heat Pump Conference, , ASME 1993, PP. 101- 107
[98] Berkner, U.: Kälte aus Fernwärme Rechtlicher leitfaden zur Vertragsgestaltung der Kältelieferung. EuroHeat & Power – Fernwärme international 4-5/1999, PP.44-47.

127
[99] Slavako, A.: Absorption Heat Pump / Transformer Cycle for Simultaneous Heating and Cooling. AES-vol. 31, International Absorption Heat Pump Conference, ASME 1993, PP. 79- 84.
[100] Langel, C.: Kälte aus Fernwärme mit einer zweistufigen Absorptionskältemaschine Rückblick auf zwei abgeschlossene Pilotvorhaben. Stadtwerke Düsseldorf, AGFW , Frankfurt, 12/ 1998.
[101] Schweigler, C.: Konzepte zur Erzeugung von Klimakälte aus Niedertemperaturwärme Entwicklungen der Absorptionskältetechnik und der zweistufigen Anlagen. ZAE BAYERN, München, 1998.
[102] Xiaosong, Z.: Review and Prospects for research and development of Absorption Heat Pumps. Workshop Proceedings- Absorption machines for Heating and Cooling in Future Energy Systems, Tokyo, Japan, October 1998, PP.123-126.
[103] Kahn, R.;G., Alefeld ;S., Hammerer;R., Pfeifer and L.,Tomasek.: An Ammonia-Water Absorption Cycle with High Temperature Lift. AES-vol. 31, International Absorption Heat Pump Conference, ASME 1993, PP. 93-100.
[104] Bassios, J.,R., Schneider; B., Veelken; D., kuckelkorn; D., Ohert and J., langreck,.: First Operation Result of a Gas-Fired 250 kW Absorption Heat Pump with Plate- Fin Heat Exchangers. AES-vol. 31, International Absorption Heat Pump Conference, ASME 1993, PP. 73-77.
[105] Mohamed, R., and Sairan, S. : Experiences on District Cooling System, Thermal Energy Storage and Co-generation in Malaysia. Workshop Proceedings- Absorption machines for Heating and Cooling in Future Energy Systems, Tokyo, Japan, October 1998, PP. 131-140.
[106] Schwenger, J.: Kraft– Wärme-Kälte -Kopplung zur integrierten Energieversorgung des Flughafens Köln/Bonn. Absorption Heat Pumps. AGFW , Frankfurt, 12/ 1998.
[107] Baksaas, H., and Grandum, S.: High Temperature Absorption/Compression Heat Pump for Upgrading Industrial Waste Heat. Workshop Proceedings- Absorption machines for Heating and Cooling in Future Energy Systems, Tokyo, Japan, October 1998.
[108] N.N, Heat pump programme.: Absorption Machines for Heating and cooling in Future energy systems. IEA Heat pump programme , Maastricht, Netherlands, 1997.
[109] Tozer ,R.: Absorption Refrigeration- principles, cycles, and applications to cogeneration. Cogeneration Conference, Madrid, Spain ,1992.
[110] Tozer ,R. and James, R.: Thermodynamics of Absorption Refrigeration . International Heat pump Conference, Louisiana, USA ,1994.

128
Lebenslauf
Persönliche Daten Name: Mohamed Morsy Abd Elmeguid Salama El Gohary Geburtsdatum: 16. November 1969 Geburtsort: Alexandria, Ägypten Familienstand: verheiratet Nationalität: ägyptisch Schulausbildung 1975-1984 Einschulung in die Grundschule, Alexandria 1984-1987 Secondary -Schule in Alexandria Studium 1992 B.Sc. Maschinenbau an der Universität Alexandria 1995 M.Sc. Maschinenbau an der Universität Alexandria Praktika 1989 Alexandria ship Yard 1991 Alamria Petroleum Co. 1993-1994 Marine Navy Berufliche Tätigkeiten 1992-1999 Wissenschaftlicher Mitarbeiter an der Universität Alexandria-Ägypten seit 1999 Wissenschaftlicher Mitarbeiter am Institut für
Energietechnik der Universität Hannover.