diesel to solar
TRANSCRIPT

1

2
Table of Contents 1. Executive Summary ......................................................................................................................... 5
2. Diesel in India .................................................................................................................................. 6
2.1. The cost of diesel .................................................................................................................... 6
3. Solar as a source of power .............................................................................................................. 8
3.1. Components of a Solar PV plant ............................................................................................. 8
3.1.1. Modules .......................................................................................................................... 8
3.1.1.1. Crystalline silicon..................................................................................................... 9
3.1.1.2. Thin-film .................................................................................................................. 9
3.1.1.3. Parameters to be considered when selecting Solar Modules ................................ 9
3.1.2. Mounting structures ..................................................................................................... 10
3.1.3. Inverters ........................................................................................................................ 10
3.1.3.1. Kinds of inverters .................................................................................................. 10
3.1.4. Charge controllers ......................................................................................................... 11
3.1.4.1. Pulse Width Modulated (PWM) ............................................................................ 11
3.1.4.2. Maximum Power Point Tracking (MPPT) .............................................................. 11
3.1.5. Batteries ........................................................................................................................ 12
3.1.5.1. Liquid vetted or flooded ........................................................................................ 12
3.1.5.2. Sealed (VRLA – Valve Regulated Lead Acid) .......................................................... 12
3.1.5.2.1. Absorbed Glass Mat (AGM) ............................................................................... 12
3.1.5.2.2. Gel Cell ............................................................................................................... 12
3.2. Solar Plant Configurations .................................................................................................... 13
3.2.1. Stand-alone PV system ................................................................................................. 13
3.2.1.1. Without Batteries .................................................................................................. 13
3.2.1.2. With batteries ....................................................................................................... 13
3.2.2. Grid-tied Captive Power Plant ...................................................................................... 13
3.2.2.1. With batteries ....................................................................................................... 14
3.2.2.2. Without batteries .................................................................................................. 14
3.2.3. Hybrid Solar PV system ................................................................................................. 14
4. Solar as a substitute for diesel ...................................................................................................... 16
4.1. Comparing diesel power with solar ...................................................................................... 16
4.2. Designing a Captive Solar PV Plant ....................................................................................... 17
4.2.1. Scoping the project ....................................................................................................... 17

3
4.2.2. Calculating the amount of solar energy available......................................................... 18
4.2.3. Surveying the site .......................................................................................................... 18
4.2.4. Calculating the amount of energy needed ................................................................... 18
4.2.5. Sizing the solar PV system ............................................................................................. 18
4.2.6. Component selection and costing ................................................................................ 18
4.2.7. Detailed design.............................................................................................................. 18
4.3. Designing a Solar-Diesel Hybrid Plant ................................................................................... 19
4.3.1. Optimising power supply using a solar-diesel hybrid ................................................... 19
4.3.1.1. Frequency and power quality ............................................................................... 19
4.3.1.2. Reverse Current Flow ............................................................................................ 19
4.3.1.3. Efficiency and Minimum Loading .......................................................................... 19
4.3.2. Prominent solar-diesel hybrid installations .................................................................. 20
5. Favourable Policies ....................................................................................................................... 21
5.1. Jawaharlal Nehru National Solar Mission (JNNSM) .............................................................. 21
5.2. State-specific policies ............................................................................................................ 22
5.3. Accelerated depreciation ...................................................................................................... 23
5.1. Renewable Energy Certificates (RECs) .................................................................................. 23
5.1.1. A note on RECs .............................................................................................................. 23
6. Economics of Captive Solar PV ...................................................................................................... 25
6.1. Capital cost of Solar PV ......................................................................................................... 25
6.1.1. Cost break up of a 100 kW solar captive system – without batteries (grid-tied) ......... 25
6.2. Assumptions used in calculations ......................................................................................... 25
6.2.1. General assumptions .................................................................................................... 25
6.2.2. Scenario-specific assumptions ...................................................................................... 25
6.3. Returns from the Captive Solar PV Plant .............................................................................. 26
6.4. The BOO(T) Model ................................................................................................................ 27
7. Conclusion ..................................................................................................................................... 28
7.1. Want to know more? ............................................................................................................ 28
8. Replacing Diesel with Solar Report ............................................................................................... 29
9. About EAI ...................................................................................................................................... 30

4
List of Tables Table 1: Comparison Crystalline Silicon vs. Thin Film ............................................................................. 9
Table 2: Comparison of PWM and MPPT Charge Controllers ............................................................... 12
Table 3: Comparison of batteries .......................................................................................................... 13
Table 4: Comparing Diesel Generator with Solar PV ............................................................................ 16
Table 5: JNNSM - Salient Features ........................................................................................................ 21
Table 6: State Solar Policies .................................................................................................................. 22
Table 7: Capital cost of a Solar PV system ............................................................................................ 25
List of Figures Figure 1: Increase in retail price of diesel ............................................................................................... 6
Figure 2: Solar irradiation levels by region ............................................................................................. 8

5
1. Executive Summary
Solar power has emerged as a viable alternative to diesel power generation for industrial and
commercial units that run diesel gensets to meet their power needs. This whitepaper from EAI
discusses both the technical aspects of substituting diesel with solar power and the financial benefits
from doing so. This whitepaper does not discuss substituting heat energy generated through diesel
with solar thermal energy.
The interest in substituting diesel with solar has been spurred by
1. Burgeoning power deficit (9-10% of peak demand in 2012 – 8.9% in the North and 18.0% in
the South)
2. Rapid escalation in cost of diesel (46% since 2010)
3. Steep decline in cost of solar power (40% reduction in module prices in 2011-12)
4. Favourable policies encouraging the use of solar power (capital subsidies, soft loans, etc.)
While solar power can provide significant savings when substituting diesel, there are several factors
that should be carefully considered to derive optimum returns from the investment in the solar PV
plant, such as
1. The nature of loads that can be supported by solar power (heavy starting currents could be
an issue)
2. Choice of solar technology that is appropriate to the site and the region
3. PV plant configurations that best serve your needs (with or without batteries, etc.)
4. Issues in integrating solar energy with diesel power (generator capacity and its ability to
handle reverse current)
5. Economics of solar PV under different scenarios (IRR of 16.7% even with conservative
assumptions)
These factors will be examined in detail in the following pages, helping you formulate and
implement a solar strategy that provides economical and reliable solar power for years to come.

6
2. Diesel in India
The rapid pace of growth of the Indian economy has been accompanied by a tremendous need for
energy which has not been matched by an increase in power generation from state run utilities. The
resulting power deficit has triggered the need for captive generation plants at many industrial and
commercial units, many of which run on diesel.
As of March 2013, India has 34.44 GW of installed captive power generation (renewable and non-
renewable) capacity, representing over 15% of the total installed electricity capacity in India. Diesel
represents about 40% of the installed captive capacity.
EAI estimates that India has as much as 13.5 GW installed capacity of diesel based captive power generating plants.
2.1. The cost of diesel In addition to the environmental cost, diesel also imposes a financial cost to the
1. Consumer – Ever increasing price of diesel
2. Government – Subsidy on diesel and a heavy oil import bill
The deregulation of the diesel price by the government has resulted in a steep increase in the cost of
diesel. The price of bulk diesel has been completely deregulated and stands at around Rs. 60 while
the retail price of diesel is heading towards complete deregulation with increases of 50 ps every few
months.
Figure 1: Increase in retail price of diesel
Mumbai 58.86 Kolkata 56.33 Chennai 55.37 Delhi 51.97

7
The levelised cost of diesel power (including genset maintenance cost) is about Rs. 16/kWh and could be as high as Rs. 40/kWh in some applications such as rural telecom towers.
In addition, the recent weakening of the rupee puts further pressure on the price of diesel. To this
can be added location and enterprise specific overheads such as the cost of
Transporting the fuel
Storing the fuel (and associated loss due to evaporation
Security to prevent pilferage
Uncertainty over delivery of diesel (with corresponding adjustment of operations)
Diesel generated power is one of the most popular solutions to the power deficit in India but the
rising cost of diesel coupled with environmental considerations has set the stage for solar power to
shoulder greater loads in India’s energy intensive enterprises. EAI estimates that the diesel power
generating segment will drive the adoption of solar power in industries.
Cost of diesel power (including genset maintenance) varies from Rs. 16/kWh to as high as Rs. 40/kWh
Transportation, storage, and other costs associated with acquiring and using the fuel can push the per unit cost even higher
The deregulation in price of diesel coupled with the depreciation in the value of the rupee continue to put upward pressure on the cost of diesel Ta
keaw
ays
8
3. Solar as a source of power
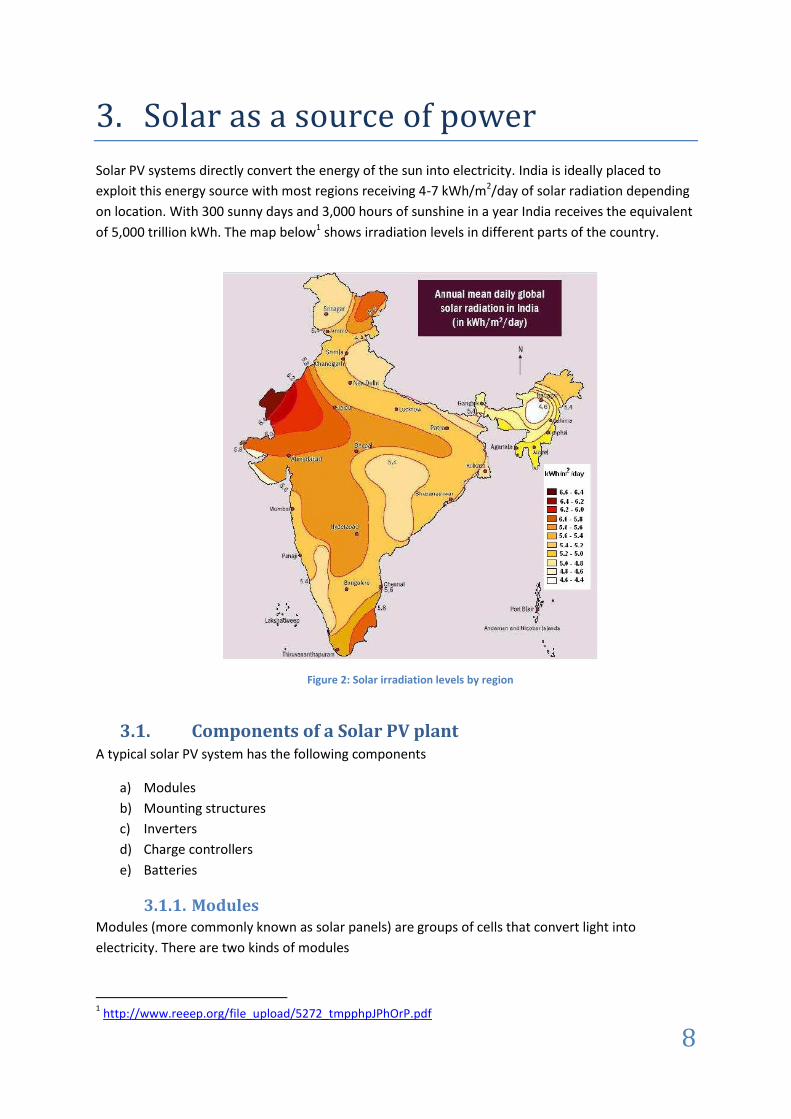
Solar PV systems directly convert the energy of the sun into electricity. India is ideally placed to
exploit this energy source with most regions receiving 4-7 kWh/m2/day of solar radiation depending
on location. With 300 sunny days and 3,000 hours of sunshine in a year India receives the equivalent
of 5,000 trillion kWh. The map below1 shows irradiation levels in different parts of the country.
3.1. Components of a Solar PV plant A typical solar PV system has the following components
a) Modules
b) Mounting structures
c) Inverters
d) Charge controllers
e) Batteries
3.1.1. Modules Modules (more commonly known as solar panels) are groups of cells that convert light into
electricity. There are two kinds of modules
1 http://www.reeep.org/file_upload/5272_tmpphpJPhOrP.pdf
Figure 2: Solar irradiation levels by region

9
3.1.1.1. Crystalline silicon
Crystalline silicon (c-Si) solar modules are currently the most commonly used, primarily due to c-Si
being stable and delivering efficiencies in the range of 13-19%.
3.1.1.2. Thin-film
Thin film modules are less efficient than c-Si based systems but enjoy a lower thermal coefficient
making them more suitable for warmer areas.
While they enjoyed a significant cost advantage a few years ago, thin film modules are now at par or in some cases even more expensive than crystalline modules. Their thermal coefficient of conversion, however, is lower than crystalline modules making them very suitable for more arid regions like Rajasthan.
Table 1: Comparison Crystalline Silicon vs. Thin Film2
Cell Technology Crystalline Silicon Thin Film
Module efficiency
13%-19% 4%- 12%
Temperature
Coefficients
Higher Lower
(Lower is beneficial at high ambient temperatures)
Inverter Compatibility and Sizing
Industry Standard System designer has to consider factors such as temperature coefficients, Voc-
Vmp difference, isolation resistance due to temperature
variances, humidity levels, etc.
Mounting systems
Industry standard Special clips and structures may be needed. Significant savings in labour cost is
witnessed in some cases
Required Area Industry standard – 8 sq.m/kw May require up to 50% more
space for a given project size
3.1.1.3. Parameters to be considered when selecting Solar Modules
1. Cost
2. Solar panel quality
3. Tolerance
4. Temperature Co-efficient
5. Conversion Efficiency
6. Durability/Warranty
7. System Sizing
8. Certifications3
2 http://www.civicsolar.com/resource/thin-film-vs-crystalline-silicon-pv-modules
10
a. Off Grid – Crystalline Silicon Solar Panels: IEC 61215/IS14286; Thin Film Terrestrial Solar
Panels: IEC 61646
b. Grid Connected – Crystalline Silicon solar panels: IEC 61215 Edition II; Thin Film solar
panels: IEC 61646
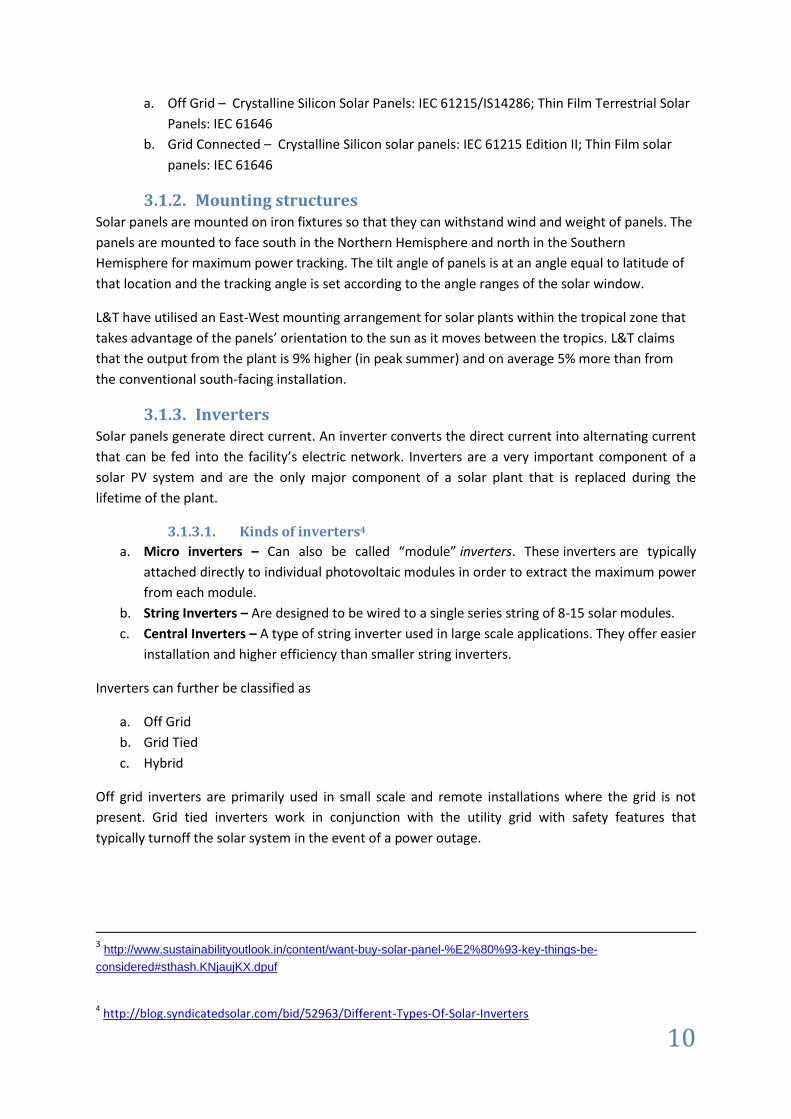
3.1.2. Mounting structures Solar panels are mounted on iron fixtures so that they can withstand wind and weight of panels. The
panels are mounted to face south in the Northern Hemisphere and north in the Southern
Hemisphere for maximum power tracking. The tilt angle of panels is at an angle equal to latitude of
that location and the tracking angle is set according to the angle ranges of the solar window.
L&T have utilised an East-West mounting arrangement for solar plants within the tropical zone that
takes advantage of the panels’ orientation to the sun as it moves between the tropics. L&T claims
that the output from the plant is 9% higher (in peak summer) and on average 5% more than from
the conventional south-facing installation.
3.1.3. Inverters Solar panels generate direct current. An inverter converts the direct current into alternating current
that can be fed into the facility’s electric network. Inverters are a very important component of a
solar PV system and are the only major component of a solar plant that is replaced during the
lifetime of the plant.
3.1.3.1. Kinds of inverters4
a. Micro inverters – Can also be called “module” inverters. These inverters are typically
attached directly to individual photovoltaic modules in order to extract the maximum power
from each module.
b. String Inverters – Are designed to be wired to a single series string of 8-15 solar modules.
c. Central Inverters – A type of string inverter used in large scale applications. They offer easier
installation and higher efficiency than smaller string inverters.
Inverters can further be classified as
a. Off Grid
b. Grid Tied
c. Hybrid
Off grid inverters are primarily used in small scale and remote installations where the grid is not
present. Grid tied inverters work in conjunction with the utility grid with safety features that
typically turnoff the solar system in the event of a power outage.
3 http://www.sustainabilityoutlook.in/content/want-buy-solar-panel-%E2%80%93-key-things-be-
considered#sthash.KNjaujKX.dpuf
4 http://blog.syndicatedsolar.com/bid/52963/Different-Types-Of-Solar-Inverters

11
Hybrid inverters (also known as Bidirectional or magical inverters) are a one system solution for a complete solar PV system. They can automatically manage between 2 or more different sources of power (grid, diesel, solar). They have inbuilt charge controllers, MPPT controller, Anti Islanding solutions, DC and AC disconnects and other features like automatic on/off of the diesel generator, automatic data logging, and various kinds of protection for the different components of the system, making them ideally suited for solar plants that act as a diesel substitute.
There are many variables that can affect the efficiency of a solar energy inverter. With every
manufacturer developing inverters with different MPPT (Maximum Power Point Tracker) ranges,
enclosures, temperature variances, monitoring abilities, etc., it becomes critical to choose the right
kind of inverter for your plant to maximise your returns.
3.1.4. Charge controllers The charge controller is required to regulate supply of charging current from the solar system to the
batteries. They improve battery performance by protecting the battery from overcharging. The
charge controller can be separate unit or integrated with the inverter. There are two kinds of charge
controllers
a) Pulse Width Modulated (PWM)
b) Maximum Power Point Tracking (MPPT)
3.1.4.1. Pulse Width Modulated (PWM)
This type of charge controller operates by sending out pulses of charge which helps in uniform
distribution of the charges on the plates of battery. These are modulating the pulse widths and
slopes of the voltage and current levels and also their rate of change. They operate in three phases:
i. Bulk phase: The voltage gradually rises to the bulk level (usually 14.4 to 14.6 volts) while the
batteries draw maximum current. When bulk level voltage is reached the absorption stage
begins
ii. Absorption phase: The voltage is maintained at bulk voltage level for specified times (usually
an hour) while the current gradually tapers off as the batteries charge up
iii. Float phase: After the absorption time passes the voltage is lowered to float level (usually
13.4 to 13.7 volts) and the batteries draw a small maintenance current until the next cycle
3.1.4.2. Maximum Power Point Tracking (MPPT)
They constantly track and maintain the optimum voltage and current to charge the battery. They
match the output of the solar panels to the battery voltage to ensure maximum charge (amps).
A 100 watt solar panel rated at 6 amps at 15.5 volts will be able to charge a 12.4 volt battery at 75
watts (6 amps times 12.4 volts). The MPPT module extracts the full 100 watts from the panel
regardless of battery voltage by utilising a DC-to-DC converter to charge the battery by delivering 8
amps.

12
Table 2: Comparison of PWM and MPPT Charge Controllers
Parameter PWM MPPT
Capacity a) Available only up to 60 Amps b) Can take only certain input
voltages: 12V,24V,48V c) Limits solar panel output voltage
a) Available up to 80 Amps b) Can take a varying range of
input voltages and hence, reduces losses in transmission and provides flexibility in solar module configuration
Cost Inexpensive; <$250 Almost thrice that of PWM
Efficiency 60-80% (approx. 68%) Increases charging efficiency to up to 30%
Peak efficiency: 99%
Warranty and life Low Much higher than PWM
3.1.5. Batteries Batteries are an optional component in solar power systems used to provide backup power when
the sun isn’t shining or to augment the solar systems when the output is low (such as when clouds
pass by). Batteries come in several voltages, but the most common varieties are 6 Volt and 12 Volt.
Solar PV systems typically use lead acid batteries which are of three types
a) Liquid vetted or flooded
b) Sealed (VRLA – Valve Regulated Lead Acid)
a. Absorbed Glass Mat (AGM)
b. Gel Cell
3.1.5.1. Liquid vetted or flooded
Flooded lead-acid (FLA) batteries are the most cost-effective variety. They require maintenance that
involves monitoring voltage and occasionally replenishing the water in the battery. Additionally, FLA
batteries vent hydrogen under heavy charging so they must be stored in a ventilated enclosure.
3.1.5.2. Sealed (VRLA – Valve Regulated Lead Acid)
Being sealed, they do not require watering, nor do they typically vent any gasses. As the electrolyte
cannot be refilled, controlling the rate of charge is very important.
3.1.5.2.1. Absorbed Glass Mat (AGM)
Absorbed Glass Mat batteries use a fibreglass-like separator to hold the electrolyte in place. These
are more expensive and more sensitive to overcharging than FLAs and offer the best vibration and
impact resistance.
3.1.5.2.2. Gel Cell
Gel cell batteries use a thickening agent to immobilise the electrolyte. The cell will continue to
function even if the container is cracked. These are the most expensive of the three types.

13
Table 3: Comparison of batteries
Parameters Flooded
Sealed
AGM Gel
Cost Cost-effective, least cost per ampere hour Nearly three times the cost of flooded batteries
2-3 times the cost of flooded batteries
Maintenance Requires maintenance No/negligible maintenance required
Size and placement
Requires ventilation; mostly needs to be kept outdoors which hinders working at ambient temperature
Sealed batteries are advantageous in situations with space constraints that require you to store your batteries in unusual orientations or where venting is not possible
3.2. Solar Plant Configurations Designing the right kind of solar power plant for your application is critical as cost, reliability, and
flexibility are determined by the design.
Solar power plants have three primary configurations
a) Stand-alone PV system
b) Grid-tied PV system
a. Grid-Interactive Without Battery Backup
b. Grid-Interactive With Battery Backup
c) Hybrid Solar PV system
3.2.1. Stand-alone PV system Stand-alone PV systems operate independent of the electric utility grid, and are generally designed
and sized to supply specific DC and/or AC electrical loads. This can be
3.2.1.1. Without Batteries
The DC output of the module or array is connected directly to a DC load. As there is no battery the
load only operates during sunlight. An MPPT Charge Controller may be used to maximise the output
from the array in some applications like positive-displacement water pumps.
3.2.1.2. With batteries
This system uses a hybrid inverter with charge controller to charge the batteries during daytime and
power the load. The batteries supply the inverter when sunlight is not available. Priority is given to
charging over fulfilling the load demand beyond a level of battery consumption.
3.2.2. Grid-tied Captive Power Plant A grid-tied solar power system (also referred to as grid-intertied, or on-grid or utility-interactive)
produces solar power that is fed to the load interactively with the utility grid, hence the term grid-
tied, as the system is tied, literally, to the grid.

14
The critical component in a grid-tied plant is the inverter or power conditioning unit (PCU) which disconnects from the grid in the event of utility outage to prevent power generated by the solar panels from flowing back into the grid. This feature, known as anti-islanding function, is required in all grid-tied systems to protect utility personnel working on the grid during an outage.
3.2.2.1. With batteries
These systems are usually smaller in capacity, typically under 20 kW, due to the high cost of
batteries. The battery is used to keep “critical load” circuits operating during a utility outage. When
an outage occurs, the unit disconnects from the utility and powers the critical load circuits which are
wired from a subpanel that is separate from the rest of the electrical circuits.
3.2.2.2. Without batteries
This system is much simpler and primarily consists of the solar array and a grid-tied inverter. It is
simple to install and achieves the highest efficiency as the introduction of batteries lead to efficiency
losses but excess power generated cannot be fed to batteries. If net-metering is not available in the
region the surplus power cannot be monetised.
3.2.3. Hybrid Solar PV system Systems with more than one source of power are called hybrid systems. Having multiple sources of
power ensures availability of power even when the sun isn’t shining, or greater availability of power
than from the solar panels. There are different kinds of hybrids, such as solar-wind hybrid, solar-
biomass hybrid, etc., but this whitepaper will focus only on the solar-diesel hybrid.
Solar PV systems are often coupled with diesel generators due to the intermittent nature of solar power, limited solar plant capacity, or because the load might require heavy inrush current.
The diesel generator supplies the excess load during daylight hours and the entire load as well as
charges the battery when the sun isn’t available. This system strikes an optimum balance between
solar capacity utilisation, battery discharge levels, and diesel consumption.
15
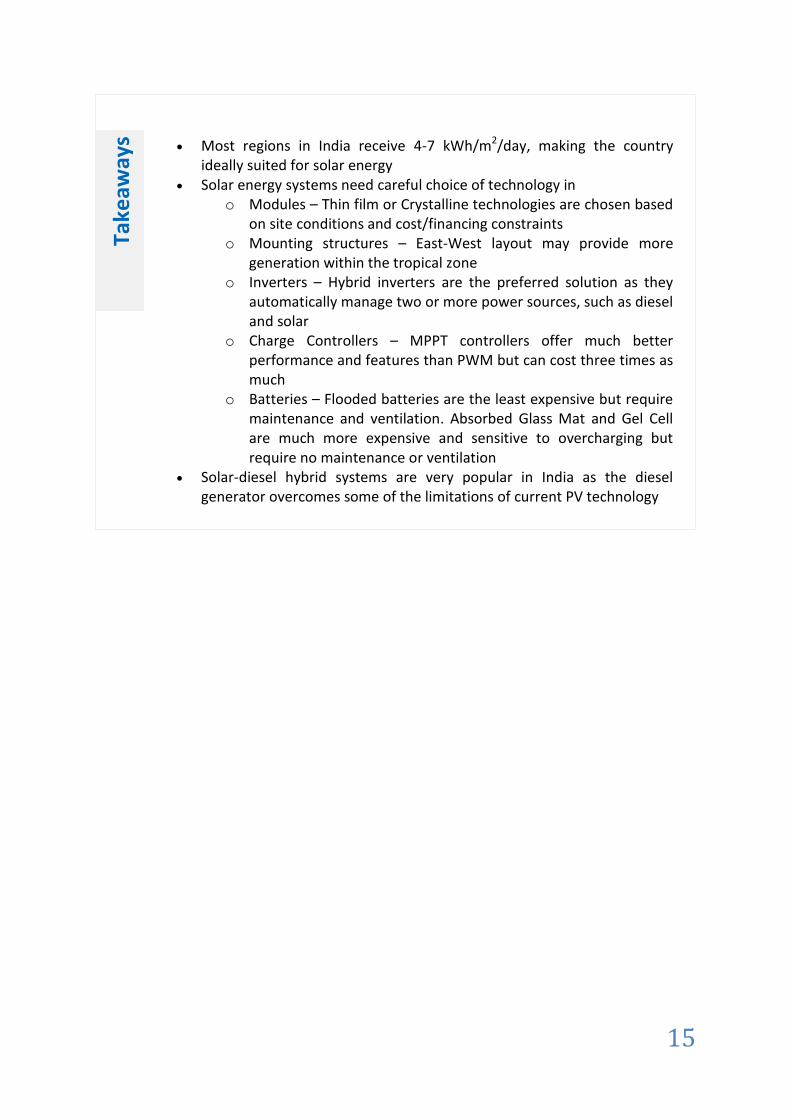
Most regions in India receive 4-7 kWh/m2/day, making the country ideally suited for solar energy
Solar energy systems need careful choice of technology in o Modules – Thin film or Crystalline technologies are chosen based
on site conditions and cost/financing constraints o Mounting structures – East-West layout may provide more
generation within the tropical zone o Inverters – Hybrid inverters are the preferred solution as they
automatically manage two or more power sources, such as diesel and solar
o Charge Controllers – MPPT controllers offer much better performance and features than PWM but can cost three times as much
o Batteries – Flooded batteries are the least expensive but require maintenance and ventilation. Absorbed Glass Mat and Gel Cell are much more expensive and sensitive to overcharging but require no maintenance or ventilation
Solar-diesel hybrid systems are very popular in India as the diesel generator overcomes some of the limitations of current PV technology
Take
away
s
16
4. Solar as a substitute for diesel
Solar power represents an opportunity to achieve energy security using a clean source of energy at
an economical cost, but there are several challenges to be overcome as well. A brief comparison
with diesel power is provided below:
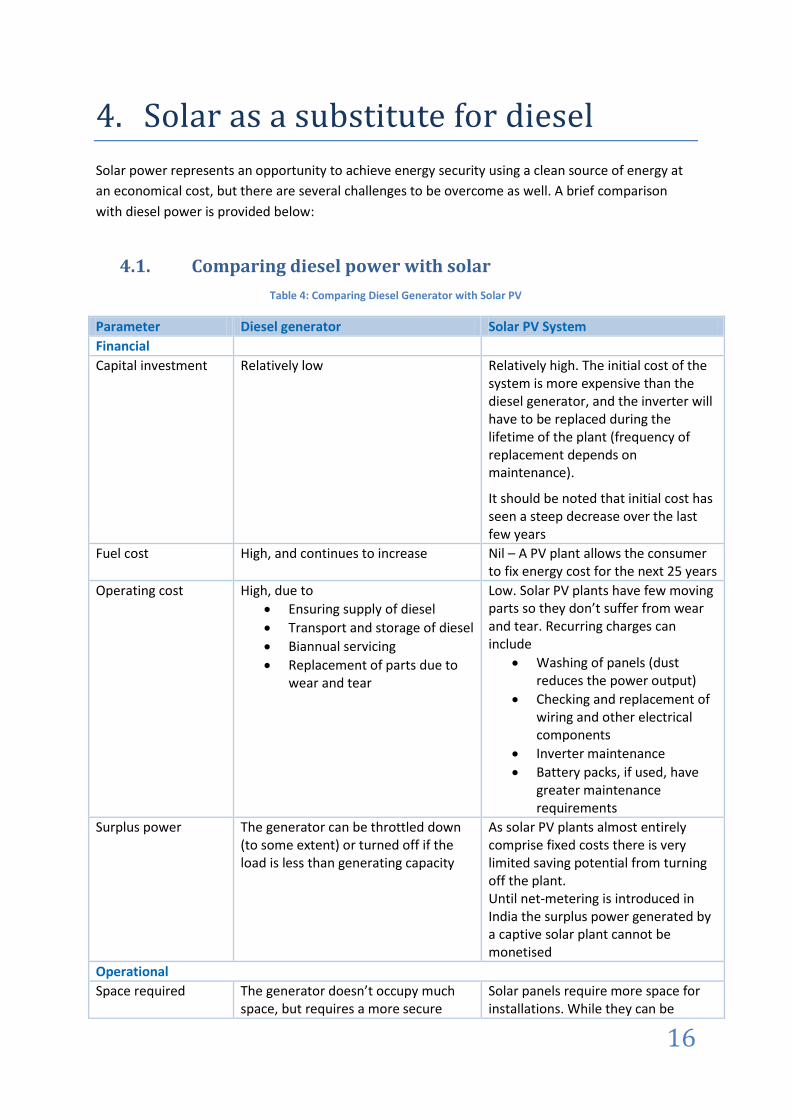
4.1. Comparing diesel power with solar
Table 4: Comparing Diesel Generator with Solar PV
Parameter Diesel generator Solar PV System
Financial
Capital investment Relatively low Relatively high. The initial cost of the system is more expensive than the diesel generator, and the inverter will have to be replaced during the lifetime of the plant (frequency of replacement depends on maintenance).
It should be noted that initial cost has seen a steep decrease over the last few years
Fuel cost High, and continues to increase Nil – A PV plant allows the consumer to fix energy cost for the next 25 years
Operating cost High, due to
Ensuring supply of diesel
Transport and storage of diesel
Biannual servicing
Replacement of parts due to wear and tear
Low. Solar PV plants have few moving parts so they don’t suffer from wear and tear. Recurring charges can include
Washing of panels (dust reduces the power output)
Checking and replacement of wiring and other electrical components
Inverter maintenance
Battery packs, if used, have greater maintenance requirements
Surplus power The generator can be throttled down (to some extent) or turned off if the load is less than generating capacity
As solar PV plants almost entirely comprise fixed costs there is very limited saving potential from turning off the plant. Until net-metering is introduced in India the surplus power generated by a captive solar plant cannot be monetised
Operational
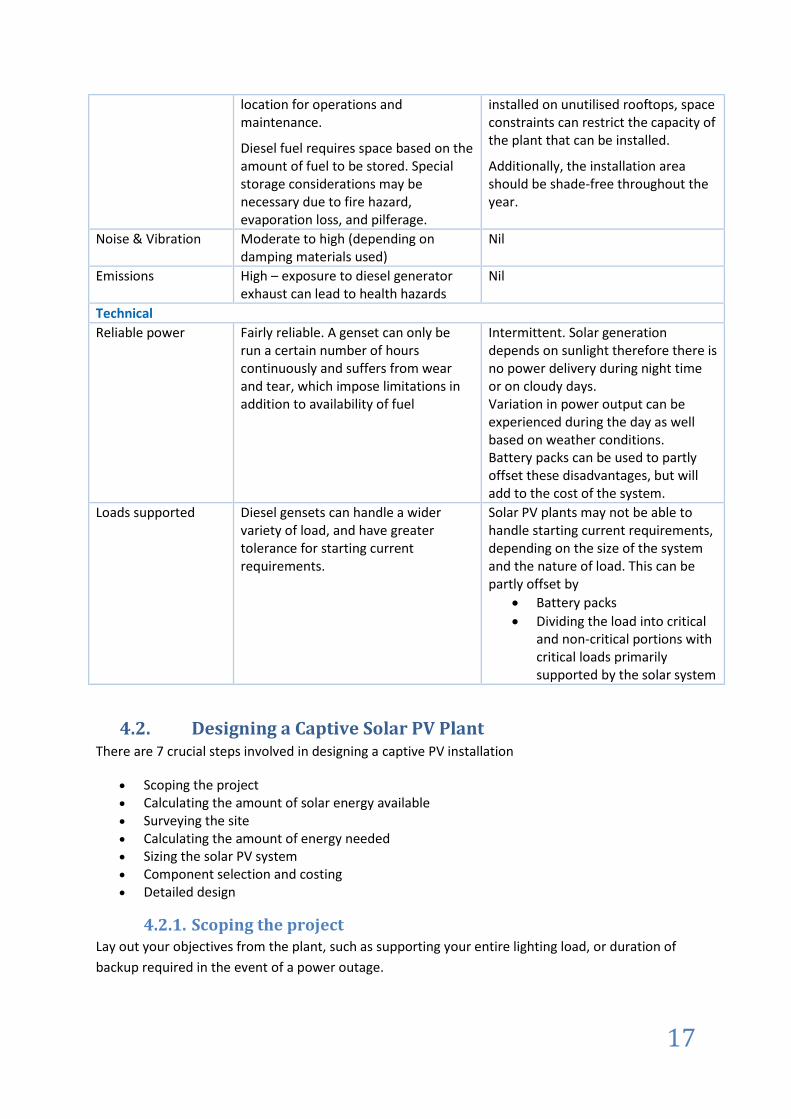
Space required The generator doesn’t occupy much space, but requires a more secure
Solar panels require more space for installations. While they can be
17
location for operations and maintenance.
Diesel fuel requires space based on the amount of fuel to be stored. Special storage considerations may be necessary due to fire hazard, evaporation loss, and pilferage.
installed on unutilised rooftops, space constraints can restrict the capacity of the plant that can be installed.
Additionally, the installation area should be shade-free throughout the year.
Noise & Vibration Moderate to high (depending on damping materials used)
Nil
Emissions High – exposure to diesel generator exhaust can lead to health hazards
Nil
Technical
Reliable power Fairly reliable. A genset can only be run a certain number of hours continuously and suffers from wear and tear, which impose limitations in addition to availability of fuel
Intermittent. Solar generation depends on sunlight therefore there is no power delivery during night time or on cloudy days. Variation in power output can be experienced during the day as well based on weather conditions. Battery packs can be used to partly offset these disadvantages, but will add to the cost of the system.
Loads supported Diesel gensets can handle a wider variety of load, and have greater tolerance for starting current requirements.
Solar PV plants may not be able to handle starting current requirements, depending on the size of the system and the nature of load. This can be partly offset by
Battery packs
Dividing the load into critical and non-critical portions with critical loads primarily supported by the solar system
4.2. Designing a Captive Solar PV Plant There are 7 crucial steps involved in designing a captive PV installation
Scoping the project Calculating the amount of solar energy available Surveying the site Calculating the amount of energy needed Sizing the solar PV system Component selection and costing Detailed design
4.2.1. Scoping the project Lay out your objectives from the plant, such as supporting your entire lighting load, or duration of
backup required in the event of a power outage.

18
4.2.2. Calculating the amount of solar energy available The insolation level, or the amount of sunlight on the installation area (expressed as kWh/m2/day), is
measured to determine the number of solar panels required. A rule of thumb measure is 1 W of PV
panel will produce 4 Wh of electricity per day (at crystalline panel efficiencies). This is only an
average and will vary with the location of the plant.
It is important to estimate the insolation over a period of time – heavy mist in winter may significantly reduce the amount of power that can be generated.
4.2.3. Surveying the site The survey conducted by the PV plant designer will check for
Shade free area available (approximately 8 m2 is required for 1 kW of solar PV)
Azimuth – the orientation of the roof. South facing is ideal (in the Northern Hemisphere)
Solar access – percentage of time the PV array receives the full, unshaded power of the sun
4.2.4. Calculating the amount of energy needed The system load is determined by determining the wattage of the devices that will be powered by
the solar system and the number of hours that load will need to be supported. The amount of
energy required can be optimised by using energy conserving devices. The cost can be optimised by
considering whether heavy/variable load should run on solar power
4.2.5. Sizing the solar PV system The size of the solar PV system is calculated by considering
The number of panels needed to meet the energy requirement based on the site insolation
levels and panel rating. A 30% safety factor is usually added to the energy requirement
Battery size, based on the number of hours of autonomy, depth of discharge, and battery
efficiency
Inverter size, based on the total wattage of all supported devices with a safety factor of 45%
Mounting structures to bear the panels’ weight even under high wind
Sizing for miscellaneous components such as wires, connectors, switches, fuses, etc. that
could fail if they are not correctly rated for the application
4.2.6. Component selection and costing The solar PV plant is expected to last for 25 years. Therefore suppliers and products should be
selected not just be considering price alone, but also considering the technical specifications,
reliability, warranty periods, etc.
4.2.7. Detailed design The detailed design is the more actionable form of the captive solar PV installation. Data collected
from the previous 6 steps is accumulated, a layout of the installation is prepared on paper, and
obvious engineering fallacies are removed.

19
4.3. Designing a Solar-Diesel Hybrid Plant Due to some of the limitations of current solar technology, solar-diesel hybrids are very popular in
India where the solar system operates in tandem with a diesel generator, supporting a wider variety
of loads and achieving diesel savings. While this does present a best-of-both-worlds solution, it
should be implemented by an experienced and knowledgeable installer due to several issues that
can be encountered in integrating solar with diesel which can have a direct impact on savings
possible and the returns from investment.
4.3.1. Optimising power supply using a solar-diesel hybrid The critical part in designing a solar diesel hybrid plant is determining the load mix between solar
and diesel power. While the theoretical maximum savings are achieved by using the largest possible
solar installation to minimise the load supported by diesel, this may not be the optimal configuration
in practical applications due to
4.3.1.1. Frequency and power quality
The frequency of the output AC power can vary beyond acceptable levels as the loading factor5 of
the diesel generator varies (as a result of introducing an intermittent solar power source into the
mix), reducing the quality of power. Some modern day devices require high quality power to
operate.
4.3.1.2. Reverse Current Flow
Some reverse current will flow into the diesel generator when the output of the solar power exceeds
that of the load demand. There is a threshold beyond which this reverse flow causes the diesel
generator to trip, removing the reference voltage for the solar plant and causing the system to break
down.
4.3.1.3. Efficiency and Minimum Loading
Running a generator at loads below its minimum load factor6 for prolonged periods affects its
efficiency which in turn impacts fuel consumption, maintenance costs, and useful life. The generator
may operate below its minimum load if a sizeable solar system is integrated into the supply and
results in decreased lifecycle savings of the solar-diesel generator system.
Due to these reasons it is recommended that the solar system size be limited to 25% of the diesel generator set capacity i.e. if the diesel generator capacity is 1,000 kVA, it is recommended that the solar system be limited to 250 kW at most. Specific vendor solutions may permit higher solar system size integration with diesel generators.
5 Load factor refers to the demand load/capacity. Therefore, for a load of 400 kW and a DG capacity of 1000 kVa (800 kW) the load factor becomes 50%.
6 Generator suppliers usually specify a minimum load factor below which the life of the lubricant, generator efficiency fall and the engine starts to slobber
(emit black smoke).

20
4.3.2. Prominent solar-diesel hybrid installations Some of the prominent solar-diesel hybrid installations in India include
Scope International – SunEdision has put up a 100-kW solar plant on roof of building of
Scope International in Chennai. Scope is Standard Chartered Bank's captive BPO and is
headquartered in Chennai (more here)
Alpine Knits – This Spinning Mill in Tirupur district of Tamil Nadu has the distinction of
having a MegaWatt(MW) Scale, Roof Mounted, Grid-Connected Solar power plant with
unique DG synchronization capabilities; the first of its kind in India, and only the second in
the World (more here)
The initial cost of a solar PV plant is higher than a diesel generator, but more than pays for itself through savings in fuel cost
Solar PV plants have few moving parts and therefore require very little maintenance
Without net-metering, surplus power from PV plants cannot be monetised
PV plants do not generate power during non-daylight hours or on cloudy days
A PV plant should be limited to 25% of diesel generator capacity in a hybrid plant to avoid solar-diesel integration issues
Take
away
s

21
5. Favourable Policies
Both central and state policies have been announced in recent years to promote the adoption of
solar power. We provide highlights of policy support below.
5.1. Jawaharlal Nehru National Solar Mission (JNNSM) The Jawaharlal Nehru National Solar Mission (JNNSM) changed the solar landscape in India. Phase 1
of the mission providing a slew of incentives for grid connected, off-grid, decentralised solar
applications, rooftop and small solar plants. Captive solar plants fall under the off-grid and
decentralised applications and are eligible for Central Financial Assistance, summarised below.
Table 5: JNNSM - Salient Features
S. No. Category Maximum capacity
GOI Support
System with battery backup
System without battery backup
Interest Subsidy
1 Individuals for all applications
1 kWp Rs.57/watt or 30% of project cost whichever is less
Rs.30/watt or 30% of project cost whichever is less
Soft loans @5% p.a.
2 Individuals for Irrigation, & community drinking water applications
5 kWp Rs.57/watt or 30% of project cost whichever is less
Rs.30/watt or 30% of project cost whichever is less
Soft loans @5% p.a.
3 Non-commercial/ commercial/industrial applications
100 kWp Rs.51/watt or 30% of project cost whichever is less
Rs.30/watt or 30% of project cost whichever is less
Soft loans @5% p.a.*
4 Non-commercial/ commercial/industrial Mini-grids
250 kWp Rs.51/watt or 30% of project cost whichever is less
Rs.27/watt or 30% of project cost whichever is less
Soft loans @5% p.a.*
*for commercial/ industrial entities either of capital or interest subsidy will be available7
There are further incentives available under the scheme, such as for special category states and
rural SPV implementation.
It should be noted, however, that there have been many issues faced in collecting subsidies under the scheme.
7 http://mnre.gov.in/file-manager/UserFiles/amendmends-benchmarkcost-aa-jnnsm-2013-14.pdf
22
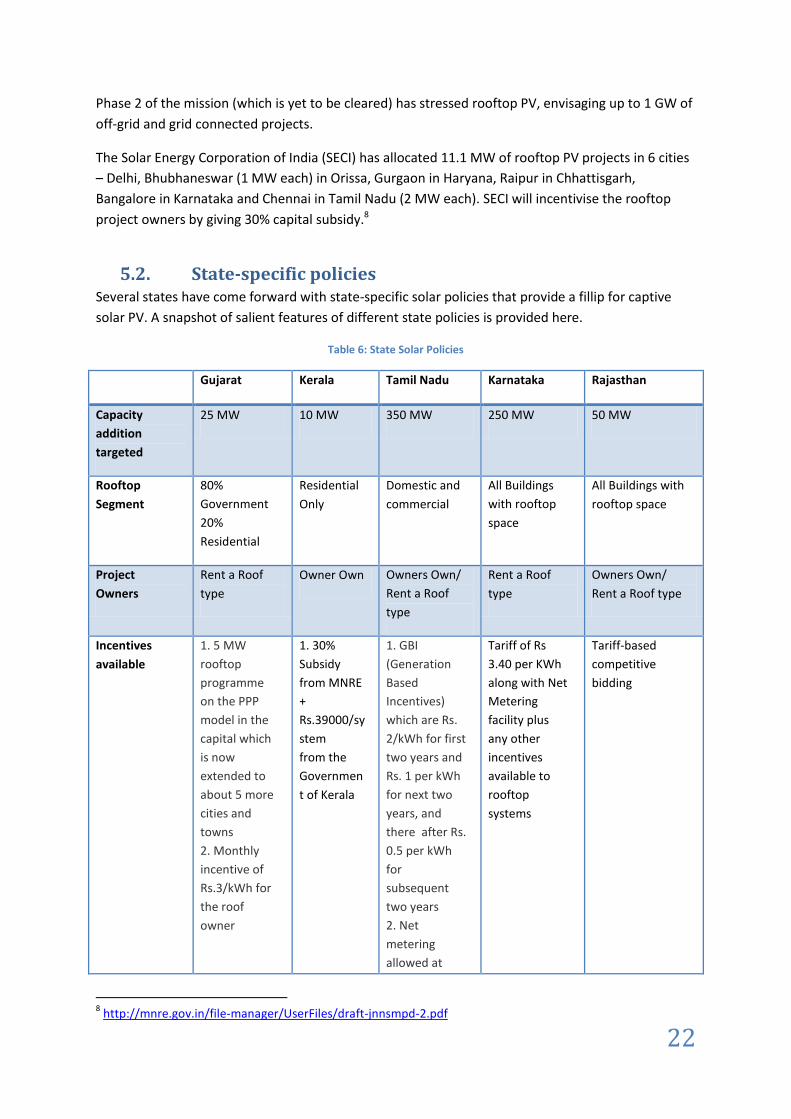
Phase 2 of the mission (which is yet to be cleared) has stressed rooftop PV, envisaging up to 1 GW of
off-grid and grid connected projects.
The Solar Energy Corporation of India (SECI) has allocated 11.1 MW of rooftop PV projects in 6 cities
– Delhi, Bhubhaneswar (1 MW each) in Orissa, Gurgaon in Haryana, Raipur in Chhattisgarh,
Bangalore in Karnataka and Chennai in Tamil Nadu (2 MW each). SECI will incentivise the rooftop
project owners by giving 30% capital subsidy.8
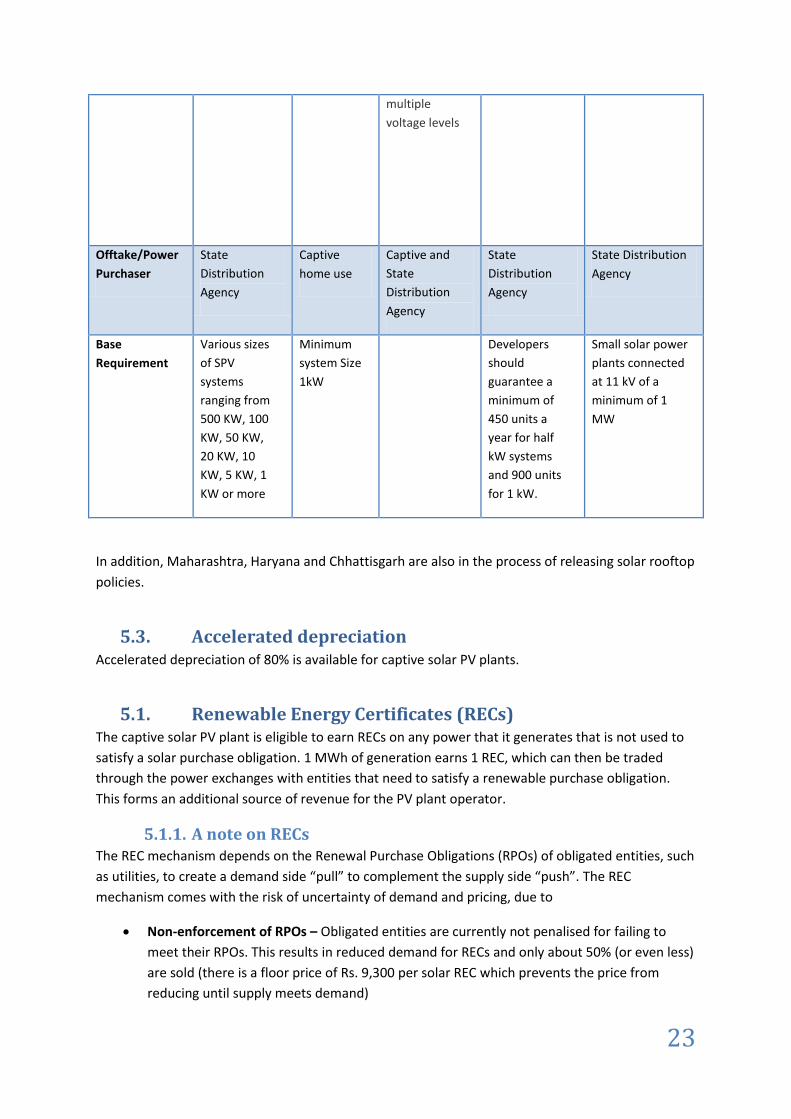
5.2. State-specific policies Several states have come forward with state-specific solar policies that provide a fillip for captive
solar PV. A snapshot of salient features of different state policies is provided here.
Table 6: State Solar Policies
Gujarat Kerala Tamil Nadu Karnataka Rajasthan
Capacity
addition
targeted
25 MW 10 MW 350 MW 250 MW 50 MW
Rooftop
Segment
80%
Government
20%
Residential
Residential
Only
Domestic and
commercial
All Buildings
with rooftop
space
All Buildings with
rooftop space
Project
Owners
Rent a Roof
type
Owner Own Owners Own/
Rent a Roof
type
Rent a Roof
type
Owners Own/
Rent a Roof type
Incentives
available
1. 5 MW
rooftop
programme
on the PPP
model in the
capital which
is now
extended to
about 5 more
cities and
towns
2. Monthly
incentive of
Rs.3/kWh for
the roof
owner
1. 30%
Subsidy
from MNRE
+
Rs.39000/sy
stem
from the
Governmen
t of Kerala
1. GBI
(Generation
Based
Incentives)
which are Rs.
2/kWh for first
two years and
Rs. 1 per kWh
for next two
years, and
there after Rs.
0.5 per kWh
for
subsequent
two years
2. Net
metering
allowed at
Tariff of Rs
3.40 per KWh
along with Net
Metering
facility plus
any other
incentives
available to
rooftop
systems
Tariff-based
competitive
bidding
8 http://mnre.gov.in/file-manager/UserFiles/draft-jnnsmpd-2.pdf
23
multiple
voltage levels
Offtake/Power
Purchaser
State
Distribution
Agency
Captive
home use
Captive and
State
Distribution
Agency
State
Distribution
Agency
State Distribution
Agency
Base
Requirement
Various sizes
of SPV
systems
ranging from
500 KW, 100
KW, 50 KW,
20 KW, 10
KW, 5 KW, 1
KW or more
Minimum
system Size
1kW
Developers
should
guarantee a
minimum of
450 units a
year for half
kW systems
and 900 units
for 1 kW.
Small solar power
plants connected
at 11 kV of a
minimum of 1
MW
In addition, Maharashtra, Haryana and Chhattisgarh are also in the process of releasing solar rooftop
policies.
5.3. Accelerated depreciation Accelerated depreciation of 80% is available for captive solar PV plants.
5.1. Renewable Energy Certificates (RECs) The captive solar PV plant is eligible to earn RECs on any power that it generates that is not used to
satisfy a solar purchase obligation. 1 MWh of generation earns 1 REC, which can then be traded
through the power exchanges with entities that need to satisfy a renewable purchase obligation.
This forms an additional source of revenue for the PV plant operator.
5.1.1. A note on RECs The REC mechanism depends on the Renewal Purchase Obligations (RPOs) of obligated entities, such
as utilities, to create a demand side “pull” to complement the supply side “push”. The REC
mechanism comes with the risk of uncertainty of demand and pricing, due to
Non-enforcement of RPOs – Obligated entities are currently not penalised for failing to
meet their RPOs. This results in reduced demand for RECs and only about 50% (or even less)
are sold (there is a floor price of Rs. 9,300 per solar REC which prevents the price from
reducing until supply meets demand)

24
Future of REC price – There is uncertainty on the pricing of RECs beyond 2017. EAI
estimates that Solar REC prices will be similar to current prices of non Solar RECs – a band of
Rs. 1,500 to Rs. 3,900 per REC – between 2017 and 2022.
The Jawaharlal Nehru National Solar Mission (JNNSM) provides attractive incentives such as capital subsidy of 30%
o Issues have been faced in collecting subsidy Several states have announced state specific solar policies, and more
states are formulating their own solar policies Accelerated depreciation of 80% is also available Captive PV plants are eligible for RECs but lack of enforcement of RPOs
and uncertainty in price beyond 2017 should be considered
Take
away
s
25
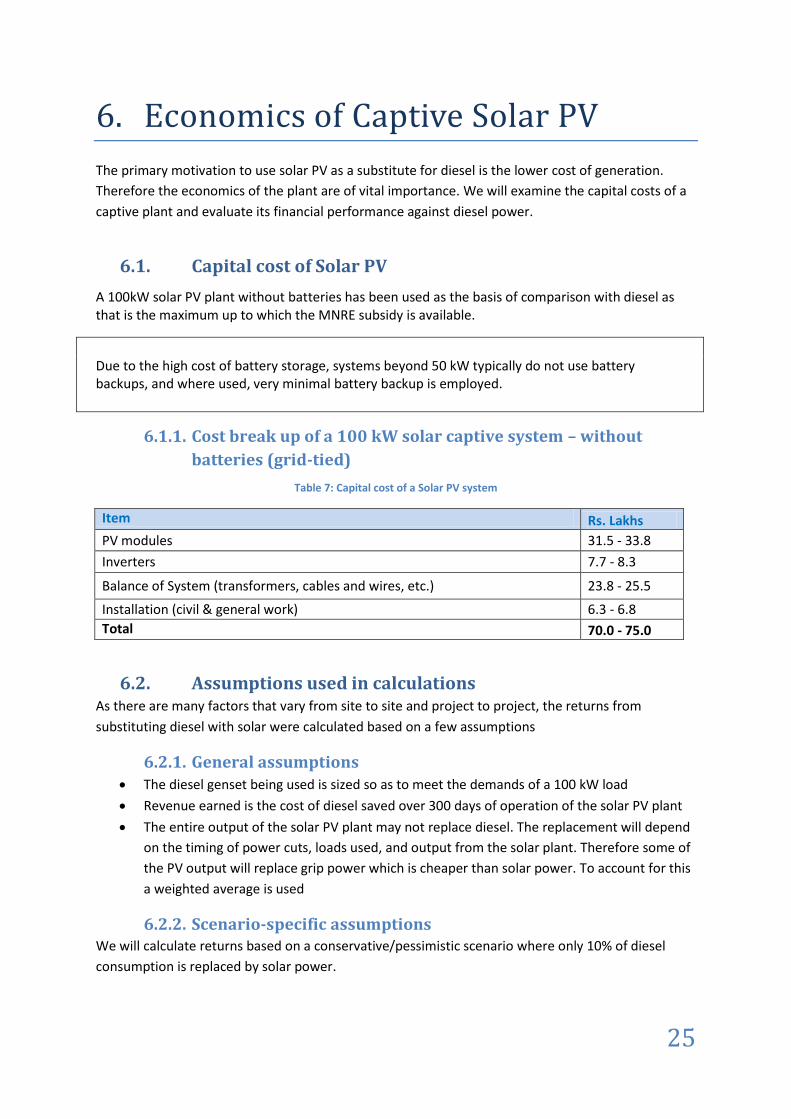
6. Economics of Captive Solar PV
The primary motivation to use solar PV as a substitute for diesel is the lower cost of generation.
Therefore the economics of the plant are of vital importance. We will examine the capital costs of a
captive plant and evaluate its financial performance against diesel power.
6.1. Capital cost of Solar PV
A 100kW solar PV plant without batteries has been used as the basis of comparison with diesel as that is the maximum up to which the MNRE subsidy is available.
Due to the high cost of battery storage, systems beyond 50 kW typically do not use battery backups, and where used, very minimal battery backup is employed.
6.1.1. Cost break up of a 100 kW solar captive system – without
batteries (grid-tied)
Table 7: Capital cost of a Solar PV system
Item Rs. Lakhs
PV modules 31.5 - 33.8
Inverters 7.7 - 8.3
Balance of System (transformers, cables and wires, etc.) 23.8 - 25.5
Installation (civil & general work) 6.3 - 6.8
Total 70.0 - 75.0
6.2. Assumptions used in calculations As there are many factors that vary from site to site and project to project, the returns from
substituting diesel with solar were calculated based on a few assumptions
6.2.1. General assumptions The diesel genset being used is sized so as to meet the demands of a 100 kW load
Revenue earned is the cost of diesel saved over 300 days of operation of the solar PV plant
The entire output of the solar PV plant may not replace diesel. The replacement will depend
on the timing of power cuts, loads used, and output from the solar plant. Therefore some of
the PV output will replace grip power which is cheaper than solar power. To account for this
a weighted average is used
6.2.2. Scenario-specific assumptions We will calculate returns based on a conservative/pessimistic scenario where only 10% of diesel
consumption is replaced by solar power.
26
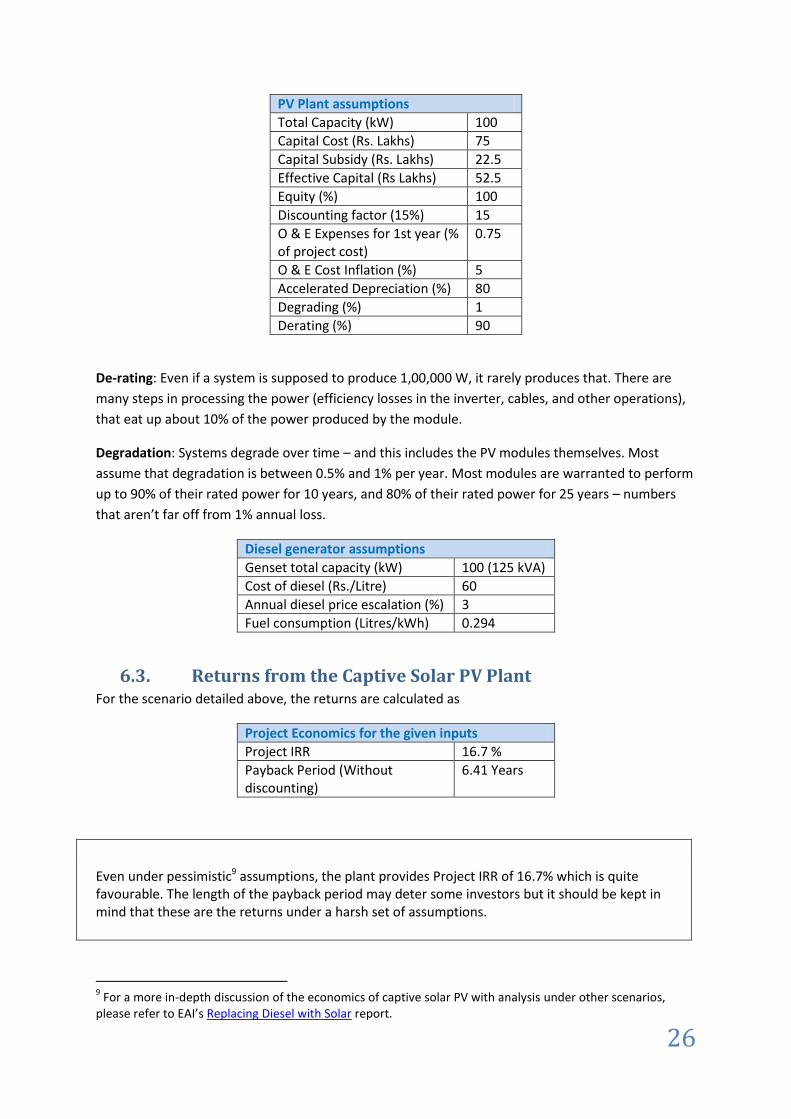
PV Plant assumptions
Total Capacity (kW) 100
Capital Cost (Rs. Lakhs) 75
Capital Subsidy (Rs. Lakhs) 22.5
Effective Capital (Rs Lakhs) 52.5
Equity (%) 100
Discounting factor (15%) 15
O & E Expenses for 1st year (% of project cost)
0.75
O & E Cost Inflation (%) 5
Accelerated Depreciation (%) 80
Degrading (%) 1
Derating (%) 90
De-rating: Even if a system is supposed to produce 1,00,000 W, it rarely produces that. There are
many steps in processing the power (efficiency losses in the inverter, cables, and other operations),
that eat up about 10% of the power produced by the module.
Degradation: Systems degrade over time – and this includes the PV modules themselves. Most
assume that degradation is between 0.5% and 1% per year. Most modules are warranted to perform
up to 90% of their rated power for 10 years, and 80% of their rated power for 25 years – numbers
that aren’t far off from 1% annual loss.
Diesel generator assumptions
Genset total capacity (kW) 100 (125 kVA)
Cost of diesel (Rs./Litre) 60
Annual diesel price escalation (%) 3
Fuel consumption (Litres/kWh) 0.294
6.3. Returns from the Captive Solar PV Plant For the scenario detailed above, the returns are calculated as
Project Economics for the given inputs
Project IRR 16.7 %
Payback Period (Without discounting)
6.41 Years
Even under pessimistic9 assumptions, the plant provides Project IRR of 16.7% which is quite favourable. The length of the payback period may deter some investors but it should be kept in mind that these are the returns under a harsh set of assumptions.
9 For a more in-depth discussion of the economics of captive solar PV with analysis under other scenarios,
please refer to EAI’s Replacing Diesel with Solar report.
27
Several other costs associated with diesel, such as transportation and storage costs, have not been
considered which would make the returns more favourable even under a conservative scenario.
6.4. The BOO(T) Model
The Build Own Operate (Transfer) model is an option that can be considered by enterprises that are
hesitant to invest the large amounts that are required initially to install a captive PV plant.
The BOO model allows energy consumers to buy the energy generated by the solar plant, just as they buy power from the utility, rather than buy the plant itself. A variation of the model allows the plant to be Transferred (T) to the consumer at the end of a certain period.
The system provider bears the capital expenditure for the solar plant provided the customer
satisfied certain criteria (such as credit rating or provides a bank guarantee) and enters into a power
purchase agreement (anywhere between 5-15 years) with the provider.
The cost of a 100 kW solar PV system is Rs. 70-75 lakhs Even with conservative assumptions, Project IRR of 16.7% with a
payback period of 6.41 years can be achieved Due to the high cost of batteries, systems beyond 50 kW either do not
use batteries or employ minimal battery backup A BOO(T) model can be considered where the energy produced by the
plant, rather than the plant itself, can be purchased
Take
away
s
28
7. Conclusion
Solar PV plants can provide a viable solution for firms grappling with the power shortage and
crippling cost of diesel. While complete replacement of diesel generators might not be possible
under current solar technology, significant savings can be achieved through partial abatement of
diesel using solar-diesel hybrid systems. Achieving favourable returns from the project, however,
involves careful evaluation of several factors
The potential to generate solar energy at your location – e.g., mist in winter can limit solar
power production
Constraints that limit the size of solar PV plant that can be installed – 1 kWp of crystalline
solar panels typically require 8 m2 of shade-free area and generates 4 kWh of power per day
(on average)
The nature and duration of loads to be supported – heavy inrush current from equipment
using electric motors may require diesel generator support
The configuration of the solar plant
Timings of load shedding that affect the amount of solar power available to abate diesel
Issues with integrating solar plants with diesel generators – We recommend limiting the
solar plant capacity to 25% of generator capacity (subject to some vendor specific solutions)
Whether buying the solar energy alone would be better than buying the solar plant
Identifying capable and effective vendors
Even under a conservative scenario, IRRs of 16.7% with payback period of 6.4 years are possible
from captive PV plants. Financial returns can be improved through a thorough understanding of the
factors that affect solar PV performance and careful system design and integration.
7.1. Want to know more?
For a more detailed discussion on substituting diesel with solar, please refer to EAI’s Replacing Diesel
with Solar report. This exhaustive study includes in-depth discussions on returns from solar PV plants
under multiple scenarios, design of solar PV plants, technology options, applications of solar PV, and
the breadth and depth of opportunities in this sector.
29
8. Replacing Diesel with Solar Report
Looking to save on diesel by moving to captive solar power? EAI’s Replacing Diesel with Solar report
is a one-stop resource for all the information you will need to assess, implement, and profit from
substituting diesel with solar. Within this report you will find
Captive solar PV technology and components
Constraints in replacing diesel with solar
Government incentives and regulations
Inputs on capital and operational costs and financial scenario analysis
Case studies for those businesses that already use solar for captive power
Financing options
Vendors, component suppliers, and system integrators
List of solar PV captive power plant systems all over India
Please click here for detailed contents, critical questions answered, and a free preview of the report.

30
9. About EAI
EAI is a boutique research and consulting firm in renewable energy technologies. Our expertise
ranges from Solar PV and Wind Energy to Algae fuels and Jatropha biodiesel. Our work has been
sought after by some of the largest corporate and multilateral organizations in the world such as The
Bill and Melinda Gates Foundation, Reliance Industries, World Bank, PepsiCo, iPLON, Vedanta Group,
Accenture, Boston Consulting Group, and more.
Our services for clients seeking to abate diesel consumption through renewable energy include
Analysis of the technical and economic feasibility of integrating various renewable
energy/power sources in your operations
Identification and due diligence of vendors
Structuring PPAs for solar, wind, and biomass power
Complete guidance on regulations, approvals, processes, and procedures involved in
procuring and integrating RE power
EAI provides a range of services for various stakeholders in the Renewable Energy and Cleantech
space, covering
Developer/IPP Assistance
Assisting Industrial consumers go green
Diversification into/within renewable energy
Market entry for international firms
Research and Publications
Renewable energy catalysis
Please visit http://www.consult.eai.in/ for more information on our consulting services.
To hear more on how we can help your organisation abate diesel consumption through renewable
energy, write to us at [email protected].