dietary intake of total polyphenol and polyphenol classes and the … · introduction colorectal...
TRANSCRIPT

https://helda.helsinki.fi
Sediment properties, biota and local habitat structure explain
variation in the erodibility of coastal sediments
Joensuu, Laura Anne Mari
2018
Joensuu , L A M , Pilditch , C A , Harris , R , Hietanen , S S , Pettersson , H & Norkko , A M
2018 , ' Sediment properties, biota and local habitat structure explain variation in the
erodibility of coastal sediments ' Limnology and Oceanography , vol. 63 , pp. 173-186 . https://doi.org/10.1002/lno.10622
http://hdl.handle.net/10138/233500
https://doi.org/10.1002/lno.10622
Downloaded from Helda, University of Helsinki institutional repository.
This is an electronic reprint of the original article.
This reprint may differ from the original in pagination and typographic detail.
Please cite the original version.
Sediment properties, biota, and local habitat structure explainvariation in the erodibility of coastal sediments
M. Joensuu ,1,2* C. A. Pilditch,3 R. Harris,3 S. Hietanen ,1,2 H. Pettersson,4 A. Norkko2,5
1Department of Environmental Sciences, University of Helsinki, Helsinki, Finland2Faculty of Biological and Environmental Sciences, Tv€arminne Zoological Station, University of Helsinki, Hanko, Finland3Department of Biological Sciences, University of Waikato, Hamilton, New Zealand4The Marine Research Unit, Finnish Meteorological Institute, Helsinki, Finland5Baltic Sea Centre, Stockholm University, Stockholm, Sweden
Abstract
Sediment resuspension is a frequent phenomenon in coastal areas and a key driver for many ecosystem
functions. Sediment resuspension is often linked to biological and anthropogenic activities, which in combi-
nation with hydrodynamic forcing initiate sediment erosion and resuspension, if the erosion threshold (sc) is
exceeded. Despite its importance to ecosystem functions very few studies have provided measurements on
natural assemblages for subtidal sediments. The aim of this study was to determinate key environmental vari-
ables regulating sediment resuspension potential across a sedimentary gradient in a subtidal coastal environ-
ment. In order to explore this, we sampled 16 sites encompassing a wide variety in environmental variables
(e.g., grain size distribution, macrofaunal communities, vegetation) in the Gulf of Finland, Baltic Sea. A core-
based erosion device (EROMES) was used to determine sediment resuspension potential measures of erosion
threshold, erosion rate (ER), and erosion constant (me). Based on abiotic and biotic properties sampled, sedi-
ments diverged into two distinct groups; cohesive (“muddy”) and noncohesive (“sandy”) sediments. Results
showed that abiotic sediment properties explained 38–53% and 15–36% of the total variation in resuspension
potential measures in “muddy” and “sandy” sediments, respectively. In cumulative models, biota accounted
for 12–26% and 6–24% to the total variation in “muddy” and “sandy” sediments, respectively. Sediment
erodibility and resuspension potential of natural sediments is highly variable from local habitats to a larger
seascape scale. Our results underline the importance of biota to resuspension potential measures in spatially
variable environments.
Coastal areas maintain valuable ecosystem services and
functions for human and marine life. These dynamic envi-
ronments are highly productive and diverse, and they play a
central role in the transfer of matter, energy and organisms
(Barbier et al. 2011; Levin et al. 2001). Sediment resuspen-
sion is a frequent phenomenon in coastal areas and a key
driver for many ecosystem functions (Danielsson et al.
2007). For example, pollutant dispersal, seafloor colonization
dynamics, and biogeochemical cycles are all influenced by
sediment resuspension (Warrick 2013). In addition, sediment
resuspension elevates water turbidity and changes oxygen
concentrations impacting both benthic and pelagic ecology
(Alongi and McKinnon 2005; Bilotta and Brazier 2008; Alm-
roth et al. 2009). Sediment resuspension in shallow coastal
areas is generally regulated by wind-waves and currents that
generate shear stress on the sediment surface (e.g., Sanford
and Maa 2001; Ziervogel and Bohling 2003; Danielsson et al.
2007; Valanko et al. 2010; Green and Coco 2014), but inter-
nal waves, seiches, biological activity, and anthropogenic
actions can also cause sediment resuspension (e.g., Weyhen-
meyer 1998; Duplisea et al. 2001). Erosion and resuspension
in cohesive “muddy” sediments is often a result of bed fail-
ure (Hayter and Mehta 1986) whereas in non-cohesive
“sandy” sediments, sediment erosion occurs when shear
stress on the sediment surface is strong enough to initiate
particle motion, i.e., erosion threshold (sc) is exceeded (Mur-
ray 1977; Mitchener and Torfs 1996).
The resistance of sediment to resuspension is influenced
by a multitude of biogeochemical features (Grabowski et al.
*Correspondence: [email protected]
Additional Supporting Information may be found in the online versionof this article.
This is an open access article under the terms of the Creative CommonsAttribution-NonCommercial License, which permits use, distribution and
reproduction in any medium, provided the original work is properlycited and is not used for commercial purposes.
173
LIMNOLOGYand
OCEANOGRAPHYLimnol. Oceanogr. 63, 2018, 173–186
VC 2017 The Authors Limnology and Oceanography published by Wiley Periodicals, Inc.on behalf of Association for the Sciences of Limnology and Oceanography
doi: 10.1002/lno.10622
2011), which are constantly altered by biological activity.
The main sediment feature controlling erosion threshold is
grain size distribution, but estimating erosion processes of
natural sediments has proven to be difficult, because they
are often heterogeneous mixtures of different grain sizes
characterized by vertical gradients in sediment properties
(Amos et al. 1992; Maa et al. 1998, Sanford and Maa 2001;
Aberle et al. 2004). In natural sediments, the seafloor sedi-
ment composition and consolidation defines the erosion
threshold and erosion rate. For example, erosion of a mud
and sand mixture depends upon the electrochemical forces
of the mud that bind particles together, as well as the physi-
cal properties of the sand, such as grain size diameter, but
also the packing density, internal structure of the sediment,
and stress history (Jacobs et al. 2011). In addition, the chem-
ical and physical characteristics are also constantly modified
by benthic macrofauna through feeding, moving, and eges-
tion (Graf and Rosenberg 1997). The effect of benthic macro-
fauna on sediment erodibility differs depending on the
organism’s size, abundance, physical features and function-
ing in and on the sediment (Widdows and Brinsley 2002;
Grabowski et al. 2011; Harris et al. 2015, 2016). Moreover,
the influence of macrofauna may change with sediment
type, due to the natural variation in species abundance and
richness in different habitats. Another important biological
sediment property, especially in cohesive “muddy” sediment,
is a microbially produced biofilm. Biofilms form when indi-
vidual particles are coated with exopolymeric substances
(EPS; Decho 2000; Black et al. 2002). EPS create a smooth
biolaminate layer on the sediment surface (Decho 2000;
Black et al. 2002) that stabilize the sediment, and if the bio-
film is not disturbed by grazing fauna or waves, biolamina-
tion of microphytobenthos may develop on sediment
surfaces (Reise 2002).
In general, hydrodynamics regulate sediment dispersal,
deposition and resuspension (e.g., J€onsson et al. 2005; Green
and Coco 2014). Fine sediment particles are often deposited
and accumulate in low energy environments forming a
“muddy” sediment (Winterwerp and van Kesteren 2004). In
contrast, sediment is frequently resuspended in high energy
environments, which prevents fine sediment deposition and
accumulation (J€onsson et al. 2005; Fagherazzi and Wiberg
2009). Differences in erosion behavior of cohesive “muddy”
and noncohesive “sandy” sediments is well acknowledged in
the literature. In both sediment types, initial erosion starts
with the smallest particles that are easiest to move. This
often occurs as aggregate or “floc” erosion in “muddy” sedi-
ments (Winterwerp and van Kesteren 2004) and bedload
transport of individual grains in “sandy” sediments (Mitch-
ener and Torfs 1996; Jacobs et al. 2011). Sediment erosion
and transportation processes, however, are also influenced
by the local habitat structure. This can be observed on a
small-scale with variations in bed structure (e.g., crest and
trough systems, Lanuru et al. 2007) or at a seascape-scale
encompassing various habitat types. For example, the
natural variation of vegetated and clear patches in local hab-
itat will affect macrofaunal community composition and
local hydrodynamics, and therefore increase the variability
in sediment characteristics and erodibility. In subtidal
coastal regions, these vegetation patches typically include
various species of vascular plants, which provide suitable
habitats for benthic fauna and increase sediment stability by
dampening water motions and thus sediment erosion (Mad-
sen et al. 2001; James et al. 2004; Nepf 2012). For example,
macrophytes may increase sediment stability by reducing
shear stress on the sediment surface by approximately 20–
80% through changes in flow conditions (Wang et al. 2010).
Indeed, natural variations in hydrodynamics, sediment prop-
erties, macrofaunal compositions, and vegetation influence
erodibility and thus sediment resuspension.
Climate change scenarios predict changes in wind speeds
and direction, and frequency of extreme wind events in the
future (IPCC 2013). These changes may increase resuspen-
sion frequencies and expose new areas to resuspension (Dan-
ielsson et al. 2007). Even though erosion threshold is among
the key parameters of sediment transport modelling (Sanford
2008), the variability in sediment erodibility and resuspen-
sion of natural sediments has remained poorly quantified
(Sanford and Maa 2001). Much of the research investigating
sediment erosion processes of natural sediments has been
done on intertidal flats, and only few of these have tried to
encompass a sedimentary gradient with natural variation in
environmental variables, especially considering also the
effect of biota. Moreover, only little research has accounted
for the patchiness of different habitats at a larger seascape
scale. Hence, we still lack a comprehensive understanding of
sediment characteristics controlling sediment resuspension
across sedimentary gradients in subtidal coastal environ-
ments. Therefore, it is important to quantify the sediment
characteristics and also the large-scale habitat variability con-
trolling this phenomenon.
The main objectives of the present study were to (1)
determine the resuspension potential of subtidal sediments
across a sedimentary gradient extending the analysis from a
small-scale variation within a local habitat to seascape vari-
ability across a coastal environment, and (2) identify the sed-
iment characteristics and role of macrofauna in controlling
the resuspension potential. In order to explore this, we con-
ducted a field survey across a wide spatial (approx. 19 km)
sedimentary gradient in shallow coastal areas of the Baltic
Sea. In this area, hydrodynamic forcing is dominated by fre-
quent upwelling and strong wind-wave events (e.g., Haapala
1994; Lehmann & Myrberg 2008; Soomere et al. 2008; Val-
anko et al. 2015). Based on our current knowledge of erosion
processes in “muddy” and “sandy” sediments, we expected
the importance of different interactions between physical
and biological sediment properties to change along the sedi-
mentary gradient. Previous studies from the study area have
shown that the sediment erosion rate is not regulated only
by linear or monotonic relationship with hydrodynamic
Joensuu et al. Variation in the erodibility of coastal sediments
174
forcing, but also depends on the local sediment characteristics
and interaction between sedimentary environment and mac-
rofauna (Valanko et al. 2010). Specifically, our focus was to
explore the role of benthic macrofauna, and how species rich-
ness, abundance and individual size influence the erodibility,
while also accounting for variations in habitat characteristics.
Materials and Methods
Study sites
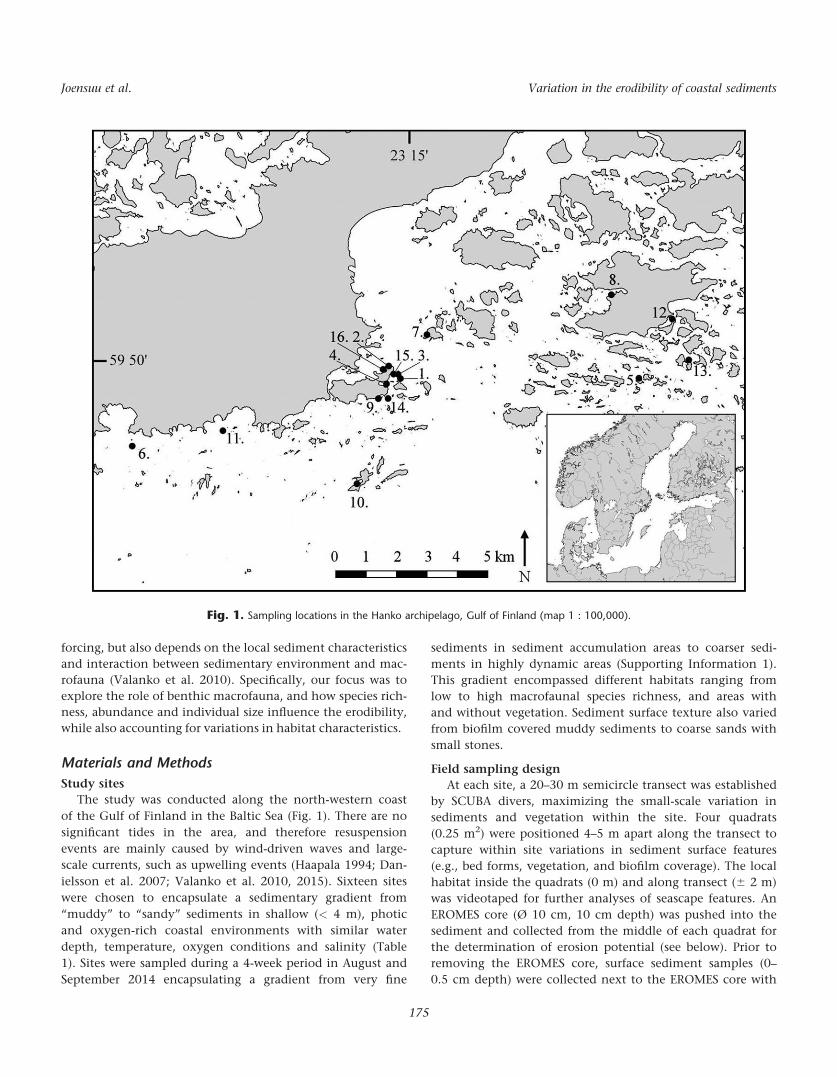
The study was conducted along the north-western coast
of the Gulf of Finland in the Baltic Sea (Fig. 1). There are no
significant tides in the area, and therefore resuspension
events are mainly caused by wind-driven waves and large-
scale currents, such as upwelling events (Haapala 1994; Dan-
ielsson et al. 2007; Valanko et al. 2010, 2015). Sixteen sites
were chosen to encapsulate a sedimentary gradient from
“muddy” to “sandy” sediments in shallow (< 4 m), photic
and oxygen-rich coastal environments with similar water
depth, temperature, oxygen conditions and salinity (Table
1). Sites were sampled during a 4-week period in August and
September 2014 encapsulating a gradient from very fine
sediments in sediment accumulation areas to coarser sedi-
ments in highly dynamic areas (Supporting Information 1).
This gradient encompassed different habitats ranging from
low to high macrofaunal species richness, and areas with
and without vegetation. Sediment surface texture also varied
from biofilm covered muddy sediments to coarse sands with
small stones.
Field sampling design
At each site, a 20–30 m semicircle transect was established
by SCUBA divers, maximizing the small-scale variation in
sediments and vegetation within the site. Four quadrats
(0.25 m2) were positioned 4–5 m apart along the transect to
capture within site variations in sediment surface features
(e.g., bed forms, vegetation, and biofilm coverage). The local
habitat inside the quadrats (0 m) and along transect (6 2 m)
was videotaped for further analyses of seascape features. An
EROMES core (Ø 10 cm, 10 cm depth) was pushed into the
sediment and collected from the middle of each quadrat for
the determination of erosion potential (see below). Prior to
removing the EROMES core, surface sediment samples (0–
0.5 cm depth) were collected next to the EROMES core with
Fig. 1. Sampling locations in the Hanko archipelago, Gulf of Finland (map 1 : 100,000).
Joensuu et al. Variation in the erodibility of coastal sediments
175
four syringes (Ø 2.1 cm). After the collection, EROMES cores
and syringes were transferred to a water bath at in situ-
temperatures. Surface sediment samples were pooled,
homogenized, then separated into two subsamples and fro-
zen prior to analyses of sediment characteristics.
Determination of sediment erosion measures
A portable EROMES-device (Sch€unemann and K€uhl 1991)
was used to determine sediment resuspension potential mea-
sures. The EROMES-device provides a relative measurement
of sediment stability by generating an instantaneous turbu-
lence at the sediment surface that initiates sediment particle
motion. Hence, although the mechanism by which the tur-
bulence shear is generated does not mimic natural hydrody-
namic forcing, it does provide easily replicated relative
measures of sediment stability on intact communities allow-
ing across site comparisons. A total of 59 EROMES cores
were collected from 16 sites. Water level in the cores were
adjusted to 20 cm above the sediment surface by removing
excess water slowly and cautiously leaving the sediment-
water interface undisturbed and intact. A propeller and an
optical backscatter sensor were positioned 3 cm and 6.5 cm
above the sediment to generate shear stress and measure tur-
bidity, (respectively), in the EROMES cores. A baffle ring was
positioned 1.5 cm above the sediment to prevent rotational
water flow. The propeller revolutions have been converted to
bed shear stresses using the calibration from quartz sand
with known critical shear stress (Sch€unemann and K€uhl
1991; Andersen 2001). The bed shear stress was increased
every 2 min by 0.1 N m22 from 0 to 2.0 N m22 and water
samples were collected to calibrate the optical backscatter
sensor into suspended solids concentration (SSC) (Andersen
2001; Andersen and Pejrup 2002). Separate SSC calibrations
were made for each site (R2 5 0.87–0.99, n 5 4–22). Erosion
rates (g m22 s21) were then calculated from the time derivate
of SSC in every bed shear stress interval, and used to deter-
minate the resuspension potential measures. The erosion
threshold (sc; N m22) was defined at the erosion rate of 0.1 g
m22 s21 (Andersen 2001; Andersen et al. 2005), and was
equal to initial bed erosion occurring after the erosion of
unconsolidated fine surface material. The erosion rate (ER; g
m22 s21) describes the quantity of eroding sediment at a
fixed bed shear stress at 0.5 N m22 (Andersen 2001; Ander-
sen et al. 2005; Lumborg et al. 2006; Harris et al. 2016). The
erosion constant (me; g N21 s21) was used to analyze the
change in erosion rate with increasing bed shear stress
(Mitchener and Torfs 1996). To estimate me, erosion rates
were plotted against bed shear stress and me was derived
from the slope between 1.0 and 1.6 N m22 (Harris et al.
2015), the range representing erosion process after the initial
erosion. Since the sc is related to the initial motion of par-
ticles, high values refer to a more stable sediment, with
greater shear stress needed to exceed the sc. In contrast, high
ER represents a less stable sediment, as sediment is eroded
more rapidly from the bed. Similarly, high me indicates a
more rapid erosion rate with increasing bed shear stress. The
sc and ER describe the early stage of erosion occurring in the
surface layer of the sediment, whereas me describes later
stage erosion of subsurface sediments, which occurs after the
surface layer has been eroded.
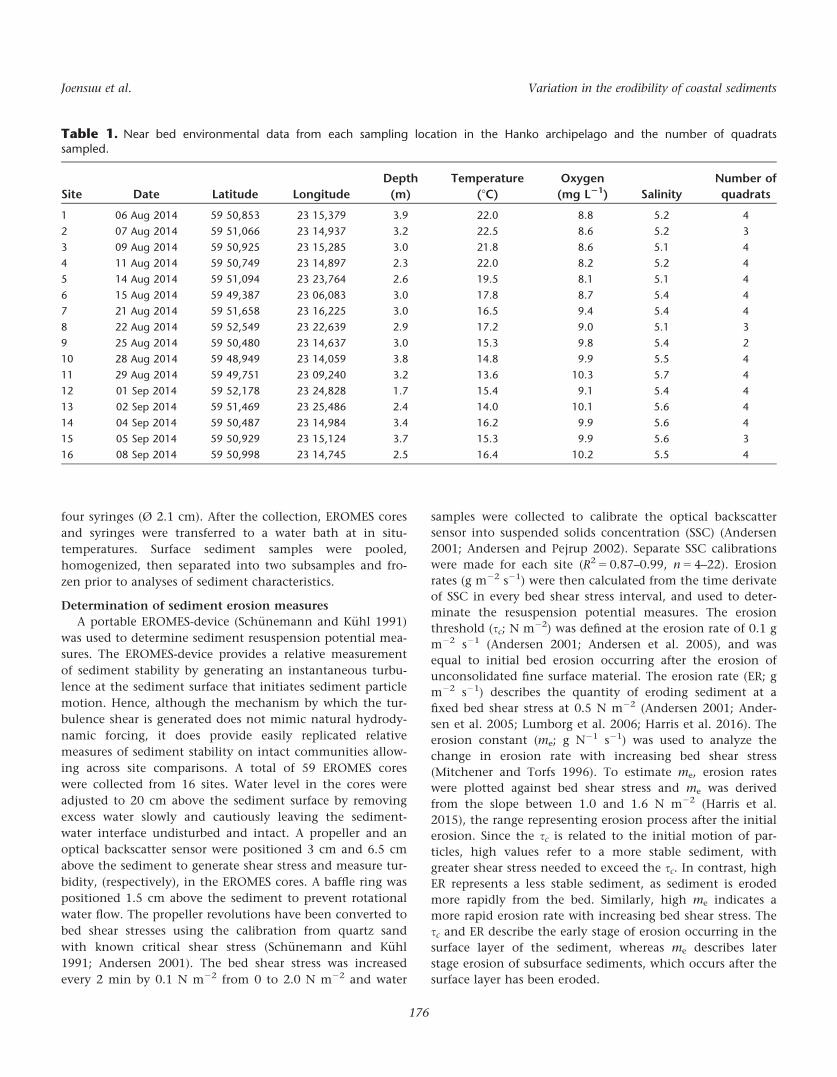
Table 1. Near bed environmental data from each sampling location in the Hanko archipelago and the number of quadratssampled.
Site Date Latitude Longitude
Depth
(m)
Temperature
(8C)
Oxygen
(mg L21) Salinity
Number of
quadrats
1 06 Aug 2014 59 50,853 23 15,379 3.9 22.0 8.8 5.2 4
2 07 Aug 2014 59 51,066 23 14,937 3.2 22.5 8.6 5.2 3
3 09 Aug 2014 59 50,925 23 15,285 3.0 21.8 8.6 5.1 4
4 11 Aug 2014 59 50,749 23 14,897 2.3 22.0 8.2 5.2 4
5 14 Aug 2014 59 51,094 23 23,764 2.6 19.5 8.1 5.1 4
6 15 Aug 2014 59 49,387 23 06,083 3.0 17.8 8.7 5.4 4
7 21 Aug 2014 59 51,658 23 16,225 3.0 16.5 9.4 5.4 4
8 22 Aug 2014 59 52,549 23 22,639 2.9 17.2 9.0 5.1 3
9 25 Aug 2014 59 50,480 23 14,637 3.0 15.3 9.8 5.4 2
10 28 Aug 2014 59 48,949 23 14,059 3.8 14.8 9.9 5.5 4
11 29 Aug 2014 59 49,751 23 09,240 3.2 13.6 10.3 5.7 4
12 01 Sep 2014 59 52,178 23 24,828 1.7 15.4 9.1 5.4 4
13 02 Sep 2014 59 51,469 23 25,486 2.4 14.0 10.1 5.6 4
14 04 Sep 2014 59 50,487 23 14,984 3.4 16.2 9.9 5.6 4
15 05 Sep 2014 59 50,929 23 15,124 3.7 15.3 9.9 5.6 3
16 08 Sep 2014 59 50,998 23 14,745 2.5 16.4 10.2 5.5 4
Joensuu et al. Variation in the erodibility of coastal sediments
176
Environmental variables
Chlorophyll a and phaeopigment concentrations were
analyzed spectrophotometrically at 665 and 750 nm wave-
lengths from lyophilized subsamples after acetone extraction
and 24 h incubation at 48C in darkness. Prior to spectropho-
tometric measurement, samples were centrifuged at
3000 rpm (10 min at 208C) and measured before and after
acidification (calculations followed Lorenzen 1967). Sedi-
ment water content was calculated as the difference between
wet weight and dry weight (1058C for 12 h) and organic con-
tent was determined using loss-on-ignition (4508C for 4 h)
from a fresh subsample. For estimates of dry bulk density (g
cm23), the sediment particle density was assumed to be
2.65 g cm23 (Mehta and Lee 1994; Avnimelech et al. 2001)
and water density 1.0 g cm23, and calculations followed
Roberts et al. 1998. For the grain size samples, large shell
fragments were removed and the samples were treated with
hydrogen peroxide (H2O2, 6%) to dissolve the organic mate-
rial, sieved (63, 250, 500 lm) and the percent of each size
fractions measured. After the resuspension potential meas-
urements, the EROMES cores were sieved with a 500 lm
mesh and benthic macrofauna extracted, stored in 70% etha-
nol, stained (Rose Bengal) and identified to the lowest taxo-
nomic level practical (usually species). Last, vegetation
coverage (%) inside each quadrat (vegetation coverage at
0 m) and at 2 m either side along the transect in both direc-
tions (vegetation coverage at 6 2 m) was determined from
the videos.
Statistical analysis
Despite our inclusion of sites, samples represent a sedi-
mentary gradient and were analyzed individually instead of
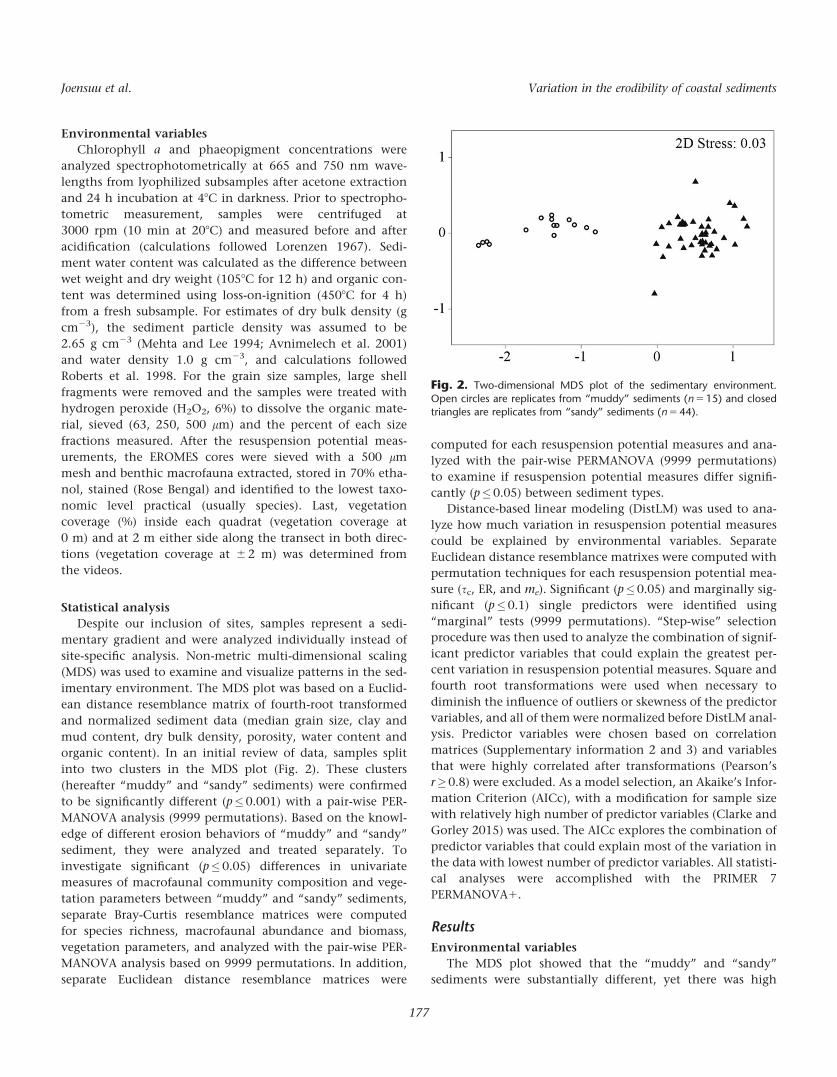
site-specific analysis. Non-metric multi-dimensional scaling
(MDS) was used to examine and visualize patterns in the sed-
imentary environment. The MDS plot was based on a Euclid-
ean distance resemblance matrix of fourth-root transformed
and normalized sediment data (median grain size, clay and
mud content, dry bulk density, porosity, water content and
organic content). In an initial review of data, samples split
into two clusters in the MDS plot (Fig. 2). These clusters
(hereafter “muddy” and “sandy” sediments) were confirmed
to be significantly different (p�0.001) with a pair-wise PER-
MANOVA analysis (9999 permutations). Based on the knowl-
edge of different erosion behaviors of “muddy” and “sandy”
sediment, they were analyzed and treated separately. To
investigate significant (p�0.05) differences in univariate
measures of macrofaunal community composition and vege-
tation parameters between “muddy” and “sandy” sediments,
separate Bray-Curtis resemblance matrices were computed
for species richness, macrofaunal abundance and biomass,
vegetation parameters, and analyzed with the pair-wise PER-
MANOVA analysis based on 9999 permutations. In addition,
separate Euclidean distance resemblance matrices were
computed for each resuspension potential measures and ana-
lyzed with the pair-wise PERMANOVA (9999 permutations)
to examine if resuspension potential measures differ signifi-
cantly (p�0.05) between sediment types.
Distance-based linear modeling (DistLM) was used to ana-
lyze how much variation in resuspension potential measures
could be explained by environmental variables. Separate
Euclidean distance resemblance matrixes were computed with
permutation techniques for each resuspension potential mea-
sure (sc, ER, and me). Significant (p�0.05) and marginally sig-
nificant (p�0.1) single predictors were identified using
“marginal” tests (9999 permutations). “Step-wise” selection
procedure was then used to analyze the combination of signif-
icant predictor variables that could explain the greatest per-
cent variation in resuspension potential measures. Square and
fourth root transformations were used when necessary to
diminish the influence of outliers or skewness of the predictor
variables, and all of them were normalized before DistLM anal-
ysis. Predictor variables were chosen based on correlation
matrices (Supplementary information 2 and 3) and variables
that were highly correlated after transformations (Pearson’s
r�0.8) were excluded. As a model selection, an Akaike’s Infor-
mation Criterion (AICc), with a modification for sample size
with relatively high number of predictor variables (Clarke and
Gorley 2015) was used. The AICc explores the combination of
predictor variables that could explain most of the variation in
the data with lowest number of predictor variables. All statisti-
cal analyses were accomplished with the PRIMER 7
PERMANOVA1.
Results
Environmental variables
The MDS plot showed that the “muddy” and “sandy”
sediments were substantially different, yet there was high
Fig. 2. Two-dimensional MDS plot of the sedimentary environment.
Open circles are replicates from “muddy” sediments (n 5 15) and closedtriangles are replicates from “sandy” sediments (n 5 44).
Joensuu et al. Variation in the erodibility of coastal sediments
177
variation within the two sediment types (Fig. 2). Median
grain size (D50) in “muddy” sediments ranged between 21
and 116 lm and in “sandy” sediments between 127 and 845
lm (Table 2). “Muddy” sediments had greater proportion of
fine particles (clay 4.2–13.6% and mud 25.2–81.9%) and
higher water content (46.2–87.4%). “Sandy” sediments were
more consolidated and had higher dry bulk density (1.5–
2.1 g cm23), but lower organic content (0.2–4.0%) and
porosity (0.2–0.4) (Table 2). The surfaces in the muddiest
sediments were covered with visible biofilms, whereas ripple
marks were observed in sandiest sediments, indicating that a
variation in hydrodynamic conditions (from sheltered to
exposed environments) was also included into the study
(Supporting Information 1). Microalgal biomass increased
with increasing mud content in “muddy” sediments, but not
in “sandy” sediments (Supporting Information 2 and 3). As
expected, the highest concentrations of microalgal biomass
were found in “muddy” sediments, yet there was also some
overlap between the sediment types.
Gastropoda Hydrobiidae and the bivalve Macoma balthica
were the most abundant species in both “muddy” and
“sandy” sediments. The polychaete Pygospio elegans was
found only in “sandy” sediments. Species richness, macro-
faunal abundance and biomass were significantly lower in
“muddy” sediments compared to “sandy” sediments (PER-
MANOVA, p<0.05). Vegetation coverage was consistently
lower in “muddy” sediments compared to the “sandy” sedi-
ments (Table 2). On the larger habitat scale, only “sandy”
sediments consistently had vegetation 6 2 m distance from
the sampled quadrat. The differences in vegetation coverage
were significant (PERMANOVA, p<0.05) between the sedi-
ment types. Typical submerged aquatic vegetation species
were Potamogeton pectinatus and Potamogeton perfoliatus in
“muddy” sediments, and Ceratophyllum demersum and P. per-
foliatus and Zostera marina in “sandy” sediments (Gustafsson
and Norkko 2016).
Resuspension potential measures
Generally, sc was lower and ER and me were higher in
“muddy” sediments compared to “sandy” sediments (Table 2),
indicating that sediment was eroded at lower shear stress in
“muddy” sediments compared to “sandy” sediments. The
highest ER were found in “muddy” sediments (0.33 g m22
s21), which was twofold higher compared to “sandy” sedi-
ments (0.14 g m22 s21). Interestingly, in some “sandy” sedi-
ments a few me values reached the substantially higher values
than measured in “muddy” sediments (Table 2). Although sc
and ER were significantly different (pairwise PERMANOVA,
p�0.05) between “muddy” and “sandy” sediment, all resus-
pension potential measures overlapped across sediment types.
In “muddy” sediments, sc increased with decreasing parti-
cle size as mud and clay content increased (Supporting Infor-
mation 2 and 3). Accordingly, ER and me increased with
increasing particle size and decreasing mud and clay content.
Median particle size and dry bulk density were positively cor-
related in “muddy” sediments indicating that sediment con-
solidation was lower in the muddiest sediments and thus they
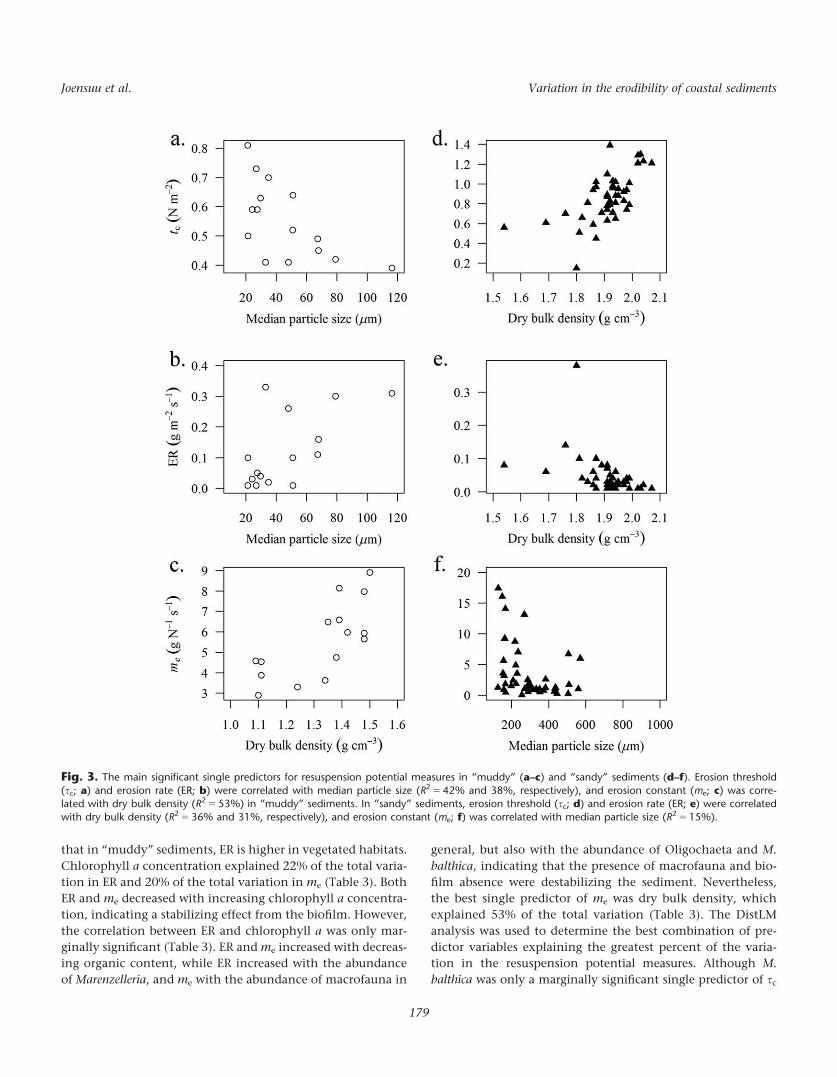
were eroded more easily. Most of the variation in sc and in ER
were explained by median particle size (42% and 38%, respec-
tively), (Fig. 3a,b), whereas most of the variation in me was
explained by dry bulk density (53%) (Fig. 3c). Also the abun-
dance of Oligochaeta was a significant single predictor,
explaining 34% and 28% of the variation in sc and ER, respec-
tively (Table 3). ER was marginally significantly correlated
with higher vegetation coverage at 0 and 6 2 m, suggesting
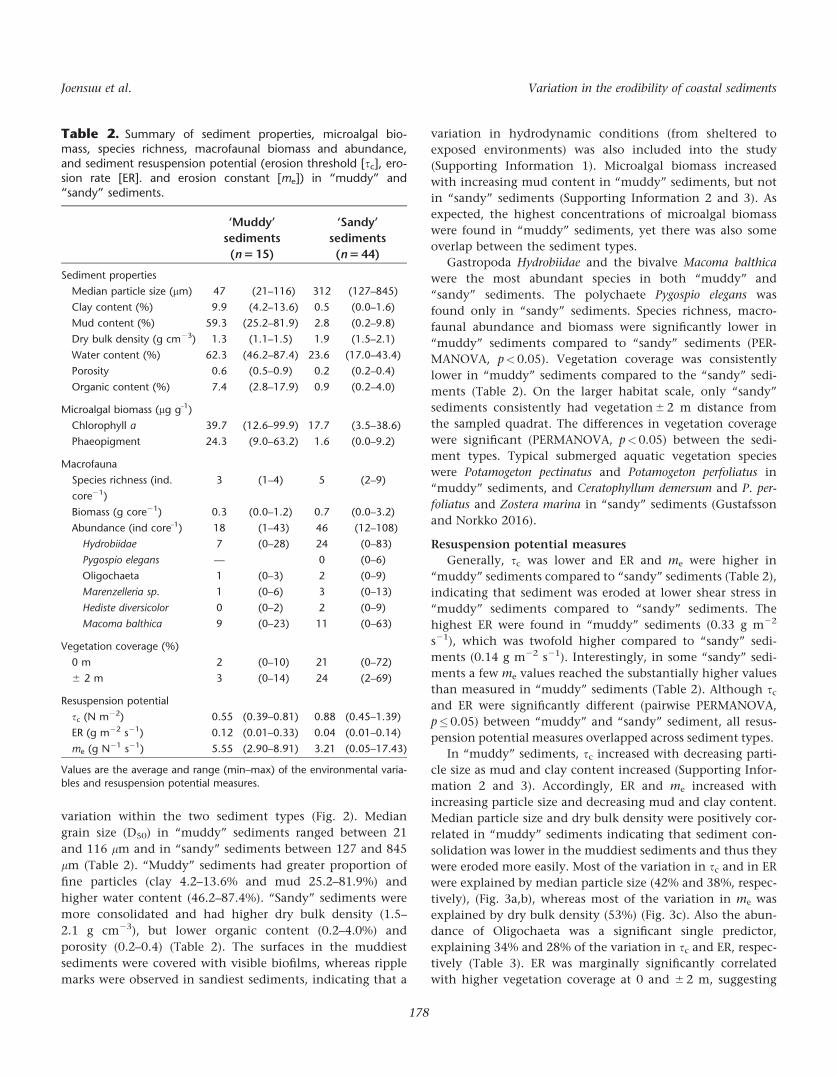
Table 2. Summary of sediment properties, microalgal bio-mass, species richness, macrofaunal biomass and abundance,and sediment resuspension potential (erosion threshold [sc], ero-sion rate [ER]. and erosion constant [me]) in “muddy” and“sandy” sediments.
‘Muddy’
sediments
(n 5 15)
‘Sandy’
sediments
(n 5 44)
Sediment properties
Median particle size (mm) 47 (21–116) 312 (127–845)
Clay content (%) 9.9 (4.2–13.6) 0.5 (0.0–1.6)
Mud content (%) 59.3 (25.2–81.9) 2.8 (0.2–9.8)
Dry bulk density (g cm23) 1.3 (1.1–1.5) 1.9 (1.5–2.1)
Water content (%) 62.3 (46.2–87.4) 23.6 (17.0–43.4)
Porosity 0.6 (0.5–0.9) 0.2 (0.2–0.4)
Organic content (%) 7.4 (2.8–17.9) 0.9 (0.2–4.0)
Microalgal biomass (mg g-1)
Chlorophyll a 39.7 (12.6–99.9) 17.7 (3.5–38.6)
Phaeopigment 24.3 (9.0–63.2) 1.6 (0.0–9.2)
Macrofauna
Species richness (ind.
core21)
3 (1–4) 5 (2–9)
Biomass (g core21) 0.3 (0.0–1.2) 0.7 (0.0–3.2)
Abundance (ind core-1) 18 (1–43) 46 (12–108)
Hydrobiidae 7 (0–28) 24 (0–83)
Pygospio elegans — 0 (0–6)
Oligochaeta 1 (0–3) 2 (0–9)
Marenzelleria sp. 1 (0–6) 3 (0–13)
Hediste diversicolor 0 (0–2) 2 (0–9)
Macoma balthica 9 (0–23) 11 (0–63)
Vegetation coverage (%)
0 m 2 (0–10) 21 (0–72)
6 2 m 3 (0–14) 24 (2–69)
Resuspension potential
sc (N m22) 0.55 (0.39–0.81) 0.88 (0.45–1.39)
ER (g m22 s21) 0.12 (0.01–0.33) 0.04 (0.01–0.14)
me (g N21 s21) 5.55 (2.90–8.91) 3.21 (0.05–17.43)
Values are the average and range (min–max) of the environmental varia-
bles and resuspension potential measures.
Joensuu et al. Variation in the erodibility of coastal sediments
178
that in “muddy” sediments, ER is higher in vegetated habitats.
Chlorophyll a concentration explained 22% of the total varia-
tion in ER and 20% of the total variation in me (Table 3). Both
ER and me decreased with increasing chlorophyll a concentra-
tion, indicating a stabilizing effect from the biofilm. However,
the correlation between ER and chlorophyll a was only mar-
ginally significant (Table 3). ER and me increased with decreas-
ing organic content, while ER increased with the abundance
of Marenzelleria, and me with the abundance of macrofauna in
general, but also with the abundance of Oligochaeta and M.
balthica, indicating that the presence of macrofauna and bio-
film absence were destabilizing the sediment. Nevertheless,
the best single predictor of me was dry bulk density, which
explained 53% of the total variation (Table 3). The DistLM
analysis was used to determine the best combination of pre-
dictor variables explaining the greatest percent of the varia-
tion in the resuspension potential measures. Although M.
balthica was only a marginally significant single predictor of sc
Fig. 3. The main significant single predictors for resuspension potential measures in “muddy” (a–c) and “sandy” sediments (d–f). Erosion threshold
(sc; a) and erosion rate (ER; b) were correlated with median particle size (R2 5 42% and 38%, respectively), and erosion constant (me; c) was corre-lated with dry bulk density (R2 5 53%) in “muddy” sediments. In “sandy” sediments, erosion threshold (sc; d) and erosion rate (ER; e) were correlatedwith dry bulk density (R2 5 36% and 31%, respectively), and erosion constant (me; f) was correlated with median particle size (R2 5 15%).
Joensuu et al. Variation in the erodibility of coastal sediments
179
in “muddy” sediments, the best combination of predictor varia-
bles included median particle size and abundance of M. balth-
ica, explaining 68% of the total variation (Table 4). Median
particle size was also included into the best model of ER,
together with Oligochaeta explaining 56% of the total varia-
tion (Table 4). A combination of dry bulk density and M. balth-
ica abundance explained 66% of the total variation in me, but
the combination was only marginally significant, whereas dry
bulk density remained the single significant predictor (Table 4).
In “sandy” sediments, the influence of sediment properties
together with the local habitat structure was apparent. The best
single predictor of sc was dry bulk density, which explained 36%
of the variation (Fig. 3d). While organic content, chlorophyll a
and phaeopigment concentration decreased, sc increased,
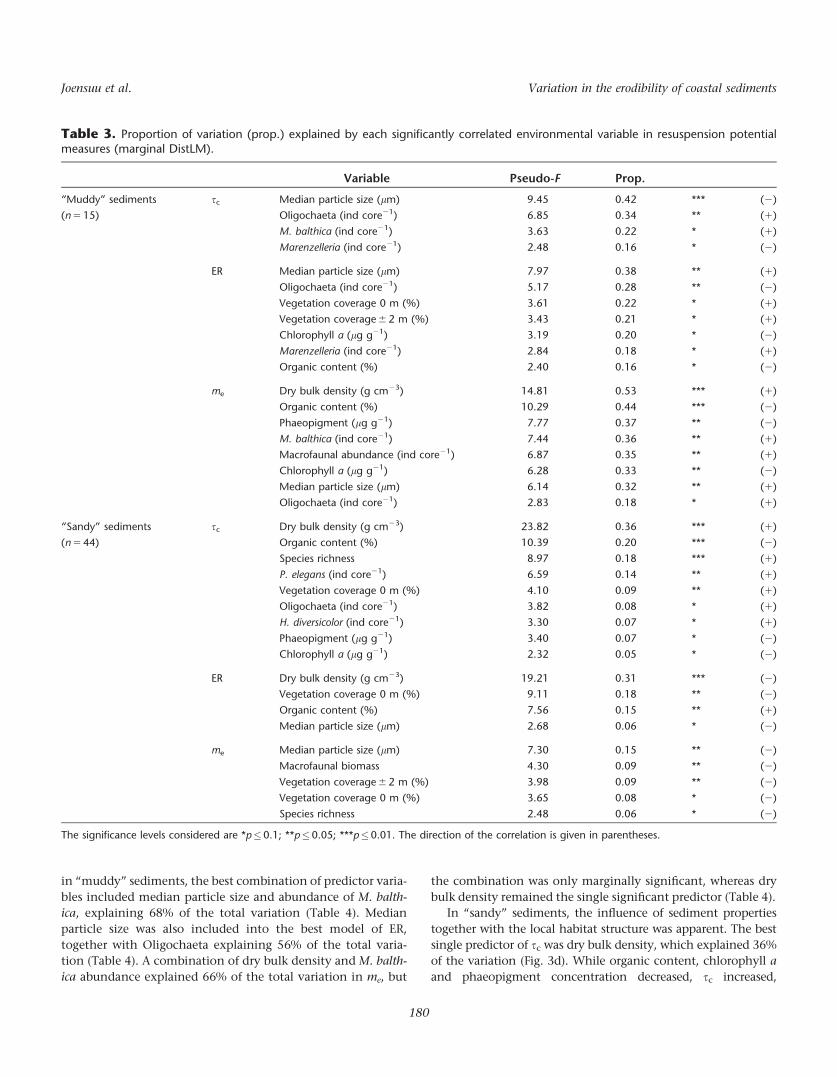
Table 3. Proportion of variation (prop.) explained by each significantly correlated environmental variable in resuspension potentialmeasures (marginal DistLM).
Variable Pseudo-F Prop.
“Muddy” sediments
(n 5 15)
sc Median particle size (lm) 9.45 0.42 *** (2)
Oligochaeta (ind core21) 6.85 0.34 ** (1)
M. balthica (ind core21) 3.63 0.22 * (1)
Marenzelleria (ind core21) 2.48 0.16 * (2)
ER Median particle size (lm) 7.97 0.38 ** (1)
Oligochaeta (ind core21) 5.17 0.28 ** (2)
Vegetation coverage 0 m (%) 3.61 0.22 * (1)
Vegetation coverage 6 2 m (%) 3.43 0.21 * (1)
Chlorophyll a (lg g21) 3.19 0.20 * (2)
Marenzelleria (ind core21) 2.84 0.18 * (1)
Organic content (%) 2.40 0.16 * (2)
me Dry bulk density (g cm23) 14.81 0.53 *** (1)
Organic content (%) 10.29 0.44 *** (2)
Phaeopigment (lg g21) 7.77 0.37 ** (2)
M. balthica (ind core21) 7.44 0.36 ** (1)
Macrofaunal abundance (ind core21) 6.87 0.35 ** (1)
Chlorophyll a (lg g21) 6.28 0.33 ** (2)
Median particle size (lm) 6.14 0.32 ** (1)
Oligochaeta (ind core21) 2.83 0.18 * (1)
“Sandy” sediments
(n 5 44)
sc Dry bulk density (g cm23) 23.82 0.36 *** (1)
Organic content (%) 10.39 0.20 *** (2)
Species richness 8.97 0.18 *** (1)
P. elegans (ind core21) 6.59 0.14 ** (1)
Vegetation coverage 0 m (%) 4.10 0.09 ** (1)
Oligochaeta (ind core21) 3.82 0.08 * (1)
H. diversicolor (ind core21) 3.30 0.07 * (1)
Phaeopigment (lg g21) 3.40 0.07 * (2)
Chlorophyll a (lg g21) 2.32 0.05 * (2)
ER Dry bulk density (g cm23) 19.21 0.31 *** (2)
Vegetation coverage 0 m (%) 9.11 0.18 ** (2)
Organic content (%) 7.56 0.15 ** (1)
Median particle size (lm) 2.68 0.06 * (2)
me Median particle size (lm) 7.30 0.15 ** (2)
Macrofaunal biomass 4.30 0.09 ** (2)
Vegetation coverage 6 2 m (%) 3.98 0.09 ** (2)
Vegetation coverage 0 m (%) 3.65 0.08 * (2)
Species richness 2.48 0.06 * (2)
The significance levels considered are *p�0.1; **p�0.05; ***p�0.01. The direction of the correlation is given in parentheses.
Joensuu et al. Variation in the erodibility of coastal sediments
180
together with species richness and abundance of P. elegans, Oli-
gochaeta and Hediste diversicolor. Only organic content, species
richness, and abundance of P. elegans were significant single pre-
dictors, explaining 20%, 18%, and 14% of the total variation in
sc, respectively, (Table 3). Vegetation coverage at 0 m explained
9% of the total variation in sc, suggesting more stable sediments
in vegetated habitats adjacent to bare patches. This was also seen
in ER, where ER decreased with increasing vegetation coverage
at 0 m. Vegetation coverage at 0 m was significantly correlated
and explained 18% of the total variation in ER. However, the
best single predictor of ER was dry bulk density, explaining 31%
of the total variation (Fig. 3e). In addition, ER increased with
increasing organic content, which explained 15% of the total
variation. In contrast to “muddy” sediments, sc increased and
ER and me decreased in “sandy” sediments with increasing
median particle size and decreasing mud and clay content.
Median particle size was only a marginally significant predictor
of ER explaining 6% of the total variation, but it was the best sin-
gle predictor in me explaining 15% of the total variation (Fig. 3f).
Further, macrofaunal biomass was a significant predictor of me,
explaining 9% of the total variation, and species richness was a
marginally significant predictor, explaining 6% of the total vari-
ation. Vegetation coverage both at 0 and 6 2 m were marginally
significant predictors explaining 8% and 9% of the total varia-
tion in me, respectively. In “sandy” sediments, the vegetation
coverage at 0 m was included into all combinations of best
predictors in resuspension potential measures (Table 4). Dry
bulk density, together with the species richness, vegetation cov-
erage at 0 m and the abundance of P. elegans explained 52% of
the total variation in sc (Table 4). However, the combination was
only marginally significant, when in fact, the highly significant
combination of dry bulk density and species richness explained
most of the total variation (45%). The best significant combina-
tion of predictor variables of ER were dry bulk density and vege-
tation coverage at 0 m, which together explained 43% of the
total variation (Table 4). Including median particle size, the
explanatory rate reached 48%, but this combination was mar-
ginally significant. When considering me, the best combination
included median particle size, species richness, and vegetation
coverage at 0 m and macrofaunal biomass, which together
explained 39% of the total variation (Table 4). When the mar-
ginally significant predictor macrofaunal biomass was removed,
this explanatory rate reached 34%.
Discussion
In this study, we have quantified how physical and biologi-
cal sediment characteristics, including elements of local habi-
tat structure and macrofauna, influence sediment erodibility
and resuspension in a submerged coastal environment. Our
study encompassed 16 different sampling sites, with 59 sam-
ples across a broad-scale sedimentary gradient. The samples
diverged into two groups of “muddy” and “sandy” sediments
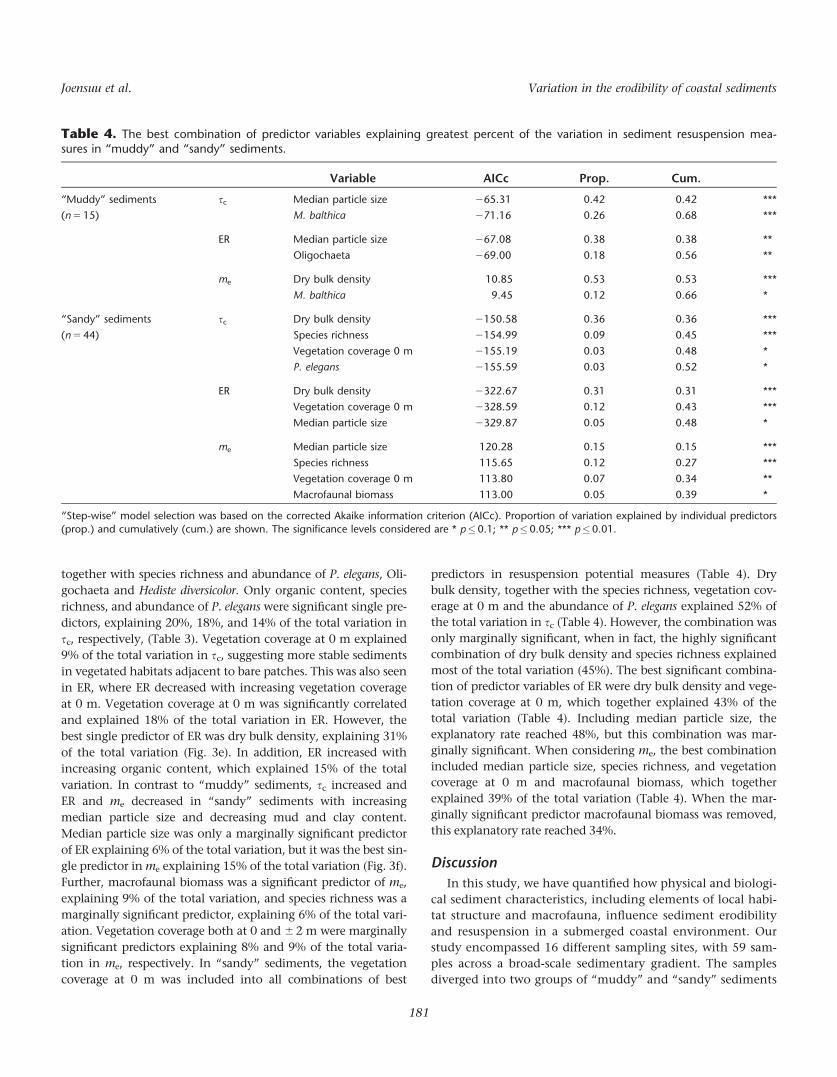
Table 4. The best combination of predictor variables explaining greatest percent of the variation in sediment resuspension mea-sures in “muddy” and “sandy” sediments.
Variable AICc Prop. Cum.
“Muddy” sediments
(n 5 15)
sc Median particle size 265.31 0.42 0.42 ***
M. balthica 271.16 0.26 0.68 ***
ER Median particle size 267.08 0.38 0.38 **
Oligochaeta 269.00 0.18 0.56 **
me Dry bulk density 10.85 0.53 0.53 ***
M. balthica 9.45 0.12 0.66 *
“Sandy” sediments
(n 5 44)
sc Dry bulk density 2150.58 0.36 0.36 ***
Species richness 2154.99 0.09 0.45 ***
Vegetation coverage 0 m 2155.19 0.03 0.48 *
P. elegans 2155.59 0.03 0.52 *
ER Dry bulk density 2322.67 0.31 0.31 ***
Vegetation coverage 0 m 2328.59 0.12 0.43 ***
Median particle size 2329.87 0.05 0.48 *
me Median particle size 120.28 0.15 0.15 ***
Species richness 115.65 0.12 0.27 ***
Vegetation coverage 0 m 113.80 0.07 0.34 **
Macrofaunal biomass 113.00 0.05 0.39 *
“Step-wise” model selection was based on the corrected Akaike information criterion (AICc). Proportion of variation explained by individual predictors
(prop.) and cumulatively (cum.) are shown. The significance levels considered are * p�0.1; ** p�0.05; *** p�0.01.
Joensuu et al. Variation in the erodibility of coastal sediments
181
with considerable variation in environmental variables both
between and within these two sediment types. Accounting for
the physical properties of the sediment in resuspension poten-
tial measures, we sought to determine the role of local habitat
structure and macrofauna. Overall, physical sediment proper-
ties explained 38–42% and 15–36% of the total variation in
resuspension potential measures of “muddy” and “sandy” sedi-
ments, while macrofauna and vegetation explained additional
15–24% and 12–26%, respectively, (Table 4). The seafloor land-
scape is highly variable in time and space, and our results sug-
gest that sediment resuspension potential are affected by
different factors, depending on the local sedimentary environ-
ment, resident benthic communities and habitat structure.
In general, cohesive behavior typically occurs when the
sediment clay content is 3 to 15% of the total sediment
weight (Mitchener and Torfs 1996). In our study, the clay
content in “muddy” sediments varied from 4 to 14% (Table
2), indicating that erosion processes in these sediments were
mainly regulated by cohesive forces. From physical sediment
properties, median particle size was found to be the most
important predictor for sc and ER in “muddy” sediments
explaining 42% and 38% of the total variation, respectively.
Clay and mud content were positively correlated with sc and
negatively correlated with ER, indicating the stabilizing
effect of very fine particles by cohesion and adhesion (Kam-
phuis and Hall 1983; Grabowski et al. 2011). This was further
supported by the significant negative correlation between sc
and median particle size (Table 3), also noted by Roberts
et al. (1998). The negative correlation between sc and
median particle size may also illustrate sediment erosion as
aggregates. Very fine particles can form aggregates that may
reach mean diameters of 2000 lm (Thomsen and Gust 2000)
and can increase bed resistance against erosion. Dry bulk
density explained 53% of the total variation in me. Although
previous findings suggest that erosion rates generally
decrease as the dry bulk density increases (Roberts et al.
1998), our results, obtained from natural “muddy” sediments
show a different pattern. The positive correlation between
me and dry bulk density in “muddy” sediments suggests that
the sub-surface erosion was more rapid as the dry bulk den-
sity increased. Since dry bulk density describes sediment con-
solidation (i.e., sediments “hardness” against erosion) and it
increases with decreasing water content and porosity, ero-
sion should decrease with increasing clay content or particle
size (i.e., more consolidated bed) in “muddy” sediments.
Typically, bulk density is lower and sc higher in consolidated
clays than in fine sands (Grabowski et al. 2011), which can
explain our results. Our results may also indicate that the
sediment was eroded more easily in the transitional region
where cohesive forces were insignificant yet particles were
still relatively small. Additionally, studies considering the
relationship between bulk density and bed erosion are often
made with bulk densities �1.65 g cm–3, whereas the dry
bulk densities in our results from the “muddy” sediments
were from the surface layer of sediment with a range of 1.1–
1.5 g cm–3, and thus markedly lower. However, the dry bulk
density calculations in our study were based on the density
of quartz particles, while sediments containing a significant
fraction of organic matter may have lower particle density
(Avnimelech et al. 2001). Nevertheless, to enable consistency
across “muddy” and “sandy” sediments, the same particle
density was used in all calculations.
Both M. balthica and Oligochaeta impacted sediment ero-
sion in “muddy” sediments. The abundance of M. balthica
added 26% and 12% to the cumulative explanation rate (sc
and me, respectively), and Oligochaeta added 18% in ER (Table
4). Interestingly, both sc and me were positively correlated
with M. balthica, indicating a somewhat contradicting effect
on sediment stability. Our results suggest that M. balthica sta-
bilize the surface sediment, but destabilize the sub-surface sed-
iment after initial erosion. The destabilizing impact of M.
balthica in the later stage of the erosion process may result
from the organisms’ functioning in the sediment (e.g., bur-
rowing, deposit-feeding), which alters sediment properties
and structure, but also from microscale roughness created by
organisms’ shells and burrows. In general, deposit-feeding
macrofauna reduce the stabilizing effect of microalgae and
biofilms on the surface of the “muddy” sediments by grazing
and subsequently decreasing sediment cohesiveness (Austen
et al. 1999; Lelieveld et al. 2004; Weerman et al. 2011; Pratt
et al. 2014), and therefore we would have expected a destabi-
lizing effect of M. balthica on the initial erosion of the surface
sediment. Further, both sc and the abundance of M. balthica
were negatively correlated with vegetation coverage at 0 m
(Supplementary information 3), which suggest that the sedi-
ment was eroded more easily in vegetated patches with lower
abundance of M. balthica. Similarly, abundance of Oligochaeta
was negatively correlated with ER and vegetation at 0 m, but
ER was positively correlated with vegetation at 0 m. This sug-
gest that erosion rates were higher in vegetated patches with
low abundance of Oligochaeta. Vegetation efficiently damp-
ens wave motions, traps sediment and decreases resuspension
(Madsen et al. 2001; James et al. 2004; Nepf 2012), and there-
fore may enhance sedimentation and the accumulation of sus-
pended solids (i.e., a “fluff layer”) on the sediment surface
(Nepf 2012), which then are easily eroded.
In “sandy” sediments, dry bulk density and median particle
size were also found to be the best predictors of resuspension
potential measures. Dry bulk density explained 36 and 31% of
the total variation in sc and ER, respectively. Contrasting to
“muddy” sediments, dry bulk density was positively correlated
with sc and negatively correlated with ER in “sandy” sedi-
ments. The density of the bed increases with depth as water
content decreases (Mitchener and Torfs 1996), and our results
indicate that more compacted sediment was more resistant to
erosion. Median particle size is often used as a single predictor
of initial bed erosion, but interestingly we did not observe a
significant correlation between sc and median particle size.
Joensuu et al. Variation in the erodibility of coastal sediments
182

Instead, median particle size explained 15% of the total varia-
tion in me, suggesting that larger particles stabilize the subsur-
face erosion in “sandy” sediments. This was also seen in ER,
where median particle size added 5% to the cumulative expla-
nation rate (Table 4). The negative correlations between sc
and fine fractions of the sediment (i.e., clay, mud and organic
matter) suggest a presence of easily eroded fine particles (“fluff
layer”) on the sediment surface, which may explain why
median particle size was not a significant predictor for the ini-
tial erosion, but instead dry bulk density was.
When considering biota in “sandy” sediments, the vege-
tation at 0 m was found to be a key predictor for sediment
resuspension as it increased cumulative explanatory power
of all resuspension potential measures by 3–12% (Table 4).
In contrast to “muddy” sediments, vegetated patches
increased stability in “sandy” sediments, i.e., sc was posi-
tively and ER and me were negatively correlated with vegeta-
tion at 0 m. The stabilizing effect of roots and rhizomes on
sediment is well acknowledged in the literature (e.g., Le Hir
et al. 2007; Grabowski et al. 2011). Vegetated patches also
provide habitats for microbial communities, which in turn
can produce a stabilizing biofilm. We also found a positive
correlation between sc and the abundance of the polychaete
P. elegans, suggesting that it stabilizes the surface sediments.
P.elegans constructs mucus coated sand tubes, which bind
sediment particles together (Bolam and Fernandes 2003)
and also maintain microhabitats for microbial communities.
In addition, species richness added 15% and macrofaunal
biomass 5% to the cumulative explanation rate in me. Since
the net effect of benthic macrofauna on sediment erodibil-
ity differs depending organism’s size, abundance, physical
features and functioning, generalizations are difficult to
make. Here, species richness is probably related to sediment
heterogeneity of diverse habitats and covariation of multiple
environmental variables. Additionally, the magnitude of
functioning is higher for larger individuals, e.g., they feed
and egest more, produce greater amounts of mucus and EPS
and also construct larger and deeper biogenic structures
(Norkko et al. 2013). Therefore, larger animals will likely
play a central role in sediment erodibility in rough, high
energy environments.
In order to put our resuspension potential measures to a
context, we converted our results of erosion threshold to
critical friction velocities (1.96–2.84 cm s21 for “muddy”
sediments and 2.11–3.73 cm s21 for “sandy” sediments).
These values are in the same range as estimated friction
velocities in previous studies from the area (1.25–3.58 cm
s21, Valanko 2012). Hydrodynamic forcing in the study area
is regulated by upwelling and wind-wave events (Haapala
1994; Lehmann & Myrberg 2008) and previous studies have
shown that resuspension is a frequent phenomenon in the
area (Valanko et al. 2010, 2015).
In this study, we have shown that local habitat structure
plays an important role in sediment erodibility and
resuspension potential. The mosaic of bare sediment and
vegetated patches at the seascape level not only created
diverse habitats for macrofaunal communities, but also influ-
enced the sedimentary environment and local hydrodynam-
ics. After accounting for the physical sediment properties,
we found that the influence of benthic macrofauna on resus-
pension potential measures was higher in “muddy” sedi-
ments compared to “sandy” sediments. Nevertheless, species
richness and vegetation, and thus habitat diversity were
important predictors of resuspension potential also in
“sandy” sediments. Sediment erodibility and resuspension
potential in natural sediments fluctuate from small scale var-
iations within the habitat mosaics to larger spatial scale var-
iations across habitats and sedimentary gradients. Our
results underline the importance of biota to resuspension
potential measures in spatially variable environments.
Despite the significance of these findings, addressing tem-
poral variation was beyond the scope of this study, and future
investigations are needed to analyze how biotic variables (e.g.,
microbial biomass, vegetation and macrofauna) change sea-
sonally to affect resuspension dynamics in submerged, coastal
environments. For example, temperature is a variable that
affects all biological processes including the microbial pro-
cesses central for the cohesive forces affecting resuspension
(e.g., EPS, microphytobenthic biomass). Across our study loca-
tions, we encountered an 88C difference in temperature from
the sheltered muddy to the exposed sandy sites. Our spatial
study design could not account for the relative importance of
temperature in affecting resuspension processes, which fur-
ther highlights the importance of conducting seasonal studies
to resolve the influence of temperature and seasonal succes-
sion in biology in affecting these processes.
Coastal areas are highly valuable environments for both
marine and human life (Levin et al. 2001) and threatened by
biodiversity loss, eutrophication, pollutants, erosion and
anthropogenic actions. Future challenges include climate
change that has been predicted to increase the frequency of
extreme events, such as strong wind-waves and storms (Dan-
ielsson et al. 2007; IPCC 2013). In addition, prevailing wind
directions are predicted to change, therefore exposing new
areas for erosion and resuspension. This is particularly impor-
tant in shallow coastal areas where hydrodynamic forcing reg-
ulate sediment erosion and transportation processes. For
example, coastal erosion is a major problem in many areas and
it will need more attention in the future (Zhang et al. 2004).
Therefore, understanding sediment transport processes is not
only important for modeling approaches, but also for engi-
neering and other disciplines addressing these challenges.
References
Aberle, J., V. Nikora, and R. Walters. 2004. Effects of bed
material properties on cohesive sediment erosion. Mar.
Geol. 207: 83–93. doi: 10.1016/j.margeo.2004.03.012
Joensuu et al. Variation in the erodibility of coastal sediments
183
Almroth, E., A. Tengberg, J. H. Andersson, S. Pakhomova, and
P. O. Hall. 2009. Effects of resuspension on benthic fluxes
of oxygen, nutrients, dissolved inorganic carbon, iron and
manganese in the Gulf of Finland, Baltic Sea. Cont. Shelf
Res. 29: 807–818. doi:10.1016/j.csr.2008.12.011
Alongi, D. M., and A. D. McKinnon. 2005. The cycling and
fate of terrestrially-derived sediments and nutrients in the
coastal zone of the Great Barrier Reef shelf. Mar. Pollut.
Bull. 51: 239–252. doi:10.1016/j.marpolbul.2004.10.033
Amos, C. L., G. R. Daborn, H. A. Christian, A. Atkinson, and
A. Robertson. 1992. In situ erosion measurements on fine-
grained sediments from the Bay of Fundy. Mar. Geol.
108: 175–196. doi:10.1016/0025-3227(92)90171-D
Andersen, T. J. 2001. Seasonal variation in erodibility of two
temperate, microtidal mudflats. Estuar. Coast. Shelf Sci.
53: 1–12. doi:10.1006/ecss.2001.0790
Andersen, T. J., and M. Pejrup. 2002. Biological mediation of
the settling velocity of bed material eroded from an inter-
tidal mudflat, the Danish Wadden Sea. Estuar. Coast.
Shelf Sci. 54: 737–745. doi:10.1006/ecss.2001.0856
Andersen, T. J., L. C. Lund-Hansen, M. Pejrup, K. T. Jensen,
and K. N. Mouritsen. 2005. Biologically induced differ-
ences in erodibility and aggregation of subtidal and inter-
tidal sediments: A possible cause for seasonal changes in
sediment deposition. J. Mar. Syst. 55: 123–138. doi:
10.1016/j.jmarsys.2004.09.004
Austen, I., T. J. Andersen, and K. Edelvang. 1999. The influence
of benthic diatoms and invertebrates on the erodibility of
an intertidal mudflat, the Danish Wadden Sea. Estuar.
Coast. Shelf Sci. 49: 99–111. doi:10.1006/ecss.1998.0491
Avnimelech, Y., G. Ritvo, L. E. Meijer, and M. Kochba. 2001.
Water content, organic carbon and dry bulk density in
flooded sediments. Aquac. Eng. 25: 25–33. doi:10.1016/
S0144-8609(01)00068-1
Barbier, E. B., S. D. Hacker, C. Kennedy, E. W. Koch, A. C.
Stier, and B. R. Silliman. 2011. The value of estuarine and
coastal ecosystem services. Ecol. Monogr. 81: 169–193.
doi:10.1890/10-1510.1
Bilotta, G. S., and R. E. Brazier. 2008. Understanding the influ-
ence of suspended solids on water quality and aquatic biota.
Water Res. 42: 2849–2861. doi:10.1016/j.watres.2008.03.018
Black, K. S., T. J. Tolhurst, D. M. Paterson, and S. E.
Hagerthey. 2002. Working with natural cohesive sedi-
ments. J. Hydraul. Eng. 128: 2–8. doi:10.1061/
(ASCE)0733-9429(2002)128:1(2)
Bolam, S. G., and T. F. Fernandes. 2003. Dense aggregations
of Pygospio elegans (Claparede): Effect on macrofaunal
community structure and sediments. J. Sea Res. 49: 171–
185. doi:10.1016/S1385-1101(03)00007-8
Clarke, K. R., and R. N. Gorley. 2015. PRIMER v7: User man-
ual/tutorial. PRIMER-E. Plymouth. 296 pp.
Danielsson, A., A. J€onsson, and L. Rahm. 2007. Resuspension
patterns in the Baltic proper. J. Sea Res. 57: 257–269. doi:
10.1016/j.seares.2006.07.005
Decho, A. W. 2000. Microbial biofilms in intertidal systems:
An overview. Cont. Shelf Res. 20: 1257–1273. doi:
10.1016/S0278-4343(00)00022-4
Duplisea, D. E., S. Jennings, S. J. Malcolm, R. Parker, and D. B.
Sivyer. 2001. Modelling potential impacts of bottom trawl
fisheries on soft sediment biogeochemistry in the North
Sea. Geochem. Trans. 2: 112–117. doi:10.1039/b108342b
Fagherazzi, S., and P. L. Wiberg. 2009. Importance of wind
conditions, fetch, and water levels on wave-generated
shear stresses in shallow intertidal basins. J. Geophys. Res.
114. F03022. doi:10.1029/2008JF001139.
Grabowski, R. C., I. G. Droppo, and G. Wharton. 2011. Erod-
ibility of cohesive sediment: The importance of sediment
properties. Earth Sci. Rev. 105: 101–120. doi:10.1016/
j.earscirev.2011.01.008
Graf, G., and R. Rosenberg. 1997. Bioresuspension and bio-
deposition: A review. J. Mar. Syst. 11: 269–278. doi:
10.1016/S0924-7963(96)00126-1
Green, M. O., and G. Coco. 2014. Review of wave-driven
sediment resuspension and transport in estuaries. Rev.
Geophys. 52: 77–117. doi:10.1002/2013RG000437
Gustafsson, C., and A. Norkko. 2016. Not all plants are the
same: Exploring metabolism and nitrogen fluxes in a benthic
community composed of different aquatic plant species.
Limnol. Oceanogr. 61: 1787–1799. doi:10.1002/lno.10334
Haapala, J. 1994. Upwelling and its influence on nutrient
concentration in the coastal area of the Hanko Peninsula,
entrance of the Gulf of Finland. Estuar. Coast. Shelf Sci.
38: 507–521. doi:10.1006/ecss.1994.1035
Harris, R. J., C. A. Pilditch, J. E. Hewitt, A. M. Lohrer, C. Van
Colen, M. Townsend, and S. F. Thrush. 2015. Biotic inter-
actions influence sediment erodibility on wave-exposed
sandflats. Mar. Ecol. Prog. Ser. 523: 15–30. doi:10.3354/
meps11164
Harris, R. J., C. A. Pilditch, B. L. Greenfield, V. Moon, and I.
Kr€oncke. 2016. The influence of benthic macrofauna on
the erodibility of intertidal sediments with varying mud
content in three New Zealand estuaries. Estuar. Coast. 39:
815–828. doi:10.1007/s12237-015-0036-2
Hayter, E. J., and A. J. Mehta. 1986. Modelling cohesive sedi-
ment transport in estuarial waters. Appl. Math. Model.
10: 294–303. doi:10.1016/0307-904X(86)90061-2
IPCC. 2013. Climate change 2013: The physical science
basis, p. 1535. In T. F. Stocker, and others [eds.], Contribu-
tion of Working Group I to the Fifth Assessment Report
of the Intergovernmental Panel on Climate Change.
Available from www.climatechange2013.org
Jacobs, W., P. Le Hir, W. Van Kesteren, and P. Cann. 2011.
Erosion threshold of sand–mud mixtures. Cont. Shelf Res.
31: S25. doi:10.1016/j.csr.2010.05.012
James, W. F., J. W. Barko, and M. G. Butler. 2004. Shear
stress and sediment resuspension in relation to submersed
macrophyte biomass. Hydrobiologia 515: 181–191. doi:
10.1023/B:HYDR.0000027329.67391.c6
Joensuu et al. Variation in the erodibility of coastal sediments
184

J€onsson, A., S. Danielsson, and L. Rahm. 2005. Bottom type
distribution based on wave friction velocity in the Baltic
Sea. Cont. Shelf Res. 25: 419–435. doi:10.1016/
j.csr.2004.09.011
Kamphuis, J. W., and K. R. Hall. 1983. Cohesive material
erosion by unidirectional current. J. Hydraul. Eng. 109:
49–61. doi:10.1061/(ASCE)0733-9429(1983)109:1(49)
Lanuru, M., R. Riethmller, C. van Bernem, and K. Heymann.
2007. The effect of bedforms (crest and trough systems)
on sediment erodibility on a back-barrier tidal flat of the
East Frisian Wadden Sea, Germany. Estuar. Coast. Shelf
Sci. 72: 603–614. doi:10.1016/j.ecss.2006.11.009
Le Hir, P., Y. Monbet, and F. Orvain. 2007. Sediment erod-
ability in sediment transport modelling: Can we account
for biota effects?. Cont. Shelf Res. 27: 1116–1142. doi:
10.1016/j.csr.2005.11.016
Lehmann, A., and K. Myrberg. 2008. Upwelling in the Baltic
Sea — A review. J. Mar. Syst. 74: S3–S12. doi:10.1016/
j.jmarsys.2008.02.010
Lelieveld, S. D., C. A. Pilditch, and M. O. Green. 2004.
Effects of deposit-feeding bivalve (macomona liliana)
density on intertidal sediment stability. N. Z. J. Mar.
Freshw. Res. 8: 115–128. doi:10.1080/00288330.2004.
9517223
Levin, L., and others. 2001. The function of marine critical
transition zones and the importance of sediment biodiver-
sity. Ecosystems 4: 430–451. doi:10.1007/s10021-001-
0021-4
Lorenzen, C. J. 1967. Determination of chlorophyll and
pheo-pigments: Spectrophotometric equations. Limnol.
Oceanogr. 12: 343–346. doi:10.4319/lo.1967.12.2.0343
Lumborg, U., T. J. Andersen, and M. Pejrup. 2006. The effect
of Hydrobia ulvae and microphytobenthos on cohesive
sediment dynamics on an intertidal mudflat described by
means of numerical modelling. Estuar. Coast. Shelf Sci.
68: 208–220. doi:10.1016/j.ecss.2005.11.039
Maa, J. P., L. Sanford, and J. P. Halka. 1998. Sediment resus-
pension characteristics in Baltimore harbor, Maryland.
Mar. Geol. 146: 137–145. doi:10.1016/S0025-
3227(97)00120-5
Madsen, J. D., P. A. Chambers, W. F. James, E. W. Koch, and
D. F. Westlake. 2001. The interaction between water
movement, sediment dynamics and submersed macro-
phytes. Hydrobiologia 444: 71–84. doi:10.1023/A:
1017520800568
Mehta, A. J., and S. Lee. 1994. Problems in linking the
threshold condition for the transport of cohesionless and
cohesive sediment grain. J. Coast. Res. 10: 170–177.
[WorldCat]
Mitchener, H., and H. Torfs. 1996. Erosion of mud/sand mix-
tures. Coast. Eng. 29: 1–25. doi:10.1016/S0378-
3839(96)00002-6
Murray, W. A. 1977. Erodibility of coarse sand-clayey silt
mixtures. J. Hydraul. Eng. 103: 1222–1227.
Nepf, H. M. 2012. Flow and transport in regions with aquatic
vegetation. Annu. Rev. Fluid Mech. 44: 123–142. doi:
10.1146/annurev-fluid-120710-101048
Norkko, A., A. Villns, J. Norkko, S. Valanko, and C. Pilditch.
2013. Size matters: Implications of the loss of large indi-
viduals for ecosystem function. Sci. Rep. 3. doi:10.1038/
srep02646
Pratt, D. R., A. M. Lohrer, C. A. Pilditch, and S. F. Thrush.
2014. Changes in ecosystem function across sedimentary
gradients in estuaries. Ecosystems. 17: 182–194. doi:
10.1007/s10021-013-9716-6
Reise, K. 2002. Sediment mediated species interactions in
coastal waters. J. Sea Res. 48: 127–141. doi:10.1016/
S1385-1101(02)00150-8
Roberts, J., R. Jepsen, D. Gotthard, and W. Lick. 1998. Effects
of particle size and bulk density on erosion of quartz par-
ticles. J. Hydraul. Eng. 124: 1261–1267. doi:10.1061/
(ASCE)0733-9429(1998)124:12(1261)
Sanford, L. P. 2008. Modeling a dynamically varying mixed
sediment bed with erosion, deposition, bioturbation, con-
solidation, and armoring. Comput. Geosci. 34: 1263–
1283. doi:10.1016/j.cageo.2008.02.011
Sanford, L. P., and J. P. Maa. 2001. A unified erosion formu-
lation for fine sediments. Mar. Geol. 179: 9–23. doi:
10.1016/S0025-3227(01)00201-8
Sch€unemann, M., and H. K€uhl. 1991. A device for erosion-
measurements on naturally formed, muddy sediments:
The EROMES System. Report of GKSS Research Centre
GKSS 91/E/18. GKSS, Geestacht.
Soomere, T., K. Myrberg, and M. Lepp€aranta. 2008. The progress
in knowledge of physical oceanography of the Gulf of Fin-
land: A review for 1997–2007. Oceanologia 50: 287–362.
Thomsen, L., and G. Gust. 2000. Sediment erosion thresh-
olds and characteristics of resuspended aggregates on the
western European continental margin. Deep-Sea Res. Pt I
47: 1881–1897. doi:10.1016/S0967-0637(00)00003-0
Valanko, S. 2012. Dispersal and metacommunity dynamics
in a soft-sediment benthic system: How well is the sea-
floor connected?. Ph.D. thesis. Abo Akademi Univ.
Valanko, S., A. Norkko, and J. Norkko. 2010. Strategies of
post-larval dispersal in non-tidal soft-sediment communi-
ties. J. Exp. Mar. Biol. Ecol. 384: 51–60. doi:10.1016/
j.jembe.2009.12.012
Valanko, S., A. Norkko, and J. Norkko. 2015. Does stability
in local community composition depend on temporal var-
iation in rates of dispersal and connectivity?. J. Sea Res.
98: 24–32. doi:10.1016/j.seares.2014.09.001
Wang, C., C. Wang, and Z. Wang. 2010. Effects of sub-
merged macrophytes on sediment suspension and NH-N
release under hydrodynamic conditions. J. Hydrodynam.
B 22: 810–815. doi:10.1016/s1001-6058(09)60120-7
Warrick, J. A. 2013. Dispersal of fine sediment in nearshore
coastal waters. J. Coast. Res. 29: 579–596. doi:10.2112/
JCOASTRES-D-12-00087.1
Joensuu et al. Variation in the erodibility of coastal sediments
185

Weerman, E. J., P. M. Herman, and J. Van de Koppel. 2011.
Macrobenthos abundance and distribution on a spatially
patterned intertidal flat. Mar. Ecol. Prog. Ser. 440: 95–
103. doi:10.3354/meps09332
Weyhenmeyer, G. A. 1998. Resuspension in lakes and its
ecological impact - a review. Adv. Limnol. 51: 185–200.
Widdows, J., and M. Brinsley. 2002. Impact of biotic and abi-
otic processes on sediment dynamics and the conse-
quences to the structure and functioning of the intertidal
zone. J. Sea Res. 48: 143–156. doi:10.1016/S1385-
1101(02)00148-X
Winterwerp, J. C., and W. G. M. van Kesteren. 2004. Intro-
duction to the physics of cohesive sediment in the marine
environment, 1st ed. Elsevier.
Zhang, K., B. C. Douglas, and S. P. Leatherman. 2004. Global
warming and coastal erosion. Clim. Change 64: 41–58.
doi:10.1023/B:CLIM.0000024690.32682.48
Ziervogel, K., and B. Bohling. 2003. Sedimentological param-
eters and erosion behaviour of submarine coastal
sediments in the south-western Baltic Sea. Geo-Mar. Lett.
23: 43–52. doi:10.1007/s00367-003-0123-4
Acknowledgments
We thank Johanna Gammal and Marie J€arnstr€om for valuable help inthe field and with the laboratory analysis, and Guillaume Bernard for
providing the grain size data. We also thank 1 anonymous reviewer andGerardo M. E. Perillo for useful and constructive comments on the man-uscript. The EROMES-device was borrowed from the University of Wai-
kato, New Zealand and the study was conducted at the Tv€arminneZoological Station. This work was funded by Walter and Andr�ee de
Nottbeck Foundation and BONUS-project COCOA.
Conflict of Interest
None declared.
Submitted 10 February 2017
Revised 25 May 2017
Accepted 06 June 2017
Associate editor: Luiz Drude de Lacerda
Joensuu et al. Variation in the erodibility of coastal sediments
186