differences in child health across rural, urban, and … 01, 2017 · differences in child health...
TRANSCRIPT

Differences in Child Health across Rural Urban andSlum Areas Evidence from Indialowast
Claus C PoumlrtnerDepartment of Economics
Albers School of Business and EconomicsSeattle University
cportnerseattleueduwwwclausportnercom
ampCenter for Studies in Demography and Ecology
University of WashingtonYu-hsuan Su
Graduate Institute of Development StudiesNational Chengchi University
yuhsunccuedutwyuhsuweeblycom
June 2017
lowastWe would like to thank Seik Kim Robert Plotnick Judith Thornton five anonymous referees andparticipants at the Population Association of America annual meetings Pacific Conference for DevelopmentEconomics Annual Conference of the European Society for Population Economics DIAL DevelopmentConference and the Labor and Development Seminar at the University of Washington for their helpfulcomments Partial support for this research came from a Eunice Kennedy Shriver National Institute of ChildHealth and Human Development research infrastructure grant R24 HD042828 to the Center for Studiesin Demography amp Ecology at the University of Washington from the Office of Research and Developmentof National Chengchi University and from the Ministry of Science and Technology of Taiwan Government104-2914-I-004-009-A1
Abstract
The developing world is rapidly urbanizing but our understanding of how child health
differs across urban and rural areas is lacking We examine the association between area
of residence and child health in India focusing on composition and selection effects
Simple height-for-age averages show that rural Indian children have the poorest health
and urban children the best with slum children in between Controlling for wealth
or observed health environment the urban height-for-age advantage disappears and
slum children fare significantly worse than their rural counterparts Hence differences
in composition across areas mask a substantial negative association between living
in slums and height-for-age This association is more negative for girls than boys
Furthermore a large number of girls are ldquomissingrdquo in slums We argue that this implies
that the negative association between living in slums and health is even stronger than
our estimate The ldquomissingrdquo girls also help explain why slum girls appear to have
a substantially lower mortality than rural girls do whereas slum boys have a higher
mortality risk than rural boys do We estimate that slum conditionsmdashwhich the survey
does not adequately capture such as overcrowding and open sewersmdashare associated
with 20ndash37 of slum childrenrsquos stunting risk
Keywords Child health mortality slum urban rural sex selection
JEL Classification I14 J13 O18
2
1 Introduction
Urban areas have a substantially lower percentage of stunted or underweight children than
rural areas but the absolute number of undernourished children has increased faster in
urban than rural areas over the last decades (Haddad Ruel and Garrett 1999 Smith Ruel
and Ndiaye 2005 Fotso 2007 van de Poel OrsquoDonnell and van Doorslaer 2007 Paciorek
Stevens Finucane and Ezzati 2013) As the developing worldrsquos urban population increases
from 39 billion in 2011 to a projected 63 billion in 2050 (United Nations 2015 p 12) it is
important that we understand how child health differs across rural and urban areas in order
to design effective policies
Why might child health differ across areas One potential reason is the makeup of the
population on average parents in urban areas are richer and better educated and richer
and better educated parents have healthier children If population composition explains the
urban-rural child health differentials controlling for key determinants of child health should
eliminate the urban advantage However the literature provides few conclusive results
Controlling for composition reduces the urban advantage but many cases with a statis-
tically significant difference remain (Kennedy Nantel Brouwer and Kok 2006 van de Poel
OrsquoDonnell and van Doorslaer 2009 Bocquier Madise and Zulu 2011) For example using
Demographic and Health Surveys (DHS) data from 47 developing countries differences in
stunting and under-five mortality risk between urban and rural areas remain statistically
significant in 16 countries for stunting and 11 countries for mortality even after controlling
for a broad set of explanatory variables (van de Poel et al 2007)1
Unequal distribution of wealth within urban areas further complicates the picture In
some cases living in urban areas correlates with better child health for both rich and poor
families with the effect being larger the richer the family (Timaeligus and Lush 1995 Fotso
2006 Dye 2008) Some urban poor however live in environments and have health out-1 For further examples see Timaeligus and Lush (1995) Fotso (2006) Fotso (2007) Dye (2008) and van de
Poel et al (2009)
1
comes that are little better than those of the rural poor (Menon Ruel and Morris 2000
Montgomery 2009)2 Finally there are cases where the urban poor experience statistically
significantly higher mortality than their rural counterparts after controlling for wealth and
socio-demographic factors (van de Poel et al 2009)
A possible explanation for these inconclusive findings may be the failure to differentiate
between slums and regular urban areas3 Slums often serve as the first stop for people moving
to cities in search of new opportunities and as the overall urban population grows more
and more people end up living in slums Currently around 863 millionmdashor 33mdashof the
urban population in developing countries live in slums (UN-Habitat 2013 p 151) There
is however only a small amount of literature on slums and child health most likely because
of a lack of data DHS data for example include slum information for only three countries
Bangladesh Egypt and India Most surveys exclude slum areas because they are often
illegal settlements and when slum areas are included the sample sizes are often too small
to allow slum-specific estimates (Fotso 2007 Marx Stoker and Suri 2013)
One way around the lack of household data is to examine the relationship between health
outcomes and urban slum prevalence at the macro level Country-level data from 80 develop-
ing countries show that a higher percent of the population living in slums is associated with
higher infant and child mortality (Rice and Rice 2009 Jorgenson and Rice 2010 Jorgen-
son Rice and Clark 2012 Jorgenson and Rice 2012) Another approach is to create slum
indicators based on neighborhood characteristics from micro-level data Using this approach
on DHS data from 18 African countries child mortality rates in slum areas are significantly
higher than in non-slum urban areasmdashalthough in most cases they are still lower than in
rural areas (Guumlnther and Harttgen 2012) Similarly results using DHS data from 73 low-
and middle-income countries show that when not controlling for determinants other than2 Although it is noteworthy that neighborhoods of relatively poor urban households are more heteroge-
neous than is often believed (Montgomery and Hewett 2005)3 Descriptive studies indicate that people in slums are less healthy compared to those in non-slum urban
areas (Basta 1977 James Ferro-Luzzi and Waterlow 1988 Mullick and Goodman 2005 Ezeh OyebodeSatterthwaite Chen Ndugwa Sartori Mberu Melendez-Torres Haregu Watson Caiaffa Capon and Lil-ford 2017)
2
residence slum children face higher health risks than urban children but lower risks than
rural children (Fink Guumlnther and Hill 2014) Controlling for maternal education wealth
and health facilities access health outcomes for slum children in towns with fewer than 1
million residents are not statistically different from those of rural children with compara-
ble characteristics What is more remarkable however is that slum children in cities with
more than 1 million residents retain their health advantage over rural childrenmdasheven when
including these controls
These inconclusive results on the relationship between child health and area of residence
provide the primary motivation for this paper The question we seek to answer is to what
extent do composition and selection effects explain differences in child health across rural
urban and slum areas Our child health outcomes are height-for-age weight-for-height
and mortality risk since these all capture different aspects of the same underlying but
unobserved health production process We focus on height-for-age as our main child health
indicator because it better measures childrenrsquos long-term health and nutritional status and
because higher height-for-age as a child is associated with more schooling and better labor
market outcomes as an adult (Thomas and Strauss 1997 Alderman Hoogeveen and Rossi
2009 Maluccio Hoddinott Behrman Martorell Quisumbing and Stein 2009)
We take a different approach from the literature and focus on one country India for
three reasons4 First India has the worldrsquos second-largest population and is home to sub-
stantial and rapidly growing slum areas Indiarsquos slum-dwelling population has risen from
279 million in 1981 to 6549 million in 2011 (India Office of the Registrar General and Cen-
sus Commissioner 2013) Indiarsquos largest city Mumbai for example has more than 6 million
slum residentsmdashout of the cityrsquos total of 12 million peoplemdasheven though slums occupy only
about 9 of the cityrsquos land In addition the number of slum dwellings has grown 40 since4 Other studies have examined rural-urban differences in specific countries but without allowing for the
potential differences between slum and non-slum urban areas For rural-urban mortality differences in Indiaand Brazil see Sastry (1997) Sastry (2004) Pradhan and Arokiasamy (2010) and Saikia Singh Jasilionisand Ram (2013) There are also studies that focus solely on slum areas (Subbaraman Orsquobrien ShitoleShitole Sawant Bloom and Patil-Deshmukh 2012)
3
1995 (Murthy 2012)
Second our data the 2005ndash2006 National Family Health Survey explicitly surveyed slum
areas in addition to rural and urban areas Having direct information on whether a respon-
dent lives in a slum is important because constructing slum indicators based on household
data as the prior literature has done is likely to miss important aspects For example
population density and area conditions such as open sewers are defining characteristics of
slums but most data sets do not provide information on either characteristic making it dif-
ficult to successfully distinguish slum and non-slum areas using standard household data5
The direct information on slums combined with a large sample size across all three types
of areasmdashwith slums oversampled to ensure a sufficient sample sizemdashallows us to better
identify potential differences across areas than the prior literature
Finally and most importantly focusing on a specific country allows us to analyze poten-
tial selection effects in detail We are particularly interested in selection effects that might
arise from two sources mortality and son preference6
Mortality selection is the potential for mortality to bias estimates of the association
between area of residence and our height-for-age and weight-for-height measures of child
health We only have information on height and weight for children who survive to the survey
date but who survives is not a random process Imagine a situation where the distributions of
underlying health for slum children and similar rural children are the same but low-health
rural children have a higher likelihood of dying than low-health slum children In that
case rural children will appear on average to be healthier in terms of weight and height
than slum children A straightforward way to examine if mortality selection is important is
to compare our mortality results to our height and weight resultsmdashsubstantial differences
suggest mortality selection7
5 Guumlnther and Harttgen (2012) and Fink et al (2014) use the number of people per room as a proxywhen defining slums This may be more likely to pick up poverty than whether a household lives in a slum
6 Other potential selection effects such as migration cannot be addressed because of data limitations7 This approach does assume that the underlying health process is the same for all three outcomes and
that the models are correctly specified Pitt (1997) discusses estimating determinants of child health whenthere is potentially selection in fertility and mortality
4
Mortality selection is a generic problem when estimating determinants of child health
but a potentially bigger issue is selection from son preference India has a long history of
strong son preferencemdashespecially in the northern states and among Hindus and Sikhsmdashthat
manifests itself in higher mortality for girls than boys and prenatal sex selection8
There are two main concerns that arise from the presence of son preference First the
differential mortality is often accompanied by selective recall where deceased girls are less
likely to be recorded than deceased boys when enumerators ask about fertility history9 The
underreporting of female deaths leads to biased mortality estimates Furthermore on av-
erage the deceased girls must have had worse health than those who survived and their
deaths make the rest of the population appear healthier Hence selective recall simultane-
ously makes the mortality selection problem worse and makes it more difficult to establish
whether it occurs using comparison of mortality and anthropometric results If mortal-
ity and selective recall vary across areas the estimates of the relationship between area of
residence and child health are biased
Second any use of prenatal sex selection may also bias estimates of the relationship
between area of residence and child health Suppose we hold all observable characteristics
constant and assume that there is a distribution of son preference across families and that the
use of prenatal sex selection correlates positively with son preference after introduction of the
technology Then all that is required for a bias is that girls not born because of prenatal sex
selection would have suffered worse health and would have had higher likelihood of dying
than girls born to families with the same characteristics but less strong son preference10
Because the cost of raising children is higher in slum and non-slum urban areas than in
rural areas and because prenatal sex selection is therefore more prevalent (Poumlrtner 2016)8 For an early discussion of son preference in India see Sen (1990) See Poumlrtner (2016) for references on
these different outcomes and an analysis of the relationship between fertility birth spacing and the use ofsex selection
9 See Poumlrtner (2016 online Appendix) for a discussion of recall errors based on son preference in the threeNFHS
10 There is empirical evidence for this mechanism in Taiwan where access to sex-selective abortion reducedrelative neonatal female mortality rates for higher-parity births (Lin Liu and Qian 2014)
5
estimated differences in child health and mortality across areas may suffer from bias even
when holding other characteristics constant
Because son preference selection mainly affects girls we estimate the relationships be-
tween area of residence and health outcomes both for boys and girls combined and separately
for each sex11 This helps us understand if the association between explanatory variables
and health differ by sex and provides an indication of the extent of son preference selection
Simple averages from NFHS-3 show that urban children do better than slum children for
all three health measures and that slum children in turn do better than rural children do
However once we control for wealth and health environment there is no substantial differ-
ence in average height between urban (non-slum) and rural children but slum children are
significantly shorter than rural children Hence the composition of slum residents effectively
hides the substantial negative association between living in slums and child health
Controlling for wealth health environment and other observable characteristics there
are important differences between boys and girls We find that the height difference between
slum and rural children is larger for girls than for boys Boys in slums do not have a higher
probability of survival than rural boys whereas slum girls appear to have a survival advantage
over rural girls We argue that the large number of ldquomissing girlsrdquo in slums and urban areas
indicates a substantial son preference selection which makes mortality a poor measure for
comparing health environments and biases the estimated negative coefficient on height for
slums towards zero We estimate that slum conditionsmdashwhich we cannot adequately capture
with currently available datamdashare associated with 20ndash37 of slum childrenrsquos risk of stunting
2 Data and Estimation Strategy
We use data from the 2005ndash2006 National Family Health Survey (NFHS-3) NFHS-3 is
the third in a series of national surveys with earlier surveys in 1992ndash1993 (NFHS-1) and11 It is possible that the absence of sisters andor the expense of sex selection affects the resources available
to boys and therefore their health but even then boys would be much less affected than girls
6
1998ndash1999 (NFHS-2) We use NFHS-3 exclusively because the first two surveys did not
include information on slums12 The survey is described in detail in International Institute
for Population Sciences (IIPS) and Macro International (2007 Chapter 1)
In eight citiesmdashChennai Delhi Hyderabad Indore Kolkata Meerut Mumbai and
Nagpurmdashthe NFHS-3 surveyed both urban non-slum areas and urban slum areas NFHS-3
used two methods to identify areas as slum One is the 2001 Census classification of the
area The census divided slums into three categories ldquo(i) all specified areas in a town or
city notified as lsquoSlumrsquo by StateLocal Government and UT Administration under any Act
including a ldquoSlum Actrdquo (ii) all areas recognized as lsquoSlumrsquo by StateLocal Government and
UT Administration Housing and Slum Boards which may have not been formally notified
as slum under any act and (iii) a compact area of at least 300 population or about 60ndash70
households of poorly built congested tenements in unhygienic environment usually with in-
adequate infrastructure and lacking in proper sanitary and drinking water facilitiesrdquo (Gupta
Arnold and Lhungdim 2009 p 10)13 Category (iii) consists mainly of what is known as
ldquonon-notified slumsrdquo The other method is the local field supervisorrsquos assessment of whether
a primary sampling unit (PSU) is in a slum14 The definition that supervisors are asked to
apply is equivalent to category (iii) used by the 2001 Census and is meant to capture the
less-established slums (See also Gupta et al 2009 p 15) The assessment was collected for
each surveyed PSU in the eight cities We consider a PSU a slum if identified as such by the
2001 Census by the field supervisor or both We examine the sensitivity of our results to
the choice of slum definition below
We restrict our sample to the seven states that have slum samples in order to make the
rural slum and urban samples more comparable The seven states with slum samples are
Delhi Uttar Pradesh West Bengal Madhya Pradesh Maharashtra Andhra Pradesh and12 NFHS-2 did collect data from slum residents in Mumbai but not any other cities13 A UT (union territory) is an administrative unit in India governed directly by the central government14 In urban areas PSUs follow the 2001 Census enumeration blocks which contain 150ndash200 households
International Institute for Population Sciences (IIPS) and Macro International (2007 Appendix C) describethe selection process
7
Tamil Nadu Finally we restrict the sample to Hindus and Muslims because of the very
small number of surveyed slum children who are not Hindu or Muslim
21 Estimation Strategy
To understand the role of composition effects we begin by showing descriptive statistics for
child health outcomes by area of residence We then estimate a series of regressions with an
expanding set of covariates Our main indicator for child health is height-for-age Z-scores
A child with a Z-score of zero is exactly the mean height of the comparison population for
that age while children with negative Z-scores are shorter The results for weight-for-height
Z-scores are also reported15
Our first model shows the association between area and child health when we control for
child gender and age
Hijk = α +Ajkβ1 +Cijkβ2 + ϵijk (1)
where Hijk is the health status of child i in household j in state k Ajk captures the area
of residence of the household divided into three exclusive areas rural urban non-slum and
urban slum Cijk is a vector of personal characteristics of that child including gender and
age in months
The second specification incorporates parental characteristics
Hijk = α +Ajkβ1 +Cijkβ2 +Pjkβ3 + microk + ϵijk (2)
where Pjk is a vector of parental characteristics that includes motherrsquos and fatherrsquos levels of
education motherrsquos height household head religion and household head caste16 In addition
this specification includes fixed effects microk for state and survey month We include survey15 We do not use the information on diarrhea cough and fever because of the noisiness of these self-
reported variables16 The fatherrsquos height is not included because the information is missing for more than half of the children
in our sample
8
month fixed effects to capture potential seasonal variation in child health which is especially
a concern in rural areas (International Institute for Population Sciences (IIPS) and Macro
International 2007) With the combination of state and month fixed effects we capture the
average child health for an area rather than simply the health status observed when the
survey happened to occur17
To examine the role of household wealth and observed local health environment we then
estimate
Hijk = α +Ajkβ1 +Cijkβ2 +Pjkβ3 +Wjkβ4 +Rjkβ5 + microk + ϵijk (3)
where Wjk is a vector of the householdrsquos wealth status and Rjk is a vector of area charac-
teristics for household jk We include in turn household wealth area wealth distribution
and area health environment followed by a model that includes all
Each area characteristic variable is created using the ldquominus-irdquo method Rjk =1
nminus1
sumRminusjk
wheresum
Rminusjk indicates that the sum is over all other households in the primary sampling
unit (PSU) except for jk The advantage is that area characteristics by construction are
no longer correlated with the unobserved characteristics of the individual household (Aizer
2010) Household wealth is captured using the NFHS-constructed wealth index described
below
After examining the association between area of residence and height-for-age and weight-
for-height we turn to mortality There are two reasons for examining mortality First it is
of interest in its own right as a health outcome Second the child mortality results provide
an indication of whether there are mortality selection problems for our height-for-age and
weight-for-height results We estimate the association between the same sets of individual
household and area characteristics and child mortality using the Cox proportional hazard
model17 This does assume that the seasonal pattern is similar across states but the loss of degrees of freedom
if we interacted month of survey with state would be large and would fail to capture the seasonal variationin health because no state was surveyed over the entire year
9
For a child i age t months the instantaneous hazard rate of death conditional on still
being alive at age t is
λ(t | Xijkt) = λ0(t) exp(Xijktβ) (4)
The baseline hazard λ0(t) is a nonparametric time-varying function and Xijkt is a vector
that combines the explanatory variables in the previous specifications For each child the
outcome is age measured in months at the time of survey if still alive or age of death if
not alive at the time of survey An observation for a child alive at the time of survey and
less than five years of age is considered censored
For all models and outcomes we present results for three samples all children combined
boys only and girls only All regressions employ survey weights to account for oversam-
pling of slum areas Furthermore we use robust standard errors clustered at PSU level for
all regressions to allow for potential intragroup correlation of errors We cluster at PSU
level because that is the highest level of aggregation for which we have variables of interest
(Moulton 1990) All regressions are done in Stata 121 using the ldquoclusterrdquo option which
also implies robust estimation of the standard errors18
22 Variables and Descriptive Statistics
Table 1 presents descriptive statistics by area of residence rural slums and urban non-
slums We limit the sample to children younger than five years of age because anthropometric
information is not available for older children Consistent with the existing literature the
overall health status of children in the sample is poor The average height-for-age Z-score is
-178 Children in rural areas do the worst with an average height-for-age Z-score of -199
while slum children have an average height-for-age Z-score of -159 and urban children are
the healthiest with a height-for-age Z-score of -150 The differences across the three areas
are all statistically significant at the 5 level19 Using a threshold of height-for-age Z-score of18 Cox proportional hazard models are run using ldquostcoxrdquo and all other regressions using ldquoregressrdquo19 The t-statistics are for ruralndashslum 1106 ruralndashurban 1538 and slumndashurban 236
10
-2 more than half of the rural children are stunted whereas around 40 fall in this category
for slums and urban areas The difference in percent stunted between urban and slum is not
statistically significant Hence in line with the prior literaturemdashand despite the common
view of slums as detrimental to healthmdashslum children do surprisingly well according to the
simple averages
[Table 1 about here]
Weight-for-height follows a similar pattern as height-for-age but with less distinct differ-
ences The differences between rural and both slum and urban are statistically significant
but the difference between slum and urban is not20 Both height-for-age Z-score and weight-
for-height Z-score are close to normally distributed and do not appear to be substantially
skewed21
For mortality analyses we expand the sample to include 1118 children who died before
their fifth birthday making the sample 16179 children born in the five years prior to the
survey Like the two other health measures children in rural areas do the worst with a
mortality rate of 83 whereas the mortality rate is 55 in slums and 51 in urban non-
slum areas Despite the relatively low mortality the oversampling of slum populations helps
ensure that we should have sufficient power in slums 167 out of 3138 children have died
of which 72 were female For comparison 239 out of 4726 children in non-slum urban areas
have died of which 98 were female Mortality risk follows the same overall pattern in the
three areas with the majority of mortality concentrated within the first months of life and
almost no deaths after the first two years of life22
The natural sex ratio at birth in India is around 105 boys per 100 girls (Poumlrtner 2016)
Hence in the absence of differential mortality sex-selective abortions and selective recall
of deceased children we should expect 488 of the sample to be girls The percentage of
girls in rural areas is at the expected number In urban areas 48 of the sample are girls20 The t-statistics are for ruralndashslum 782 ruralndashurban 984 and slumndashurban 07321 Histograms of outcomes by area and sex are available in the online Appendix22 Non-parametric Kaplan-Meier survival curves using survey weights are available in the online Appendix
11
whereas in slum areas only 46 are This provides a first indication that son preference
selection may affect estimates of the association between area and child health
The average level of education of both mothers and fathers in urban non-slums and slum
areas are substantially higher than in rural areas23 There is less than a yearrsquos difference in
the average education levels between slum areas and urban non-slum areas for both mothers
and fathers Corresponding to the height differences between children mothers are on
average tallest in urban areas followed by slum areas and finally rural areas
The wealth index in NFHS-3 is a composite measure of household living standard based
on principle components analysis of 33 assets and household characteristics We use the
wealth quintiles rather than the underlying index itself24 Not surprisingly rural areas are
the poorest with 60 of the children belonging to households in the bottom two wealth
categories Urban areas have the highest proportion in the top category (Category 5) with
47 of children in that category but slums are not far behind with 38 in the top category
Furthermore 78 of slum children belong to the top two wealth groups in slums compared
to 74 in urban areas
The bottom portion of Table 1 shows area wealth distribution and area health envi-
ronment All area characteristics are calculated as the average of households in the PSU
excluding the household itself as described in Section 21 Area wealth distribution is cap-
tured by the percentage of households in each of the five wealth categories As expected
given the distribution of wealth discussed above slums and urban areas are relatively simi-
lar in terms of area wealth distribution while households in rural areas generally have less
wealth
Area health environment includes characteristics that are thought to broadly reflect the
healthiness of the living conditions of the area These include water access (captured by the
average time to fetch water and type of drinking water source) access to improved cooking23 The estimations use a set of dummies to capture parental education 1ndash4 years 5ndash7 8ndash9 10ndash11 and
12ndashplus years This follows International Institute for Population Sciences (IIPS) and Macro International(2007)
24 See httpdhsprogramcomtopicswealth-index for an in-depth discussion of the wealth index
12
fuel sharing a toilet with 10 or more households access to improved toilet facilities and the
average number of people per room
The time it takes to fetch watermdasharound six minutesmdashis close to identical across urban
and slum areas which is about half the time it takes in rural areas Using the NFHS-3
reportrsquos definition of access to improved sources of drinking water around 96 of households
in urban and slum areas have access to an improved source of drinking water with rural
areas only slightly behind at 8725
Smoke from solid cooking fuels is a serious health hazard and we therefore include
whether the household has access to improved cooking fuel (International Institute for Pop-
ulation Sciences (IIPS) and Macro International 2007)26 The proportion of households that
use improved cooking fuels is higher in slums than in urban areas with 78 in slums and
69 in urban areas Rural areas are far behind with only 7 using an improved cooking
fuel
At 19 slums have the highest percentage of households sharing toilets with ten or
more other households probably because most slum dwellers rely on public toilets in the
community In urban areas 6 of households share with ten or more households while less
than 1 do so in rural areas About three-quarters of households in slums and urban areas
have access to improved toilets while only 17 in rural areas have similar access Finally
slums and rural areas have essentially the same number of people per room at 37 with
urban households having an average of 33 people per room
Two important points arise from these descriptive statistics First normal standard of
living measures and area of residence are not necessarily closely correlated There are for
example more children in the top two wealth categories in slum areas than in urban areas25 In addition to water piped into the dwelling yard or plot an improved drinking water source includes
water available from a public tap or standpipe a tube well or borehole a protected dug well a protectedspring rainwater and bottled water (International Institute for Population Sciences (IIPS) and MacroInternational 2007) We also tried splitting into four main safe water sources but none were statisticallysignificantly different from unsafeunimproved water sources All showed coefficients close to zero and thechanges in the area dummiesrsquo association with height-for-age Z-score were minimal
26 Solid cooking fuels include coallignite charcoal wood straw shrubs grass agricultural crop wasteand dung cakes We consider electricity natural gas biogas and kerosene as improved cooking fuel
13
and education levels are relatively high This finding is in line with the literature that points
out that slum residency is not equal to poverty and vice versa (Montgomery and Hewett
2005 Montgomery 2009 Bhan and Jana 2013) Second even though the general perception
of slums is one of squalor and poor living conditions the descriptive statistics appear to paint
a different picture Differences in many household characteristics across areas are relatively
small and for some characteristics slums even appear to do best
3 Results
The simple averages show that slum children although they clearly are worse off than chil-
dren in urban areas do not lag far behind in terms of health and certainly are in better
health than rural children The question is to what extent these simple averages provide
an adequate description of the association between child health and area of residency We
begin by examining how composition effects influence child height-for-age We then turn to
mortality and son preference selection Finally we examine the robustness of our results
31 Composition Effects and Height-for-Age
Table 2 presents the results for the specifications described above for child height-for-age Z-
scores27 Columns (1) to (7) show the results for different sets of control variables beginning
with the specification that only includes child age and sex and ending with the specifica-
tion that includes all variables Only the estimated differences across areas and by sex are
presented here28
[Table 2 about here]
The simplest specification Column (1) which includes only age dummies shows that
children in urban slums appear to be taller than rural children with children in urban ar-27 The online Appendix shows results by religion and caste affiliation28 Full results are available upon request
14
eas the tallest Compared with rural children slum children are on average 038 standard
deviations taller and urban children are 043 standard deviations taller Both differences
are statistically significant at the 1 level Controlling for parental education motherrsquos
height household head religion and caste and state and survey month fixed effects in Col-
umn (2) substantially reduces the urban health advantage and there is now no statistically
significant difference between childrenrsquos health in rural and slum areas Once we include
either household wealth area wealth distribution or area health environment as additional
explanatory variables shown in Columns (3) through (5) living in slums is associated with
statistically significantly worse health than living in rural areas Furthermore the difference
is large in the full specification Column (7) a slum child is 022 standard deviations shorter
than a rural child holding all other observable factors constant
Restricting the sample to boys only there is no significant difference between rural and
urban or rural and slums in Columns (3) through (5) and Column (7) although slum areas
are still substantially below rural areas The estimates for girls show only a very small
difference between child health in rural and urban areas for Columns (3) through (7) Living
in slums is however associated with substantially and statistically significantly worse health
relative to rural areas Once we control for wealth status wealth distribution or area health
environment girls in slums are almost a quarter of a standard deviation shorter than girls
in rural areas
As in the previous literature on child health the results for height-for-age are substantially
stronger than for weight-for-height29 The overall pattern of the weight-for-height results is
however strikingly similar to the height-for-age results The basic specification shows an
advantage in child health for both slums and urban children over rural children with the
largest difference for urban children Once we control for variables such as household wealth
area wealth distribution and area health environment slum children have lower weight-for-
height Z-scores than rural children The differences among slum urban and rural areas are29 The results for weight-for-height Z-scores are available in the online Appendix
15
however not statistically significant in the specifications that include area characteristics
Overall the findings suggest that a composition effect is at least partly responsible for the
simple averages showing relatively healthy children in both urban and slum areas Control-
ling for either household wealth or area characteristics a child living in a slum is significantly
shorter than what we would expect for a child with the same observable characteristics in a
rural area although this association should not be taken as causal The question is whether
mortality selection affects these results
32 The Role of Mortality Selection
Table 3 follows the same specifications to examine how child mortality differs by area except
that age of the child is incorporated directly into the baseline hazard The coefficients
presented are hazard ratios a coefficient less than one indicates that there is a lower risk of
death compared to the reference group whereas a coefficient greater than one indicates a
higher risk than the reference group For the pooled sample of boys and girls the simplest
specification implies a hazard that is more than 40 lower for children in slums and urban
areas compared to rural areas and these estimates are statistically significantly different
from one
[Table 3 about here]
Slum and urban children have substantially better survival chances than rural children
This pattern does not change when we include additional variables although the additional
variables reduce the differences in survival chances across areas Urban children have 20ndash25
lower mortality hazard than rural children with the same characteristics and this difference is
statistically significant in all models Slum children have a similar or even higher advantage
but the estimate is outside the normal significance interval for the full model in Column (7)
These mortality results do appear to complicate the story Using the pooled sample and
the full models slum children do significantly worse than rural children in terms of height
16
but slum children also have lower mortality albeit not significantly so Hence it is possible
that mortality selection explains part of the poorer health outcomes in slum areas when we
take composition effects into account
Countering this interpretation are the large differences in results by sex Boys in slums
have higher mortality and substantially worse height outcomes compared with rural boys
whereas in urban areas boys have statistically insignificantly worse height outcomes but
lower mortality risk than rural boys The implication is that it is hard to see evidence of
selective mortality driving the health results for boys
Girls show a distinctly different pattern from boys In all specifications girls from both
slums and urban areas are substantially less likely to die than girls from rural areas In fact
girls from slums appear to have identical or lower mortality than girls from urban areas in
all specifications In the full model Column (7) the mortality hazard for slum girls is 70
lower than the hazard for rural girls compared to 40 for urban girls Hence it is possible
that part of the reason why we observe poorer health outcomes in slums is due to the much
lower observed mortality among girls in slums relative to rural girls
33 The Role of Son Preference Selection
There is however an important caveat to the mortality selection explanation for girls both
urban and slum areas show substantial bias in observed sex ratios at birth Assuming that
no boys are ldquomissingrdquo because of sex-selective abortions or selective recall errors we should
observe 100105
girls born per boy born (Poumlrtner 2016) Hence with 1612 recorded male births
in slums we should expect 1 612times 100105
= 1 535 girls born in slums We observed however
only 1374 girls born in slums Similarly with 2354 boys born in urban areas there should
be 2242 girls born but only 2122 are observed For rural areas there are 4456 male births
and 4261 female births which means 511 of the children born are boys which corresponds
closely to the expected sex ratio
To get an idea of how much son preference selection affects our estimate we combine
17
observed mortality with the number of female births missing This tells us for how many
children we would have observed anthropometric information if there was no selection because
of mortality selective recall or sex-selective abortions If we restrict to girls the combination
of missing and dead over observed births and predicted missing would be 9 in rural areas
10 in urban areas and 15 in slums30 That is we lack health information for a much
higher proportion of children in slum areas than in rural or urban areas
Seen in this light our puzzling mortality resultsmdashwith a very low mortality risk for
slum girls relative to rural girls but a higher mortality risk for slum boys relative to rural
boysmdashmake more sense Girls in slums who were not observed because of son preference
selection would likely have had both higher morbidity and higher mortality than what we
see for the observed girls In other words a possible reason that mortality appears so low
for girls in slums is that those at highest risk of dying are simply never recorded or born
The implication is that the slum results on height-for-age and weight-for-height are likely
underestimates in the sense that child health in slums compared to rural areas would be
even worse if there were no son preference selection
34 How Sensitive are Results to Slum Definition
There are four potential issues with respect to our slum definition that we need to address
First there is no ldquocorrectrdquo objective definition of a slum (Bhan 2013) The lack of an
objective slum definition may explain the substantial idiosyncrasies by city in how supervisors
classified slums relative to the census definition31 At one end supervisors in Indore agreed
with only five of the 30 areas classified as slums by the census and supervisors classified no
additional PSUs as slums At the other end supervisors in Delhi agreed with all but four of
the census slum PSUs and classified only two of the census non-slum areas as slums30 There are 384 female deaths out of 4261 female births in rural areas In urban areas there are 120
missing girls 98 female deaths and 2122 observed female births To calculate the percentage the numberof missing girls is added to the number of observed births to yield 98+120
2122+120 = 010 Finally for slum areasthere are 161 missing girls 72 female deaths and 1374 observed female births yielding 72+161
1374+161 = 01531 See Gupta et al (2009 Table 11 p 73) for a breakdown by city according to the different definitions
18
We classify an area as slum if indicated as such either by the census or the team supervisor
To examine how the slum definition affects our results we replicated the estimations using
two alternative definitions of slum 2001 Census definition only or supervisor definition
only32 The results for height-for-age using either the census definition or the supervisorrsquos
assessment correspond closely to those in Table 2 For the census definition the full model
coefficient for slum using the pooled sample is -017 just outside the 10 significance level
whereas the supervisorrsquos definition leads a point estimate of -019 which is statistically
significant at the 10 level Both are lower than the -022 we find but not statistically
significantly so
Second the 2001 Censusmdashon which the NFHS-3 sampling frame is basedmdashidentified slum
and non-slum areas two to three years prior to the census and some areas may therefore
have changed status in the almost 10 years from the creation of the census frame to the
NFHS-3 survey The biggest concern is that we fail to capture some newer slum areas in
the eight cities especially since these newer slums are likely ldquoworserdquo (Montgomery 2009
Subbaraman et al 2012 Bhan and Jana 2013 Fink et al 2014) The small and statistically
insignificant differences between the results using census or supervisor definitions of slums
help ease this concern Even if the census definition misses areas that have emerged as
slums more recently these would likely be captured by the supervisor during the survey as
supervisors were asked to classify areas as slums if they fit the non-notifiednon-recognized
definition of slums33 A related concern is that some of the areas originally classified as
slums by the census have developed enough to no longer qualify For both concerns the
effect would be that we underestimate how strong the negative association between slums
and child health relative to rural areas is34
Third the representativeness of the data is a potential issue because the slum sample32 Results are shown in the online Appendix33 The caveat to this argument is that supervisors might have been too stringent and therefore also failed
to classify areas as slums34 It would also make urban non-slum areas appear less healthy relative to rural areas because any newer
missed slums would be classified as urban areas
19
covered only the selected citiesmdashalthough these eight cities did account for nearly 30 of
Indiarsquos slum population in 2001 (Gupta et al 2009) How much this matters depends on
two things First whether slums in the non-selected urban areas are different from the slums
we do have data on Second whether slums in non-selected urban areas are still included
in NFHS-3 but captured as regular urban areas Based on the (imperfect) slum measures
created from household data used in the prior literature slums in smaller urban areas may
be worse than slums in larger urban areas (Fink et al 2014) If that is the case our results
are lower bound estimates of the negative association between slums and child health
If many slum areas were surveyed in the non-selected urban areas this would bias down-
ward our estimated association between living in urban non-slum areas and child health
making urban non-slum areas seem unhealthier than they really are Unfortunately there
is no direct way to establish the extent to which slums in other urban areas than the eight
cities were surveyed What we can do however is split urban areas into the eight selected
for the slum survey and those that were notmdashand therefore perhaps include some slum
areasmdashand re-estimate the models35 The weight-for-height results are practically identical
across selected and non-selected urban areas and the slum results do not change There are
a number of possible explanations for these results but we consider it most likely that very
few slums were surveyed in the non-selected urban areas combined with little difference in
the association between living in urban areas and child health across the different urban
areas36
Finally there clearly is the potential for variation across slums in how unhealthy they are
For example survey data from Kaula Bandar a non-notified slum in Mumbai show relatively
worse health outcomes compared with NFHS-3 slum data from Mumbai likely because of
Kaula Bandarrsquos non-notified status (Subbaraman et al 2012) We cannot however address
this important topic because we cannot reliably identify different types of slums in the data35 Results are available in the online Appendix36 Another possibility is that a number of slums were surveyed but not recorded as slums in the non-
selected urban areas combined with the other parts of the non-selected urban areas being substantiallyhealthier than the selected urban areas
20
Ultimately however these concerns point to the association between living in slums and
health being even more negative than our estimates show
35 Other Selection or Specification Issues
Finally in addition to selection from mortality and son preference other selection issues or
omitted variable biases may affect our results The main candidate is selective migration If
parents for example believe that slums are bad for child health those parents who care the
most about child health are the most likely to not live in slums but their children would
do better under any circumstances In that case slums would seem worse than they really
are because the parents remaining in slums care less about child health and therefore have
worse outcomes
All the limited information on migration in NFHS-3 allows us to do is identify two
groups migrantsmdashthose not born in the neighborhood they are surveyed inmdashand non-
migrantsmdashthose who have never moved Despite the common perception that slums are
mainly populated by a transient population the percentage of mothers who were born in
the neighborhood they are interviewed in is higher in slums 27 than in urban non-slums
22 and rural areas 1437 The distribution is in line with the argument made by Fry
Cousins and Olivola (2002) that slums often are stable and homogeneous communities rather
than chaotic agglomerations although see the discussion of slums as poverty traps in Marx
et al (2013) The low number for the rural population is most likely the result of the
Indian practice of exogamy where a woman marries into a household in another village and
becomes part of her husbandrsquos household (Rosenzweig and Stark 1989) The possibility
of selective migration does point to the importance of collecting detailed information on
migration behavior in future surveys so that researchers may better understand household37 These numbers are based on the question asked of all women ldquoHow long have you been living contin-
uously in (NAME OF CURRENT PLACE OF RESIDENCE)rdquo where name of current place of residenceis the villagersquos name in rural areas and the neighborhood in urban areas Hence we can reasonably expectthat a woman surveyed in a slum who responds that she was born in the same neighborhood would havespent her entire life in the slum For more on this question see the discussion on DHS user forum on IndiaResults by group are available upon request
21
migration decisions
Finally our results are conditional on including a set of covariates that best eliminate
omitted variable bias and correctly specifying the regression models We have expanded on
the set of covariates used compared to prior research in this field but it is still possible
that other unobserved variables could be correlated with both our chosen covariates and the
child health outcomes The stability of the results for different combinations of covariates
is however encouraging We discuss the need for better survey information especially for
area characteristics in the conclusion
4 Discussion
Our finding of a substantial negative association between slums and height-for-age when con-
trolling for household characteristics runs counter to some of the recent literature especially
the cross-country analysis in Fink et al (2014) There are minor differences in outcomes
and estimation methods used We focus on height-for-age Z-scores rather than the simple
cutoff of stunting and use an expanded set of explanatory variables Neither of those are
however likely to explain the differences in results
Why then do the results differ One important reason may be that NFHS-3 designed
the sample frame to incorporate slums and provides a slum indicator Previous studies had
to create slum indicators based solely on information about households in the areas which
cannot capture area characteristics such as overcrowding and unhygienic local conditions38
Furthermore other surveys may not even include slum areas if these areas are not explicitly
targeted (Fotso 2007 Marx et al 2013) If the areas designated as slums in the prior
literature are not really slums but simply poorer urban areas this may explain why prior
studies failed to find a difference across areas
Another reason for the differences in results is that focusing on one country and estimating38 Consider for example using the number of people per room as an indicator for crowding The number
of people per room fails to capture that dwellings in slums are located much closer together than in eitherurban or rural areas and the average number of people per room varies little across areas
22
results for boys and girls separately allow us to better examine how selection issues affect
results The very low mortality risk for slum girls and the large number of missing girls
in slums point to a potential role for son preference selection39 If son preference selection
differs by area mortality results contribute little to our understanding of how child health
differs across areas It suggests that our estimates are lower bounds and that without son
preference selection the slum estimates would have been more negative than what we find
This leaves the question what explains the negative association between slums and child
health The slum dummy captures the average difference in child health between slums
and rural areas conditional on the observable characteristics in our regressions We expect
that the broader unobserved health environment of slums explains most of this difference
Three factors are likely the most important components of this health environment open
sewers overcrowding and poor water quality All three are either insufficiently or not at
all captured by DHS data
Water quality is a particularly interesting example because slums appear to have better
access to improved water sources than either urban non-slum or rural areas Our water access
variables provide however only an imprecise measure of actual water quality because they
do not consider the reliability of the supply (Satapathy 2014) Intermittent water supply
reduces water quality because interruptions in supply allow contaminants such as human
excreta to enter the pipes with the contaminants then distributed across the system when
the supply is restored Even with identical supply interruptions across urban and slum areas
water quality would likely be worse in slums because of overcrowding open defecation and
poor sewage systems Low water quality affects child health through environmental enteric
dysfunction where contaminated water or other environmental factors change childrenrsquos gut
bacteria leaving them more prone to malnutrition despite being fed what appears to be an
adequate diet (Keusch Rosenberg Denno Duggan Guerrant Lavery Tarr Ward Black
Nataro Ryan Bhutta Coovadia Lima Ramakrishna Zaidi Burgess and Brewer 2013)40
39 The main caveat is that we cannot rule out selective migration40 Spears (2013) argues that open defecation can explain much of the variation in height-for-age between
23
In summary we find a negative association between living in slums and child health
because the broader health environment which we cannot adequately capture in our data is
responsible for the lower levels of health in slums when controlling for parental and observable
area characteristics The combination of poor water quality open sewers and overcrowding
is a likely candidate41
5 Conclusion
The primary aim of this paper is to examine the association between child health and res-
idence area type Simple averages from the third round of Indiarsquos National Family Health
Survey show the worst child health in rural areas the best in urban areas with slums in
between This runs counter to the common belief that slums are very unhealthy but is in
line with prior cross-country findings The simple height-for-age averages however do not
consider composition and selection effects which may obscure an arearsquos true health effects
The main finding is a strong negative association between living in slums and childrenrsquos
height-for-age once we control for wealth or area characteristics The negative association
between slum residence and height-for-age is larger for girls than boys Furthermore selection
effects are important Mortality appears to be low for girls in slums but this hides that
many girls are ldquomissingrdquo possibly because of selective recall of deceased girls or outright
sex selection This suggests that the negative association between living in slums and health
would likely be substantially worse for girlsmdashand therefore overallmdashif we were somehow able
to capture health outcomes for girls who either died or who were never born because of sex
selection Working in the same direction is the absence in our data of slums in smaller urban
India and Africa and that would presumably work mainly through this mechanism Furthermore there isevidence that exposure to open defecation is increasing in India (Spears 2014)
41 See also Bhan and Jana (2013) This may also explain why the positive relationship between motherrsquoseducation and child health found in rural areas diminishes or even disappears in slum and urban areas asshown in the online Appendix One interpretation is that slumsrsquo broader health environment is so bad thatmore education does little to counter the negative effects That a mother knows to wash her hands boilwater before use and take a sick child to the doctor matters little for child health if the local playground isan open sewer or if diseases spread quickly and easily due to overcrowding
24
areas and possibly newer slums in the selected cities The caveats to our results are that we
cannot address selective migration and that the results are conditional on correctly specified
models
To provide an idea of how living in slums is associated with child health Table 4 shows
the predicted percent stunted by area and the predicted percent stunted if slum children had
the same risk of stunting as children in urban areas or rural areasmdashbut otherwise retained
their other observed characteristicsmdashusing the pooled sample girls only and boys only42
We consider a child stunted if the predicted height-for-age Z-score is minus two or lower and
we base our calculation of the predicted number of stunted children by area on our results
combined with the 2011 Census
[Table 4 about here]
Just below 51 of children are stunted overall Slumsrsquo contribution to overall stunting
might seem insignificant because India is still a predominately rural society and there is a
substantial level of stunting in rural areas Using the population attributable fraction ap-
proach only 06ndash12 of Indiarsquos stunting is associated with living in slums43 This however
obscures the fact that the predicted number of stunted children decreases by half a million
if slum children had similar risk as urban areas and by one million if the risk was equal to
rural areas Hence focusing on slum children and controlling for observable characteristics
the population attributable fraction shows that 20ndash37 of slum childrenrsquos stunting risk is
associated with unobserved slum conditions
An important implication of our results is that the health environment variables gener-
ated from standard household surveys are unable to fully capture the differences in health42 These numbers should be taken as suggestive at best and not as causal estimates and are conditional
on correctly specifying the underlying model with the caveats discussed above Furthermore although wedo employ the weights provided in NFHS-3 we only use the subset of states that have slum informationin NFHS-3 and the composition of the population in NFHS-3 may vary from India as a whole Our totalpredicted number of stunted does not match that of for example UNICEF (2013) because the census countfor slums included children aged five and six Scaling our estimate by 57 to get an approximation forunder-fives leads to a total number of 598 million stunted children below age five which is slightly lowerthan the 617 million quoted in the UNICEF report
43 See Levine (2007) on calculation and interpretation of the population attributable fraction
25
environment and fall particularly short for slums Differences in many household charac-
teristics across areas are relatively small and for some characteristics slums even appear
to do best Thus in addition to more surveys that explicitly target a representative sam-
ple of slums with a sufficient number of observations we need better measures of area
characteristicsmdashfirst and foremost in DHS surveys because of their extensive use in the
analysis of child health When trying to understand what exactly makes slums unhealthy
better area measures would allow future research to consider factors such as overcrowding
access to health services sewage system quality and reliability and contamination of water
supply as contributors to poor slum health
Until we have better data on area characteristics our best guess for what is behind the
substantial negative association between living in slums and child health is a combination
of unreliable water supply open sewers and overcrowding This combination results in low
water quality leading to environmental enteric dysfunction and poor health outcomesmdasheven
when other household characteristics suggest that the child should do relatively well This
suggests that policies that emphasize physical infrastructure such as reliability of water
supply would be more cost-effective than those focusing on changing household behavior
and characteristics The perennial problem is of course that the very nature of slums and
the illegality of many dwellings make this difficult (Subbaraman et al 2012) Furthermore
it is important to distinguish between poverty and slum targeting when designing policies
(Bhan and Jana 2013) Both are important but are likely to lead to very different policies
Our results also have broader implications for future research Differences in the number
of ldquomissingrdquo girls across areas are associated with mortality numbers that do not adequately
reflect how health conditions differ and bias downwards the estimated differences in health
among areas Understanding and addressing this selection effect when estimating mortality
and health determinants is an important area for future research This is especially the case
for countries with strong son preferences such as India and China
The selection issues also provide a cautionary note on the use of cross-country data
26
Because of the large number of DHS data sets with their ready availability and similar
variable definitions across countries researchers can now combine data from many countries
for analysis The combined datarsquos large sample size means we can address questions for
which individual country-level samples may be too small Cross-country data however also
make adequately addressing country-specific factors such as son preference more difficult
potentially leading to biased results One example is the prior finding that slums are not
associated with worse child health which we argue comes partly from this type of bias
In conclusion with slums associated with stunting of up to 1 million Indian children and
with the rapid increase in the developing worldrsquos urban population understanding how child
health differs across areasmdashand more generally what determines child health in citiesmdashis
an undertaking with important policy implications and one that will only become more
important over time
27
References
Aizer Anna ldquoThe Gender Wage Gap and Domestic Violencerdquo American Economic Re-
view September 2010 100 (4) 1847ndash59
Alderman Harold Hans Hoogeveen and Mariacristina Rossi ldquoPreschool Nutrition
and Subsequent Schooling Attainment Longitudinal Evidence from Tanzaniardquo Economic
Development and Cultural Change 2009 57 (2) 239ndash260
Basta Samir S ldquoNutrition and health in low income urban areas of the third worldrdquo
Ecology of Food and Nutrition 1977 6 (2) 113ndash124
Bhan Gautam ldquoPlanned Illegalities - Housing and the rsquoFailurersquo of Planning in Delhi
1947-2010rdquo Economic amp Political Weekly June 2013 48 (24) 58ndash70
and Arindam Jana ldquoOf Slums or Povertyrdquo Economic and Political Weekly May 2013
48 (18)
Bocquier Philippe Nyovani Janet Madise and Eliya Msiyaphazi Zulu ldquoIs there
an urban advantage in child survival in sub-saharan Africa Evidence from 18 countries
in the 1990srdquo Demography May 2011 48 (2) 531ndash58
Dye Christopher ldquoHealth and Urban Livingrdquo Science 2008 319 (5864) 766ndash769
Ezeh Alex Oyinlola Oyebode David Satterthwaite Yen-Fu Chen Robert
Ndugwa Jo Sartori Blessing Mberu G J Melendez-Torres Tilahun Haregu
Samuel I Watson Waleska Caiaffa Anthony Capon and Richard J Lilford
ldquoThe history geography and sociology of slums and the health problems of people who
live in slumsrdquo The Lancet 20170328 2017 389 (10068) 547ndash558
Fink Guumlnther Isabel Guumlnther and Kenneth Hill ldquoSlum Residence and Child Health
in Developing Countriesrdquo Demography 2014 51 (4) 1175ndash1197
28
Fotso Jean-Christophe ldquoChild health inequities in developing countries differences
across urban and rural areasrdquo International Journal for Equity in Health 2006 5 (1)
1ndash10
ldquoUrban-rural differentials in child malnutrition Trends and socioeconomic correlates
in sub-Saharan Africardquo Health amp Place 2007 13 (1) 205 ndash 223 Part Special Issue
Environmental Justice Population Health Critical Theory and GIS
Fry Sarah Bill Cousins and Ken Olivola ldquoHealth of children living in urban slums
in Asia and the near east Review of existing literature and datardquo Environmental Health
Project Activity Report 109 US Agency for International Development Washington DC
May 2002
Guumlnther Isabel and Kenneth Harttgen ldquoDeadly Cities Spatial Inequalities in Mor-
tality in sub-Saharan Africardquo Population and Development Review 2012 38 (3) 469ndash486
Gupta Kamla Fred Arnold and H Lhungdim Health and Living Conditions in
Eight Indian Cities National Family Health Survey (NFHS-3) India 2005-06 Mumbai
International Institute for Population Sciences August 2009
Haddad Lawrence Marie T Ruel and James L Garrett ldquoAre Urban Poverty and
Undernutrition Growing Some Newly Assembled Evidencerdquo World Development Novem-
ber 1999 27 (11) 1891 ndash 1904
India Office of the Registrar General and Census Commissioner ldquoPrimary Census
Abstract for Slumrdquo Technical Report New Delhi 2013
International Institute for Population Sciences (IIPS) and Macro International
National Family Health Survey (NFHS-3) 2005ndash06 India Vol 1 Mumbai India IIPS
September 2007
29
James W P T Anna Ferro-Luzzi and J C Waterlow ldquoDefinition of Chronic
Deficiency in Adults - Report of a Working Party of the International Dietary Energy
Consultative Grouprdquo European Journal of Clinical Nutrition 1988 42 (12) 969ndash81
Jorgenson Andrew K and James Rice ldquoUrban Slum Growth and Human Health
A Panel Study of Infant and Child Mortality in Less-Developed Countries 1990ndash2005rdquo
Journal of Poverty 2010 14 (4) 382ndash402
and ldquoUrban Slums and Childrenrsquos Health in Less-Developed Countriesrdquo Journal of
World-Systems Research 2012 XVIII (1) 103ndash116
and Brett Clark ldquoAssessing the Temporal and Regional Differences in the Relation-
ships between Infant and Child Mortality and Urban Slum Prevalence in Less Developed
Countries 1990-2005rdquo Urban Studies 2012 pp 1ndash18
Kennedy Gina Guy Nantel Inge D Brouwer and Frans J Kok ldquoDoes living
in an urban environment confer advantages for childhood nutritional status Analysis
of disparities in nutritional status by wealth and residence in Angola Central African
Republic and Senegalrdquo Public Health Nutrition 2006 9 (2) 187ndash193
Keusch Gerald T Irwin H Rosenberg Donna M Denno Christopher Duggan
Richard L Guerrant James V Lavery Philip I Tarr Honorine D Ward
Robert E Black James P Nataro Edward T Ryan Zulfiqar A Bhutta
Hoosen Coovadia Aldo Lima Balakrishnan Ramakrishna Anita K M Zaidi
Deborah Hay C Burgess and Thomas Brewer ldquoImplications of Acquired Environ-
mental Enteric Dysfunction for Growth and Stunting in Infants and Children Living in
Low- and Middle-Income Countriesrdquo Food and Nutrition Bulletin 2013 34 (3) 357ndash364
Levine Beverly ldquoWhat Does the Population Attributable Fraction Meanrdquo Preventing
Chronic Disease January 2007 4 (1) 1ndash5
30
Lin Ming-Jen Jin-Tan Liu and Nancy Qian ldquoMore Missing Women Fewer Dying
Girls The Impact of Sex-Selective Abortion on Sex at Birth and Relative Female Mortality
in Taiwanrdquo Journal of the European Economic Association August 2014 12 (4) 899ndash926
Maluccio John A John Hoddinott Jere R Behrman Reynaldo Martorell
Agnes R Quisumbing and Aryeh D Stein ldquoThe Impact of Improving Nutrition
During Early Childhood on Education among Guatemalan Adultsrdquo The Economic Jour-
nal 2009 119 (537) 734ndash763
Marx Benjamin Thomas Stoker and Tavneet Suri ldquoThe Economics of Slums in the
Developing Worldrdquo The Journal of Economic Perspectives 2013 27 (4) 187ndash210
Menon Purnima Marie T Ruel and Saul S Morris ldquoSocio-Economic Differen-
tials in Child Stunting are Consistently Larger in Urban than in Rural Areasrdquo Food and
Nutrition Bulletin 2000 21 (3) 282ndash289
Montgomery Mark R ldquoUrban poverty and health in developing countriesrdquo Population
Bulletin 2009 64 (2)
and Paul C Hewett ldquoUrban poverty and health in developing countries household
and neighborhood effectsrdquo Demography August 2005 42 (3) 397ndash425
Moulton Brent R ldquoAn Illustration of a Pitfall in Estimating the Effects of Aggregate
Variables on Micro Unitsrdquo Review of Economics and Statistics 1990 72 (4) 334ndash338
Mullick Mohammad Sayadul Islam and Robert Goodman ldquoThe prevalence of psy-
chiatric disorders among 5ndash10 year olds in rural urban and slum areas in Bangladeshrdquo
Social Psychiatry and Psychiatric Epidemiology 2005 40 (8) 663ndash671
Murthy Sharmila L ldquoLand security and the challenges of realizing the human right to
water and sanitation in the slums of Mumbai Indiardquo Health and Human Rights 2012 14
(2) 61ndash73
31
Paciorek Christopher J Gretchen A Stevens Mariel M Finucane and Majid
Ezzati ldquoChildrenrsquos height and weight in rural and urban populations in low-income and
middle-income countries a systematic analysis of population-representative datardquo The
Lancet Global Health April 2013 1 (5) e300ndashe309
Pitt Mark M ldquoEstimating the Determinants of Child Health when Fertility and Mortality
are Selectiverdquo Journal of Human Resources 1997 32 (1) 129ndash158
Poumlrtner Claus C ldquoSex-selective Abortions Fertility and Birth Spacingrdquo Working Paper
Seattle University Seattle WA November 2016
Pradhan Jalandhar and Perianayagam Arokiasamy ldquoSocio-economic inequalities in
child survival in India A decomposition analysisrdquo Health Policy 2010 98 (2ndash3) 114 ndash
120
Rice James and Julie Steinkopf Rice ldquoThe Concentration of Disadvantage and the
Rise of an Urban Penalty Urban Slum Prevalence and the Social Production of Health
Inequalities in the Developing Countriesrdquo International Journal of Health Services 2009
39 (4) 749ndash770
Rosenzweig Mark R and Oded Stark ldquoConsumption Smoothing Migration and Mar-
riage Evidence from Rural Indiardquo Journal of Political Economy 1989 97 (4) 905ndash926
Saikia Nandita Abhishek Singh Domantas Jasilionis and Faujdar Ram ldquoEx-
plaining the rural-urban gap in infant mortality in Indiardquo Demographic Research 2013
29 (18) 473ndash506
Sastry Narayan ldquoWhat explains rural-urban differentials in child mortality in Brazilrdquo
Social Science amp Medicine 1997 44 (7) 989 ndash 1002
ldquoUrbanization development and under-five mortality differentials by place of residence
in Satildeo Paulo Brazil 1970-1991rdquo Demographic Research 2004 S2 355ndash386
32
Satapathy Biraja Kabi ldquoSafe Drinking Water in Slums From Water Coverage to Water
Qualityrdquo Economic and Political Weekly June 2014 XLIX (24) 50ndash55
Sen Amartya ldquoMore Than 100 Million Women Are Missingrdquo New York Review of Books
1990 37 (20)
Smith Lisa C Marie T Ruel and Aida Ndiaye ldquoWhy Is Child Malnutrition Lower
in Urban Than in Rural Areas Evidence from 36 Developing Countriesrdquo World Devel-
opment 2005 33 (8) 1285 ndash 1305
Spears Dean ldquoHow Much International Variation in Child Height Can Sanitation Ex-
plainrdquo Policy Research Working Paper 6351 World Bank Washington DC February
2013
ldquoIncreasing average exposure to open defecation in India 2001-2011rdquo Working Paper 21
RICE Institute July 2014
Subbaraman Ramnath Jennifer Orsquobrien Tejal Shitole Shrutika Shitole Kiran
Sawant David E Bloom and Anita Patil-Deshmukh ldquoOff the map the health and
social implications of being a non-notified slum in Indiardquo Environment and Urbanization
2012 24 (2) 643ndash663
Thomas Duncan and John Strauss ldquoHealth and Wages Evidence on Men and Women
in Urban Brazilrdquo Journal of Econometrics 1997 77 (1) 159ndash185
Timaeligus Ian M and Louisiana Lush ldquoIntra-urban differentials in child healthrdquo Health
Transition Review 1995 5 (2) 163ndash190
UN-Habitat State of the Worldrsquos Cities 20122013 Prosperity of Cities State of the
Worldrsquos Cities New York NY Routledge 2013
UNICEF Improving child nutrition The achievable imperative for global progress New
York UNICEF 2013
33
United Nations World Urbanization Prospects The 2014 Revision number
STESASERA322 United Nations Department of Economic and Social Affairs Pop-
ulation Division 2015
van de Poel Ellen Owen OrsquoDonnell and Eddy van Doorslaer ldquoAre urban children
really healthier Evidence from 47 developing countriesrdquo Social Science amp Medicine 2007
65 (10) 1986 ndash 2003
and ldquoWhat Explains the Rural-Urban Gap in Infant Mortality Household or
Community Characteristicsrdquo Demography 2009 46 (4) 827ndash850
34
Tables
Table 1 Descriptive Statistics
Variable Rural Slum Urban Total t testsa
Dependent VariablesHeight-for-age Z-score minus199 minus159 minus150 minus178 ABC
(167) (163) (169) (168)Ratio with height-for-age Z-score lt -2b 051 040 039 046 AB
(050) (049) (049) (050)Weight-for-height Z-score minus104 minus081 minus079 minus093 AB
(129) (135) (138) (133)Ratio with weight-for-height Z-score lt -2b 020 017 016 019 AB
(040) (038) (037) (039)Percent that have diedc 828 532 506 682 NAChild CharacteristicsGirl 049 046 048 048 AAge of child (months) 300 305 306 303
(170) (168) (167) (169)Parental Education and Motherrsquos HeightMotherrsquos education (years) 33 67 73 51 ABC
(43) (50) (56) (52)Fatherrsquos education (years) 60 79 86 71 ABC
(50) (48) (54) (52)Motherrsquos height (cm) 1512 1521 1524 1517 ABC
(56) (57) (58) (57)Household Religion and CasteHindu 087 073 076 081 ABCMuslim 013 027 024 019 ABCScheduled caste 023 020 017 021 ABCScheduled tribe 010 004 002 006 ABCOther backward classes 044 034 040 041 ABCNot a scheduled castetribe or backward class 023 042 040 031 ABHousehold Wealth StatusWealth category 1 (poorest) 033 001 004 019 ABCWealth category 2 027 004 007 017 ABCWealth category 3 022 017 015 019 ABWealth category 4 014 040 027 022 ABCWealth category 5 (richest) 004 038 047 022 ABCArea Wealth DistributionRatio in wealth category 1 (poorest) 034 001 003 019 ABCRatio in wealth category 2 029 005 007 018 ABCRatio in wealth category 3 021 017 015 018 ABCRatio in wealth category 4 012 040 028 022 ABCRatio in wealth category 5 (richest) 004 038 047 022 ABCArea Health EnvironmentAverage time to get water and return (minutes) 1162 673 629 920 ABRatio with improved source of drinking water 087 096 096 091 ABRatio sharing toilet with 10 plus households 000 019 006 005 ABCRatio that has improved toilet 017 074 075 044 ABCAverage number of people per room 366 368 333 357 BCRatio with improved cooking fuel 007 078 069 038 ABC
Observations 7993 2822 4246 15061Notes Standard deviations in parentheses (not shown for categorical variables except stunting and wasting) Allarea variables are calculated as the mean for the householdrsquos PSU excluding the household itself There is anaverage of 136 births per woman within the five years prior to the survey date with a minimum of one and amaximum of foura T tests for differences between areas assuming unequal variance A indicates that there is a statistically significantdifference at the 5 percent level between rural and slum areas B indicates that there is a statistically significantdifference at the 5 percent level between rural and urban areas and C indicates that there is a statistically significantdifference at the 5 percent level between slum and urban areasb The ratio of stunted and wasted children is presented for information only and not used as dependent variablesc Mortality calculation is based on all births that occurred in the five years prior to the survey The sample sizesare 8717 in rural areas 2986 in slums and 4476 in urban non-slums for a total of 16179 births The outcomeused for Cox mortality regressions is length of life rather than dummy for died
35
Table 2 Covariates of Child Health Height-for-Age Z-Score
(1) (2) (3) (4) (5) (6) (7)
Child age dummiesa Yes Yes Yes Yes Yes Yes YesState and survey month fixed effects No Yes Yes Yes Yes Yes YesParental education and motherrsquos heightb No Yes Yes Yes Yes No YesHousehold religion and castec No Yes Yes Yes Yes Yes YesHousehold wealth statusd No No Yes No No Yes YesArea wealth distributione No No No Yes No Yes YesArea health environmentf No No No No Yes Yes Yes
All children (n=15061)Slum 038lowastlowastlowast 007 minus012lowastlowast minus015lowast minus022lowastlowast minus026lowastlowast minus022lowastlowast
(006) (006) (006) (008) (011) (011) (011)Urban 043lowastlowastlowast 014lowastlowastlowast minus003 minus008 minus008 minus013lowast minus010
(006) (004) (005) (007) (007) (007) (007)Girl 001 001 001 001 001 001 001
(003) (003) (003) (003) (003) (003) (003)
R2 010 020 021 020 020 018 021Adj R2 010 020 021 020 020 018 021Wald test against model (1) (2) (2) (2) (7) (2)F-statistics 5003 2369 788 328 3355 744Degrees of freedom (151515) (41515) (41515) (91515) (111515) (171515)P-value 000 000 000 000 000 000
Boys (n=7858)Slum 039lowastlowastlowast 012 minus009 minus010 minus019 minus025lowast minus019
(008) (008) (009) (011) (013) (013) (013)Urban 041lowastlowastlowast 013lowastlowast minus006 minus010 minus011 minus017lowast minus013
(006) (005) (006) (009) (009) (009) (009)
R2 009 020 021 021 021 018 021Adj R2 009 020 021 020 020 017 021Wald test against model (1) (2) (2) (2) (7) (2)F-statistics 3722 1456 563 231 2116 460Degrees of freedom (151443) (41443) (41443) (91443) (111443) (171443)P-value 000 000 000 001 000 000
Girls (n=7203)Slum 037lowastlowastlowast 002 minus014 minus019lowast minus024lowast minus027lowast minus024lowast
(007) (008) (009) (011) (014) (014) (014)Urban 045lowastlowastlowast 016lowastlowastlowast 001 minus005 minus004 minus009 minus006
(007) (006) (007) (009) (009) (009) (009)
R2 011 021 021 021 021 019 022Adj R2 011 020 021 020 020 019 021Wald test against model (1) (2) (2) (2) (7) (2)F-statistics 2188 1447 442 271 1538 500Degrees of freedom (151430) (41430) (41430) (91430) (111430) (171430)P-value 000 000 000 000 000 000
Notes sign at 10 sign at 5 sign at 1 Weighted OLS with robust standard errors clustered at PSU level in parenthesesa Age dummies for 4-7 8-11 12-17 18-23 24-35 36-47 and 48-59 months old with 0-3 as the excluded categoryb Education dummies for mother and father The dummies are for 1-4 years 5-7 8-9 10-11 and 12 plus years of educationc Religion dummy for Muslim with Hindu the excluded category Caste dummies for each of scheduled caste scheduled tribe and other backward classwith none of the above the excluded categoryd Wealth dummies for the household being in wealth category 2 3 4 and 5 respectivelye Area wealth is the percentage of households in wealth categories 2 through 5 calculated excluding the household itselff Area health environment variables include water access captured by the average time to fetch water and whether an improved source of drinking wateris available access to improved cooking fuel sharing toilet with ten or more households access to improved toilet and the average number of people perroom Each calculated as the average in PSU excluding the household itself
36
Table 3 Covariates of Child Health Mortality
(1) (2) (3) (4) (5) (6) (7)
State and survey month fixed effects No Yes Yes Yes Yes Yes YesParental education and motherrsquos heighta No Yes Yes Yes Yes No YesHousehold religion and casteb No Yes Yes Yes Yes Yes YesHousehold wealth statusc No No Yes No No Yes YesArea wealth distributiond No No No Yes No Yes YesArea health environmente No No No No Yes Yes Yes
All children (n=16179)Slum 057lowastlowastlowast 083 093 083 067 070 067
(009) (015) (017) (017) (018) (019) (018)Urban 060lowastlowastlowast 077lowastlowast 084 080lowast 072lowastlowast 075lowastlowast 073lowastlowast
(006) (008) (009) (011) (010) (010) (010)Girl 112 111 111 111 111 111 111
(008) (008) (008) (008) (008) (008) (008)
Boys (n=8422)Slum 070lowastlowast 094 108 095 124 130 125
(013) (019) (023) (023) (034) (035) (034)Urban 068lowastlowastlowast 085 095 088 089 092 090
(008) (011) (013) (016) (016) (016) (016)
Girls (n=7757)Slum 045lowastlowastlowast 068 075 069 030lowastlowastlowast 032lowastlowastlowast 031lowastlowastlowast
(011) (018) (020) (021) (013) (013) (013)Urban 052lowastlowastlowast 070lowastlowast 074lowast 071lowast 054lowastlowastlowast 056lowastlowastlowast 055lowastlowastlowast
(007) (010) (011) (014) (012) (012) (012)
Notes sign at 10 sign at 5 sign at 1 Weighted Cox regresions with robust standard errors clustered at PSU level in parenthesesCoefficients presented are hazards ratios a coefficient less than 1 indicates that there is a lower risk of death compared to the reference groupwhereas a coefficient greater than 1 indicates that there is a higher risk than the reference groupa Education dummies for mother and father The dummies are for 1-4 years 5-7 8-9 10-11 and 12 plus years of educationb Religion dummy for Muslim with Hindu the excluded category Caste dummies for each of scheduled caste scheduled tribe and other backwardclass with none of the above the excluded categoryc Wealth dummies for the household being in wealth category 2 3 4 and 5 respectivelyd Area wealth is the percentage of households in wealth categories 2 through 5 calculated excluding the household itselfe Area health environment variables include water access captured by the average time to fetch water and whether an improved source of drinkingwater is available access to improved cooking fuel sharing toilet with ten or more households access to improved toilet and the average numberof people per room Each calculated as the average in PSU excluding the household itself
37
Table 4 Predicted Stunting by Area
Percent Stunteda India 2011b
Pooled Girls Boys (millions)
Rural 570 569 567 692Urban 336 322 350 118Slum 334 344 332 27
if urban 267 236 293 22if rural 211 213 232 17
Notes Predictions are based on Model (7) presented in Table 2 for height-for-age Z-score using the sample described above These predictions shouldonly be taken as suggested valuesa All results use weighting provided in NFHS-3b Calculated using predicted percent stunted and 2011 census informationon number of children by area According to the 2011 Census there was121285762 rural children aged 0-6 35109645 non-slum urban childrenand 8082743 slum children for a total child population of 164478150This corresponds to 49 percent of children living in slums 214 percent inurban non-slum and 737 percent in rural areas
38
- Introduction
- Data and Estimation Strategy
-
- Estimation Strategy
- Variables and Descriptive Statistics
-
- Results
-
- Composition Effects and Height-for-Age
- The Role of Mortality Selection
- The Role of Son Preference Selection
- How Sensitive are Results to Slum Definition
- Other Selection or Specification Issues
-
- Discussion
- Conclusion
- References
-
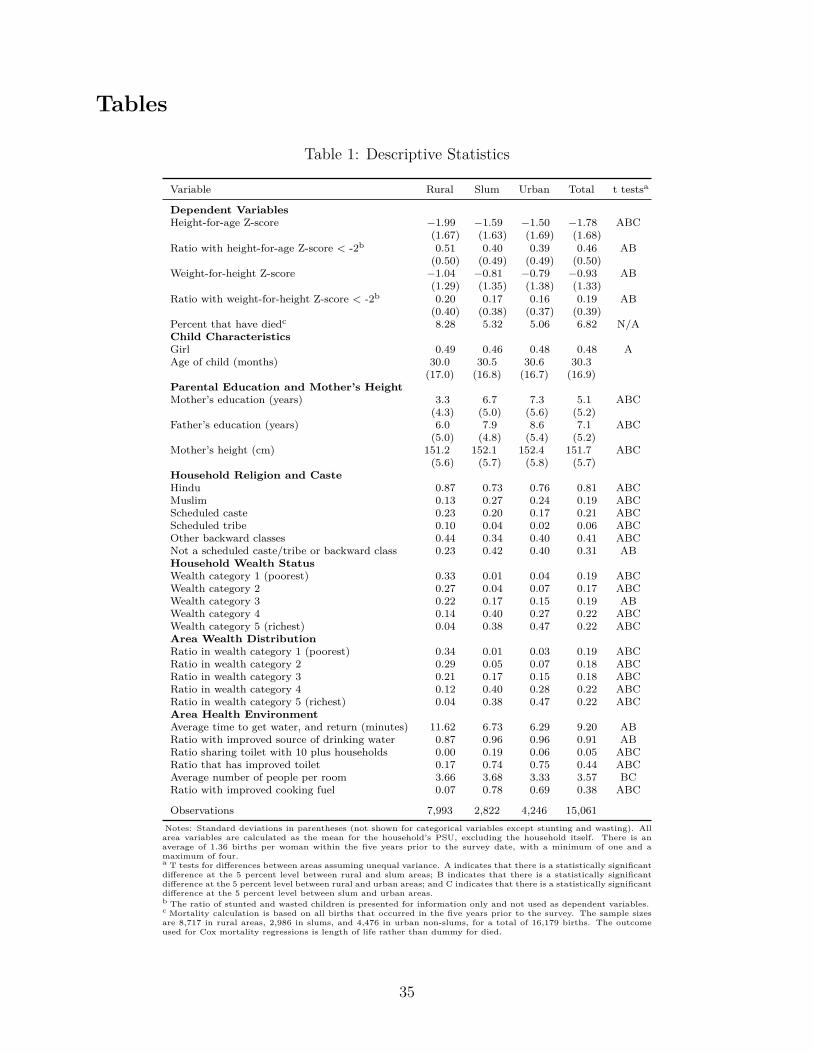
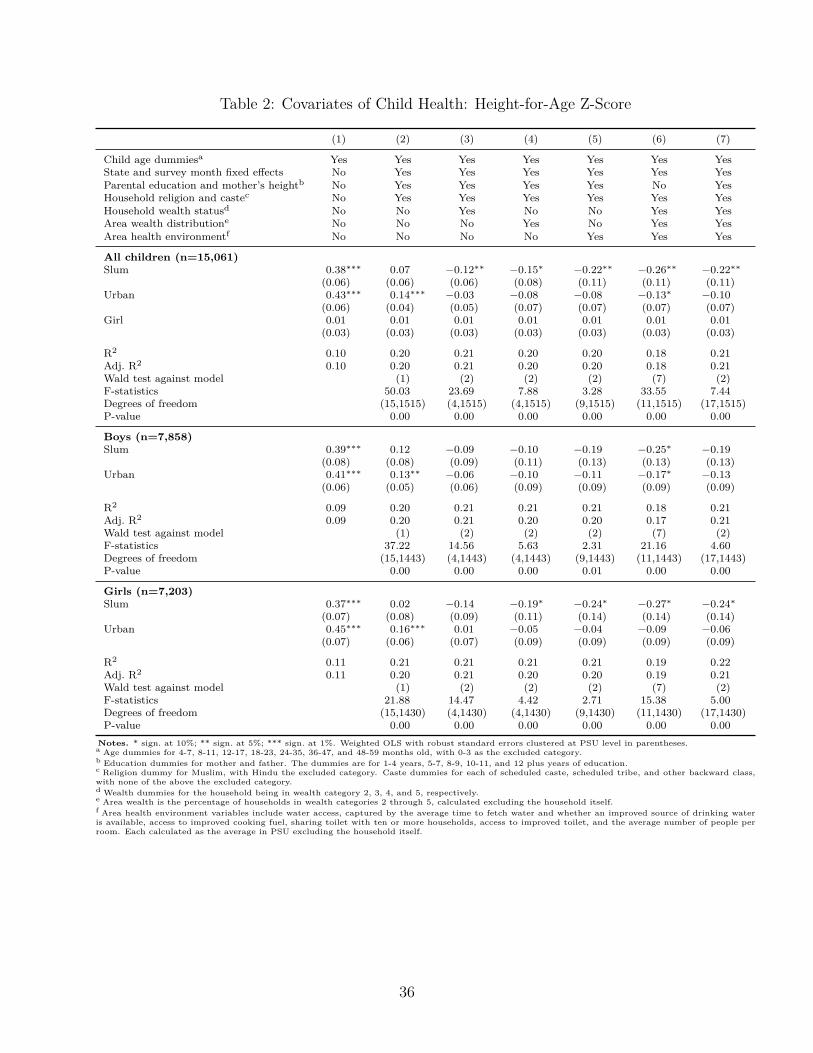
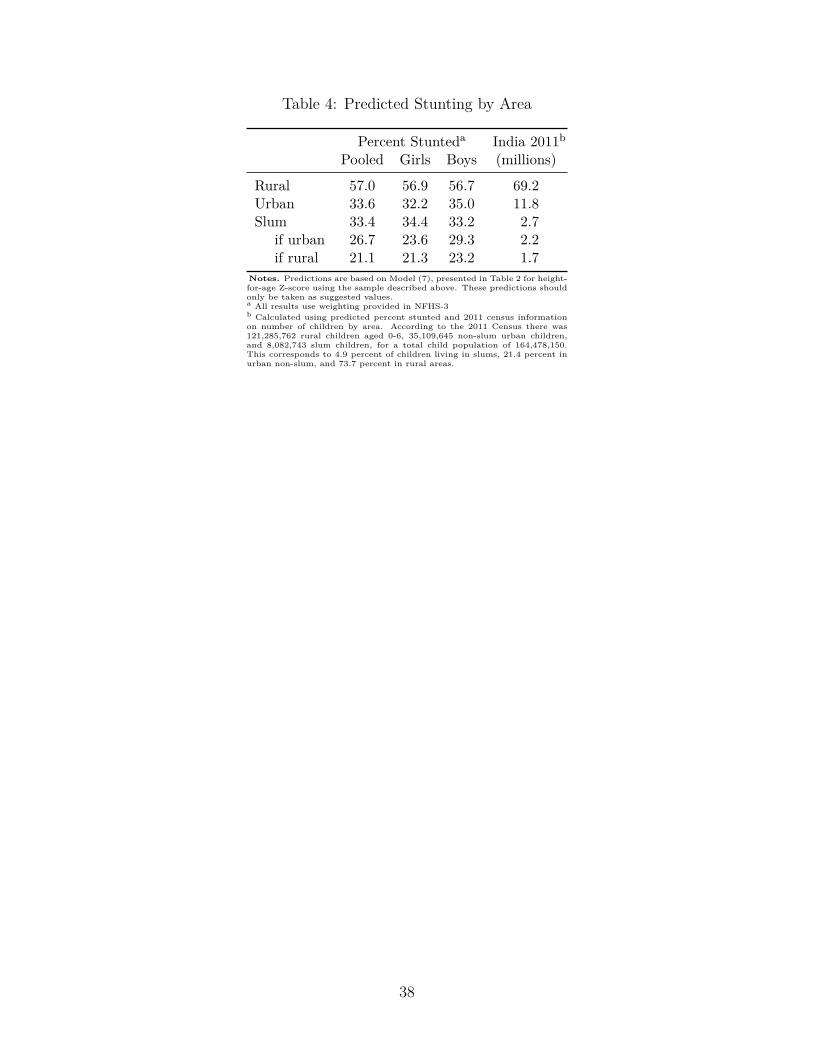