differences in the signaling pathways of a1a- and a1b ... · differences in the signaling pathways...
TRANSCRIPT
Differences in the Signaling Pathways of a1A- and a1B-Adrenoceptors Are Related to Different EndosomalTargetingVanessa Segura1, Miguel Perez-Aso1, Fermı Monto1, Elena Carceller1, Marıa Antonia Noguera1,
John Pediani2,3, Graeme Milligan2, Ian Christie McGrath3, Pilar D’Ocon1*
1 Departamento de Farmacologıa, Facultad de Farmacia, Universitat de Valencia, Valencia, Spain, 2 Molecular Pharmacology Group, Institute of Molecular, Cell and
Systems Biology, College of Medical, Veterinary and Life Sciences. University of Glasgow, Glasgow, United Kingdom, 3 Autonomic Physiology Unit, School of Life Sciences,
College of Medical, Veterinary and Life Sciences, University of Glasgow, Glasgow, United Kingdom
Abstract
Aims: To compare the constitutive and agonist-dependent endosomal trafficking of a1A- and a1B-adrenoceptors (ARs) andto establish if the internalization pattern determines the signaling pathways of each subtype.
Methods: Using CypHer5 technology and VSV-G epitope tagged a1A- and a1B-ARs stably and transiently expressed in HEK293 cells, we analyzed by confocal microscopy the constitutive and agonist-induced internalization of each subtype, and thetemporal relationship between agonist induced internalization and the increase in intracellular calcium (determined byFLUO-3 flouorescence), or the phosphorylation of ERK1/2 and p38 MAP kinases (determined by Western blot).
Results and Conclusions: Constitutive as well as agonist-induced trafficking of a1A and a1B ARs maintain two differentendosomal pools of receptors: one located close to the plasma membrane and the other deeper into the cytosol. Eachsubtype exhibited specific characteristics of internalization and distribution between these pools that determines theirsignaling pathways: a1A-ARs, when located in the plasma membrane, signal through calcium and ERK1/2 pathways but,when translocated to deeper endosomes, through a mechanism sensitive to b-arrestin and concanavalin A, continuesignaling through ERK1/2 and also activate the p38 pathway. a1B-ARs signal through calcium and ERK1/2 only when locatedin the membrane and the signals disappear after endocytosis and by disruption of the membrane lipid rafts by methyl-b-cyclodextrin
Citation: Segura V, Perez-Aso M, Monto F, Carceller E, Noguera MA, et al. (2013) Differences in the Signaling Pathways of a1A- and a1B-Adrenoceptors Are Relatedto Different Endosomal Targeting. PLoS ONE 8(5): e64996. doi:10.1371/journal.pone.0064996
Editor: James Porter, University of North Dakota, United States of America
Received September 18, 2012; Accepted April 20, 2013; Published May 24, 2013
Copyright: � 2013 Segura et al. This is an open-access article distributed under the terms of the Creative Commons Attribution License, which permitsunrestricted use, distribution, and reproduction in any medium, provided the original author and source are credited.
Funding: This study has been supported by research grants from the Instituto de Salud Carlos III, Fondo de Investigaciones Sanitarias (FIS PI070509); GeneralitatValenciana (GVACOMP2009/261) and Universitat de Valencia (UV-INV-AE11-42176). Vanessa Segura and MiguelSpanish Ministry of Education and Science. The funders had no role in study design, data collection and analysis, decision to publish, or preparation of themanuscript.
Competing Interests: The authors have declared that no competing interests exist.
* E-mail: [email protected]
Introduction
There is evidence that for the a1-ARs the constitutive and
agonist-driven cellular internalization differs between a1A- and
a1B- subtypes. This could have important implications for the
different physiological roles of these subtypes and for the
therapeutic use of selective antagonists of this receptor sub-family.
However, there are contradictions in what these differences are
between studies conducted using different techniques. Since this
could be important for the physiology of the receptors and for the
pharmacology and therapeutic use of subtype-selective antagonist
ligand drugs (a1- blockers) in the cardiovascular and urogenital
systems, we have taken a new technical approach to the problem
in an attempt to resolve this controversy.
a1-Adrenoceptors (a1-ARs) are heptahelical transmembrane
proteins that belong to the G protein-coupled receptor (GPCR)
superfamily [1]. Upon agonist binding, all three a1-AR couple to
the Gq/11 protein [2], resulting in phosphatidylinositol 4,5-
biphosphate hydrolysis via phospholipase Cb activation; resultant
second messengers include inositol 1,4,5-triphosphate and diacyl-
glycerol, which mobilize intracellular calcium and activate protein
kinase C, respectively [3,4,5]. Many lines of evidence suggest that
activation of a1-ARs also induce phosphorylation of mitogen-
activated protein kinases (MAPKs) as p38 and extracellular signal-
regulated kinase (ERK) [6,7,8]. The G-protein mediated signaling
of a1-ARs requires that receptors, Gq/11 proteins and phospho-
lipase C are located in the plasma membrane. Termination of this
pathway occurs by desensitization and endocytosis of the GPCRs,
which involves phosphorylation of the activated receptor by G-
protein-coupled Receptor Kinases (GRKs) and second-messenger-
dependent protein kinases PKA and PKC [9,10], and subsequent
recruitment of the multifunctional adapter protein b-arrestin.
It has long been known that b-arrestin prevents G protein
signaling by physically uncoupling the interaction between a
PLOS ONE | www.plosone.org 1 May 2013 | Volume 8 | Issue 5 | e64996
Perez-Aso received a fellowship from the´
GPCR and its associated G protein, and initiates clathrin-
mediated internalization, facilitating the formation of the clathrin
coated pits required for receptor endocytosis. Following endocy-
tosis, the receptors traffic through divergent endosomal pathways
lead to different fates. Some are resensitized by dephosphorylation,
and recycled back to the cell surface. Others undergo down-
regulation by being targeted to lysosomes where they are
degraded. Some GPCRs remain intact and continue to signal,
or initiate new signaling pathways independent of arrestins [11].
The best studied example of an arrestin-activated signaling
pathway is the ERK cascade. Recent studies have shown that
adrenoceptors can initiate ERK signaling by both G-protein- and
b-arrestin-dependent processes [12,13]. b-arrestins function as
membrane-tethered scaffolds capable of recruiting elements of the
MAPK pathways to membranes of endosomes, thus facilitating
ERK activation. Furthermore, by anchoring activated ERK to
endosomes, b-arrestins might prevent ERK translocation to the
nucleus, thus favoring cytoplasmic ERK signaling
[14,15,16,17,18]. Interestingly, the time course and molecular
consequences of activating ERK signaling through G-protein
mediated pathways versus b-arrestin mediated pathways are
considerably different [13].
A few studies have investigated the internalization properties of
the a1-AR subtypes with divergent conclusions. Following agonist
stimulation, a1B-AR is rapidly desensitized by GRKs and its
clathrin-mediated internalization involves b-arrestin interaction
[19,20,21]. This subtype undergoes constitutive internalization
according to Stanasila et al. [22] but not according to Morris et al.
[23]. The most intriguing results have been observed with the a1A-
AR. This subtype has been observed in lipid rafts under basal
conditions [24,25] and, according to some authors, undergoes
constitutive and phenylephrine (PHE)-mediated internalization via
clathrin-coated vesicles [23,26,27]. In contrast, other authors [22]
did not find constitutive internalization for this subtype possibly
due to differences in the expression system (stable vs transient), the
receptor constructs (GFP-tagged vs HA-tagged) or the methods
used to measure endocytosis (fluorescent images techniques vs
biotinylation experiments).
The aim of the present work was to explore the constitutive and
agonist-dependent endosomal trafficking of a1A- and a1B-ARs,
using CypHer5 technology [28,29] and VSV-G epitope tagged
receptors stably and transiently expressed in HEK 293 cells. In
order to establish if the internalization pattern determines the
signaling pathways and explains differences in the functional role
of each subtype, we also analyzed the temporal relationship
between internalization and the increase in intracellular calcium, a
signal directly related to the interaction of ARs with the G-protein
in the membrane, as well as intracellular signals not necessarily
dependent on G proteins, such as activation of MAPKs (ERK1/2
and p38).
Experimental Procedures
1. Multiple Fluorescent Labeling of Recycling and LateEndocytic Vesicles in unstimulated Rat-1 fibroblasts
Rat-1 fibroblasts, (R-1Fs), stably expressing the human a1A or
a1B-AR, grown on sterile coverglasses were rinsed with PBS and
then exposed at room temperature to PBS containing 10 nM
QAPB and either the recycling endosomal marker transferrin,
(Tfn-)-Alexa Fluor 546 (20 mg/ml) or the late endosomal/lysosomal
marker Lysotracker Red DND-99 (150 nM) for 15 and 70 min,
respectively. At the end of each labeling period, cells were rinsed
with PBS supplemented only with QAPB (10 nM). Approximately
10 min before image acquisition, cells were exposed to PBS
containing 10 nM QAPB plus the nuclear DNA-binding dye
Hoechst 33342 (10 mg/ml; 10-min incubation at room tempera-
ture) to stain cell nuclei. Each coverglass was then washed and
bathed in QAPB containing PBS before being imaged. The dyes
Hoechst 33342, QAPB, transferrin, (Tfn), Tfn-Alexa Fluor546, and
Lysotracker Red were sequentially excited using the appropriate
fluorescence filter sets to prevent bleed through, and the resultant
images were overlaid using MetaMorph software (version 7.7.7,
Molecular Devices, Sunnydale, CA). 3D visualisation of the
colocalisation of QAPB ligand-human a1a or a1b-AR complexes
with Lysotracker Red was achieved by using a Nikon TE2000-E
inverted microscope equipped with a z-axis linear encoded stepper
motor. Each dye was sequentially excited, and a z-series of images
was acquired at 0.22-mm steps to produce individual z-stacks. The
z-stack images were then merged and deconvoluted using an
iterative and constrained algorithm (Autodeblur software, version
9.3.6; Autoquant Imaging, Media Cybernetics, Inc., Silver
Spring,). A 3D x-z maximum projection image was constructed
using Autovisualise software (Autoquant Imaging, Media Cyber-
netics, Inc., Silver Spring, MD).
For the analysis of QAPB-labeled human a1A or a1B -AR, with
Tfn-Alexa Fluor546 or Lysotracker Red, a region of no
fluorescence, (black area), adjacent to the cell was used to
determine the average background level of autofluorescence
average in each channel image acquired. This background
autofluorescence amount was then subtracted from each pixel in
each channel image collected. Pearson correlation coefficients that
described the degree by which QAPB and Lysotracker Red
fluorescence varied from a perfect correlation overlap value of
1.00 were measured by comparing the amounts of fluorescence
measured in each matched pixel of the two different channel
images acquired.
The degree of partial colocalisation detected when QAPB-
labeled human a1A or a1B-AR fused with Tfn-Alexa Fluor546
labeled recycling endosomes was quantified from a rectangular
region of interest (ROI) drawn and superimposed on each channel
image in exactly the same x-y position. Using the Metamorph
‘‘correlation plot’’ module, correlation coefficients were quantified
that described the degree by which QAPB and Tfn-Alexa
Fluor546 fluorescence at each pixel within the rectangular region
varied from a perfect correlation of 1.00.
2. Construction of the VSV-G-Tagged a1-AR subtypesVSV-G (YTDIEMNRLGK)epitope tags were introduced im-
mediately upstream of each human a1A-, and a1B-AR. The amino-
terminal primer (59- AAAAAAAGGATCCGCCACCATGTA-
CACCGATATAGAGATGAACAGGCTGGGAAAGGTGTT-
TCTCTCGGGAAATGC-39) or (59-AAAAAAAGCTTC-
CACCA TGTACACTGATATCGAAATGAACCGCCTGGG-
TAAGAATCCCGACCTGGACACCG-39) was used to incorpo-
rate a VSV-G tag, a kozak sequence and a BamHI, HindIII and
HindIII site for a1A-, and a1B-AR, respectively. Depending on the
subtype used as a template, the following carboxyl-terminal
reverse primer was hybridized: a1A-AR, 59-AAAAAAAACTC-
GAGCTAGACTTCCTCCCCGTTC-39 and a1B-AR, 59-
AAAAAGAATTCCTAAAACTGCCCGGGCGC-39, incorpo-
rating a XhoI, EcoRI and EcoRI site downstream of the coding
sequence. Oligonucleotides were purchased from Thermo Elec-
tron corporation (Glasgow, United Kingdom). All the PCR
fragments were subsequently cloned into the plasmid pcDNA3
(Invitrogen, Paisley, Renfrewshire, Scotland, UK) in-frame
ligation. Construct sequences were confirmed by nucleotide
sequencing.
a1-Adrenoceptor Signals and Endosomal Targeting
PLOS ONE | www.plosone.org 2 May 2013 | Volume 8 | Issue 5 | e64996
3. Cell Culture and TransfectionHEK293 cells were grown in Dulbecco’s modified Eagle’s
minimum essential medium (Sigma St Louis MO, USA) supple-
mented with 10% newborn calf serum (Gibco BRL, Gaithersburg,
MD, USA), L-glutamine 2 mM (Gibco BRL, Gaithersburg, MD,
USA), 100 mg/ml streptomycin and 100 units/ml penicillin at
37uC in a humidified atmosphere of 5% CO2. Cells were stably
transfected by electroporation (300 V, 50 ms, 2 mm gap) using a
Multiporator (Eppendorf AG, Hamburg, Germany) After 48h,
cells were selected with G418 400 mg/ml (Sigma, St Louis MO,
USA). All the experiments were performed with around 75% of
confluence. For transient transfection, HEK293 cells were grown
to 50% confluence prior to transfection on poly (L-lysine)-coated
coverslips without using antibiotics. Transient transfection was
performed using Lipofectamine reagent (Invitrogen) according to
the manufacturer’s instructions. A total of 1 mg of pcDNA3
containing the appropriate VSV-G tagged human a1-AR subtype
was used to transfect each coverslip.
Quantitative reverse-transcription polymerase chain reaction
and saturation binding experiments performed as previously
described [30] confirmed the stable or transient expression of
each subtype of VSV-G-tagged or untagged a1-ARs in the
HEK293 cell lines.
4. Real-time imaging of the internalization of the a1-ARsubtypes
HEK293 cells transiently or stably expressing the N-terminal
VSV-G tagged human a1A- and a1B-AR subtypes were plated
onto poly-L-Lysine (Sigma, St Louis MO) coated sterile coverslips
48h before experimentation. Live cells were washed three times
with cold Krebs-Ringer-Hepes buffer (KRH, 120 mM NaCl,
25 mM HEPES, 4.8 mM KCl, 1.2 mM MgSO4 and 1.3 mM
CaCl2 at pH 7.4) at 4uC and were then incubated with CypHer5E
Linked Anti-VSV Antibody (PA45407, GE Healthcare, Amer-
sham International, Buckinghamshire, UK) at 5 mg/ml in KRH
buffer at 4uC for 1 h. After washing with KRH buffer at 4uC,
coverslips were rapidly mounted into a flow chamber bath
(Attofluor, Molecular Probes; Eugene, OR, USA), placed on the
microscope stage in a 95% air and 5% CO2 atmosphere at 37uC.
At this time, cells were exposed to prewarmed KRH buffer or
buffer supplemented either with concanavalin A (ConA, 250 mg/
ml, Sigma St Louis MO, USA) or prazosin (10 mM, Sigma St
Louis MO, USA) for 30 min. After incubation with the
aforementioned solutions, the zero time was set up immediately
before adding phenylephrine (PHE, 100 mM, Sigma St Louis MO,
USA) and the system was set to acquire images at 1 minute and
then at 5 min intervals for 15 min. A set of control experiments
without agonist was performed in the same conditions to analyze
constitutive internalization. A laser-scanning confocal inverted
microscope (LEICA TCS SP2 (DM-IRBE), equipped with a 60x
oil HCX PL APO (1.32 numerical aperture) objective, was used to
acquire images. The excitation wavelength was 633 nm using a
Helium/Neon laser and the emitted fluorescence was detected
with a 650 nm long pass filter. Image processing and analysis were
carried out using MetaMorph, version 6.1r3 (Universal Imaging
Corporation) and the Leica software, v. 2.61. By considering that
all the fluorescence obtained was due to endosomal localization of
receptors, two distinct fluorescence regions were defined in the
same cell: a fraction close to the cytoplasmic side of the plasma
membrane and another fraction achieving the profound cytosolic
regions close to the nuclei. To identify membrane and cytosolic
regions more clearly, light microscopic images were overlapped
with fluorescence images. Internalization kinetic was quantified for
each cell at these two different cellular regions in 8-10 different
cells for each experiment, by measuring the mean intensity of the
fluorescence of two linear segments of 5 mm of length located in
the cytosol, close to the nucleus, and two linear segments of 5 mm
of length located in regions close to the plasma membrane (Figure
S1). To better identify membrane and cytosolic regions, light
microscopic images were overlapped with fluorescence ima-
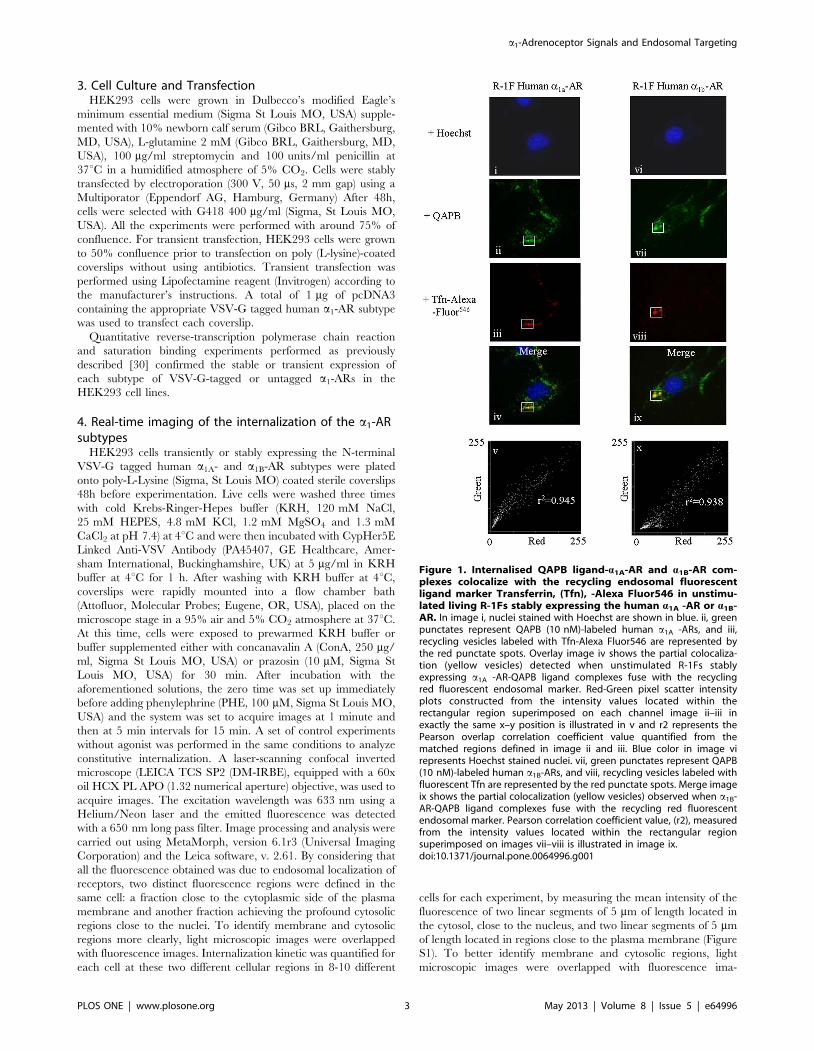
Figure 1. Internalised QAPB ligand-a1A-AR and a1B-AR com-plexes colocalize with the recycling endosomal fluorescentligand marker Transferrin, (Tfn), -Alexa Fluor546 in unstimu-lated living R-1Fs stably expressing the human a1A -AR or a1B-AR. In image i, nuclei stained with Hoechst are shown in blue. ii, greenpunctates represent QAPB (10 nM)-labeled human a1A -ARs, and iii,recycling vesicles labeled with Tfn-Alexa Fluor546 are represented bythe red punctate spots. Overlay image iv shows the partial colocaliza-tion (yellow vesicles) detected when unstimulated R-1Fs stablyexpressing a1A -AR-QAPB ligand complexes fuse with the recyclingred fluorescent endosomal marker. Red-Green pixel scatter intensityplots constructed from the intensity values located within therectangular region superimposed on each channel image ii–iii inexactly the same x–y position is illustrated in v and r2 represents thePearson overlap correlation coefficient value quantified from thematched regions defined in image ii and iii. Blue color in image virepresents Hoechst stained nuclei. vii, green punctates represent QAPB(10 nM)-labeled human a1B-ARs, and viii, recycling vesicles labeled withfluorescent Tfn are represented by the red punctate spots. Merge imageix shows the partial colocalization (yellow vesicles) observed when a1B-AR-QAPB ligand complexes fuse with the recycling red fluorescentendosomal marker. Pearson correlation coefficient value, (r2), measuredfrom the intensity values located within the rectangular regionsuperimposed on images vii–viii is illustrated in image ix.doi:10.1371/journal.pone.0064996.g001
a1-Adrenoceptor Signals and Endosomal Targeting
PLOS ONE | www.plosone.org 3 May 2013 | Volume 8 | Issue 5 | e64996

ges.The mean of these determinations was normalized as Ii/I0,
where I0 is the mean intensity taken at zero time for each
experiment. The data represent more than four independent
experiments.
5. Real-time imaging of calcium signalTo monitor intracellular calcium concentration, HEK293 cells
stably expressing the N-terminal VSV-G tagged or untagged
human a1A- and a1B-AR subtypes were plated onto poly-L-Lysine
coated sterile coverslips 48h before experimentation, washed three
times with cold Krebs-Ringer-Hepes buffer (KRH, 120 mM
NaCl, 25 mM HEPES, 4.8 mM KCl, 1.2 mM MgSO4 and
1.3 mM CaCl2 at pH 7.4) at 4uC and incubated for 2 hours with
the fluorescent calcium chelator FLUO-3-AM (5 mM) (Invitrogen,
Carlsbad CA, USA) in KRH at 5% CO2 and 37uC. Then, cells
were washed once with KRH and mounted into a flow chamber
bath placed on the microscope stage in a 95% air and 5% CO2
atmosphere at 37uC as has been described above. At this time,
cells were exposed to prewarmed KRH buffer or buffer
supplemented with prazosin (10 mM). Following 30 minute
incubation with the aforementioned solutions, the zero time was
set up immediately before adding PHE 100 mM and the system
was set to acquire images at 1minute and then at 5 minute
intervals for 15 min. A 63x oil HCX PL APO (1.32 numerical
aperture) objective, was used to acquire images. The excitation
wavelength was 488 nm using an Argon laser and the emitted
fluorescence was detected with a 500–550 nm band-pass filter. We
performed experiments in parallel with and without PHE in
presence or absence of 10 mM prazosin to determine the
spontaneous changes in the fluorescence due to the experimental
procedure. As a slight but continuous increase in the fluorescence
intensity was observed in the absence of PHE, in order to avoid
non specific fluorescence, the increased calcium signal elicited in
absence of PHE or in the presence of prazosin was subtracted from
the PHE calcium signal.
6. Preparation of Cellular Extracts and ImmunoblottingHEK293 cells were starved for 4h in serum-free medium in
presence or absence of methyl-b-cyclodextrin (mbCD, 10 mM,
Sigma, St Louis MO, USA) for 30 or 60 min and filipin 1 mg/ml,
prazosin 10 mM or 5-methylurapidil 10 mM for 30 min, followed
by stimulation with PHE 100 mM for a 15 min time course at
37uC. After stimulation, cells were washed once with cold PBS and
lysed by rotating 30 min at 4uC with 500 ml of RIPA buffer
(50 mM HEPES, 150 mM NaCl, 10% glycerol, 1.5 mM MgCl2,
0.1% SDS, 1 mM EGTA, 1% triton and 1% sodium deoxycho-
late) containing protease inhibitor cocktail (CompleteH, Roche
Applied Science, Germany) and phosphatase inhibitor cocktail
(PhosSTOPH, Roche Applied Science, Germany) followed by
sonication with a MicrosonTM XL 2000 Ultrasonic Liquid
Processor and storage at -80uC. The protein content was
measured by the Bradford (1976) method (Bio-Rad Hercules
CA, USA). 15 mg of cellular extracts were incubated with SDS-
sample buffer (2% SDS, 60 mM Tris buffer, 5% b-mercaptoeth-
anol, 0.01% bromophenol blue and 10% glycerol) at 40uC during
30 min, separated on 10% SDS-polyacrylamide gels and
transferred to PVDF membranes for immunoblotting. Prior to
antibody incubation, membranes were blocked in phosphate-
buffered saline with 0.1% Tween 20 (PBST) plus 3% BSA
(Albumin from bovine serum, Sigma St Louis MO, USA). Anti
phospho-p42/44 ERK MAPK (Thr202/Thr204), p42/44 ERK
MAPK (Cell Signaling Technology, Beverly, MA), p-p38 Anti-
ACTIVEH p38 pAb, Rabbit, (pTGpY) (Promega Corp., Madison
USA) and p38 (Cell Signaling Technology, Beverly, MA)
antibodies were incubated overnight at 4uC, 1/500 diluted, while
anti actin (Sigma St Louis MO, USA) antibody was used at a 1/
2500 dilution. Membranes were then washed three times with
PBST, incubated with antirabbit IgG horseradish peroxidase-
conjugated secondary antibody (Amersham International, Buck-
Figure 2. Internalised QAPB ligand- a1A-AR and a1B-ARcomplexes colocalize with the late endosomal fluorescentmarker Lysotracker Red DND-99 in living R-1Fs stably express-ing the human a1A-AR or a1B-AR. (A). In image i, nuclei stained withHoechst are shown in blue. ii, green punctates represent QAPB (10 nM)-labeled human a1A -ARs, and iii, acidic late endosomes labeled withLysotracker Red DND-99 for 80 minutes are represented by the redpunctate spots. Overlay image iv shows the extensive colocalization(yellow vesicles) detected when unstimulated R-1Fs stably expressinga1A -AR-QAPB ligand complexes fuse with the late endosomesfluorescently labeled with Lysotracker Red. Linear red-green pixelscatter intensity plots constructed from the intensity values locatedwithin images ii–iii is illustrated in v and r2 represents the Pearsonoverlap correlation coefficient value quantified from each channelimage ii and iii. 3D x-z colocalization maximum projection view ofhuman a1A -AR-QAPB ligand complexes fusing with late/lytic endo-somes is shown in iv (yellow punctates).(B). In image i, nuclei stainedwith Hoechst are shown in blue. ii, green punctates represent QAPB(10 nM)-labeled human a1B-ARs, and iii, late endosomes labeled withLysotracker Red for 80 minutes are illustrated by the red punctatespots. Merge image iv shows the extensive colocalization (yellowvesicles) detected when unstimulated R-1Fs stably expressing a1B-AR-QAPB ligand complexes fuse with the late endosomes fluorescentlylabeled with Lysotracker Red. Linear green-red pixel scatter intensityplots constructed from the intensity values located within images ii–iii isillustrated in v and r2 represents the Pearson overlap correlationcoefficient value quantified from each channel image ii and iii. A 3D x-zcolocalization maximum projection view of human a1B-AR-QAPB ligandcomplexes interacting with late/lytic endosomes is shown in iv (yellowpunctates).doi:10.1371/journal.pone.0064996.g002
a1-Adrenoceptor Signals and Endosomal Targeting
PLOS ONE | www.plosone.org 4 May 2013 | Volume 8 | Issue 5 | e64996
a1-Adrenoceptor Signals and Endosomal Targeting
PLOS ONE | www.plosone.org 5 May 2013 | Volume 8 | Issue 5 | e64996

inghamshire, UK) at 1:2500 (Amersham Biosciences, UK) for 45
min at room temperature and washed extensively with PBST
before chemiluminescent detection was performed using the ECL
Western Blotting Detection Reagents (Amersham International,
Buckinghamshire, UK). The image was captured with the
AutoChemi System (uvp Bioimaging Systems. Cambridge, UK)
and band intensity was measured using LabWorks Image
acquisition and Analysis (uvp Bioimaging Systems. Cambridge,
UK).
7. Statistical AnalysisThe results are presented as the mean 6 S.E.M. for n
independent experiments performed in different days. A statistical
analysis was performed by two-way ANOVA or by the Student’s t
test for unpaired samples (GraphPad Software, Inc. San Diego
CA, USA). Significance was defined as p,0.05.
Results
a1A- and a1B-ARs both locate with early and lateendosomes
A short 15 min exposure to the recycling endosomal marker
transferrin, (Tfn-)-Alexa Fluor 546 produced its colocalization with
the fluorescent ligand QAPB in compartments near to the cell
membrane for both a1A- and a1B-ARs indicating transition of the
receptors through this compartment (Figure 1). Similarly, for both
a1A- and a1B-ARs a more prolonged exposure of 70 min to the late
endosomal/lysosomal marker Lysotracker Red DND-99 indicated
its colocalization with QAPB in a much greater number of
endosomes located throughout the cytoplasm and as deep as the
nuclear membrane (Figure 2). Together this indicates that the
recycling receptors enter the near-membrane endosomal com-
partment and subsequently populate the deeper endosomal
compartments.
Constitutive internalization and intracellular distributionpatterns of a1-ARs are subtype-specific
We analyzed the internalization kinetics of the a1-ARs, as well as
the specific subcellular distribution of each subtype related to its
internalization kinetics. For this purpose, the VSV-G tag was
inserted into the amino terminal sequence of the a1A- and a1B-ARs
that had been stably or transiently transfected in HEK293 cells.
This tag is highly detectable with an anti VSV-G antibody labeled
with the CypHer 5 fluorochrome which is able to monitor the
trafficking of the receptors from the cell surface into acidic
endosomal pathways in live cells [28,29]. This dye is pH-sensitive
and fluorescent only in acidic environments (endosomes), but is non
fluorescent at a neutral pH (cell surface). Compared to most
common methods such as green fluorescent proteins tags [31,32],
this approach has the advantage of avoiding the fluorescent signal of
membrane receptors. Given this particular property, the intracel-
lular fluorescence corresponding to surface VSV-G tagged-receptor
internalization could be assessed by real-time live cell imaging.
Visualizing the Cypher 5 fluorescence in real-time demonstrates
that the a1A and the a1B subtypes spontaneously internalize by
endocytosis when expressed stably (Figure 3) or transiently (Figure
S2) in HEK 293 cells. The experimental procedure needed to
show this constitutive internalization is based on the incubation of
live cells with CypHer 5 for 60 min at 4uC. At this temperature,
the endocytic mechanism is blocked since the endocytosis pathway
has been reported to be temperature-dependent [33], thus only the
surface receptor will be labeled during this period.
After incubation with the CypHer5E linked Anti-VSV antibody
at 4uC for 60 min to label the cell surface receptors, the
fluorochrome was removed and live cells were rapidly mounted in
a chamber bath linked to a confocal microscope. At this time the
lack of a fluorescent signal (Figure S3) indicates that, at 4uC,
endocytic mechanisms are blocked and, therefore, there is a lack of
constitutive internalization [34] in stably transfected cells. Cells
were then exposed to KRH buffer at 37uC for 30 min to allow
equilibration. At this time point, the first image was acquired and
the observed fluorescence (Figure 3) could be attributed to
constitutive internalization of VSV-G-a1A-AR and VSV-G-a1B-
AR. Fluorescence was not observed in non transfected cells (Figure
S3). However the internalized receptor subtypes differed in their
subcellular distribution as shown by the pattern of fluorescence.
VSV-G-a1A-AR exhibited intracellular punctuate fluorescence
distributed mainly in regions near the plasma membrane but with
some of the receptors close to the cell nucleus (Figure 3A). By
contrast VSV-G-a1B-AR was concentrated in clusters more
homogeneously distributed throughout the cytosol. Quantification
of the fluorescence confirmed the existence of two different regions
(near to the plasma membrane and cytosolic) (Figure 3B) which
could be interpreted as two differently located acidic endosomal
pools. Similar results were found in transiently transfected cells
(Figure S2)
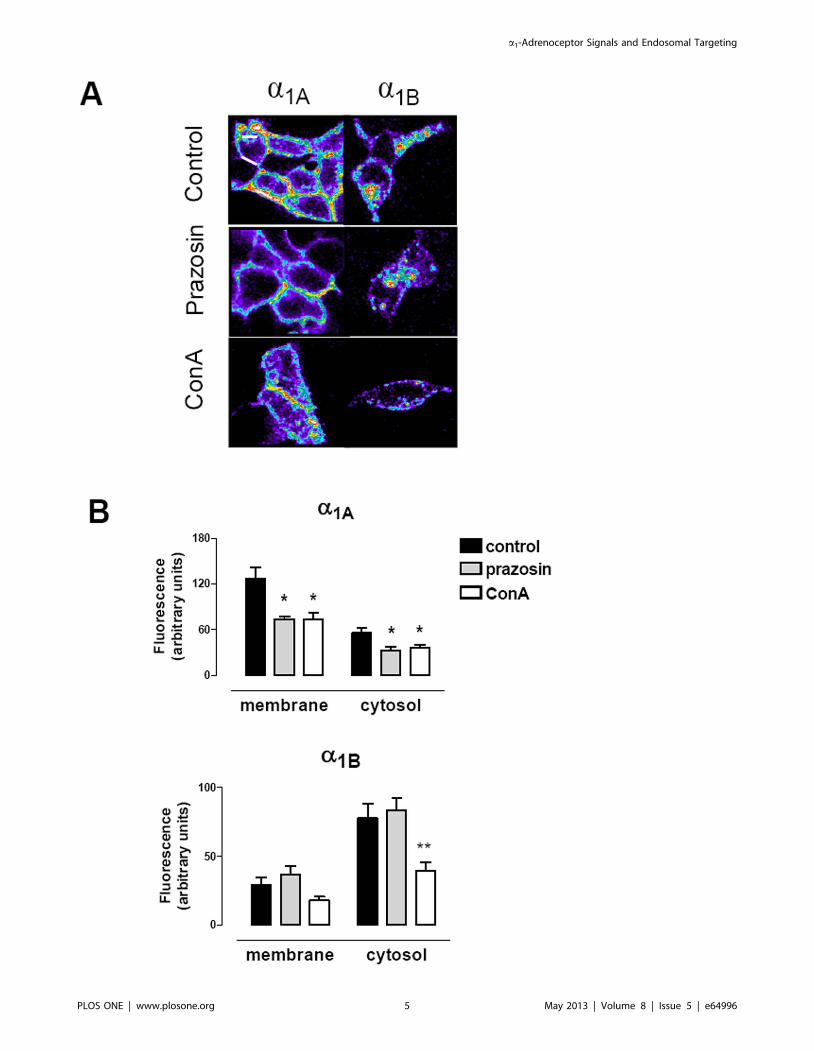
Preincubation with the selective a1-AR antagonist/inverse
agonist ligand prazosin (PZ) resulted in decreased localization of
VSV-G-a1A-AR in both near-membrane and cytosolic regions,
whereas it did not alter significantly the distribution pattern of the
VSV-G-a1B-AR (Figure 3B). The clathrin-mediated endocytosis
blocker concanavalin A (ConA) inhibited constitutive internaliza-
tion of the VSV-G-a1A-AR to the near-membrane and cytosolic
region, and also trafficking to the cytosolic region of the VSV-G-
a1B-AR.
These spatial differences suggest specific patterns of constitutive
endosomal trafficking for each subtype at this time point and were
corroborated with the kinetic analysis of this constitutive
internalization over time (Figure 4), by acquiring images in
presence and absence of PZ or ConA at 35, 40 and 45 minutes
after the equilibration period (30 min).
The constitutive internalization of the a1A subtype continues
until 45 min showing a significant decrease in the fluorescent
intensity in the region near to the plasma membrane together with
an increase in fluorescence in the cytosolic region over time
(Figure 4). At the same time point, the VSV-G-a1B-AR did not
exhibit an increased internalization suggesting that this process has
Figure 3. Quantitative analysis of the constitutive internalization of VSV-G a1A- and VSV-G a1B-ARs. Live HEK293 cells stably transfectedwith each subtype were incubated with CypHer5E Linked anti-VSV-G Antibody at a 5 mg/ml in KRH buffer at 4uC for 1h. After washing with cold KRHBuffer, coverslips were rapidly mounted into a chamber bath, placed on the confocal microscope stage in a 95% air and 5% CO2 atmosphere at 37uC.At this time, HEK293 were then exposed to prewarmed KRH buffer for 30 min at 37uC and the images were acquired. In some experiments 10 mMprazosin or 250 mg/ml concanavalin A (ConA) were added during the incubation time. (A) Confocal images representatives of the increase ofintracellular fluorescence after 30 min of incubation at 37aC for both VSV-G-a1A- and VSV-G-a1B-ARs (B). Changes in intracellular fluorescence intensitywere measured in the cells treated or not with prazosin or ConA. Intracellular fluorescence was quantified in the regions close to the cytoplasmic sideof the plasma membrane, and in the cytosolic region away from nuclei (Figure S1). Data were expressed as arbitrary units of fluorescence andrepresent the mean 6 S.E.M. of at least 4 independent experiments. Student’s t test: *p,0.05 **p,0.01 vs control.doi:10.1371/journal.pone.0064996.g003
a1-Adrenoceptor Signals and Endosomal Targeting
PLOS ONE | www.plosone.org 6 May 2013 | Volume 8 | Issue 5 | e64996
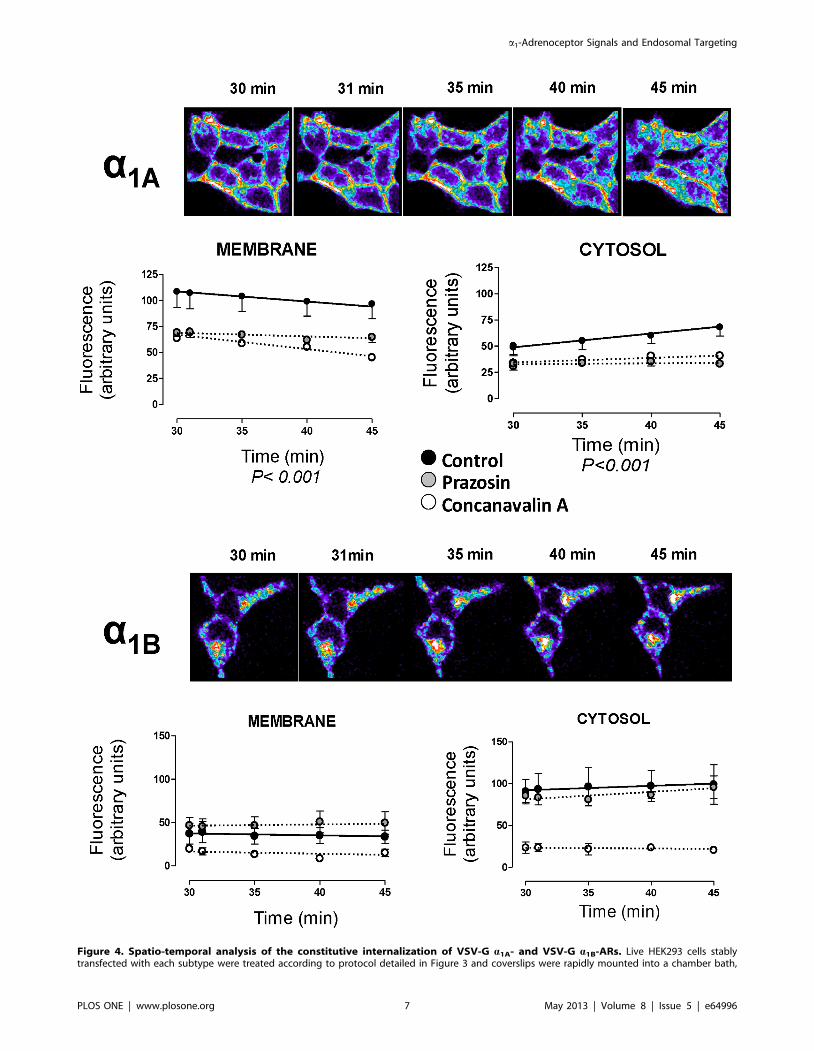
Figure 4. Spatio-temporal analysis of the constitutive internalization of VSV-G a1A- and VSV-G a1B-ARs. Live HEK293 cells stablytransfected with each subtype were treated according to protocol detailed in Figure 3 and coverslips were rapidly mounted into a chamber bath,
a1-Adrenoceptor Signals and Endosomal Targeting
PLOS ONE | www.plosone.org 7 May 2013 | Volume 8 | Issue 5 | e64996
reached its equilibrium during the initial time (30 min) needed to
stabilize the system from 4u to 37uC. Incubation with prazosin or
ConA maintains the differences observed at zero time without any
significant change during the latter 15 min of incubation (from 30
to 45 min, Figure 4).
Agonist-induced internalization to endosomes issubtype-specific and differently modulated by prazosinand ConA
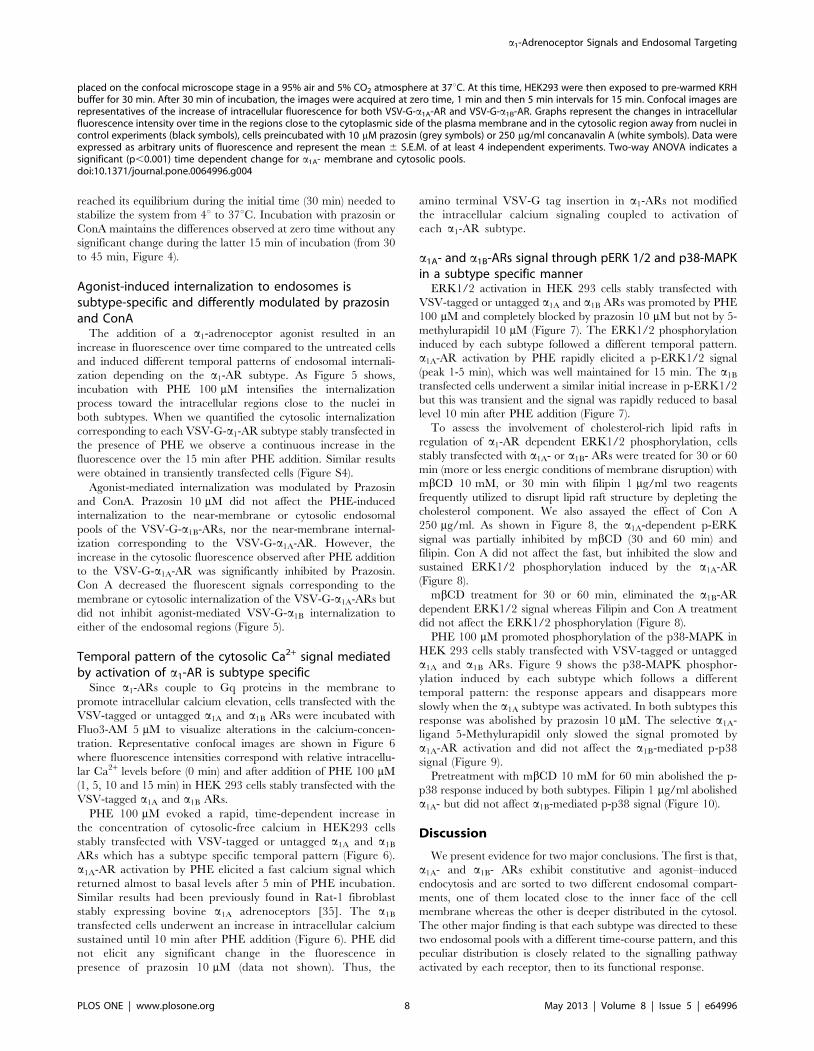
The addition of a a1-adrenoceptor agonist resulted in an
increase in fluorescence over time compared to the untreated cells
and induced different temporal patterns of endosomal internali-
zation depending on the a1-AR subtype. As Figure 5 shows,
incubation with PHE 100 mM intensifies the internalization
process toward the intracellular regions close to the nuclei in
both subtypes. When we quantified the cytosolic internalization
corresponding to each VSV-G-a1-AR subtype stably transfected in
the presence of PHE we observe a continuous increase in the
fluorescence over the 15 min after PHE addition. Similar results
were obtained in transiently transfected cells (Figure S4).
Agonist-mediated internalization was modulated by Prazosin
and ConA. Prazosin 10 mM did not affect the PHE-induced
internalization to the near-membrane or cytosolic endosomal
pools of the VSV-G-a1B-ARs, nor the near-membrane internal-
ization corresponding to the VSV-G-a1A-AR. However, the
increase in the cytosolic fluorescence observed after PHE addition
to the VSV-G-a1A-AR was significantly inhibited by Prazosin.
Con A decreased the fluorescent signals corresponding to the
membrane or cytosolic internalization of the VSV-G-a1A-ARs but
did not inhibit agonist-mediated VSV-G-a1B internalization to
either of the endosomal regions (Figure 5).
Temporal pattern of the cytosolic Ca2+ signal mediatedby activation of a1-AR is subtype specific
Since a1-ARs couple to Gq proteins in the membrane to
promote intracellular calcium elevation, cells transfected with the
VSV-tagged or untagged a1A and a1B ARs were incubated with
Fluo3-AM 5 mM to visualize alterations in the calcium-concen-
tration. Representative confocal images are shown in Figure 6
where fluorescence intensities correspond with relative intracellu-
lar Ca2+ levels before (0 min) and after addition of PHE 100 mM
(1, 5, 10 and 15 min) in HEK 293 cells stably transfected with the
VSV-tagged a1A and a1B ARs.
PHE 100 mM evoked a rapid, time-dependent increase in
the concentration of cytosolic-free calcium in HEK293 cells
stably transfected with VSV-tagged or untagged a1A and a1B
ARs which has a subtype specific temporal pattern (Figure 6).
a1A-AR activation by PHE elicited a fast calcium signal which
returned almost to basal levels after 5 min of PHE incubation.
Similar results had been previously found in Rat-1 fibroblast
stably expressing bovine a1A adrenoceptors [35]. The a1B
transfected cells underwent an increase in intracellular calcium
sustained until 10 min after PHE addition (Figure 6). PHE did
not elicit any significant change in the fluorescence in
presence of prazosin 10 mM (data not shown). Thus, the
amino terminal VSV-G tag insertion in a1-ARs not modified
the intracellular calcium signaling coupled to activation of
each a1-AR subtype.
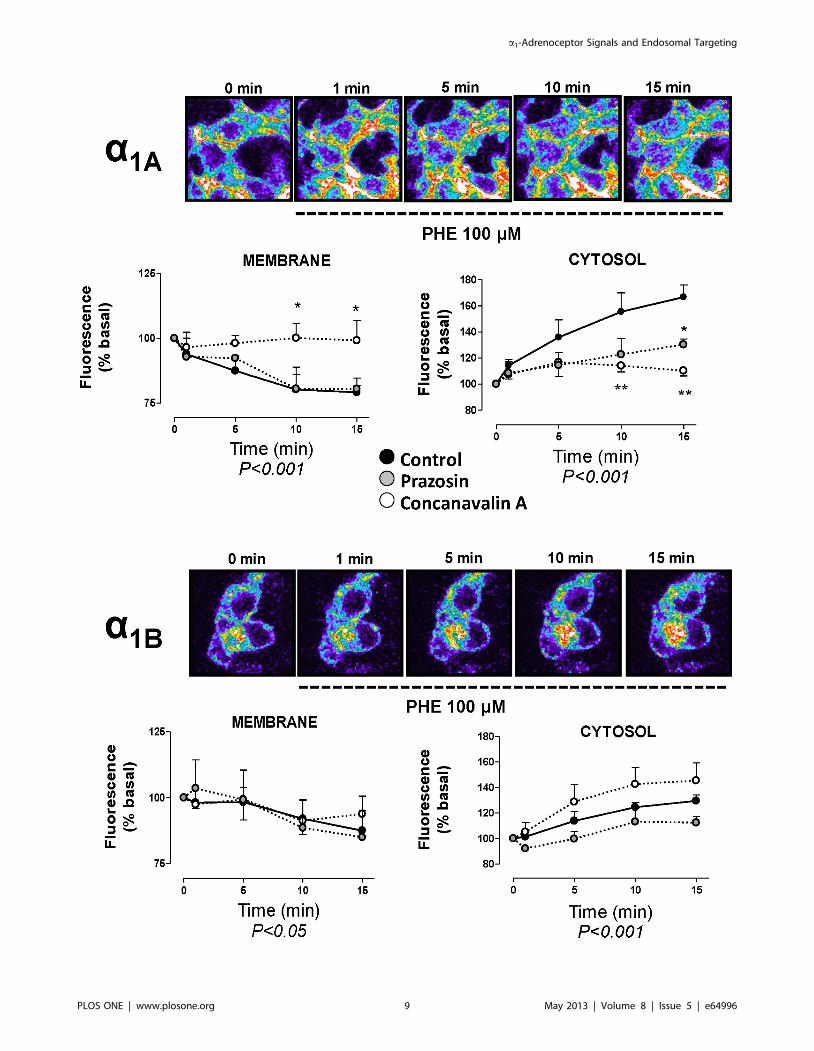
a1A- and a1B-ARs signal through pERK 1/2 and p38-MAPKin a subtype specific manner
ERK1/2 activation in HEK 293 cells stably transfected with
VSV-tagged or untagged a1A and a1B ARs was promoted by PHE
100 mM and completely blocked by prazosin 10 mM but not by 5-
methylurapidil 10 mM (Figure 7). The ERK1/2 phosphorylation
induced by each subtype followed a different temporal pattern.
a1A-AR activation by PHE rapidly elicited a p-ERK1/2 signal
(peak 1-5 min), which was well maintained for 15 min. The a1B
transfected cells underwent a similar initial increase in p-ERK1/2
but this was transient and the signal was rapidly reduced to basal
level 10 min after PHE addition (Figure 7).
To assess the involvement of cholesterol-rich lipid rafts in
regulation of a1-AR dependent ERK1/2 phosphorylation, cells
stably transfected with a1A- or a1B- ARs were treated for 30 or 60
min (more or less energic conditions of membrane disruption) with
mbCD 10 mM, or 30 min with filipin 1 mg/ml two reagents
frequently utilized to disrupt lipid raft structure by depleting the
cholesterol component. We also assayed the effect of Con A
250 mg/ml. As shown in Figure 8, the a1A-dependent p-ERK
signal was partially inhibited by mbCD (30 and 60 min) and
filipin. Con A did not affect the fast, but inhibited the slow and
sustained ERK1/2 phosphorylation induced by the a1A-AR
(Figure 8).
mbCD treatment for 30 or 60 min, eliminated the a1B-AR
dependent ERK1/2 signal whereas Filipin and Con A treatment
did not affect the ERK1/2 phosphorylation (Figure 8).
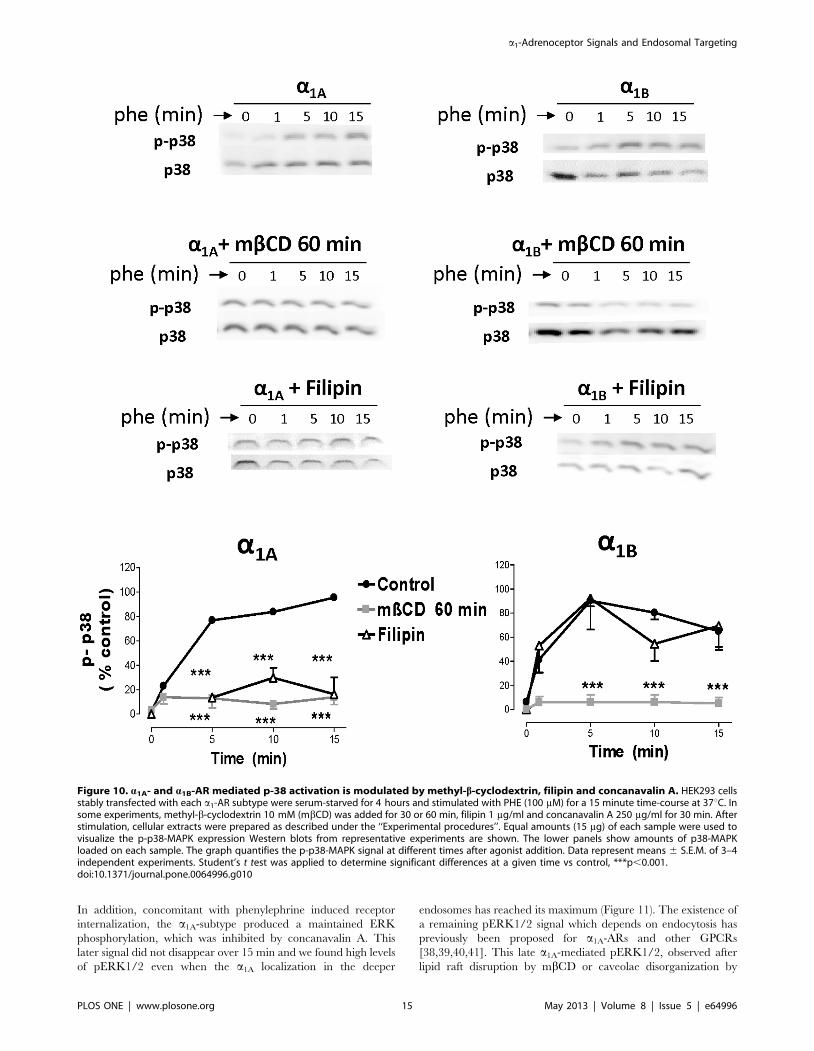
PHE 100 mM promoted phosphorylation of the p38-MAPK in
HEK 293 cells stably transfected with VSV-tagged or untagged
a1A and a1B ARs. Figure 9 shows the p38-MAPK phosphor-
ylation induced by each subtype which follows a different
temporal pattern: the response appears and disappears more
slowly when the a1A subtype was activated. In both subtypes this
response was abolished by prazosin 10 mM. The selective a1A-
ligand 5-Methylurapidil only slowed the signal promoted by
a1A-AR activation and did not affect the a1B-mediated p-p38
signal (Figure 9).
Pretreatment with mbCD 10 mM for 60 min abolished the p-
p38 response induced by both subtypes. Filipin 1 mg/ml abolished
a1A- but did not affect a1B-mediated p-p38 signal (Figure 10).
Discussion
We present evidence for two major conclusions. The first is that,
a1A- and a1B- ARs exhibit constitutive and agonist–induced
endocytosis and are sorted to two different endosomal compart-
ments, one of them located close to the inner face of the cell
membrane whereas the other is deeper distributed in the cytosol.
The other major finding is that each subtype was directed to these
two endosomal pools with a different time-course pattern, and this
peculiar distribution is closely related to the signalling pathway
activated by each receptor, then to its functional response.
placed on the confocal microscope stage in a 95% air and 5% CO2 atmosphere at 37uC. At this time, HEK293 were then exposed to pre-warmed KRHbuffer for 30 min. After 30 min of incubation, the images were acquired at zero time, 1 min and then 5 min intervals for 15 min. Confocal images arerepresentatives of the increase of intracellular fluorescence for both VSV-G-a1A-AR and VSV-G-a1B-AR. Graphs represent the changes in intracellularfluorescence intensity over time in the regions close to the cytoplasmic side of the plasma membrane and in the cytosolic region away from nuclei incontrol experiments (black symbols), cells preincubated with 10 mM prazosin (grey symbols) or 250 mg/ml concanavalin A (white symbols). Data wereexpressed as arbitrary units of fluorescence and represent the mean 6 S.E.M. of at least 4 independent experiments. Two-way ANOVA indicates asignificant (p,0.001) time dependent change for a1A- membrane and cytosolic pools.doi:10.1371/journal.pone.0064996.g004
a1-Adrenoceptor Signals and Endosomal Targeting
PLOS ONE | www.plosone.org 8 May 2013 | Volume 8 | Issue 5 | e64996
a1-Adrenoceptor Signals and Endosomal Targeting
PLOS ONE | www.plosone.org 9 May 2013 | Volume 8 | Issue 5 | e64996

Figure 5. Spatio-temporal analysis of the agonist-induced internalization of VSV-G a1A- and VSV-G a1B-ARs. Live HEK293 cells stablytransfected with each subtype were treated according to protocol detailed in Figure 3 and coverslips were rapidly mounted into a chamber bath,placed on the confocal microscope stage in a 95% air and 5% CO2 atmosphere at 37uC. After 30 min of incubation PHE 100 mM was added and theimages were acquired immediately before PHE addition (zero time) and 1, 5, 10 and 15 min. Confocal images are representatives of the increase ofintracellular fluorescence for both VSV-G-a1B-AR and VSV-G-a1B-AR. Graphs represent the significant changes in intracellular fluorescence intensityover time in the regions close to the cytoplasmic side of the plasma membrane and in the cytosolic region away from nuclei in control experiments(black symbols), cells preincubated with 10 mM prazosin (grey symbols) or 250 mg/ml concanavalin A (white symbols). Data were expressed aspercentage of basal fluorescence determined before agonist addition (0 min) and represent the mean 6 S.E.M. of at least 4 independent experiments.Two way ANOVA indicates a significant (p,0.001 or p,0.05) ) time dependent change for a1A - membrane and cytosolic pools and for a1B-cytosolicpool. Student’s t test was applied to determine significant differences at a given time vs control, *p,0.05 **p,0.01.doi:10.1371/journal.pone.0064996.g005
Figure 6. Activation of a1-ARs in cells stably transfected with the VSV-tagged or untagged a1A- and a1B-subtypes increasesintracellular Ca2+. Live HEK293 cells stably transfected with each subtype were incubated for 2 h with the fluorescent Ca2+ quelant FLUO-3-AM andmounted into a chamber bath placed on the confocal microscopy stage in a 95% air and 5% CO2 atmosphere at 37uC. After 30 min of stabilization,images were collected before (zero time) and after (1, 5, 10 and 15 min) adding PHE 100 mM. Graphs represent the time-course of intracellular Ca2+
increase induced by a1-AR activation of VSV-tagged or untagged a1A- and a1B-ARs. The data were calculated as the increase in fluorescence observedafter PHE addition over time, after substraction of the fluorescence observed in parallel experiments performed in the presence of PHE + prazosin(10 mM). Data represent the means 6 S.E.M. of 5–8 independent experiments. Two way ANOVA indicates that activation of the VSV tagged anduntagged a1A and a1B-subtypes elicits a significant (p,0.05) time dependent change in the calcium signal.doi:10.1371/journal.pone.0064996.g006
a1-Adrenoceptor Signals and Endosomal Targeting
PLOS ONE | www.plosone.org 10 May 2013 | Volume 8 | Issue 5 | e64996
Figure 7. a1A- and a1B-AR stimulation shows a subtype-specific pattern of ERK1/2 phosphorylation. HEK293 cells stably transfected withVSV-tagged or untagged a1A- and a1B-subtypes were serum-starved for 4 hours and stimulated with PHE (100 mM) for a 15 minute time-course at37uC. In some experiments, prazosin (10 mM) or 5-methylurapidil (10 mM) were added for 30 min. After stimulation, cellular extracts were prepared asdescribed under the ‘‘Experimental procedures’’. Equal amounts (15 mg) of each sample were used to visualize the p-ERK1/2 expression Western blotsfrom representative experiments were shown. The lower panels show total ERK1/2 loaded on each sample. The graph quantifies the p-ERK1/2 signalat different times. Data represent means 6 S.E.M. of 4-6 independent experiments. Student’s t test was applied to determine significant differences ata given time vs control, *p,0.05 **p,0.01.doi:10.1371/journal.pone.0064996.g007
a1-Adrenoceptor Signals and Endosomal Targeting
PLOS ONE | www.plosone.org 11 May 2013 | Volume 8 | Issue 5 | e64996
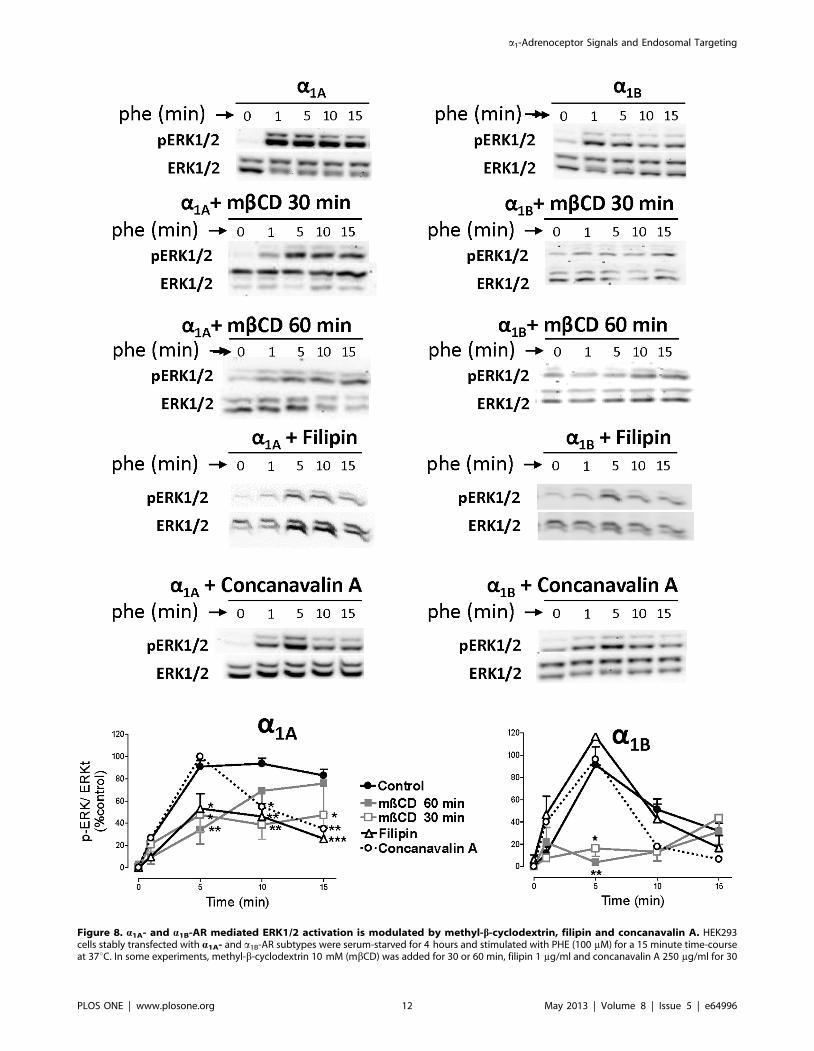
Figure 8. a1A- and a1B-AR mediated ERK1/2 activation is modulated by methyl-b-cyclodextrin, filipin and concanavalin A. HEK293cells stably transfected with a1A- and a1B-AR subtypes were serum-starved for 4 hours and stimulated with PHE (100 mM) for a 15 minute time-courseat 37uC. In some experiments, methyl-b-cyclodextrin 10 mM (mbCD) was added for 30 or 60 min, filipin 1 mg/ml and concanavalin A 250 mg/ml for 30
a1-Adrenoceptor Signals and Endosomal Targeting
PLOS ONE | www.plosone.org 12 May 2013 | Volume 8 | Issue 5 | e64996

Internalization patterns of a1A- and a1B-ARsIn absence of stimulus, VSV-tagged a1-ARs, previously located
in the membrane, constitutively internalize into acidic endosomes
located both, near the membrane or deeper in cytosol. This is
confirmed by colocalisation with transferrin. After 30 min, the a1A
subtype was mainly distributed in endosomes located near the
cytoplasmic side of the plasma membrane but this receptor pool
decreases as time passes while, in contrast, the deeper cytosolic
pool increases. This is confirmed by colocalisation with lyso-
tracker. These observations made by new approaches agree with
and extend previous findings about constitutive internalization of
a1A-AR stably expressed in Rat-1 fibroblats [23,27], but disagree
with a previous study in which spontaneous internalization of the
a1A subtype transfected in HEK 293 cells has not been found [22].
In this case, differences could not be attributed to cell line or to the
expression system since we found similar results in stable and
transiently transfected cells, nor to the different receptor
constructs, because they are different in all cases. The main
reason to explain the discrepancies could be the method used to
measure endocytosis: fluorescent ligands ([23], [27] and the
present study) or biotinylation experiments [22]. Although
receptor biotinylation is an accurate method to quantify receptors,
it is possible that it does not detect small receptor movements such
as a1A ARs moving faster from the membrane to the endosomes
located near the membrane.
The a1B subtype also undergoes constitutive internalization, but
with a different subcellular distribution. The fluorescent signal was
concentrated as clusters homogeneously distributed within the cell,
confirming previous works [22], but differing from Morris et al.,
[23] who did not find constitutive internalization in a preliminary
experiment with HA-tagged a1B EGFP ARs. When we quantified
the intensity of the real-time fluorescence for 15 min more, we saw
no changes in fluorescence in either of the regions measured (close
to the cytoplasmic side of the plasma membrane or in the deeper
cytosol).
Agonist addition intensified the internalization process especial-
ly for the a1A subtype, which rapidly moves from the endosomes
located close to the inner face of the membrane to the deeper
endosomes.
Clathrin-mediated internalization could be involved in agonist-
induced [18] as well as constitutive endocytosis of GPCRs [34],
and constitutive internalization of a1A has been described as a
mechanism which depends on b-arrestin and clathrin [23,27]. Our
results support these findings as the spontaneous traffic of a1A- and
a1B-ARs was partially inhibited by concanavalin A, a validated
blocker of endocytosis mediated by clathrin-coated pit/vesicle
formation [27]. Concanavalin A also inhibits agonist-mediated
a1A-AR internalization as previously described [23,27], although it
did not affect a1B-AR agonist-mediated internalization. This
observation contrasts with previous results which suggested that
agonist stimulation of a1B-AR endocytosis is dependent on b-
arrestin [22]. However, as we have already stated, the different
methodological approaches could be the reason for such
discrepancies. Prazosin modified constitutive (both near mem-
brane and deeper pools), and agonist induced endocytosis (deeper
pool) of the a1A subtype but did not alter the spontaneous nor the
agonist induced internalization of the a1B subtype. Similar results
have been reported for the a1A- subtype, using the HA-tagged a1A-
AR [23,25] or the fluorescent prazosin-derivative QAPB [27]. The
surprising lack of a significant effect of prazosin on the
internalization of the a1B-subtype has not been previously
described.
Comparison between Ca2+-signal, activation of ERK1/2 orp38-MAPK and the endocytic pathways of the a1-ARsubtypes
After PHE stimulation of VSV-tagged or untagged a1A- and
a1B-ARs, a strong increase in the calcium levels was observed. It is
well-known that receptor endocytosis can attenuate or terminate
membrane-located cell signaling. In our case, the strong increase
in the calcium signal starts to decline together with a decrease in
receptor localization in the near-membrane pool of endosomes. A
close parallel was observed between the passage to the deeper
endosomes and disappearance of the calcium signal and finally,
when a1-AR localization in the deeper endosomes is achieved at
this maximal level, the localization in the near-membrane pool is
minimal and the calcium concentration is close to the basal levels
even in the continued presence of PHE (Figure 11). In this case, it
seems that receptor endocytosis from membrane to deeper
endosomes terminates cell calcium-signaling. This observation
agrees with the well-known a1-AR signaling pathway which
involves membrane located protein Gq and inositol phosphates. As
well as a1A- or a1B- AR moving from the membrane to deeper
endosomes, the coupling with the Gq protein is interrupted and
calcium signal declines.
pERK1/2 kinetics elicited by PHE-activation of a1A and a1B-
ARs, gave a different pattern for each subtype. a1B-induced
ERK1/2 phosphorylation, which reaches its maximum 5 min after
PHE stimulation and decreases at the same time as a1B-ARs
located near the membrane disappear (Figure 11). As expected,
this signal was completely inhibited by prazosin but not by the
selective a1A ligand 5-methylurapidil. To investigate in detail the
importance of the membrane integrity for receptor induced
signaling we use two agents frequently utilized to disrupt lipid raft
structure by depleting the cholesterol component: mbCD and
filipin. However, the effect of these agents on the membrane
integrity is not identical. In fact, filipin treatment completely
changes the cellular distribution of caveolin-1 leading to a collapse
of the caveolae, whereas mbCD sequestrates cholesterol without
any significant effect on caveolin-1 distribution [36]. As a1B
mediated ERK1/2 phosphorylation was not observed after
membrane disruption by mbCD treatment (30 or 60 min) but
remained unaltered after filipin treatment, we can assume that
caveolae, important for internalisation of GPCR, are not essential
components of a1B-AR signaling pathway, which depends on
membrane integrity. This result agrees with the observation that
the clathrin-mediated endocytosis blocker concanavalin A [27]
does not modified the ERK1/2 signal activated by the a1B -
subtype.
A different ERK1/2 response was observed with the a1A-AR.
This subtype elicited a rapid ERK1/2 phosphorylation inhibited
by membrane and caveolae disruption but insensitive to Conca-
navalin A treatment, indicating its dependence of membrane
integrity but not to clatrhin-mediated internalizacion, which is in
agreement with previous reports showing that agonist elicited a1A-
dependent pERK1/2 signal depends on caveolae integrity [25,37]
min. After stimulation, cellular extracts were prepared as described under the ‘‘Experimental procedures’’. Equal amounts (15 mg) of each samplewere used to visualize the p-ERK1/2 expression Western blots from representative experiments are shown. The lower panels show total ERK1/2loaded on each sample. The graph quantifies the p-ERK1/2 signal at different times. Data represent means 6 S.E.M. of 3-6 independent experiments.Student’s t test was applied to determine significant differences at a given time vs control, *p,0.05 **p,0.01 ***p,0.001.doi:10.1371/journal.pone.0064996.g008
a1-Adrenoceptor Signals and Endosomal Targeting
PLOS ONE | www.plosone.org 13 May 2013 | Volume 8 | Issue 5 | e64996

Figure 9. a1A- and a1B-AR stimulation shows a subtype-specific pattern of p38-MAPK phosphorylation. HEK293 cells stably transfectedwith VSV-tagged or untagged a1A- and a1B-subtypes were serum-starved for 4 hours and stimulated with PHE (100 mM) for a 15 minute time-courseat 37uC. In some experiments, prazosin (10 mM) or 5-methylurapidil (10 mM) were added for 30 min. After stimulation, cellular extracts were preparedas described under the ‘‘Experimental procedures’’. Equal amounts (15 mg) of each sample were used to visualize the phosphorylated p-38 MAPKexpression Western blots from representative experiments are shown. The lower panels show total p38 loaded on each sample. The graph quantifiesthe p-p38 MAPK signal at different times. Data represent means 6 S.E.M. of 3-6 independent experiments. Student’s t test was applied to determinesignificant differences at a given time vs control, *p,0.05 **p,0.01 ***p,0.001.doi:10.1371/journal.pone.0064996.g009
a1-Adrenoceptor Signals and Endosomal Targeting
PLOS ONE | www.plosone.org 14 May 2013 | Volume 8 | Issue 5 | e64996
In addition, concomitant with phenylephrine induced receptor
internalization, the a1A-subtype produced a maintained ERK
phosphorylation, which was inhibited by concanavalin A. This
later signal did not disappear over 15 min and we found high levels
of pERK1/2 even when the a1A localization in the deeper
endosomes has reached its maximum (Figure 11). The existence of
a remaining pERK1/2 signal which depends on endocytosis has
previously been proposed for a1A-ARs and other GPCRs
[38,39,40,41]. This late a1A-mediated pERK1/2, observed after
lipid raft disruption by mbCD or caveolae disorganization by
Figure 10. a1A- and a1B-AR mediated p-38 activation is modulated by methyl-b-cyclodextrin, filipin and concanavalin A. HEK293 cellsstably transfected with each a1-AR subtype were serum-starved for 4 hours and stimulated with PHE (100 mM) for a 15 minute time-course at 37uC. Insome experiments, methyl-b-cyclodextrin 10 mM (mbCD) was added for 30 or 60 min, filipin 1 mg/ml and concanavalin A 250 mg/ml for 30 min. Afterstimulation, cellular extracts were prepared as described under the ‘‘Experimental procedures’’. Equal amounts (15 mg) of each sample were used tovisualize the p-p38-MAPK expression Western blots from representative experiments are shown. The lower panels show amounts of p38-MAPKloaded on each sample. The graph quantifies the p-p38-MAPK signal at different times after agonist addition. Data represent means 6 S.E.M. of 3–4independent experiments. Student’s t test was applied to determine significant differences at a given time vs control, ***p,0.001.doi:10.1371/journal.pone.0064996.g010
a1-Adrenoceptor Signals and Endosomal Targeting
PLOS ONE | www.plosone.org 15 May 2013 | Volume 8 | Issue 5 | e64996

filipin, but inhibited by Concanavalin A, corroborates the
existence of an ERK1/2 signal independent of the membrane or
caveolae integrity but dependent on receptor internalization.
Our results also show that prazosin, an antagonist which freely
crosses the plasma membrane [42] and internalizes with receptors
[27], blocks the calcium signal as well as ERK1/2 and p38
phosphorylation elicited by PHE whereas 5-methylurapidil does
not. Similar results were previously described in cardiomyocites
where PHE-induced activation of ERK1/2 was blocked by
prazosin but nor by the membrane impermeable a1 antagonist
as CGP-12177A [42]
Previous evidence indicates that a1A-ARs, via ERK activation,
exert an anti-apoptotic activity with a cardioprotective role in
cardiomyocytes that was not evident for the other a1 subtypes
[43]. The fact that the pool of receptors responsible for this anti-
apoptotic activity was perinuclearly localized, strongly suggests
that it is dependent on the receptor-internalization. Our present
results suggest that the slow and sustained p-ERK activation
induced by a1A-AR located in endosomes could be the prosurvival
pathway relevant for cardioprotection, and could explain the
clinical evidence that chronic use of a a1 antagonist as doxazosin
was associated with higher risk factor for coronary heart disease
[44]. The fact that ERK1/2 phosphorylation mediated by the a1A
subtype was completely inhibited by prazosin but not by the
selective a1A ligand 5-methylurapidil was an unexpected result that
opens new perspectives to investigate the inhibitory profile of the
a1-selective ligands on MAPKs signals to improve its therapeutic
usefulness.
Finally, both a1A and a1B-ARs phosphorylate p38 when
activated by PHE and this phosphorylation was inhibited by
prazosin. 5-methylurapidil only retards the p38 signal promoted
by the a1A subtype. The temporal pattern of p38 phosphorylation
did not correlate to the other pathways analyzed. Activation of the
a1A-AR elicits a slow phosphorylation of p38 entirely dependent
on lipid rafts and caveolae integrity, suggesting that the signal is
not related to the endocytic process, or if it is, only receptors
internalized in intact lipid rafts can signal through this p38-MAPK
pathway raft-dependent endocytosis [45]. Activation of the a1B-
AR induces a faster p38-MAPK signal, which also depends on the
lipid rafts integrity, since it was not observed after mbCD
treatment, but was unaffected by filipin, confirming that mainte-
nance of caveolae structure is not essential for a1B-signalling. In
Figure 11. Combined analysis of the temporal patterns of calcium signal, pERK1/2 signal and internalization of VSV-a1-ARsfollowing stimulation. Schematic diagram representing the kinetic of the internalization patterns of VSVG-a1A and VSVG-a1B ARs in endosomeslocated near the plasma membrane (continuous line) or in the cytosol (discontinuous line), and the kinetic of the intracellular calcium signal (green),or the pERK1/2 signal (blue) elicited by activation of these receptors or by activation of the receptors after disruption of lipid rafts with mbCD (red). Inorder to facilitate the comparison, the data were calculated as a percentage of the maximal response in each case, and represent the mean of theexperiments previously describeddoi:10.1371/journal.pone.0064996.g011
a1-Adrenoceptor Signals and Endosomal Targeting
PLOS ONE | www.plosone.org 16 May 2013 | Volume 8 | Issue 5 | e64996
this case we cannot conclude if the activation of the p38-MAPK
pathway by the a1B-AR depends or not, at least partially, on the
receptor internalization process, but precedes it (Figure 11).
Controversial results provide evidence that activation of p38 can
be beneficial or detrimental in a cell [46], but recent data showed
that activation of a1-AR in cardiomyocytes induces p38 activation
and has a protective role to antagonize noradrenaline-induced cell
death [47]. Future studies about the functional consequences of
the p38 activation by each a1-AR subtype could add more
information about the cardioprotective role of a1A-ARs and the
relationship between cardioprotection and the property of
continuing signaling once the receptor has been internalized into
the deeper cytosolic endosomes.
In short, constitutive as well as agonist-induced trafficking of a1A
and a1B ARs maintain two different endosomal pools of receptors
with different subcellular distribution: one located close to the
plasma membrane and the other deeper in the cytosol. Each
subtype exhibits peculiar characteristics of internalization and
distribution between both pools that condition their signaling
pathways: a1A-AR, when located in the plasma membrane, signal
through calcium and ERK1/2 pathways but, when it translocates
to deeper endosomes, continues signaling through ERK1/2 and
could also activate the p38 pathway. a1B-AR signals through
calcium, ERK1/2 and p38 only when located in the membrane
and the signals disappear by membrane disruption. The functional
consequences of the intracellular signaling could be related to the
cardioprotective activity shown by the a1A subtype.
Supporting Information
Figure S1 Internalization kinetic was quantified foreach cell at two different cellular regions (cytosol andnear-membrane) by measuring the mean intensity ofthe fluorescence of two linear segments of 5 mm oflength located in the cytosol, close to the nucleus, andtwo linear segments of 5 mm of length located in regionsnear to the plasma membrane. Data were the mean of the
measures obtained from 8–10 different cells for each
experiment.To better identify membrane and cytosolic re-
gions, light microscopic images were overlapped with fluores-
cence images.
(TIFF)
Figure S2 Live HEK293 cells transiently transfectedwith VSV-G-a1A- or VSV-G-a1B-AR subtypes were incu-bated with CypHer5E Linked anti-VSV-G Antibody at a
5 mg/ml in KRH buffer at 46C for 1h. After washing with
cold KRH Buffer, coverslips were rapidly mounted into a chamber
bath, placed on the confocal microscope stage in a 95% air and
5% CO2 atmosphere at 37uC. At this time, HEK293 were then
exposed to prewarmed KRH buffer at 37uC. After 30 min of
incubation the images were acquired at zero time (30 min), 31 min
and then 5 min intervals for 15 min (45 min). Confocal images are
representatives of the increase of intracellular fluorescence for both
VSV-G-a1A-AR and VSV-G-a1B-AR.
(TIFF)
Figure S3 A) Live non transfected HEK293 cells were incubated
with CypHer5E Linked anti-VSV-G Antibody at a 5 mg/ml in
KRH buffer at 4uC for 60 min. After washing with cold KRH
Buffer, coverslips were rapidly mounted into a chamber bath,
placed on the confocal microscope stage in a 95% air and 5% CO2
atmosphere at 37uC. At this time, HEK293 were then exposed to
prewarmed KRH buffer for 30 min at 37uC and the images were
acquired (left: fluorescence; right: transmission) B) HEK293 cells
stably expressing VSV-G-a1A and VSV-G-a1B-AR subtypes after
incubation with the CypHer5E linked Anti-VSV antibody at a
5 mg/ml in KRH buffer at 4uC for 60 min. Cells were washed with
cold Krebs Ringer Buffer three times at 4uC, immediately, cells
were fixed with 3.7%paraformaldehyde in PBS/4% sucrose for
10 min. Coverslips were mounted onto glass slides with Daco
mounting medium and stored at 4uC in the dark until viewing in
the confocal microscope. No significant fluorescence was observed
under these conditions
(TIFF)
Figure S4 Live HEK293 cells transiently transfectedwith VSV-G-a1A- or VSV-G-a1B-AR subtypes were treatedaccording to protocol detailed in Figure b and coverslipswere rapidly mounted into a chamber bath, placed onthe confocal microscope stage in a 95% air and 5% CO2
atmosphere at 376C. After 30 min of incubation PHE 100 mM
was added and the images were acquired immediately before PHE
addition (zero time) and 1, 5, 10 and 15 min. Confocal images are
representatives of the increase of intracellular fluorescence for both
VSV-G-a1A-AR and VSV-G-a1B-AR.
(TIFF)
Author Contributions
Conceived and designed the experiments: VS MP-A FM JP GM IM PD.
Performed the experiments: VS MP-A FM JP EC MAN. Analyzed the
data: VS MP-A FM MAN JP GM IM PD. Contributed reagents/
materials/analysis tools: GM. Wrote the paper: GM IM PD.
References
1. Alexander S, Mathie A, Peters J (2011) G-Protein-Coupled Receptors. British
Journal of Pharmacology, 164: S5–S113. doi: 10.1111/j.1476-5381.2011.
01649_3.x
2. Wu D, Katz A, Lee CH, Simon MI (1992) Activation of Phospholipase C by
Alpha 1-Adrenergic Receptors Is Mediated by the Alpha Subunits of Gq Family.
J Biol Chem 267: 25798–25802.
3. Perez DM, DeYoung MB, Graham RM (1993) Coupling of Expressed Alpha
1B- and Alpha 1D-Adrenergic Receptor to Multiple Signaling Pathways Is Both
G Protein and Cell Type Specific. Mol Pharmacol 44: 784–795.
4. Lee MW, Severson DL (1994) Signal Transduction in Vascular Smooth Muscle:
Diacylglycerol Second Messengers and PKC Action. Am J Physiol 267: C659–
678
5. Theroux TL, Esbenshade TA, Peavy RD, Minneman KP (1996) Coupling
Efficiencies of Human Alpha 1-Adrenergic Receptor Subtypes: Titration of
Receptor Density and Responsiveness with Inducible and Repressible
Expression Vectors. Mol Pharmacol 50: 1376–1387.
6. Keffel S, Alexandrov A, Goepel M, Michel MC (2000) Alpha(1)-Adreno-
ceptor Subtypes Differentially Couple to Growth Promotion and Inhibition in
Chinese Hamster Ovary Cells. Biochem Biophys Res Commun 272: 906–
911.
7. Wright CD, Chen Q, Baye NL, Huang Y, Healy CL, et al. (2008) Nuclear
Alpha1-Adrenergic Receptors Signal Activated ERK Localization to Caveolae
in Adult Cardiac Myocytes. Circ Res 103: 992–1000.
8. Lyssand JS De Fino MC, Tang X, Hertz AL, Feller DB, et al. (2008) Blood
pressure is regulated by an a1D.adrenergic receptor/dystrophin signalosome J
Biol Chem 283: 18792–18800.
9. Benovic JL, Pike LJ, Cerione RA, Staniszewski C, Yoshimasa T, et al. (1985)
Phosphorylation of the Mammalian Beta-Adrenergic Receptor by Cyclic AMP-
Dependent Protein Kinase. Regulation of the Rate of Receptor Phosphorylation
and Dephosphorylation by Agonist Occupancy and Effects on Coupling of the
Receptor to the Stimulatory Guanine Nucleotide Regulatory Protein. J Biol
Chem 260:7094–7101.
10. Ferguson SS (2001) Evolving Concepts in G Protein-Coupled Receptor
Endocytosis: the Role in Receptor Desensitization and Signaling. Pharmacol
Rev 53: 1–24.
11. Hanyaloglu AC, von Zastrow M (2008) Regulation of GPCRs by Endocytic
Membrane Trafficking and Its Potential Implications. Annu Rev Pharmacol
Toxicol 48: 537–568.
12. Patel PA, Tilley DG, Rockman HA. (2008) Beta-Arrestin-Mediated Signaling in
the Heart. Circ J 72: 1725–1729.
a1-Adrenoceptor Signals and Endosomal Targeting
PLOS ONE | www.plosone.org 17 May 2013 | Volume 8 | Issue 5 | e64996
13. Luttrell LM, Gesty-Palmer D (2010) Beyond desensitization: Physiological
Relevance of Arrestin-Dependent Signaling. Pharmacol Rev 62: 305–330.
14. Oakley RH, Laporte SA, Holt JA, Barak LS, Caron MG (1999) Association of
Beta-Arrestin With G Protein-Coupled Receptors During Clathrin-Mediated
Endocytosis Dictates the Profile of Receptor Resensitization. J Biol Chem 274:
32248–32257.
15. DeFea KA, Zalevsky J, Thoma MS, Dery O, Mullins RD, et al. (2000) Beta-
Arrestin-Dependent Endocytosis of Proteinase-Activated Receptor 2 Is Required
for Intracellular Targeting of Activated ERK1/2. J Cell Biol 148: 1267–1281.
16. Terrillon S, Bouvier M (2004) Receptor Activity-Independent Recruitment of
Betaarrestin2 Reveals Specific Signalling Modes. EMBO J 23: 3950–3961.
17. DeWire SM, Ahn S, Lefkowitz RJ, Shenoy SK (2007) Beta-Arrestins and Cell
Signaling. Annu Rev Physiol 69: 483–510
18. Calebiro D, Nikolaev VO, Persani L, Lohse MJ (2010) Signaling by Internalized
G-Protein-Coupled Receptors. Trends Pharmacol Sci 31: 221–228.
19. Lattion AL, Diviani D, Cotecchia S (1994) Truncation of the Receptor Carboxyl
Terminus Impairs Agonist-Dependent Phosphorylation and Desensitization of
the Alpha 1B-Adrenergic Receptor. J Biol Chem 269: 22887–22893.
20. Mhaouty-Kodja S, Barak LS, Scheer A, Abuin L, Diviani D, et al. (1999)
Constitutively Active Alpha-1b Adrenergic Receptor Mutants Display Different
Phosphorylation and Internalization Features. Mol Pharmacol 55: 339–347.
21. Diviani D, Lattion AL, Abuin L, Staub O, Cotecchia S (2003) The Adaptor
Complex 2 Directly Interacts With the Alpha 1b-Adrenergic Receptor and Plays
a Role in Receptor Endocytosis. J Biol Chem 278: 19331–19340.
22. Stanasila L, Abuin L, Dey J, Cotecchia S (2008) Different Internalization
Properties of the Alpha1a- and Alpha1b-Adrenergic Receptor Subtypes: the
Potential Role of Receptor Interaction With Beta-Arrestins and AP50. Mol
Pharmacol 74: 562–573.
23. Morris DP, Price RR, Smith MP, Lei B, Schwinn DA (2004) Cellular Trafficking
of Human Alpha1a-Adrenergic Receptors Is Continuous and Primarily Agonist-
Independent. Mol Pharmacol 66: 843–854.
24. Morris DP, Lei B, Wu YX, Michelotti GA, Schwinn DA (2008) The Alpha1a-
Adrenergic Receptor Occupies Membrane Rafts With Its G Protein Effectors
but Internalizes Via Clathrin-Coated Pits. J Biol Chem 283: 2973–2985.
25. Lei B, Morris DP, Smith MP and Schwinn DA (2009) Lipid Rafts Constrain
Basal Alpha(1A)-Adrenergic Receptor Signaling by Maintaining Receptor in an
Inactive Conformation. Cell Signal 21: 1532–1539.
26. Price RR, Morris DP, Biswas G, Smith MP, Schwinn DA (2002) Acute Agonist-
Mediated Desensitization of the Human Alpha 1a-Adrenergic Receptor Is
Primarily Independent of Carboxyl Terminus Regulation: Implications for
Regulation of Alpha 1aAR Splice Variants. J Biol Chem 277: 9570–9579.
27. Pediani JD, Colston J F, Caldwell D, Milligan G, Daly CJ, et al. (2005) Beta-
Arrestin-Dependent Spontaneous Alpha1a-Adrenoceptor Endocytosis Causes
Intracellular Transportation of Alpha-Blockers Via Recycling Compartments.
Mol Pharmacol 67: 992–1004.
28. Adie EJ, Kalinka S, Smith L, Francis MJ, Marenghi A, et al. (2002) A pH-
Sensitive Fluor, CypHer 5, Used to Monitor Agonist-Induced G Protein-
Coupled Receptor Internalization in Live Cells. Biotechniques 33: 1152–1157.
29. Adie EJ, Francis MJ, Davies J, Smith L, Marenghi A, et al. (2003) CypHer 5: a
Generic Approach for Measuring the Activation and Trafficking of G Protein-
Coupled Receptors in Live Cells. Assay Drug Dev Technol 1: 251–259.
30. Oliver E, Martı D, Monto F, Flacco N, Moreno L, et al. (2009) The impact of
alpha1-adrenoceptors up-regulation accompanied by the impairment of beta-
adrenergic vasodilatation in hypertension. J Pharmacol Exp Ther 328: 982–990.
31. Hirasawa A, Sugawara T, Awaji T, Tsumaya K, Ito H, et al. (1997) Subtype-
Specific Differences in Subcellular Localization of Alpha1-Adrenoceptors:Chlorethylclonidine Preferentially Alkylates the Accessible Cell Surface
Alpha1-Adrenoceptors Irrespective of the Subtype. Mol Pharmacol 52:764–770.
32. Chalothorn D, McCune DF, Edelmann SE, Garcia-Cazarin ML, Tsujimoto G,et al. (2002) Differences in the Cellular Localization and Agonist-Mediated
Internalization Properties of the Alpha(1)-Adrenoceptor Subtypes. Mol Phar-macol 61:1008–1016.
33. von Zastrow M, Kobilka BK (1994) Antagonist-Dependent and -Independent
Steps in the Mechanism of Adrenergic Receptor Internalization. J Biol Chem269: 18448–18452.
34. Wolfe BL, Trejo J (2007) Clathrin-Dependent Mechanisms of G Protein-Coupled Receptor Endocytosis. Traffic 8:462–470.
35. Pediani JD, MacKenzie JF, Heeley RP, Daly CJ, McGrath JC (2000). Single-cellrecombinant pharmacology: bovine alpha(1a)-adrenoceptors in rat-1 fibroblasts
release intracellular Ca(2+), display subtype-characteristic agonism and antag-
onism, and exhibit an antagonist-reversible inverse concentration-responsephase. J Pharmacol Exp Ther 293:887–895.
36. Moyano C, Kerr J, Mueller A (2008) CCR5 internalisation and signalling havedifferent dependence on membrane lipid raft integrity. Cellular Signalling 20:
1687–1694
37. Morris JB, Huynh H, Vasilevski O, Woodcock EA (2006) Alpha1-adrenergicreceptor signaling is localized to caveolae in neonatal rat cardiomyocytes. J Mol
Cell Cardiol 41:17–25.38. Liu F, He K, Yang X, Xu N, Liang Z, et al. (2011) Alpha1A-Adrenergic
Receptor Induces Activation of Extracellular Signal-Regulated Kinase 1/2Through Endocytic Pathway. PLoS One 6: e21520.
39. Ahn S, Shenoy SK, Wei H and Lefkowitz RJ (2004) Differential Kinetic and
Spatial Patterns of Beta-Arrestin and G Protein-Mediated ERK Activation bythe Angiotensin II Receptor. J Biol Chem 279: 35518–35525.
40. Shenoy SK, Drake MT, Nelson CD, Houtz DA, Xiao K, et al. (2006) Beta-Arrestin-Dependent, G Protein-Independent ERK1/2 Activation by the Beta2
Adrenergic Receptor. J Biol Chem 281: 1261–1273.
41. Gesty-Palmer D, Chen M, Reiter E, Ahn S, Nelson CD, et al. (2006) DistinctBeta-Arrestin- and G Protein-Dependent Pathways for Parathyroid Hormone
Receptor-Stimulated ERK1/2 Activation. J Biol Chem 281: 10856–10864.42. Wright CD, Chen Q, Baye NL, Huang Y, Healy CL, et al. (2008) Nuclear
alpha1-adrenergic receptors signal activated ERK localization to caveolae inadult cardiac myocytes Circ Res. 103: 992–1000.
43. Huang Y, Wright CD, Merkwan CL, Baye NL, Liang Q, et al. (2007) An
alpha1A-adrenergic-extracellular signal-regulated kinase survival signalingpathway in cardiac myocytes, Circulation 115: 763–772.
44. ALLHAT Collaborative Research Group (2000) Major cardiovascular events inhypertensive patients randomized to doxazosin vs chlorthalidone: the antihy-
pertensive and lipid-lowering treatment to prevent heart attack trial (ALLHAT).,
JAMA 283: 1967–1975.45. Lajoie P, Nabi IR (2010) Lipid Rafts, Caveolae, and Their Endocytosis. Int Rev
Cell Mol Biol 282: 135–163.46. Stenbergen C (2002) The role of p38 mitogen-activated protein kinase in
myocardial ischemia/reperfusion injury; relationship to ischemic precondition-ing. Basic Res Cardiol 97: 276–285
47. Tsang MY, Rabkin SW (2009) p38 mitogen-activated protein kinase (MAPK) is
activated by noradrenaline and serves a cardioprotective role, whereasadrenaline induces p38 MAPK dephosphorylation. Clin Exp Pharmacol Physiol
36 (8):e12–19.
a1-Adrenoceptor Signals and Endosomal Targeting
PLOS ONE | www.plosone.org 18 May 2013 | Volume 8 | Issue 5 | e64996