differential gene expression analysis of pure cell...
TRANSCRIPT

6 5 0 . 9 6 2 . 3 0 2 0 t e l 8 8 8 . 4 6 6 . 7 9 1 1 t o l l - f r e e 6 5 0 . 9 6 2 . 3 0 3 9 f a x t e c h s u p p o r t @ a r c t u r . c o m w w w . a r c t u r . c o m
Differential Gene Expression Analysis of Pure Cell Populations from Frozen Uterine Tissue Using Laser Capture Microdissection (LCM) and cDNA Microarrays
A P P L I C A T I O N N O T E #4
Abstract
Laser Capture Microdissection (LCM) is an innovative technique which permits the rapid and reliable procurement of pure cell populations from heterogeneous tissue sections. After LCM, RNA isolated from pure cell populations was amplified to generate adequate amounts of antisense RNA (aRNA) for hybridization, and the differential gene expression profiles were analyzed between two experimental groups.
Introduction
When investigating molecular mechanisms in specific tissues or cells, the accuracy of deduced mechanisms often depends on the relative abundance of the cell population in question. Mammalian uterine tissue consists of endometrium and myometrium. The endometrium is comprised of luminal epithelium, densely packed stroma, and the germinal basalis. For implantation, blastocysts make their first physical uterine contact with the maternal endometrial luminal epithelium. In previous analyses of global gene expression during implantation, authors used whole uterine tissue, thus these studies produced information on the temporal gene expression profile in the uterus, but not in the specific cell population.1,2 Using LCM, a pure population of luminal epithelial tissue was obtained, without stromal cell or embryonic contamination, with the objective of identifying genes expressed exclusively in the luminal epithelium during the apposition stage of implantation. Total cellular RNA was then amplified to obtain aRNA for microarray hybridization to elucidate genes differentially expressed in the luminal epithelium of implantation (IM) sites compared to the interimplantation (INTER) sites (no blastocyst implantation).3
Method
SLIDE PREPARATION AND STAINING1. Freshly frozen tissues were cut into 5
µm thick sections and placed onto plain glass slides. Slides were stored at -70 oC until use.
NOTE: Slides may be stored at -70oC for up to six months.
2. Slides were stained with hematoxylin and eosin, and dehydrated per the following protocol.
1) Defrost slides briefly, 30 seconds or less.
2) Fix with 70% ethanol for 30 seconds 3) Wash with DEPC-treated distilled
water for 30 seconds. 4) Stain with Mayer’s hematoxylin
(DAKO, Cat. # S3309) for 30 seconds.
5) Wash with DEPC-treated distilled water for 30 seconds.
6) Wash with Bluing reagent (1X Scott’s tap water; Sigma, Cat. #
Se-Jin Yoon and Kyung-Ah LeeInfertility Medical Center, CHA General Hospital, Seoul 135-081, Korea
S5134) for 30 seconds. 7) Dehydrate with 70% ethanol for 30
seconds. 8) Dehydrate with 95% ethanol for 30
seconds. 9) Stain with Eosin (Sigma, Cat. #
E6003) for 30 seconds. 10) Place the slides to 75% ethanol for
30 seconds. 11) Place the slides to 95% ethanol for
30 seconds. 12) Place the slides to 100% ethanol for
30 seconds. 13) Place the slides to xylene for 5
minutes. 14) Remove slides from xylene and air-
dry for 5 minutes.
Figure 1. (A) Microphotographs during LCM procedure. Mouse uterine section (1) before and (2) after
LCM of luminal epithelium. (3) Luminal epithelium captured on the transfer film. RNA was extracted from
luminal epithelium of implantation (IM) and interimplantation (INTER) sites. After two rounds of linear
amplification, optical density of aRNA was measured at 260 nm and 280 nm. 0.2 µg of amplified aRNAs
were analyzed by agarose gel electrophoresis (B) and Bioanalyzer (C) to visualize the quality and quantity
of aRNA after amplification. Amplified RNAs appeared as highly reproducible smears, ranging from 200 to
600 bases in length.

6 5 0 . 9 6 2 . 3 0 2 0 t e l 8 8 8 . 4 6 6 . 7 9 1 1 t o l l - f r e e 6 5 0 . 9 6 2 . 3 0 3 9 f a x t e c h s u p p o r t @ a r c t u r . c o m w w w . a r c t u r . c o m
A P P L I C A T I O N N O T E #42
ISOLATION OF SPECIFIC CELL POPULATION BY LCM ANALYSISLCM was performed using a PixCell® IIsystem (Arcturus, Cat# LCM1106)using CapSure® Macro LCM caps(Arcturus, Cat# LCM0211). Pureluminal epithelium of implantation orinterimplantation sites was isolated usingLCM (Figure 1A), filling an entire CapSureMacro cap with cells of interest.
RNA ISOLATION AND AMPLIFICATION1. Total cellular RNA was extracted
from captured cells immediately after microdissection using the PicoPure® RNA Isolation Kit (Arcturus,
Cat. # KIT0202). a) 50 µl extraction buffer was
pipetted into a 0.5 ml microcentrifuge tube. b) Placed the CapSure caps carrying
the captured cells onto the microcentrifuge tube and inverted the assembly such that the extraction buffer completely covered the cap surface.
c) Incubated at 42oC for 30min. d) Performed RNA binding onto
the silica column followed by washing as prescribed in the PicoPure RNA Isolation kit user guide.
e) Eluted the RNA in 11 µl elution buffer following the PicoPure protocol.
2. This RNA sample was directly used for amplification using the RiboAmp® RNA Amplification Kit (Arcturus, Cat. # KIT0201). After two rounds of amplification, the aRNA was run on an agarose gel, and appeared as a smear, ranging from under 200 bases to over 600 bases in length (Figure 1B). The quality and quantity of aRNA after amplification were further examined by bioanalyzer (Agilent Technologies, Palo Alto, CA) (Figure 1C). Eight to ten micrograms (8-10 µg) of aRNA was obtained from CapSure caps filled with microdissected cells, enough for quadruple hybridizations for each sample, using 2 µg of aRNA per hybridization.
Figure 3. MA scatter plot. Microarray data from 4 times repeated experiments were normalized with LOWESS
and visualized by MA scatter plot. Horizontal axis show the A value representing the signal intensity and vertical
axis show the M value representing the gene expression difference. Representatives from significant genes
determined by SAM were indicated with black arrow. Some of non-significant genes with high M values were
marked with red arrows.
Figure 2. Identification of the genes displaying significant changes in expression. Graph represents a scatter
plot of the observed relative difference d(i) versus the expected relative difference dE(i). The solid line indicates
the line for d(i)=dE(i), where the observed relative difference is identical to the expected relative difference. The
dotted lines are drawn at a distance D = 0.117 from the solid line. The red spots (right upper quadrant) indicate
the genes with higher expression at implantation (IM) site and the green spots (left lower quadrant) indicate the
genes with higher expression at interimplantation (INTER) site.
6 5 0 . 9 6 2 . 3 0 2 0 t e l 8 8 8 . 4 6 6 . 7 9 1 1 t o l l - f r e e 6 5 0 . 9 6 2 . 3 0 3 9 f a x t e c h s u p p o r t @ a r c t u r . c o m w w w . a r c t u r . c o m
A P P L I C A T I O N N O T E #43
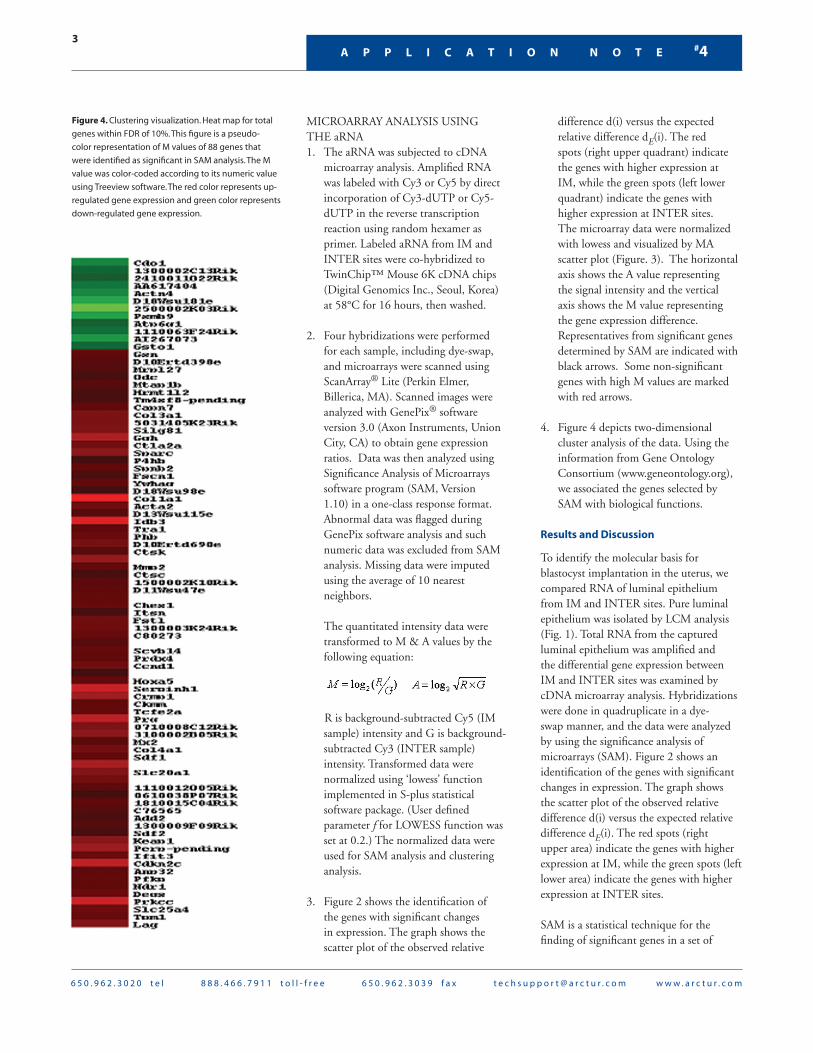
Figure 4. Clustering visualization. Heat map for total
genes within FDR of 10%. This figure is a pseudo-
color representation of M values of 88 genes that
were identified as significant in SAM analysis. The M
value was color-coded according to its numeric value
using Treeview software. The red color represents up-
regulated gene expression and green color represents
down-regulated gene expression.
MICROARRAY ANALYSIS USING THE aRNA1. The aRNA was subjected to cDNA
microarray analysis. Amplified RNA was labeled with Cy3 or Cy5 by direct incorporation of Cy3-dUTP or Cy5-dUTP in the reverse transcription reaction using random hexamer as primer. Labeled aRNA from IM and INTER sites were co-hybridized to TwinChip™ Mouse 6K cDNA chips (Digital Genomics Inc., Seoul, Korea) at 58°C for 16 hours, then washed.
2. Four hybridizations were performed for each sample, including dye-swap, and microarrays were scanned using ScanArray® Lite (Perkin Elmer, Billerica, MA). Scanned images were analyzed with GenePix® software version 3.0 (Axon Instruments, Union City, CA) to obtain gene expression ratios. Data was then analyzed using Significance Analysis of Microarrays software program (SAM, Version 1.10) in a one-class response format. Abnormal data was flagged during GenePix software analysis and such numeric data was excluded from SAM analysis. Missing data were imputed using the average of 10 nearest neighbors.
The quantitated intensity data were transformed to M & A values by the following equation:
R is background-subtracted Cy5 (IM sample) intensity and G is background-subtracted Cy3 (INTER sample) intensity. Transformed data were normalized using ‘lowess’ function implemented in S-plus statistical software package. (User defined parameter f for LOWESS function was set at 0.2.) The normalized data were used for SAM analysis and clustering analysis.
3. Figure 2 shows the identification of the genes with significant changes in expression. The graph shows the scatter plot of the observed relative
difference d(i) versus the expected relative difference dE(i). The red spots (right upper quadrant) indicate the genes with higher expression at IM, while the green spots (left lower quadrant) indicate the genes with higher expression at INTER sites. The microarray data were normalized with lowess and visualized by MA scatter plot (Figure. 3). The horizontal axis shows the A value representing the signal intensity and the vertical axis shows the M value representing the gene expression difference. Representatives from significant genes determined by SAM are indicated with black arrows. Some non-significant genes with high M values are marked with red arrows.
4. Figure 4 depicts two-dimensional cluster analysis of the data. Using the information from Gene Ontology Consortium (www.geneontology.org), we associated the genes selected by SAM with biological functions.
Results and Discussion
To identify the molecular basis for blastocyst implantation in the uterus, we compared RNA of luminal epithelium from IM and INTER sites. Pure luminal epithelium was isolated by LCM analysis (Fig. 1). Total RNA from the captured luminal epithelium was amplified and the differential gene expression between IM and INTER sites was examined by cDNA microarray analysis. Hybridizations were done in quadruplicate in a dye-swap manner, and the data were analyzed by using the significance analysis of microarrays (SAM). Figure 2 shows an identification of the genes with significant changes in expression. The graph shows the scatter plot of the observed relative difference d(i) versus the expected relative difference dE(i). The red spots (right upper area) indicate the genes with higher expression at IM, while the green spots (left lower area) indicate the genes with higher expression at INTER sites.
SAM is a statistical technique for the finding of significant genes in a set of

6 5 0 . 9 6 2 . 3 0 2 0 t e l 8 8 8 . 4 6 6 . 7 9 1 1 t o l l - f r e e 6 5 0 . 9 6 2 . 3 0 3 9 f a x t e c h s u p p o r t @ a r c t u r . c o m w w w . a r c t u r . c o m
microarray experiments. SAM uses repeated permutations of the data to determine if the expression of any gene is significantly related to the response variable (in this case, the difference between IM and INTER). In SAM, the relative difference d(i) for gene i is defined as:
where ri is a fold difference (or M value), si is a standard deviation, and s0 is a “fudge factor”. The expected relative difference dE(i) is the average of d(i)s from the data set generated by permutations. SAM calls a gene significant if the difference between d(i) and dE(i) is larger than user-provided threshold (delta value). For genes identifiedas significant, SAM estimates the percentage of genes identified by chance, the false discovery rate (FDR). For example, if 100 genes with 5% of FDR were selected, five genes among 100 genes are likely to be false positive.
In Figure 2, 88 genes were selected as significant in regard to gene expression changes with a FDR of 10%. Among them, 12 genes were negatively significant (green spots) and the rest were positively significant (red spots). Because we used intensities from the IM sample in the numerator portion of gene expression ratio, the positively significant genes could be interpreted as up-regulated genes in IM samples.
The microarray data from quadruplet hybridizations for each sample were normalized with LOWESS and visualized by MA scatter plot (Fig. 3). The horizontal axis of Figure 3 (Mean of A) represents the signal intensity and the vertical axis (Mean of M) represents the gene expression difference. Representatives from significant genes determined by SAM were indicated with black arrow. Some non-significant genes with high M values were marked with red arrows.
Figure 4 depicts clustering visualization
of our data. This figure is a pseudo-color representation of M values of 88 genes that were identified as significant in SAM analysis. The M value was color-coded according to its numeric value using Treeview software. The red color indicates up-regulated gene expression, while the green color indicates down-regulated gene expression.
Comparison by SAM revealed that 73 genes were more highly expressed at the IM site and 13 at the INTER site, showing higher expression within an estimated false discovery rate (FDR) of 0.163. These differentially expressed genes at each site were categorized based on the basis of the best available information regarding their biological functions. Among 73 highly expressed genes at the IM site, 6 were Expressed Sequence Tags (ESTs) and 14 were genes with unknown functions. The remaining 53 genes with known functions were categorized as being structural proteins (24, 45.3%) or as being related to metabolism (6, 11.3%), signal transduction (7, 13.2%), immune responsiveness action (6, 11.3%), cell cycling (4, 7.5%), gene/protein expression (4, 7.5%), and oxidative stress (2, 3.8%). Meanwhile, among 13 genes that were up-regulated at the INTER site, 2 were ESTs and 6 were genes with unknown functions. The remaining set of 5 genes had functions related to metabolism (3), gene/protein expression (1), and signal transduction (1) (data not shown). Among those 58 genes with known functions and are expressed at both IM and INTER sites, 13 (22.4%) genes were associated with Ca2+ for their functions and/or regulations.
Conclusions
In the present study, we compared the gene expression profiles of the luminal epithelial endometrium of implantation (IM) and interimplantation (INTER) sites to elucidate the genes involved in the process of embryo apposition prior to implantation using LCM, linear amplification of RNA and microarray analysis. The nature of these genes suggest and that active tissue remodeling is in progress at the
A P P L I C A T I O N N O T E #44
implantation sites before the embryonic attachment. Further, we propose that Ca2+ is a crucial regulatory factor, actively involved in this process. The list of genes identified may provide information regarding molecular mechanisms occurring at the implantation sites before embryo attachment and regulated by various embryonic factors.
References
1 Reese, J., Das, S.K., Paria, B.C., Lim, H., Song, H., Matsumoto, H., Knudtson, K.L., DuBois, R.N., Dey, S.K. (2001) Global gene expression analysis to identify molecular markers of uterine receptivity and embryo implantation. J Biol Chem, 276, 44137- 44145.
2 Carson, D.D., Lagow, E., Thathiah, A., Al-Shami, R., Farach-Carson, M.C., Vernon, M., Yuan, L., Fritz, M.A., Lessey, during the early to mid-luteal (receptive phase) transition in human endometrium detected by high-density microarray screening. Mol Human Reprod, 8, 871-879.
3 Yoon, S.J., Choi, D.H., Lee, W.S., Cha, K.Y., Kim, S.N., Lee, K.A. (2004) A molecular basis for embryo apposition at the luminal epithelium. Mol Cell Endocrinol, 219, 95-104.
The data described herein has been published, in part, in Yoon et al., Mol Cell Endocrinol, 219: 95-104, (2004).
Arcturus Bioscience, Inc.
400 Logue Avenue
Mountain View, CA
USA 94043
650.962.3020 tel
650.962.3039 fax
888.446.7911 toll-free
www.arctur.com
PN 14540-00 Rev A