differential spectral sensitivity in the optic tectum and
TRANSCRIPT

Differential Spectral Sensitivity
in the Optic Tectum
and Eye of the Turtle
ALLEN M. GRANDA and CHARLES E. STIRLING
From the Walter Reed Army Institute of Research, Washington, D. C. Mr. Stirling's presentaddress is Department of Physiology, Upstate Medical Center, The State University of NewYork, Syracuse
ABSTRACT Light flashes of calibrated wavelength and intensity were pre-sented to the turtle eye and electrical responses were simultaneously recordedfrom the cornea and the optic tectum. Spectral sensitivity curves derived fromcriterion-response levels showed a characteristic red-sensitive process at bothsites. At high criterion levels the two curves were quite similar. At low criterion-response levels the tectum showed an enhanced blue-green process not evidentin the peripheral record. The sensitivity to blue-green may correspond to pre-viously observed behavior.
INTRODUCTION
In the visual system of the turtle the signal registered by the receptors inte-grates and combines with other sensory information, and the more obviousplaces for this integration to occur are in the rich interconnections of theretina and at the first synapse thereafter, the optic tectum (cf. Fig. 1). Thislatter structure in reptiles is a complex system consisting of several layers(11, 12), the outer layer, the stratum opticum, receiving optic tract fiberswhich enter it along its ventral surface and pass dorsally. The synaptic connec-tions are made at various levels deeper within the structure where signalsalong the several incoming fiber tracts can be integrated and perhaps re-inforced by signals from other sensory systems. It has been claimed on ana-tomical grounds that the tectum functions as a highly developed correlatingcenter for several kinds of sensory information as well as an efferent center forthe transmission of impulses to the periphery (11, 14).
In the present study, electrical responses recorded from the optic tectum ofthe turtle have been compared with simultaneously recorded responses fromthe surface of the eye as a means for the assessment of afferent input and itspossible modification by later neural systems. Spectral sensitivity curves based
901
The Journal of General Physiology
brought to you by COREView metadata, citation and similar papers at core.ac.uk
provided by PubMed Central

902 THE JOURNAL OF GENERAL PHYSIOLOGY · VOLUME 48 - 965
C0
-
t)
.-
o
C-
ol

A. M. GRANDA AND C. E. STIRLING Sensitivity in Turtle Optic Tectum and Eye
on these responses were derived from the electrical measurements. Whateverdifferences that may be found can be attributed to changes in the relativesensitivity of intervening transmission systems.
METHODS
Stimulus System A diagram of the stimulus system is shown in the upper halfof Fig. 2. Light was supplied from a tungsten ribbon-filament lamp (SI) with current
SI
FIGURE 2. Diagram of stimulus and recording systems. All abbreviations are definedin the text.
maintained from a storage battery at 18 amperes by adjusting the voltage dropacross the filament. The beam was led by appropriate lenses (LI, , L3, L4) into aBausch and Lomb monochromator (Bausch and Lomb Optical Company, New York).The exit beam was then led by means of additional lenses (L5, L6, L7) and a mirror(M) into a series of three prisms terminating in an eyepiece (OPT). The final sectionof the system permitted focusing of the light beam in the plane of the animal's pupil.At the focal point of lens 3, a Wollensak-Alphax (Wollensak Co., Rochester, NewYork) heavy duty shutter (Sh) was placed to permit delivery of flashes of about 0.03second's duration. The onset time for the flash was less than 0.0025 second. A secondsource (S2), supplied by a tungsten automobile headlight, could be combined with
903

THE JOURNAL OF GENERAL PHYSIOLOGY - VOLUME 48 · 965
the light beam from the monochromator, when desired, by means of a beam splitter(BS). The superimposed beams subtended an angle of 7° at the eye.
The entrance and exit slits of the monochromator were set to allow a fall-off ofof 50 per cent full energy 8.25 m/k on either side of the nominal wavelength. For azero-order spectrum or white light, the intensity of the main path was about 830foot-lamberts; for light of wavelength 580 m/t, about 15.6 foot-lamberts. An RCA type930 phototube, calibrated by the National Bureau of Standards, was used to measurethe relative spectral emission of the stimulus system at the experimental wavelengths.The relative energy values used in the analysis were as follows: 400 mti-0.0 1, 440 mn/-0.29, 440 m/y--0.52, 460 m-0.72, 480 m/L--0.80, 500 m/--0.90, 520 miu 0.90,540 my--0.94, 560 m/--0.94, 580 mi--0.92, 600 mg--0.94, 620 m--0.93, 640 mn-0.99, 660 m/--0.94, 680 m,--0.96, 700 mA-0.93, 720 mg--0.88, 740 mA-0.76.
Recording Electrical responses from the eye were recorded from cotton-wickelectrodes placed on the cornea of the two eyes and moistened with physiologicalsaline solution. The signal from the active electrode placed on the stimulated eye wasled via an Ag-AgC1 electrode to the input grid of a Tektronix 122 preamplifier(Tektronix, Inc., Portland, Oregon) (TA 1 in Fig. 2) whose response was 3 db downat 0.8 cycles and 1 kc. This signal alternated with the stimulus marker (SM), a portionof stimulus light falling on a photocell, by means of an electronic switch (SW) andshared the lower beam of a dual-beam cathode-ray oscilloscope (CRO 2).
The tectal response was recorded between two stainless steel wire electrodes, each5 mils in diameter, and insulated except for the tip. The recorded potentials were ledto a second Tektronix 122 preamplifier (TA 2 in Fig. 2) with the same band widthas TA 1. The tectal response was then displayed on the upper beam of CRO 2. Theelectroretinogram (ERG), tectal response, and stimulus marker were photographedfrom the face of the oscilloscope by means of a Grass (Grass Instruments, Quincy,Mass.) kymograph camera. Measurements were made on the film record.
Subjects and Preoperative Procedure Six female turtles of the species Pseudemysscripta elegans, the common red-eared turtle, were used in the present study. Theyranged in length from 20 to 25 cm, and in weight from 1.4 to 1.8 kg. A week beforetesting, each animal was anesthetized with 2 cc/kg body wt 25 per cent solution tri-caine methane sulfonate (Sandoz MS-222, Sandoz Pharmaceuticals, Hanover, NewJersey). The skull was opened to expose the left tectal lobe and part of the caudal endof the left cerebral cortex. Two or three enamelled stainless steel electrodes were em-bedded in the tectum with one electrode placed in the posterior cortex for reference.We have found in agreement with Orrego (20) that this end of the cortex is un-affected by visual stimuli. The electrodes were fixed in place with dental cement andthe skin replaced and sutured. The animals recovered without ill effects after a fewhours and were allowed to recuperate over several days.
Experimental Procedure For the experiment proper, each animal was injectedwith 2 to 4 cc tubocurarine chloride (15 mg/cc) sufficient to produce completeparalysis. A respirator was connected via cannula into the thorax for breathing. Sub-cutaneous injections of atropine sulfate (1 cc 10 per cent solution) were used to preventexcessive mucous formation and for mydriasis. The animal was then aligned with thestimulus light and cotton-wick electrodes adjusted to each eye. At the end of an ex-perimental run, each animal was either injected intramuscularly with sufficient
904

A. M. GRANDA AND C. E. STIRLING Sensitivity in Turtle Optic Tectum and Eye
prostigmine sulfate to counteract the tubocurarine, or else sacrificed for histologicalexamination.
Colored light flashes were presented at 20 m/t intervals between the wavelengthlimits of 400 and 740 m~/. Each wavelength was presented in an intensity series cover-ing 2 to 3 log units. The series were presented under conditions of dark-adaptation;i.e., the animal was left in a completely darkened cage for at least 40 minutes priorto the first stimulus flash. The flashes were separated by a dark interval of 2 minutesto allow recovery from their effects. The results to be described from the tectum arebased on means derived from six animals. The electroretinographic results, on theother hand, are based on a mean of two animals. In the other four animals completecurves were not obtained due to electrode movement and consequent discrepancieswith corneal placements. The curves from the two animals accord very well withprevious work (1, 8, 9).
RESULTS
Response Waveforms Responses from the two recording sites are shown inFig. 3. The records are responses to light stimuli of highest available intensityat the normal wavelengths listed in the margins. The upper trace is from theoptic tectum, positivity downward; the middle trace is the electroretinogram,positivity upward; the lowest trace is the stimulus-onset marker. It may benoted that the evoked tectal potentials are extremely complex and formed ofseveral peaks. With longer wavelength stimuli, i.e. flashes near 640 mat, theevoked response reaches its greatest amplitude. The accompanying electro-retinograms show this same sensitivity to red light and are very much rippledin that portion of the spectrum (9). Of interest is the relative duration of theresponse complex. The tectal response lasts quite a long time although theduration is dependent on both wavelength (Fig. 3) and intensity (Fig. 4).For example, in Fig. 3 at high intensity levels and also at the sensitive red endof the spectrum, the tectum shows a clear, well defined waveform having animplicit time; i.e., time from stimulus onset to the first peak, of about 80 to85 milliseconds. The response quickly returns to the baseline and shows littlefurther variation. However, at low intensity values and also at the shorterwavelengths, regardless of the level of intensity, the response appears to lastfor some time, even up to a second or more. Its form is difficult to identify,usually consisting of a principal deflection followed by a long train of minorvariations. The long duration of evoked potentials has been noted in thesensory systems of several animals (3, 4, 15).
The electroretinogram shows an implicit time to the highest peak of theb-wave of about 80 to 90 milliseconds in the long wavelengths similar to thatfound in the tectum. However, the response waveform in almost all casesreturns smoothly to the base line and no comparable long-train deflectionsoccur such as were observed in the tectal record. A comparison of implicittimes shows the b-wave of the ERG to precede the tectal response for dim light
905

580
420
44C
460
48C
600
620
640
660
680
700
720
740
500
52C
56C
IOOJv TECTUM I ERGI 200MSEC I-
FIGURE 3. Electrical responses from eye and tectum to light of maximum intensity,not necessarily of equal energy. The upper trace is from optic tectum, positivity down-ward. ERG is recorded on middle trace, positivity upward. Stimulus onset marker isshown on lower trace. Duration of stimulus, 30 milliseconds. Numbers in right and leftmargins refer to nominal wavelengths measured in millimicrons (see text). Amplitudecalibrations of 100 /zv for both tectum and ERG are shown in the bottom margin as wellas a time calibration of 200 milliseconds.
906
5
400

W 520 640
0.0
0.3
0.6
1.0
1.3
1.6
2.0
2.3
IOO10 V TECTUM I ERG I 200MsEc F -
FIGURE 4. Electrical responses from eye and tectum. Identification of traces identicalto Fig. 3. Headings on each column refer to color or wavelength of stimulus light: W
is "white light"; 520 and 640 are nominal wavelengths in millimicrons. Numbers in
left margin are density units of neutral filtering interposed in the stimulus path. Cali-
brations are defined in legend to Fig. 3.
907
I- ·
l
Al
l
ll
I
l
THE JOURNAL OF GENERAL PHYSIOLOGY - VOLUME 48 1965
I-
zLdHzH
LH
ti-j9
(D
-
0r
c7
(SllOA0dIV31 001) 30fnlIldVV 3SNOdS38
0
'C
-C
-
aa.E
C
Cu
o
o
E
6C
.-
tE
.S
X,
o
o
3
X >
ma
Ya
,
908
CDIXw

A. M. GRANDA AND C. E. SRLING Sensitivity in Turtle Optic Tectum and Eye
and short wavelengths. However, for red light and/or higher intensities thetectal implicit time is frequently shorter than the peak of the b-wave. Thea-wave of the ERG generally precedes the tectal response. This picture issimilar to the results obtained by Crampton and Boggs (5), and Armingtonand Crampton (2) in their work on the chicken.
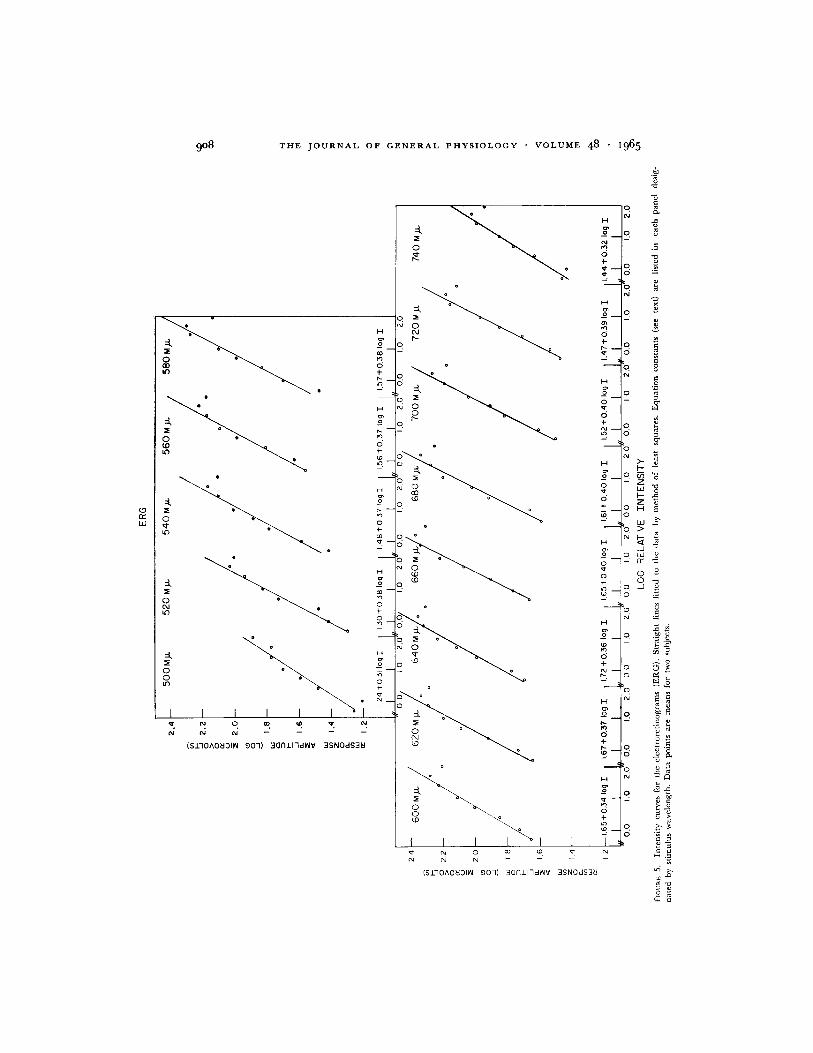
Intensity Curves The largest excursion (most negative to most positivepoint within a period of 350 milliseconds) of each ERG was measured and theamplitude values in microvolts were plotted in Fig. 5 as a function of stimulusintensity. The ordinate values of response amplitude were transformed into
TABLE I
STANDARD ERRORS OF ESTIMATEAND CORRELATIONS BETWEEN RESPONSE AMPLITUDES
AND STIMULUS INTENSITIES
Standard error Correlation Standard error CorrelationWavelength ERG (r) Tectum (r)
460 0.40 0.88480 0.37 0.90
500 0.25 0.95 0.38 0.90520 0.09 0.99 0.37 0.90540 0.16 0.98 0.35 0.92560 0.15 0.98 0.34 0.92580 0.22 0.96 0.30 0.94
600 0.09 0.99 0.26 0.95620 0.14 0.98 0.20 0.97640 0.16 0.98 0.22 0.97660 0.13 0.99 0.15 0.98680 0.15 0.98 0.17 0.98
700 0.11 0.99 0.21 0.97720 0.11 0.99 0.26 0.95740 0.16 0.98 0.23 0.96
logarithmic equivalents and a straight line fitted to the experimental datapoints for each wavelength by the method of least squares. The response ampli-tude value corresponding to the highest intensity was not included in thedetermination, this omission being justified by the fit to the remaining points.The constants of the general equation: log R = log a + b log I, where R isthe response amplitude, I is a measure of stimulus intensity, and a and b areintercept (for relative point 0.0) and slope constants respectively, are listed ineach panel of Fig. 5 for the several wavelengths. There was a correlation (r)better than 0.95 between all values of log R and log I (see Table I). Thestandard errors of estimated intensity from a particular response amplitude
value [SEI. = N--1 I (1- r)are also listed in Table I and may be
909

o03
0
0Oto
0
DoUC\IllLO:i ,,
Ha,
d_ _
6
I,
*
H
d
a3
0
H
.I-S-_6--drn
H
d_o0
-
H
do0_
4-
H
ao09a-
6
d
_4-
H
N -6
a
o
0
I.
\:*\
o
l l l l l
N 9 0 (O N N - _ _
D
',J
CM Io
d ~
rl
q90
0
d =
0
NE
00
9
dA
90 N o
9
O0
N
9
q o
_0_. 0
0
N
0
0 OO0CD 0
I A ( l l0
N N N
SliOAO'dIW 901 - 30lfldWV 3SNOdS38
0
0
ad
H
c0"-
H
NI-
H
0
4-
H
o
0
0
D-o,N
'a)
_.
0
2-*
N
910
N
o
0 20
o o,N .
o C
0 w
0
o O
9 n
.,
9 HC
O
,.
0 O
Z B
0U)
0o
(0
o
IT
: I
=kn
O
IR ll c
A. M. GRANDA AND C. E. STIRLING Sensitivity in Turtle Optic Tectum and Eye
understood as a statement of the limits of confidence when substituted in the
expression, CL 95per cent = , - (1.96 X sEI.R)
Intensity curves for the tectal responses are shown in Fig. 6. The measure-ments were taken from the response in the same way as from the electro-retinogram. Straight lines to these data were also fitted by the method of least
I I2
I-
zwCl
w
4-jw
0-J
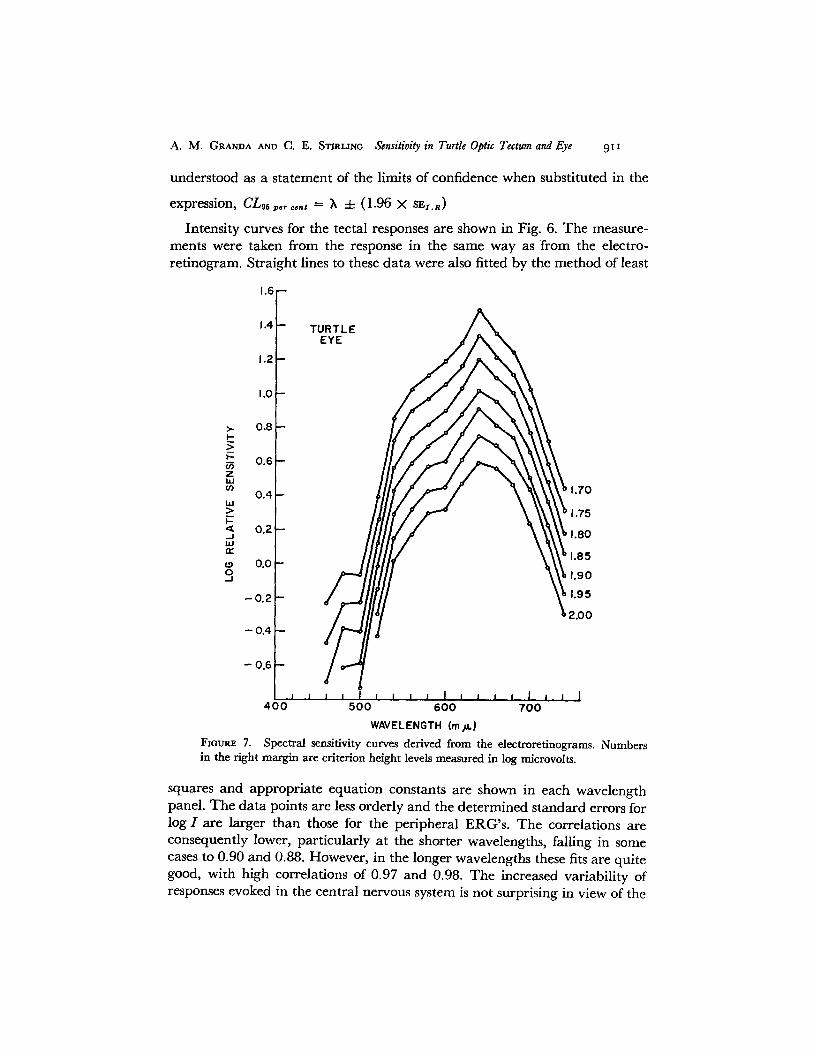
WAVELENGTH (mA)FIGURE 7. Spectral sensitivity curves derived from the electroretinograms. Numbersin the right margin are criterion height levels measured in log microvolts.
squares and appropriate equation constants are shown in each wavelengthpanel. The data points are less orderly and the determined standard errors forlog I are larger than those for the peripheral ERG's. The correlations areconsequently lower, particularly at the shorter wavelengths, falling in somecases to 0.90 and 0.88. However, in the longer wavelengths these fits are quitegood, with high correlations of 0.97 and 0.98. The increased variability ofresponses evoked in the central nervous system is not surprising in view of the
9I1
THE JOURNAL OF GENERAL PHYSIOLOGY VOLUME 48 · 965
enormous complexity of central neural connections, a fact commented on byIngvar (13) and Crescitelli (6).
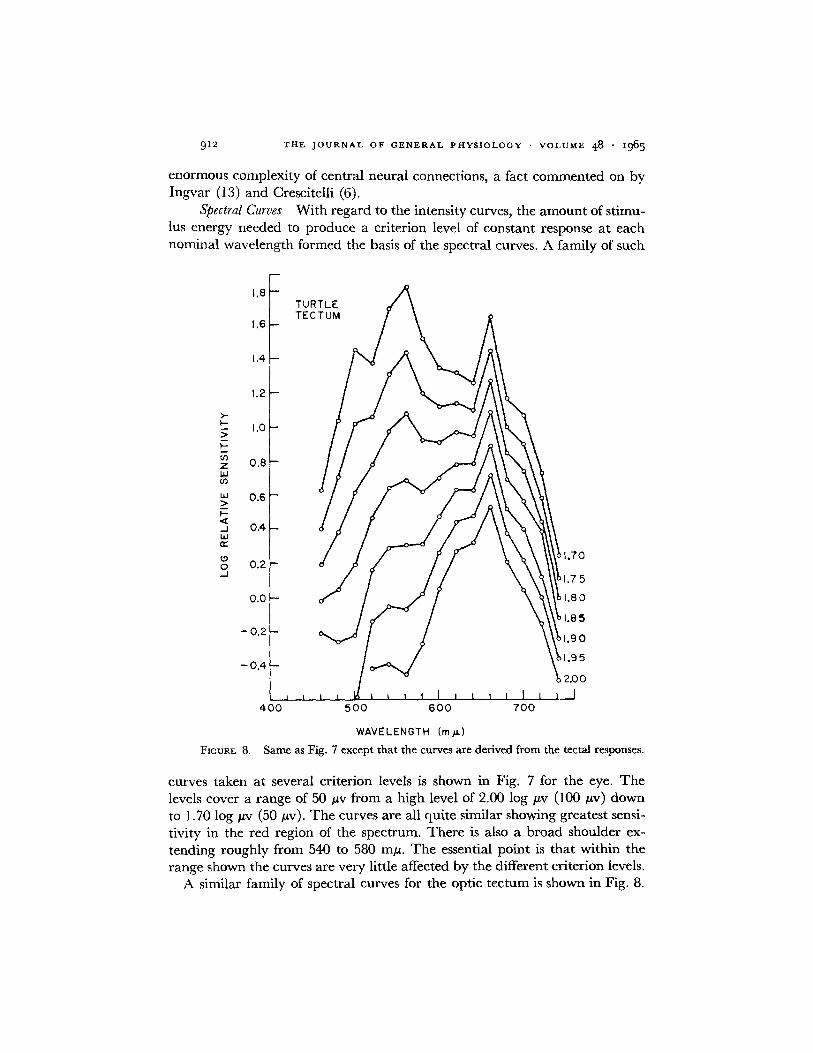
Spectral Curves With regard to the intensity curves, the amount of stimu-lus energy needed to produce a criterion level of constant response at eachnominal wavelength formed the basis of the spectral curves. A family of such
u,zwUn
w
4
cr0-j
0
5
0
5
0
5
)0
400 500 600 700
FIGURE 8. Same as Fig.
WAVELENGTH (mA)
7 except that the curves are derived from the tectal responses.
curves taken at several criterion levels is shown in Fig. 7 for the eye. Thelevels cover a range of 50 ytv from a high level of 2.00 log ,tv (100 Mv) downto 1.70 log Mv (50 Av). The curves are all quite similar showing greatest sensi-tivity in the red region of the spectrum. There is also a broad shoulder ex-tending roughly from 540 to 580 my. The essential point is that within therange shown the curves are very little affected by the different criterion levels.
A similar family of spectral curves for the optic tectum is shown in Fig. 8.
912

A. M. GRANDA AND C. E. STIRLING Sensitivity in Turtle Optic Tectum and Eye
They also cover the same range of criterion values. These spectral curves arebased on the corresponding intensity curves of Fig. 6, and derived in a mannerexplained above. At the high criterion value of 2.00 log v, the tectal curvealso peaks in the red region and falls off in the far red. On the shorter wave-length side of the peak there is a small indication of a process at 600 to 620 mu,as well as a slight, broad shoulder, much less sensitive, at 540 to 560 m#q.Generally, this high criterion curve is not too dissimilar from the spectral
1.6
1.4
1.2
1.0I-
z
-J
0
-J
n
oJ
0.8
0.6
0.4
0.2
0.0
-0.2
0.4
4UU
MAT(
I I I l I I i I I500 600
WAVELENGTH (ma)
I I , , I
FIGURE 9. Matched spectral curves for the eye and the tectum (see text). Curves arefrom a single animal.
curves derived from the eye. Most noteworthy, however, at lower criteria, isthe gradual emergence of an increased sensitivity in the blue-green portion ofthe spectrum, peaking near 540 to 560 moi, and which is as sensitive as thestill present 650 to 660 mj process. The shoulder at 600 to 620 mix is no longerdistinguishable.
Matched Curves The respective spectral curves of both eye and tectumcan be more profitably compared if the amount of stimulus energy necessary
........... I I I ~ I I m
700
913
_
_
_
_
_
_
_
_
_
_
_
A ~
THE JOURNAL OF GENERAL PHYSIOLOGY · VOLUME 48 · 965
to evoke a constant response at one site, e.g., the eye, can be matched to aparticular criterion level for the tectum. The match must be done at an arbi-trary meeting point, in this case 660 my as this point represents the nominalpeak value of the tectal spectral curve. Thus, the amount of stimulus energynecessary to evoke from the eye a criterion response of 1.70 log /tv at 660 m/,would, by definition of the match, evoke a response at the tectum of 1.78 log/uv at this same nominal wavelength. These two values, 1.70 log v and 1.78log tuv then determined the criterion levels for the eye and tectum, respec-tively, at all experimental wavelengths. The resulting two curves are shownin Fig. 9. It may be seen that the two curves cover approximately the samerange in sensitivity, about 1.4 to 1.6 log units. The tectal curve shows the twoprominent peaks mentioned in the previous section and is somewhat morebroad than the curve from the eye. The results are similar to that shown forthe lower criterion values of Fig. 8. Of particular interest is that even formatched stimulus light energies, the enhancement of the blue-green process isfound only centrally.
DISCUSSION
The spectral curves derived from the ERG are very similar to previous workin almost all details (1, 8, 9). Of particular note is the fall-off in sensitivity atthe shorter wavelengths or blue end of the visible spectrum. Toward theshorter wavelengths sensitivity is quite low by 500 m/u, a loss of almost oneand a half log units from the long wavelength peak. The presence then of ablue-green process in the tectum not readily apparent in the peripheral recordimplies some change or interaction occurring in the afferent pathway whichcan modify the sensory message (7, 13, 16).
It may be argued that the tectal blue-green response (see Fig. 8) is mostevident at low criterion levels, indeed, it appears to be reciprocally related tocriterion height; e.g., it is most apparent at the lower criterion height of1.75 log /,v. If the blue-green receptors are few in number and/or havethresholds below that of the red receptors, then such a family of spectral curvesas shown in Fig. 8 could be reasonably deduced. The peak near 530 mt, ap-pears when the stimulus is sufficiently below that of the red receptors to excitemainly the blue-green receptor group. At stronger stimulus levels, the blue-green peak is simply masked by the greater number of red receptors whosethreshold has now been exceeded. The assumption must be made, of course,of overlapping sensitivities for the groups of receptors involved. Now, if thiswere the case, then such sensitivity must also be reflected in the peripheralspectral curves, bearing in mind that the ERG is a massed response originat-ing within the retina, probably just beyond the receptor layer. Whatever ex-
914

A. M. GRANDA AND C. E. STIRLING Sensitivity in Turtle Optic Tectum and Eye
planation offered concerning the relationship of receptors to tectal spectralsensitivity certainly must include the entire retina as well.
In the peripheral curves the whole system may be interpreted as shifteddown in gain so that a corresponding shorter wavelength peak is not at allevident because the stimulus intensity values are too high. Some evidence infavor of this interpretation has been gathered in recordings where an averag-ing technique has followed the eye's response down to very low levels of light.At such low values a small blue-green peak is evident, but in no case does itmatch in sensitivity the long wavelength end of the spectrum. What thismeans is that although there is a blue-green input system at the periphery, theweighting of its sensitivity relative to one for red light must change enormouslyat a later stage in the visual system.
Such change in the afferent message need not be surprising for it is the taskwe would assume to be accomplished by a rich internuncial network such asis found in the optic tectum. Indeed, whatever message were transmittedcentrally must integrate with other information from the sensorium,"integration" meaning suitable modification of the sensory message conso-nant with some survival value for the organism. This is not to suggest a cominginto being de novo of information in the central nervous system, for it cannotbe doubted that whatever blue-green sensitivity is evident in the visual systemis first received by the eye's receptor mechanism and then sent centrally.
Recently Muntz (17, 18, 19), in his work on the frog, revived Hooker's (10)explanation of a positive phototaxis to blue light in the turtle. Hooker be-lieved that turtles hatched on land orient themselves to water by the bluerlight over the sea relative to the longer wavelengths of the land. Once in thewater, the deeper blue is instrumental in attracting the animal away from itsenemies near the shoreline. While the results presented here may not beequated to vision in the turtle, nevertheless more blue sensitivity recorded ata more central stage in the visual system fits in quite well with observedbehavior.
SUMMARY
1. A comparison of the spectral sensitivity of the eye and optic tectum in theturtle was investigated with electrophysiological techniques. Potentials in re-sponse to light flashes at various wavelengths and intensities were measuredand compared during simultaneous recording.
2. Implicit times to the highest peak of the b-wave in the ERG were verysimilar to implicit times for the first peak of the tectal response, about 80 to90 milliseconds. The a-wave of the ERG generally preceded the tectal evokedpotential.
3. At high criterion levels of response, 2.0 log g/v, the spectral sensitivity
915

THE JOURNAL OF GENERAL PHYSIOLOGY VOLUME 48 1965
curves of the eye and tectum are very much alike showing a characteristic redprocess. At lower criterion values near 1.70 log v, the tectum shows anenhanced blue-green process not evident in the peripheral record.
We wish to thank Dr. Guy C. Sheatz for advice concerning the electrodes.Received for publication, August 20, 1964.
REFERENCES
1. ARMINGTON, J. C., Spectral sensitivity of the turtle, Pseudemys, J. Comp. andPhysiol. Psychol., 1954, 47, 1.
2. ARMINGTON, J. C., and CRAMPTON, G. H., Comparison of spectral sensitivity atthe eye and the optic tectum of the chicken, Am. J. Ophth., 1958, 46, 72.
3. BRAZIER, M. A. B., Long-persisting electrical traces in the brain of man and theirpossible relationship to higher nervous activity, Electroencephalog. and Clin.Neurophysiol., Moscow Colloquium, 1960, (H. H. Jasper and G. D. Smirnov,editors), suppl. 13, 347.
4. CHANG, H. T., The evoked potentials, in Handbook of Physiology, (John Field,editor), Washington, American Physiological Society, 1959, section 1, chapter12, 299.
5. CRAMPTON, G. H., and BOGGs, N., Latencies of the ERG and optic tectum evokedpotentials in the chicken, Am. J. Physiol., 1959, 196, 1067.
6. CRESCITELLI, F., Physiology of vision, Ann. Rev. Physiol., 1960, 22, 525.7. CRESCITELLI, F., Some characteristics of on- and off-responses to flash of colored
light in ground squirrel visual system, J. Neurophysiol., 1962, 25, 141.8. DEANE, H. W., ENROTH-CUGELL, C., GONGAWARE, M. S., NEYLAND, M., and
FORBES, A., Electroretinogram of the fresh-water turtle: Form and spectralsensitivity, J. Neurophysiol., 1958, 21, 45.
9. GRANDA, A. M., Electrical responses of the light- and dark-adapted turtle eye,Vision Research, 1962, 2, 343.
10. HOOKER, D., Certain reactions to color in the young loggerhead turtle, CarnegieInst. Wash. Publ., 1911, 132, 69.
11. HUBER, G. C., and CROSBY, E. C., A phylogenetic consideration of the optictectum, Proc. Nat. Acad. Sc., 1933, 19, 15.
12. HUBER, G. C., and CROSBY, E. C., The reptilian optic tectum, J. Comp. Neurol.,1933, 57, 57.
13. INGVAR, D. H., Spectral sensitivity, as measured in cerebral visual centres, Astudy of responses to monochromatic flicker in the unanaesthetized cat, Acta.physiol. Scand., 1959, 46, Suppl. 159.
14. KAPPERS, C. U. A., HUBER, G. C., and CROSBY, E. C., The Comparative Anatomyof the Nervous System of Vertebrates, Including Man, New York, Macmillanand Company, Limited, 1936.
15. KONISHI, J., Electric response of visual center in fish especially to electric lightflash, Jap. J. Physiol., 1960, 10, 13.
16. LENNOX, M. A., and MADSEN, A., Cortical and retinal responses to colored lightflash in anesthetized cat, J. Neurophysiol., 1955, 18, 412.
9,6

A. M. GRANDA AND C. E. STIRLING Sensitivity in Turtle Optic Tectum and Eye 917
17. MUNTZ, W. R. A., Microelectrode recordings from the diencephalon of the frog(rana pipiens) and a blue-sensitive system, J. Neurophysiol., 1962, 25, 699.
18. MUNTZ, W. R. A., Effectiveness of different colors of light in releasing the positivephototatic behavior of frogs, and a possible function of the retinal projection tothe diencephalon, J. Neurophysiol., 1962, 25, 712.
19. MUNTZ, W. R. A., The development of phototaxis in the frog (rana temporaria),J. Exp. Biol., 1963, 40, 371.
20. ORREGO, F., The reptilian forebrain. I. The olfactory pathways and corticalareas in the turtle, Arch. ital. biol., 1961, 99, 425.