diffuse interstellar bands in emission
TRANSCRIPT

PoS(SSC2015)045
Diffuse Interstellar Bands in Emission
T.B. Williams*
South African Astronomical ObservatoryPO Box 9, Observatory 7935, South Africa
E-mail: [email protected]
Peter J. SarreSchool of Chemistry, The University of NottinghamNottingham NG7 2RD, UK
E-mail: [email protected]
Kristine SpekkensDepartment of Physics, Royal Military College of CanadaPO Box 17000, Station Forces, Kingston ON K7K 7B4, XNS CanadaE-mail: [email protected]
Rachel Kuzio de NarayDepartment of Physics and Astronomy, Georgia State University
25 Park Place, Atlanta GA 30303 USAE-mail: [email protected]
Charlotte C.M. MarshallSchool of Chemistry, The University of NottinghamNottingham NG7 2RD, UKE-mail: [email protected]
Recent Fabry-Pérot observations towards the galaxy NGC 1325 with the Southern AfricanLarge Telescope (SALT) led to the serendipitous discovery of an emission feature centered at661.3 nm arising from material in the interstellar medium (ISM) of our Galaxy; this emissionfeature lies at the wavelength of one of the sharper and stronger diffuse bands normally seen inabsorption. The flux of the feature is 4.2 ± 0.5 x 10⁻¹⁸
e s-1 cm-2 arc-sec-2. It appears that this is thefirst observation of emission from a diffuse band carrier in the ISM, excited in this case by theinterstellar radiation field. We present the discovery spectra and describe follow-upmeasurements proposed for SALT.
SALT Science Conference 2015 -SSC2015-1-5 June, 2015Stellenbosch Institute of Advanced Study, South Africa
*Speaker
Copyright owned by the author(s) under the terms of the Creative Commons Attribution-NonCommercial-NoDerivatives 4.0 International License (CC BY-NC-ND 4.0). http://pos.sissa.it/

PoS(SSC2015)045
Diffuse Interstellar Bands in Emission TB Williams
1.Introduction
The longest-standing problem in astronomical spectroscopy is the identification of thecarriers of the diffuse interstellar absorption bands (DIBs), the first systematically studiedexamples of which were investigated by Merrill [1] on photographic plates over 80 years ago.Most researchers consider a population of large carbon-based molecules to be responsible forthe DIBs (see for example Douglas [2], Léger & d'Hendecourt [3], Kroto et al. [4], andCampbell et al. [5]). Identification of the carriers would open a new probe of interstellarconditions and processes in interstellar clouds and could have implications far beyond -including the role of such molecules in star and planet formation and even for the origins of life.Only one clear-cut example exists where complementary emission (from a subset) of DIBs isseen – in the Red Rectangle nebula – where the emission is excited by radiation from the centralstar HD 44179 (see Sarre [6], Fossey [7], and Scarrott et al. [8], but questioned by Glinski &Anderson [9]).
2.Observations and Data Reductions
As part of the RINGS (RSS Imaging and spectroscopic Nearby Galaxy Survey) program(Mitchell et al. [10]), we observed the galaxy NGC 1325 (l = 212° b = -55°) on the nights of 01November 2011 and 28 December 2011, using the Fabry-Pérot (FP) medium resolution mode ofthe Robert Stobie Spectrograph (RSS) on the Southern African Large Telescope (SALT). Oneach night we took 23 exposures, each of 60 second duration, covering the spectral range from658.7 nm to 663.1 nm in equally spaced 0.2 nm steps, to measure the Hα emission from thegalaxy. The spectral resolution of each image was 0.4 nm. The images cover the full 8 arc-minute field of view of the telescope. The seeing on the two nights was 1.8 and 2.0 arc-secondsFWHM, respectively. Twilight sky flats were obtained with the spectrograph configured as forthe observations, but without the FP etalon. We also observed similar scans for the galaxyNGC 2280 (l = 237° b = -14°) on the same nights.
The RSS medium resolution FP system is designed to operate with two etalons in series,using a lower resolution etalon to block adjacent interference orders of the medium resolutionetalon. Full details of the system are given in Rangwala et al. [11]. Mechanical flexures in thespectrograph have precluded this dual-etalon operation, and the data described here were takenwith only the medium resolution etalon and an interference filter, admitting three successiveorders of the etalon. Thus each point in the image receives light from three wavelengths,separated by the 7.5 nm free spectral range of the etalon. This wavelength ambiguity can lead topossible confusion in interpreting the data, and will be addressed in detail below.
Light that reaches different points in the image illuminates the FP etalon at different anglesin the collimated beam, producing a radial wavelength gradient in each image. The wavelengthvaries quadratically with radius, with the outer edge of the image approximately 2.4 nm bluerthan the center. Thus a uniform monochromatic illumination of the telescope focal planeproduces a circular ring in the image, with the radius of the ring related to the wavelength of theillumination. Night sky OH emission features (see Osterbrock, et al. [12]) produce such rings in
2
PoS(SSC2015)045
Diffuse Interstellar Bands in Emission TB Williams
our images. These features are useful for calibrating the wavelengths of our spectra, but mustthen be subtracted from the images in order to properly analyze the galaxy spectrum. In order tobetter measure the night sky emission, we calculate the median of all the images in each galaxyscan and subtract this median image from each of the individual images. This removes thecontinuum and leaves the emission in each image. We then identify the OH emission features inthe median-subtracted images and use them to calculate the wavelength calibration, achievingan accuracy of 0.01 nm RMS.
3.Results
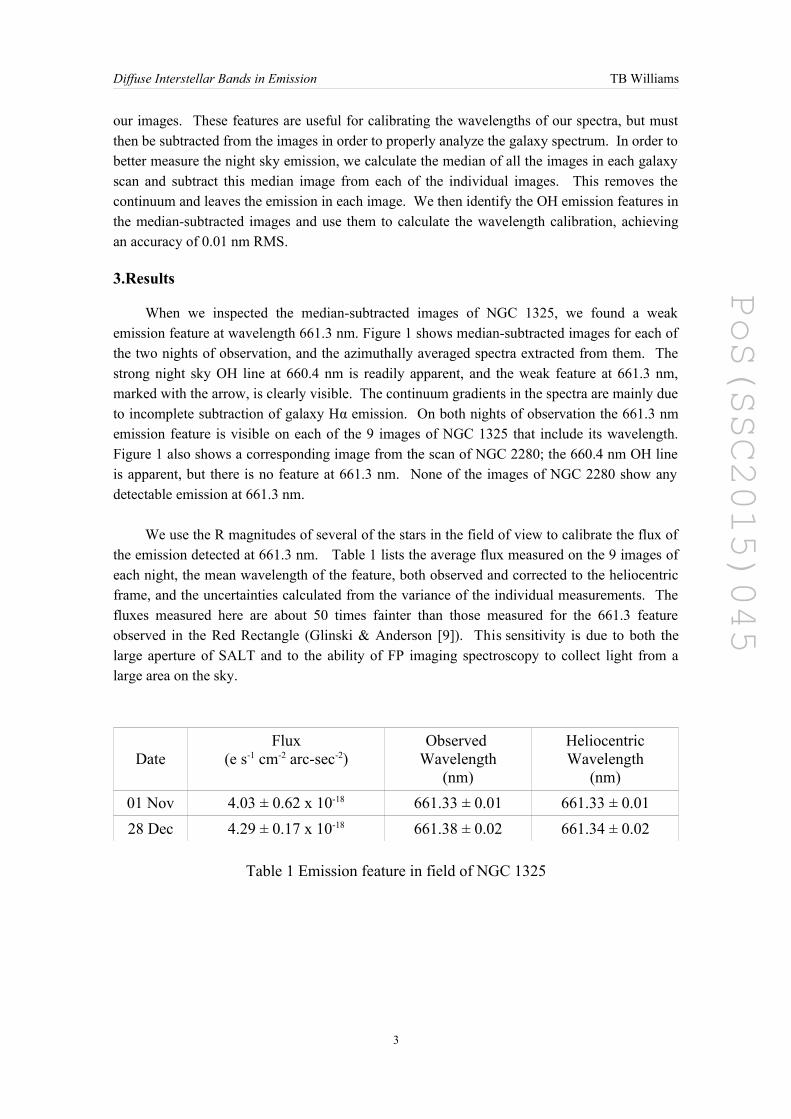
When we inspected the median-subtracted images of NGC 1325, we found a weakemission feature at wavelength 661.3 nm. Figure 1 shows median-subtracted images for each ofthe two nights of observation, and the azimuthally averaged spectra extracted from them. Thestrong night sky OH line at 660.4 nm is readily apparent, and the weak feature at 661.3 nm,marked with the arrow, is clearly visible. The continuum gradients in the spectra are mainly dueto incomplete subtraction of galaxy Hα emission. On both nights of observation the 661.3 nmemission feature is visible on each of the 9 images of NGC 1325 that include its wavelength.Figure 1 also shows a corresponding image from the scan of NGC 2280; the 660.4 nm OH lineis apparent, but there is no feature at 661.3 nm. None of the images of NGC 2280 show anydetectable emission at 661.3 nm.
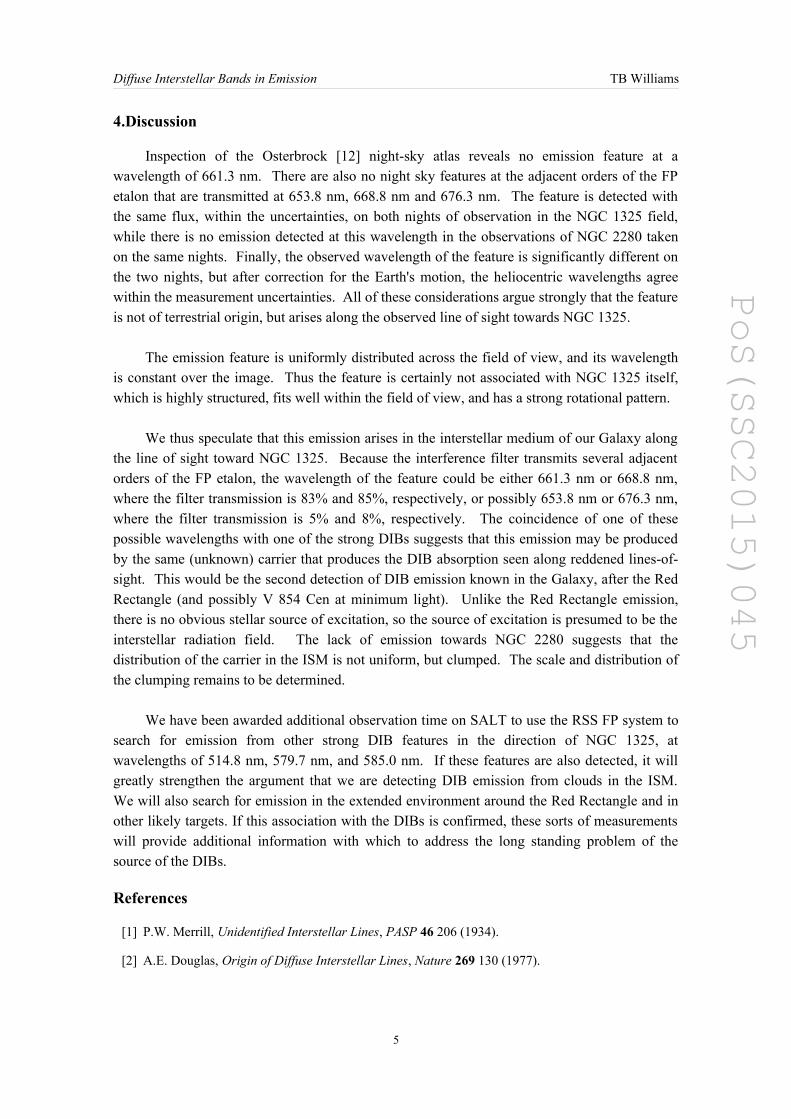
We use the R magnitudes of several of the stars in the field of view to calibrate the flux ofthe emission detected at 661.3 nm. Table 1 lists the average flux measured on the 9 images ofeach night, the mean wavelength of the feature, both observed and corrected to the heliocentricframe, and the uncertainties calculated from the variance of the individual measurements. Thefluxes measured here are about 50 times fainter than those measured for the 661.3 featureobserved in the Red Rectangle (Glinski & Anderson [9]). This sensitivity is due to both thelarge aperture of SALT and to the ability of FP imaging spectroscopy to collect light from alarge area on the sky.
DateFlux
(e s-1 cm-2 arc-sec-2)Observed
Wavelength(nm)
HeliocentricWavelength
(nm)
01 Nov 4.03 ± 0.62 x 10⁻¹⁸ 661.33 ± 0.01 661.33 ± 0.01
28 Dec 4.29 ± 0.17 x 10⁻¹⁸ 661.38 ± 0.02 661.34 ± 0.02
Table 1 Emission feature in field of NGC 1325
3

PoS(SSC2015)045
Diffuse Interstellar Bands in Emission TB Williams
Figure 1. Sample FP images and spectra. Top row: NGC 1325 on 01 Nov. 2011;middle row: NGC 1325 on 28 Dec. 2011; bottom row: NGC 2280 on 01 Nov.2011. Left column: median-subtracted images; right column: azimuthally-averaged spectra. Red arrow indicates 661.3 nm emission. Emission is presentin all NGC 1325 images that contain that wavelength, absent in all NGC 2280images.
4
PoS(SSC2015)045
Diffuse Interstellar Bands in Emission TB Williams
4.Discussion
Inspection of the Osterbrock [12] night-sky atlas reveals no emission feature at awavelength of 661.3 nm. There are also no night sky features at the adjacent orders of the FPetalon that are transmitted at 653.8 nm, 668.8 nm and 676.3 nm. The feature is detected withthe same flux, within the uncertainties, on both nights of observation in the NGC 1325 field,while there is no emission detected at this wavelength in the observations of NGC 2280 takenon the same nights. Finally, the observed wavelength of the feature is significantly different onthe two nights, but after correction for the Earth's motion, the heliocentric wavelengths agreewithin the measurement uncertainties. All of these considerations argue strongly that the featureis not of terrestrial origin, but arises along the observed line of sight towards NGC 1325.
The emission feature is uniformly distributed across the field of view, and its wavelengthis constant over the image. Thus the feature is certainly not associated with NGC 1325 itself,which is highly structured, fits well within the field of view, and has a strong rotational pattern.
We thus speculate that this emission arises in the interstellar medium of our Galaxy alongthe line of sight toward NGC 1325. Because the interference filter transmits several adjacentorders of the FP etalon, the wavelength of the feature could be either 661.3 nm or 668.8 nm,where the filter transmission is 83% and 85%, respectively, or possibly 653.8 nm or 676.3 nm,where the filter transmission is 5% and 8%, respectively. The coincidence of one of thesepossible wavelengths with one of the strong DIBs suggests that this emission may be producedby the same (unknown) carrier that produces the DIB absorption seen along reddened lines-of-sight. This would be the second detection of DIB emission known in the Galaxy, after the RedRectangle (and possibly V 854 Cen at minimum light). Unlike the Red Rectangle emission,there is no obvious stellar source of excitation, so the source of excitation is presumed to be theinterstellar radiation field. The lack of emission towards NGC 2280 suggests that thedistribution of the carrier in the ISM is not uniform, but clumped. The scale and distribution ofthe clumping remains to be determined.
We have been awarded additional observation time on SALT to use the RSS FP system tosearch for emission from other strong DIB features in the direction of NGC 1325, atwavelengths of 514.8 nm, 579.7 nm, and 585.0 nm. If these features are also detected, it willgreatly strengthen the argument that we are detecting DIB emission from clouds in the ISM.We will also search for emission in the extended environment around the Red Rectangle and inother likely targets. If this association with the DIBs is confirmed, these sorts of measurementswill provide additional information with which to address the long standing problem of thesource of the DIBs.
References
[1] P.W. Merrill, Unidentified Interstellar Lines, PASP 46 206 (1934).
[2] A.E. Douglas, Origin of Diffuse Interstellar Lines, Nature 269 130 (1977).
5

PoS(SSC2015)045
Diffuse Interstellar Bands in Emission TB Williams
[3] A. Léger, L. d'Hendecourt, Are polycyclic aromatic hydrocarbons the carriers of the diffuse interstellar bands in the visible?, A&A 146 81 (1985).
[4] H.W. Kroto, J.R. Heath, S.C. O'Brian, S.C.Curl, R.E. Smalley, C(60): Buckminsterfullerene, Nature318 162 (1985).
[5] E.K. Campbell, M. Holz, D. Gerlich, J.P. Maier, Laboratory confirmation of C60+ as the carrier of
two diffuse interstellar bands, Nature 523, 322 (2015).
[6] P.J. Sarre, Diffuse Bands in Emission, Nature 351 356 (1991).
[7] S.J. Fossey, Red Rectangle Emission, Nature 353 393 (1991).
[8] S.M. Scarrott, S. Watkin, J.R. Miles, P.J. Sarre, Evidence for a link between the more prominent optical emission bands in the Red Rectangle and some of the diffuse interstellar absorption bands, MNRAS 255 11 (1992).
[9] R.J. Glinski, C.M. Anderson, On the Red Rectangle optical emission bands, MNRAS 332 L17 (2002).
[10] C.J. Mitchell, T.B. Williams, K. Spekkens, K. Lee-Waddell, R. Kuzio de Naray, J.S. Sellwood, The RINGS Survey I: Hα and HI Velocity Maps of Galaxy NGC 2280, AJ 149 116 (2015).
[11] N. Rangwala, T.B. Williams, C. Pietraszewski, C.L. Joseph, An Imaging Fabry-Perot System for theRobert Stobie Spectrograph on the Southern African Large Telescope, AJ 135 1825 (2008)
[12] D.E. Osterbrock, J.P. Fulbright, A.R. Martel, M.J. Keane, S.C. Trager, Night-Sky High-Resolution Spectral Atlas of OH and O2 Emission Lines for Echelle Spectrograph Wavelength Calibration, PASP 108 277 (1996).
6