diffusion of medicare's rbrvs and related physician ...€¦ · diffusion of medicare's...
TRANSCRIPT
Diffusion of Medicare's RBRVS and Related Physician Payment Policies
Lauren A McCormack, M.S.P.H., and Russel T. Burge, Ph.D.
In 1992, Medicare reformed its physician payment method by imPlementing the Medicare fee schedule (MFS), of which the resource-based relative value scale (RBRVSJ is a major component. Using a recent survey and case studies, we examine the diffusion of Medicare's RBRVS to non-Medicare payers and how those payers use and perceive the RBRVS and MFS policies. We find that approximately one-third of payers that participated in the survey have adopted RBRVSbased payment systems in varying degrees while another 40 percent were seriously considering its adoption. Prospects for expanded use ofMedicare's RBRVS appear favorable.
BACKGROUND
The rapid increase in health care costs has been a primary motivation behind many proposals to reform the U.S. health care system. While overall national health expenditures have increased from $250 billion in 1980 to $751 billion in 1991, national expenditures for physician services increased at an even faster rate, from $42 billion to $142 billion (Letsch et al., 1992). Potential reform measures for physician reimbursement range from capitated payments to negotiated payments for a specialized bundle of services to newly developed fee schedules.
Support for this research was provided by the Health Care Financing Administration (HCFA) through Contract Number 500-92-0020. Lauren A. McConnack and Russel T. Burge are with Health Economics Research, Inc. The opinions expressed are those of the authors and do not necessarily reflect the views or policy positions of HCFA or Health Economics Research, Inc.
The Medicare program took a major step to reform physician payment by implementing the MFS on January 1, 1992.' Medicare's reform provisions, enacted by Congress as part of the Omnibus Budget Reconciliation Act of 1989 (OBRA 1989), were motivated by several factors. First, Medicare program expenditures for physician services had been growing at rates that averaged over 13 percent since 1965. By 1991, Medicare expenditures for physician services-which constituted 70 percent of total Part B expenditures and more than 25 percent of Medicare total expenditures-had reached $26 billion (Physician Payment Review Commission [PPRC], 1992). A second factor was the wide variation in physician payments across types of procedures, physician specialties, and geographic locations that developed under Medicare's customary, prevailing, and reasonable (CPR) charge payment methodology. Finally, concern about the impact of increasing financial liability on Medicare beneficiaries for physician services was another important factor for the passage of OBRA 1989. Out-of-pocket expenditures for Medicare beneficiary households (of which physicians' charges billed above Medicare maximums, or balance billing amounts, were a major component) were about 17.1 percent of household income in
1Physician fees are in transition between historical allowed charges under the CPR charge method and the MFS, and will be fully based on the MFS in 1996.
HEAL1H CARE FINANCING REVIEW/Wmter 1994/Volume 16, Number 2 159

1991, up from about 10.6 percent in 1972 (Physician Payment Review Commission, 1992). To address these concerns, OBRA 1989 included the following provisions: (1) physician service fees derived using RBRVS;' (2) a cost-control mechanismMedicare volume performance standards (MVPS); and (3) balance billing limits on non-participating providers.
The RBRVS serves as the foundation of the MFS and includes three resource components: (1) total physician work; (2) practice expenses; and (3) malpractice expenses. Each component is measured in terms of relative value units (RVUs). In the MFS, fees are based on RVUs from the RBRVS, adjusted for geographic input price differences, and multiplied by a national conversion factor to derive dollar amounts. The MFS also consists of accompanying physician payment policies.
The physician work RVU component was developed by Harvard University researchers and refined by HCFA (Hsiao et al., 1988, 1992; Federal Register, 1991). The work RVU for each current procedural terminology (CF'f) code represents the relative value of physician work (e.g, time, physical effort and skill, mental effort and judgment, and stress from iatrogenic risk) required for that service in comparison to all other services. HCFA developed the practice expense RVUs, using historical charges for each code and estimates of the average portion of total revenues that physician specialties attributed to their practice expenses (e.g., equipment, rent, and salaries for ancillary personnel). Similarly, malpractice expense RVUs were also developed by HCFA The total RVU for each CIT code
2Throughout this article, uRBRVS" and uMedicare's RBRVS" are used interchangeably as our focus is on the RBRVS developed for and used first by the Medicare program. The acronym MFS is used when referring to the broader concept of Medicare's physician payment system which combines RBRVS and Medicare physician payment policies.
represents a value indexed to an intermediate office visit which has 1.0 total RVUs.
Physician service fees under the MFS are calculated from the following equation:
FEE,L = CFx GAFnx ' '
(RVU.,, +RVU",' + RVU.) (1)
where i is the ith service or procedure; GAF is a procedure- and location-specific geographic adjustment factor comprised of the weighted average of three indexesphysician work, practice expenses, and malpractice expenses-based on the Geographic Practice Cost Indexes (GPCI); and CF is the national conversion factor to convert the sum of the three RVUs, multiplied by the respective GAF, into dollars. Medicare's total RVU is the sum of the three RVU components. In the formulas, each RVU component is indicated with a subscript subscript w indicates physician work involved in performing service i; subscript pe represents practice expenses associated with service i; and subscript m represents physician malpractice expense for service i. RVUs vary by procedure while each procedure-specific GAF varies by Medicare payment locality L of which there are over 200 pricing localities based mainly on administrative units created by HCFA to administer the Medicare program.
This method of calculating physician service fees using RBRVS is intended to make payments for physician services across service types, specialties, and locations more equitable by reflecting estimated resource costs into the payment. Under the CPR system, payments reflected charges, rather than resource costs that contributed to incentives to provide more costly diagnostic and surgical procedures versus cognitive and primary care services. The MVPS in the MFS are designed to control the rate of expenditure growth by
HEALTH CARE FINANCING REVIEW/Winter 1994/Volume 16, Number2 160
setting physician annual payment updates (through changes in the CF) according to the difference between actual national physician expenditure growth in a given year and its established target. Targets are adjusted to account for changes out of the control of physicians such as beneficiary population and technology development. Thus, the MVPS are aimed at controlling costs by reducing the growth in the volume of physician services. Balance billing limitations are designed to protect Medicare beneficiaries from increased financial liability for physician services. That is, physicians are prohibited from billing patients directly for an amount in excess of an established percent of the Medicareallowed charge.
Application of RBRVS beyond Medicare may have important implications for the distribution of physician reimbursement and services in the United States because the Medicare RBRVS is expected to redistnbute payments away from invasive surgical procedures and diagnostic testing to evaluation and management services. Early patterns of RBRVS adoption across different payers may portend the feasibility of broader use. These patterns signal specific strengths and weaknesses of Medicare's RBRVS and possible long-term implications for access to care in a multipayer enviromnent The spread of Medicare's RBRVS may parallel the diffusion of other Medicare payment methodologies. For example, Medicare implemented the prospective payment system (PI'S), which pays hospitals for acute inpatient stays by Medicare beneficiaries according to diagnosis-related groups (DRGs), in fiscal year 1984. Since then, 21 State Medicaid programs and about two-thirds of Blue Cross/Blue Shield (BC/BS) Association Member Plans have adopted the DRG payment system to varying degrees (Carteret al., 1994).
This article examines the diffusion of RBRVS to various payers; payers' perceptions, goals, and expectations of RBRVS; and how these payers use RBRVS and other payment policies developed under Medicare's physician payment reform. We also discuss the implications of expanded use of Medicare's RBRVS.
DATA AND MElliODS
Survey of Payers
During the spring of 1993, a mail survey containing over 50 questions about methods used to pay for physicians' services was sent to 1,923 health care payers.' The sampling frame included traditional indemnity insurers, managed-care organizations4
(e.g., health maintenance organizations [HMOs] and preferred provider organizations [PPOs]), BC/BS organizations, thirdparty administrators, self-insured employers, and State Medicaid programs.' The 333 respondents, described in Table 1, represent a wide spectrum of organizations. 6
Several smaller or less formal surveys on the diffusion of Medicare's RBRVS and physician payment policies have been conducted by other organizations (e.g., PPRC, BC/BS Associations, State
3Survey data analyzed in the study were acquired from Deloitte & Touche (Boston Office) in conjunction with a larger research effort they were undertaking. Because of confidentiality concerns, Health Economics Research, Inc. was provided only ~gate infonnation from this survey.4A manageckare organization is a health plan that attempts to control or coordinate use of health services by its enrolled members in order to contain health eKpenditures. improve quality, or both. Arrangements often involve a defined delivery system of ~derswith some fonn of contractual arrangement with the plan. Deloitte & Touche purchased data bases for the first four payer
types from CharlesJ. Singer & Company. Self-insured employers and State Medicaid programs were subsequently merged onto the file by Deloitte & Touche. The groups are mutually exclusive. Respondents self-selected their payer category at the outset of the survey. Ten respondents did not choose one of the categories grovided and were coded as ~other." The data collection timeline did not allow for systematic followup
(such as additional mailings or using incentives to increase participation), which is a recommended approach to improving response rates, especially in mail sutveys (D11Iman, 1978).
HEALTII CARE FINANCING REVIEW/W'mter 1994/Volume 16. Number 2 161
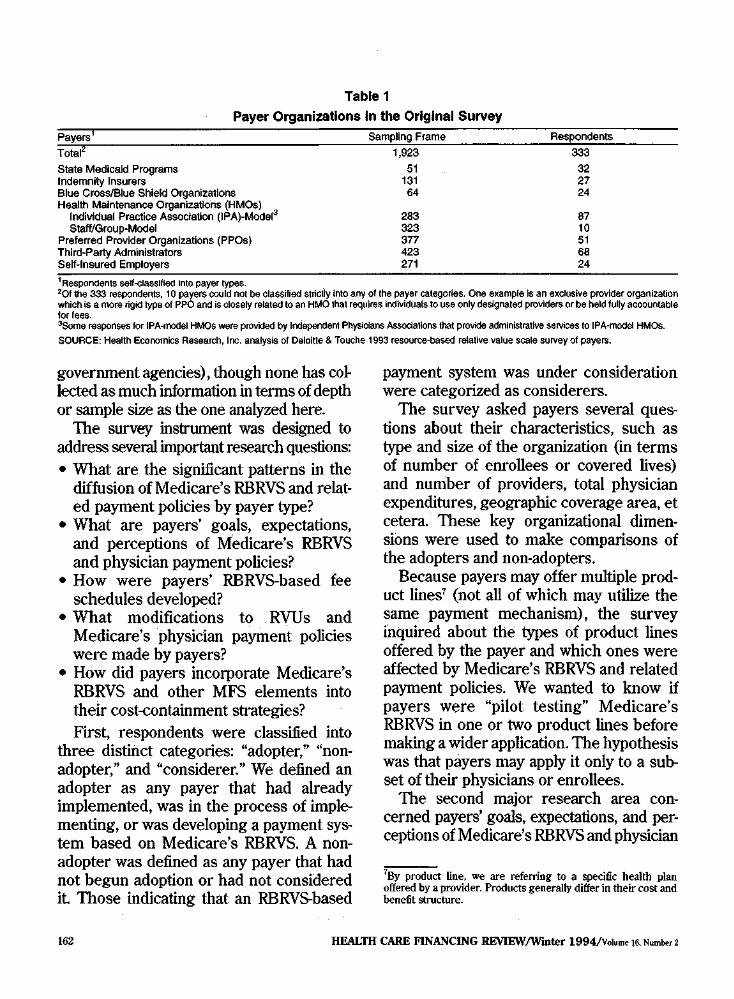
Table 1
Payer Organizations In the Original Survey
II
State Medicaid Programs Indemnity insurers
51 131
32 27
Blue Cross/Blue Shield Organizations 64 24 Health Maintenance Organizations (HMOs)
Individual Practice Association (IPA)-Model3 283 87 Staff/Group-Model 323 10
Preferred Provider Organizations (PPOs) 377 51 Third-Party Administrators 423 68 Self-Insured Employers 271 24 1 Respondents seH-classlfled Into payer types.201 the 333 respondents, 10 payers could not be classified stricUy into any of the payer categories. One e~ampie Is an e~cluslve provider organization which is a more rigid typa of PPO and is closely related to an HMO that requires individuals to use only designated providers or be held fully accountable for fees.3Some responses for IPA-model HMOS were provided by Independent Physicians Assodations that provide administrative services to IPA-model HMOS.
SOURCE: Health Economics Research, Inc. analysiS of Deloitte & Touche 1993 resource-based relative value scale survey of payers.
government agencies), though none has colleered as much information in terms of depth or sample size as the one analyzed here.
The survey instrument was designed to address several important research questions: • What are the significant patterns in the
diffusion of Medicare's RBRVS aud related payment policies by payer type?
• What are payers' goals, expectations, aud perceptions of Medicare's RBRVS aud physician payment policies?
• How were payers' RBRVS-based fee schedules developed?
• What modifications to RVUs aud Medicare's physician payment policies were made by payers?
• How did payers incorporate Medicare's RBRVS aud other MFS elements into their cost-containment strategies? First, respondents were classified into
three distinct categories: "adopter," "nonadopter," aud "considerer." We defined au adopter as auy payer that had already implemented, was in the process of implementing, or was developing a payment system based on Medicare's RBRVS. A nonadopter was defined as auy payer that had not begun adoption or had not considered it Those indicating that an RBRVS-based
payment system was under consideration were categorized as considerers.
The survey asked payers several questions about their characteristics, such as type aud size of the organization (in terms of number of enrollees or covered lives) and number of providers, total physician expenditures, geographic coverage area, et cetera. These key organizational dimensions were used to make comparisons of the adopters and non-adopters.
Because payers may offer multiple product lines' (not all of which may utilize the same payment mechanism), the survey inquired about the types of product lines offered by the payer aud which ones were affected by Medicare's RBRVS aud related payment policies. We wanted to know if payers were "pilot testing" Medicare's RBRVS in one or two product lines before making a wider application. The hypothesis was that payers may apply it only to a subset of their physicians or enrollees.
The second major research area con~ cerned payers' goals, expectations, and perceptions of Medicare's RBRVS and physician
7By product line, we are referring to a specific health plan offered by a provider. Products generally differ in their cost and benefit structure.
HEALTH CARE FINANCING REVIEW/W"mter 1994/Volume 16. Number 2 162
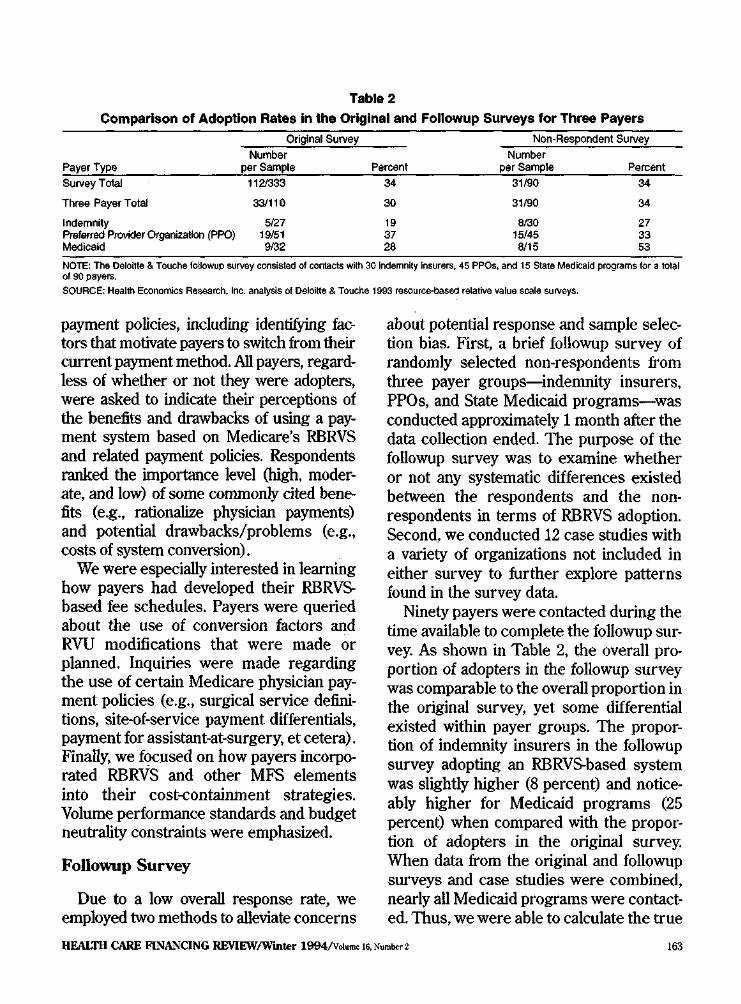
Table 2
Comparison of Adoption Rates In the Original and Followup Surveys for Three Payers
Original Survey Non-Respondent Survey Number Number
Payer Type per Sample Percent per Sample Percent Survey Total 1121333 34 31/90 34
Three Payer Total 33/110 30 31/90 34
Indemnity 5/27 19 8130 27 Preferred Provider Organization (PPO) 19/51 37 15145 33 Medicaid 9132 28 8/15 53
NOTE: The Delol1te & Touche followup survey consisted of contacts with 30 Indemnity Insurers, 45 PPOs, and 15 State Medicaid programs for a total of 90 payers. SOURCE: Health Economics Research, Inc. analysis of Deloltte & Touche 1993 resource-based relative value scale surveys.
payment policies, including identifying factors that motivate payers to switch from their current payment method. All payers, regardless of whether or not they were adopters, were asked to indicate their perceptions of the benefits and drawbacks of using a payment system based on Medicare's RBRVS and related payment policies. Respondents ranked the iroportance level (high, moderate, and low) of some commonly cited benefits (e.g., rationalize physician payments) and potential drawbacks/problems (e.g., costs of system conversion).
We were especially interested in learning how payers had developed their RBRVSbased fee schedules. Payers were queried about the use of conversion factors and RVU modifications that were made or planned. Inquiries were made regarding the use of certain Medicare physician payment policies (e.g., surgical service definitions, site-of-service payment differentials, payment for assistant-at-surgery, etcetera). Finally, we focused on how payers incorporated RBRVS and other MFS elements into their cost-containment strategies. Volume performance standards and budget neutrality constraints were emphasized.
Followup Survey
Due to a low overall response rate, we employed two methods to alleviate concerns
about potential response and sample selection bias. First, a brief followup survey of randomly selected non-respondents from three payer groups-indemnity insurers, PPOs, and State Medicaid programs-was conducted approximately 1 month after the data collection ended. The purpose of the followup survey was to examine whether or not any systematic differences existed between the respondents and the nonrespondents in terms of RBRVS adoption. Second, we conducted 12 case studies with a variety of organizations not included in either survey to further explore patterns found in the survey data.
Ninety payers were contacted during the time available to complete the followup survey. As shown in Table 2, the overall proportion of adopters in the followup survey was comparable to the overall proportion in the original survey, yet some differential existed within payer groups. The proportion of indemnity insurers in the followup survey adopting an RBRVS.based system was slightly higher (8 percent) and noticeably higher for Medicaid programs (25 percent) when compared with the proportion of adopters in the original survey. When data from the original and followup surveys and case studies were combined, nearly all Medicaid programs were contacted. Thus, we were able to calculate the true
HEALTH CARE F1NANCING REVIEW/Wmter 1994/Votume 16, Number2 163

diffusion rate in the Medicaid sectorwhich was approximately halfway between the two survey rates.' For PPOs, the difference in adoption rates was 4 percent lower in the followup group. Within the four geographic regions of the United States, diffusion rates between payers in the original and followup samples differed between 4 and 15 percent (with the South and West at the respective extremes).
Concern over non·response bias was not completely mitigated by the followup survey for two reasons, which serve as limitations to the study. First, only three payer groups were resurveyed due to resource constraints. Thus, it is questionable whether findings from the non-resurveyed payer groups should be generalized beyond the actual survey participants. Second, although comparable diffusion rates were found, the followup survey did not have a !()().percent response rate. Both the original and followup surveys, therefore, may suffer from response bias. The direction of the bias is likely to be positive, suggesting that the results of the survey are likely to overestimate the actual diffusion of Medicare's RBRVS. The primary reason for the positive influence on adoption rates is that payers interested in or using Medicare's RBRVS would be more likely to participate in the survey.9
Case Studies
We also conducted case studies of 12 payers-6 public and 6 private-actively involved in the use, implementation, or analysis of Medicare's RBRVS to verify that patterns identified through the survey were consistent In the public sector, case study organizations included State Medicaid programs
8Some information on Medicaid programs reported in this article reflects data collected by all three methods. 9See McCormack et al., 1993 for a more detailed discussion of the authors' methodology and findings.
in Michigan, Virginia, and Washington State; the West Virginia Workers' Compensation Fund; the Federal Office of Workers' Compensation Programs; and the Civilian Health and Medical Program of the Uniformed Services (CHAMPUS). The six private-sector participants included three indemnity insurers and three PPOs. The case study methodology included telephone interviews with key officials in each organization. Using payer-specific topic guides, detailed information was collected on: payers' use and perception of Medicare's RBRVS and related payment policies, and the development and implementation of alternative RBRVS-based payment systems. The case studies supplemented some areas not explored by the survey and probed into the technicai development payers were undertaking, including updated methodologies and implementation schedules.
RESULTS
Payment systems based on Medicare's RBRVS were found to exist across payers in both the public and private sectors. Among the 333 responding payers, onethird (n • 112) had adopted Medicare's RBRVS in some fashion for at least one of their product lines. Payers' use of RBRVS ranged from full-scale implementation to various limited applications. Limited applications included a fee screen for overvalued procedures used by CHAMPUS, a fee screen to set maximum allowed charges used by some PPOs, and the interim use approach by the Arizona Medicaid program which pays providers according to RBRVS fees for program beneficiaries not yet enrolled in a managed-care plan.
About one-haH of the adopters in the survey had already completed implementation according to their plan while the other half were still developing their plan or
HEALTII CARE FINANCING REVIEW/Wmter 1994/Volmne 16, Number2 164
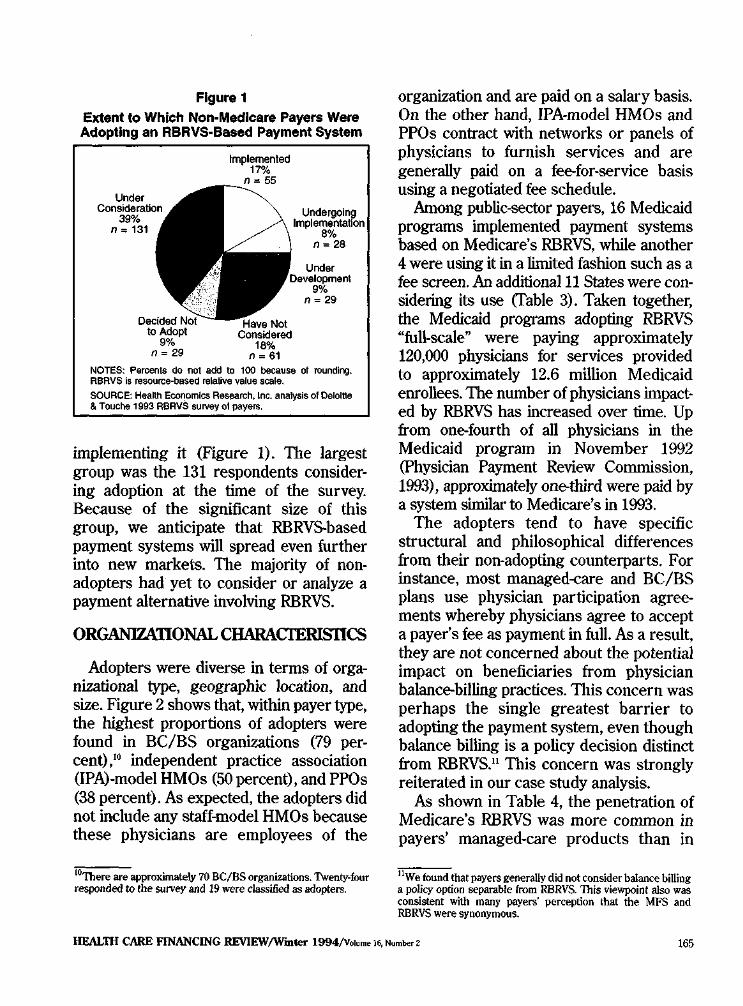
Figure 1
Extent to Which Non-Medicare Payers Were Adopting an RBRVS-Based Payment System
Implemented 17% =55
Undergoing lmplementatfon
8% n= 28
n = 29
NOTES: Percents do not add to 100 because of rounding. RBRVS Is resouroe-based relative value scale.
SOURCE: Health Economics Research, Inc. analysis of Oeloltle & Touche 1993 RBRVS survey ol payers.
implementing it (Figure 1). The largest group was the 131 respondents considering adoption at the time of the survey. Because of the significant size of this group, we anticipate that RBRVS-based payment systems will spread even further into new markets. The majority of nonadopters had yet to consider or analyze a payment alternative involving RBRVS.
ORGANIZATIONAL CHARACIERIS11CS
Adopters were diverse in terms of organizational type, geographic location, and size. Figure 2 shows that, within payer type, the highest proportions of adopters were found in BC/BS organizations (79 percent),10 independent practice association (IPA)-model HMOs (50 percent), and PPOs (38 percent). As expected, the adopters did not include any staff-model HMOs because these physicians are employees of the
10There are approximately 70 BC/BS organizations. Twenty-four responded to the survey and 19 were classified as adopters.
organization and are paid on a salary basis. On the other hand, IPA-model HMOs and PPOs contract with networks or panels of physicians to furnish services and are generally paid on a fee-for-service basis using a negotiated fee schedule.
Among public-sector payers, 16 Medicaid programs implemented payment systems based on Medicare's RBRVS, while another 4 were using it in a limited fashion such as a fee screen. An additional 11 States were considering its use (fable 3). Taken together, the Medicaid programs adopting RBRVS "full-scale" were paying approximately 120,000 physicians for services provided to approximately 12.6 million Medicaid enrollees. The number of physicians impacted by RBRVS has increased over time. Up from one-fourth of all physicians in the Medicaid program in November 1992 (Physician Payment Review Commission, 1993), approximately one-third were paid by a system similar to Medicare's in 1993.
The adopters tend to have specific structural and philosophical differences from their non-adopting counterparts. For instance, most managed-care and BC/BS plans use physician participation agreements whereby physicians agree to accept a payer's fee as payment in full. As a result, they are not concerned about the potential impact on beneficiaries from physician balance-billing practices. This concern was perhaps the single greatest barrier to adopting the payment system, even though balance billing is a policy decision distinct from RBRVS.n This concern was strongly reiterated in our case study analysis.
As shown in Table 4, the penetration of Medicare's RBRVS was more common in payers' managed-care products than in
11We found that payers generally did not consider balance billing a policy option separable from RBRVS. This viewpoint also was consistent with many payers' perception that the MFS and RBRVS were synonymous.
HEAL111 CARE FINANCING REVIEW/W"mter 1994/Volume 16, Number 2 165
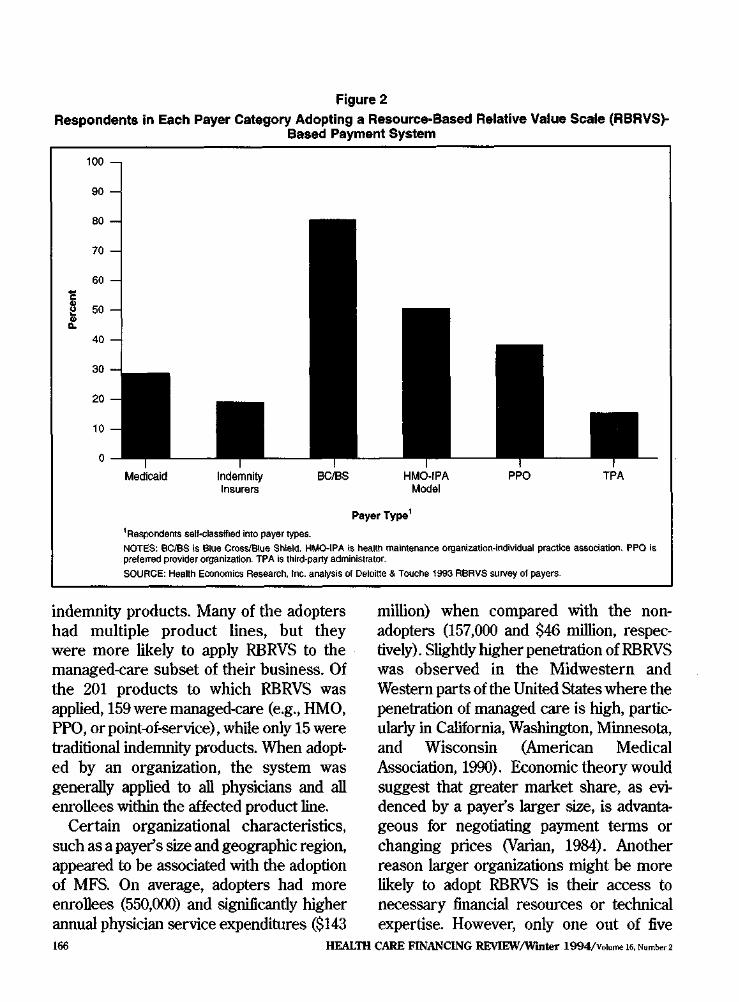
Figure 2
Respondents in Each Payer Category Adopting a Resource-Based Relative Value Scale (RBRVS)Based Payment System
100
90
80
70
~
~ .!!
60
50
40
30
20
10
0
Payer Type1
1Respondents sell-classified into payer types. NOTES: 6C/BS Is Blue Cross/Blue Shield. HMO-IPA Is health maintenance orgaflizatioo-indlvidual practice association. PPO is preferred provider organization. TPA is third-party administrator.
SOURCE: Health Economics Research, Inc. analysis of Deloitte & Touche 1993 RBRVS survey of payers.
indemnity products. Many of the adopters had multiple product lines, but they were more likely to apply RBRVS to the managed-care subset of their business. Of the 201 products to which RBRVS was applied,159were managed-care (e.g., HMO, PPO, or point-of-service), while only 15 were traditional indemnity products. When adopted by an organization, the system was generally applied to all physicians and all enrollees within the affected product line.
Certain organizational characteristics, such as a payer's size and geographic region, appeared to be associated with the adoption of MFS. On average, adopters had more enrollees (550,000) and significantly higher annual physician service expenditures ($143
million) when compared with the nonadopters (157,000 and $46 million, respectively). Slightly higher penetration of RBRVS was observed in the Midwestern and Western parts of the United States where the penetration of managed care is high, particularly in California, Washington, Minnesota, and Wisconsin (American Medical Association, 1990). Economic theory would suggest that greater market share, as evidenced by a payer's larger size, is advantageous for negotiating payment terms or changing prices (Varian, 1984). Another reason larger organizations might be more likely to adopt RBRVS is their access to necessary financial resources or technical expertise. However, only one out of five
HEALTH CARE FINANCING REVIEW/Wurter 1994/Volume 16, Number 2 166
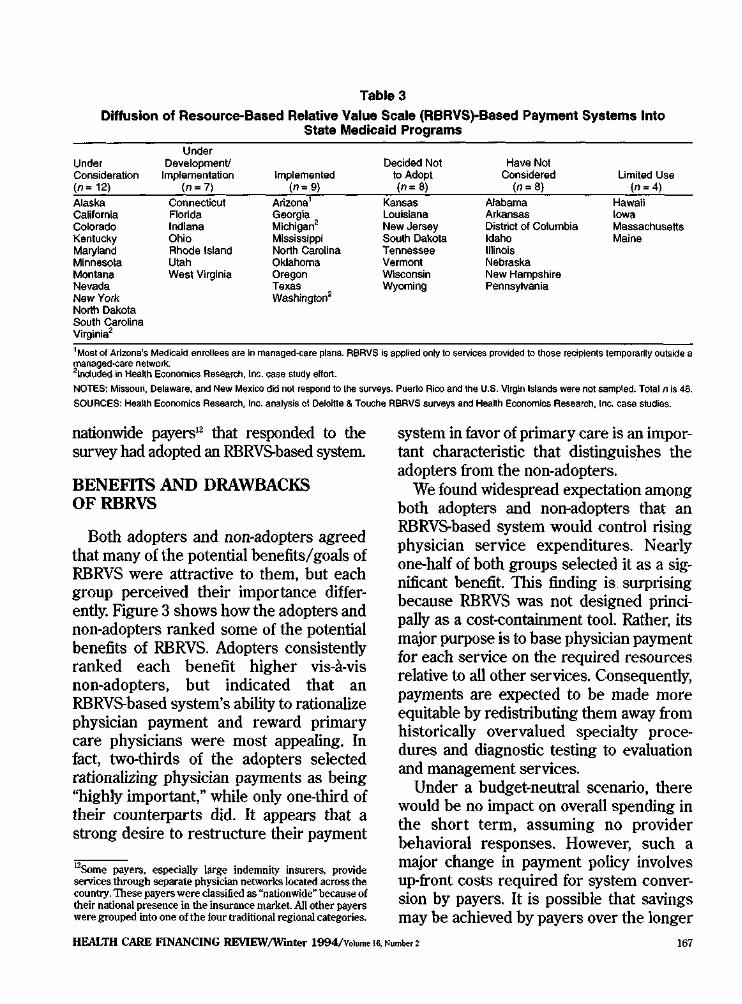
Table 3
Diffusion of Resource-Based Relative Value Scale (RBRVS)-Based Payment Systems Into State Medicaid Programs
Under Under Development! Decided Not Have Not Consideration Implementation Implemented to Adopt Considered limited Use (n = 12) (n=7) (n= 9) (n: 8) (n"' 8) (n=4)
Alaska Connecticut Arizona' Kansas Alabama Hawaii california Colorado
Florida Indiana
Georgia Michlgan2
Louisiana New Jersey
Arkansas District of Columbia
Iowa Massachusetts
Kentucky Ohio Mississippi South Dakota Idaho Maine Maryland Rhode Island North Carolina Tennessee Illinois Minnesota Utah Oklahoma Vermont Nebraska Montana West Virginia Oregon Wisconsin New Hampshire Nevada New York
Texas Washington2
Wyoming Pennsylvania
North Dakota South carolina Virginia2
'Most of Arizona's Medk:aid enrollees are In managed-care plans. R6RVS is applied only to services proVided to those reciplenls temporalily outside a managed-care netwoJ1<.21ncluded in HeaHh Economics Research, Inc. case study effort.
NOTES: Missouri, Delaware, and New Mexico did not respond to the surveys. Puerto Rico and the U.S. Vlrg!n Islands were not sam~ed. Total n is 48.
SOURCES: Health Economics Research, Inc. analysis ol Oeloitte & Touche RBRVS surveys and HeaHh Economics Research, Inc. case studies.
nationwide payers12 that responded to the survey had adopted an RBRVS-based systeDL
BENEFITS AND DRAWBACKS OFRBRVS
Both adopters and non-adopters agreed that many of the potential benefits/ goals of RBRVS were attractive to them, but each group perceived their importance differently. Figure 3 shows how the adopters and non-adopters ranked some of the potential benefits of RBRVS. Adopters consistently ranked each benefit higher vis-a-vis non-adopters, but indicated that an RBRVS-based system's ability to rationalize physician payment and reward primary care physicians were most appealing. In fact, two-thirds of the adopters selected rationalizing physician payments as being "highly important," while only one-third of their counterparts did. It appears that a strong desire to restructure their payment
12Some payers, especially large indemnity insurers, provide services through separate physician networks located across the country. These payers were classified as qnationwide~ because of their national presence in the insurance markel All other payers were grouped into one of the four traditional regional categories.
system in favor of primary care is an important characteristic that distinguishes the adopters from the non-adopters.
We found widespread expectation among both adopters and non-adopters that an RBRVS-based system would control rising physician service expenditures. Nearly one-half of both groups selected it as a significant benefit. Tills finding is surprising because RBRVS was not designed principally as a cost-containment tool. Rather, its major purpose is to base physician payment for each service on the required resources relative to all other services. Consequently, payments are expected to be made more equitable by redistributing them away from historically overvalued specialty procedures and diagnostic testing to evaluation and management services.
Under a budget-neutral scenario, there would be no impact on overall spending in the short term, assuming no provider behavioral responses. However, such a major change in payment policy involves up-front costs required for system conversion by payers. It is possible that savings may be achieved by payers over the longer
HEALTH CARE FINANCING REVIEW/W'mter 1994/volume lil, Number z 167
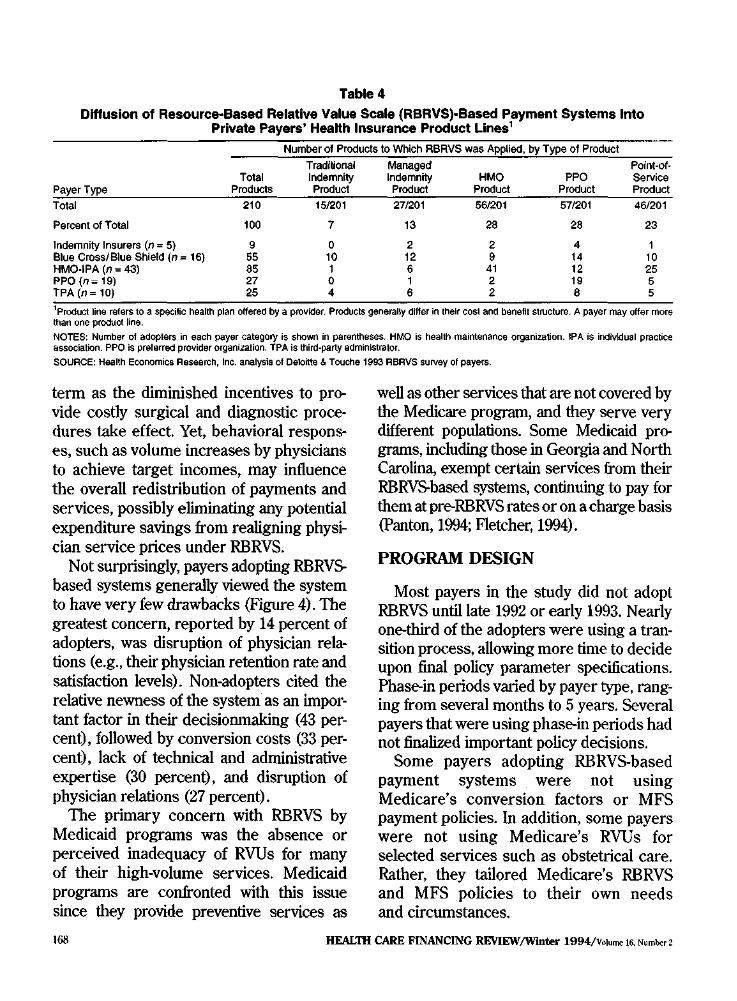
Table 4
Diffusion of Resource--Based Relative Value Scale (RBRVS)·Based Payment Systems Into Private Payers' Health Insurance Product Lines 1
Number of Products to Which ABRVS was Applied, by Type of Product Traditional Managed Point-of-
Total Indemnity Indemnity HMO PPO Service Payer Type Products Product Prod"" Product Product Product Total 210 151201 271201 5612Q1 57/201 46/201
Percent of Total 100 7 13 28 28 23
Indemnity Insurers (n = 5) 9 0 2 2 4 1 Blue Cross/Blue Shield (n= 16) 55 10 12 9 14 10 HMO-IPA (n = 43) 85 1 6 41 12 25 PPO (n-19) 27 0 1 2 19 5 TPA (n = 10) 25 4 6 2 8 5 1Productline refers to a specific health plan offered by a provider. Products generally differ in their cosl and benefit structure. A payer may offer more than one product line.
NOTES: Number of adopters in each payer category is showrl in parentheses. HMO is health maintenance organization. IPA is indMdual practice association. PPO is preferred provider organization. TPA is third-party administrator.
SOURCE: Health Economics Research, Inc. analysis of Deloitte & Touche 1993 ABAVS suiVay of payers.
term as the diminished incentives to provide costly surgical and diagnostic procedures take effect. Yet, behavioral responses, such as volume increases by physicians to achieve target incomes, may influence the overall redistribution of payments and services, possibly eliminating any potential expenditure savings from realigning physician service prices under RBRVS.
Not surprisingly, payers adopting RBRVS. based systems generally viewed the system to have very few drawbacks (Figure 4). The greatest concern, reported by 14 percent of adopters, was disruption of physician relations (e.g., their physician retention rate and satisfaction levels). Non-adopters cited the relative newness of the system as an important factor in their decisionmaking (43 percent), followed by conversion costs (33 percent), lack of technical and administrative expertise (30 percent), and disruption of physician relations (27 percent).
The primary concern with RBRVS by Medicaid programs was the absence or perceived inadequacy of RVUs for many of their high-volume services. Medicaid programs are confronted with this issue since they provide preventive services as
well as other services that are not covered by the Medicare program, and they serve very different populations. Some Medicaid programs, including those in Georgia and North Carolina, exempt certain services from their RBRVS.based systems, continuing to pay for them at pre-RBRVS rates or on a charge basis (Panton, 1994; Fletcher, 1994).
PROGRAM DESIGN
Most payers in the study did not adopt RBRVS until late 1992 or early 1993. Nearly one-third of the adopters were using a transition process, allowing more time to decide upon final policy parameter specifications. Phase-in periods varied by payer type, ranging from several months to 5 years. Several payers that were using phase-in periods had not finalized important policy decisions.
Some payers adopting RBRVS.based payment systems were not using Medicare's conversion factors or MFS payment policies. In addition, some payers were not using Medicare's RVUs for selected services such as obstetrical care. Rather, they tailored Medicare's RBRVS and MFS policies to their own needs and circumstances.
HEAL1H CARE FINANCING RE\IIEW/Wmter 1994/Volume 16. Number 2 168

Figure 3 Percent of Payers Reporting the Perceived Benefits of a Resource-Based Relative Value Scale
(RBRVS)-Based Payment System as "Highly Important"
100
90
80 D Adopters
• Non-Adopters
70
60 ~
~ :. 50
40
30
20
10
0
Rationalize Physician Payments
Reward Primary Care
Physicians
Control Health Care Costs
Avoid Cost Shifting
Medicare Compatability
Respond to Competition
NOTE: Sample size for adopters range from 108-11 0. Sample size for non-adopters range from 80-82.
SOURCE: Heallh Eoooomics Research, Inc. analysis of Deloltte & Touche 1993 RBRVS survey o1 payers.
Of the 112 adopters, only 20 percent had opted to use Medicare's conversion factors (CFs), although less than one-haH of the adopters had made a decision regarding the exact CFs that they would use at the time of the survey. Nearly 60 percent determined that they would use multiple CFs to convert RVUs into dollars. The most common basis used to deterntine multiple CFs is geography, but "areas of medicine" and "physician specialty" were also cited. A few Medicaid programs are using a separate CF for obstetrical services, citing this as a way to fulfill requirements under the OBRA 1989 equal access provision. Of the case studies participants, most of the private sector payers were using multiple CFs that were applied to medical and surgical service categories. One private payer was
using CFs that resulted in payment levels approximately 150 percent higher than Medicare's fees.
Payers are clearly divided over modifying Medicare's RVUs. One-third of the adopters made changes to some RVUs, a sintilar proportion did not make changes, and another one-third were undecided. The groups of services commonly modified include obstetrics/gynecology (OB/GYN), pediatrics, and pathology.
Across most payer types, Medicare payment policies on global surgical service definitions and the payment method for assistants-at-surgery were implemented by one-half of the adopters. Figure 5 shows that significant uncertainty exists regarding all payment policies identified in the survey instrument For each policy or
REALm CARE FINANCING REVIEW/W"mter 1994/Volume 16, Number 2 169
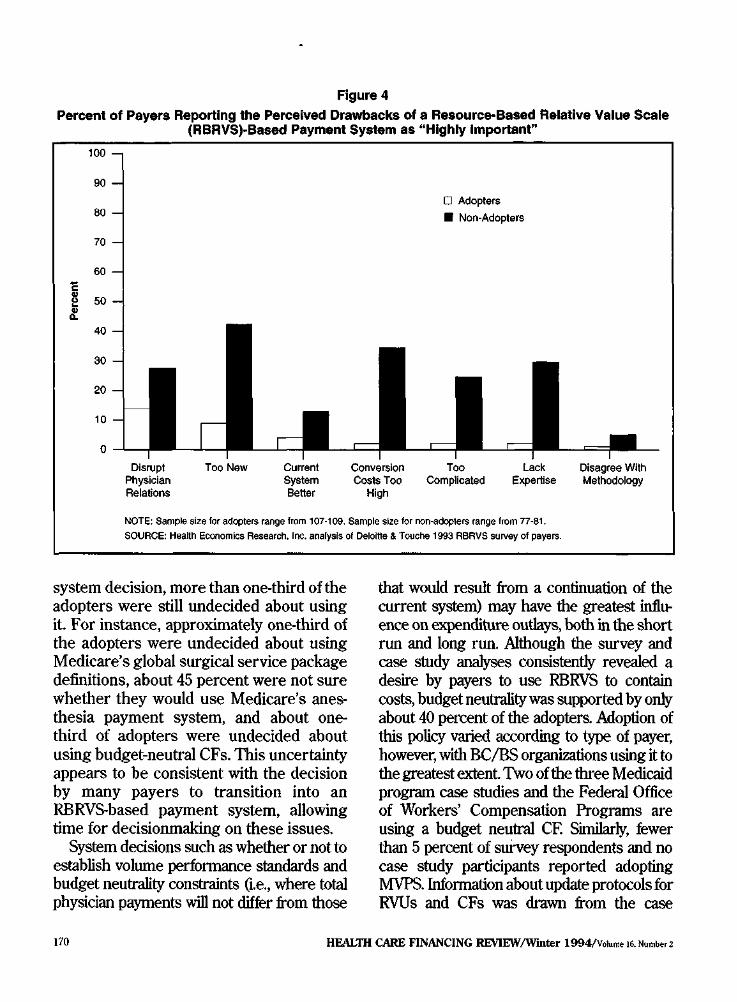
Figure 4 Percent of Payers Reporting the Perceived Drawbacks of a Resource-Based Relative Value Scale
100
90
80
70
60 E ~ 50 .!:
40
30
20
10
0
(RBRVS)·Based Payment System as "Highly Important"
0 Adopters
• Non-Adopters
NOTE: Sample size lor adopters range from 107-1 09. Sample size for non-adopters range from 77-81. SOURCE: HeaHh Economics Research, Inc. analysis of Deloltle & Touche 1993 RBRVS survey of payers.
system decision, more than one-third of the adopters were still undecided about using it. For instance, approximately one-third of the adopters were undecided about using Medicare's global surgical service package definitions, about 45 percent were not sure whether they would use Medicare's anesthesia payment system, and about onethird of adopters were undecided about using budget-neutral CFs. This uncertainty appears to be consistent with the decision by many payers to transition into an RBRVS-based payment system, allowing time for decisionmaking on these issues.
System decisions such as whether or not to establish volume performance standards and budget neutrality constraints (I.e., where total physician payments will not differ from those
that would result from a continuation of the current system) may have the greatest influence on expenditure outlays, both in the short run and long run. Although the survey and case study analyses consistently revealed a desire by payers to use RBRVS to contain costs, budget neutrality was supported by only about 40 percent of the adopters. Adoption of this policy varied according to type of payer, however, with BC/BS orgaoizations using it to the greatest extent Two of the three Medicaid program case studies and the Federal Office of Workers' Compensation Programs are using a budget neutral CF. Similarly, fewer than 5 percent of survey respondents and no case study participants reported adopting MVPS. Information about update protocols for RVUs and CFs was drawn from the case
HEALTH CARE FINANCING REVIEW/Wmter 1994/Volume 16. Number 2 170

Figure 5 Percent of Payers Adopting Selected Medicare Fee Schedule Policies
100
90
80
70
60
~ 50•:. 40
30
20
10
0
Surgical Service
Definitions Payment System Interpretations
Payment Method for Assistant
at Surgery
0 Undecided• Adopters • Non-Adopters
NOTE: Sample siZe for adopters range from 105-1 07. EKG Is electrocardiogram. SOURCE: Health Economics Research, foe. analysis ot Deloitte &Touche 1993 resource-based relative value scala survey of payers.
studies. Several payers planned to update RVUs along with Medicare, but formal update protocols for CFs had generally not been developed. One exception was the Washington State Medicaid program, whose CF update will depend largely on its legislature.
CONCLUSIONS AND POUCY IMPUCATIONS
Analysis of recent survey data and case studies reveals that Medicare's RBRVS has spread into both public and private sector payers since its inception, though payers have determined that specific parts of the MFS are inappropriate for their program. Also, it appears that RBRVS.based payment systems are being applied predominantly to
managed-care products in which balance billing is not an issue for beneficiaries' outof-pocket liability. 1hls finding is significant given the short period of time since Medicare's implementation of the MFS, the amount of resources needed to restructure a payer's payment system, and the continued growth of managed care in the health care industry. Clearly, a driving force behind the rapid adoption of this system is the rationalization of payment Given the shift in payments toward primary-care services and the emphasis given to primary care by managed-care organizations, it is not surprising that diffusion rates have been most rapid in the managed-a~re marketplace. This also could explain some of the difference in adoption rates across geographic areas.
HEALTH CARE FINANCING REVIEW!Wbtter 1994/V<>!ume 16, Number 2 171
One important distinction between Medicare and other payers adopting RBRVS is the integration (or non-integration) of RBRVS into their cost-containment strategies. Only about 40 percent of adopters decided to implement a budget-neutral system (although some payers had yet to make a decision) and significantly fewer had established volume performance standards. Some case study payers, especially those with large provider networks, see RBRVS as an important management tool for creating physician profiles on volume and intensity of services, and subsequently controlling the growth in costs. Other payers viewed the adoption of RBRVS as a way to minimize cost shifting. They were concerned that if they did not adopt an RBRVS-based system, physician charges might increase in an effort to offset reductions in fees by other payers that did adopt it These different approaches to cost containment may result in differences in the growth rate of physician service expenditures between Medicare and other payers.
The long-term implications from expanded use of RBRVS on the distribution of services, reimbursement, and cost shifting across payers will depend largely on the uncertain dynamic interactions and impacts from multiple payers using the system. It is not certain, for example, what effect broader use of RBRVS will have on the volume of specific procedures or services for a particular population, or the total impact on individual specialty or physician reimbursement. Increased use of RBRVS may lead to results that magnify or mitigate the original expectations of RBRVS. For instance, the basic premise of RBRVSto base fees for physician services on required resources relative to other services-leads to a redistribution of payments away from surgical procedures and diagnostic testing to evaluation and
management services. Given these incentives, one expectation is that incomes for surgeons and specialists would decline, while incomes for primary care physicians would rise. The predicted aggregate impact on any given specialty is likely to be magnified when multiple payers' fee schedules are based on RBRVS, even if conversion factors differ by payer. On the other hand, a "volume effect" may occur within and across payers whereby providers respond to fee reductions by increasing the volume of other services differentially within and across payers. Such a response would result in an overall change in service volume and reimbursement far different than expected under RBRVS (McGuire and Pauly, 1991). Volume effects across payers might be driven by different payment policies, conversion factors, relative value units, and balance billing limits.
In the short run, the potential for increased use of RBRVS appears to be substantial, given the adoption rates across various payer types and the large proportion of payers currently analyzing its feasibility. This is especially relevant to geographic regions with a larger penetration of managed-care products in the marketplace. In addition, RBRVS has broad appeal as evidenced by the different types of public and private payers using it and its various applications. However, the structure of physician service markets may dictate how RBRVS is used by payers and what payment policies will accompany it in the longer run.
This study advances the state of know~ edge on the extent to which an important Medicare payment methodology, the RBRVS, has spread to various health care payer organizations. However. caution must be used when generalizing this study's results because of low response rates for some payer types. Also, the survey and case
HEAL11f CARE FINANCING REVIEW/Wmter 1994/Volume IR Number 2 172

studies were conducted shortly after Medicare's implementation of the MFS and before the outcome of the 1994 national health care reform debate was known. In addition, we were unable to explore payers' use patterns along a wider array of payment policy and technical issues. Future research using a larger sample of payers and more detailed questions on RBRVS-based payment systems is needed to fully examine the extent of RBRVS and MFS payment policy use by payer, product line, and geographic region. Future studies could also analyze the impacts on payers, providers, and beneficiaries from multiple payer use of Medicare's RBRVS.
ACKNOWLEDGMEN'IS
We thank the following individuals from Health Economics Research, Inc.: A James Lee, Nancy T. McCall, Gregory C. Pope, and Margo L Rosenbach, for providing several useful comments on earlier versions of this article. Carol J. Ammering provided technical research assistance and graphical support and Janet B. Mitchell served on the research team. Our appreciation is also warmly extended to an anonymous reviewer.
REFERENCES
American Medical Association: Trends in U.S. Health Care 1990. Chicago. 1990. Carter, G.M., Jacobson, P.O., Kaminski, G.F., and Perry, M.].: Use of Diagnosis-Related Groups by Non-Medicare Payers. Health Care Financing Review. 16(2):127-158, W'mter 1994. Dillman, D.: Mail and Telephone Surveys: The Total Design Method. New York. Wiley, 1978.
Federal Register. Medicare Program; Fee Schedule for Physicians' Services, Fee Schedule Update for Calendar Year 1992 and Physician Performance Standard Rates of Increase for Federal FY 1992; Final Rules and Notice. Vol. 56, No. 227. Office of the Federal Register, National Archives and Records Administration. Washington. U.S. Government Printing Office, November 25, 1991.
Fletcher, B.: Personal communication. Georgia Department of Medical Assistance. November 1994.
Hsiao, W.C., Braun, P., Becker, E.R., et at.: A National Study of Resource-Based Relative Value Scales for Physician Services. Final Report to the Health Care Financing Administration. HCFA Contract No. 17-C98795/1-03. Boston. Harvard School of Public Health, 1988.
Hsiao, W.C., Braun, P., Becker, E.R, et a!.: An Overview of the Development and Refinement of the Resource-Based Relative Value Scale. Medical Care 30(11) Supplement NS1-NS12. 1992.
Letsch, S.W., Lazenby, H.C., Levit. KR, and Cowan, CA: National Health Expenditures, 1991. Health Care Financing Review 14(2):1-30, Winter 1992.
McConnack, L, Burge, R T., Anunering, C., and Mitchell, }.B.: Use ofMedicare Payment Metlwdologies and Cost Containment Strategies by Medicaid Programs and Private Payers. Final Report to the Health Care Financing Administration under Master ContractNmnber 500-9Z-0020. Waltham, MA Health Economics Research, Inc. December 1993.
McGuire, T.G., and Pauly, M.V.: Physician Responses to Fee Changes with Multiple Payers. journal of Health Economics 10:385-410, 1991.
Panton,}.: Personal communication. North Carolina Department of Medical Assistance. November 1994.
Physician Payment Review Commission: Annual Report to Congress, 1992. Washington. 1992.
Physician Payment Review Commission: Annual Report to Congress, 1993. Washington. 1993.
Varian, H: Microeconomic Analysis, 2nd Edition. New York Norton, 1984.
Reprint Requests: Lauren A McConnack., M.S.P.H., Health Economics Res1!arch, Inc., 1030 15th Street, NW., Executive Building, Suite 412, Washington, DC 20005.
HEALTH CARE ftNANCING REVIEW/W"mter 1994/Volume16.Numher2 173