diffusion of methodological innovation in pharmacoepidemiology: self ... · diffusion of...
TRANSCRIPT
Diffusion of Methodological Innovation in
Pharmacoepidemiology:
Self-controlled Study Designs
by
Giulia P. Consiglio
A thesis submitted in conformity with the requirements
for the degree of Master of Science
Graduate Department of Pharmaceutical Sciences
University of Toronto
© Copyright by Giulia P. Consiglio 2015

ii
Diffusion of Methodological Innovation in Pharmacoe pidemiology:
Self-controlled Study Designs
Giulia P. Consiglio
Master of Science
Graduate Department of Pharmaceutical Science
University of Toronto
2015
Abstract
Self-controlled designs are methodological innovations that complement traditional observational
studies and are useful to control for time-invariant confounders. The use and diffusion of self-
controlled case-control and cohort designs in pharmacoepidemiology was examined over time, and
described using Rogers’ Diffusion of Innovations Theory and co-authorship network analysis
(visualized in a supplementary graphics interchange format (GIF) image). Studies experienced a lag
in diffusion, followed by a rapid uptake in use since 2000. Overall, the co-authorship network was
comprised of 176 papers, 763 authors and 46 components; 31 components contained one paper
(61% self-controlled case-control). The largest component of the network was interconnected and
was comprised of 69% self-controlled cohort studies. Future work to develop and disseminate
standardized language could target seminal authors and key opinion leaders identified in the
network. Formal reporting guidelines are also encouraged, as the majority of applications did not
follow recommendations on reporting, such as raw data display.

iii
Acknowledgements
There are many individuals without whom this thesis would not have been possible.
To my supervisor, Dr. Suzanne Cadarette, I am grateful to have completed my graduate studies
under your supervision. Thank you for leading by example, for helping me to grow both
professionally and personally, and for always setting the bar high. Words cannot express my
gratitude.
To my committee members, Dr. Malcolm Maclure and Dr. Lisa McCarthy, thank you both for your
guidance throughout my thesis research. The opportunity to learn from individuals with your levels of
passion has been a rewarding experience, with positive implications on my thesis research, and
undoubtedly, life beyond graduate school. I would also like to thank Dr. Dave Dubins who keenly
and kindly created the Excel macros that I utilized—they were a life saver!
To my colleagues: Jordan Albaum, Amine Amiche, Andrea Burden, Sam Elbayoumi, Racquel
Jandoc, Mina Tadrous, Joann Ban, Cody Black, Erin Cicinelli, Patrick Edwards, Gina Matesic
Lindsay Wong, and Jennifer Youn – thank you all for the your support. I will always treasure your
friendship and the memories we’ve made in PB632 and 616.
I would also like to recognize the Ontario Ministry of Research and Innovation Early Researcher
Award that funded this research.
Last, but not least, I would like to thank my family, friends and MT. Without your unconditional love
and endless encouragement none of this would have been possible. I love you all.
Giulia Consiglio

iv
Diffusion of Methodological Innovation in Pharmacoe pidemiology:
Self-controlled Study Designs
TABLE OF CONTENTS
Acknowledgements .......................................................................................................................... iii
OVERVIEW ...................................................................................................................................... x
SECTION A: BACKGROUND ........................................................................................................... 1
Chapter 1 Observational research methods and self-controlled designs ........................................... 1
1.1 Why observational research to study drugs? ........................................................................... 1
1.2 Two most common observational study designs ...................................................................... 2
1.2.1 Cohort study design .............................................................................................................. 2
Box 1. Confounding ................................................................................................................ 3
1.2.2 Case-control study design .................................................................................................... 3
1.3 Methodological innovation in observational research: self-controlled study designs ................ 4
1.3.1 Self-controlled case-control study designs ............................................................................ 4
1.3.1.1 The case-crossover (CCO)study design ..................................................................... 4
1.3.1.2 The case-time control (CTC) study design .................................................................. 5
1.3.1.3 The case-case-time control (CCTC) study design ....................................................... 6
1.3.2 Self-controlled cohort: the self-controlled case-series (SCCS) study design ......................... 6
1.4 Summary ................................................................................................................................. 7
Chapter 2 The Diffusion of Innovations Theory ............................................................................... 14
2.1 Diffusion of Innovations Theory ............................................................................................. 14
2.1.1 Innovation ........................................................................................................................... 14
2.1.2 Communication Channels ................................................................................................... 15
Box 2 Adopter categories ..................................................................................................... 17
2.1.3 Time ................................................................................................................................... 18
2.1.4 Social System ..................................................................................................................... 19
2.2 Social networks and social network analysis ......................................................................... 20
2.2.1 Co-authorship network analysis .......................................................................................... 20
2.3 Summary ............................................................................................................................... 22
Chapter 3 Self-controlled designs in pharmacoepidemiology .......................................................... 27
3.1 Recent reviews of self-controlled literature ............................................................................ 27
3.2 Self-controlled recommendations .......................................................................................... 29
3.2.1 Exposures .......................................................................................................................... 29

v
3.2.2 Outcomes ........................................................................................................................... 30
3.2.3 Reporting recommendations ............................................................................................... 31
3.3 Objectives .............................................................................................................................. 31
3.3.1 Hypotheses ........................................................................................................................ 32
3.4 Summary ............................................................................................................................... 32
SECTION B: THESIS RESEARCH ................................................................................................. 36
Chapter 4 Methods ......................................................................................................................... 36
4.1 Systematic review .................................................................................................................. 36
4.1.1 Analysis .............................................................................................................................. 37
4.1.2 How applied self-controlled studies follow recommendations over time .............................. 37
4.2 Co-authorship network analysis ............................................................................................. 39
4.2.1 Network creation ................................................................................................................. 39
4.2.2 Network analyses ............................................................................................................... 40
4.2.2.1 Institutional affiliation ................................................................................................ 40
4.2.2.2 Centrality .................................................................................................................. 41
Chapter 5 Results ........................................................................................................................... 45
5.1 Exposures and outcomes ...................................................................................................... 45
5.2 Other self-controlled design features ..................................................................................... 47
5.3 Self-controlled studies and recommendations over time ........................................................ 47
5.4 Language .............................................................................................................................. 48
5.5 Co-authorship network analysis overtime .............................................................................. 49
5.5.1 Institutional affiliations ......................................................................................................... 53
5.5.2 Network centrality ............................................................................................................... 54
5.5.3 Co-authorship networks – by design ................................................................................... 55
Chapter 6 Discussion ...................................................................................................................... 99
6.1 Overview ............................................................................................................................... 99
6.2 Diffusion of Innovations Theory ........................................................................................... 100
6.2.1 Diffusion patterns over time – similarities and differences between design types .............. 101
6.2.1.1 Rate of diffusion ...................................................................................................... 101
6.2.1.2 Network composition .............................................................................................. 105
6.2.1.3 The presence of centrally acting authors ................................................................ 108
6.3 Strengths ............................................................................................................................. 110
6.4 Limitations ........................................................................................................................... 111

vi
6.5 Future directions .................................................................................................................. 112
6.6 Relevance ........................................................................................................................... 113
6.7 Conclusions ......................................................................................................................... 114
REFERENCES ............................................................................................................................. 117

vii
LIST OF TABLES
Table 1.1 Summary of observational study designs. ......................................................................... 9
Table 1.2 Summary ofself-controlled study designs. ............................................................. 10
Table 3.1 Detailed methods/planning and reporting recommendations. ............................ 34
Table 4.1 Literature search terms.................................................................................................... 43
Table 4.2 Assessment of self-controlled recommendations. ............................................................ 44
Table 5.1 Summary characteristics ................................................................................................. 57
Tables 5.2A-B Summary characteristics over time. ......................................................................... 58
Table 5.3 Language. ....................................................................................................................... 60
Table 5.4 Institutional affiliations. .................................................................................................... 61
Tables 5.5A-B Institutional affiliations – by component. ................................................................... 62
Table 5.6 Centrality of the network – overall. .................................................................................. 64
Tables 5.7A-B Centrality of the network – by component. ............................................................... 65
Table 5.8 Centrality of the network – overall. .................................................................................. 67
Table 5.9 Centrality of the network – overall. .................................................................................. 68
Table 5.10 Institutional affiliations. .................................................................................................. 69
Table 5.11 Institutional affiliations. .................................................................................................. 70

viii
LIST OF FIGURES
Figure 1.1 Cohort study design. ...................................................................................................... 11
Figure 1.2 Case-control study design. ............................................................................................. 11
Figure 1.3 Case-crossover study design. ........................................................................................ 12
Figure 1.4 Case-time control study design. ..................................................................................... 12
Figure 1.5 Case-case-time control study design. ............................................................................. 13
Figure 1.6 Self-controlled case-series study design. ....................................................................... 13
Figure 2.1 Rogers’ Diffusion of Innovations Theory. ........................................................................ 24
Figure 2.2 Rate of adoption curve. .................................................................................................. 25
Figure 2.3 Graphical representation of a directed co-authorship network. ....................................... 25
Figures 2.4A-D Measures of Centrality. .......................................................................................... 26
Figure 3.1 Model of transient exposure. .......................................................................................... 35
Figure 3.2 Acute outcomes following transient exposure effects. .................................................... 35
Figure 5.1 Study Flow. .................................................................................................................... 71
Figure 5.2 Proportional Venn diagram. ............................................................................................ 72
Figure 5.3 Cumulative authors and number of publications, by year. .............................................. 73
Figure 5.4A-B Methodological recommendations – exposures. ....................................................... 74
Figure 5.5A-B Methodological recommendations – outcomes (biological onset). ............................ 75
Figure 5.6A-B Methodological recommendations – outcomes (observation window length). ........... 76
Figure 5.7A-B Reporting recommendations – raw data display. ...................................................... 77
Figure 5.8A-B Reporting recommendations – report on outcome onset timing ................................ 78
Figure 5.9 Directed sociograms -- self-controlled co-authorship network......................................... 79
Figure 5.10A-P Directed sociograms -- self-controlled co-authorship network over time ................. 93
Figure 5.11A-C Directed sociograms -- top 3 largest components................................................... 96
Figure 5.12 Directed sociogram -- self-controlled case-control co-authorship network .................... 97
Figure 5.13 Directed sociogram -- self-controlled cohort co-authorship network .............................. 98
Figure 6.1 Proposed language -- self-controlled study designs. .................................................... 116
ix
LIST OF APPENDICES
APPENDIX A The Diffusion of Innovations Theory ................................................................ 13535
APPENDIX B Case-crossover study design -- systematic review .......................................... 15339
APPENDIX C Additional design features ................................................................................... 155
APPENDIX D Distribution of observation window length ....................................................... 15454
APPENDIX E Data abstraction table ..................................................................................... 17155
APPENDIX F Self-controlled recommendations over time ..................................................... 13971
APPENDIX G Worksheet to design self-controlled studies .................................................... 17878

x
OVERVIEW
This thesis has 6 chapters and is divided into two sections: A) background and B) thesis research.
Three background chapters comprise Section A and include information essential to interpret
the methods, results and discussion of this thesis research. Chapter 1 introduces observational
research methods, including traditional cohort and case-control studies, and innovative self-
controlled designs in pharmacoepidemiology. Chapter 2 introduces the Diffusion of Innovations
Theory by Everett Rogers as the conceptual framework that explains how methodological
innovations such as self-controlled study designs diffuse in pharmacoepidemiologic research
networks. Chapter 3 revisits observational research methods, focusing on self-controlled designs,
including recommendations for their use.
Section B comprises the research study of this thesis: the methods, results and discussion
are presented. The methods (Chapter 4 ) describe a systematic review of self-controlled literature,
and a co-authorship network analysis leveraging published self-controlled studies. Chapters 5
(results) and 6 (discussion) report and explain the findings of this research.
Appendices at the end of the thesis provide the reader with supplementary information that
support this thesis research.

1
SECTION A: BACKGROUND
Chapter 1 Observational research methods and self-c ontrolled designs
This chapter provides an introduction to observational research methods in pharmacoepidemiology
and the two most commonly used study designs: cohort and case-control. In addition, self-controlled
study designs are introduced and their main design features are described. The chapter concludes
with a summary of the observational research designs covered, with particular focus on four self-
controlled designs.
1.1 Why observational research to study drugs?
Randomized-controlled trials (RCTs) investigate the safety and efficacy of drugs versus a
comparator (another drug or placebo) within defined patient populations. By design, RCTs control
for confounding, and are thus considered the strongest research design to evaluate drug effects
when randomization and blinding criteria are met.1 However, although RCTs are the gold standard
research design to provide evidence of efficacy for drug approval, they are underpowered to study
safety outcomes.2 In addition, patients studied in RCTs are often not generalizable to the broader
population of patients who may be prescribed the drug in practice. In contrast, non-experimental
observational methods are used in pharmacoepidemiologic research to study drug effects among
patients as prescribed in real-world clinical practice, and these are critical to understand the safety
of prescription medications. In the last decade, the field of pharmacoepidemiology has experienced
rapid growth in publications.3,4 The increase over the last decade may partly relate to increased
availability of healthcare utilization data and the increased investment in post-marketing and
pharmacoepidemiologic research.5-7 Administrative databases are designed to collect and store data
generated through the routine administration of programs, such as social services, education and
healthcare utilization. Healthcare utilization data is a set of administrative data, commonly created
by governments or insurance companies to track use of healthcare services. Although these
databases were not originally designed for research, they are routinely utilized for research

2
purposes since they provide a rich source of healthcare information.8 For example, healthcare
utilization data permit the assessment of the patterns of drug use (pharmacy claims data) within the
healthcare system, and the subsequent impact of therapy on clinical outcomes (medical claims
data).9
Health Canada and the Canadian Institutes of Health Research have invested millions of
dollars in the establishment of the Drug Safety and Effectiveness Network (DSEN) since 2011.
DSEN funds observational research studies that leverage healthcare utilization data to answer
important drug safety and effectiveness questions.10 Similarly, since 2010 the Patient-Centered
Outcomes Research Institute (PCORI) in the United States supports the development of research
methodology to promote valid observational research methods, such as comparative drug safety
and effectiveness research.11 Initiatives such as DSEN and PCORI have enhanced the recognition
of the clinical importance of drug safety and effectiveness research that relies on observational
study designs to inform health care decision making and improve patient outcomes.10,11
1.2 Two most common observational study designs
The focus of this thesis is self-controlled designs, yet the traditional observational study designs –
cohort and case-control – are briefly introduced, Table 1.1 . The cohort and case-control are the
two most commonly used observational study designs.12
1.2.1 Cohort study design
The first cohort study in North America dates back to the late 1800s.13 Cohort studies examine the
risk or rate of an outcome among a group of individuals.14,15 A cohort can be defined as any group
of individuals that are at risk of experiencing an outcome.14 In pharmacoepidemiology, a cohort
study starts with drug exposure status (exposed or not, or different levels of drug exposure), and
follows the cohort of individuals over time to compare the outcome rate between exposure groups,
Figure 1.1 .16 A cohort study can assess multiple outcomes for a given exposure.16,17 However, a
large cohort is required to study rare outcomes. Cohort studies compare rates of disease outcomes

3
in exposed and unexposed individuals over time using risk ratios, (RR=rateexposed/rateunexposed).
Confounding factors may be difficult to ascertain, and if they are not adequately accounted for,
results may be biased, Box 1 .
Box 1. Confounding
Observational research methods may be limited when compared to RCTs because confounding
may threaten study validity. A confounding variable is: 1) a variable that is associated with drug
exposure, 2) a risk factor for the outcome of interest independent of the drug, and 3) is not on the
causal pathway between the exposure and outcome. If not properly handled (controlled), a
confounding variable can lead to a distorted (biased) risk estimate.3,4,18 Observational research
methods can accurately and reliably measure drug safety and effectiveness when confounding is
fully controlled for, but usually there is no way of knowing whether confounding has been fully
controlled.
1.2.2 Case-control study design
The origins and early development of the case-control study design date back to the early 1900s.19
In contrast to the cohort study design that starts with exposure status and looks forward, a case-
control study starts with a group of individuals who have experienced an outcome, called cases.
Cases are individually matched to non-cases (controls) who are similar yet have not experienced
the outcome. Once the 2 groups are matched, the researchers ‘look back’ using historical data to
determine whether or not past exposure was preferential among cases compared to controls,
Figure 1.2 .14
Case-control studies calculate the exposure odds ratios (OR=oddscases/oddscontrols) to
compare past exposure among cases and controls. ORs approximate RRs when outcomes are
rare.20 Case-control studies are advantageous to study rare diseases or outcomes efficiently, i.e., at
the first sign of a new safety signal. Case-control studies can assess multiple drug exposures, and
4
help understand long-term exposures since complete follow-up data is available.16,17 However,
sometimes controls may be difficult to select and exposures can be difficult to ascertain.
1.3 Methodological innovation in observational rese arch: self-controlled study designs
While the cohort and case-control designs are the most commonly used observational research
methods, their capacity to answer important drug safety and effectiveness questions is limited in
scenarios when: 1) outcomes are rare (cohort), 2) it is difficult to find matching controls (case-
control), or 3) there is unmeasured confounding that renders controlling for confounding too
difficult.5 To handle some of these limitations, self-controlled designs were developed that offer
innovative and alternative solutions.
Four self-matching designs were developed to conduct drug safety and effectiveness
research.5,21,22,23 The case-crossover, case-time control and case-case-time control study designs
(extensions of the case-control) and the self-controlled case-series study design (extension of the
cohort) are briefly described using terminology as originally presented in their respective seminal
publications,5,21-23 Table 1.2 . These methods (summarized below) are the focus of this research,
and are described in further detail in Chapter 3.
1.3.1 Self-controlled case-control study designs
1.3.1.1 The case-crossover (CCO) study design
The first self-controlled innovation was the case-crossover design in 1991. The case-crossover
study design was first described in epidemiology as an alternative to the case-control design to
identify the immediate determinants of myocardial infarction.5,7 The case-crossover study design is
analogous to a case-control design where the cases serve as their own controls. 5,6,24-27 Instead of
matching cases to similar controls at the same time point,5 this design matches cases to
themselves, and compares exposure status immediately before the outcome (hazard period ) with
exposure in designated control period(s) earlier in time, Figure 1.3 . Control periods may also
occur post-outcome such that they are bi-directional in nature. Case-crossover studies are

5
advantageous over cohort and case-control studies because they do not require difficult follow-up or
control selection.28 In addition, case-crossover studies have an inherent ability to control for time-
invariant confounders . These include factors not typically recorded in healthcare databases, such
as: long-term frailty, stable disease severity, regular over the counter drug and supplement use,
physical activity, diet, smoking, and alcohol consumption.22,25,29 This is because patients are
matched to themselves using within-individual comparisons for factors that remain constant over
time. However, this advantage is minimized when hazard and control periods are long because
stable confounders become more likely to change over longer periods of time.
Like its case-control analogue, the odds ratio is used to estimate risk in case-crossover
studies because every individual is a case that has experienced the outcome of interest.20 However,
case-crossover studies calculate ORs by comparing exposures in the hazard period to those in the
control period(s) using discordant pairs data only, since the cases are matched to themselves.20 The
OR is estimated from the cases exposed to the drug in the hazard period but not the control period,
B, and the cases exposed in the control period, but not the hazard period, C (Table 1.1) . These are
known as discordant pairs . Conversely, the concordant pairs have experienced no changes in
exposure status—they are the cases that were exposed or unexposed during both time periods and
thus contribute no information about the association between the drug exposure and the outcome. A
weighted OR can be estimated from matched pairs using the Mantel-Haenszel estimator or
conditional logistic regression. Interpretation of the case-crossover OR is the same as the case-
control.
1.3.1.2 The case-time control (CTC) study design
The case-time control study design was first proposed in 1995,21 Figure 1.4 . The case-time control
design is an extension of the case-crossover (and therefore the case-control), named for its
similarities with the case-control, and conducts two separate case-crossover studies: 1) a case-
crossover study in cases, and 2) a “case-crossover study” in a group of matched controls. The risk

6
estimate is calculated as a ratio of odds ratios between the two separate case-crossover studies
(ORcases/ORcontrols).21,30 The ratio of ORs is interpreted as the case-crossover odds ratio since
controls are self-matched. Case-time control studies are prone to many of the same advantages and
limitations as the case-control and the case-crossover. Case-time-control studies can be
advantageous over the case-crossover design to control for exposure time trends , i.e., in the
setting where drug use naturally changes over time, such as when drugs are newly introduced to
market, or following changes in drug formulary listing status.21 However, if confounding factors
associated with drug use; e.g. disease severity, change in the case group over time; the drug effect
estimates could remain confounded.30 In addition, although this design has a self-controlled
component, it does not alleviate the challenge of selecting sufficiently matched controls.
1.3.1.3 The case-case-time control (CCTC) study design
The case-case-time control study design was first proposed in 2011.22 The case-case-time control
design is an extension of the case-time control (and thus, case-crossover and case-control) design.
However, rather than using external controls, case-case-time control studies sample person-time
from future cases as controls for current cases to counter biases that may arise from exposure time
trends, Figure 1.5 .22
Case-case-time control analyses compare a ratio of odds much like case-time control
studies (ORcases/ORcontrols (future cases)). Case-case-time control methods do not sample person-time
after an outcome has occurred (i.e., no use of bi-directional controls). Unlike case-time control
designs, the case-case-time control minimizes the risk of selection bias that arises when controls
are selected. However, it may be difficult to match cases to controls derived from future cases since
longer study durations are required.22
1.3.2 Self-controlled cohort: the self-controlled c ase-series (SCCS) study design
The self-controlled case-series method was developed as an extension of the cohort study design in
1995 to estimate the relative risk of adverse events to assess vaccine safety, but can be more

7
generally applied to assess drug effects.31 In a recent review, 76% of self-controlled case-series
applications investigated vaccines.32 Like the self-controlled case-control design extensions, the
self-controlled case-series uses only cases. However, the design starts with an exposure rather than
outcome, and identifies periods when people are considered at greater risk of the event called risk
periods . Risk periods occur during and/or after each exposure. Baseline unexposed (control)
periods may include all other time periods of the observation period outside the risk period, in which
people are considered to be at baseline risk. Baseline unexposed periods may occur before or after
the risk periods. The incidence of events within risk periods are compared to those within baseline
unexposed periods, Figure 1.6 .32 Like a cohort study, the self-controlled case-series makes use of
all available temporal information without the need for selection of a control period, and calculates
the relative rate of an event to estimate risk (RR=Incidencerisk period(s)/Incidencebaseline control period(s)).33
Self-controlled case-series studies are advantageous to provide estimates of risk using only cases,
and they inherently control for time-invariant confounders . However, the benefit of the self-
controlled case-series method relies on critical design assumptions, including: occurrence of an
outcome does not affect the probability of future exposure; outcomes must be either independent
(for recurring events) or rare, and; when outcomes are recurring they cannot occur at the exact
same time.
1.4 Summary
Information provided by observational research is important for patient and physician prescribing
decisions, as well as for drug policy decision making. In this chapter, self-controlled methodological
innovations in observational research were introduced. Self-controlled designs complement
traditional observational study designs as research needs and resources (e.g. healthcare utilization
data) continue to change over time. The case-crossover design was developed to address a
research question that existing methodologies could not. Innovations of the case-crossover design
include the case-time control and case-case-time control designs that adjust for temporal changes in

8
drug use and prescribing practice. The self-controlled case-series design was initially developed to
study vaccines, yet can also be used to study a broad range of drug exposures. The remainder of
this thesis focuses on the three self-controlled case-control design innovations: case-crossover,
case-time control, case-case-time control ; and one self-controlled cohort design innovation: self-
controlled case-series . These designs share many common features, e.g. risk periods are
compared to referent periods to calculate risk. However, in spite of these similarities, it is apparent
from their original language that the terminology used to describe many of these features is varied.
A better understanding of self-controlled designs, how they have emerged in observational research
and who has been using them may provide some insight into the breadth of their applications, gaps
in pharmacoepidemiologic research methods and help to explain differences in self-controlled
language. The next chapter of this background section will describe the diffusion of innovations in
pharmacoepidemiology, using self-controlled designs as an example of methodological innovation.
The third and final background chapter will revisit self-controlled design features and conclude with
the objectives and hypothesis of this thesis research.

9
Table 1.1 Summary of traditional observational stud y designs: cohort and case-control. Design
(time of origin) Description Statistical Analysis (2x2 table) Strengths Limitations
Cohort
(19th century)
Follow-up to observe outcome based on drug
exposure status
Risk ratios, e.g. relative rate (RR):
A/(A+B) = Incidencerisk
C/(C+D) Incidencebaseline
Outcome No outcome
Exposed A B
Unexposed C D
• Can study multiple outcomes • Can study uncommon drug
exposures when cohorts are large
• Incidence data available therefore yields direct measures of relative risk
• Cohorts that don’t use historical data can take many years to complete
• Difficult to study rare outcomes when cohorts are small
• Subject to residual confounding (due to measurement error in confounders or unmeasurable confounders that are not controlled for)
Case-control
(20th century)
Match cases to control to compare drug exposure
based on outcome
Odds ratio (ORcase-control): A/C = A.D B/D B.C
Cases Controls
Exposed A B
Unexposed C D
• Can study many exposures • Can study uncommon outcomes
• Control selection difficult and problematic, can lead to bias
• Subject to residual confounding

10
Table 1.2 Summary of innovative, self-controlled ob servational study designs in pharmacoepidemiology. Self-controlled designs that are the focus of this thesis research: self-controlled case-control (case-crossover, case-time control, case-case-time control) and self-controlled cohort (self-control case-series). Design
(time of origin) Description Statistical Analysis (2x2 table) Strengths Limitations
Case-crossover
1991
Match cases to themselves at an earlier time point to compare
drug exposure based on outcome
Odds ratio (ORcase-crossover):
A/C = A.D B/D B.C
Control Period
Exposed Unexposed
Hazard Period
Exposed A B
Unexposed C D
• Efficient—self-matching • Efficient—uses only cases • Can use multiple control periods
for one hazard period • Controls for time-invariant
confounding • Can leverage Healthcare
utilization data*
• Requires careful selection of length and timing of periods otherwise can get very different results
• Recall bias for survey and questionnaire-based studies for different levels of disease severity
• Limited to transient drug exposures with acute outcomes
Case-time control
1995
Match cases to themselves at an earlier time point to compare
drug exposure based on outcome, then to
controls and compare ratios
Ratio of odds: ORcase-crossover ORcase-control
• Efficient—self-matching • Efficient—uses only cases • Like case-crossover design, with
the additional advantage of controlling for exposure time trends
• Control selection difficult • Like case-crossover study design
Case-case-time control
2011
Match cases to future case-controls at current
and referent cross-sections of time and
compare drug exposures and compare ratios
Ratio of odds: ORcase-crossover (cases)
ORcase-crossover (future-cases)
• Like case-time control • Minimizes risk of selection bias
since controls are an at-risk group of future cases and not an external non-case comparison group
• No need for bi-directional controls
• Like case-crossover study designs • Can be difficult to selected future
cases (controls) when duration of study is long
Self-controlled case series
1995
The incidences of events within risk periods are
compared to those within baseline control periods
Risk ratios. e.g. relative rate (RR):
Incidenceriskperiods
Incidencebaseline control periods
• Like case-crossover
• Advantageous to investigate vaccines or other drug exposures with short risk periods
• Difficult to choose how to define risk periods
• Probability of exposure must not be altered by a previous outcome
• Outcome must be independently recurring or rare
* All observational study designs leveraging healthcare/drug utilization data are subject to exposure and outcome misclassification. For example, start and stop time of vaccines administered by a physician are more likely to be accurately measured compared to “as needed” medications, such as NSAIDs.

11
Figure 1.1 Cohort study design. A follow-up study starting with exposure status: exposed (E) or unexposed (U), and then looks forward in time to see which individuals are at greater risk of experiencing the study outcome (E1, U1) or not (E0, U0). Yields risk ratios.
Figure 1.2 Case-control study design. The case-control study starts with outcome cases matched to controls, and then looks back in time to compare prior exposure status of cases and controls, i.e. exposed (E) or not (U). Yields odds ratios.

12
Figure 1.3 Case-crossover study design. The case-crossover study starts with an outcome, and compares exposure status within the same individual in the period immediately before the outcome (hazard period), and one or more period(s) in the past (control period). Control periods may be bi-directional, such that they also occur post-outcome, and are appropriate when the outcome does not affect the probability of future drug exposure. Hazard and control periods can vary in length and number. Yields odd ratios.
Figure 1.4 Case-time control study design. Two separate studies are completed and compared. One, a case-crossover analysis amongst cases who are matched to controls, and the second, a case-crossover analysis that is carried out in the control group. Thus, exposure history is compared: 1) between two time periods (current and reference) and 2) between two groups (cases and controls). Yields a ratio of odds ratios.

13
Figure 1.5 Case-case-time control study design. The “current” period (like hazard period) is a cross section of calendar time during which the event has occurred for the case, but not for the future case (control). The referent period (control period) is a cross-sectional sample of exposure history from the same subjects prior to the current period. This design samples current and referent time from cases, matches them to future case-controls and the exposure odds for the case is divided by the exposure odds ratio from the future case to estimate the exposure-outcome relationship, adjusting for potential bias from exposure time trends. Yields a ratio of odds ratios.
Figure 1.6 Self-controlled case-series study design . The self-controlled case-series starts with an exposure and looks at risk periods (can be pre- or post-exposure) to calculate the incidence of at least one outcome or event within risk periods compared to baseline (control) periods that make up the remainder of the study period. Yields risk ratios.

14
Chapter 2 The Diffusion of Innovations Theory
Self-controlled extensions of the traditional case-control (case-crossover, case-time control and
case-case-time control) and cohort (self-controlled case-series) are methodological innovations
that have emerged to facilitate pharmacoepidemiologic research. This chapter introduces the
Diffusion of Innovations Theory as the conceptual framework used to describe the diffusion of
self-controlled designs in pharmacoepidemiology.
2.1 Diffusion of Innovations Theory
How a methodological innovation is adopted for use in pharmacoepidemiology can be described
using Rogers’ Diffusion of Innovations Theory .34 The Diffusion of Innovations Theory was first
published in 1962, and since then over 5000 studies in a variety of disciplines have used the
theory to describe the adoption of an innovation.35 This theory states that: diffusion is the
process by which an innovation is communicated through certain channels over time among the
members of a social system. Thus, diffusion is comprised of four main elements: 1) an
innovation, 2) some means of communication or communication channels , 3) time , and 4) a
social system .36 The Diffusion of Innovations Theory can be interpreted visually by its many
parts (Figure 2.1 ) with a detailed summary included in Appendix A, Table A1 .
2.1.1 Innovation
An innovation is an idea, practice, or object that is perceived as new.36 The Diffusion of
Innovations Theory describes each self-controlled study design as an innovation technology. A
technology is typically comprised of two components: 1) the hardware component, which is
material and includes some equipment or product; and 2) the software component, which is the
intangible information base for the tool.37 However, methodological innovations or technologies
such as self-controlled designs are only comprised of the software component. The software

15
component is designed to reduce uncertainty in solving an existing problem or need, e.g., just
as the case-crossover method originated to fill a gap in observational research.5 An innovation
can be described by five key attributes:36
1) Relative advantage: perceived relative advantage over existing ideas or methods
2) Compatibility: perceived consistency with existing values and needs of potential adopters
3) Complexity: degree perceived to be difficult to understand or use
4) Trialability: degree can be tested (testing reduces uncertainty)
5) Observability: degree results are visible to others
2.1.2 Communication Channels
Communication channels are how messages of the innovation are passed between individuals.
Communication channels have two important components: 1) source , or origin of
communication, and; 2) the channel itself, or means of communication. Source and channel
can be further described:36
1) Source: an individual or an institution that originates a message. The source can be
outside the social system (cosmopolite ) or within the social system (localite ). The
more similar individuals who interact are (e.g., education, beliefs, institution, region),
the more likely the source will be effective
2) Channel: means by which a message gets from a source to an individual. May be:
• Interpersonal: can be outside or within the social system and involve direct
communication between individuals, e.g. meetings and targeted email

16
• “Mass” media: largely outside the social system such that one or few
individuals reach many, e.g., media, scholarly publications, and large
seminars and conference presentations
• Active vs. passive: degree targeted to individual (e.g., small seminar or
interpersonal email) vs. passive communication (e.g., publication)
One communication channel may be more effective than another depending on the
phase of the Innovation-Decision Process. The Innovation-Decision Process is comprised of
5 steps:36
1) Knowledge: occurs when an individual is exposed to the innovation’s existence and
gains some understanding of how it functions. Mass media channels; such as
television or in the case of the innovation of research methods in
pharmacoepidemiology, a plenary talk at a conference; are relatively more important
at the knowledge stage.
2) Persuasion: occurs when an individual forms a favourable or unfavourable attitude
toward the innovation. Interpersonal (direct communication) channels within the
social system are relatively more important at the persuasion stage. For example,
email exchange with the corresponding author of a seminal methods paper may
impact the attitude of an individual toward that particular study design.
3) Decision: occurs when an individual engages in activities that lead to a choice to
adopt or reject the innovation. For example, a researcher attends a workshop on
self-controlled study designs at a conference and decides to study the effects of
short-term drug use on an acute outcome, such as antibiotic use and Achilles tendon
rupture, using a self-controlled study design.

17
4) Implementation: occurs when an individual puts an innovation into use, yet remains
uncertain about the innovation. For example, a researcher conducts a case-
crossover study and a case-control study to compare the results of the
methodological innovation to a traditional methodology.
5) Confirmation: occurs when an individual seeks reinforcement of an innovation-
decision already made, but he or she may reverse this decision if exposed to
conflicting messages about the innovation, e.g., from peer-reviewer feedback on
submitted publications.
Differences in communication channel effectiveness also depend on the type of adopter
or adopter category . Cosmopolite channels outside the social system are relatively more
important for earlier adopters, and localite channels within the social system are relatively more
important for later adopters.36 This is because early adopters must rely on outside sources for
new information on innovations, whereas later adopters typically adopt the innovation once it
has reached their own social system and can rely on familiar members to explain the innovation
and build confidence in it.
Box 2 Adopter categories
There are five adopter categories: 1) innovators, 2) early adopters, 3) early majority, 4) late
majority and 5) laggards. Innovators are the first members of a group to adopt the technology.
Initially, few individuals use the technology and these people are labeled early adopters . Early
adopters’ leadership in adopting a new technology serves to reduce the uncertainty about the
innovation that other researchers may possess.36 Key opinion leaders are often early adopters
and play a pivotal role in disseminating innovation to potential adopters. The early and late
majorities comprise the majority of members of the social system to adopt an innovation.
Laggards are the latest members of the social system to adopt an innovation.

18
2.1.3 Time
The Innovation-Decision Process occurs simultaneously with the Innovation-Development
Process , which describes the lifecycle of a technology and is characterized by six phases: 1)
recognizing a problem or need, 2) research, 3) development, 4) commercialization, 5) diffusion
and adoption, and 6) consequences (Appendix A, Table A1 ).36 Together, these processes lead
to the decision of an individual to either adopt and implement, or reject an innovation.
The success of an innovation is indicated by the rate of adoption. The rate of adoption is
the number of individuals that adopt a technology over a specified period of time and tells us the
relative speed a technology is adopted by members of a social system. Visually this can be
interpreted by the steepness of the innovation adoption curve and the location of the chasm.
The chasm divides the curve into the five distinct adopter categories, Figure 2.2 . Innovators
and early adopters appear to the left of the chasm, where the innovation “takes off”. The early
and late majorities typically each represent about one-third of the members of the social
system to the right of the chasm.36 Eventually, the cumulative number of adopters plateaus, and
those adopting at this point are labelled laggards . The number of individuals that decide to
adopt an innovation is positively related to the rate of adoption of an innovation.
The five key attributes of an innovation (Section 2.1.1 ) are an important set of factors
that collectively impact the rate of adoption. Relative advantage, compatibility, trialability and
observability are positively related to the rate of adoption of an innovation. Complexity is an
innovation attribute that is negatively related to its rate of uptake. For example, discrepancies in
the language used to describe control periods of the self-controlled case-control designs may be
confusing, which can deter researchers from applying self-controlled research methods.
Other factors that impact the rate of adoption include the Innovation-Decision Process
and communication channels, as well as the nature of the social system and the change agents

19
present within it. A change agent is an individual who influences potential adopters’ decisions
in a direction deemed desirable by the change agency . That is, change agents seek to secure
or prevent the adoption of the innovation by providing a communication link between a resource
system of some kind (the change agency) and potential adopters.36 The impact of change
agents on the rate of adoption is dependent on several factors, such as their credibility, empathy
and contact with opinion leaders. In addition, the Innovation-Decision is not always optional, but
can also be authoritative (e.g. government enforced), or collective (i.e. “everyone is doing it”). If
an innovation is adopted by an authoritative organization, it is more likely to be adopted and will
be positively related to the rate of adoption. Conversely, the more people in the Innovation-
Decision making process, the slower the rate of adoption.
2.1.4 Social System
A social system is a group of individuals who work together towards a common goal, e.g.,
researchers, decision makers and funding agencies. Units in the social system may be
comprised of individuals, groups or organizations that choose whether to adopt or reject an
innovation. The decision whether or not to adopt a novel method in pharmacoepidemiology,
such as self-controlled designs, may depend on the structure of the social system, i.e., social
system norms, and member interconnectedness. In pharmacoepidemiologic research, funding
opportunities, competitions, and incentives are social system norms, and communication
channels may impact the member interconnectedness of a social system. For example, who
attends and presents at various conferences and length of time before a scholarly manuscript is
published in a peer-reviewed journal are communication channels within the social system that
may impact the adoption of an innovation. Social systems made up of relatively more key
opinion leaders are more likely to have a higher rate of adoption.
20
The diffusion of innovations can also be described by the centrality or decentrality of
social systems. A centralized system is one whereby overall control of decisions is by national
government administrators and technical subject-matter experts, in a top-down or linear way.
Decentralized systems, on the other hand, function on a more local scale, and decisions are
made between individuals that share and create information collectively based on the
assumption that members of the system have the ability to make sound decisions about how the
diffusion process is managed. In reality, systems through which innovations are diffused are
typically a combination of centralized and decentralized.
2.2 Social networks and social network analysis
Social networks are defined as sets of people, organizations or institutions with relationships or
interactions between them.34,38,39 Given the importance of connections between individuals in a
social system for the diffusion of an innovation, social network analysis can play an important
role in explaining the adoption and diffusion of methodological innovation in
pharmacoepidemiologic research. In particular, social networks can be used to examine who is
using which self-controlled method, with whom, and from where, e.g., countries, research
institutions and institution type.
2.2.1 Co-authorship network analysis
Co-authorship is one of the most well-documented forms of research collaboration.40 Co-
authorship networks seek to visualize connections between co-authors. Thus, co-authorship
network analysis is a type of social network analysis that identifies connections between
individuals who have co-authored papers. 41
A co-authorship network can be created from a matrix of associations that records the
number, strength and direction of co-authorship between pairs of authors and is visualized in a

21
sociogram . The matrix of associations includes the set of connections between co-authors to
be visualized as defined by the network boundaries . For example, the boundaries of a co-
authorship network analysis of empirical self-controlled studies include all full-text articles of
self-controlled applications in pharmacoepidemiology that are published in peer-reviewed
journals. Sociograms depict authors as nodes , with lines between nodes that connect the
authors and denote co-authorship called ties . They are also comprised of components , which
are clusters of individuals that make up subgroups within the sociogram and reveal co-
authorship collaboration within the network that can grow and change over time. Cut-points are
nodes whose removal would increase the number of components in the network. In this thesis,
cut-points will be referred to as “bridges” – authors who facilitate the flow of knowledge and
information between (at least) two groups of authors. Figure 2.3 illustrates how directed co-
authorship networks containing authors, ties, components and bridges are visualized
graphically. Papers 1, 2, and 3 were written by authors A, B and C; A and D; and E, F, G and H;
respectively, as indicated on the left hand side of the figure. Each author is represented by a
circle. Co-authorship ties are represented by arrows that connect circles of co-authors in the
sociogram on the right, from first author directed to co-authors. Authors A, B, C and D have not
published with authors E, F, G and H, thus the authors appear in 2 separate components.
Author A is a bridge because author A has published with authors B and C in Paper 1 and
author D in Paper 2, and if removed would separate the network into 3 components. Specific
analyses may be conducted to describe network properties and reveal the uptake and flow of
knowledge throughout a social system.
Centrality, measured by scores, is a structural property that explains how authors fit
relative to one another within the social system of a network.42 Individuals with high centrality
scores are often more likely to be early adopters or key opinion leaders of an innovation, and

22
promote the flow of information. In contrast, individuals with low centrality scores are typically
found toward the periphery of where they appear in co-authorship networks and work
independently. Degree centrality is defined by the number of ties an author possesses,
including ties directed outwards and ties directed inwards, Figures 2.4A-B . The higher an
author’s degree centrality, the higher the likelihood that they will have an influential part in the
flow of information throughout a network.43 Low degree centrality means that the flow of
information is more evenly distributed (decentralized). Other common measures of centrality
include betweenness and eigenvector.43 Betweenness centrality quantifies the number of times
an author acts as a bridge along the shortest path between two other authors, and functions as
a measure of how an author can control the flow of information within a network, Figure 2.4C .42
Betweenness centrality is calculated by finding all the shortest paths between any two
individuals in the network and counting the number of these shortest paths that go through each
author. High betweenness authors often do not have the shortest average path to everyone
else, but they have the greatest number of shortest paths that necessarily have to go through
them.42 The eigenvector centrality score measures the relative influence of an author based on
the number of ties neighbouring authors possess, Figure 2.4D .43 Highly connected authors
within highly interconnected components, have high eigenvector centrality. However, unlike
degree centrality, eigenvector centrality does not necessarily depend on the number of ties,
since a tie is deemed important because it is linked to other important authors.42
2.3 Summary
This chapter describes Rogers’ Diffusion of Innovations Theory and provides examples of how
the theory can be used to describe the diffusion of novel research methods such as self-
controlled designs in pharmacoepidemiology. Social network analysis performed using co-
authorship network analytic techniques will enable the study of the diffusion of the self-

23
controlled study design innovations amongst researchers in pharmacoepidemiology over time.
As recent demand by the public and governments to improve pharmaceutical drug safety has
yielded significant growth in the field,5-7,44 it is important to understand how the methods are
being applied over time, who is applying them, and how they are diffusing into the field of
pharmacoepidemiology. Measures of centrality can help to explain the diffusion of self-
controlled methods in pharmacoepidemiology. A closer look at self-controlled applications (e.g.
how self-controlled studies followed recommendations on methods and reporting) in Chapter 3
may also help to explain the trajectories of diffusion of self-controlled innovations. Chapter 3
concludes the background section of this thesis and presents the objectives and hypotheses of
this research.

24
2. Reject
1. Adopt Continued adoption
Late adoption
Discontinuation (active rejection)
Continued rejection (passive)
Decision
Diffusio
n
INNOVATION
The CCO study design
TIME INNOVATION
ATTRIBUTES: Relative advantage, Compatibility Complexity, Trialability, Observability
COMMUNICATION CHANNELS SOCIAL SYSTEM
ATTRIBUTES: Norms, Interconnectedness, Communication channels, Adopter categories
Increasing importance of localite (within one’s social system, e.g. interpersonal) versus cosmopolite (outside social system, e.g. peer-reviewed publication) channels
Recognizing a need
to innovate: Difficult to find
controls
Research Development
Applied research
knowledge to develop
CCO
Commercialization: Publication of CCO
seminal paper (Maclure,1991) in Am J Epidemiol
Developmen
t
Diffusion
and adoptio
n
Uptake of the
CCO in PE
Consequences
Figure 2.1
Rogers’ Diffusion of Innovations Theory. Diffusion of the case-crossover (CCO) design is depicted as an example of methodological innovation in
pharmacoepidemiology (PE).

25
Figure 2.2 Rate of adoption curve. Plot of adopter categories (separated by dashed lines (grey)) and adoption of an innovation over time (grey). Both curves are normal and represent the same adoption data—the adoption of an innovation follows a normal, bell-shaped curve (black) when plotted over time on a frequency basis. If the cumulative number of adopters is plotted, the result is an s-shaped curve, which plateaus over time. The chasm (black line) marks the period of time on the s-shaped curve where diffusion gains significant momentum and “takes off”.36
Figure 2.3 Graphical representation of a directed c o-authorship network . Left: circles represent authors and arrows linking co-authors represent co-authorship ties. Right: sociogram depicts author A as a bridge connecting Paper 1 and Paper 2. Authors A, B, C and D have not published with authors E, F, G and H thus the authors have no ties and groups of authors represent 2 separate components. Author A is a bridge (or cut-point, according to Rogers’ Diffusion of Innovations Theory), and if removed, three separate components would be created.

26
A. In-Degree centrality B. Out-degree centrality
C. Betweenness centrality D. Eigenvector central ity
Figures 2.4A-D Measures of Centrality. The three measures of centrality are illustrated: degree (in- and out-degree for directed networks), betweenness and eigenvector. In each figure, Author A is the most centralized author. Degree is the number of ties a node has (in=co-author, out=first author), betweenness assigns a value to a node based on the number of times a node acts as a bridge along the shortest path between two nodes and eigenvector provides a relative score measuring the influence of a node based on the number of ties its neighbours possess.
Higher scores indicate that an author is: an opinion leader (in-degree), collaborative (out-degree), a bridge (betweenness), or “a big fish in a big pond” (eigenvector).
NB: Centrality scores are influenced by the number of co-authors on a paper, thus are artificially inflated if the number of co-authors is high.

27
Chapter 3 Self-controlled designs in pharmacoepidem iology
This chapter takes a closer look at self-controlled applications in pharmacoepidemiology. In this
chapter, recent reviews of self-controlled designs in pharmacoepidemiology are summarized,
methodological recommendations that guide self-controlled observational research practices are
described, and the objectives and hypotheses of this thesis are presented.
3.1 Recent reviews of self-controlled literature
Three recent reviews of self-controlled study designs have demonstrated increased use over
time in drug safety and effectiveness research,6,32,44 one of which was led by me, focusing on
the case-crossover design and forms the preliminary results for this thesis; the full paper is
reprinted with permission in Appendix B . Methodological and reporting recommendations made
by each study are presented in Table 3.1 , and summarized below.
First, the case-crossover (n=50) and self-controlled case-series studies (n=45) were
reviewed through to September 2010 with the aim of analysing how the two designs have been
applied and reported in pharmacoepidemiologic literature.32 From their findings, this review
made six planning and seven reporting recommendations, such as: report the risk period
definition and the justification of their characteristics, i.e. the biological plausibility of the
exposure-outcome timing; sensitivity analyses must be conducted and reported to check the
robustness of particular methodology choices (e.g. risk and control period selection); and count
of discordant cases (case-crossover) and counts of events in the different time periods (self-
controlled case-series) should be reported.
Next, a narrative review published in 2012 assessed the medication exposures
investigated in self-controlled studies (34 self-controlled case-series, 25 case-crossover, 3 case-
crossover and case-time control, 2 sequence symmetry analysis and 1 case-crossover/self-
controlled case-series combination) that leveraged administrative data. This review was
instructional in nature and made recommendations to safety surveillance programs to inform

28
when self-controlled designs should be used as the primary method of surveillance or not, and
when self-controlled methods are complementary with cohort methods.6 To demonstrate the
feasibility of self-controlled studies in relation to the nature of the medical product or drug,
exposures were ranked and tabulated such that short exposures with increasingly accurate
exposure timing appeared higher on the table. That is, short observation window lengths that
are well-defined may be advantageous to use self-controlled methods over prolonged windows
that cannot be clearly ascertained from the data.
Finally, early in my thesis research I led a systematic review of the case-crossover
design through to July 2012 (Appendix B ),44 examining how studies aligned with the following
methodological and reporting recommendations: 1) exposure is one-time or short-term
(transient) with good measurement of start and stop, and minimal exposure time trend; 2)
biologically plausible exposure-outcome association and exposure windows; and 3) discordant
pairs data display. The majority of case-crossover studies met recommendations for drug
exposure, yet 6% of studies used bi-directional controls, which may be inappropriate in
pharmacoepidemiology because health outcomes often affect future probabilities of drug use. In
addition, only one third of all applications presented raw data on discordant pairs enabling
readers to reproduce odds ratios. Thus, this review recommended the following methodological
and reporting standards: 1) justify the biological plausibility of observation windows; 2) comment
on: i. potential exposure time trend, ii. validity of exposure (transient and measureable); and iii.
outcome (abrupt/acute and measureable) definitions; and 3) report raw discordant pairs
information.
Although the independent efforts to review self-controlled designs have contributed
much knowledge to the field, a more in depth assessment would be beneficial since no single
study has systematically reviewed all self-controlled designs in pharmacoepidemiology. In
addition, little is known regarding the change in application of self-controlled designs over time,

29
such as who is using what design, and how well self-controlled observational studies have
followed methodological and reporting recommendations. As described in Chapter 1, the field of
pharmacoepidemiology is rapidly evolving to meet the demands of drug safety and
effectiveness research post-market. Rogers’ Diffusion of Innovations Theory states that diffusion
is the process by which an innovation is communicated through certain channels over time
among the members of a social system. Thus, better understanding of how novel
methodological innovations evolve and diffuse in pharmacoepidemiologic research according to
Rogers’ Diffusion of Innovations Theory over time using co-authorship network analytic
techniques is of interest.
An overview of self-controlled study designs in Chapter 1 reveals that despite similarities
shared across the designs, there are variations in the language used to describe self-controlled
design features, such as, control periods. This is likely owing to the fact that each design was
developed independently and has subtle differences. For example, the hazard (case-crossover),
current (case-time control and case-case-time control), and risk (self-controlled case-series)
periods all represent equivalent periods of study time that relate to drug exposure. Better
understanding of the use of terminology within and between designs may help to develop
standardized terminology and improve clarity amongst readers and researchers.
3.2 Self-controlled recommendations
Recommendations that summarize original methodological criteria from self-controlled seminal
papers,5,21-23 and criteria developed by PCORI24 promote ideal self-controlled research and were
presented in my recent systematic review.44 Methodological recommendations on appropriate
exposures and outcomes are summarized below.
3.2.1 Exposures
Three methodological recommendations are specific to exposures:

30
1. One-time or short-term (transient),
2. Good measurement of start and stop, and
3. Minimal (exposure) time trend.
Self-controlled observational study designs were originally intended to study exposures
within subjects that are temporary, short-lived, potentially repeating and vary overtime, i.e. are
transient , Figure 3.1 .5,7 In self-controlled studies, observation windows examine periods of
drug exposure within defined periods of time. Observation window lengths are typically made up
of 2 parts: 1) the risk period, and 2) the induction period. The risk period represents the period
of time when the individual is at an increased risk of experiencing the outcome as a result of the
drug exposure. The duration of the risk period is determined based on pharmacokinetic
properties of the drug exposure (e.g. half-life). In instances when drug effects are not
instantaneous, the observation period includes an induction period. The induction period is the
initial stage from the time of drug consumption when there is not an increased biological risk of
experiencing the outcome, to the point in time at which the outcome is triggered (i.e. latency
period).7
Observation windows that are short are less prone to confounders that vary over time
and are thus less prone to bias related to exposure time trends. Since it is common in
pharmacoepidemiologic research that illness influences future use of medication,22 the case-
time control and case-case-time control designs were developed to help control for exposure
time trends.
3.2.2 Outcomes
Two methodological recommendations are specific to outcomes:6,24,32,44
1. Abrupt and acute, and
2. Clearly defined.

31
Abrupt and acutely occurring outcomes have sudden onset and short duration, Figure
3.2. It is important that all outcomes are abrupt to identify whether or not the outcome was
triggered by drug exposure in the observation window, and that all outcomes are clearly defined
such that timing of outcome onset is identifiable.5,7
Outcomes that recur over time are normally not studied using the self-controlled case-
control study designs (case-crossover, case-time control and case-case-time control), since
these methods start with the outcome of interest, and look at changes in exposure status during
different observation windows relative to a single outcome. Additional features of self-controlled
designs are presented in Appendix C .
3.2.3 Reporting recommendations
Three recent reviews summarized in Section 3.1 have also recommended a set of self-
controlled reporting standards. Recommendations that promote ideal reporting of self-controlled
designs include report of: appropriate use of design; risk period definition and justification, i.e.
biological plausibility of exposure and outcome timing; rationale for introducing washout periods
(if any); statistical method and estimator of risk used; sample size calculation; sensitivity
analyses conducted and results; risk estimator, 95% confidence interval; raw data display;
comment on potential exposure time trend; and comment on validity of exposure and outcome
definitions (Table 3.1 ).
3.3 Objectives
The overall objective of this thesis research is to describe the use and diffusion of self-
controlled designs in pharmacoepidemiology over time . More specifically, the objectives of
this research are to:

32
1. Systematically review the use of self-controlled designs in pharmacoepidemiology:
extensions of the case-control (case-crossover, case-time control and case-case-time
control), and cohort (self-controlled case-series) study designs; and
2. Complete a co-authorship network analysis and apply Rogers’ Diffusion of Innovations
Theory to describe the diffusion of pharmacoepidemiologic applications of self-
controlled studies over time.
3.3.1 Hypotheses
The hypotheses of this research are the following:
• The number of applied self-controlled studies will increase over time
• The proportion of applied self-controlled studies that follow recommendations will decrease
over time
• Language used to describe observation windows will vary within and between designs
• The co-authorship network will reveal that components made up of seminal authors will
contain more early adopters and key opinion leaders, bridges and institutions, than
components without seminal authors.
3.4 Summary
This chapter reveals that the use of self-controlled designs has been reviewed in
pharmacoepidemiology, yet unanswered questions remain. In particular, little is known
regarding the application of self-controlled designs over time, such as who is using self-
controlled designs, and how self-controlled studies have followed methodological and reporting
recommendations. Furthermore, there are disparities in the language used to describe self-
controlled observation windows within and between designs. Thus, the overall objective of this
thesis is to describe the use of self-controlled designs in pharmacoepidemiology and examine
the diffusion of self-controlled methodological innovations using a modified version of Rogers’

33
Diffusion of Innovations Theory and co-authorship network analytic techniques over time. The
next chapter is the first of three chapters in the research section of this thesis and describes the
methods used to meet the objectives of this research.

34
Table 3.1 Detailed methods/planning and reporting r ecommendations. From recommendations of three recent reviews of self-controlled study designs.6,32,44
Recommendation Methods/planning Reporting
Nordmann et al., 2012
• Should fulfill validity assumptions of the design • Risk and control periods definitions have to be
based on physiological evidence or hypotheses, referenced or validated by an expert group
• Risk period should be identical for all subjects. Sensitivity analysis on risk/control periods onset, end and duration should be planned
• Restriction times should be implemented if appropriate with identical risk and referent periods
• Conditional logistic regression for case-crossover and Poisson regression for self-controlled case-series must be applied and relevant estimator of risk must be used: OR for case-crossover designs and RR for self-controlled case-series designs
• Sample size should be estimated based on case-control method (case-crossover) or published sample size formula to calculate the sample size should be used (self-controlled case-series)
• Sensitivity analyses must be conducted to check the robustness of particular methodology choices, particularly risk and control period selection choice
• Report that setting is valid for the design implementation. In case of unfulfilled assumptions: lack of fulfilment should be stated, impact on results should be discussed, and if possible, comparison with other design(s) performed
• Report the risk period definition and the justification of their characteristics. Report sensitivity analyses results varying risk/control periods’ characteristics
• Report rationale for introducing restriction times if any • Report statistical method and estimator of risk used in
the materials and methods section. Report specific estimator with confidence interval in the results section. Use adequate denomination for risk estimators in reports: OR and RR
• Report the calculated sample size and all the elements necessary to reproduce the calculation
• Report all sensitivity analyses conducted and results • Report the risk estimator, 95% confidence interval: for
case-crossover, report count of discordant cases, for self-controlled case-series, report count of events in the different time periods
Maclure et al., 2012
• Self-controlled methods should not be used for surveillance when the dates the product was provided (e.g. dispensing date) are a poor measure of the actual times of use (e.g. as needed intake)
• Self-controlled designs can be used as the primary method of surveillance when the medical product is used on / immediately after an accurately recorded date (e.g. vaccine), when unmeasured time-invariant characteristics of the patients are suspected of confounding or selection factors in a cohort analysis, and when time-varying confounders can be accounted for
• Self-controlled methods may complement cohort methods; but can only be determined once immersed in the data, and the main threats to validity and the relative merits of the methods are understood
Consiglio et al., 2013
• Justify the biological plausibility of exposure windows
• Comment on potential exposure time trend • Comment on the validity of exposure and outcome
definitions • Report raw discordant pairs information
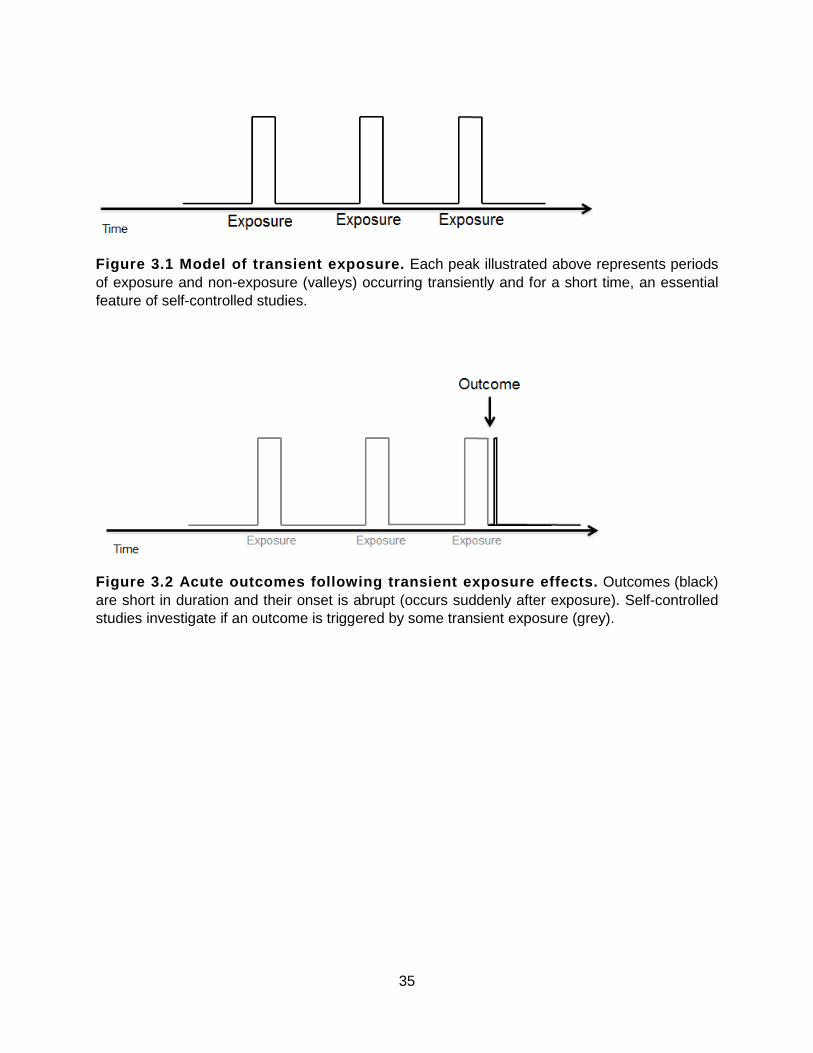
35
Figure 3.1 Model of transient exposure. Each peak illustrated above represents periods of exposure and non-exposure (valleys) occurring transiently and for a short time, an essential feature of self-controlled studies.
Figure 3.2 Acute outcomes following transient expos ure effects. Outcomes (black) are short in duration and their onset is abrupt (occurs suddenly after exposure). Self-controlled studies investigate if an outcome is triggered by some transient exposure (grey).

36
SECTION B: THESIS RESEARCH
Chapter 4 Methods
This chapter describes the methods used to investigate the research objectives of this thesis
presented in Chapter 3.
4.1 Systematic review
We leveraged and updated two existing systematic reviews32,44 to include all English language
articles that used self-controlled designs in pharmacoepidemiology through to December 31,
2013.21,25 First, we pulled all empirical applications of case-crossover, case-time control, case-
case-time control and self-controlled case-series in the area of pharmacoepidemiology identified
in the existing systematic reviews. Next, we updated existing reviews and searched MEDLINE®
and EMBASE® databases since inception to December 31, 2013, with keyword terms (Table
4.1) and restricted to studies investigating drug exposures in humans and published in the
English language. We then used Web of Science® and performed a citation search to identify
papers that referenced the case-crossover, case-time control, case-case-time control and self-
controlled case-series study design seminal papers.5,21-23 Inclusion of the citation search was
important since it contributed ten percent of application papers included in my review of the
case-crossover study design.44 Empirical applications of self-controlled case-control designs
(case-crossover, case-time control, case-case-time control) and the self-controlled cohort
design (self-controlled case-series) in the area of pharmacoepidemiology were eligible. Studies
investigating drug adherence, rather than drug effects, were excluded from our review because
they did not examine a biological effect of therapy, and instead examined reasons for returning
to therapy after a gap in treatment. Two researchers (G.P.C. and Erin A. Cicinelli, University of
Toronto pharmacy student) searched and reviewed all abstracts and full-text articles as
necessary to exclude articles that did not meet eligibility criteria. Papers were restricted to full-

37
text publications up to December 31, 2013 to visualize a complete year of research.
Discrepancies were resolved by agreement.
All eligible papers were alphabetized in EndNote® and split into two equal parts by first
author last name: 1. Aberra to Juurlink, and 2. Kang to Zinman. Two researchers (G.P.C. and
E.A.C.) each independently abstracted data from one half of the total eligible papers, and
double checked the abstraction of the complement. Paper characteristics including year,
author(s), institutions, study design, data source, primary outcome, exposure details, and
terminology used to describe observation windows were abstracted from eligible application
papers. Additional outcome and exposure details were abstracted and included length of
observation windows, outcome onset, use of washout period, use of post-outcome referent
windows (case-crossover) or pre-exposure risk windows (self-controlled case-series), sensitivity
analyses (e.g., multiple hazard/control periods, or hazard/control periods of varying length), and
raw data display. Exposures were grouped by drug class, and outcomes were grouped by event
(e.g. death, hospitalization or motor vehicle collision) or disease type (e.g. cardiovascular,
gastrointestinal or respiratory).
4.1.1 Analysis
A study flow diagram was created to detail the systematic review inclusion and exclusion
criteria. A proportional Venn diagram was created to illustrate the number of papers that
originated from each search strategy. The number of eligible application papers was plotted by
calendar year and study design. Paper characteristics, study design, study criteria and self-
controlled terminology were tabulated.
4.1.2 How applied self-controlled studies follow re commendations over time
As detailed in Chapter 3, methodological recommendations state that exposures should be: 1)
one-time or short-term (transient), with 2) good measurement of start and stop, and 3) minimal

38
(exposure) time trend; and outcomes are: 1) abrupt and acute, and 2) clearly defined. In
addition, recent reviews list several criteria for ideal self-controlled reporting such as raw data
display for reproducible calculations of odds or risk ratios. The number of applied self-controlled
studies that have followed specific methodological and reporting recommendations was
investigated, and stratified into two groups: self-controlled case-control (case-crossover, case-
time control, case-case-time control) or self-controlled cohort (self-controlled case-series).
Whether or not studies followed existing recommendations was assessed based on the data
abstraction and categorized as: “followed recommendations ,” “somewhat followed
recommendations ,” or “did not follow recommendations, ” Table 4.2 . Methodological and
reporting criteria that were undefined or could not be categorized definitively upon assessment
were considered “did not follow recommendations.” The proportion of papers that followed
recommendations were plotted over time: before and after 2011, and in five segments
(Appendix F : 1992-2001, 2002-2004, 2005-2007, 2008-2010 and 2011-2013).
The specific methodological recommendation on exposures was assessed for “one-time
or short-term (transient)” exposures. The specific methodological recommendations on
outcomes assessed whether or not outcomes were “abrupt and acute” in two ways: 1) based on
outcome onset, i.e., the biological plausibility of the exposure-outcome timing; and 2) based on
observation window length. Papers were not assessed for methodological recommendations on
exposures for good measurement of start and stop and minimal (exposure) time trend, nor
methodological recommendations on outcomes that they are clearly defined, because these
criteria rely on the data (i.e. the validity of data source) and thus could not be determined.
Reporting recommendations that were assessed included: raw data display and report of
outcome onset, i.e. biological plausibility of the exposure-outcome timing. The two reporting
recommendations that were assessed were selected from the complete set listed in Section

39
3.2.3 and Table 3.1 because they suggest report of features that are critical to self-controlled
designs.44
4.2 Co-authorship network analysis
All empirical applications of self-controlled case-control (case-crossover, case-time control,
case-case-time control) and self-controlled cohort (self-controlled case-series) studies were
included and comprised the boundaries of the co-authorship network. Analyses were examined
using a modified version of Rogers’ Diffusion of Innovations Theory.
4.2.1 Network creation
Cytoscape (Version 3.1.0)50 network creation software was used to create a co-authorship
network to visualize the diffusion of self-controlled designs in pharmacoepidemiologic research
over time.45 Cytoscape and UCINET 6 software (Version 6.526)46 were used for the co-
authorship network analyses. Microsoft Excel macros developed by Dr. David Dubins at the
Leslie Dan Faculty of Pharmacy at the University of Toronto enabled the creation of association
matrices and tables that were imputed into Cytoscape and UCINET software.
First, all authors from eligible empirical papers were imputed in order of authorship into
an Excel worksheet that was linked to macros. Next, the macro converted the complete author
list by paper into an association matrix that listed all authors and connected them according to
their collaboration as co-authors. In addition to the creation of the matrix, the macro generated a
table that listed primary and co-author connections that were imported into Cytoscape for
analysis. The sociogram created in Cytoscape was directed, such that arrows connect first
authors to co-authors; undirected sociograms connect all authors in a single paper using lines
instead of arrows and thus do not enable the visualization of first authors (arrows pointing out)
to co-authors (arrows pointing in). Recall from Chapter 2 that authors are represented by nodes.
The size of each node was created proportional to the number of articles published by that

40
author, and node shape represented the method(s) used: diamond for case-crossover, chevron
for case-time control, hexagon for case-case-time control, circle for self-controlled case-series,
triangle for case-crossover/case-time control and self-controlled case-series combinations, and
square for multiple methods used over time. Seminal author (first author) nodes were coloured
grey so that they could be easily visualized in the network. Co-authorship networks were
generated overall, i.e. from 1992 to December 31, 2013, and over time. A graphics interchange
format (GIF) file was created from annual images of the network to visualize the network
growing over time. Stationary images were created to visualize diffusion over time (by year) in
this thesis document.47 The network from 1992-2013 was stratified by design, i.e. self-controlled
cohort (self-controlled case-series) or self-controlled case-control (case-crossover, case-time
control, case-case-time control), and by component.
4.2.2 Network analyses
Three separate co-authorship networks were analysed: 1) all four self-controlled study designs;
2) self-controlled case-control study designs (case-crossover, case-time control, case-case-time
control); and 3) self-controlled cohort (self-controlled case-series) study design. All three
networks were analysed over time (by year) and for institutional affiliation and centrality
measures. The main network (all self-controlled study designs) was also analysed by
component. The total number of bridges ( or cut-points, according to Rogers’ Diffusion of
Innovations Theory)36 and number of ties between authors were also determined using
Cytoscape software.
4.2.2.1 Institutional affiliation
Institutional affiliations of the first, second and last authors of eligible papers, were tabulated.
Traditionally, the position of authors is decided by contribution such that the first author
contributes most and also receives most of the credit.48 However, sometimes (particularly in

41
pharmacoepidemiology) the overall contribution of the last author is most important and
represents the senior author, e.g. thesis supervisor.48 This is because the senior author is
assumed to be the driving force, both intellectually and financially, behind the research.48 Based
on discussions, the second author was included because they are also important such that may
contribute unique expertise to the research, e.g., when the last author is a thesis supervisor and
the research includes a component outside the supervisor’s expertise. Departments and
divisions were collapsed into the main institution whenever possible. For example, authors with
affiliations from St. Michael’s Hospital or Li Ka Shing Knowledge Institute at St. Michael’s
Hospital were ascribed to St. Michael’s Hospital. The institutional credit of each institution was
determined using the Excel macro function for institutional affiliation. From institutional affiliation,
institution type e.g., academic institutions (schools or hospitals), government, or industry, and
institution country were extrapolated.
4.2.2.2 Centrality
Influential members of the social system were identified using three centrality measures
calculated by UCINET: degree, betweenness and eigenvector.43 Degree centrality was
measured from the number of ties an author possesses. If an author had a high in-degree
centrality, they were considered prominent members of the co-authorship network, i.e., opinion
leaders , such that many authors sought to publish with them. The higher the out-degree of
centrality, the higher the likelihood that authors were collaborative and influential on the uptake
of self-controlled designs throughout the network since they published with many others.
Betweenness centrality was calculated by finding all the shortest paths between any two
authors in the network and counting the number of shortest paths that go through each author.42
Authors with high betweenness centrality are more likely to act as bridges between two groups
of co-authors, and were considered critical to the collaboration and uptake of an innovation
across the network. Eigenvector centrality was calculated by constructing pairwise connections

42
between all authors in the network (1 for connected, 0 for not), and then a single number was
assigned to each author while attempting to keep the distances between these new values
equal to the distances observed in the association matrix.43 Authors with high eigenvector
centrality were highly interconnected to authors with high degree centrality, and their relative
influence on the network, i.e., on neighbouring co-authors, was considered high.

43
Table 4.1 List of terms used to search MEDLINE® and EMBASE® databases from inception to December 31, 2013
Operator Case-crossover Case-time control Case-case-time control Self-controlled case-series
‘OR’
‘case-crossover’
‘case crossover’
‘case cross-over’
‘case-time control’
‘case-time-control’
‘case time control’
‘case time-control’
‘case-case-time-control’
‘case-case-time control’
‘case-case time control’
‘case-case time-control’
‘case case-time-control’
‘case case-time control’
‘case case time-control’
‘self-controlled case-series’
‘self-controlled-case-series’
‘self-controlled case series’
‘self-controlled-case series’
‘self controlled-case-series’
‘self controlled-case series’
‘self-controlled case-series’
‘NOT’ ‘randomized controlled trial’ ‘RCT’
Limits humans, English

44
Table 4.2 Assessment of self-controlled designs and methodological and reporting recommendations. List of criteria used to identify whether or not self-controlled designs followed recommendations on methods and reporting.6,24,32,44
Recommendation Follows recommendation?
Yes Somewhat No Methodological Exposure One-time or short-term (transient)*
• Professionally-administered
• Self-administered: one-time or short-term drug utilization
Self- administered: long-course drug utilization**
Self- administered: “as needed” drug utilization
Outcome *** Immediate (0-3 days)
Immediate (0-7 days)
Intermediate (4-30 days)
Intermediate (8-30 days)
Prolonged (> 30 days)
Prolonged (> 30 days)
Abrupt (sudden onset)
Risk period (biological)
Observation window (design)
Reporting
Raw data display Discordant pairs or event counts and person-time
• Raw discordant pairs data for reproducible odds ratio
• Raw event data and person-time for reproducible relative incidence
Raw data report yet risk ratio is non-reproducible e.g., adjusted ratio reported
No raw data; irreproducible ratio
Outcome onset Comment on biological plausibility of exposure-outcome timing
Onset reported with evidence
Timing unknown and under investigation
Onset not reported
*Mode of administration and drug utilization patterns identified by G.P.C. were double-checked (Usama El-Bayoumi, PharmD, PhD Student) for accuracy.
**Long-course drug utilization was categorized as “somewhat followed recommendations.” This rationale was founded upon 2 factors: 1) methodological recommendations on self-controlled studies suggest that exposures are one-time or short-term, and 2) the suitability of prolonged exposures to self-controlled methods under certain conditions (as demonstrated previously).27
***Outcome periods were derived from published self-controlled literature. For example, studies investigating abrupt outcomes had an onset of hours to days.5,6,32,49 Thus, a window spanning “0-3 days” was chosen for biological risk period. To account for potential delays in actual drug consumption leading to outcome onset, observation windows that follow recommendations are longer, “0-7 days”. Studies that noted investigating “long” outcome onset studied onsets occurring greater than one month after exposure.27 Distribution of observation window frequency was plotted (Appendix D ) to verify the selection of the 30-day cut point. The intermediate period was selected to complement the immediate and prolonged periods and spans the remaining 4-30, and 8-30 days.

45
Chapter 5 Results
A total of 176 unique papers applying self-controlled methods were identified: 90 self-controlled
case-control (79 case-crossover, 5 case-crossover/case-time control, 5 case-time control and 1
case-case-time control), 85 self-controlled cohort (i.e. self-controlled case-series), and 1
combination (case-crossover/self-controlled case-series), Figure 5.1 .50-225 From the keyword
search strategies, 66 papers (38%) were common to all three strategies (EMBASE®,
MEDLINE® and Web of Science®). EMBASE® contributed the most papers to the network (142
papers), slightly more compared to MEDLINE® (137 papers). EMBASE® and MEDLINE®
searches had 60 papers (34%) in common; 10 EMBASE® papers and 7 MEDLINE® papers
were unique. Web of Science® contributed 99 papers to the network; 6 papers were in common
with EMBASE®, 4 papers were in common with MEDLINE®, and 23 papers (13%) were unique,
Figure 5.2 . The number of eligible application papers is plotted by calendar year and study
design in Figure 5.3 . Initial use of self-controlled designs in pharmacoepidemiology was slow,
with few applications until 2000 (3 self-controlled case-control, 2 self-controlled cohort). Since
2001, the number of applications and unique authors increased rapidly across both self-
controlled case-control and cohort studies over time. In particular, there is a rapid increase since
2010 with 88 applications (50%; 41 self-controlled case-control, 46 self-controlled cohort)
published from 2011 to 2013. Another curve of the number of cumulative authors over time is
plotted on the same figure and is similarly increasing over time, with a steeper increase in
cumulative number of authors since 2011 (358 unique authors before 2011, 405 authors since
2011). The steep increase evident from 2010 to 2011 in the number of self-controlled
applications and authors represents the chasm of the adopter curve (Section 5.5).
5.1 Exposures and outcomes
Overall, self-controlled case-control- and cohort-based applications investigated a diverse set of
drug exposures and outcomes, Table 5.1 . Appendix E, Table E1 includes details of each

46
application paper. Primary drug exposures included: vaccine (38%; 6% self-controlled case-
control, 72% self-controlled cohort), psychotropic (24%; 32% self-controlled case-control, 16%
self-controlled cohort), analgesic (7%; 13% self-controlled case-control), antibiotic/antiinfective
(6%; 10% self-controlled case-control, 1% self-controlled cohort), cardiovascular (6%; 8% self-
controlled case-control, 4% self-controlled cohort), respiratory (4%; 7% self-controlled case-
control, 1% self-controlled cohort). Sixteen percent examined other drugs, such as isotretinoin
for severe acne, and the anti-retroviral drug nevirapine. Primary outcomes investigated were
categorized as events (44%) or diseases (60%). The most common outcomes investigated
included: hospitalization (15%; 21% self-controlled case-control, 8% self-controlled cohort),
cardiovascular/cerebrovascular disease (15%; 19% self-controlled case-control, 11% self-
controlled cohort), and autoimmune disease (12%; 4% self-controlled case-control, 21% self-
controlled cohort).
Study characteristics were also examined over time, Tables 5.2 A-B . Fifty percent of all
applications were published from January 1, 2011 to December 31, 2013: 46% self-controlled
case-control and 53% self-controlled cohort. Changes occurring over time were apparent in
exposures: the proportion of vaccines investigated using self-controlled case-control studies
decreased (i.e., 10% before 2011, none since 2011); yet, the proportion of self-controlled cohort
studies investigating vaccines was consistently high, and increased over time (i.e., 69% before
2011, 75% since 2011). Changes in outcomes investigated over time were also apparent: self-
controlled case-control studies investigated gastrointestinal outcomes early on (8% before
2011); yet only one study investigated gastrointestinal outcomes since 2011. Conversely, an
increasing number of self-controlled case-control (i.e., 16% before 2011, 26% since 2011), and
self-controlled cohort (5% before 2011, 11% since 2011) studies investigated hospitalization
outcomes over time.

47
5.2 Other self-controlled design features
Overall, 19% of observation windows were longer than 30 days (20% self-controlled case-
control, 17% self-controlled cohort), and 45% were 8 to 30 days in length (45% self-controlled
case-control, 42% self-controlled cohort). Washout periods to eliminate the carry-over of drug
effects were used in 55% of studies: 68% self-controlled case-control, 41% self-controlled
cohort; and increasingly over time. Sensitivity analyses were performed in 75% of studies: 76%
self-controlled case-control, 73% self-controlled cohort; and this was also increasing over time.
Reproducible odds ratios were more common in self-controlled case-control studies (31%) than
self-controlled cohort applications (13%). The majority (83%) of all self-controlled applications
utilized administrative data: the proportion of self-controlled case-control studies utilizing
administrative data was increasing over time, yet the proportion of self-controlled cohort studies
remained stable over time.
5.3 Self-controlled studies and recommendations ove r time
The proportion of self-controlled applications that followed methodological and reporting
recommendations was plotted over time in Figures 5.4-5.8 (before 2011, since 2011) and
Appendix F (1992-2001 and four, 3-year groupings). The proportion of self-controlled case-
control applications that followed methodological recommendations on exposures decreased
over time: 39% before 2011 and 24% since 2011, Figure 5.4A . There was little change in the
proportion of self-controlled cohort applications that followed methodological recommendations
on exposures over time: 81% before 2011 and 78% self-controlled cohort since 2011, Figure
5.4B. The proportion of papers that followed methodological recommendations on biological
onset of outcomes was fairly stable over time in self-controlled case-control studies, Figure
5.5A, and increased over time in the self-controlled cohort studies (30% before 2011 and 47%
since 2011), Figure 5.5B . The proportion of papers that followed methodological
recommendations on outcome onset based on observation window length was fairly stable over

48
time in self-controlled cohort studies, Figure 5.6B , and the proportion of those that did not follow
recommendations on outcome onset based on observation window length decreased over time
in self-controlled case-control studies (39% before 2011 and 14% since 2011), Figure 5.6A .
An increasing proportion of papers reported raw data for odds ratio calculations over
time for self-controlled case-control studies (25% before 2011 and 60% since 2011), and an
increasing proportion of self-controlled cohort did not report raw data for risk ratio calculations
over time (85% before 2011 and 100% since 2011), Figure 5.7 . The proportion of self-controlled
case-control papers that reported outcome onset, i.e. biological plausibility of exposure-outcome
timing, varied over time, Figure 5.8. In self-controlled cohort studies, the proportion of papers
that reported the outcome onset was decreasing (100% before 2011 and 60% since 2011). An
increasing proportion of self-controlled cohort applications somewhat followed
recommendations on report of outcome onset (7% before 2011 and 23% since 2011).
5.4 Language
The terminology and frequency of terms used to describe “observation windows” of self-
controlled applications in pharmacoepidemiology is tabulated in Table 5.3 . The most commonly
used terms to describe windows (hereafter called “index” windows in this thesis) that occur
immediately before the outcome of self-controlled case-control studies were: case (45%),
hazard (20%) and at-risk/risk (18%). The most commonly used terms to describe “index”
windows that occur immediately after the exposure of self-controlled cohort studies included: at-
risk/risk (76%), exposure/exposed (31%) and high risk (8%). Control (80%) was the most
commonly used term to describe “referent” windows of self-controlled case-control studies.
Greater than 13 terms were used at least once per application to describe “referent” windows of
self-controlled cohort studies: control (33%), unexposed (21%) and baseline (15%) were most
commonly used.

49
5.5 Co-authorship network analysis overtime
Overall, the co-authorship network was comprised of 176 papers, 763 unique authors, and 46
components; 30 components included only a single-paper, Figure 5.9 . The diffusion over time is
presented in Figure 5.10A-P . Arrows are directed from first author to co-authors of each paper.
Node size is proportional to the number of published articles and indicates the method(s) used:
diamond for case-crossover, chevron for case-time control, hexagon for case-case-time control,
circle for self-controlled case-series, triangle for case-crossover/case-time control and self-
controlled case-series combinations, and square for multiple methods used over time.
Ray et al. from Vanderbilt University in the US published the first paper using self-
controlled designs (self-controlled case-control) in 1992, Figure 5.10A . This was the only paper
published by these authors in the network and thus these authors formed a single paper
component in the network. In 1995, two papers appeared in the network: one self-controlled
cohort published by seminal author or innovator Farrington et al. from the Public Health
Laboratory of London, and one by Sturkenboom et al. from the University Centre of Pharmacy in
the Netherlands (Figure 5.10B ). Another self-controlled case-control design appeared in the
network in 1998 (Barbone et al.), forming its own component in the final network, Figure 5.10C .
In 2000, Farrington co-authored the only paper added to the network (self-controlled cohort) by
Dourado et al. and thus self-controlled cohort studies became linked, while networks of self-
controlled case-control studies remained fragmented (Figure 5.10D ). In 2001, 8 papers were
added to the network: six self-controlled cohort studies and two self-controlled case-control, for
a total of seven components in the network (Figure 5.10E ). At this time, the first bridges
appeared in the network joining separate components of self-controlled cohort co-authors:
Gargiullo (Centers for Disease Control and Prevention), and Farrington (Public Health
Laboratory, London and The Open University). The component containing Farrington as a
bridge was comprised of five self-controlled cohort applications, and was predominately

50
London-based; yet two papers were from South American Institutions (Dourado et al. and
Sardinas et al.), and one co-author (Crowcraft) was from the University of Toronto, Canada.
Also in 2001, self-controlled case-control studies persisted as single-paper components in the
network. One paper was published in 2002 (self-controlled case-control) by a Canadian group of
authors (Neutel et al. from the University of Ottawa) and formed another single self-controlled
case-control component that persisted to 2013, Figure 5.10F . In 2003 (Figure 5.10G ), the
network contained 21 papers and nine components (five single paper components). The first
combination paper was published in 2003 by Hernandez-Diaz et al., combining self-controlled
case-control (case-crossover and case-time control) methods. A new bridge, Viboud (self-
controlled case-control) appeared in the network, bridging Etienney et al. and French
researchers initially publishing in 2001 (Fagot et al.). Four additional papers contributed to the
network in 2004 (Figure 5.10H ): two single component papers (self-controlled case-control),
and two papers (self-controlled cohort) added to each of the largest components of the network.
Chen acted as a bridge (self-controlled cohort), for one addition to the network (Mutsch et al.)
and Farrington contributed to a ninth paper in the network, evidenced in the network by the
increasing node size. In 2005, nine papers and 61 authors were added to the network: the
majority were self-controlled cohort (56%). In 2005 (Figure 5.10I ), seminal author (innovator)
Maclure appeared as a single component and seminal author (innovator) Suissa became a
bridge connecting an Italian group of authors using the case-time control design and a
Canadian group of authors using the case-crossover design. Thus, Suissa represented a
change agent introducing methodological innovation to new and different groups. In 2006
(Figure 5.10J ), eight new papers and 61 new authors contributed to the network. Institutional
affiliations appearing in the network in 2006 were from varying geographical locations: Denmark
(Gislason et al.), US (Hambidge et al. (Colorado), Hunter et al. (Boston), Biskupiak et al.
(Utah)), Canada (Juurlink et al.), London (Stowe et al., Hughes et al.), and Scotland (Cameron

51
et al.). Eight papers and 47 authors were added to the network in 2007 (Figure 5.10K ),
including the first case-time control application by Kjaer et al. from Denmark and new bridges
that continue to increase the size of the 2 largest components (Crowcroft and Jacobsen). There
were 15 single paper components in the network as of 2007; the majority were self-controlled
case-control designs. Eleven papers and 57 new authors appeared in the network in 2008,
Figure 5.10L . The network comprised five two-paper components and 17 single paper
components. London-based authors contributed an additional four self-controlled cohort papers
to the component containing Farrington at this time, and one additional paper (self-controlled
case-control) was added to this component via the Canadian bridge and change agent
(Crowcroft). Fourteen papers were added to the network in 2009 Figure 5.10M . Already
interconnected parts of the network became increasingly interconnected and the network
continued to grow in size (e.g., nodes Andrews, Farrington, Gislason, and Smeeth became
larger). This included a self-controlled case-control application (case-crossover) from London-
based authors Hubbard and Smith, who had previously only published self-controlled cohort
applications, and the second case-time control application (from the Institute of Clinical and
Evaluative Sciences, St. Michael’s Hospital and the University of Toronto in Toronto, Canada).
Four new single components were added to the network in 2010; three applied the self-
controlled case-control design, Figure 5.10N . In total, 14 papers were published in 2010; the
majority of studies (79%) were self-controlled case-control. Three self-controlled case-control
papers added to the network formed two-paper components (Chang, Lee, and Velthove). Co-
author Lagarde was a bridge between seminal author Suissa and first author Orriols from the
National Institute of Health and Medical Research in France. Other additions to the network
such as Huang and Olesen, similarly contributed to the Suissa-containing component of the
network. However, these authors appeared on the other side of the Gargiullo bridge relative to
Suissa. In general, the component containing the Suissa brigde utilized mixed self-controlled

52
methods, compared to the Farrington-containing component that was comprised of mostly self-
controlled cohort studies, with self-controlled case-control on the periphery. Thirty-six percent of
all applied self-controlled studies in 2010 were published in Asia and Australia. The largest
increase in number of papers (n=33), unique authors (n=225), and thus overall network size
(n=38 components in total; 14 multi-paper components and 24 components containing a single
paper) occurred from 2010 to 2011. As seen in the graph of number of authors over time,
(Figure 5.3 ) this point in time may represent the chasm when the diffusion of self-controlled
designs gains significant momentum and “takes off” among early adopters. The network
became increasingly interconnected: authors from the University of Groningen, Erasmus
University Medical Centre, and PHARMO Institute in the Netherlands collaborated with authors
Toh and Hernandez-Diaz from Boston and Harvard Universities forming a 5-paper component;
and seminal author Maclure joined a three-paper component in 2011 because of collaboration
between researchers from Boston and Harvard Universities (Figure 5.10O ). Thirty-six percent
of papers in 2011 were published by Canadian (15%) and US (21%) institutions. Three papers
by Wilson et al. from Ottawa, Canada were added to the large, Farrington-containing
component of the network. Patel first-authored a paper with 34 co-authors, including bridge-
author Gargiullo, and thus became linked to the Suissa-containing component of the network. In
2012, there was a decline in the number of new papers (n=27) and number of components
(n=37; 14 multi-paper components and 23 components containing a single paper), yet an
increase in the number of new authors (n=233), Figure 5.10P . The two largest components of
the network became connected when change agent Pariente, from the Universities of Montreal
and Bordeaux, joined the network after co-authoring a self-controlled case-control paper with
Moore (from Orriols et al.), and authoring a self-controlled cohort paper co-authored by
Farrington. Seminal author (innovator) Wang published an application of the self-controlled
case-control methodological innovation (the case-case-time control, developed in 2011) in 2012,

53
and collaborated with Maclure, thus Wang and four co-authors were added to this existing
component.
In 2013, 28 papers were added to the final network: 195 authors publishing 14 self-
controlled case-control studies and 14 self-controlled cohort studies. The overall network was
comprised of 17 bridges and 46 components: 31 components consisted of only one paper; 61%
self-controlled case-control, and 39% self-controlled case-series. Nearly 20% of components
consisted of two papers and 4% consisted of three papers. The largest component consisted of
97 papers and 433 authors including seminal authors Farrington and Suissa, Figure 5.12A .
Self-controlled cohort studies made up 69% of the largest component, and in general, self-
controlled case-control studies continued to be found on the periphery of the largest component.
Overall, the second largest component was relatively small compared to the first component
and was comprised of nine papers (16 authors), Figure 5.12B . The third largest component was
comprised of seven papers (24 authors), including seminal authors Maclure and Wang, Figure
5.12C.
5.5.1 Institutional affiliations
From 1992 to 2001, 23 institutions contributed to the co-authorship network, and the number of
institutions increased over time to 106 by 2011. From 2011 to 2013, an additional 83 institutions
contributed to the network, thus, 189 unique institutions contributed to the co-authorship
network overall, Table 5.4 . The highest contributing institutions of the network included: Health
Protection Agency, London (6%), University of Nottingham (6%), and National Taiwan
University (4%). The most common institution types were: academic (schools 54% and hospitals
18%), and government (20%). The highest contributing countries of the network included: US
(24%), UK (23%), Canada (13%). Similar institutional contributions were seen in the largest
component of the network when a separate analysis was conducted by component, Table 5.5A .
The most common institutions appearing in the second largest component included: Harvard

54
University (42%), Boston University (29%), and Brown University (13%). The most common
institutions appearing in the third largest component included: National Taiwan University (52%),
National Taiwan University Hospital (22%), and Center for Drug Evaluation, Taiwan (15%),
Table 5.5B .
Over time, the network shifted from the majority of affiliations from Vanderbilt University
in the US, to UK- and other American-based institutions. Academia (schools and hospitals),
government, and private insurance companies were consistently among the top four institution
types over time. Other institutions types included: pharmaceutical industry, pharmaceutical
consulting companies, independent research organizations and not-for-profit research
organizations. Seminal author Farrington’s affiliated institution, Open University (4.2%), made a
top institutional contribution to the network from 2001-2004. No other seminal authors’
institutional affiliations appeared in the top five institutions of the entire network over time.
Overall, the proportionate contribution from Canadians slowly decreased over time. From 2011
to 2013, the US surpassed the UK as the most common country contributing to the network
(UK: down 9% from 2010).
5.5.2 Network centrality
Table 5.6 summarizes the centrality of the network over time. Seminal author Farrington had
the highest in-degree and betweenness centrality, indicating that Farrington was an opinion
leader and a bridge between groups of co-authors. Miller had the highest eigenvector centrality,
indicating that Miller is an author highly connected to opinion leaders and other influential
authors, within a highly interconnected component. Farrington maintained the highest in-degree
and betweenness centrality from 1992 to 2013. Authors with the top three out-degree centrality
scores varied in institution and country over time, compared to the in-degree, betweenness and
eigenvector centrality scores. Overall, Dodd and Patel had the highest out-degree centrality,
indicating increased collaboration and influence on the uptake of self-controlled designs

55
throughout the network, however, this metric is flawed since it is heavily weighted on co-author
counts.
The remaining authors with highest in-degree, betweenness, and eigenvector centrality
were primarily from UK-based institutions, including: Open University (Farrington), University
College London (Andrews, Taylor), University of Nottingham (Hubbard), and Health Protection
Agency, London (Miller, Stowe). The remaining authors with highest out-degree centrality were
from institutions in the US (Dodd, Patel, Hambigde), the National Institute of Health and Medical
Research in France (Orriols), and Gentofte University Hospital and National Institute of Public
Health, in Copenhagen, Denmark (Gislason). Similar patterns of centrality were seen in the
largest component of the network when a separate analysis was conducted by component,
Table 5.7 , and by design Tables 5.8-9 .
5.5.3 Co-authorship networks – by design
Co-authorship between 406 authors publishing 91 self-controlled case-control and 391 authors
publishing 85 self-controlled cohort studies was visualized in two separate networks, Figures
5.13-14. The self-controlled case-control network was comprised of 39 components (62% of
components contained a single paper) and the self-controlled cohort network was comprised of
16 components (75% of components contained a single paper). Ten bridges were identified in
the self-controlled case-control network, and six bridges were identified in the self-controlled
cohort network.
The highest contributing institutions of the self-controlled case-control network included:
National Taiwan University (7%), Seoul National University (5%) and Gentofte University
Hospital, Harvard University, and University of Pennsylvania (4%). The majority of institutions of
the self-controlled case-control network were academic (86%), and 38% of all institutions were
from the US and Canada, Table 5.10 . The highest contributing institutions of the self-controlled
cohort network included: Health Protection Agency, London (13%), University of Nottingham

56
(12%), London School of Hygiene and Tropical Medicine (7%), and University of Ottawa and
University College London (6%). Academia comprised 47% of the institution type of the self-
controlled cohort network, followed by 32% government. Forty-five percent of all institutions
were from the UK. Self-controlled cohort Institutional contributions to the network were nearly
identical to the largest component of the overall network, Table 5.11 .
Self-controlled case-control author Gislason had high out-degree centrality scores most
frequently over time (Table 5.8), indicating that he is an opinion leader in the network. However,
Gislason’s out-degree centrality was decreasing over time. Gislason also had the highest
betweenness centrality, indicating that Gislason was a bridge between groups of co-authors,
and his betweenness centrality was increasing over time. Authors such as Orriols had the
highest in-degree centrality, indicating a common co-author in the self-controlled case-control
network. Orriols also had the highest eigenvector centrality in 2013, indicating that Orriols is an
author highly connected to influential and opinion leaders, within a highly interconnected
component. Centrality patterns of the self-controlled cohort network were similar to those seen
in the largest component of the overall network, Tables 5.5 , 5.9.

57
Table 5.1 Study characteristics of empirical self-controlled extensions of the case-control and cohort designs applied in the area of pharmacoepidemiology overall (1992-2013), n=176.
Self -controlled case-control
N=91*
Self -controlled cohort N=86*
TOTAL, N=176
Study characteristic n % n % N % Primary exposure
Analgesic 12 13.2 0 0.0 12 6.8 Antibiotic/antiinfective 9 9.9 1 1.2 10 5.7 Cardiovascular 7 7.7 3 3.5 10 5.7 Psychotropic 29 31.9 14 16.3 42 23.9 Respiratory 6 6.6 1 1.2 7 4.0 Vaccine 5 5.5 62 72.1 67 38.1 Other** 23 25.3 5 5.8 28 15.9
Primary outcome Event 47 51.6 25 29.1 71 40.3
Falls 4 4.4 3 3.5 7 4.0 Hospitalization 19 20.9 7 8.1 26 14.8 Motor vehicle 9 9.9 2 2.3 10 5.7 Other 15 16.5 13 15.1 28 15.9
Disease 44 48.4 61 70.9 105 59.7 Autoimmune 4 4.4 18 20.9 22 12.5 Cardio/cerebrovascular 17 18.7 9 10.5 26 14.8 Gastrointestinal 5 5.5 9 10.5 14 8.0 Hepatic/renal 5 5.5 1 1.2 6 3.4 Respiratory 3 3.3 2 2.3 5 2.8 Other** 10 11.0 22 25.6 32 18.2
Observation windows ≤7 days 24 26.4 19 20.9 43 24.4 8 to 30 days 41 45.1 38 41.8 79 44.9 >30 days 18 19.8 15 16.5 33 18.8 variable 6 6.6 11 12.1 17 9.7 undefined 1 1.1 3 3.3 4 2.3
Exposure time trend Bi-directional control 4 4.4 29 33.7 33 18.6 Pre-exposure risk period n/a n/a 22 25.6 22 12.4
Washout periods Washout 62 68.1 35 40.7 97 54.8 Undefined 9 9.9 1 1.2 10 5.6
Sensitivity analyses 69 75.8 63 73.3 133 75.1 Raw data display
Adjusted ratios presented 3 3.3 15 17.4 18 10.2 Reproducible ratios 28 30.8 11 12.8 39 22.0
Data Source*** Administrative data 73 80.2 70 81.4 143 81.3 Medical records/chart review 11 12.1 11 12.8 22 12.4 Survey or questionnaire 7 7.7 3 3.5 10 5.6 Other** 7 7.7 3 3.5 10 5.6
*Includes case-crossover/self-controlled case-series combination paper. ** Complete list of “Other” in Appendix E, Table E1 . ***Studies will add to greater than 100% because multiple data sources used per paper.

58
Tables 5.2A-B Summary characteristics over time. Summary of characteristics by self-controlled design type, overtime (1992 to 2010).
Table 5.2A. Self-controlled case-control studies (case-crossover, case-time control, case-case-time control), N=49.
1992-2001
n=5
2002-2004
n=6
2005-2007
n=13
2008-2010
n=25
2011-2013
n=42
Study characteristic n % n % n % n % n % Primary exposure
Analgesic 0 0.0 1 16.7 2 15.4 5 20.0 4 9.5
Antibiotic/antiinfective 0 0.0 0 0 2 15.4 3 12.0 4 9.5
Cardiovascular 0 0.0 0 0 1 7.7 2 8.0 4 9.5
Psychotropic 2 40.0 1 16.7 3 23.1 7 28 16 38.1
Respiratory 0 0.0 0 0 1 7.7 3 12.0 2 4.8
Vaccine 1 20.0 3 50.0 1 7.7 0 0.0 0 0.0
Other* 2 40.0 1 16.7 3 23.1 5 20.0 12 28.6
Primary outcome
Event 3 60.0 3 50.0 5 38.5 10 40.0 26 61.9
Falls 0 0.0 1 16.7 0 0.0 1 4.0 2 4.8
Hospitalization 0 0.0 0 0.0 3 23.1 5 20.0 11 26.2
Motor vehicle collision 2 40.0 0 0.0 0 0.0 2 8.0 5 11.9
Other 1 20.0 2 33.3 2 15.4 2 8.0 8 19.0
Disease 2 40.0 3 50.0 8 61.5 15 60.0 16 38.1
Autoimmune 0 0.0 0 0.0 2 15.4 2 8.0 0 0.0
Cardio/cerebrovascular 0 0.0 0 0.0 4 30.8 5 20.0 8 19.0
Gastrointestinal 0 0.0 1 16.7 1 7.7 2 8.0 1 2.4
Hepatic/renal 0 0.0 0 0.0 0 0.0 1 4.0 4 9.5
Respiratory 0 0.0 0 0.0 1 7.7 2 8.0 0 0.0
Other* 2 40.0 2 33.3 0 0.0 3 12.0 3 7.1
Observation windows
≤7 days 2 40.0 2 33.3 3 23.1 5 20.0 12 28.6
8 to 30 days 0 0.0 1 16.7 3 23.1 13 52.0 24 57.1
>30 days 1 20.0 3 50.0 5 38.5 4 16.0 5 11.9
variable 1 20.0 0 0.0 1 7.7 3 12.0 1 2.4
undefined 1 20.0 0 0.0 0 0.0 0 0.0 0 0.0
Bi-directional control 0 0.0 1 16.7 1 7.7 2 8.0 0 0.0
Washout periods
Washout 4 80.0 3 50.0 4 30.8 20 80.0 31 73.8
Undefined 0 0.0 1 16.7 5 38.5 2 8.0 1 2.4
Sensitivity analyses 3 60.0 4 66.7 7 53.8 19 76.0 36 85.7
Raw data display
Adjusted ratios presented 0 0.0 0 0.0 0 0.0 1 4.0 2 4.8
Reproducible ratios 2 40.0 4 66.7 4 30.8 3 12.0 15 35.7
Data Source** Administrative data 3 60.0 2 33.3 10 76.9 18 72.0 40 95.2 Medical records/chart review 2 40.0 3 50.0 2 15.4 2 8.0 2 4.8
Survey or questionnaire 2 40.0 2 33.3 1 7.7 2 8.0 0 0.0
Other* 0 0.0 0 0.0 1 7.7 4 16.0 2 4.8
*Complete list of “Other” in Appendix E, Table E1 . **Studies will add to greater than 100% because multiple data sources used per paper.

59
Table 5.2B. Self-controlled cohort study (self-controlled case-series), N=41. 1992-2001
n=8 2002-2004
n=5 2005-2007
n=13 2008-2010
n=16 2011-2013
n=44
Study characteristic n % n % n % n % n %
Primary exposure Analgesic 0 0.0 0 0.0 0 0.0 0 0.0 0 0.0
Antibiotic/antiinfective 0 0.0 0 0.0 0 0.0 1 6.3 0 0.0
Cardiovascular 0 0.0 0 0.0 0 0.0 0 0.0 3 6.8
Psychotropic 0 0.0 1 20.0 3 23.1 4 25.0 6 13.6
Respiratory 0 0.0 0 0.0 0 0.0 0 0.0 1 2.3
Vaccine 8 100 4 80.0 9 69.2 8 50.0 33 75.0
Other** 0 0.0 0 0.0 1 7.7 3 18.8 1 2.3
Primary outcome
Event 1 12.5 1 20.0 2 15.4 3 18.8 18 40.9
Falls 0 0.0 0 0.0 0 0.0 0 0.0 3 6.8
Hospitalization 1 12.5 0 0.0 0 0.0 1 6.3 5 11.4
Motor vehicle collision 0 0.0 0 0.0 0 0.0 2 12.5 0 0.0
Other 0 0.0 1 20.0 2 15.4 1 6.3 9 20.5
Disease 7 87.5 4 80.0 11 84.6 12 75.0 27 61.4
Autoimmune 1 12.5 0 0.0 4 30.8 4 25.0 9 20.5
Cardio/cerebrovascular 0 0.0 1 20.0 2 15.4 4 25.0 2 4.5
Gastrointestinal 3 37.5 0 0.0 2 15.4 0 0.0 4 9.1
Hepatic/renal 0 0.0 0 0.0 1 7.7 0 0.0 0 0.0
Respiratory 0 0.0 1 20.0 0 0.0 0 0.0 1 2.3
Other** 3 37.5 2 40.0 2 15.4 4 25.0 11 25.0
Observation windows
≤7 days 2 25.0 1 20.0 2 15.4 2 12.5 12 27.3
8 to 30 days 4 50.0 3 60.0 6 46.2 5 31.3 20 45.5
>30 days 0 0.0 1 20.0 4 30.8 4 25.0 6 13.6
variable 1 12.5 0 0.0 0 0.0 4 25.0 6 13.6
undefined 1 12.5 0 0.0 1 7.7 0 0.0 1 2.3
Pre-exposure risk period 2 25.0 1 20.0 7 53.8 4 25.0 8 18.2
Washout periods
Washout 6 75.0 2 40.0 4 30.8 7 43.8 31 70.5
Undefined 1 12.5 0 0.0 0 0.0 0 0.0 0 0.0
Sensitivity analyses 4 50.0 4 80.0 11 84.6 11 68.8 33 75.0
Raw data display
Adjusted ratios presented 0 0.0 0 0.0 3 23.1 4 25.0 8 18.2
Reproducible ratios 1 12.5 0 0.0 0 0.0 0 0.0 10 22.7
Data Source*
Administrative data 6 75.0 4 80.0 10 76.9 14 87.5 36 81.8
Medical records/chart review 2 25.0 0 0.0 1 7.7 2 12.5 6 13.6
Survey or questionnaire 0 0.0 1 20.0 0 0.0 0 0.0 2 4.5
Other** 0 0.0 0 0.0 2 15.4 0 0.0 1 2.3
* Studies will add to greater than 100% because multiple data sources used per paper.
**Complete list of “Other” in Appendix E, Table E1 .

60
Table 5.3 Language. List and frequency of language used to describe “observation windows” such as “index,” “referent,” and “windows” of self-controlled study designs.
*Observation windows include the “index” window immediately before the outcome or following exposure, “referent” or control window, and the terminology to describe the “window” itself, as indicated in each paper. **Includes case-crossover/self-controlled case-series combination paper. ***Proportions sum to greater than 100% since multiple terms could be used to describe observation windows in one paper.
Term* Self-controlled case-control
N=91**
Self-controlled cohort N=86**
n %*** n %*** “Index” At-risk/risk/high risk 17 18.7 72 83.7 Case 41 45.1 0 0 Case-observation 1 1.1 0 0 Current exposure 1 1.1 0 0 Exposed/exposure 2 2.2 27 31.4 Follow-up 0 0 1 1.2 Hazard 19 20.1 0 0 Index 5 5.5 0 0 Period after 0 0 1 1.2 Post-index time 1 1.1 0 0 Post-vaccination 0 0 3 3.5 Recent time 1 1.1 0 0 Time before event/index 3 3.3 0 0 Treated 0 0 1 1.2 Withdrawal 0 0 1 1.2 Not clearly stated 3 3.3 3 3.5 “Referent” Background risk 0 0 5 5.8 Baseline 0 0 13 15.1 Baseline (unexposed) control 0 0 6 7.0 Comparison 2 2.2 0 0 Control 73 80.2 29 33.7 Control effect 1 1.1 0 0 Low risk 0 0 2 2.3 Non-exposed 3 3.3 0 0 No(n)-risk 0 0 4 4.7 Period before 0 0 1 1.2 Pre-index time/time prior to index 4 4.4 0 0 Reference/referent 6 6.6 8 9.3 Time before vaccination 0 0 1 1.2 Time in follow-up 0 0 1 1.2 Time outside/not at risk 0 0 3 3.5 Unexposed 0 0 18 20.9 Untreated 0 0 1 1.2 Not clearly stated 6 6.6 12 14.0 “Window” Days/date 3 3.3 0 0 Interval 9 9.9 10 11.6 Period 71 78.0 84 97.7 Person-time 0 0 1 1.2 Time (period) 5 5.5 3 3.5 Window 0 0 16 18.6 Not clearly stated 2 2.2 2 2.3

61
Table 5.4 Institutional affiliations. Percentage of top institutions, institution types and country of institutions from all self-controlled designs over time.
1992-2001
% 1992-2004
% 1992-2007
% 1992-2010
% 1992-2013
% Institution Boston University 0 2.8 3.4 1.9 1.7 Centers for Disease Control and Prevention 12.8 9.7 5.2 3.2 2.5 Communicable Disease Surveillance Centre 2.6 1.4 <1 <1 <1 Gentofte University Hospital 0 0 <1 4.3 2.1 Health Protection Agency, London 12.8 6.9 11.6 9.8 6.4 Kaiser Permanente 2.6 4.2 2.9 2.3 2.9 London School of Hygiene and Tropical Medicine 0 2.8 1.4 5.9 3.3 National Taiwan University 0 0 0 1.7 3.7 Public Health Laboratory, London 2.6 1.4 <1 <1 <1 Seoul National University 0 4.2 2.0 1.1 2.5 The Open University 5.1 4.2 2.0 1.1 <1 University Centre for Pharmacy 5.1 2.8 1.4 <1 <1 University College London 7.7 4.2 6.8 3.8 2.8 Universidade Federal da Bahia 7.7 4.2 2.1 1.1 <1 University of Groningen 2.6 1.4 <1 <1 <1 University Hospital, Nottingham 2.6 4.2 11.6 7.6 5.7 University of Udine 2.6 1.4 <1 <1 <1 Vanderbilt University 7.7 4.2 2.0 1.1 1.1 Institution Type Academia, hospital 12.6 9.1 18.3 20.3 19.0 Academia, school 46.0 51.7 47.5 49.5 53.9 Government 39.4 29.4 27.5 25.3 20.4 Private insurer 1.9 6.3 4.0 2.9 3.4 Other 0 3.5 2.7 2.0 3.3 Country Australia 5.9 3.4 1.7 2.0 4.1 Brazil 5.9 3.4 1.7 2.0 1.1 Canada 14.7 10.3 8.5 7.8 12.7 Denmark 0 0 7.5 10.5 5.9 Netherlands 14.7 8.0 5.7 4.2 3.4 South Korea 0 6.9 3.4 2.0 4.5 Taiwan 0 0 0 5.4 7.9 United Kingdom 27.5 32.2 32.8 31.3 22.8 United States 21.6 26.4 27.7 22.5 23.7

62
Tables 5.5A-B Institutional affiliations – by compo nent.
Table 5.5A. Percentage of top institutions, institution types and country from the largest component of the network.
1992-2001
%
1992-2004
%
1992-2007
%
1992-2010
%
1992-2013
%
Institution
Centres for Disease Control and Prevention 16.7 13.7 7.9 5.3 4.2
Communicable Disease Surveillance Centre 3.3 2.0 1.0 0.6 0.3
Direccion Nacional de Epidemiologia 6.7 3.9 2.1 1.3 0.3
Gentofte University Hospital 0 0 0.8 7.1 2.9
Health Protection Agency, London 16.7 13.7 17.7 16.5 9.3
Hospital Neurologique 5.0 2.9 1.6 0.9 0.3
Kaiser Permanente 3.3 5.9 4.4 3.9 5.3
London Schools of Hygiene and Tropical Medicine 0 3.9 2.1 8.8 4.2
Public Health Laboratory, London 3.3 2.0 1.0 0.6 0.3
Royal Victoria Hospital 2.5 1.5 1.6 0.9 0.4
Sunnybrook Health Sciences Centre 0 0 0.9 1.2 1.3
The Hospital for Sick Children 0 0 1.6 0.9 0.4
The Open University 6.7 5.9 3.1 1.9 0.7
University Centre for Pharmacy 6.7 3.9 2.1 1.3 0.8
University College London 10 9.8 10.4 6.3 3.4
Universidade Federal da Bahia 10 5.9 3.1 1.9 0.6
University of Groningen 3.3 2.0 1.0 0.6 1.4
University of Nottingham 3.3 9.8 17.7 0.6 7.2
University of Ottawa 0 0 0 0 8.5
University of Toronto 0 0 2.5 3.1 5.1
Institution Type
Academia (Hospital) 8.3 15.0 26.5 26.0 40.6
Academia (Schools) 38.6 55.0 47.1 46.0 31.3
Government 48.4 20.0 20.6 24.0 22.9
Private Insurance 4.5 5.0 2.9 2.0 1.0
Other 0 5.0 2.9 2.0 4.2
Institution Country
Australia 0 0 0 0 8.3
Brazil 10.0 5.9 2.9 2.0 1.0
Canada 10.0 5.9 20.6 22.0 27.1
Denmark 0 0 17.6 12.0 10.4
France 0 0 2.9 6.0 9.4
Italy 0 0 2.9 6.0 3.1
Netherlands 10.0 5.9 5.9 4.0 5.2
United Kingdom 43.3 49.0 20.6 20.0 11.5
United States 20.0 29.4 17.6 22.0 18.8

63
Table 5.5B. Percentage of top institutions, institution types and country from the second and third largest components of the network.
Component 2 Component 3
1992-2013
% 1992-2010
% 1992-2013
%
Institution
Boston University 0 50.0 31.0
Brigham and Women’s Hospital 0 0 3.6
Brown University 0 0 13.1
Cathay General Hospital 2.8 0 0
Center for Drug Evaluation 11.5 0 0
En Chu Kong Hospital, Taiwan 5.0 0 0
Far Eastern Memorial Hospital, New Taipei 6.5 0 0
Havard University 0 25.0 41.7
National Health Research Institutes, Taipei 3.7 0 0
National Taiwan University 45.6 0 0
National Taiwan University Hospital 25.0 0 0
Pfizer Inc. 0 12.5 3.6
University of British Columbia 0 0 3.6
University of Victoria 0 12.5 3.6
Institution type
Academia (Hospital) 40.0 25.0 20.6
Academia (Schools) 56.3 18.75 42.8
Government 9.5 50 33.3
Private Insurance 0 6.25 3.3
Other 3.2 0 0
Country
Canada 0 29.2 8.3
Taiwan 100 0 0
United States 0 70.8 91.7

64
Table 5.6 Centrality of the network – overall. Top three centrality scores* of network of all self-controlled designs over time.
1992-2001 1992-2004 1992-2007 1992-2010 1992-2013
In-degree Andrews N 1 1 4 4 6 Chen RT 1 3 4 4 4 Farrington CP 4 7 7 7 9 Gargiullo PM 2 2 2 3 5 Hubbard R 0 2 2 4 5 Miller E 2 2 5 5 5 Smeeth L 0 1 2 4 4 Stowe J 2 2 3 3 4 Taylor B 3 3 3 4 4 Waight P 2 2 2 2 4 Out-degree Dodd CN 0 0 0 0 34 Farrington CP 8 8 8 8 8 France EK 0 10 10 10 10
Gislason GH 0 0 10 16 16 Hambidge SJ 0 0 18 18 29 Kramarz P 11 11 11 11 11 Martins IS 0 0 0 14 14 Murphy TV 11 11 11 11 11 Orriols L 0 0 0 0 31 Patel MM 0 0 0 0 34 Betweenness Andrews N 4 7 25 27.5 161.5 Farrington CP 36 72 105 158 318 Hubbard R 0 7 10 44.5 83.5 Miller E 12 24 43 59 125.5 Smeeth L 0 6 6 47.5 57.5 Eigenvector Andrews N 0.38 0.40 0.15 0.23 0.43 Farrington CP 0.57 0.49 0.41 0.37 0.29 Hubbard R 0 0.14 0.50 0.45 0.27 Miller E 0.47 0.53 0.20 0.28 0.46 Stowe J 0.18 0.16 0.08 0 0.41 Tata LJ 0 0.12 0.49 0 0.24 *Centrality scores: degree is the number of ties an author has (in-degree as co-author, out-degree as first author), betweenness assigns a value to an author based on the number of times an author acts as a bridge along the shortest path between two authors and eigenvector provides a relative score measuring the influence of an author based on the number of ties its neighbours possess. Higher scores indicate that an author is: an opinion leader (in-degree), collaborative (out-degree), a bridge (betweenness), or “a big fish in a big pond” (eigenvector). NB: Centrality scores are influenced by the number of co-authors on a paper, thus are artificially inflated if the number of co-authors is high.

65
Tables 5.7A-B.Centrality of the network – by compon ent.
Table 5.7A. Top three centrality scores* of network of all self-controlled designs of the largest component over time.
1992-2001 1992-2004 1992-2007 1992-2010 1992-2013
In-degree Andrews N 1 1 4 4 6 Chen Robert T 1 3 4 4 4 Farrington CP 4 7 7 7 9 Gargiullo PM 2 2 2 2 4 Hubbard R 0 2 2 4 5 Miller E 2 2 5 5 5 Smeeth L 0 1 2 4 4 Stowe J 2 2 3 3 3 Taylor B 3 3 3 4 4 Waight P 2 2 2 2 2 Out-degree Dodd CN 0 0 0 1 34 Farrington CP 8 8 8 8 8 Fosbol EL 0 0 0 11 11 France EK 0 11 10 10 10 Gislason GH 0 0 10 16 16 Hambride SJ 0 0 18 18 29 Kramarz P 11 11 11 11 11 Murphy TV 11 11 11 11 11 Patel MM 0 0 0 0 34 Orriols L 0 0 0 7 31 Sturkenboom MCM 5 5 5 5 5 Tata LJ 0 5 10 10 10 Betweenness Andrews N 4 7 25 27.5 161.5 Farrington CP 36 72 105 158 318 Hubbard R 0 7 10 44.5 83.5 Miller E 12 24 43 59 125.5 Smeeth L 0 6 6 47.5 57.5 Stowe J 0 0 10 26 76 Taylor B 0 0 22 35.5 97 Eigenvector Andrews N 0.381 0.40 0.15 0.23 0.43 Farrington CP 0.569 0.49 0.41 0.37 0.29 Hubbard R 0 0.14 0.50 0.45 0.27 Miller E 0.467 0.53 0.20 0.28 0.46 Smeeth L 0 0.12 0.28 0.30 0.18 Smith C 0 0.04 0.28 0.24 0.14 Stowe J 0.181 0.16 0.08 0.21 0.41 Tata LJ 0 0.12 0.49 0.42 0.24
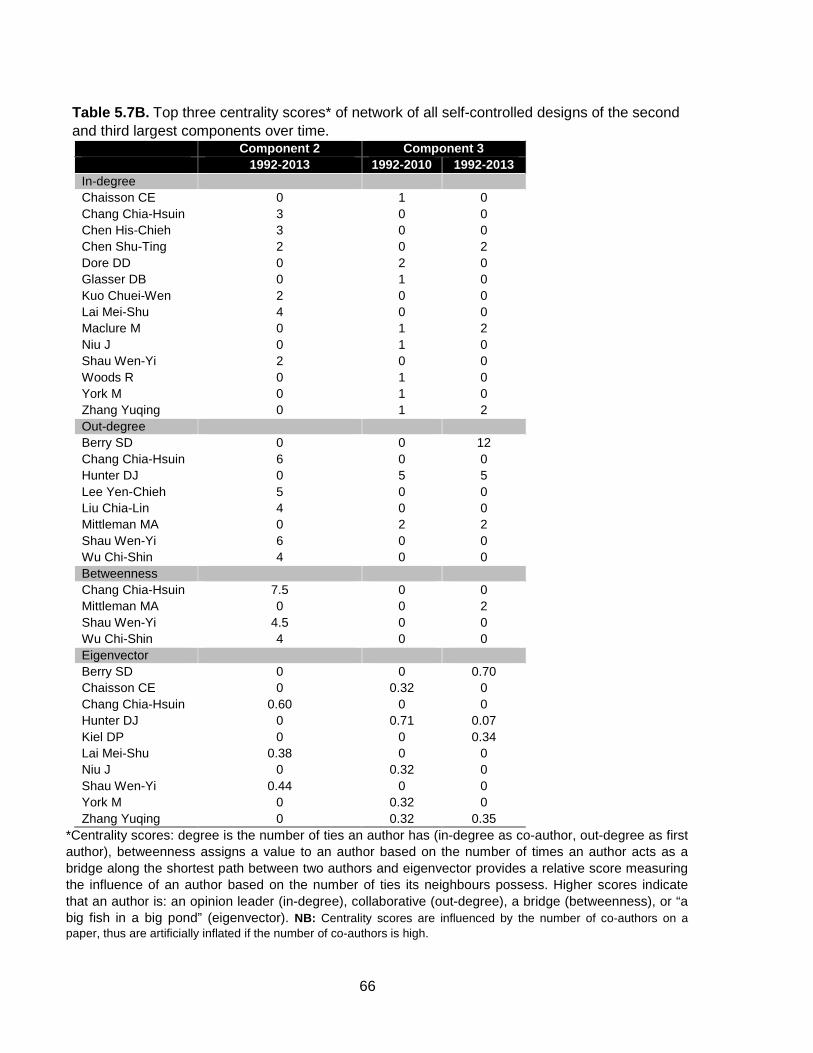
66
Table 5.7B. Top three centrality scores* of network of all self-controlled designs of the second and third largest components over time.
Component 2 Component 3 1992-2013 1992-2010 1992-2013 In-degree Chaisson CE 0 1 0 Chang Chia-Hsuin 3 0 0 Chen His-Chieh 3 0 0 Chen Shu-Ting 2 0 2 Dore DD 0 2 0 Glasser DB 0 1 0 Kuo Chuei-Wen 2 0 0 Lai Mei-Shu 4 0 0 Maclure M 0 1 2 Niu J 0 1 0 Shau Wen-Yi 2 0 0 Woods R 0 1 0 York M 0 1 0 Zhang Yuqing 0 1 2 Out-degree Berry SD 0 0 12 Chang Chia-Hsuin 6 0 0 Hunter DJ 0 5 5 Lee Yen-Chieh 5 0 0 Liu Chia-Lin 4 0 0 Mittleman MA 0 2 2 Shau Wen-Yi 6 0 0 Wu Chi-Shin 4 0 0 Betweenness Chang Chia-Hsuin 7.5 0 0 Mittleman MA 0 0 2 Shau Wen-Yi 4.5 0 0 Wu Chi-Shin 4 0 0 Eigenvector Berry SD 0 0 0.70 Chaisson CE 0 0.32 0 Chang Chia-Hsuin 0.60 0 0 Hunter DJ 0 0.71 0.07 Kiel DP 0 0 0.34 Lai Mei-Shu 0.38 0 0 Niu J 0 0.32 0 Shau Wen-Yi 0.44 0 0 York M 0 0.32 0 Zhang Yuqing 0 0.32 0.35
*Centrality scores: degree is the number of ties an author has (in-degree as co-author, out-degree as first author), betweenness assigns a value to an author based on the number of times an author acts as a bridge along the shortest path between two authors and eigenvector provides a relative score measuring the influence of an author based on the number of ties its neighbours possess. Higher scores indicate that an author is: an opinion leader (in-degree), collaborative (out-degree), a bridge (betweenness), or “a big fish in a big pond” (eigenvector). NB: Centrality scores are influenced by the number of co-authors on a paper, thus are artificially inflated if the number of co-authors is high.

67
Table 5.8 Centrality of the network – overall. Top three centrality scores* of network of the self-controlled case-control design over time.
1992-2001 1992-2004 1992-2007 1992-2010 1992-2013 In-degree Abildstrom SZ 0 0 1 3 3 Folke F 0 0 0 3 4 Fosbol EL 0 0 0 3 4 Gislason GH 0 0 0 3 16 Hambidge SJ 0 0 0 0 18 Kober L 0 0 1 3 4 Orriols L 0 0 2 0 31 Poulsen HE 0 0 0 3 4 Schramm TK 0 0 1 3 3 Suissa S 1 0 2 2 3 Torp-Pedersen C 0 0 0 3 4 Viboud C 1 2 2 2 2 Weeke P 0 0 0 1 16 Yi Sung Gon 0 2 2 2 2 Out-degree Barbone F 6 6 6 6 6 Fagot JP 5 5 5 5 5 Folke F 0 0 0 0 4 Fosbol EL 0 0 0 11 4 France EK 0 10 10 10 10 Gislason GH 0 0 10 16 4 Hambidge SJ 0 0 18 18 18 Martins IS 0 0 0 14 14 Sturkenboom MCM 5 5 5 5 5 Betweenness Choi NK 0 0 0 0 11.5 Fosbol EL 0 0 0 8.5 11.5 Gislason GH 0 0 0 19 26.5 Hallas J 0 0 0 6 0 Ki M 0 2 2 2 2 Eigenvector Andersen SS 0 0 0 0.284 0 Barbone F 0.707 0 0 0 0 Delorme B 0 0 0 0 0.26 Fosbol EL 0 0 0 0.331 0 France EK 0 0.707 0.463 0 0 Gagdegbeku B 0 0 0 0 0.26 Gislason GH 0 0 0 0.599 0 Hambidge SJ 0 0 0.579 0 0 Lagarde E 0 0 0 0 0.32 Orriols L 0 0 0 0 0.71
*Centrality scores: degree is the number of ties an author has (in-degree as co-author, out-degree as first author), betweenness assigns a value to an author based on the number of times an author acts as a bridge along the shortest path between two authors and eigenvector provides a relative score measuring the influence of an author based on the number of ties its neighbours possess. Higher scores indicate that an author is: an opinion leader (in-degree), collaborative (out-degree), a bridge (betweenness), or “a big fish in a big pond” (eigenvector). NB: Centrality scores are influenced by the number of co-authors on a paper, thus are artificially inflated if the number of co-authors is high.

68
Table 5.9 Centrality of the network – overall. Top three centrality scores* of network of the self-controlled cohort design over time.
1992-2001 1992-2004 1992-2007 1992-2010 1992-2013 In-degree Andrews N 1 1 4 4 6 Chen Robert T 2 2 2 2 2 Farrington CP 4 7 7 7 9 Gargiullo PM 2 2 2 2 4 Hubbard R 0 2 4 4 5 Miller E 2 2 5 5 5 Stowe J 2 2 2 3 3 Smith C 0 2 2 4 4 Smeeth L 0 1 4 4 4 Taylor B 3 3 3 4 4 Waight P 2 2 2 2 2 Out-degree Dodd CN 0 0 0 0 34 Farrington CP 8 8 8 8 8 Hambidge SJ 0 0 18 18 29 Kramarz P 11 11 11 11 11 Murphy TV 11 11 11 11 11 Patel MM 0 0 0 0 34 Tata LJ 0 0 10 10 10 Betweenness Andrews N 4 7 25 27.5 155.5 Farrington CP 36 72 105 158 295 Hubbard R 0 7 10 44.5 83.5 Miller E 12 24 43 59 117.5 Smeeth L 0 6 6 47.5 57.5 Eigenvector Andrews N 0.38 0.40 0.15 0.23 0.43 Farrington CP 0.57 0.49 0.41 0.37 0.29 Hubbard R 0 0.14 0.50 0.45 0.27 Miller E 0.47 0.53 0.20 0.28 0.46 Stowe J 0.18 0.16 0.08 0.21 0.41 Tata LJ 0 0.12 0.49 0.417 0.24 *Centrality scores: degree is the number of ties an author has (in-degree as co-author, out-degree as first author), betweenness assigns a value to an author based on the number of times an author acts as a bridge along the shortest path between two authors and eigenvector provides a relative score measuring the influence of an author based on the number of ties its neighbours possess. Higher scores indicate that an author is: an opinion leader (in-degree), collaborative (out-degree), a bridge (betweenness), or “a big fish in a big pond” (eigenvector). NB: Centrality scores are influenced by the number of co-authors on a paper, thus are artificially inflated if the number of co-authors is high.

69
Table 5.10 Institutional affiliations. Percentage of top institutions, institution types and country of institutions of self-controlled case-control designs over time.
1992-2001
% 1992-2004
% 1992-2007
% 1992-2010
% 1992-2013
%
Institution
Boston University 0 6.1 8.8 4.8 3.4
Eulji University 0 6.1 2.5 1.6 <1
Gentofte University Hospital 0 0 1.3 4.8 4.1
Harvard University 0 3.0 4.4 2.4 4.1
Kaiser Permanente 0 6.1 5.6 4.1 1.2
National Taiwan University 0 0 0 4.1 6.9
Seoul National University 0 9.1 4.3 2.8 5.2
University Centre for Pharmacy 13.3 6.1 3.5 <1 <1
University of Dundee 13.3 6.1 3.5 <1 <1
University of Pennsylvania 0 0 3.9 5.5 3.7
University of Utah 0 0 5.3 1.9 1.1
Vanderbilt University 20.0 9.1 5.3 1.9 1.4
Institution Type
Academia, hospital 23.0 15.0 26.1 29.6 27.1
Academia, school 73.0 66.5 57.0 54.5 59.5
Government 4.0 13.9 13.7 14.5 9.4
Country
Australia 20.0 9.1 2.9 1.4 2.9
Canada 20.0 15.2 14.1 12.2 11.4
Denmark 0 0 13.0 20.9 10.6
France 13.3 15.2 7.2 8.5 9.0
Netherlands 20.0 9.1 8.7 8.7 5.4
South Korea 0 18.2 8.7 2.9 8.7
Taiwan 0 0 0 4.9 14.1
United States 20.0 30.3 35.1 25.3 26.9

70
Table 5.11 Institutional affiliations. Percentage of top institutions, institution types and country of institutions of self-controlled cohort designs over time.
1992-2001
% 1992-2004
% 1992-2007
% 1992-2010
% 1992-2013
%
Institution
Centers for Disease Control and Prevention 20.8 15.4 7.7 5.5 4.9
Communicable Disease Surveillance Centre 4.2 2.6 1.3 <1 <1
Health Protection Agency, London 20.8 17.9 21.8 21.1 13.0
Kaiser Permanente 4.2 2.6 1.3 2.4 4.9
London School of Hygiene and Tropical Medicine 0 5.1 2.6 13.8 6.5
Public Health Laboratory, London 4.2 2.6 1.3 <1 <1
The Open University 8.3 7.7 3.8 2.4 1.5
University College London 12.5 12.8 12.8 8.1 5.7
Universidade Federal da Bahia 12.5 7.7 3.8 2.4 1.1
University of Nottingham 4.2 2.6 21.8 16.3 11.7
University of Ottawa 0 0 0 0 5.9
Institution Type
Academia, hospital 4.2 2.4 5.9 6.0 11.2
Academia, school 33.3 47.6 48.9 50.2 47.4
Government 58.3 40.5 38.4 36.8 31.8
Private insurer 4.2 4.8 3.1 3.8 6.8
Other 0 4.8 3.7 3.3 2.9
Country
Australia 0 0 0 3.6 5.0
Brazil 12.5 7.7 4.5 3.6 1.2
Canada 0 0 4.5 5.4 15.1
Italy 0 0 0 0 2.4
Scotland 0 0 4.5 1.8 1.2
United Kingdom 54.2 64.1 67.4 68.1 44.8
United States 25.0 23.1 11.4 12.9 20.0
Vietnam 0 0 4.5 3.6 1.2

71
Figure 5.1 Study Flow . Study flow diagram of systematic search results. CCO=case-crossover, CCTC=case-case-time control, CTC=case-time control, SCCS=self-controlled case-series. CCO combinations include 5 CCO+CTC and 1 CCO+SCCS papers.

Figure 5.2 Venn diagram. Illustrates the proportional contribution of each systematic review results. EMBASE® (n=142) and MEDLINE® (n=137) databases were used for the keyword search. The cited reference search was performed using Web of Science® (n=99).
MEDLINE®
4
66 60
6
72
Illustrates the proportional contribution of each search strategy to the systematic review results. EMBASE® (n=142) and MEDLINE® (n=137) databases were used for the keyword search. The cited reference search was performed using Web of Science® (n=99).
EMBASE®
10
Web of Science ®
23
60
MEDLINE®7
6
66
4
6
search strategy to the systematic review results. EMBASE® (n=142) and MEDLINE® (n=137) databases were used for the keyword search. The cited reference search was performed using Web of Science® (n=99).
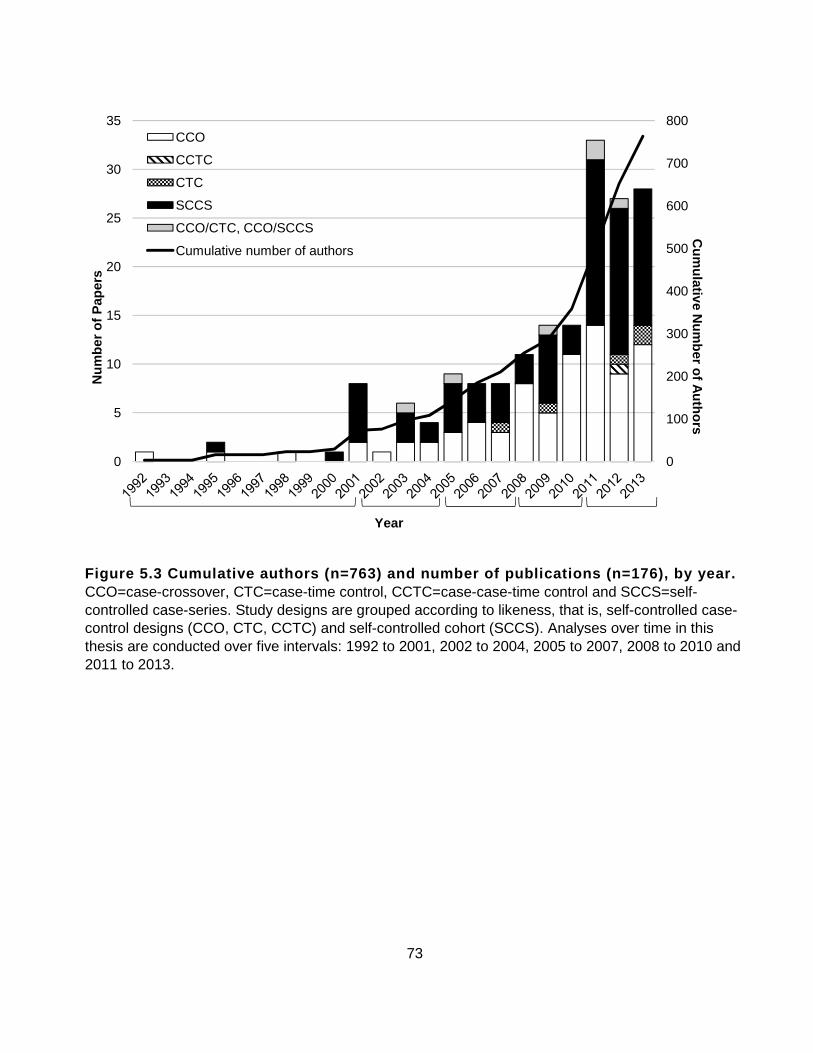
73
Figure 5.3 Cumulative authors (n=763) and number of publications (n=176), by year. CCO=case-crossover, CTC=case-time control, CCTC=case-case-time control and SCCS=self-controlled case-series. Study designs are grouped according to likeness, that is, self-controlled case-control designs (CCO, CTC, CCTC) and self-controlled cohort (SCCS). Analyses over time in this thesis are conducted over five intervals: 1992 to 2001, 2002 to 2004, 2005 to 2007, 2008 to 2010 and 2011 to 2013.
0
100
200
300
400
500
600
700
800
0
5
10
15
20
25
30
35C
umulative N
umber of A
uthorsN
umbe
r of
Pap
ers
Year
CCO
CCTC
CTC
SCCS
CCO/CTC, CCO/SCCS
Cumulative number of authors

74
0
10
20
30
40
50
60
70
80
90
100
1992-2010 2011-2013
Pro
port
ion
of p
aper
s
Year
Did not follow Somewhat followed Followed recommendations
A. Self-controlled case-control B. Self-contro lled cohort
Figure 5.4A-B. Applications following methodologica l recommendations – exposures. Methodological recommendations on exposures over time and by design are followed, somewhat followed, or not followed over time by A. self-controlled case-control and B. self-controlled-cohort studies.
0.0
10.0
20.0
30.0
40.0
50.0
60.0
70.0
80.0
90.0
100.0
1992-2010 2011-2013
Pro
port
ion
of p
aper
s
YearDid not follow Somewhat followed Followed recommendations

75
0.010.020.030.040.050.060.070.080.090.0
100.0
1992-2010 2011-2013
Pro
port
ion
of p
aper
s
YearDid not follow Somewhat followed Followed recommendations
A. Self-controlled case-control B. S elf-controlled cohort
Figure 5.5A-B. Applications following methodologica l recommendations – outcomes (biological onset). Me thodological recommendations on outcomes (biological onset) over time and by design are followed, somewhat followed , or not followed over time by A. self-controlled case-control and B. self-controlled -cohort studies .
0.010.020.030.040.050.060.070.080.090.0
100.0
1992-2010 2011-2013
Pro
port
ion
of p
aper
s
YearDid not follow Somewhat followed Followed recommendations
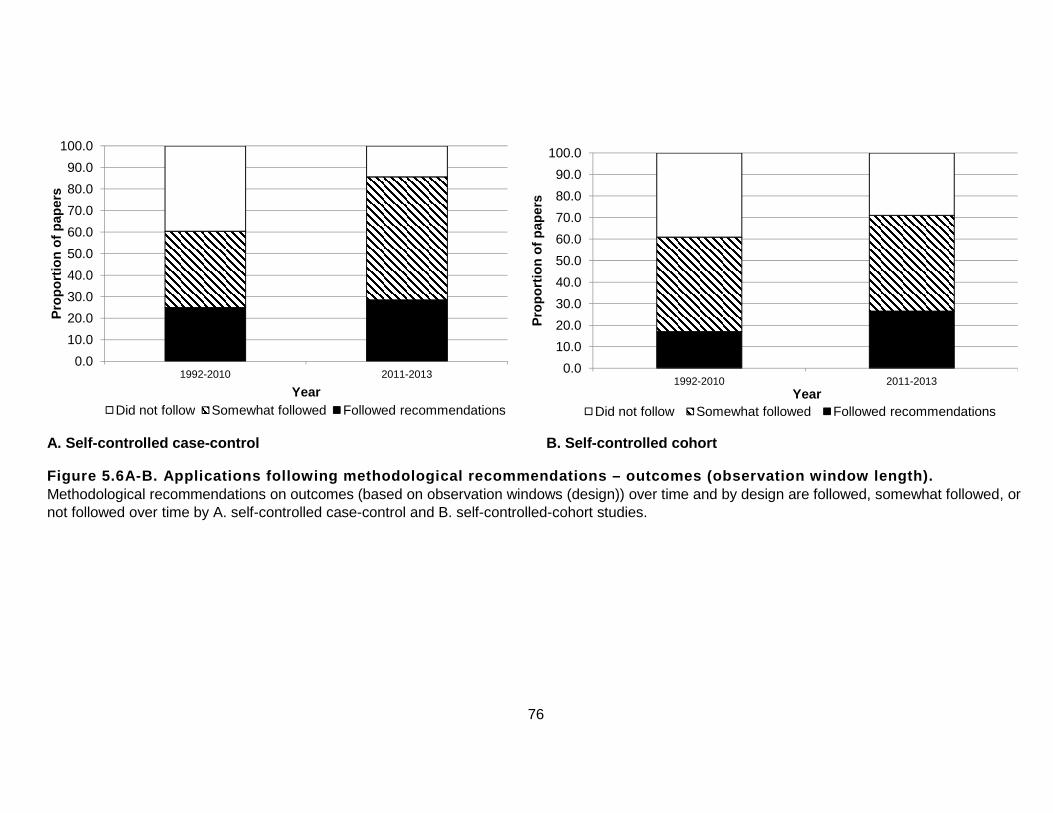
76
0.0
10.0
20.0
30.0
40.0
50.0
60.0
70.0
80.0
90.0
100.0
1992-2010 2011-2013
Pro
port
ion
of p
aper
s
YearDid not follow Somewhat followed Followed recommendations
0.0
10.0
20.0
30.0
40.0
50.0
60.0
70.0
80.0
90.0
100.0
1992-2010 2011-2013
Pro
port
ion
of p
aper
s
YearDid not follow Somewhat followed Followed recommendations
A. Self-controlled case-control B. Self- controlled cohort
Figure 5.6A-B. Applications following methodologica l recommendations – outcomes (observation window le ngth). Methodological recommendations on outcomes (based on observation windows (design)) over time and by design are followed, somewhat followed, or not followed over time by A. self-controlled case-control and B. self-controlled-cohort studies.

77
A. Self-controlled case-control B. Self-contr olled cohort
Figure 5.7A-B. Applications following reporting rec ommendations – raw data display. Reporting recommendations (raw data display) over time and by design are followed, somewhat followed, or not followed over time by self-controlled case-control and cohort studies.
0.0
10.0
20.0
30.0
40.0
50.0
60.0
70.0
80.0
90.0
100.0
1992-2010 2011-2013
Pro
port
ion
of p
aper
s
YearDid not follow Somewhat followed Followed recommendations
0.0
10.0
20.0
30.0
40.0
50.0
60.0
70.0
80.0
90.0
100.0
1992-2010 2011-2013
Pro
port
ion
of p
aper
s
Year
Did not follow Somewhat followed Followed recommendations

78
0.0
10.0
20.0
30.0
40.0
50.0
60.0
70.0
80.0
90.0
100.0
1992-2010 2011-2013
Pro
port
ion
of p
aper
s
YearDid not follow Somewhat followed Followed recommendations
0.0
10.0
20.0
30.0
40.0
50.0
60.0
70.0
80.0
90.0
100.0
1992-2010 2011-2013
Pro
port
ion
of p
aper
s
Year
Did not follow Somewhat followed Followed recommendations
A. Self-controlled case-control B. Self-contr olled cohort
Figure 5.8A-B. Applications following reporting rec ommendations – report on outcome onset timing. Reporting recommendations on outcome onset (biological plausibility of exposure-outcome timing) over time and by design are followed, somewhat followed, or not followed over time by A. self-controlled case-control and B. self-controlled-cohort studies.

79
Figure 5.9 Directed sociograms of the self-controll ed co-authorship network of case-control- and cohor t-based self-controlled designs from 1992 to 2013 (46 components, 176 paper s, 763 authors and 17 bridges; Chen, Crowcroft, de Jong van der Berg, Farrington, Gargiullo, Gill, Gwini, Jacobsen, Koren, Liu, Molle r, Moore, Souverein, Suissa, Sun, Viboud, Zhang). Arrows are directed from author to co-authors of each paper. Node size is proportional to the number of published articles and indicates the method(s) used: diamond for case-crossover, chevron for case-time control, hexagon for case-case-time control, circle for self-controlled case-series, triangle for case-crossover/case-time control and self-controlled case-series combinations, and square for multiple methods used over time.

80
Figure 5.10A . 1992—3 authors, 1 paper, 1 component. Figure 5.10B. 1995—17 authors, 3 papers, 3 components.

81
Figure5.10C . 1998—24 authors, 4 papers, 4 components.
Figure 5.10D . 2000—30 authors, 5 papers, 4 components.

82
Figure 5.10E . 2001—75 authors, 13 papers, 7 components, 2 bridges (Farrington, Gargiullo).

83
Figure 5.10F . 2002— 78 authors, 14 papers, 7 components.

84
Figure 5.10G . 2003—98 authors, 20 papers, 10 components, 3 bridges (Farrington, Gargiullo, Viboud).

85
Figure 5.10H . 2004—113 authors, 24 papers, 12 components, 4 bridges (Chen, Farrington, Gargiullo, Viboud).

86
Figure 5.10I . 2005—148 authors, 33 papers, 13 components, 5 bridges (Chen, Farrington, Gargiullo, Suissa, Viboud).

87
Figure 5.10J . 2006—194 authors, 41 papers, 17 components, 6 bridges (Chen, Crowcroft, Farrington, Gargiullo, Suissa, Viboud).

88
Figure 5.10K . 2007—213 authors, 49 papers, 16 components, 7 bridges (Chen, Crowcroft, Farrington, Gargiullo, Jacobsen, Suissa, Viboud).

89
Figure 5.10L . 2008—258 authors, 58 papers, 22 components, 8 bridges (Chen, Crowcroft, Farrington, Gargiullo, Jacobsen, McGee, Suissa, Viboud).

90
Figure 5.10M . 2009—289 authors, 74 papers, 24 components, 8 bridges (Chen, Crowcroft, Farrington, Gargiullo, Jacobsen, McGee, Suissa, Viboud).
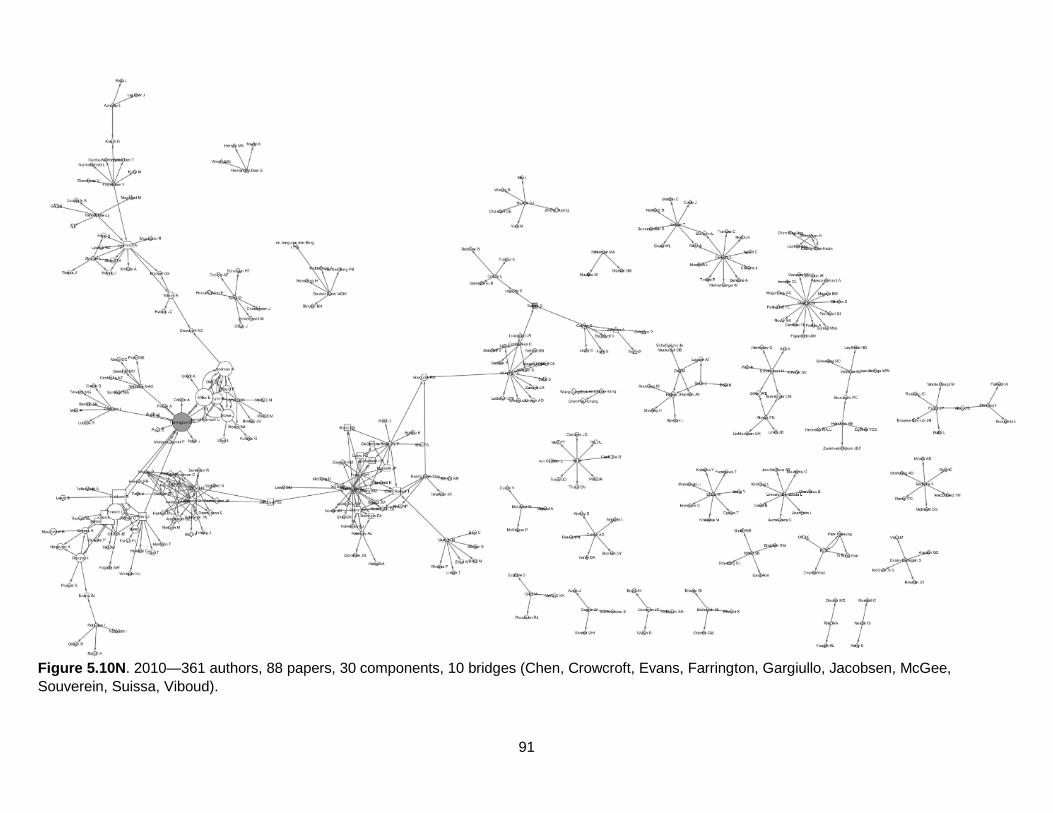
91
Figure 5.10N . 2010—361 authors, 88 papers, 30 components, 10 bridges (Chen, Crowcroft, Evans, Farrington, Gargiullo, Jacobsen, McGee, Souverein, Suissa, Viboud).

92
Figure 5.10O . 2011—504 authors, 121 papers, 38 components, 12 bridges (Chen, Crowcroft, de Jong Van der Berg, Evans, Farrington, Gargiullo, Jacobsen, McGee, Souverein, Suissa, Viboud, Zhang).

93
Figure 5.10P . 2012—645 authors, 148 papers, 39 components, 12 bridges (Chen, Crowcroft, de Jong Van der Berg, Evans, Farrington, Gargiullo, Jacobsen, McGee, Souverein, Suissa, Viboud, Zhang).
Figure 5.10A-P. Directed sociograms of the self-con trolled co-authorship network of case-control- and cohort-based self-controlled designs from 1992 to 2012. Arrows are directed from author to co-authors of each paper. Node size is proportional to the number of published articles and indicates the method(s) used: diamond for case-crossover, chevron for case-time control, hexagon for case-case-time control, circle for self-controlled case-series, triangle for case-crossover/case-time control and self-controlled case-series combinations, and square for multiple methods used over time.

94
Figure 5.11A. Component 1 – the largest component o f the network. Four hundred and thirty-three authors, 97 papers, and 11 bridges (Chen, Crowcroft, de Jong van der Berg, Farrington, Gargiullo, Gill, Jacobsen, Koren, Moore, Suissa, Sun).

95
Figure 5.11B. Component 2 – the second largest comp onent of the network. Sixteen authors, 9 papers, and one bridge (Liu).

96
Figure 5.11C. Component 3 – the third largest compo nent of the network. Twenty-four authors, 7 papers, and one bridge (Zhang).
Figure 5.11A-C Directed sociograms of the top 3 lar gest components of the self-controlled co-authorship network of case-control- a nd cohort-based self-controlled designs from 1992 to 2013. Arrows are directed from author to co-authors of each paper. Node size is proportional to the number of published articles and indicates the method(s) used: diamond for case-crossover, chevron for case-time control, hexagon for case-case-time control, circle for self-controlled case-series, triangle for case-crossover/case-time control and self-controlled case-series combinations, and square for multiple methods used over time.

97
Figure 5.12 Directed sociogram of the self-controll ed case-control co-authorship network from 1992 to 2013 (39 components, 91 papers , 406 authors, 10 bridges). Arrows are directed from author to co-authors of each paper. Node size is proportional to the number of published articles and indicates the method(s) used: diamond for case-crossover, chevron for case-time control, hexagon for case-case-time control, circle for self-controlled case-series, triangle for case-crossover/case-time control and self-controlled case-series combinations, and square for multiple methods used over time.

98
Figure 5.13 Directed sociogram of the self-controll ed cohort co-authorship network from 1992 to 2013 (16 components, 86 papers , 391 authors, 6 bridges). Arrows are directed from author to co-authors of each paper. Node size is proportional to the number of published articles and indicates the method(s) used: diamond for case-crossover, chevron for case-time control, hexagon for case-case-time control, circle for self-controlled case-series, triangle for case-crossover/case-time control and self-controlled case-series combinations, and square for multiple methods used over time.

99
Chapter 6 Discussion
The main objective of this thesis was to review the use and diffusion of self-controlled designs in
pharmacoepidemiology over time. A modified version of Rogers’ Diffusion of Innovations Theory
provides the conceptual framework that was used to examine and understand these research
findings.
6.1 Overview
From the systematic search, 176 applied self-controlled studies were identified, and findings
were consistent with the hypothesis of this research that the number of applications increased
over time. However, whether or not the findings were consistent with the hypothesis that the
proportion of applied self-controlled studies that follow recommendations will decrease over time
was unclear. According to methodological recommendations,5-7,24 antibiotics/anti-infectives and
vaccines are appropriate exposures to investigate using self-controlled study designs for their
one-time or short-term (transient) utilization patterns.44 The majority (79%) of self-controlled
cohort applications met methodological recommendations on exposures; 73% of self-controlled
cohort studies investigated vaccines. A likely explanation for this is that the self-controlled
cohort methodology was originally intended to investigate the association between vaccination
and acute potential adverse events.23,31 The high proportion of applications investigating vaccine
safety may also be attributable to global vaccine safety monitoring initiatives launched in 2011
that have led to large-scale, international self-controlled case-series collaborations.226 Indeed,
from 2011 to 2013, 77% of self-controlled case-series studies investigated vaccines.
Other exposures, such as psychotropic and respiratory drugs, may be appropriate
depending on indication and duration of use.44 Self-controlled case-control applications followed
methodological recommendations on exposures 25% of the time. This is likely attributable to the
high proportion of psychotropic medications investigated (42% from 2011 to 2013).

100
Psychotropics are often used on a regular and chronic basis, e.g. antidepressants, or as
needed, e.g. sleep aids.227 Similarly, the majority of self-controlled case-control applications did
not clearly follow methodological recommendations on outcomes over time, in particular when
based on the observation window length. This is likely attributable to the fact that observation
window length is investigator dependent, and is designed taking into account exogenous factors
such as limitations of the data source, e.g. measureable versus actual drug consumption. These
findings indicate that chronic rather than one-time, short or transient exposures and prolonged
rather than abrupt and acutely occurring outcomes are becoming increasingly investigated using
self-controlled studies, and is likely attributable to the innovations being stretched to meet the
needs of the growing field of post-marketing research. The notion that innovations are being
stretched is also consistent with recent findings that state that seminal methods have been
modified over time making original assumptions less important in order to increase the utility of
the original designs.228 For example, the critical assumption of self-controlled cohort studies that
the occurrence of an event must not alter the probability of subsequent exposure was modified
to “must not alter the probability of exposure subsequent to an (arbitrarily defined) pre-exposure
window.”
In contrast to methodological recommendations, findings from this research provide
clear evidence that raw data display and justification of the outcome onset (i.e. biological
plausibility of the exposure-outcome timing) were underreported in self-controlled designs.
6.2 Diffusion of Innovations Theory
The use of self-controlled methods and Rogers’ Diffusion of Innovations Theory helps to explain
their diffusion in pharmacoepidemiology. According to the theory, there are a number of factors
that impact the rate of adoption of an innovation, i.e., the diffusion of self-controlled designs in
pharmacoepidemiology. These factors include: 1) the innovation itself, 2) communication
101
channels (including source), 3) time, and 4) the social system. Recall that the number of self-
controlled papers and unique authors increased over time, consistent with the hypothesis of this
research. The largest increase in number of papers, unique authors and network size occurred
from 2010 to 2011, which may represent the chasm when the diffusion of self-controlled designs
gains significant momentum and “takes off” among early adopters. However, to precisely
identify the early adopters, i.e., the inflection point of the curve, would require additional years of
follow-up. Despite the overall increase, the diffusion of the innovations was initially slow, and the
diffusion patterns of the 2 design types varied. Laggards may also be identified from the curve,
however, in the case of innovative methods, they may be an indicator of successful diffusion .
That is, once the “laggards” of a social system have adopted an innovation, this may signal that
the innovation has been widely accepted.
6.2.1 Diffusion patterns over time – similarities a nd differences between design types
The main similarities and differences that persisted in the diffusion of self-controlled case-
control- and self-controlled cohort-based studies are broken down into 3 themes: 1) the rate of
diffusion, 2) network composition, and 3) the presence of centrally acting authors.
6.2.1.1 Rate of diffusion
The first self-controlled methodological innovation was the case-crossover in 1991 by Maclure.
This innovation leveraged the traditional case-control study design, thus the design was
compatible with existing values and needs of researchers, with the added advantage that only
cases were required, and the ability to control for time-invariant confounding. In spite of this
however, use and uptake of the innovation was slow early on. In general, it may be challenging
to publish using innovative methods early on in their development because editors and peer-
reviewers are not familiar with the designs. However, an additional barrier to imitation and
102
spread was cost: the design was originally developed for expensive studies based on interviews
with patients. The research became more visible and easier to imitate when
pharmacoepidemiologists applied the method to lower-cost studies using administrative
databases.
The lag in uptake is most apparent in the self-controlled case-time control design. The
case-time control seminal paper was published in 1995, yet the first application appeared in the
network in 2007. Indeed, this design is less commonly used overall, which may be attributed to
the fact that case-time control designs require the selection of a control group, which can be
difficult, and the added complexity of the methodology may deter researchers from using the
design. In addition, the control group selection requirement reduces the trialability of case-time
control studies. That is, the degree to which the innovation could be tested and uncertainties
surrounding the innovation are reduced. The novelty of the case-case-time control design —
and therefore the minimal observability of the design — can likely explain why the case-case-
time control design is uncommonly used.
The diffusion of self-controlled cohort studies faced similar barriers to adoption as self-
controlled case-control studies. One barrier to adoption of self-controlled cohort studies was
likely attributable to the fact that similar researchers tend to collaborate with one another,36 and
thus non-vaccine researchers were less likely to apply the self-controlled cohort design. This is
known as homophily .36 That is, homophilous researchers are similar, e.g., share similar
research interests. The first author to publish an applied self-controlled cohort study was
seminal author Farrington in 1995 (the same year as its development) in vaccine safety, and
despite the observability and trialability that a prolific seminal author may add to the certainty
and trust of potential adopters in an innovation, there was still a lag in uptake until 2001.
Compared to self-controlled case-control studies, the perceived complexity of self-controlled

103
cohort studies may be less because relative risk is calculated leveraging principles from the
cohort study design, which is typically easier to interpret compared to case-control-based
studies that calculate odds ratios.20,229
Communication channels may also help to explain why the lag in diffusion is similar
across self-controlled designs. Communication of an innovation to potential adopters is a means
of knowledge and persuasion that leads to a decision to adopt or reject an innovation; this
depends on the source and the channel.36 The more similar the source of a message is to
potential adopters, the higher the likelihood that the message is effective, i.e. effective
persuasion leading to adoption of an innovation. Thus, a lack of homophily between the source
of information on self-controlled designs and potential adopters in pharmacoepidemiology may
have led to their slow uptake. In addition, a lack of communication technologies in the 1990s
(when the majority of the self-controlled designs were innovated) may help to explain this lag.
For example, interpersonal and direct communication via e-mail may be more effective at
spreading innovations throughout a social system due to the added advantages of knowledge,
persuasion and certainty, compared to passive journal publications that require readers to
interpret and make conclusions about the research on their own. For example, the case-case-
time control was developed in 2011 and thus was not prone to the same communication
challenges as the older self-controlled case-control- and cohort-based designs, yet this design
was only used once in 2012.
Perhaps the most important factor contributing to the overall lag in diffusion of the earlier
self-controlled studies may be variations in language used. A lack of standardized terminology
(i.e. over 13 terms were used to describe referent windows in self-controlled cohort studies) may
be a barrier to the adoption of self-controlled methods. The lack of consistency in language
used to describe self-controlled designs is particularly important because the designs are so

104
similar, such that different terms to describe the same thing may be confusing, which lends to a
negative impact on the use and diffusion of self-controlled designs in
pharmacoepidemiology.230,231
After 2000, the rate of uptake of self-controlled innovations gained speed and the overall
co-authorship network began to grow over time. This may be attributed to the geographic
homophily of the communication source on early adopters/early majority of adopters. That is,
authors from similar institutions in similar geographic locations were more familiar, e.g., London-
based researchers publishing self-controlled cohort studies. Thus, these researchers and
institutions relied on each other and were more receptive to one another to build confidence in
applying the innovations. Growth in the network may also suggest that there was a switch from
mass communication, e.g. passive publication of seminal paper, to interpersonal or direct
communication as means of diffusion. Other reasons for the rapid increase in applications since
2001 could include the increased availability of healthcare utilization data,50,232 and the
increased investment in post-marketing and pharmacoepidemiologic research. In fact, 81% of
all applications used linked administrative data, and observational research networks such as
Developing Evidence to Inform Decisions about Effectiveness (DEcIDE, 2005), Observational
Medical Outcomes Partnership (OMOP, 2007), PCORI (2010) and DSEN (2011); were
established.51,233 OMOP was a public-private partnership established to inform the appropriate
use of administrative databases for studying drug effects, with particular focus on the value of
administrative data. The DEciDE network was established by the Agency for Healthcare
Research and Quality in the US to conduct post-marketing drug research. In fact, the
Universities of Colorado and Vanderbilt that contributed to the co-authorship network
participated in the DEcIDE network as well. In the case of self-controlled cohort studies, growth
in the network may also be attributed to the methods-specific website created in 2003 by Open

105
University.233 The website houses information on general self-controlled cohort methods, a list of
published studies, and detailed statistical programming. Thus, this increased the observability
and trialability of the design, and may have also contributed to the increased diffusion of self-
controlled cohort methods by making the design easier to use.
6.2.1.2 Network composition
The overall network of self-controlled designs in pharmacoepidemiology consisted of 46
components and 763 unique authors. The first self-controlled cohort study appeared in the
network in the same year as the seminal methods publication by seminal author Farrington
(1995), and did not appear again until 5 years later, when Farrington co-authored the second
self-controlled cohort study. Similarly, there were gaps between initial applications of self-
controlled case-control designs such as the case-crossover design; the first application
appeared in the network in 1992 (Ray et al.), then again in 1995 (Sturkenboom et al.) and 1998
(Barbone et al.). Attributes of Ray, the first author to contribute a pharmacoepidemiologic
application to the overall network, may help to further explain why the uptake of the case-
crossover design was slow. Ray has conducted much research investigating another
methodological innovation in pharmacoepidemiology called the disease risk score, and thus his
research focus was on a competing innovation.234 Similarly, Barbone is a clinician with a PhD in
pharmacoepidemiology from the University of Alabama in Birmingham, and thus is more likely to
conduct research in response to clinical research questions rather than based on preference of
a particular research method. Indeed, Ray et al. and Barbone et al. did not publish any other
self-controlled studies for the rest of the study period. Potential reasons why an author may
publish a “one off” paper outside of their regular field, may include: following the direction of a
graduate supervisor, tenure, switching institutions, retirement, or based upon a collective
decision made by a funding body.235 In the diffusion of innovations literature, one-time use by an

106
early or later adopter that is followed by no further use is labeled “active rejection,” (Figure 2.1 ).
However, given the number of ways that investigators can move on to other topics, I will refer to
this merely as abandonment without imputing motive. In contrast, passive rejection occurs
when a researcher rejects an innovation without trying it.36,37 “One off” papers appearing in the
network, such as those published by Ray and Barbone, represented single paper components
due to abandonment. Composition of the overall network, including the number of single paper
components, was different for self-controlled case-control and self-controlled cohort designs.
For example, 61% of single paper components were self-controlled case-control designs. In
addition, components of co-authors of self-controlled case-control designs were generally more
fragmented in the overall network compared with the more integrated components of co-authors
of self-controlled cohort designs. That is, researchers from similar institutions (geographic
homophily) using self-controlled case-control designs formed smaller components in the overall
network. This might be partly attributable to the variations in the language used to describe self-
controlled designs.
In contrast, self-controlled cohort designs comprised the majority (69%) of the largest
component of the network. The largest component was formed in 2012 when 2 components
containing seminal authors Farrington and Suissa were joined and thus collaborations between
institutions from London, Canada and France were evident. Self-controlled case-control studies
that appeared in the largest component appeared on the periphery of the network. The majority
of self-controlled case-control institutions that appeared in the largest component over time
were from Canada, France and the Netherlands. Otherwise, London-based institutions
dominated the largest component and the overall network. This pattern was also apparent over
time and could be attributed to the prolific and collaborative nature of the London-based
authors, e.g. seminal author Farrington.

107
There were 11 bridges in the largest component, indicating that these bridging authors
acted as important conduits of information, connecting otherwise disconnected groups in the
network. Moore and Pariente were identified as important bridges in the largest component
because these authors connect groups of authors publishing in self-controlled case-control and
self-controlled cohort methods. In fact, if these authors were removed from the network, seminal
authors Farrington and Suissa would not be connected. Few bridges connect authors outside of
the largest component, and thus the flow of information and the diffusion of innovation are
difficult.
There was a large discrepancy in size between the first and next two largest
components, evidenced by the fragmented nature of the network of co-authors using the self-
controlled case-control designs, which is attributable to the largely localized institutional
collaborations and the diversity of exposures and outcomes investigated overall and over time
outside of the largest component (which largely investigated vaccine safety). The second and
third largest components were comprised of only self-controlled case-control studies. The
second largest component grew from 2008 to 2013 and all of the authors were affiliated with
Taiwan Universities. In fact, the proportion of applied self-controlled studies published in Asia
and Australia was increasing over time (5 papers in 2010 to 9 in 2013). This may be attributed
to the establishment of the Asian Pharmacoepidemiology Network (AsPEN) by Frank May in
2012 to develop and advance multi-national database research in pharmacoepidemiology in the
Asia/Pacific region. Overall, the findings were consistent with the hypothesis of this research
that components made up of seminal authors will contain more authors, including early adopters
or key opinion leaders, bridges, and institutions. However, this was not the case for seminal
authors Maclure and Wang who appeared in the third largest component. This could likely be
explained by the novelty of the case-case-time control, and the fact that Maclure originally

108
developed the design in the American Journal of Epidemiology, and thus collaborations outside
the boundaries of this pharmacoepidemiologic network are not captured. This may also help to
explain the fragmented composition of self-controlled case-control designs in the network.
6.2.1.3 The presence of centrally acting authors
Measures of author centrality are commonly used to describe the interconnectedness of co-
authors and thus the diffusion of self-controlled innovations in social networks over time.
Centrality scores revealed that Farrington was influential on the entire network: Farrington had
the highest in-degree and betweenness centrality overall. These measures indicate that
Farrington is a key opinion leader within the network, which is logical given Farrington’s role as
a seminal author and the most prolific author in the largest component of the network. Indeed,
centrality analyses over time, by component and of the self-controlled cohort study similarly
demonstrated the importance of Farrington in the network. In addition, his prominence within the
network makes him a likely bridge between groups of co-authors who seek out Farrington as a
collaborator. This is evidenced by Farrington’s own willingness to collaborate on the
development of pharmacoepidemiologic methods in Canada, France and across Europe, as
illustrated on his Faculty page at The Open University.233 Furthermore, this indicates the
importance of a seminal author to the use and diffusion of innovations over time. For example,
Farrington’s research interests in vaccines impacted the exposures investigated. In addition,
geographical location was a determinant of collaboration. That is, homophily of interests and
geography with the seminal author have important implications on the diffusion of innovations.
Homophily of terminology also had serious implications for the diffusion of self-controlled
designs. Observable and trialable language that is consistent (and therefore less complex) used
throughout the network could have made a difference on the wide spread diffusion of self-

109
controlled designs, as this has been previously suggested in other areas of methodological
innovation such as the disease risk score.236
In 2013, Miller had the highest eigenvector centrality. This implies that Miller is highly
connected to other highly interconnected, influential authors, also referred to as “a big fish in a
big pond.”42 Since Miller co-authored numerous papers with Farrington, this also is logical.
However Miller’s centrality score decreased over time as the number of papers published with
or near Farrington (i.e. one author in between) in the network increased. Dodd and Patel had
the highest out-degree centrality, indicating increased collaboration and influence on the uptake
of self-controlled designs throughout the network. However, this measure of centrality may be
skewed by the fact that Dodd and Patel were the first authors on two separate papers, each co-
authored by 34 other self-controlled researchers. In fact, both authors only appeared in the
network once; Patel in 2011 and Dodd in 2013.
It is logical that authors with the highest centrality are all from the largest component of
the overall network because of its size relative to other components. When centrality was
analysed separately for each component, Farrington, Miller, Dodd and Andrews maintained their
positions as the most centralized authors of the largest component. When stratified by design,
the self-controlled cohort network is dominated by one large component, much like the largest
component of the overall network of self-controlled designs and thus this network has nearly
identical resulting centrality measures, indicating that authors such as Farrington, Miller and
Andrews are the most influential for the diffusion of innovations in the network. These authors
were early adopters of self-controlled methodological innovations and can be identified as key
opinion leaders in the diffusion of self-controlled designs over time.36,37 Interestingly,
researchers such as Crowcroft, Suissa and Pariente who appeared to be change agents in the
network did not receive high centrality scores. Change agents facilitate the diffusion of

110
innovations through new research groups. For example, Canadian author Crowcroft
collaborated with London-based researchers and the network tells us that she was potentially
responsible for the introduction of self-controlled designs to a large group of distinct researchers
that leverage administrative data. However, more research (e.g. focus group, standardized
interviews) is required to identify the precise cause.
Reasons for the low centrality scores of perceived change agents may be attributed to
the fact that these authors were less prolific compared to centrally acting authors Farrington and
Miller, e.g., and centrality is highly dependent on the number of co-authors. In addition, it has
been shown that it is difficult to accurately assess centrality in smaller networks, thus centrality
analyses outside of the largest component may be less informative.237
6.3 Strengths
This was the first known study to systematically review the four self-controlled designs, which is
a major strength of this research. In general, it is important to review the use and diffusion of
novel methodological innovations to identify what methods are being used, who is using them,
and whether or not they are being used correctly. To identify the use of self-controlled studies
over time, the systematic review was conducted with much care; the multiple search strategies
used were comprehensive and the searches and data abstraction were conducted by two
researchers independently. To describe the diffusion of self-controlled methods amongst
researchers in pharmacoepidemiology over time, co-authorship network analysis is
advantageous to allow for patterns that may not otherwise have been visible in the network to
be seen. Our co-authorship analysis identified the most collaborative, and influential members
of a social system, such as key opinion leaders, leveraging social network analysis techniques.
Network centrality scores are another example of social network analysis techniques that
strengthened this research, as these measures can be useful indicators for the overall impact of

111
an author on a the diffusion of an innovation in a network.238 This is one of the first known
studies to examine the diffusion of innovative study designs in a pharmacoepidemiologic
research network. The comparison of the spread of self-controlled case-control and self-
controlled cohort designs lays the groundwork for a move toward more efficient diffusion of
innovations, such as the knowledge translation of a new, standardized self-controlled language.
6.4 Limitations
Although the systematic review of the use of self-controlled methodological innovations has
contributed new information to its field, this research was focused in pharmacoepidemiology. In
particular, since the case-crossover design originated in data gathered from interviews, a
complete picture of the use and diffusion of the design may be missing. Moreover, because the
research is focused in pharmacoepidemiology, it is limited by not recognizing research
collaborations with authors leveraging self-controlled methods in other fields, e.g. to study illicit
drug use in epidemiology.
When considering applications that followed methodological and reporting
recommendations or not, not all existing recommendations could be evaluated. For example,
methodological recommendations on outcomes suggest: 1) outcomes are abrupt and acute, and
2) outcomes are clearly defined. However, to assess if outcomes are “clearly defined” or not
relates to the data source, thus this was not investigated. That is, clearly defined outcomes rely
on the validity of the data source(s) and the accuracy of the outcome start and stop time, which
is difficult to assess. This rationale can similarly be applied to recommendations on exposures,
e.g., good measurement of start and stop.
Despite the advantages of co-authorship network analysis to examine the diffusion of
methodological innovations over time, co-authorship is only a portion of the entire social network
perspective. An investigation of diffusion based on co-authorship alone leaves lingering

112
questions surrounding the communication channels through which messages of the innovation
were passed. To obtain the complete picture of the diffusion of an innovation, such as why there
may be a lag in use, additional research on affiliations such as society memberships or
conference attendance may be informative. Surveys and interviews of the innovators and
different stages of adopter (e.g. early adopters, laggards) could also be powerful tools to
capture collaboration between researchers beyond co-authorship. In addition, while centrality
measures are useful to assess the impact authors may have on a network, they may be
misleading since they are significantly correlated with the number of co-author, evidenced by
the high scores of Dodd and Patel who published only once yet had 34 co-authors.238 A possible
solution may be to adjust for the number of authors.
Another limitation of this research is based on a critical assumption that guided the co-
authorship network analysis methodology: that all authors listed on an article made an
intellectual contribution. Thus, it was assumed that all papers included in the co-authorship
network abided by the uniform bioethical standards for authorship, such that all listed authors
participated in the conception and design, acquisition of data, drafting of the article and final
approval.48 It is possible that in spite of these standards, some authors may have received ‘gift’
authorship, which occurs when authors have not met all of the aforementioned criteria.48
6.5 Future directions
This research highlights the need for a formal set of recommendations or guidelines on methods
and reporting of self-controlled methods in pharmacoepidemiology, such as a checklist, e.g.
Good ReseArch for Comparative Effectiveness (GRACE) or STrengthening the Reporting of
OBservational studies in Epidemiology (STROBE). Such a tool in its early stages of
development is presented in Appendix G . Existing research has demonstrated that the
introduction of formal reporting guidelines has a positive impact on the reporting of

113
observational and RCT reporting,239 and can similarly help to improve the quality of self-
controlled research by providing novice researchers with a solid methodological foundation that
can be leveraged to conduct self-controlled studies. Developing standards to guide the use of
bi-directional periods in the pharmacoepidemiologic application of self-controlled studies is
particularly important because the integrity of the designs is at risk when health outcomes affect
future probability of drug use due to susceptibility to bias.
Linked to the development of formal methodological and reporting standards, quality
appraisal of self-controlled studies is another important area of research yet to be explored. An
earlier narrative review ranked exposures investigated by case-crossover studies for their
suitability to self-controlled case-control study designs.6 Future research is required to rank the
repertoire of self-controlled studies in order of their suitability to exposures and outcomes
investigated using self-controlled methods, and maintain such rankings as more applications
emerge over time. This research is particularly important because unlike the clear evidence of
underreporting in self-controlled designs, it is unclear of the implications of stretching self-
controlled designs to answer atypical research questions, and thus these methods need to be
investigated further. Leveraging the co-authorship network, another potential future research
endeavour related to quality may include mapping how self-controlled applications followed
methodological and reporting recommendations to the network over time. This will enable the
visualization of studies that have followed existing recommendations by component and over
time, so that we can identify which authors and institutions are conducting high quality research
or not.
6.6 Relevance
This analysis of the use of self-controlled designs in pharmacoepidemiology and networks of
co-authors is relevant to the development of a standardized terminology and practices that are

114
clear and transferrable across all self-controlled study designs. A terminology to create
consistency of observation window naming across all self-controlled designs in a clear and
intuitive way is proposed and illustrated in Figure 6.1 . Newly proposed terminology includes the
terms index window and referent window to describe the observation windows of self-controlled
designs. First, a new term called index date , is proposed for added clarity. The index date
marks the point when the drug exposure (self-controlled cohort) or outcome (self-controlled
case-control) may be identified at the start or end of the index window. The index window
represents the period immediately before the outcome (self-controlled case-control), or
immediately after drug exposure (self-controlled cohort). Next, the term referent window to
describe “control” periods was selected based on the existing case-time control and case-case-
time control terminology, which was carefully named previously out of necessity to distinguish
between control periods and control groups.22 However, to disseminate novel terminology can
be challenging, particularly in a fragmented network of researchers. Leveraging the network
analysis, prominent and influential self-controlled researchers such as seminal authors can be
invited to workshops and conferences (such as the International Society for
Pharmacoepidemiology annual meeting) to develop and disseminate common language, as well
as guidelines for reporting studies.
6.7 Conclusions
This is the first study to systematically review all self-controlled designs in
pharmacoepidemiology. There were differences in the exposures and outcomes investigated,
largely based on design type, i.e. self-controlled case-control or self-controlled cohort. For
example, vaccines were the most commonly investigated exposure in self-controlled cohort
studies, and their use has likely increased due to a recent global vaccine safety monitoring
initiative that promotes international collaborations in vaccine safety research. While

115
conclusions cannot be made about the appropriateness of stretched self-controlled methods
without further testing, evidence of underreporting of raw data and biologically plausible
outcome onset timing highlights a need for formal guidelines.
The number of self-controlled applications increased over time, yet the diffusion was
initially slow. Rogers’ Diffusion of Innovations Theory helps to explain the diffusion of self-
controlled innovations in pharmacoepidemiology and key self-controlled researchers are
identified over time using social network analysis techniques. The slow diffusion of self-
controlled designs was attributed to the observability, trialability and complexity of the designs.
The composition of the network varied such that self-controlled case-control networks were
fragmented compared to a large, interconnected, component of mainly self-controlled cohort
studies. The results of this research indicate the seminal author Farrington is not only an
innovator but a key opinion leader, and has been instrumental in the diffusion of the self-
controlled case-series design in pharmacoepidemiology. As the number of self-controlled
applications continues to increase, a standardized set of terminology to describe self-controlled
designs is required to provide novice researchers with clarity of designs, making them easier to
use.

116
A. Case-crossover
B. Self-controlled case-series
C. Case-time control
D. Case-case-time control
Figure 6.1 Proposed language to describe self-contr olled study designs in pharmacoepidemiology. Illustration of observation windows over time, starting at some index date (arrow associated with outcome or exposure) based on outcome (self-controlled case-control) or exposure (self-controlled cohort). Developed at weekly meetings between G.P.C., M.M. and S.M.C. over a one month period and leveraging language abstraction.

117
REFERENCES
1. Viera AJ, Bangdiwala SI. Eliminating bias in randomized controlled trials: importance of allocation concealment and masking. Family medicine 2007;39:132-7. 2. Treweek S, Pitkethly M, Cook J, et al. Strategies to improve recruitment to randomised controlled trials. Cochrane Database Syst Rev 2010;14. 3. Tadrous M, Gagne JJ, Sturmer T, Cadarette SM. Disease risk score as a confounder summary method: systematic review and recommendations. Pharmacoepidemiology and drug safety 2013;22:122-9. 4. Sturmer T, Schneeweiss S, Avorn J, Glynn RJ. Adjusting effect estimates for unmeasured confounding with validation data using propensity score calibration. Am J Epidemiol 2005;162:279-89. 5. Maclure M. The case-crossover design: A method for studying transient effects on the risk of acute events. Am J Epidemiol 1991;133:144-53. 6. Maclure M, Fireman B, Nelson JC, et al. When should case-only designs be used for safety monitoring of medical products? Pharmacoepidemiology & Drug Safety 2012;21:50-61. 7. Maclure M, Mittleman MA. Should we use a case-crossover design? Annu Rev Public Health 2000;21:193-221. 8. Ash AS. Health Care Utilization Data. 9. Cadarette SM, Burden AM. Measuring and improving adherence to osteoporosis pharmacotherapy. Current opinion in rheumatology 2010;22:397-403. 10. Canadian Institutes of Health Research (CIHR) -- Drug Safety and Effectiveness Network (DSEN). 2014. (Accessed 2014, at http://www.cihr-irsc.gc.ca/e/39389.html.) 11. Patient-Centered Outcomes Research Institute (PCORI) Research Methodology. 2014. (Accessed 2014, at http://www.pcori.org/research-we-support/research-methodology-standards/.) 12. DiPietro NA. Methods in Epidemiology: Observational Study Designs. Pharmacotherapy: The Journal of Human Pharmacology and Drug Therapy 2010;30:973-84. 13. Eldredge J. Cohort studies in health sciences librarianship. J Med Libr Assoc 2002;90:380-92. 14. Rothman KJ. Epidemiology An Introduction. 2nd Edition ed: Oxford University Press Inc.; 2012. 15. Yang Y, West-Strum, D. Understanding Pharmacoepidemiology. 1 ed. United States of America: McGraw-Hill Companies; 2011. 16. von Elm E, Altman DG, Egger M, Pocock SJ, Gotzsche PC, Vandenbroucke JP. The Strengthening the Reporting of Observational Studies in Epidemiology (STROBE) statement: guidelines for reporting observational studies. Bull World Health Organ 2007;85:867-72. 17. Fletcher RH, Fletcher SW, Wagner EH. Clinical Epidemiology The Essentials United States of America: Williams & Wilkins; 1988. 18. Schneeweiss S, Glynn RJ, Tsai EH, Avorn J, Solomon DH. Adjusting for unmeasured confounders in pharmacoepidemiologic claims data using external information: the example of COX2 inhibitors and myocardial infarction. Epidemiology 2005;16:17-24. 19. Paneth N, Susser E, Susser M. Origins and early development of the case-control study: Part 1, Early evolution. Soz Praventivmed 2002;47:282-8. 20. Strom BL, Kimmel SE. Textbook of Pharmacoepidemiology: John Wiley & Sons Inc.; 2006. 21. Suissa S. The case-time-control design. Epidemiology 1995;6:248-53.

118
22. Wang S, Linkletter C, Maclure M, et al. Future cases as present controls to adjust for exposure trend bias in case-only studies. Epidemiology 2011;22:568-74. 23. Farrington CP. Relative incidence estimation from case series for vaccine safety evaluation. Biometrics 1995;51:228-35. 24. Our Questions, Our Decisions: Standards for Patient-centered Outcomes Research. Public Comment Draft Report. PCORI Methodology Committee; 2012 July 23 2012. 25. Bateson TF, Schwartz J. Selection bias and confounding in case-crossover analyses of environmental time-series data. Epidemiology 2001;12:654-61. 26. Navidi W. Bidirectional case-crossover designs for exposures with time trends. Biometrics 1998;54:596-605. 27. Wang PS, Schneeweiss S, Glynn RJ, Mogun H, Avorn J. Use of the case-crossover design to study prolonged drug exposures and insidious outcomes. Annals of epidemiology 2004;14:296-303. 28. Eliofotisti P. COMPARISON OF THE CASE-TIME-CONTROL AND THE CASE-CROSSOVER DESIGN IN ESTIMATING RISK OF INJURY FOR PRESCRIPTION MEDICATIONS USING POPULATION DATABASES. Quebec: University of Laval; 2011. 29. Bateson TF, Schwartz J. Control for seasonal variation and time trend in case-crossover studies of acute effects of environmental exposures. Epidemiology 1999;10:539-44. 30. Schneeweiss S, Sturmer T, Maclure M. Case-crossover and case-time-control designs as alternatives in pharmacoepidemiologic research. Pharmacoepidemiology & Drug Safety 1997;6:S51-9. 31. Whitaker HJ, Farrington CP, Spiessens B, Musonda P. Tutorial in biostatistics: the self-controlled case series method. Statistics in medicine 2006;25:1768-97. 32. Nordmann S, Biard L, Ravaud P, Esposito-Farese M, Tubach F. Case-only designs in pharmacoepidemiology: a systematic review. PloS one 2012;7:e49444. 33. Madigan D, Simpson S, Hua W, Paredes A, Fireman B, Maclure M. The Self-Controlled Case Series: Recent Developments. Columbia University. 34. Wasserman S, Faust K. Social Network Analysis: Methods and Applications: Cambridge University Press; 1994. 35. Haider M, Kreps GL. Forty years of diffusion of innovations: utility and value in public health. Journal of health communication 2004;9:3-11. 36. Rogers EM. Diffusion of Innovations. Fifth ed. Toronto: Free Press; 2003. 37. Sahin I. Detailed review of Rogers' Diffusion of Innovations Theory and educational technology-related studies based on Rogers' Theory. The Turkish Online Journal of Educational Technology 2006;5:14-23. 38. Yu Q, Shao H, He P, Duan Z. World scientific collaboration in coronary heart disease research. International journal of cardiology 2012. 39. Long JC, Cunningham FC, Braithwaite J. Network structure and the role of key players in a translational cancer research network: a study protocol. BMJ open 2012;2. 40. Glänzel W, Schubert A. Analysing Scientific Networks Through Co-Authorship. In: Moed H, Glänzel W, Schmoch U, eds. Handbook of Quantitative Science and Technology Research: Springer Netherlands; 2005:257-76. 41. Blanchet K, James P. How to do (or not to do) … a social network analysis in health systems research. Health Policy and Planning 2011. 42. Activate Networks. Who is central to a social network? It depends on your centrality measure. 2014. (Accessed September 5, 2014, at http://www.activatenetworks.net/who-is-central-to-a-social-network-it-depends-on-your-centrality-measure/.)

119
43. Prell C. Social network analysis: history, theory and methodology. London: Sage Publications; 2012. 44. Consiglio GP, Burden AM, Maclure M, McCarthy L, Cadarette SM. Case-crossover study design in pharmacoepidemiology: systematic review and recommendations. Pharmacoepidemiology and drug safety 2013. 45. Saito R, Smoot ME, Ono K, et al. A travel guide to Cytoscape plugins. Nature methods 2012;9:1069-76. 46. Borgatti SP, Everett MG, Freeman LC. Ucinet for Windows: Software for Social Network Analysis. Harvard, MA: Analytic Technologies; 2002. 47. Cicinelli EA, Consiglio GP, Cadarette SM. Diffusion of Innovation in Pharmacoepidemiology: Co-authorship Network Analysis of Case-only Study Designs. In: Undergraduate Summer Research Day; 2014; Toronto; 2014. 48. Tscharntke T, Hochberg ME, Rand TA, Resh VH, Krauss J. Author Sequence and Credit for Contributions in Multiauthored Publications. PLoS Biol 2007;5:e18. 49. Delaney JAC, Suissa S. The case-crossover study design in pharmacoepidemiology. Stat Methods Med Res 2009;18:53-65. 50. Wu CS, Wang SC, Gau SSF, Tsai HJ, Cheng YC. Association of stroke with the receptor-binding profiles of antipsychotics - A case-crossover study. Biological Psychiatry 2013;73:414-21. 51. Wilson K, Ducharme R, Hawken S. Association between socioeconomic status and adverse events following immunization at 2, 4, 6 and 12 months. Hum Vaccin Immunother 2013;9:1153-7. 52. Wijlaars LPMM, Nazareth I, Whitaker HJ, Evans SJW, Petersen I. Suicide-related events in young people following prescription of SSRIs and other antidepressants: A self-controlled case series analysis. BMJ Open 2013;3. 53. Tseng HF, Sy LS, Qian L, et al. Safety of a tetanus-diphtheria-acellular pertussis vaccine when used off-label in an elderly population. Clinical Infectious Diseases 2013;56:315-21. 54. Soderberg KC, Laflamme L, Moller J. Newly initiated opioid treatment and the risk of fall-related injuries: A nationwide, register-based, case-crossover study in Sweden. CNS Drugs 2013;27:155-61. 55. Shin JY, Choi NK, Jung SY, Lee J, Kwon JS, Park BJ. Risk of ischemic stroke with the use of risperidone, quetiapine and olanzapine in elderly patients: A population-based, case-crossover study. Journal of Psychopharmacology 2013;27:638-44. 56. Raman SR, Marshall SW, Haynes K, Gaynes BN, Naftel AJ, Sturmer T. Stimulant treatment and injury among children with attention deficit hyperactivity disorder: an application of the self-controlled case series study design. Injury Prevention 2013;19:164-70. 57. Price SD, Holman CDJ, Sanfilippo FM, Emery JD. Use of case-time-control design in pharmacovigilance applications: Exploration with high-risk medications and unplanned hospital admissions in the Western Australian elderly. Pharmacoepidemiology and Drug Safety 2013;22:1159-70. 58. Orriols L, Wilchesky M, Lagarde E, Suissa S. Prescription of antidepressants and the risk of road traffic crash in the elderly: A case-crossover study. British Journal of Clinical Pharmacology 2013;76:810-5. 59. Orriols L, Foubert-Samier A, Gadegbeku B, et al. Prescription of antiepileptics and the risk of road traffic crash. Journal of Clinical Pharmacology 2013;53:339-44. 60. Liu CL, Shau WY, Chang CH, Wu CS, Lai MS. Pneumonia risk and use of angiotensin-converting enzyme inhibitors and angiotensin II receptor blockers. Journal of Epidemiology 2013;23:344-50.

120
61. Lee CH, Jang EJ, Hyun MK, Lee NR, Kim K, Yim JJ. Risk of hospital admission or emergency room visit for pneumonia in patients using respiratory inhalers: A case-crossover study. Respirology 2013;18:1116-27. 62. Huang WT, Yang HW, Liao TL, et al. Safety of pandemic (H1N1) 2009 monovalent vaccines in taiwan: a self-controlled case series study. PLoS ONE [Electronic Resource] 2013;8:e58827. 63. Huang EJ, Bonafide CP, Keren R, Nadkarni VM, Holmes JH. Medications associated with clinical deterioration in hospitalized children. Journal of Hospital Medicine 2013;8:254-60. 64. Galeotti F, Massari M, D'Alessandro R, et al. Risk of Guillain-Barre syndrome after 2010-2011 influenza vaccination. Eur J Epidemiol 2013;28:433-44. 65. Fardet L, Nazareth I, Whitaker HJ, Petersen I. Severe neuropsychiatric outcomes following discontinuation of long-term glucocorticoid therapy: a cohort study. Journal of Clinical Psychiatry 2013;74:e281-6. 66. Donegan K, Beau-Lejdstrom R, King B, Seabroke S, Thomson A, Bryan P. Bivalent human papillomavirus vaccine and the risk of fatigue syndromes in girls in the UK. Vaccine 2013;31:4961-7. 67. Dodd CN, Romio SA, Black S, et al. International collaboration to assess the risk of Guillain Barre Syndrome following Influenza A (H1N1) 2009 monovalent vaccines. Vaccine 2013;31:4448-58. 68. Choi NK, Lee J, Chang Y, et al. Polyethylene glycol bowel preparation does not eliminate the risk of acute renal failure: a population-based case-crossover study.[Erratum appears in Endoscopy. 2014 Feb;46(2):109]. Endoscopy 2013;45:208-13. 69. Carlin JB, Macartney KK, Lee KJ, et al. Intussusception risk and disease prevention associated with rotavirus vaccines in Australia's National Immunization Program. Clinical Infectious Diseases 2013;57:1427-34. 70. Butt DA, Mamdani M, Austin PC, Tu K, Gomes T, Glazier RH. The risk of falls on initiation of antihypertensive drugs in the elderly. Osteoporosis International 2013;24:2649-57. 71. Bjorkenstam C, Moller J, Ringback G, Salmi P, Hallqvist J, Ljung R. An Association between Initiation of Selective Serotonin Reuptake Inhibitors and Suicide - A Nationwide Register-Based Case-Crossover Study. PLoS ONE 2013;8. 72. Bird ST, Etminan M, Brophy JM, Hartzema AG, Delaney JA. Risk of acute kidney injury associated with the use of fluoroquinolones. Cmaj 2013;185:E475-82. 73. Bird ST, Delaney JAC, Brophy JM, Etminan M, Skeldon SC, Hartzema AG. Tamsulosin treatment for benign prostatic hyperplasia and risk of severe hypotension in men aged 40-85 years in the United States: Risk window analyses using between and within patient methodology. Bmj 2013;347. 74. Berry SD, Zhu Y, Choi H, Kiel DP, Zhang Y. Diuretic initiation and the acute risk of hip fracture. Osteoporosis International 2013;24:689-95. 75. Berry SD, Lee Y, Cai S, Dore DD. Nonbenzodiazepine sleep medication use and hip fractures in nursing home residents. JAMA Internal Medicine 2013;173:754-61. 76. Benchimol EI, Hawken S, Kwong JC, Wilson K. Safety and utilization of influenza immunization in children with inflammatory bowel disease. Pediatrics 2013;131:e1811-20. 77. Asturias EJ, Contreras-Roldan IL, Ram M, et al. Post-authorization safety surveillance of a liquid pentavalent vaccine in Guatemalan children. Vaccine 2013;31:5909-14. 78. Wilson K, Hawken S. Incidence of adverse events in premature children following 2-mo vaccination. Human Vaccines and Immunotherapeutics 2012;8:592-5.
121
79. Weeke P, Jensen A, Folke F, et al. Antidepressant use and risk of out-of-hospital cardiac arrest: A nationwide case-time-control study. Clinical Pharmacology and Therapeutics 2012;92:72-9. 80. Wang S, Linkletter C, Dore D, Mor V, Buka S, Maclure M. Age, antipsychotics, and the risk of ischemic stroke in the Veterans Health Administration. Stroke 2012;43:28-31. 81. Velazquez FR, Colindres RE, Grajales C, et al. Postmarketing surveillance of intussusception following mass introduction of the attenuated human rotavirus vaccine in Mexico. Pediatric Infectious Disease Journal 2012;31:736-44. 82. Tseng HF, Liu A, Sy L, et al. Safety of zoster vaccine in adults from a large managed-care cohort: a Vaccine Safety Datalink study. J Intern Med 2012;271:510-20. 83. Tokars JI, Lewis P, DeStefano F, et al. The Risk of Guillain-Barre Syndrome Associated with Influenza A (H1N1) 2009 Monovalent Vaccine and 2009-2010 Seasonal Influenza Vaccines: Results from Self-Controlled Analyses. Pharmacoepidemiology and Drug Safety 2012;21:546-52. 84. Sun Y, Christensen J, Hviid A, et al. Risk of febrile seizures and epilepsy after vaccination with diphtheria, tetanus, acellular pertussis, inactivated poliovirus, and Haemophilus influenzae type B. Jama 2012;307:823-31. 85. Smith SW, Sato M, Gore SD, et al. Erythropoiesis-stimulating agents are not associated with increased risk of thrombosis in patients with myelodysplastic syndromes. Haematologica 2012;97:15-20. 86. Shau WY, Chen HC, Chen ST, et al. Risk of new acute myocardial infarction hospitalization associated with use of oral and parenteral non-steroidal anti-inflammation drugs (NSAIDs): a case-crossover study of Taiwan's National Health Insurance claims database and review of current evidence. BMC cardiovascular disorders 2012;12:4. 87. Seitz DP, Campbell RJ, Bell CM, et al. Short-term exposure to antidepressant drugs and risk of acute angle-closure glaucoma among older adults. Journal of Clinical Psychopharmacology 2012;32:403-7. 88. Rogers MA, Levine DA, Blumberg N, Flanders SA, Chopra V, Langa KM. Triggers of hospitalization for venous thromboembolism. Circulation 2012;125:2092-9. 89. Pariente A, Fourrier-Reglat A, Ducruet T, et al. Antipsychotic use and myocardial infarction in older patients with treated dementia. Archives of Internal Medicine 2012;172:648-53; discussion 54-5. 90. Orriols L, Queinec R, Philip P, et al. Risk of injurious road traffic crash after prescription of antidepressants. Journal of Clinical Psychiatry 2012;73:1088-94. 91. Liu CL, Shau WY, Wu CS, Lai MS. Angiotensin-converting enzyme inhibitor/angiotensin II receptor blockers and pneumonia risk among stroke patients. Journal of Hypertension 2012;30:2223-9. 92. Lee YC, Chang CH, Lin JW, Chen HC, Lin MS, Lai MS. Non-steroidal anti-inflammatory drugs use and risk of upper gastrointestinal adverse events in cirrhotic patients. Liver International 2012;32:859-66. 93. Koopmans PC, Bos JH, de Jong van den Berg LT. Are antibiotics related to oral combination contraceptive failures in the Netherlands? A case-crossover study. Pharmacoepidemiology and Drug Safety 2012;21:865-71. 94. Kang DY, Park S, Rhee CW, et al. Zolpidem use and risk of fracture in elderly insomnia. Journal of Preventive Medicine and Public Health 2012;45:219-26. 95. Hawken S, Manuel DG, Deeks SL, Kwong JC, Crowcroft NS, Wilson K. Underestimating the safety benefits of a new vaccine: the impact of acellular pertussis vaccine versus whole-cell pertussis vaccine on health services utilization. Am J Epidemiol 2012;176:1035-42.
122
96. Hambidge SJ, Ross C, Glanz J, et al. Trivalent inactivated influenza vaccine is not associated with sickle cell crises in children. Pediatrics 2012;129:e54-e9. 97. Douglas IJ, Evans SJW, Hingorani AD, et al. Clopidogrel and Interaction with Proton Pump Inhibitors: Comparison between Cohort and within Person Study Designs. BMJ (Online) 2012;345. 98. De Wals P, Deceuninck G, Toth E, et al. Risk of Guillain-Barre syndrome following H1N1 influenza vaccination in Quebec. JAMA - Journal of the American Medical Association 2012;308:175-81. 99. Dassanayake TL, Jones AL, Michie PT, et al. Risk of road traffic accidents in patients discharged following treatment for psychotropic drug overdose: A self-controlled case series study in Australia. CNS Drugs 2012;26:269-76. 100. Crawford NW, Cheng A, Andrews N, et al. Guillain-Barre syndrome following pandemic (H1N1) 2009 influenza A immunisation in Victoria: a self-controlled case series. Medical Journal of Australia 2012;197:574-8. 101. Butt DA, Mamdani M, Austin PC, Tu K, Gomes T, Glazier RH. The risk of hip fracture after initiating antihypertensive drugs in the elderly. Archives of Internal Medicine 2012;172:1739-44. 102. Berry SD, Mittleman MA, Zhang Y, et al. New loop diuretic prescriptions may be an acute risk factor for falls in the nursing home. Pharmacoepidemiology and Drug Safety 2012;21:560-3. 103. Arnheim-Dahlstrom L, Hallgren J, Weibull CE, Sparen P. Risk of presentation to hospital with epileptic seizures after vaccination with monovalent AS03 adjuvanted pandemic A/H1N1 2009 influenza vaccine (Pandemrix): self controlled case series study. BMJ (Clinical research ed) 2012;345. 104. Andrews N, Stowe J, Miller E, et al. A collaborative approach to investigating the risk of thrombocytopenic purpura after measles-mumps-rubella vaccination in England and Denmark. Vaccine 2012;30:3042-6. 105. Yang YH, Lai JN, Lee CH, Wang JD, Chen PC. Increased risk of hospitalization related to motor vehicle accidents among people taking zolpidem: A case-crossover study. Journal of Epidemiology 2011;21:37-43. 106. Wu CS, Wang SC, Cheng YC, Gau SS. Association of cerebrovascular events with antidepressant use: a case-crossover study. American Journal of Psychiatry 2011;168:511-21. 107. Wright AJ, Gomes T, Mamdani MM, Horn JR, Juurlink DN. The risk of hypotension following co-prescription of macrolide antibiotics and calcium-channel blockers. CMAJ 2011;183:303-7. 108. Wilson K, Hawken S, Potter BK, et al. Patterns of emergency room visits, admissions and death following recommended pediatric vaccinations - a population based study of 969,519 vaccination events. Vaccine 2011;29:3746-52. 109. Wilson K, Hawken S, Kwong JC, et al. Impact of birth weight at term on rates of emergency room visits and hospital admissions following vaccination at 2 months of age. Vaccine 2011;29:8267-74. 110. Wilson K, Hawken S, Kwong JC, et al. Adverse events following 12 and 18 month vaccinations: a population-based, self-controlled case series analysis. PLoS ONE [Electronic Resource] 2011;6:e27897. 111. Traversa G, Spila-Alegiani S, Bianchi C, et al. Sudden Unexpected Deaths and Vaccinations during the First Two Years of Life in Italy: A Case Series Study. Plos One 2011;6.

123
112. Toh S, Mitchell AA, Anderka M, de Jong-van den Berg LT, Hernandez-Diaz S, National Birth Defects Prevention S. Antibiotics and oral contraceptive failure - a case-crossover study. Contraception 2011;83:418-25. 113. Stowe J, Andrews N, Bryan P, Seabroke S, Miller E. Risk of convulsions in children after monovalent H1N1 (2009) and trivalent influenza vaccines: a database study. Vaccine 2011;29:9467-72. 114. Risselada R, Straatman H, van Kooten F, et al. Platelet aggregation inhibitors, vitamin K antagonists and risk of subarachnoid hemorrhage. J Thromb Haemost 2011;9:517-23. 115. Patel MM, Lopez-Collada VR, Bulhoes MM, et al. Intussusception Risk and Health Benefits of Rotavirus Vaccination in Mexico and Brazil. N Engl J Med 2011;364:2283-92. 116. Orriols L, Philip P, Moore N, et al. Benzodiazepine-Like Hypnotics and the Associated Risk of Road Traffic Accidents. Clin Pharmacol Ther 2011;89:595-601. 117. Mullooly JP, Schuler R, Mesa J, Drew L, DeStefano F, team VSD. Wheezing lower respiratory disease and vaccination of premature infants. Vaccine 2011;29:7611-7. 118. Morgan TM, Schlegel C, Edwards KM, et al. Vaccines are not associated with metabolic events in children with urea cycle disorders. Pediatrics 2011;127:e1147-e53. 119. Meuleners LB, Duke J, Lee AH, Palamara P, Hildebrand J, Ng JQ. Psychoactive medications and crash involvement requiring hospitalization for older drivers: A population-based study. Journal of the American Geriatrics Society 2011;59:1575-80. 120. Lee CH, Wang JD, Chen PC. Risk of liver injury associated with Chinese herbal products containing radix bupleuri in 639,779 patients with hepatitis B virus infection. PloS one 2011;6:e16064. 121. Kilpatrick RD, Danese MD, Belozeroff V, Smirnakis K, Goodman WG, Rothman KJ. The association of vitamin D use with hypercalcemia and hyperphosphatemia in hemodialysis patients: A case-crossover study. Pharmacoepidemiology and Drug Safety 2011;20:914-21. 122. Jung SY, Choi NK, Kim JY, et al. Short-acting nifedipine and risk of stroke in elderly hypertensive patients. Neurology 2011;77:1229-34. 123. Hambidge SJ, Ross C, McClure D, Glanz J. Trivalent inactivated influenza vaccine is not associated with sickle cell hospitalizations in adults from a large cohort. Vaccine 2011;29:8179-81. 124. Gwini SM, Coupland CA, Siriwardena AN. The effect of influenza vaccination on risk of acute myocardial infarction: self-controlled case-series study. Vaccine 2011;29:1145-9. 125. Gribbin J, Hubbard R, Gladman J, Smith C, Lewis S. Serotonin-norepinephrine reuptake inhibitor antidepressants and the risk of falls in older people: case-control and case-series analysis of a large UK primary care database. Drugs & Aging 2011;28:895-902. 126. Gribbin J, Hubbard R, Gladman J, Smith C, Lewis S. Risk of falls associated with antihypertensive medication: self-controlled case series. Pharmacoepidemiol Drug Saf 2011;20:879-84. 127. Glanz JM, Newcomer SR, Hambidge SJ, et al. Safety of Trivalent Inactivated Influenza Vaccine in Children Aged 24 to 59 Months in the Vaccine Safety Datalink. Arch Pediatr Adolesc Med 2011;165:749-55. 128. Garrison MM, Lozano P, Christakis DA. Controller medication use and sleep problems in pediatric asthma: a longitudinal case-crossover analysis. Arch Pediatr Adolesc Med 2011;165:826-30. 129. Farez MF, Correale J. Yellow fever vaccination and increased relapse rate in travelers with multiple sclerosis. Archives of Neurology 2011;68:1267-71. 130. Escolano S, Farrington CP, Hill C, Tubert-Bitter P. Intussusception after Rotavirus Vaccination - Spontaneous Reports. N Engl J Med 2011;365:2139-.

124
131. Coupland CAC, Dhiman P, Barton G, et al. A study of the safety and harms of antidepressant drugs for older people: a cohort study using a large primary care database. Health Technology Assessment 2011;15:1-+. 132. Choi NK, Chang Y, Jung SY, et al. A population-based case-crossover study of polyethylene glycol use and acute renal failure risk in the elderly. World Journal of Gastroenterology 2011;17:651-6. 133. Chang CH, Lin JW, Chen HC, Kuo CW, Shau WY, Lai MS. Non-steroidal anti-inflammatory drugs and risk of lower gastrointestinal adverse events: A nationwide study in Taiwan. Gut 2011;60:1372-8. 134. Chang CH, Chen HC, Lin JW, Kuo CW, Shau WY, Lai MS. Risk of hospitalization for upper gastrointestinal adverse events associated with nonsteroidal anti-inflammatory drugs: A nationwide case-crossover study in Taiwan. Pharmacoepidemiology and Drug Safety 2011;20:763-71. 135. Berry SD, Zhang Y, Lipsitz LA, Mittleman MA, Solomon DH, Kiel DP. Antidepressant prescriptions: an acute window for falls in the nursing home. The journals of gerontology 2011;Series A, Biological sciences and medical sciences. 66:1124-30. 136. Berard A, Azoulay L, Nakhai-Pour HR, Moussally K. Isotretinoin and the risk of cardiovascular, cerebrovascular and thromboembolic disorders. Dermatology 2011;223:45-51. 137. Andrews N, Stowe J, Al-Shahi Salman R, Miller E. Guillain-Barre syndrome and H1N1 (2009) pandemic influenza vaccination using an AS03 adjuvanted vaccine in the United Kingdom: Self-controlled case series. Vaccine 2011;29:7878-82. 138. Velthove KJ, Leufkens HG, Schweizer RC, van Solinge WW, Souverein PC. Medication changes prior to hospitalization for obstructive lung disease: a case-crossover study. Annals of Pharmacotherapy 2010;44:267-73. 139. Shuto H, Imakyure O, Matsumoto J, et al. Medication use as a risk factor for inpatient falls in an acute care hospital: A case-crossover study. British Journal of Clinical Pharmacology 2010;69:535-42. 140. Schelleman H, Bilker WB, Brensinger CM, Wan F, Hennessy S. Anti-infectives and the risk of severe hypoglycemia in users of glipizide or glyburide. Clinical Pharmacology and Therapeutics 2010;88:214-22. 141. Petersen I, Gilbert R, Evans S, Ridolfi A, Nazareth I. Oral antibiotic prescribing during pregnancy in primary care: UK population-based study. J Antimicrob Chemother 2010;65:2238-46. 142. Orriols L, Delorme B, Gadegbeku B, et al. Prescription Medicines and the Risk of Road Traffic Crashes: A French Registry-Based Study. Plos Medicine 2010;7:9. 143. Olesen JB, Hansen PR, Erdal J, et al. Antiepileptic drugs and risk of suicide: A nationwide study. Pharmacoepidemiology and Drug Safety 2010;19:518-24. 144. Martins IS, Pellegrino FL, Freitas A, et al. Case-crossover study of Burkholderia cepacia complex bloodstream infection associated with contaminated intravenous bromopride. Infect Control Hosp Epidemiol 2010;31:516-21. 145. Lee CH, Wang JD, Chen PC. Increased risk of hospitalization for acute hepatitis in patients with previous exposure to NSAIDs. Pharmacoepidemiology and Drug Safety 2010;19:708-14. 146. Huang WT, Gargiullo PM, Broder KR, et al. Lack of association between acellular pertussis vaccine and seizures in early childhood. Pediatrics 2010;126:263-9. 147. Grimaldi-Bensouda L, Abenhaim L, Michaud L, et al. Clinical features and risk factors for upper gastrointestinal bleeding in children: A case-crossover study. European Journal of Clinical Pharmacology 2010;66:831-7.

125
148. Gold M, Dugdale S, Woodman RJ, McCaul KA. Use of the Australian Childhood Immunisation Register for vaccine safety data linkage. Vaccine 2010;28:4308-11. 149. Gagne JJ, Avorn J, Shrank WH, Schneeweiss S. Refilling and switching of antiepileptic drugs and seizure-related events. Clinical Pharmacology and Therapeutics 2010;88:347-53. 150. Fosbol EL, Folke F, Jacobsen S, et al. Cause-specific cardiovascular risk associated with nonsteroidal antiinflammatory drugs among healthy individuals. Circulation 2010;Cardiovascular quality and outcomes. 3:395-405. 151. Chang CH, Shau WY, Kuo CW, Chen ST, Lai MS. Increased risk of stroke associated with nonsteroidal anti-inflammatory drugs: A nationwide case-crossover study. Stroke 2010;41:1884-90. 152. Zinman L, Thoma J, Kwong JC, Kopp A, Stukel TA, Juurlink DN. Safety of influenza vaccination in patients with myasthenia gravis: A population-based study. Muscle & Nerve 2009;40:947-51. 153. Zambon A, Friz HP, Contier P, Corrao G. Effect of Macrolide and Fluoroquinolone Antibacterials on the Risk of Ventricular Arrhythmia and Cardiac Arrest An Observational Study in Italy Using Case-Control, Case-Crossover and Case-Time-Control Designs. Drug Saf 2009;32:159-67. 154. Stowe J, Andrews N, Wise L, Miller E. Investigation of the temporal association of Guillain-Barre syndrome with influenza vaccine and influenzalike illness using the United Kingdom General Practice Research Database. Am J Epidemiol 2009;169:382-8. 155. Stowe J, Andrews N, Taylor B, Miller E. No evidence of an increase of bacterial and viral infections following Measles, Mumps and Rubella vaccine. Vaccine 2009;27:1422-5. 156. Rifkin SB, Smith MR, Brotman RM, Gindi RM, Erbelding EJ. Hormonal contraception and risk of bacterial vaginosis diagnosis in an observational study of women attending STD clinics in Baltimore, MD. Contraception 2009;80:63-7. 157. Park-Wyllie LY, Mamdani MM, Li P, Gill SS, Laupacis A, Juurlink DN. Cholinesterase inhibitors and hospitalization for bradycardia: a population-based study. PLoS Med 2009;6:e1000157. 158. Naleway AL, Belongia EA, Donahue JG, Kieke BA, Glanz JM. Risk of immune hemolytic anemia in children following immunization. Vaccine 2009;27:7394-7. 159. Grosso A, Douglas I, Hingorani AD, MacAllister R, Hubbard R, Smeeth L. Inhaled tiotropium bromide and risk of stroke. Br J Clin Pharmacol 2009;68:731-6. 160. Grosso A, Douglas I, Hingorani A, MacAllister R, Smeeth L. Oral bisphosphonates and risk of atrial fibrillation and flutter in women: a self-controlled case-series safety analysis. PLoS One 2009;4:e4720. 161. Gislason GH, Rasmussen JN, Abildstrom SZ, et al. Increased mortality and cardiovascular morbidity associated with use of nonsteroidal anti-inflammatory drugs in chronic heart failure. Archives of Internal Medicine 2009;169:141-9. 162. Gibson JE, Hubbard RB, Smith CJ, Tata LJ, Britton JR, Fogarty AW. Use of self-controlled analytical techniques to assess the association between use of prescription medications and the risk of motor vehicle crashes. Am J Epidemiol 2009;169:761-8. 163. Douglas IJ, Evans SJ, Pocock S, Smeeth L. The risk of fractures associated with thiazolidinediones: a self-controlled case-series study. PLoS Med 2009;6:e1000154. 164. Dall M, Schaffalitzky de Muckadell OB, Lassen AT, Hansen JM, Hallas J. An Association Between Selective Serotonin Reuptake Inhibitor Use and Serious Upper Gastrointestinal Bleeding. Clinical Gastroenterology and Hepatology 2009;7:1314-21. 165. Andersen SS, Hansen ML, Gislason GH, et al. Antiarrhythmic therapy and risk of death in patients with atrial fibrillation: a nationwide study. Europace 2009;11:886-91.

126
166. Teixeira L, Mouthon L, Mahr A, et al. Mortality and risk factors of scleroderma renal crisis: A French retrospective study of 50 patients. Annals of the Rheumatic Diseases 2008;67:110-6. 167. Stowe J, Kafatos G, Andrews N, Miller E. Idiopathic thrombocytopenic purpura and the second dose of MMR. Arch Dis Child 2008;93:182-3. 168. Schelleman H, Bilker WB, Brensinger CM, Han X, Kimmel SE, Hennessy S. Warfarin with fluoroquinolones, sulfonamides, or azole antifungals: Interactions and the risk of hospitalization for gastrointestinal bleeding. Clinical Pharmacology and Therapeutics 2008;84:581-8. 169. Molokhia M, McKeigue P, Curcin V, Majeed A. Statin induced myopathy and myalgia: time trend analysis and comparison of risk associated with statin class from 1991-2006. PLoS ONE 2008;3:e2522. 170. Lee CH, Wang JD, Chen PC. Case-crossover study of hospitalization for acute hepatitis in Chinese herb users. Journal of Gastroenterology and Hepatology 2008;23:1549-55. 171. Hauser T, Mahr A, Metzler C, et al. The leucotriene receptor antagonist montelukast and the risk of Churg-Strauss syndrome: A case-crossover study. Thorax 2008;63:677-82. 172. Hallas J, Bjerrum L, Stovring H, Andersen M. Use of a prescribed ephedrine/caffeine combination and the risk of serious cardiovascular events: A registry-based case-crossover study. Am J Epidemiol 2008;168:966-73. 173. Grosso A, Douglas I, Hingorani A, MacAllister R, Smeeth L. Post-marketing assessment of the safety of strontium ranelate; a novel case-only approach to the early detection of adverse drug reactions. Br J Clin Pharmacol 2008;66:689-94. 174. Duran-Barragan S, McGwin G, Jr., Vila LM, Reveille JD, Alarcon GS, cohort LamU. Angiotensin-converting enzyme inhibitors delay the occurrence of renal involvement and are associated with a decreased risk of disease activity in patients with systemic lupus erythematosus--results from LUMINA (LIX): a multiethnic US cohort. Rheumatology 2008;47:1093-6. 175. Douglas IJ, Smeeth L. Exposure to antipsychotics and risk of stroke: self controlled case series study. Bmj 2008;337:a1227. 176. Azoulay L, Blais L, Koren G, LeLorier J, Berard A. Isotretinoin and the risk of depression in patients with acne vulgaris: A case-crossover study. Journal of Clinical Psychiatry 2008;69:526-32. 177. Ward KN, Bryant NJ, Andrews NJ, et al. Risk of serious neurologic disease after immunization of young children in Britain and Ireland. Pediatrics 2007;120:314-21. 178. Taylor B, Andrews N, Stowe J, Hamidi-Manesh L, Miller E. No increased risk of relapse after meningococcal C conjugate vaccine in nephrotic syndrome. Arch Dis Child 2007;92:887-9. 179. Sode J, Obel N, Hallas J, Lassen A. Use of fluroquinolone and risk of Achilles tendon rupture: a population-based cohort study. European Journal of Clinical Pharmacology 2007;63:499-503. 180. Miller E, Andrews N, Stowe J, Grant A, Waight P, Taylor B. Risks of convulsion and aseptic meningitis following measles-mumps-rubella vaccination in the United Kingdom. Am J Epidemiol 2007;165:704-9. 181. Kjaer D, Horvath-Puho E, Christensen J, et al. Use of phenytoin, phenobarbital, or diazepam during pregnancy and risk of congenital abnormalities: A case-time-control study. Pharmacoepidemiology and Drug Safety 2007;16:181-8. 182. Handoko KB, Zwart-van Rijkom JE, Hermens WA, Souverein PC, Egberts TC. Changes in medication associated with epilepsy-related hospitalisation: a case-crossover study. Pharmacoepidemiol Drug Saf 2007;16:189-96.

127
183. Finkelstein Y, Schechter T, Garcia-Bournissen F, et al. Is morphine exposure associated with acute chest syndrome in children with vaso-occlusive crisis of sickle cell disease? A 6-year case-crossover study. Clinical Therapeutics 2007;29:2738-43. 184. Andrews N, Stowe J, Miller E, Taylor B. Post-licensure safety of the meningococcal group C conjugate vaccine. Human vaccines 2007;3:59-63. 185. Stowe J, Andrews N, Wise L, Miller E. Bell's palsy and parenteral inactivated influenza vaccine. Human vaccines 2006;2:110-2. 186. Juurlink DN, Stukel TA, Kwong J, et al. Guillain-Barre syndrome after influenza vaccination in adults: a population-based study. Arch Intern Med 2006;166:2217-21. 187. Hunter DJ, York M, Chaisson CE, Woods R, Niu J, Zhang Y. Recent diuretic use and the risk of recurrent gout attacks: the online case-crossover gout study.[Erratum appears in J Rheumatol. 2006 Aug;33(8):1714]. Journal of Rheumatology 2006;33:1341-5. 188. Hughes RA, Charlton J, Latinovic R, Gulliford MC. No association between immunization and Guillain-Barre syndrome in the United Kingdom, 1992 to 2000. Arch Intern Med 2006;166:1301-4. 189. Hambidge SJ, Glanz JM, France EK, et al. Safety of trivalent inactivated influenza vaccine in children 6 to 23 months old. JAMA-J Am Med Assoc 2006;296:1990-7. 190. Gislason GH, Jacobsen S, Rasmussen JN, et al. Risk of death or reinfarction associated with the use of selective cyclooxygenase-2 inhibitors and nonselective nonsteroidal antiinflammatory drugs after acute myocardial infarction. Circulation 2006;113:2906-13. 191. Cameron JC, Walsh D, Finlayson AR, Boyd JH. Oral polio vaccine and intussusception: a data linkage study using records for vaccination and hospitalization. Am J Epidemiol 2006;163:528-33. 192. Biskupiak JE, Brixner DI, Howard K, Oderda GM. Gastrointestinal complications of over-the-counter nonsteroidal antiinflammatory drugs. J Pain Pall Care Pharmacother 2006;20:7-14. 193. Tata LJ, West J, Smith C, et al. General population based study of the impact of tricyclic and selective serotonin reuptake inhibitor antidepressants on the risk of acute myocardial infarction. Heart 2005;91:465-71. 194. Tata LJ, Fortun PJ, Hubbard RB, et al. Does concurrent prescription of selective serotonin reuptake inhibitors and non-steroidal anti-inflammatory drugs substantially increase the risk of upper gastrointestinal bleeding? Aliment Pharmacol Ther 2005;22:175-81. 195. Mittleman MA, MacLure M, Glasser DB. Evaluation of acute risk for myocardial infarction in men treated with Sildenafil Citrate. American Journal of Cardiology 2005;96:443-6. 196. Hubbard R, Lewis S, West J, et al. Bupropion and the risk of sudden death: a self-controlled case-series analysis using The Health Improvement Network. Thorax 2005;60:848-50. 197. Hubbard R, Lewis S, Smith C, et al. Use of nicotine replacement therapy and the risk of acute myocardial infarction, stroke, and death. Tobacco control 2005;14:416-21. 198. Corrao G, Zambon A, Faini S, Bagnardi V, Leoni O, Suissa S. Short-acting inhaled beta-2-agonists increased the mortality from chronic obstructive pulmonary disease in observational designs. J Clin Epidemiol 2005;58:92-7. 199. Cohen AD, Bonneh DY, Reuveni H, Vardy DA, Naggan L, Halevy S. Drug exposure and psoriasis vulgaris: Case-control and case-crossover studies. Acta Dermato-Venereologica 2005;85:299-303. 200. Ali M, Canh GD, Clemens JD, et al. The use of a computerized database to monitor vaccine safety in Viet Nam. Bull World Health Organ 2005;83:604-10.

128
201. Aberra FN, Brensinger CM, Bilker WB, Lichtenstein GR, Lewis JD. Antibiotic use and the risk of flare of inflammatory bowel disease. Clinical Gastroenterology and Hepatology 2005;3:459-65. 202. Smeeth L, Thomas SL, Hall AJ, Hubbard R, Farrington P, Vallance P. Risk of myocardial infarction and stroke after acute infection or vaccination. N Engl J Med 2004;351:2611-8. 203. Park T, Ki M, Yi SG. Statistical analysis of MMR vaccine adverse events on aseptic meningitis using the case cross-over design. Statistics in Medicine 2004;23:1871-83. 204. Mutsch M, Zhou W, Rhodes P, et al. Use of the inactivated intranasal influenza vaccine and the risk of Bell's palsy in Switzerland. N Engl J Med 2004;350:896-903. 205. France EK, Glanz JM, Xu S, et al. Safety of the trivalent inactivated influenza vaccine among children - A population-based study. Arch Pediatr Adolesc Med 2004;158:1031-6. 206. Tata LJ, West J, Harrison T, Farrington P, Smith C, Hubbard R. Does influenza vaccination increase consultations, corticosteroid prescriptions, or exacerbations in subjects with asthma or chronic obstructive pulmonary disease? Thorax 2003;58:835-9. 207. Miller E, Andrews N, Waight P, Taylor B. Bacterial infections, immune overload, and MMR vaccine. Measles, mumps, and rubella. Arch Dis Child 2003;88:222-3. 208. Ki M, Park T, Yi SG, Oh JK, Choi B. Risk analysis of aseptic meningitis after measles-mumps-rubella vaccination in Korean children by using a case-crossover design. Am J Epidemiol 2003;157:158-65. 209. Hubbard R, Farrington P, Smith C, Smeeth L, Tattersfield A. Exposure to tricyclic and selective serotonin reuptake inhibitor antidepressants and the risk of hip fracture. Am J Epidemiol 2003;158:77-84. 210. Hernandez-Diaz S, Hernan MA, Meyer K, Werler MM, Mitchell AA. Case-crossover and case-time-control designs in birth defects epidemiology. Am J Epidemiol 2003;158:385-91. 211. Etienney I, Beaugerie L, Viboud C, Flahault A. Non-steroidal anti-inflammatory drugs as a risk factor for acute diarrhoea: A case crossover study. Gut 2003;52:260-3. 212. Neutel CI, Perry S, Maxwell C. Medication use and risk of falls. Pharmacoepidemiology and Drug Safety 2002;11:97-104. 213. Sardinas MA, Cardenas AZ, Marie GC, et al. Lack of association between intussusception and oral polio vaccine in Cuban children. Eur J Epidemiol 2001;17:783-7. 214. Murphy TV, Gargiullo PM, Massoudi MS, et al. Intussusception among infants given an oral rotavirus vaccine. N Engl J Med 2001;344:564-72. 215. Miller E, Waight P, Farrington CP, Andrews N, Stowe J, Taylor B. Idiopathic thrombocytopenic purpura and MMR vaccine. Arch Dis Child 2001;84:227-9. 216. Kramarz P, Destefano F, Gargiullo PM, et al. Does influenza vaccination prevent asthma exacerbations in children? The Journal of pediatrics 2001;138:306-10. 217. Farrington CP, Miller E, Taylor B. MMR and autism: further evidence against a causal association. Vaccine 2001;19:3632-5. 218. Fagot JP, Mockenhaupt M, Bouwes-Bavinck JN, et al. Nevirapine and the risk of Stevens-Johnson syndrome or toxic epidermal necrolysis. AIDS 2001;15:1843-8. 219. Confavreux C, Suissa S, Saddier P, Bourdes V, Vukusic S, Vaccines Multiple Sclerosis S. Vaccinations and the risk of relapse in multiple sclerosis. N Engl J Med 2001;344:319-26. 220. Andrews N, Miller E, Waight P, et al. Does oral polio vaccine cause intussusception in infants? Evidence from a sequence of three self-controlled cases series studies in the United Kingdom. Eur J Epidemiol 2001;17:701-6. 221. Dourado I, Cunha S, Teixeira MG, et al. Outbreak of aseptic meningitis associated with mass vaccination with a urabe-containing measles-mumps-rubella vaccine: implications for immunization programs. Am J Epidemiol 2000;151:524-30.

129
222. Barbone F, McMahon AD, Davey PG, et al. Association of road-traffic accidents with benzodiazepine use. Lancet 1998;352:1331-6. 223. Sturkenboom MCJM, Middelbeek A, De Jong Van den Berg LTW, Van den Berg PB, Stricker Ch BH, Wesseling H. Vulvo-vaginal candidiasis associated with acitretin. J Clin Epidemiol 1995;48:991-7. 224. Farrington P, Pugh S, Colville A, et al. A new method for active surveillance of adverse events from diphtheria/tetanus/pertussis and measles/mumps/rubella vaccines. Lancet 1995;345:567-9. 225. Ray WA, Fought RL, Decker MD. PSYCHOACTIVE-DRUGS AND THE RISK OF INJURIOUS MOTOR-VEHICLE CRASHES IN ELDERLY DRIVERS. Am J Epidemiol 1992;136:873-83. 226. WHO. Global Vaccine Safety Blueprint In. Programme for International Drug Monitoring; November 2011. 227. Hebert C, Delaney JA, Hemmelgarn B, Levesque LE, Suissa S. Benzodiazepines and elderly drivers: a comparison of pharmacoepidemiological study designs. Pharmacoepidemiology and drug safety 2007;16:845-9. 228. Weldeselassie YG, Whitaker HJ, Farrington CP. Use of the self-controlled case-series method in vaccine safety studies: review and recommendations for best practice. Epidemiology and infection 2011;139:1805-17. 229. Simon SD. Understanding the odds ratio and the relative risk. Journal of andrology 2001;22:533-6. 230. Vehovar VBZLMK. Language as a barrier. The Internet Global Summit 1999. 231. Wallace J, Nwosu B, Clarke M. Barriers to the uptake of evidence from systematic reviews and meta-analyses: a systematic review of decision makers’ perceptions. BMJ open 2012;2. 232. Quartey G, Feudjo-Tepie M, Wang J, Kim J. Opportunities for minimization of confounding in observational research. Pharmaceutical statistics 2011;10:539-47. 233. The Department of Mathematics and Statistics. In: The Open University. http://www.mathematics.open.ac.uk/People/heather.whitaker; 2014. 234. Edwards PR, Consiglio G, Tadrous M, Cadarette SM. Uptake of Methodological Innovation in Pharmacoepidemiology: Disease Risk Score Co-Authorship Network Analysis. In: Pharmacoepidemiology and drug safety; 2013: WILEY-BLACKWELL 111 RIVER ST, HOBOKEN 07030-5774, NJ USA; 2013. p. 216-. 235. Dosi G. Technological Paradigms and Technological Trajectories. Research Policy 1982:147-62. 236. Tadrous M, Gagne JJ, Sturmer T, Cadarette SM. Disease Risk Score (DRS) as a confounder summary method: systematic review and recommendations. Pharmacoepidemiology & Drug Safety 2012. 237. Freeman LC. Centrality in social networks conceptual clarification. Social Networks 1978;1:215-39. 238. Yan E, Ding Y. Applying centrality measures to impact analysis: A coauthorship network analysis. J Am Soc Inf Sci Technol 2009;60:2107-18. 239. Fung AE, Palanki R, Bakri SJ, Depperschmidt E, Gibson A. Applying the CONSORT and STROBE statements to evaluate the reporting quality of neovascular age-related macular degeneration studies. Ophthalmology 2009;116:286-96. 240. Maclure M, Mittleman MA. Case-crossover designs compared with dynamic follow-up designs. Epidemiol 2008;19:176-8.

130
241. Greenland S. A unified approach to the analysis of case-distribution (case-only) studies. Statistics in Medicine 1999;18:1-15. 242. Carracedo-Martinez E, Tobias A, Saez M, Taracido M, Figueiras A. Case-crossover design: Basic essentials and applications. Gac Sanit 2009;23:161-5. 243. DiPietro NA. Methods in epidemiology: Observational study designs. Pharmacother 2010;30:973-84. 244. Ellenberg SS, Braun MM. Monitoring the safety of vaccines - Assessing the risks. Drug Saf 2002;25:145-52. 245. Farrington CP, Nash J, Miller E. Case series analysis of adverse reactions to vaccines: A comparative evaluation. Am J Epidemiol 1996;143:1165-73. 246. Figueiras A, Tato F, Takkouche B, GestalOtero JJ. An algorithm for the design of epidemiologic studies applied to drug surveillance. Eur J Clin Pharmacol 1997;51:445-8. 247. Gagne JJ, Fireman B, Ryan PB, et al. Design considerations in an active medical product safety monitoring system. Pharmacoepidemiol Drug Saf 2012;21:32-40. 248. Hanley JA, Dendukuri N. Efficient sampling approaches to address confounding in database studies. Stat Methods Med Res 2009;18:81-105. 249. Lee C-H, Wang J-D, Chen P-C, Health Data Analysis in Taiwan Research G. Case-crossover design: an alternative strategy for detecting drug-induced liver injury. J Clin Epidemiol 2012;65:560-7. 250. McMahon AD, Evans JMM, McGilchrist MM, McDevitt DG, MacDonald TM. Drug exposure risk windows and unexposed comparator groups for cohort studies in pharmacoepidemiology. Pharmacoepidemiol Drug Saf 1998;7:275-80. 251. Nicholas JM, Grieve AP, Gulliford MC. Within-person study designs had lower precision and greater susceptibility to bias because of trends in exposure than cohort and nested case-control designs. J Clin Epidemiol 2012;65:384-93. 252. Quartey G, Feudjo-Tepie M, Wang JX, Kim J. Opportunities for minimization of confounding in observational research. Pharm Stat 2011;10:539-47. 253. Schneeweiss S. Developments in post-marketing comparative effectiveness research. Clin Pharmacol Ther 2007;82:143-56. 254. Schneeweiss S. A basic study design for expedited safety signal evaluation based on electronic healthcare data. Pharmacoepidemiol Drug Saf 2010;19:858-68. 255. Schneeweiss S, Avorn J. A review of uses of health care utilization databases for epidemiologic research on therapeutics. J Clin Epidemiol 2005;58:323-37. 256. Tsai C-L, Camargo CA, Jr. Methodological considerations, such as directed acyclic graphs, for studying "acute on chronic" disease epidemiology: chronic obstructive pulmonary disease example. J Clin Epidemiol 2009;62:982-90. 257. Varadhan R, Frangakis CE. Revealing and addressing length bias and heterogeneous effects in frequency case-crossover studies. Am J Epidemiol 2004;159:596-602. 258. Etminan M, Gill S, FitzGerald M, Samii A. Challenges and opportunities for pharmacoepidemiology in drug-therapy decision making. J Clin Pharmacol 2006;46:6-9. 259. Etminan M, Samii A. Pharmacoepidemiology I: A review of pharmacoepidemiologic study designs. Pharmacother 2004;24:964-9. 260. Klungel OH, Martens EP, Psaty BM, et al. Methods to assess intended effects of drug treatment in observational studies are reviewed. J Clin Epidemiol 2004;57:1223-31. 261. Luo X, Sorock GS. Analysis of recurrent event data under the case-crossover design with applications to elderly falls. Stat Med 2008;27:2890-901. 262. Orriols L, Salmi LR, Philip P, et al. The impact of medicinal drugs on traffic safety: a systematic review of epidemiological studies. Pharmacoepidemiol Drug Saf 2009;18:647-58.

131
263. Singh S, Graff LA, Bernstein CN. Do NSAIDs, antibiotics, infections, or stress trigger flares in IBD? Am J Gastroenterol 2009;104:1298-313; quiz 314. 264. Smeeth L, Donnan PT, Cook DG. The use of primary care databases: Case-control and case-only designs. Fam Pract 2006;23:597-604. 265. Wu LT, Anthony JC. The use of the case-crossover design in studying illicit drug use. Subst Use Misuse 2000;35:1035-50+128-131. 266. Aberra FN, Brensinger CM, Bilker WB, Lichtenstein GR, Lewis JD. Antibiotic use and the risk of flare of inflammatory bowel disease. Clin Gastroenterol Hepatol 2005;3:459-65. 267. Azoulay L, Blais L, Koren G, LeLorier J, Berard A. Isotretinoin and the risk of depression in patients with acne vulgaris: A case-crossover study. J Clin Psychiatry 2008;69:526-32. 268. Berard A, Azoulay L, Nakhai-Pour HR, Moussally K. Isotretinoin and the risk of cardiovascular, cerebrovascular and thromboembolic disorders. Dermatol 2011;223:45-51. 269. Berry SD, Mittleman MA, Zhang Y, et al. New loop diuretic prescriptions may be an acute risk factor for falls in the nursing home. Pharmacoepidemiol Drug Saf 2012;21:560-3. 270. Berry SD, Zhang Y, Lipsitz LA, Mittleman MA, Solomon DH, Kiel DP. Antidepressant prescriptions: an acute window for falls in the nursing home. J Gerontol 2011;66:1124-30. 271. Biskupiak JE, Brixner DI, Howard K, Oderda GM. Gastrointestinal complications of over-the-counter nonsteroidal antiinflammatory drugs. J Pain Palliat Care Pharmacother 2006;20:7-14. 272. Chang CH, Chen HC, Lin JW, Kuo CW, Shau WY, Lai MS. Risk of hospitalization for upper gastrointestinal adverse events associated with nonsteroidal anti-inflammatory drugs: a nationwide case-crossover study in Taiwan. Pharmacoepidemiol Drug Saf 2011;20:763-71. 273. Chang C-H, Lin J-W, Chen H-C, Kuo C-W, Shau W-Y, Lai M-S. Non-steroidal anti-inflammatory drugs and risk of lower gastrointestinal adverse events: a nationwide study in Taiwan. Gut 2011;60:1372-8. 274. Choi N-K, Chang Y, Jung S-Y, et al. A population-based case-crossover study of polyethylene glycol use and acute renal failure risk in the elderly. World J Gastroenterol 2011;17:651-6. 275. Cohen AD, Bonneh DY, Reuveni H, Vardy DA, Naggan L, Halevy S. Drug exposure and psoriasis vulgaris: Case-control and case-crossover studies. Acta Derm Venereol 2005;85:299-303. 276. Confavreux C, Suissa S, Saddier P, Bourdes V, Vukusic S. Vaccinations and the risk of relapse in multiple sclerosis. N Engl J Med 2001;344:319-26. 277. Corrao G, Zambon A, Faini S, Bagnardi V, Leoni O, Suissa S. Short-acting inhaled beta-2-agonists increased the mortality from chronic obstructive pulmonary disease in observational designs. J Clin Epidemiol 2005;58:92-7. 278. Dall M, Schaffalitzky de Muckadell OB, Lassen AT, Hansen JM, Hallas J. An association between selective serotonin reuptake inhibitor use and serious upper gastrointestinal bleeding. Clin Gastroenterol Hepatol 2009;7:1314-21. 279. Duran-Barragan S, McGwin G, Jr., Vila LM, Reveille JD, Alarcon GS, cohort LamU. Angiotensin-converting enzyme inhibitors delay the occurrence of renal involvement and are associated with a decreased risk of disease activity in patients with systemic lupus erythematosus--results from LUMINA (LIX): a multiethnic US cohort. Rheumatology (Oxford) 2008;47:1093-6. 280. Finkelstein Y, Schechter T, Garcia-Bournissen F, et al. Is morphine exposure associated with acute chest syndrome in children with vaso-occlusive crisis of sickle cell disease? A 6-year case-crossover study. Clin Ther 2007;29:2738-43.

132
281. Fosbol EL, Folke F, Jacobsen S, et al. Cause-specific cardiovascular risk associated with nonsteroidal antiinflammatory drugs among healthy individuals. Circulation 2010;3:395-405. 282. France EK, Glanz JM, Xu S, et al. Safety of the trivalent inactivated influenza vaccine among children - A population-based study. Arch Pediatr Adolesc Med 2004;158:1031-6. 283. Gagne JJ, Avorn J, Shrank WH, Schneeweiss S. Refilling and switching of antiepileptic drugs and seizure-related events. Clin Pharmacol Ther 2010;88:347-53. 284. Garrison MM, Lozano P, Christakis DA. Controller medication use and sleep problems in pediatric asthma: A longitudinal case-crossover analysis. Arch Pediatr Adolesc Med 2011;165:826-30. 285. Gibson JE, Hubbard RB, Smith CJP, Tata LJ, Britton JR, Fogarty AW. Use of self-controlled analytical techniques to assess the association between use of prescription medications and the risk of motor vehicle crashes. Am J Epidemiol 2009;169:761-8. 286. Gislason GH, Rasmussen JN, Abildstrom SZ, et al. Increased mortality and cardiovascular morbidity associated with use of nonsteroidal anti-inflammatory drugs in chronic heart failure. Arch Int Med 2009;169:141-9. 287. Grimaldi-Bensouda L, Abenhaim L, Michaud L, et al. Clinical features and risk factors for upper gastrointestinal bleeding in children: A case-crossover study. Eur J Clin Pharmacol 2010;66:831-7. 288. Hallas J, Bjerrum L, Stovring H, Andersen M. Use of a prescribed ephedrine/caffeine combination and the risk of serious cardiovascular events: A registry-based case-crossover study. Am J Epidemiol 2008;168:966-73. 289. Hambidge SJ, Glanz JM, France EK, et al. Safety of trivalent inactivated influenza vaccine in children 6 to 23 months old. Jama 2006;296:1990-7. 290. Handoko KB, Zwart-van Rijkom JEF, Hermens WAJJ, Souverein PC, Egberts TCG. Changes in medication associated with epilepsy-related hospitalisation: A case-crossover study. Pharmacoepidemiol Drug Saf 2007;16:189-96. 291. Hauser T, Mahr A, Metzler C, et al. The leucotriene receptor antagonist montelukast and the risk of Churg-Strauss syndrome: a case-crossover study. Thorax 2008;63:677-82. 292. Hebert C, Delaney JAC, Hemmelgarn B, Levesque LE, Suissa S. Benzodiazepines and elderly drivers: A comparison of pharmacoepidemiological study designs. Pharmacoepidemiol Drug Saf 2007;16:845-9. 293. Hernandez-Diaz S, Hernan MA, Meyer K, Werler MM, Mitchell AA. Case-crossover and case-time-control designs in birth defects epidemiology. Am J Epidemiol 2003;158:385-91. 294. Hunter DJ, York M, Chaisson CE, Woods R, Niu J, Zhang Y. Recent diuretic use and the risk of recurrent gout attacks: The online case-crossover gout study. J Rheumatol 2006;33:1341-5. 295. Jung SY, Choi NK, Kim JY, et al. Short-acting nifedipine and risk of stroke in elderly hypertensive patients. Neurol 2011;77:1229-34. 296. Ki M, Park T, Yi SG, Oh JK, Choi BY. Risk analysis of aseptic meningitis after measles-mumps-rubella vaccination in Korean children by using a case-crossover design. Am J Epidemiol 2003;157:158-65. 297. Kilpatrick RD, Danese MD, Belozeroff V, Smirnakis K, Goodman WG, Rothman KJ. The association of vitamin D use with hypercalcemia and hyperphosphatemia in hemodialysis patients: a case-crossover study. Pharmacoepidemiol Drug Saf 2011;20:914-21. 298. Lee C-H, Wang J-D, Chen P-C. Case-crossover study of hospitalization for acute hepatitis in Chinese herb users. J Gastroenterol Hepatol 2008;23:1549-55. 299. Lee C-H, Wang J-D, Chen P-C. Increased risk of hospitalization for acute hepatitis in patients with previous exposure to NSAIDs. Pharmacoepidemiol Drug Saf 2010;19:708-14.

133
300. Lee C-H, Wang J-D, Chen P-C. Risk of liver injury associated with Chinese herbal products containing radix bupleuri in 639,779 patients with hepatitis B virus infection. PLoS One 2011;6:e16064. 301. Lee YC, Chang CH, Lin JW, Chen HC, Lin MS, Lai MS. Non-steroidal anti-inflammatory drugs use and risk of upper gastrointestinal adverse events in cirrhotic patients. Liver Int 2012;32:859-66. 302. Martins IS, Pellegrino FLPC, Freitas AdA, et al. Case-crossover study of Burkholderia cepacia complex bloodstream infection associated with contaminated intravenous bromopride. Infect Control Hosp Epidemiol 2010;31:516-21. 303. Meuleners LB, Duke J, Lee AH, Palamara P, Hildebrand J, Ng JQ. Psychoactive medications and crash involvement requiring hospitalization for older drivers: A population-based study. J Am Geriatr Soc 2011;59:1575-80. 304. Mittleman MA, Maclure M, Glasser DB. Evaluation of acute risk for myocardial infarction in men treated with sildenafil citrate. The American journal of cardiology 2005;96:443-6. 305. Neutel CI, Perry S, Maxwell C. Medication use and risk of falls. Pharmacoepidemiol Drug Saf 2002;11:97-104. 306. Olesen JB, Hansen PR, Erdal J, et al. Antiepileptic drugs and risk of suicide: a nationwide study. Pharmacoepidemiol Drug Saf 2010;19:518-24. 307. Orriols L, Delorme B, Gadegbeku B, et al. Prescription medicines and the risk of road traffic crashes: A French registry-based study. PLoS Med 2010;7. 308. Orriols L, Philip P, Moore N, et al. Benzodiazepine-Like Hypnotics and the Associated Risk of Road Traffic Accidents. Clin Pharmacol Ther 2011;89:595-601. 309. Park T, Ki M, Yi SG. Statistical analysis of MMR vaccine adverse events on aseptic meningitis using the case cross-over design. Stat Med 2004;23:1871-83. 310. Ray WA, Fought RL, Decker MD. Psychoactive-drugs and the risk of injurious motor-vehicle crashes in elderly drivers. Am J Epidemiol 1992;136:873-83. 311. Rifkin SB, Smith MR, Brotman RM, Gindi RM, Erbelding EJ. Hormonal contraception and risk of bacterial vaginosis diagnosis in an observational study of women attending STD clinics in Baltimore, MD. Contracept 2009;80:63-7. 312. Risselada R, Straatman H, van Kooten F, et al. Platelet aggregation inhibitors, vitamin K antagonists and risk of subarachnoid hemorrhage. J Thromb Haemost 2011;9:517-23. 313. Rogers MAM, Levine DA, Blumberg N, Flanders SA, Chopra V, Langa KM. Triggers of hospitalization for venous thromboembolism. Circ 2012;125:2092-9. 314. Schelleman H, Bilker WB, Brensinger CM, Han X, Kimmel SE, Hennessy S. Warfarin with fluoroquinolones, sulfonamides, or azole antifungals: interactions and the risk of hospitalization for gastrointestinal bleeding. Clin Pharmacol Ther 2008;84:581-8. 315. Schelleman H, Bilker WB, Brensinger CM, Wan F, Hennessy S. Anti-infectives and the risk of severe hypoglycemia in users of glipizide or glyburide. Clin Pharmacol Ther 2010;88:214-22. 316. Seitz DP, Campbell RJ, Bell CM, et al. Short-term exposure to antidepressant drugs and risk of acute angle-closure glaucoma among older adults. J Clin Psychopharmacol 2012;32:403-7. 317. Shau WY, Chen HC, Chen ST, et al. Risk of new acute myocardial infarction hospitalization associated with use of oral and parenteral non-steroidal anti-inflammation drugs (NSAIDs): A case-crossover study of Taiwan's National Health Insurance claims database and review of current evidence. BMC Cardiovasc Disord 2012;12. 318. Shuto H, Imakyure O, Matsumoto J, et al. Medication use as a risk factor for inpatient falls in an acute care hospital: A case-crossover study. Br J Clin Pharmacol 2010;69:535-42.

134
319. Sode J ON, Hallas J, Lassen A. Use of fluroquinolone and risk of Achilles tendon rupture: a population-based cohort study. Eur J Clin Pharmacol 2007;63:499-503. 320. Sturkenboom MCJM, Middelbeek A, De Jong Van den Berg LTW, Van den Berg PB, Stricker Ch BH, Wesseling H. Vulvo-vaginal candidiasis associated with acitretin. J Clin Epidemiol 1995;48:991-7. 321. Teixeira L, Mouthon L, Mahr A, et al. Mortality and risk factors of scleroderma renal crisis: a French retrospective study of 50 patients. Ann Rheum Dis 2008;67:110-6. 322. Toh S, Mitchell AA, Anderka M, de Jong-van den Berg LTW, Hernandez-Diaz S, Natl Birth Defects Prevention S. Antibiotics and oral contraceptive failure - a case-crossover study. Contracept 2011;83:418-25. 323. Velthove KJ, Leufkens HGM, Schweizer RC, Van Solinge WW, Souverein PC. Medication changes prior to hospitalization for obstructive lung disease: A case-crossover study. Ann Pharmacother 2010;44:267-73. 324. Weiss Smith S, Sato M, Gore SD, et al. Erythropoiesis-stimulating agents are not associated with increased risk of thrombosis in patients with myelodysplastic syndromes. Haematol 2012;97:15-20. 325. Wu CS, Wang SC, Cheng YC, Gau SSF. Association of cerebrovascular events with antidepressant use: A case-crossover study. Am J Psychiatr 2011;168:511-21. 326. Yang Y-H, Lai J-N, Lee C-H, Wang J-D, Chen P-C. Increased risk of hospitalization related to motor vehicle accidents among people taking zolpidem: a case-crossover study. J Epidemiol 2011;21:37-43. 327. Zambon A, Polo Friz H, Contiero P, Corrao G. Effect of macrolide and fluoroquinolone antibacterials on the risk of ventricular arrhythmia and cardiac arrest: an observational study in Italy using case-control, case-crossover and case-time-control designs. Drug Saf 2009;32:159-67. 328. Selby Jv BACFL. The patient-centered outcomes research institute (PCORI) national priorities for research and initial research agenda. Jama 2012;307:1583-4. 329. Suissa S, Henry D. The establishment of the Canadian network for observational drug effect studies (cNODES). Pharmacoepidemiol Drug Saf 2011;20:S168. 330. Glynn RJ, Schneeweiss S, Sturmer T. Indications for propensity scores and review of their use in pharmacoepidemiology. Basic Clin Pharmacol Toxicol 2006;98:253-9. 331. Schneeweiss S. Developments in post-marketing comparative effectiveness research. Clin Pharmacol Ther 2011;82:143-56. 332. A brief history of comparative effectiveness research and evidence-based medicine. Report. Washington DC: National Pharmaceutical Council; 2011. 333. Stürmer T, Joshi M, Glynn RJ, Avorn J, Rothman KJ, Schneeweiss S. A review of the application of propensity score methods yielded increasing use, advantages in specific settings, but not substantially different estimates compared with conventional multivariable methods. J Clin Epidemiol 2006;59:437.e1-.e24. 334. Paterson JM, Laupacis A, Bassett K, Anderson GM, Collaborative ftB-OPfD-M, Institute for Clinical Evaluative Sciences in Toronto O. Using Pharmacoepidemiology To Inform Drug Coverage Policy: Initial Lessons From A Two-Province Collaborative. Health Aff 2006;25:1436-43.
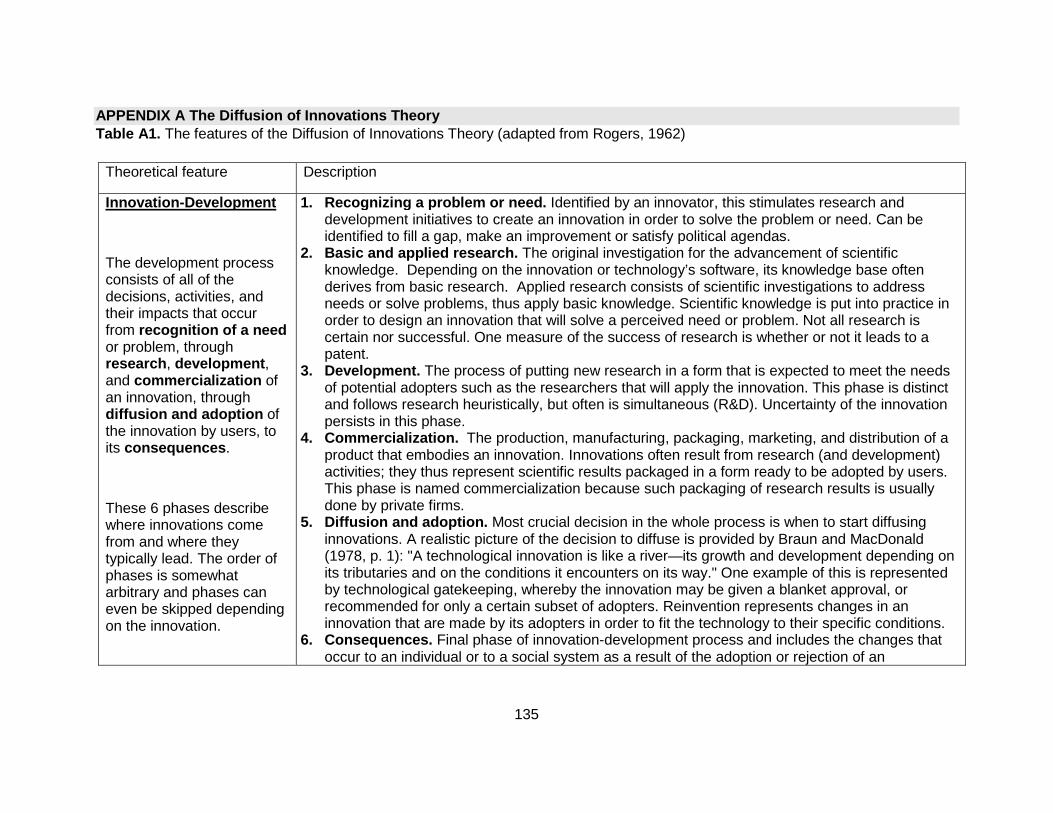
135
APPENDIX A The Diffusion of Innovations Theory Table A1. The features of the Diffusion of Innovations Theory (adapted from Rogers, 1962)
Theoretical feature Description
Innovation -Development
The development process consists of all of the decisions, activities, and their impacts that occur from recognition of a need or problem, through research , development , and commercialization of an innovation, through diffusion and adoption of the innovation by users, to its consequences .
These 6 phases describe where innovations come from and where they typically lead. The order of phases is somewhat arbitrary and phases can even be skipped depending on the innovation.
1. Recognizing a problem or need. Identified by an innovator, this stimulates research and development initiatives to create an innovation in order to solve the problem or need. Can be identified to fill a gap, make an improvement or satisfy political agendas.
2. Basic and applied research. The original investigation for the advancement of scientific knowledge. Depending on the innovation or technology’s software, its knowledge base often derives from basic research. Applied research consists of scientific investigations to address needs or solve problems, thus apply basic knowledge. Scientific knowledge is put into practice in order to design an innovation that will solve a perceived need or problem. Not all research is certain nor successful. One measure of the success of research is whether or not it leads to a patent.
3. Development. The process of putting new research in a form that is expected to meet the needs of potential adopters such as the researchers that will apply the innovation. This phase is distinct and follows research heuristically, but often is simultaneous (R&D). Uncertainty of the innovation persists in this phase.
4. Commercialization. The production, manufacturing, packaging, marketing, and distribution of a product that embodies an innovation. Innovations often result from research (and development) activities; they thus represent scientific results packaged in a form ready to be adopted by users. This phase is named commercialization because such packaging of research results is usually done by private firms.
5. Diffusion and adoption. Most crucial decision in the whole process is when to start diffusing innovations. A realistic picture of the decision to diffuse is provided by Braun and MacDonald (1978, p. 1): "A technological innovation is like a river—its growth and development depending on its tributaries and on the conditions it encounters on its way." One example of this is represented by technological gatekeeping, whereby the innovation may be given a blanket approval, or recommended for only a certain subset of adopters. Reinvention represents changes in an innovation that are made by its adopters in order to fit the technology to their specific conditions.
6. Consequences. Final phase of innovation-development process and includes the changes that occur to an individual or to a social system as a result of the adoption or rejection of an
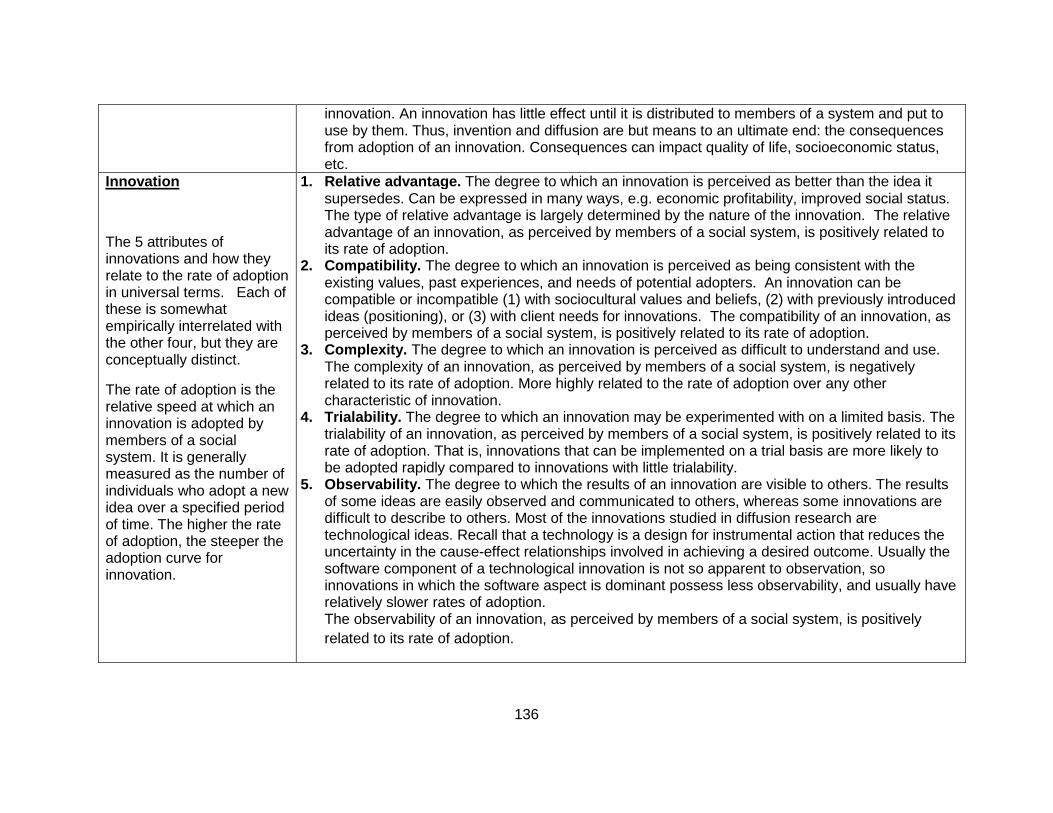
136
innovation. An innovation has little effect until it is distributed to members of a system and put to use by them. Thus, invention and diffusion are but means to an ultimate end: the consequences from adoption of an innovation. Consequences can impact quality of life, socioeconomic status, etc.
Innovation
The 5 attributes of innovations and how they relate to the rate of adoption in universal terms. Each of these is somewhat empirically interrelated with the other four, but they are conceptually distinct.
The rate of adoption is the relative speed at which an innovation is adopted by members of a social system. It is generally measured as the number of individuals who adopt a new idea over a specified period of time. The higher the rate of adoption, the steeper the adoption curve for innovation.
1. Relative advantage . The degree to which an innovation is perceived as better than the idea it supersedes. Can be expressed in many ways, e.g. economic profitability, improved social status. The type of relative advantage is largely determined by the nature of the innovation. The relative advantage of an innovation, as perceived by members of a social system, is positively related to its rate of adoption.
2. Compatibility. The degree to which an innovation is perceived as being consistent with the existing values, past experiences, and needs of potential adopters. An innovation can be compatible or incompatible (1) with sociocultural values and beliefs, (2) with previously introduced ideas (positioning), or (3) with client needs for innovations. The compatibility of an innovation, as perceived by members of a social system, is positively related to its rate of adoption.
3. Complexity. The degree to which an innovation is perceived as difficult to understand and use. The complexity of an innovation, as perceived by members of a social system, is negatively related to its rate of adoption. More highly related to the rate of adoption over any other characteristic of innovation.
4. Trialability. The degree to which an innovation may be experimented with on a limited basis. The trialability of an innovation, as perceived by members of a social system, is positively related to its rate of adoption. That is, innovations that can be implemented on a trial basis are more likely to be adopted rapidly compared to innovations with little trialability.
5. Observability. The degree to which the results of an innovation are visible to others. The results of some ideas are easily observed and communicated to others, whereas some innovations are difficult to describe to others. Most of the innovations studied in diffusion research are technological ideas. Recall that a technology is a design for instrumental action that reduces the uncertainty in the cause-effect relationships involved in achieving a desired outcome. Usually the software component of a technological innovation is not so apparent to observation, so innovations in which the software aspect is dominant possess less observability, and usually have relatively slower rates of adoption. The observability of an innovation, as perceived by members of a social system, is positively related to its rate of adoption.
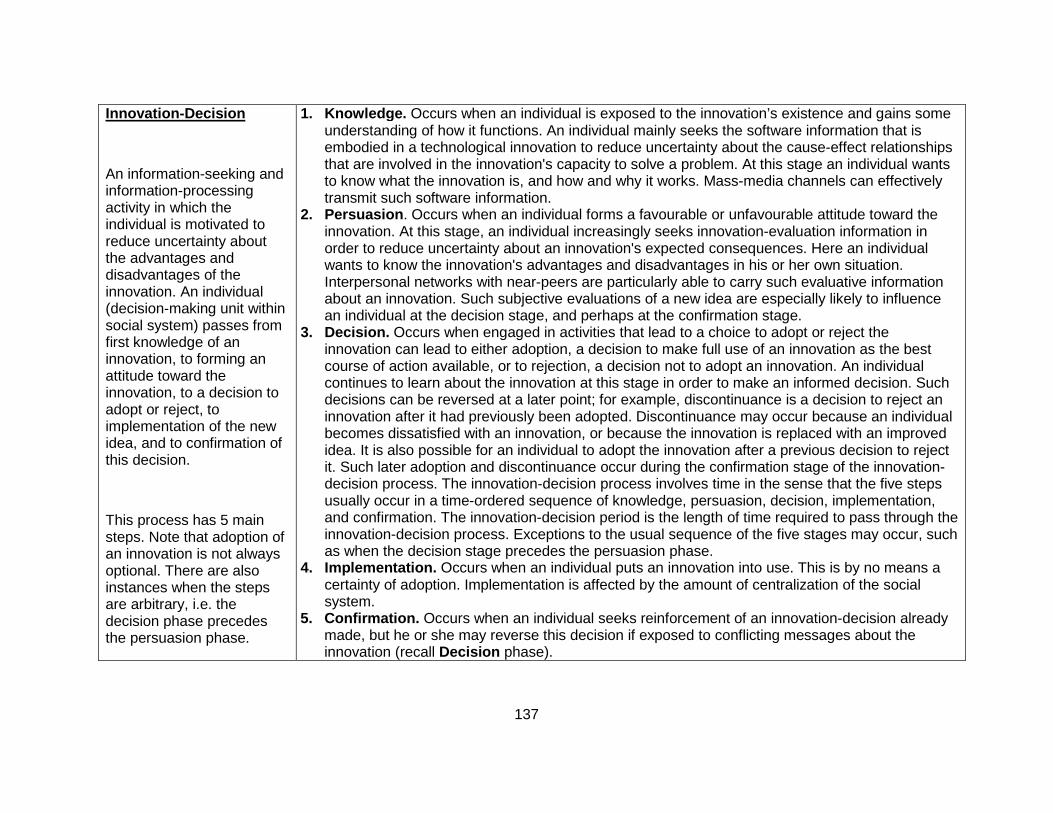
137
Innovation -Decision
An information-seeking and information-processing activity in which the individual is motivated to reduce uncertainty about the advantages and disadvantages of the innovation. An individual (decision-making unit within social system) passes from first knowledge of an innovation, to forming an attitude toward the innovation, to a decision to adopt or reject, to implementation of the new idea, and to confirmation of this decision.
This process has 5 main steps. Note that adoption of an innovation is not always optional. There are also instances when the steps are arbitrary, i.e. the decision phase precedes the persuasion phase.
1. Knowledge. Occurs when an individual is exposed to the innovation’s existence and gains some understanding of how it functions. An individual mainly seeks the software information that is embodied in a technological innovation to reduce uncertainty about the cause-effect relationships that are involved in the innovation's capacity to solve a problem. At this stage an individual wants to know what the innovation is, and how and why it works. Mass-media channels can effectively transmit such software information.
2. Persuasion . Occurs when an individual forms a favourable or unfavourable attitude toward the innovation. At this stage, an individual increasingly seeks innovation-evaluation information in order to reduce uncertainty about an innovation's expected consequences. Here an individual wants to know the innovation's advantages and disadvantages in his or her own situation. Interpersonal networks with near-peers are particularly able to carry such evaluative information about an innovation. Such subjective evaluations of a new idea are especially likely to influence an individual at the decision stage, and perhaps at the confirmation stage.
3. Decision. Occurs when engaged in activities that lead to a choice to adopt or reject the innovation can lead to either adoption, a decision to make full use of an innovation as the best course of action available, or to rejection, a decision not to adopt an innovation. An individual continues to learn about the innovation at this stage in order to make an informed decision. Such decisions can be reversed at a later point; for example, discontinuance is a decision to reject an innovation after it had previously been adopted. Discontinuance may occur because an individual becomes dissatisfied with an innovation, or because the innovation is replaced with an improved idea. It is also possible for an individual to adopt the innovation after a previous decision to reject it. Such later adoption and discontinuance occur during the confirmation stage of the innovation-decision process. The innovation-decision process involves time in the sense that the five steps usually occur in a time-ordered sequence of knowledge, persuasion, decision, implementation, and confirmation. The innovation-decision period is the length of time required to pass through the innovation-decision process. Exceptions to the usual sequence of the five stages may occur, such as when the decision stage precedes the persuasion phase.
4. Implementation. Occurs when an individual puts an innovation into use. This is by no means a certainty of adoption. Implementation is affected by the amount of centralization of the social system.
5. Confirmation. Occurs when an individual seeks reinforcement of an innovation-decision already made, but he or she may reverse this decision if exposed to conflicting messages about the innovation (recall Decision phase).

138
Innovation -Diffusion
The overarching theory. Comprised of 4 elements, each element identifiable in every diffusion research study, and in every diffusion campaign or program.
Diffusion is the process by which an innovation is communicated through certain channels over time among the members of a social system .
1. Innovation . An idea, practice, object or technology (synonym) that is perceived as new by an individual or another unit of adoption. Technologies may have one or both components: 1) hardware (that materializes the technology) and 2) software (the information base for the tool). The software information embodied in a technology serves to reduce uncertainty concerned with the cause-effect relationships that are involved in achieving a desired outcome of an innovation i.e. diffusion or uptake.
2. Social system . Individuals, organizations, informal groups, (some unit of “adoption”) engaged in joint problem solving with a common goal where diffusion occurs. Units within social system can adopt (5 adopter categories: innovators, early adopters, early majority, late majority and laggards) or reject innovation.
3. Time . Time for diffusion of innovation depends on: (1) the innovation-decision process, (i.e. defines the type of adopter e.g. early versus laggard); (2) innovativeness; and (3) an innovation's rate of adoption (recall).
4. Communications channels . Different types with different levels of effectiveness depending on adopter or not and adopter characteristic. Can be interpersonal (communicating with your neighbours) or mass media. Can also be passive or active. Passive communication channels provide information to an individual about an innovation's existence, how it works, where it can be obtained, and how to adopt it. This information is applicable to a mass audience, and so the mass media can be effective in disseminating it. Active communication channels provide information to an individual that motivates him or her to adopt. Active channels carry messages that are tailored closely to the particular needs of an individual. Active channels are often interpersonal.

APPENDIX B Case-crossover study design– systematic review
Systematic Review of the Case-crossover Study Desig n in Pharmacoepidemiology
Giulia P Consiglio,1 Andrea M Burden,1 Malcolm Maclure,2 Lisa McCarthy,1,3 Suzanne M Cadarette1
1 Leslie Dan Faculty of Pharmacy, University of Toronto, Toronto ON, Canada
2 Department of Anesthesiology, Pharmacology and Therapeutics, University of British Columbia, Vancouver, BC, Canada
3 Women’s College Research Institute, Toronto ON, Canada
Correspondence to: Suzanne M. Cadarette, Leslie Dan Faculty of Pharmacy, University of Toronto, 144 College Street, Toronto, ON M5S 3M2 Canada. Tel: 416-978-2993, Fax: 416-978-8511, E-mail: [email protected]
Conflict of Interest: None related to this work.
Sponsors: This research was supported by a research grant to Dr. Cadarette from the Ontario Ministry of Research and Innovation (Early Researcher Award, ER09-06-043). Dr. Cadarette is supported by a Canadian Institutes of Health Research New Investigator Award in Aging and Osteoporosis (MSH-95364).
Prior Presentations: This research was presented at the Canadian Association for Population Therapeutics Annual Meeting, May 2012.
Key Words: case-crossover, case-only, pharmacoepidemiology, review literature as topic
Running Head: Case-crossover studies in pharmacoepidemiology
Abstract word count: 243
Main Text Word Count: 1660
No. Figures: 3
No. Tables: 1
Appendix: 1 Table

140
Key Points
• The case-crossover study design is a case-only design that is ideal when exposure effects
are transient and the outcome’s onset is abrupt and clearly defined.
• Use of the case-crossover study design in pharmacoepidemiology has increased rapidly in
the last decade. The increase in application may be related to broader availability of
validated healthcare utilization data, and an increased global investment in drug safety
research.
• The majority of case-crossover studies met methodological recommendations for drug
exposure, yet we recommend that future applications justify the biological plausibility of
exposure windows and report raw discordant pairs information.
• Development of a formal set of methodological and reporting standards for the case-
crossover design in pharmacoepidemiologic research may help to apply, critically appraise
and interpret case-crossover research.
ABSTRACT
Purpose: To systematically identify and review articles that use the case-crossover study
design in the area of pharmacoepidemiology, and compare empirical applications against
methodological recommendations.
Methods: A systematic search of MEDLINE®, EMBASE® and Web of Science® was
completed to identify all English language articles that applied the case-crossover study design
in the area of pharmacoepidemiology. The number of reviews, methodological contributions and
empirical pharmacoepidemiologic applications were summarized by publication year. Empirical
applications were retrieved and methodological details (outcome, exposure, exposure windows,
sensitivity analysis, statistical reporting) were tabulated and compared to methodological

141
recommendations based on exposure characteristics, exposure windows, and discordant pairs
data display.
Results: Of 836 unique articles identified, 99 pharmacoepidemiologic studies were eligible: 20
methodological contributions, 9 review papers, and 70 empirical applications. Only three
empirical applications in the area of pharmacoepidemiology were published between 1992 and
2000. Since 2000, the number of empirical pharmacoepidemiologic applications published
(n=67) has increased over time to a high of 15 in 2011. The design was mainly applied to
examine drug safety (96%), and most applications investigated: psychotropic (23%) and
analgesic (19%) exposure drug classes; and considered hospitalization (23%) and cardio-
/cerebrovascular (17%) events. Only 27% of applications displayed sufficient data to enable
readers to confirm odds ratios presented.
Conclusions: Use of the case-crossover design in pharmacoepidemiology has increased
rapidly in the last decade. As the application of the case-crossover design continues to
increase, it is important to develop standards of practice, especially for display of data.
INTRODUCTION
Two main study designs dominate when identifying risk factors for disease: the cohort study,
and case-control study.14,15,20 Self-controlled, case-only designs are increasingly recognized as
complementary and in some cases, advantageous over cohort and case-control
designs.5,7,14,15,20,24,240 In particular, case-only designs are able to control for time-invariant
factors not typically recorded in healthcare databases, such as long-term frailty, stable disease
severity, regular over the counter drug and supplement use, physical activity, diet, smoking, and
alcohol consumption. The case-crossover study design is a case-only design that is ideal to
control for time-invariant confounding when the exposure effects are transient and the

142
outcome’s onset is abrupt and clearly defined.5,6,24 This design compares exposure status
immediately before the outcome with exposure in designated control period(s) earlier in time.
We sought to systematically review the use of the case-crossover design in
pharmacoepidemiology and examine how applied case-crossover studies align with current
methodological recommendations.5-7,24
METHODS
To identify all English language articles that used the case-crossover design in
pharmacoepidemiologic studies, we searched MEDLINE® and EMBASE® databases from
inception to July 2012 with keyword terms: ‘case-crossover’, OR ‘case crossover’, OR ‘case
cross-over’, NOT ‘randomized controlled trial’, NOT ‘RCT’. Abstracts with the words ‘case-
crossover study’ were excluded if they were prospective studies of disease prognosis among a
cohort of ‘cases’ who cross between treatments. We then used Web of Science® to perform a
citation search to identify papers that referenced the case-crossover study design seminal
paper.5 A citation search can be important to identify early methodological applications since
researchers may be slow to adopt the new terminology, particularly when there is no MeSH
term.236 Case-crossover review papers, methodological contributions and empirical applications
in the area of pharmacoepidemiology were eligible. Studies investigating drug adherence and
not drug effects were excluded from our review because they examine reasons for returning to
therapy after a gap, rather than a biological effect of therapy. Two authors (GPC and AMB)
searched and reviewed all abstracts and full-text articles as necessary to exclude articles that
did not meet eligibility criteria. Discrepancies were resolved by agreement.
The number of eligible publications was plotted by calendar year and type: review paper,
methodological contribution or empirical application. We then focused exclusively on the
empirical applications and tabulated: author, year, data source, outcome, exposure, exposure

143
windows, washout periods, sensitivity analysis, and whether or not sufficient data display
(discordant pair information) was provided to replicate odds ratio calculations. One author
(GPC) abstracted all data and a second author (AMB) verified all abstracted data. We used
these data to identify whether or not each empirical application met current methodological
standards5-7,245-7,245-7,245-7,245-7,235-7,236-8,246-8,246,7,24,2386,7,24,238,4-6, 8 1) exposure is one-time or short-
term with good measurement of start and stop, and minimal exposure time trend; 2) biologically
plausible exposure-outcome windows; and 3) discordant pairs data display. An important
assumption of the case-crossover design is that transient exposures have stable prevalence
over time, thus there is equal opportunity to be exposed and unexposed. If time trends in the
exposure exist the case-crossover design will result in biased estimates.241 Biological plausibility
of exposures and exposure windows were assessed using a three-step approach. First we
consulted Micromedex®, a database containing drug indication, dosage, interaction and adverse
events information; to identify the best published evidence that supports the exposure-outcome
associations investigated. Next, two pharmacists (co-author LM and MT listed in the
acknowledgements) independently commented on the plausibility of the exposure-outcome
associations based on their clinical experience. Finally, appropriateness of exposure windows
(hazard and control) and the use of bi-directional controls were assessed. Applications that
reported discordant pairs (reproducible odds ratios) were tabulated (yes/no).
RESULTS
Of 836 unique articles identified, 99 pharmacoepidemiologic studies were eligible: 20
methodological contributions,5,7,27,49,240,242-257 9 review papers,6,258-265 and 70 empirical
applications,107,151,165,169,190,211,218,222,266-327 Figure 1 . A Venn diagram was used to illustrate the
number of unique contributions to the systematic review and overlap between search strategies.
Of the 70 pharmacoepidemiologic empirical applications, 47% were identified by all 3 searches,

144
36% were identified in both MEDLINE® and EMBASE® but not the Web of Science® citation
search, and 10% were identified uniquely from the Web of Science® seminal paper citation
search, Figure 2 . During the first decade after the case-crossover design was introduced in
1991, there were three pharmacoepidemiologic applications, five methodological contributions,
and one review, Figure 3 . In the next decade, the frequency of papers grew to a high of fifteen
empirical applications in 2011. Ninety-six percent of pharmacoepidemiologic applications
studied drug safety, and 76% used linked healthcare utilization data. Questionnaires (10%) and
medical charts (7%) were the most common alternate data sources.
Exposure Characteristics and Outcomes
All exposures studied were appropriate for use in case-crossover study design (one-time or
short-term/transient exposure). Although psychotropic and respiratory drugs may be used
chronically, they may be appropriate exposures for application in the case-crossover design
based on indication and duration of use. The most commonly studied drug classes were
psychotropic (24%), analgesic (17%), anti-biotic/-infective (10%), cardio-/cerebrovascular (7%),
respiratory (7%), and vaccine (7%), Table 1 . The most commonly studied outcomes were
hospitalization (23%), cardio-/cerebrovascular disease (21%), motor vehicle collision (9%),
gastrointestinal disease (9%), and falls (6%). Of the hospitalizations, 38% were due to cardio-
/cerebrovascular disease, Appendix Table 2 (available for download online) .
Biologically Plausible Exposure Windows, Sensitivity Analysis and Washout
All exposure-outcome associations were biologically plausible, Table 1 . Depending on the
exposure-outcome association, pharmacoepidemiologic applications utilized a range of
exposure window (hazard and control) lengths. Hazard periods ranged from 6 hours,78 to 5
months,36, 38 Appendix Table 2 . The most commonly applied hazard period lengths were 1-
month (28 or 30 days; 31%) or 1-day (13%), and most studies (64%) utilized hazard periods

145
less than or equal to 1-month. All defined exposure windows were similarly biologically plausible
based on Micromedex® and pharmacist review. Nine percent of applications utilized biologically
plausible hazard and control periods that were defined, yet unmatched in length. Seventy-four
percent of studies used multiple control periods in sensitivity analysis. Multiple hazard periods
were also applied in sensitivity analysis, however this was less common (30%). Four studies
used bi-directional controls,282,289,298,299 and two of these applications were biologically
plausible.282,289 Fifty-seven percent of studies separated hazard and control periods with a
washout period.
Data Display
All studies presented odds ratio estimates with confidence limits for the primary analysis.
However, transparent information on discordant pairs was provided for the primary analysis in
only 31% of studies, with discordant pairs presented in text (1%),268 or table format (30%),
Table 1 . Of studies that applied multiple exposure windows, 10% presented discordant pairs
information for each sensitivity analysis. Only 56% of sensitivity analyses reported odds ratios,
other papers simply stated results were similar in sensitivity analysis in text.
DISCUSSION
We attribute the rapid increase in empirical case-crossover applications since 2001 to the
increased availability of healthcare utilization data,22,104 and the increased investment in post-
marketing and pharmacoepidemiologic research.328-332 Indeed, 76% of case-crossover
applications examined healthcare utilization data, and other recent reviews report increased
applications of novel methods in the area of pharmacoepidemiology.236,333
According to methodological standards,5-7,24 anti-biotics/-infectives, and vaccines are
appropriate exposures to investigate using the case-crossover study design for their one-time or

146
short-term (transient) utilization patterns. Other exposures, such as psychotropic and respiratory
drugs, may be appropriate depending on indication and duration of use. However, some long
half-life psychotropics may result in prolonged drug effects, and thus may be less suitable to the
case-crossover study design. For example, second generation antipsychotics used chronically
can lead to dyslipidemia with the potential for future complications, including diabetes. Only 17%
of applications utilized the case-crossover design to investigate vaccine or anti-biotic/-infective
exposures as recommended,24 and 42% of applications investigated psychotropic or analgesic
drugs. In addition, analgesic exposures such as NSAIDs may be prolonged due to chronic use,
used for periodic symptom relief, or its start and stop times immeasurable due to high over-the-
counter and long-term utilization patterns.334 Nonetheless, our results identify that the majority of
exposure windows were between 1-day and 1-month in length, indicative of short-term
exposures in spite of the drug being studied, and comparable to methodological
recommendations.
All identified studies included outcomes that were clearly defined and suitable for the
case-crossover design. A clearly defined outcome event is critical when defining hazard window
length, however, the ability to appropriately classify drug exposure often presents a challenge in
the application of the case-crossover design in pharmacoepidemiology. In our review all
exposure-outcome associations and exposure windows were biologically plausible. We
identified four studies (5.7%) that used bi-directional controls. While the ‘bi-directional’ design is
less applicable in pharmacoepidemiology because health outcomes often affect probabilities of
future drug use in diverse ways, we believe 2 of these applications were plausible.189,205 We
recommend exposure windows that are biologically plausible, short-term or transient, with
corresponding sensitivity analysis. In cases when bi-directional sampling is not possible as the
outcome event will affect future exposure, the case-time-control design is preferred.21
147
Only 31% of studies presented raw discordant pairs data to reproduce odds ratios. In
addition, of the studies that included multiple exposure windows, the presentation of risk (odds
ratios) to evaluate sensitivity of window selection was absent nearly half of the time (44%). We
recommend that sensitivity analyses report all odds ratios and discordant pair information to
demonstrate the change in risk across different exposure windows and thus how sensitive
results were to changes in exposure window length for a more comprehensive analysis. In
addition, we recommend that all case-crossover applications report the discordant pairs in their
findings so that the data can be replicated and validated. Although we recognize that word limits
or journal-specific criteria may preclude reporting all data from sensitivity analyses in the main
text, a move towards detailed sensitivity analyses provided in online appendices, or even posted
on the author’s research website may be helpful.
Our systematic review is subject to some limitations. First, we recognize that due to the
lack of standardized terminology to describe the case-crossover study design, we may have
missed some relevant applications. In addition, by limiting our study to pharmacoepidemiologic
applications, we may not have captured the overall trends and reporting of the case-crossover
design. Conversely, by focusing on pharmacoepidemiologic examples, we were able to critically
examine diverse drug exposures and outcomes relevant to drug safety and effectiveness
research using methodological standards, which we believe is a strength of our review. Another
strength includes the cited reference search, which contributed an additional 10% of unique
case-crossover empirical applications.
In conclusion, while the number of case-crossover studies is increasing in
pharmacoepidemiology, there is opportunity for improvement in quality of presentation. The
majority of studies met methodological recommendations for drug exposure, yet we recommend
that future applications justify the biological plausibility of exposure windows and report raw

148
discordant pairs information. While having a clearly defined outcome is currently not standard
practice we believe it is important and necessary when defining hazard periods. In addition,
while the case-crossover study design controls for time-invariant confounding, researchers
should remain mindful of potential exposure time trends, including temporal changes in
prescribing. If future exposure is not dependent on the acute outcome event, and the time
trends could be controlled for using bi-directional sampling. However, if the likelihood for time
trends is high and the outcome event is associated with future exposure, it is recommended
authors explore alternative study designs, including the case-time-control design. The
development of a formal set of methodological and reporting standards for the case-crossover
design in pharmacoepidemiologic research may help to apply, critically appraise and interpret
case-crossover research.
ACKNOWLEDGEMENTS
This research was supported by a research grant to Dr. Cadarette from the Ontario Ministry of
Research and Innovation (Early Researcher Award, ER09-06-043). Dr. Cadarette is supported
by a Canadian Institutes of Health Research New Investigator Award in Aging and Osteoporosis
(MSH-95364). Authors thank William Witteman, BA, MISt for helpful suggestions in completing
systematic literature searches and expertise in medical literature databases. Authors
acknowledge JA Chris Delaney, PhD, University of Florida and Mina Tadrous, PharmD, MS,
University of Toronto, for insightful discussions, and Mina Tadrous for review of biologically
plausibility. This research was presented at the Canadian Association for Population
Therapeutics Annual Meeting in Montreal QC, Canada, May 2012.

149
Table 1 Study characteristics of empirical case-crossover applications in the area of pharmacoepidemiology, N=70.
Study Characteristic n % Primary Outcome Event 33 47.1 Falls 4 5.7 Hospitalization 16 22.9 Motor vehicle collision 6 8.6 Other* 7 10.0 Disease 37 52.9 Cardio- or cerebrovascular 15 21.4 Gastrointestinal 6 8.6 Hepatic or renal 3 4.3 Respiratory 3 4.3 Other* 10 14.3 Primary Exposure Analgesic 12 17.1 Anti-biotic or -infective 7 10.0 Cardiovascular 5 7.1 Psychotropic 17 24.3 Respiratory 5 7.1 Vaccine 5 7.1 Other* 19 27.1 Area of Study Drug safety 67 95.7 Drug effectiveness 3 4.3 Exposure Windows Hazard periods1 ≤1 month 45 64.3 1-day 9 12.9 1-month 22 31.4 >1 month 19 27.1 Variable window lengths 6 8.6 Undefined 1 1.4 Control periods Matched to hazard period 54 77.1 Variable window lengths 6 8.6 Undefined 6 8.6

150
*‘Other’
primary event and disease outcomes are listed along with ‘Other’ exposure drug classes (Appendix Table 1 ) 1Numbers sum to greater than 100% for studies (n=7) that applied 2 or more primary hazard periods 2France et al. apply bi-directional controls with 14-d washout period post-outcome only 3Odds ratios or relative risk ratios reproducible
Bi-directional (matched) 4 5.7 Biological Plausibility Exposure-outcome 70 100 Implausible exposure windows 8 11.4 Bi-directional controls 2 2.9 Washout Period Washout period2 40 57.1 No washout 16 22.9 Undefined 14 20.0 Data Source Linked healthcare utilization data 53 75.7 Questionnaire 7 10.0 Medical chart review 5 7.1 Other 5 7.1 Statistical Analysis 3 Presents discordant pairs in table format 21 30.0 Presents discordant pairs in text 1 1.4 Sensitivity Analysis 52 74.3 Multiple control periods 52 100 Multiple hazard periods 21 40.4 Presents odds ratios 29 55.7 Presents discordant pairs 5 9.6

151
Figure 1. Flow diagram of systematic search results . All searches restricted to humans and English language. The Web of Science® citation search identified all works citing Maclure, 1991. (PE, pharmacoepidemiology)
Figure 2. Venn diagram. Venn diagram demonstrating unique and overlapping pharmacoepidemiologic empirical applications of the case-crossover design identified from MEDLINE®, EMBASE®, and Web of Science® searches, N= 70. A keyword search was performed by using MEDLINE® and EMBASE® databases. A cited reference search (Maclure, 1991) was completed using the Web of Science® citation database.

152
Figure 3 Number of empirical case-crossover applications (solid-black), methodological contributions (solid-white) and review papers (dashed) in the area of pharmacoepidemiology, by publication year.
0
2
4
6
8
10
12
14
16
1819
91
1992
1993
1994
1995
1996
1997
1998
1999
2000
2001
2002
2003
2004
2005
2006
2007
2008
2009
2010
2011
2012
Num
ber
of P
ublic
atio
ns
Year of Publication

153
APPENDIX C Additional design features
Figure C1. Self-controlled case-control: case-cross over study design – additional features . Observation windows are indicated above the study diagram (black), and original terminology is shown below the study diagram (grey). Recall from Chapter 1, the case-crossover study starts with an outcome, and compares exposure status within the same individual in the period immediately before the outcome (hazard period), and one or more period(s) in the past (control period). Bi-directional control periods that occur post-outcome are included to control for exposure time trends. Case-time control and case-case-time controls studies are ideal to control for natural trends in drug use over time when bi-directional controls are infeasible. Case-crossover observation windows can vary in length and number, and in some cases can be separated by a washout period to eliminate drug exposure carry-over effects. The washout period is equal to the maximum induction time of the observation window and can be similarly used in case-time control and case-case-time control study designs.
Figure C2. Self-controlled cohort: self-controlled case-series – additional features. Observation windows are indicated above the study diagram (black), and original terminology is shown below the study diagram (grey). Recall from Chapter 1, the self-controlled case-series starts with an exposure and looks at risk periods (can be pre- or post-exposure) to calculate the incidence of at least one outcome or event within risk periods compared to baseline (control) periods. Pre-exposure risk periods occur before the risk period, and are distinct from the risk and referent windows in self-controlled case-series studies. Multiple risk periods may be used to control for risk of independently recurring outcomes that may change with age.

154
APPENDIX D Distribution of observation window lengt h
Figure D1. Distribution of observation windows. Distribution of observation windows of self-controlled applications in pharmacoepidemiology from the data abstraction for the determination of window lengths to assess whether or not studies followed methodological recommendations on outcome onset.
0
5
10
15
20
25
30
35
40
<1d 1d 2d 3d 4d 5d 6d 7d 8d 9d 10d
12d
14d
15d
20d
21d
22d
23d
24d
28d
30d
31d
35d
38d
42d
43d
45d
57d
mon
ths
>ye
arva
riabl
eun
defin
ed
Num
ber
Observation window length

155
APPENDIX E Data abstraction table
Table E1. Data abstraction. Complete data abstraction from 176 eligible self-controlled application papers.
Primary outcome
Event Disease
Primary exposure
Fal
ls
Hos
pita
lizat
ion
MV
C
Oth
er
Aut
oim
mun
e
CV
/CB
GI
Hep
atic
/ren
al
Res
pira
tory
Oth
er
Description
Method(s) Obs
erva
tion
win
dow
le
ngth
Outcome onset B
i-dire
ctio
nal
cont
rols
Sen
sitiv
ity
anal
yses
Was
hout
Rep
rodu
cibl
e ris
k ra
tio
Data source
Reference
Analgesics
nsNSAIDs x GI complications
(PUBs) CCO 90d NS UD N UD Y admin data
Biskupiak, 2006
NSAIDs
x Stroke (ischemic, hemorrhagic)
CCO 30d immediate N Y Y Y admin data
Chang, 2010 NSAIDs x UGI AE CCO 30d NS N Y N Y admin data Chang, 2011 NSAIDs x Lower GI AE CCO 30d NS N Y Y N admin data Chang, 2011
NSAIDs x
Diarrhea (acute) CCO 1, 3, 6d ≥ 1m N Y Y Y medical
records Etienney, 2003
NSAIDs
x CV death, nonfatal and fatal MI or stroke
CCO 30d NS N Y Y N admin data
Fosbol, 2010
NSAIDS x
Death or 2nd MI CCO 30d NS N Y
Y N
admin data
Gislason, 2006 NSAIDs x MI or HF CCO 30d NS N Y Y N admin data Gislason, 2009
NSAIDs x
UGIB CCO 7d NS N N Y N interview Grimaldi-
Bensouda, 2010
NSAIDs
x (Sub) acute liver necrosis, toxic hepatitis
CCO 28d 5-90d Y Y Y N admin data
Lee CH, 2010 NSAIDs x UGI AE CCO 30d NS N Y N Y admin data Lee YC, 2012 NSAIDs x MI (acute) CCO 30d NS N Y Y Y admin data Shau, 2012 Antibiotics/ anti -infectives Antibiotics x IBD flare CCO 60d NS UD N UD N admin data Aberra, 2005 fluoroquinolones x acute kidney
injury CTC 14d NS N Y N Y admin data
Bird, 2013 antibiotics x breakthrough
pregnancy CCO + CTC
30d NS N Y Y Y admin data Koopmans, 2012
oral antibiotic prescribing
x pregnancy
SCCS 280d NS Y N N N admin data Petersen, 2010
Antibiotics/-infectives x GIB CCO 30d 2-15d N Y UD N admin data Schelleman,

156
Primary outcome
Event Disease
Primary exposure
Fal
ls
Hos
pita
lizat
ion
MV
C
Oth
er
Aut
oim
mun
e
CV
/CB
GI
Hep
atic
/ren
al
Res
pira
tory
Oth
er
Description
Method(s) Obs
erva
tion
win
dow
le
ngth
Outcome onset B
i-dire
ctio
nal
cont
rols
Sen
sitiv
ity
anal
yses
Was
hout
Rep
rodu
cibl
e ris
k ra
tio
Data source
Reference
(add-on) 2008
Anti-infectives x Severe
hypoglycemia CCO 30d 1-10d N Y Y N admin data Schelleman,
2010
Fluoroquinolones x Achilles tendon
rupture CCO 90d NS N N Y Y admin data
Sode, 2007
Antibiotics x
Pregnancy CCO 30d NS N N N Y cohort study
data Toh, 2011
Macrolide antibiotics x Hypotension,
shock, death CCO 7d NS N N Y Y admin data
Wright, 2011 Macrolide and fluoroquinolone antibiotics
x Ventricular arrhythmia or cardiac arrest
CCO + CTC
variable (4 w up to 1y)
NS N Y Y N admin data
Zambon, 2009 Cardiovascular
Antiarrythmic drug x All-cause
mortality CCO 30d NS N Y Y N admin data
Andersen, 2009 Antihypertensive drugs
x Hip fracture
SCCS 45d UI Y Y Y Y admin data Butt, 2012
Antihypertensive drugs
x Falls
SCCS 15, 30, 45d
UI Y* Y Y Y admin data Butt, 2013
ACE inhibitors
x Renal involvement (lupus)
CCO variable (period
between 2 visits)
NS N Y Y N cohort study data Duran-Barragan,
2008 Antihypertensive drugs
x Falls
SCCS 21, 38d
1-21, 22-60d
Y Y N Ya admin data Gribbin, 2011
Nifedipine x
1st Stroke CCO 3, 7,
14d NS N Y Y N admin data
Jung, 2011 ACE and ARB x pneumonia CCO 30d NS N Y Y N admin data Liu CL, 2012 ACE and ARB x pneumonia CCO 30d NS N Y Y N admin data Liu CL, 2013
Statins and fibrates x Myopathy and
myalgia CCO 84d NS N Y Y N admin data
Molokhia, 2005 Platelet aggregration inhibitors and Vit K antagonists
x
1st SAH
CCO + CTC
30d NS N Y N N admin data
Risselada, 2011 Psychotropics BZDs, tricyclic and SSRI antidepressants, other psychoactive drugs
x
MVC
CCO 1d NS N Y Y N admin data
Barbone, 1998

157
Primary outcome
Event Disease
Primary exposure
Fal
ls
Hos
pita
lizat
ion
MV
C
Oth
er
Aut
oim
mun
e
CV
/CB
GI
Hep
atic
/ren
al
Res
pira
tory
Oth
er
Description
Method(s) Obs
erva
tion
win
dow
le
ngth
Outcome onset B
i-dire
ctio
nal
cont
rols
Sen
sitiv
ity
anal
yses
Was
hout
Rep
rodu
cibl
e ris
k ra
tio
Data source
Reference
SSRI and non-SSRI Rx changes
x
Falls
CCO 7d NS N Y N Y admin data + hospital records Berry, 2011
Non-BZD hynotic drug (zolpidem tartrate, eszopiclone, zaleplon)
x
Hip fracture
CCO 30d NS N Y Y N admin data
Berry, 2013 SSRI x
suicide CCO 28d 1-9d N Y Y Y admin data Bjorkenstam,
2013 antidepressant use x
Adverse drug reaction
SCCS 1, 28, 56d,
variable (≥85d)
NS Y Y N N admin data
Coupland, 2011
SSRIs x
Serious UGIB CCO 30d several
weeks N Y Y N admin data
Dall, 2009 psychotropic drugs x
MVC SCCS 3d, 7d,
28d 1-2d Y Y Y Y admin data Dassanayake,
2012 antipsychotics (typical and atypical)
x stroke
SCCS 35d UI N Y Y N admin data Douglas, 2008
AED Rx changes and refills
x Seizure-related event
CCO 21, 28d
>1d N Y Y N admin data Gagne, 2010
BZDs, non-BZD hypnotics, SSRIs, β-blockers, tricyclic antidepressants, opioids, antihistamines
x
1st MVC
CCO + SCCS
28d NS N Y N N admin data
Gibson, 2009 SNRIs x
Falls SCCS 1, 28d,
variable NS Y Y N Ya admin data
Gribbin, 2011 inhaled tiotropium bromide
x stroke
SCCS variable 1y Y N Y N admin data Grosso, 2009
Rx changes: AED, AED interacting drugs, AED non-interacting drugs
x
Epilepsy-related
CCO 28d NS N Y N N admin data
Handoko, 2007 antidepressant use x
hip fracture SCCS 14,
28d NS Y Y Y N admin data
Hubbard, 2003 buproprion x
sudden death SCCS 28d 28 or
63d N Y N N admin data
Hubbard, 2005 nicotine replacement x acute MI, acute SCCS 14d NS Y Y N N admin data Hubbard, 2005

158
Primary outcome
Event Disease
Primary exposure
Fal
ls
Hos
pita
lizat
ion
MV
C
Oth
er
Aut
oim
mun
e
CV
/CB
GI
Hep
atic
/ren
al
Res
pira
tory
Oth
er
Description
Method(s) Obs
erva
tion
win
dow
le
ngth
Outcome onset B
i-dire
ctio
nal
cont
rols
Sen
sitiv
ity
anal
yses
Was
hout
Rep
rodu
cibl
e ris
k ra
tio
Data source
Reference
therapy stroke, death Zolpidem x
fracture CCO 1d 15min -
1d N Y Y N admin data
Kang, 2012 phenytoin, phenobarbital, diazepam during pregnancy
x
congenital abnormalities
CTC 2m 5w (w3-8 of organo-
genesis period)
N N N Y admin data
Kjaer, 2007 BZDs, anti-depressants, opioids, analgesics
x
MVC
CCO variable (Rx
period + 4 x t1/2)
NS N Y Y N admin data
Meuleners, 2011 CNS, BZD and antipsychotic, CVD, antibiotic, and GI drugs
x
Falls
CCO 1d NS N N Y Y hospital records
Neutel, 2002 AED x Suicide CCO 30d NS N Y Y N admin data Olesen, 2010 Insulin (blood-glucose lowering), antiadrenergic, muscle relaxant, opioids, anti-migraine, AED, anti-Parkinson, anti-psychotic, antidepressants, hypnotics, sedatives, drugs used in addiction and antihistamines
x
MVC
CCO 1 d immediate yet
depends on level of medication
N N Y N admin data + police report
Orriols, 2010 Zopiclone, zolpidem and BZD hypnotics
x MVC
CCO 1d immediate (same day)
N N Y Y admin data + police report Orriols, 2011
antidepressant use x MVC CCO 1d NS N Y Y Ya admin data Orriols, 2012 AED x MVC CCO 3m NS N N N N admin data Orriols, 2013 antidepressant use x MVC CCO 1d NS N Y Y Ya admin data Orriols, 2013 BZDs, cyclic antidepressants, opioids, and antihistamines
x
MVC (injury)
CCO UD variable (based on
days supply)
N N Y N admin data
Ray, 1992
Antidepressants x Acute angle-
closure CCO 30d “soon after
initiating N Y Y N admin data
Seitz, 2012

159
Primary outcome
Event Disease
Primary exposure
Fal
ls
Hos
pita
lizat
ion
MV
C
Oth
er
Aut
oim
mun
e
CV
/CB
GI
Hep
atic
/ren
al
Res
pira
tory
Oth
er
Description
Method(s) Obs
erva
tion
win
dow
le
ngth
Outcome onset B
i-dire
ctio
nal
cont
rols
Sen
sitiv
ity
anal
yses
Was
hout
Rep
rodu
cibl
e ris
k ra
tio
Data source
Reference
glaucoma treatment”
Hypnotics, anti-anxiolytics, anti-psychotics, antihistamines, anti-diabetics, antihypertensives, diuretics, anti-Parkinsons, anti-ulcer drugs
x
Falls
CCO 3d NS N Y Y N incident report + medical records
Shuto, 2010
Antidepressants x Stroke CCO 14d NS N Y N Y admin data Wu CS, 2011 Zopiclone, zolpidem and BZDs
x MVC
CCO 1d 1d (after treatment)
N Y Y N admin data Yang, 2011
cholinesterase inhibitors
x MI
SCCS 30d, variable
NS Y Y N N admin data Pariente, 2012
cholinesterase inhibitors
x hospitalization (bradycardia)
CTC 3m "During initial
period of therapy"
N N Y Ya admin data
Park-Wyllie, 2009
methylphenidate and dexamphetamine
x MAE (injury)
SCCS variable <1d Y Y Y N admin data Raman, 2012
atypical antipsychotics (risperidone, quetiapine, olanzapine)
x
ischemic stroke
CCO 10, 20, 30d
weeks to 1 month
N Y Y N admin data
Shin, 2013 newly-prescribed opioids
x fall-related injuries
CCO 28d NS N Y Y N admin data Soderberg, 2013
SSRIs and TCAs x AMI SCCS 1, 7d NS Y Y N N admin data Tata, 2005 SSRIs (or TCAs) and NSAIDs ns, COX-2 or aspirin (concurrent use)
x
UGIB
SCCS UD NS/UD Y*
UD Y N admin data
Tata, 2005 antipsychotics x ischemic stroke CCTC 30d 0-7d N Y Y N admin data Wang, 2012 antidepressant use: tricyclic antidepressants, SSRI, other
x
cardiac arrest
CTC 30d NS N Y N N admin data
Weeke, 2011 SSRIs and TCAs x suicide-related
events SCCS 1d,
1w, 1w Y Y Y N admin data
Wiljaars, 2013

160
Primary outcome
Event Disease
Primary exposure
Fal
ls
Hos
pita
lizat
ion
MV
C
Oth
er
Aut
oim
mun
e
CV
/CB
GI
Hep
atic
/ren
al
Res
pira
tory
Oth
er
Description
Method(s) Obs
erva
tion
win
dow
le
ngth
Outcome onset B
i-dire
ctio
nal
cont
rols
Sen
sitiv
ity
anal
yses
Was
hout
Rep
rodu
cibl
e ris
k ra
tio
Data source
Reference
(attempted suicide, suicidal ideation, intentional self-harm)
variable
antipsychotics with various receptor-binding profiles
x
stroke
CCO 14d NS N Y Y N admin data
Wu CS, 2013 Respiratory β2-agonists (short-acting)
x Mortality from COPD
CCO + CTC
60d NS N N N N admin data Corrao, 2005
Discontinuation of long-term GC therapy
x depression, delirium/confusion, mania, panic disorder, suicide or suicide attempt
SCCS 2m UI Y N Y N admin data
Fardet, 2013 Asthma controller x Sleep CCO 7d 24, 52 w N Y Y N survey data Garrison, 2011 Montelukast x CSS CCO 90d <3m N Y N N questionnaire Hauser, 2008 Respiratory inhalers, including ICS (with and without LABA)
x ER visit or hospitalization for pneumonia
CCO 30d NS N Y Y N admin data
Lee CH, 2013
Corticosteroids
x
SRC
CCO 90d NS N Y N N physician recall + medical records Teixeira, 2008
Inhaled GCs, β2-agonists, muscarinic antagonists, xanthine derivatives, Montelukast
x
Obstructive lung disease
CCO 90d NS N Y Y N
admin data
Velthove, 2010 Vaccines Measles vaccination x MAEs SCCS 14d 14d Y Y N Ya admin data Ali, 2005 oral polio vaccine x
intussusception SCCS
14d ≥3-4w Y* Y Y N admin data
Andrews, 2001 MCCV, DTP vaccine, MMR vaccine
x
convulsions or pupura
SCCS convulsions: 14d,
pupur
Convulsions: 14d, Purpura:
42d
Y* Y N N AE report (system)
Andrews, 2007

161
Primary outcome
Event Disease
Primary exposure
Fal
ls
Hos
pita
lizat
ion
MV
C
Oth
er
Aut
oim
mun
e
CV
/CB
GI
Hep
atic
/ren
al
Res
pira
tory
Oth
er
Description
Method(s) Obs
erva
tion
win
dow
le
ngth
Outcome onset B
i-dire
ctio
nal
cont
rols
Sen
sitiv
ity
anal
yses
Was
hout
Rep
rodu
cibl
e ris
k ra
tio
Data source
Reference
a: 28, 43d
H1N1 (2009) pandemic influenza vaccination
x Guillain-Barré Syndrome
SCCS 6w 1w, 6-8w UD Y N Y admin data
Andrews, 2011 MMR vaccine x idiopathic
thrombocytopenic purpura
SCCS 14, 42d
NS N Y Y Y admin data
Andrews, 2012 H1N1 (2009) pandemic influenza vaccination
x epileptic seizures
SCCS 6, 23d NS Y* Y Y N IM records Arnheim-Dalstrom, 2012
liquid pentavalent DTaP-HBV-Hib
x MAEs or SAEs
SCCS 2, 5, 24d
immediate N Y N Y outpatient records Asturias, 2013
any influenza immunization
x ADRs (defined as ER visit, hospitalization, physician office visit for any reason, IBD-related events)
SCCS 178d NS Y* Y Y N admin data
Benchimol, 2013 oral polio vaccine x
intussusception SCCS 5, 14,
28d 14-41d Y*
Y Y N admin data
Cameron, 2006 rotavirus vaccine x intussusception SCCS 7, 21d 21d Y Y N N admin data Carlin, 2013
1O immunization or booster
x
MS relapse
CCO 60d NS “after
vaccination”
N Y N Y interview + medical records
Confavreux, 2001
H1N1 (2009) pandemic influenza vaccination
x Guillain-Barré Syndrome
SCCS
42d 42d Y N N N IM records + hospital records Crawford, 2012
H1N1 (2009) pandemic influenza vaccination
x Guillain-Barré Syndrome
SCCS 28, 42, 57d
42d N Y N N admin data
De Wals, 2012 H1N1 (2009) pandemic influenza vaccination
x Guillain-Barré Syndrome
SCCS 42d 42d Y*
Y N N admin data
Dodd, 2013 Bivalent HPV x fatigue
syndromes SCCS 12m NS N Y N N admin data
Donegan, 2013 MMR Vaccine x aseptic
meningitis SCCS
20d 15d N N Y Y admin data
Dourado, 2000

162
Primary outcome
Event Disease
Primary exposure
Fal
ls
Hos
pita
lizat
ion
MV
C
Oth
er
Aut
oim
mun
e
CV
/CB
GI
Hep
atic
/ren
al
Res
pira
tory
Oth
er
Description
Method(s) Obs
erva
tion
win
dow
le
ngth
Outcome onset B
i-dire
ctio
nal
cont
rols
Sen
sitiv
ity
anal
yses
Was
hout
Rep
rodu
cibl
e ris
k ra
tio
Data source
Reference
rotavirus vaccine x intussusception
SCCS 5d NS N Y N N AE report (system) Escolano, 2011
yellow fever vaccination
x MS exacerbation
SCCS 4w 6-11d, 2m
N N N Ya outpatient records Farez, 2011
DTP and MMR vaccines
x febrile convulsion and idiopathic thrombocytopenic purpura
SCCS MMR: 5, 20d; DTP: 4, 7d
MMR: 6-35d;
DTP: 0-14d
N Y Y N admin data Farrington, 1995
MMR vaccine x
autism
SCCS variable (any time/
arbitrary periods 24m, 36m, 60m)
NS/any time after
vaccination
Y Y Y N admin data
Farrington, 2001 Influenza vaccine x MAE CCO 14d 14d Y Y N N admin data France, 2004 Influenza immunization
x Guillain-Barré Syndrome
SCCS 42d 42d Y N N N interviews + chart review Galeotti, 2013
TIV x MAEs
SCCS 3, 14, 42d
variable Y* Y N N admin data Glanz, 2011
DTP and MMR vaccines
x Febrile convulsion and idiopathic thrombocytopenic purpura
SCCS DTP: 4, 7, 14d; MMR: 6, 14, 20d
NS Y* Y Y N admin data
Gold, 2010 influenza immunization
x MI
SCCS 14, 30, 60d
1-2w Y Y Y Ya admin data Gwini, 2010
Influenza vaccine x MAE CCO 3, 14d NS Y Y N Y chart review Hambidge, 2006 TIV x hospitalization
(SCC) sickle cell crisis
SCCS 14d 14d Y*
N N N admin data
Hambidge, 2011 TIV x hospitalization
(SCC) sickle cell crisis
SCCS 14d 14d Y Y N N admin data
Hambidge, 2012 acellular pertussis vaccine or whole-cell pertussis vaccine
x HSU (ER visits and hospitalizations)
SCCS 3d 2d N N Y Y admin data
Hawken, 2012 DTaP vaccine x
febrile seizures SCCS 1, 3,
4d NS Y Y N Ya admin data
Huang, 2010

163
Primary outcome
Event Disease
Primary exposure
Fal
ls
Hos
pita
lizat
ion
MV
C
Oth
er
Aut
oim
mun
e
CV
/CB
GI
Hep
atic
/ren
al
Res
pira
tory
Oth
er
Description
Method(s) Obs
erva
tion
win
dow
le
ngth
Outcome onset B
i-dire
ctio
nal
cont
rols
Sen
sitiv
ity
anal
yses
Was
hout
Rep
rodu
cibl
e ris
k ra
tio
Data source
Reference
H1N1 (2009) pandemic influenza vaccination
x ADRs (GBS, demyelinating disease of the CNS, convulsion, encephalitis/myelitis, Bell's palsy, acute hemorrhagic or ischemic stroke, idiopathic thrombocytopenia)
SCCS 43d NS N Y N Ya admin data
Huang, 2013 any immunization x Guillain-Barré
Syndrome SCCS 42d NS N N N Ya admin data
Hughes, 2006 all influenza vaccines x Guillain-Barré
Syndrome SCCS 42d 7-56d Y*
Y Y Ya admin data
Juurlink, 2006
MMR vaccines
x Aseptic meningitis
CCO 42d NS N N
UD N
chart review + survey
Ki, 2003 all influenza vaccines x ER visit or
hospitalization (asthma )
SCCS UD NS UD UD UD N admin data
Kramarz, 2001 MMR vaccine x idiopathic
thrombocytopenic purpura
SCCS 42d few weeks, ≥15-35 d
Y N N N admin data
Miller, 2001 MMR vaccine x bacterial
infection SCCS 30d,
12w NS Y* Y Y N admin data
Miller, 2003 MMR vaccine x
febrile convulsion and aseptic meningitis
SCCS AM: 20d,
convulsions: 6, 20d
15-35d Y*
Y N N admin data
Miller, 2007 DTaP, HAV vaccine, HBV vaccine, HiB, OPV, IPV, MMR vaccine, PCV7, live attenuated rotavirus vaccine, and live attenuated varicella vaccine
x
hyperammonemic episodes
SCCS 8, 22d NS Y Y N N medical records
Morgan, 2011 HBV, DTaP, HiB, OPV, IPV, MMR,
x wheezing lower respiratory
SCCS 7, 14, 15d
NS N Y N N admin data Mullooly, 2011

164
Primary outcome
Event Disease
Primary exposure
Fal
ls
Hos
pita
lizat
ion
MV
C
Oth
er
Aut
oim
mun
e
CV
/CB
GI
Hep
atic
/ren
al
Res
pira
tory
Oth
er
Description
Method(s) Obs
erva
tion
win
dow
le
ngth
Outcome onset B
i-dire
ctio
nal
cont
rols
Sen
sitiv
ity
anal
yses
Was
hout
Rep
rodu
cibl
e ris
k ra
tio
Data source
Reference
Varicella, PCV7, TIV disease oral rotavirus vaccine x
intussusception SCCS 21d <10m N N Y N hospital
records Murphy, 2001 inactivated intranasal influenza vaccine
x Bell's palsy
SCCS 30d, variable
91d UD Y N N questionnaire Mutsch, 2004
DTP/DTaP vaccines, HBV, and vaccination with any antigen
x immune hemolytic anemia
SCCS 42d hours to days
Y N N N admin data
Naleway, 2009
MMR vaccines x Aseptic
meningitis CCO 42d NS N Y N Y admin data
Park, 2004 RV1 (rotovirus vaccine 1)
x
intussusception
SCCS 7d 3-7d N Y N N hospital disease
surveillance + IM records Patel, 2011
oral polio vaccine x
intussusception
SCCS 14d “shown in previous studies”
Y* Y Y N hospital records
Sardinas, 2001 influenza, tetanus and pneumococcus vaccines
x myocardial infarction
SCCS 90d NS Y N N N admin data
Smeeth, 2004 parenteral inactivated influenza vaccine
x
Bell's palsy
SCCS 30, 90d
1-3, 1-30, 31-
60d
Y*
Y N N admin data
Stowe, 2006 second dose of MMR vaccine
x idiopathic thrombocytopenic purpura
SCCS 6w after first dose ≤6w
Y* N N N admin data
Stowe, 2008 influenza vaccine x Guillain-Barré
Syndrome SCCS 30d 6-8w Y* Y N N admin data
Stowe, 2008 MCCV and MMR vaccine
x bacterial or viral infections
SCCS 30d 3m Y* Y N N hospital records Stowe, 2009
seasonal TIV vaccination (pre2009/10) or H1N1 adjuvanted pandemic strain (2009/10)
x
convulsions
SCCS 1, 3, 4d
6-11d Y* Y N N admin data
Stowe, 2011 DTaP-IPV-Hib vaccination
x febrile seizures and epilepsy
SCCS 1, 3, 4, 8d
1d Y Y N N admin data Sun, 2012
influenza vaccine x asthma, COPD, oral corticosteroid
SCCS 3, 12d NS N Y N N admin data
Tata, 2003

165
Primary outcome
Event Disease
Primary exposure
Fal
ls
Hos
pita
lizat
ion
MV
C
Oth
er
Aut
oim
mun
e
CV
/CB
GI
Hep
atic
/ren
al
Res
pira
tory
Oth
er
Description
Method(s) Obs
erva
tion
win
dow
le
ngth
Outcome onset B
i-dire
ctio
nal
cont
rols
Sen
sitiv
ity
anal
yses
Was
hout
Rep
rodu
cibl
e ris
k ra
tio
Data source
Reference
prescriptions, or acute exacerbations
MCCV meningococcal C conjugate vaccine
x nephrotic syndrome relapse (also steroid-responsive nephrotic syndrome)
SCCS 1, 3, 6m
6m Y* Y N N AE report (system) +
hospital records
Taylor, 2007 Influenza A (H1N1) 2009 monovalent and 2009-2010 seasonal influenza vaccines
x
Guillain-Barré Syndrome
SCCS 42d 42d
N Y N N IM records + telephone
questionnaire Tokars, 2012
hexavalent vaccine x sudden unexpected deaths
SCCS 1, 2, 8, 15d
2d Y Y N Ya admin data
Traversa, 2011 Zoster vaccine x ADRs (5 groups):
stroke and cerebrovascular events, CV diseases, meningitis, encephalitis and encephalopathy, Ramsay-hunt syndrome and Bell's palsy, MAEs
SCCS 14d, 42d
NS/UI N Y Y Y admin data
Tseng, 2012 DTaP (off-label) x meningitis,
encephalitis and encephalopathy, cranial nerve diaorders, GBS, brachial neuritis, paralytic syndromes, MAE (inflammatory or allergic), anaphalaxis and generalized reaction
SCCS 6, 7, 42d
limited knowledge
N Y N Y admin data
Tseng, 2013 rotavirus vaccine x intussusception SCCS 31d 3-14d N Y N Ya admin data Velazquez, 2012 MCCV, DTP vaccine, MMR vaccine
x
serious neurological disease
SCCS DTP, HiB,
MCCV: 4, 8d; MMR: 6, 20d
fever and convulsion: 0-3 and 0-7d (MenC
DTP) and 6-11d for MMR
UD Y Y N immunization records
Ward, 2007 MMR, MCCV and pentavalent vaccine
x ER visits and hospitalization
SCCS 1d 5-14d N Y Y
N admin data Wilson, 2011

166
Primary outcome
Event Disease
Primary exposure
Fal
ls
Hos
pita
lizat
ion
MV
C
Oth
er
Aut
oim
mun
e
CV
/CB
GI
Hep
atic
/ren
al
Res
pira
tory
Oth
er
Description
Method(s) Obs
erva
tion
win
dow
le
ngth
Outcome onset B
i-dire
ctio
nal
cont
rols
Sen
sitiv
ity
anal
yses
Was
hout
Rep
rodu
cibl
e ris
k ra
tio
Data source
Reference
booster dose (ADRs) pediatric vaccinations x ER visits,
hospitalizations, and death
SCCS 3d 2d immediate
N N Y N admin data
Wilson, 2011 vaccinations at 2 months of age
x ER visits, hospitalizations, and death
SCCS 3d 2d immediate
N N Y Ya admin data
Wilson, 2011 DTP, polio, HiB and pneumococcus
x Adverse drug reactions
SCCS 3d 24-48h N Y Y N admin data Wilson, 2012
DTP, polio, HiB, pneumococcus, MMR, MCCV
x
ADRs
SCCS 3, 9d 1-2d, MMR: 1-
2w
N N Y Y admin data
Wilson, 2013 influenza vaccine x hospitalization
for myasthenia gravis (MG)
SCCS 6w NS N Y Y
Ya admin data
Zinman, 2009 Other Isotretinoin x Depression CCO 150d NS N N Y Y admin data Azoulay, 2008
Isotretinoin
x MI, stroke, other thromboembolic disorders
CCO 150d UI N Y Y Y admin data
Berard, 2011
Diuretics
x
Falls
CCO 1d NS N Y
Y N
admin data + hospital records
Berry, 2012 diuretics (loop and thiazide)
x hip fracture
CCO 7d NS/UI N Y Y Y admin data Berry, 2012
tamsulosin x hospitalization (hypotension)
SCCS 4w UI Y N N N admin data Bird, 2013
PEG
x
ARF
CCO 14, 28d
hours N Y
Y Y
admin data
Choi, 2011 PEG x ARF CCO 1,2,4w NS N Y Y Y admin data Choi, 2013 Psoriasis-causing drugs
x Psoriasis
CCO 90d NS N Y Y N admin data Cohen, 2005
Thiazolidinedione x fractures
SCCS variable 1y, 3y
NS N N N Ya admin data Douglas, 2009
PPIs and clopidigrel x death or incident of MI
SCCS UD NS Y *
Y N Ya admin data Douglas, 2012

167
Primary outcome
Event Disease
Primary exposure
Fal
ls
Hos
pita
lizat
ion
MV
C
Oth
er
Aut
oim
mun
e
CV
/CB
GI
Hep
atic
/ren
al
Res
pira
tory
Oth
er
Description
Method(s) Obs
erva
tion
win
dow
le
ngth
Outcome onset B
i-dire
ctio
nal
cont
rols
Sen
sitiv
ity
anal
yses
Was
hout
Rep
rodu
cibl
e ris
k ra
tio
Data source
Reference
Nevirapine x SJS and TEN CCO 7d NS N Y Y Y questionnaire Fagot, 2001
Morphine x Acute chest
syndrome CCO variable NS UD N UD N medical
records Finkelstein, 2007 Strontium ranelate x ADRs (VTE,
gastrointestinal disturbance, dermatitis, memory loss, severe skin reactions)
SCCS variable NS/UI N Y Y N admin data
Grosso, 2008 Oral bisphosphonates x atrial fibrillation
and flutter SCCS variable NS N Y Y N admin data
Grosso, 2009
Ephedrine and caffeine
x
CV toxicity: death, MI, stroke
CCO 1d NS N Y
Y N
admin data
Hallas, 2008
Folic acid antagonists x Cardiac
abnormality CCO + CTC
60d NS N Y Y Y interview Hernandez-Diaz, 2003
IV medications from different therapeutic classes
x clinical deterioration (defined as cardiopulmonary arrest, acute respiratory compromise, or urgent ICU transfer while hospitalized on patient wards)
CCO 12h immediate (2h
induction time)
N Y Y N admin data
Huang, 2013 Loop and thiazide diuretics
x Gout (recurring)
CCO 2d NS N Y UD N questionnaire Hunter, 2006
Vit D sterols
x Hypercalcemia and hyperphosphatemia
CCO 60d NS N Y N N admin data
Kilpatrick, 2011
CHMs
x Acute hepatitis-related hospitalization, hepatotoxicity
CCO 30, 60d
5-90d Y Y Y N admin data
Lee CH, 2008

168
Primary outcome
Event Disease
Primary exposure
Fal
ls
Hos
pita
lizat
ion
MV
C
Oth
er
Aut
oim
mun
e
CV
/CB
GI
Hep
atic
/ren
al
Res
pira
tory
Oth
er
Description
Method(s) Obs
erva
tion
win
dow
le
ngth
Outcome onset B
i-dire
ctio
nal
cont
rols
Sen
sitiv
ity
anal
yses
Was
hout
Rep
rodu
cibl
e ris
k ra
tio
Data source
Reference
(major) CHMs containing Radix Bupleuri
x 1o diagnosis of liver injury
CCO 30d NS UD Y UD N admin data Lee CH, 2011
Hospital-administered IV (any)
x Burkholderia cepacia complex bloodstream infection
CCO 3d NS N N Y Y lab records
Martins, 2010
Sildenafil x
MI CCO 1d 2h UD Y UD N clinical trial
records Mittleman, 2005 high-risk medications: anticoagulants, antirheumatics, corticosteroids, opioids and CV drugs: hypertension drugs, cardiac rhythm regulators, beta-blockers, and serum lipid-reducing agents
x
hospitalization (unplanned)
CTC 1d NS N N Y N admin data
Price, 2013 Hormonal contraception
x BV
CCO variable 30-90d N N UD N cohort study data Rifkin, 2009
EPO-stimulating agents, chemotherapeutics, antipsychotics
x
VTE
CCO 90d NS N Y
Y
N
admin data
Rogers, 2012
Acitretin
x Vulvo-vaginal candidiasis
CCO variable NS N N
Y N
admin data + medical records
Sturkenboom, 1995
EPO-A, darbepoietin-A
x DVT
CCO 84d NS N N Y N admin data Weiss-Smith, 2012

169
Table E2. List of abbreviations from Table E1 (in alphabetical order).
ACE Angiotensin converting enzyme AE Adverse events AED Antiepileptic drug ADR Adverse drug reaction AMI Acute myocardial infarction ARB Angiotensin receptor blocker ARF Acute renal failure BV Bacterial vaginosis BZD Benzodiazepine CB Cerebrovascular CHM Chinese herbal medicines CNS Central nervous system COPD Chronic obstructive pulmonary disease COX-2 Cyclooxygenase-2 CSS Churg-Strauss syndrome CV Cardiovascular DTaP Diphtheria, tetanus, and acellular pertussis (whooping cough) DTP Diphtheria, tetanus, and pertussis (whooping cough) DVT Deep vein thrombosis EPO Erythropoietin ER/ED Emergency room/department GBS Guillaine-Barré Syndrome GC Glucocorticoid GI Gastrointestinal GIB Gastrointestinal bleed H1N1 Hemagglutanin-1 and Neurominadase-1 (swine flu) HBV Hepatitis B Virus Hib haemophilus influenzae type b HF Heart failure HPV Human papillomavirus HSU Health Services Utilization IBD Inflammatory bowel disease ICS Inhaled corticosteroid ICU Intensive care unit IPV (Inactivated) polio vaccine IV Intravenous LABA Long-acting beta agonists MAE Medically attended event including but not limited to: pharyngitis, upper
respiratory tract infection, common cold, sinusitis, bronchitis, pneumonia, cellulitis/skin infection, asthma, limb soreness, rash, headache, epilepsy, uriticaria, and allergic reaction
MCCV Meningococcal C conjugate vaccine
Abbreviation Full -text

170
MI Myocardial infarction MMR Measles Mumps Rubella MS Multiple Sclerosis MVC Motor vehicle collision N No NS Not stated NSAIDs Non-steroidal anti-inflammatory drugs (selective and non-selective) nsNSAIDs Non-selective non-steroidal anti-inflammatory drugs OPV Oral polio vaccine PCV7 Pneumococcal conjugate vaccine (protects against 7 strains of bacteria) PEG Polyethylene glycol (in colonoscopy bowel preparations) PPI Proton pump inhibitor PUB Perforations, ulcers, bleeds Rx Prescription RV1 Rotovirus 1 SAE Serious adverse events SAH Subarachnoid hemorrhage SCC Sickle cell crisis SJS Steven-Johnson’s Syndrome SNRI Serotonin-norepinephrine reuptake inhibitor SRC Scleroderma renal crisis SSRI Selective serotonin reuptake inhibitor TCA Tricyclic antidepressant TEN Toxic epidermal necrolysis TIV Trivalent inactivated influenza vaccine UD Undefined UGI Upper gastrointestinal UGIB Upper gastrointestinal bleed UI Under investigation Vit Vitamin VTE Venous thromboembolism Y Yes
Abbreviation Full -text

171
APPENDIX F Self-controlled recommendations over tim e
Table F1. Applications following methodological and reporting recommendations – over time and by design . Methodological recommendations on exposures, outcomes and reporting (raw data display and onset timing) recommendations on raw data display; are followed, somewhat followed or not followed over time by self-controlled case-control and cohort studies.
Self -controlled case -control Self -controlled cohort 1992-2001
(n=5) 2002-2004
(n=8) 2005-2007
(n=12) 2008-2010
(n=26) 2011-2013
(n=42) 1992-2001
(n=8) 2002-2004
(n=5) 2005-2007
(n=13) 2008-2010
(n=15) 2011-2013
(n=44) n % n % n % n % n % n % n % n % n % n %
Exposures Followed 2 40.0 4 66.7 5 41.7 10 23.8 10 23.8 8 100 4 80.0 11 84.6 10 66.7 35 77.8
Somewhat followed 1 20.0 2 33.3 2 16.7 17 40.5 17 40.5 0 0.0 1 20.0 1 7.7 2 15.3 8 17.8
Did not follow 2 40.0 0 0.0 5 41.7 16 38.1 16 38.1 0 0.0 0 0.0 1 7.7 3 20.0 2 4.4 Outcomes – biological onset Followed 1 20.0 0 0.0 1 8.3 5 19.2 8 19.0 3 37.5 0 0.0 1 7.7 1 6.7 12 26.7
Somewhat followed 0 0.0 1 16.7 0 0.0 3 11.5 1 2.4 3 37.5 0 0.0 5 38.5 2 13.3 8 17.8
Did not follow 4 80.0 5 83.3 11 91.7 18 69.2 33 78.6 2 25.0 5 100 7 53.8 12 80.0 25 55.6 Outcomes – onset based on observation window Followed 2 40.0 2 33.3 3 25.0 5 20.0 12 28.6 2 25.0 1 20.0 2 15.4 2 13.3 12 26.7
Somewhat followed 0 0.0 1 16.7 3 25.0 13 52.0 24 57.1 4 50.0 3 60.0 6 46.2 5 33.3 20 44.4
Did not follow 3 60.0 3 50.0 6 50.0 7 28.0 6 14.3 2 25.0 1 20.0 5 38.5 8 53.3 13 28.9 Raw data display Followed 2 40.0 4 66.7 3 25.0 25 59.5 25 59.5 1 12.5 0 0.0 1 7.7 0 0.0 0 0.0
Somewhat followed 0 0.0 0 0.0 3 25.0 10 23.8 10 23.8 0 0.0 0 0.0 0 0.0 4 26.7 0 0.0
Did not follow 3 60.0 2 33.3 6 50.0 7 16.7 7 16.7 7 87.5 5 100 12 92.3 11 73.3 45 100
Report of onset timing Followed 1 20.0 2 33.3 2 16.7 11 42.3 10 23.8 8 100 1 20.0 9 69.2 6 40.0 27 60.0
Somewhat followed 0 0.0 0 0.0 0 0.0 0 0.0 2 4.8 0 0.0 0 0.0 1 7.7 2 13.3 10 22.2
Did not follow 4 80.0 4 66.7 11 91.7 14 53.8 30 71.4 0 0.0 4 80.0 3 23.1 8 53.3 7 15.6
*Mode of administration and drug utilization patterns identified by G.P.C. were double-checked (Usama El-Bayoumi, PharmD, PhD Student) for accuracy.

172
**Long-course drug utilization was categorized as “somewhat followed recommendations.” This rationale was founded upon 2 factors: 1) methodological recommendations on self-controlled studies suggest that exposures are one-time or short-term, and 2) the suitability of prolonged exposures to self-controlled methods under certain conditions (as demonstrated previously).27
***Outcome periods were derived from published self-controlled literature. For example, studies investigating abrupt outcomes had an onset of hours to days.5,6,32,49 Thus, a window spanning “0-3 days” was chosen for biological risk period. To account for potential delays in actual drug consumption leading to outcome onset, observation windows that follow recommendations are longer, “0-7 days”. Studies that noted investigating “long” outcome onset studied onsets occurring greater than one month after exposure.27 Distribution of observation window frequency was plotted to verify the selection of the 30-day cut point. The intermediate period was selected to complement the immediate and prolonged periods and spans the remaining 4-30, and 8-30 days.

173
i. Self-controlled case-control ii. Self-contr olled cohort
Figure F1 i-ii. Applications following methodologic al recommendations – exposures. Methodological recommendations on exposures over time and by design are followed, somewhat followed, or not followed over time by i. self-controlled case-control and ii. self-controlled-cohort studies.
0.0
10.0
20.0
30.0
40.0
50.0
60.0
70.0
80.0
90.0
100.0
1992-2001 2002-2004 2005-2007 2008-2010 2011-2013
Pro
port
ion
of p
aper
s
YearDid not follow Somewhat followed Followed recommendations
0.0
10.0
20.0
30.0
40.0
50.0
60.0
70.0
80.0
90.0
100.0
1992-2001 2002-2004 2005-2007 2008-2010 2011-2013
Pro
port
ion
of p
aper
s
YearDid not follow Somewhat followed Followed recommendations

174
i. Self-controlled case-control ii. Self-cont rolled cohort
Figure F2 i-ii. Applications following methodologic al recommendations – outcomes report of biological onset. Methodological recommendations on outcomes (report of biological onset) over time and by design are followed, somewhat followed, or not followed over time by i. self-controlled case-control and ii. self-controlled-cohort studies.
0.0
10.0
20.0
30.0
40.0
50.0
60.0
70.0
80.0
90.0
100.0
1992-2001 2002-2004 2005-2007 2008-2010 2011-2013
Pro
port
ion
of p
aper
s
YearDid not follow Somewhat followed Followed recommendations
0.0
10.0
20.0
30.0
40.0
50.0
60.0
70.0
80.0
90.0
100.0
1992-2001 2002-2004 2005-2007 2008-2010 2011-2013
Pro
port
ion
of p
aper
s
YearDid not follow Somewhat followed Followed recommendations

175
i. Self-controlled case-control ii. Self-cont rolled cohort
Figure F3 i-ii. Applications following methodologic al recommendations – outcomes. Methodological recommendations on outcomes (based on observation windows (design)) over time and by design are followed, somewhat followed, or not followed over time by i. self-controlled case-control and ii. self-controlled-cohort studies.
0.0
10.0
20.0
30.0
40.0
50.0
60.0
70.0
80.0
90.0
100.0
1992-2001 2002-2004 2005-2007 2008-2010 2011-2013
Pro
port
ion
of p
aper
s
YearDid not follow Somewhat followed Followed recommendations
0.0
10.0
20.0
30.0
40.0
50.0
60.0
70.0
80.0
90.0
100.0
1992-2001 2002-2004 2005-2007 2008-2010 2011-2013
Pro
port
ion
of p
aper
s
YearDid not follow Somewhat followed Followed recommendations

176
i. Self-controlled case-control ii. Self-controlled cohort
Figure F4 i-ii. Applications following reporting re commendations – raw data display. Reporting recommendations (raw data display) over time and by design are followed, somewhat followed, or not followed over time by i. self-controlled case-control and ii. self-controlled cohort studies.
0.0
10.0
20.0
30.0
40.0
50.0
60.0
70.0
80.0
90.0
100.0
1992-2001 2002-2004 2005-2007 2008-2010 2011-2013
Pro
port
ion
of p
aper
s
YearDid not follow Somewhat followed Followed recommendations
0.0
10.0
20.0
30.0
40.0
50.0
60.0
70.0
80.0
90.0
100.0
1992-2001 2002-2004 2005-2007 2008-2010 2011-2013
Pro
port
ion
of p
aper
s
YearDid not follow Somewhat followed Followed recommendations

177
i. Self-controlled case-control ii. Self-cont rolled cohort
Figure F5 i-ii. Applications following reporting re commendations – onset/biological plausibility. Reporting recommendations on outcome onset (biological plausibility of exposure-outcome timing) over time and by design are followed, somewhat followed, or not followed over time by i. self-controlled case-control and ii. self-controlled-cohort studies.
0.0
10.0
20.0
30.0
40.0
50.0
60.0
70.0
80.0
90.0
100.0
1992-2001 2002-2004 2005-2007 2008-2010 2011-2013
Pro
port
ion
of p
aper
s
YearDid not follow Somewhat followed Followed recommendations
0.0
10.0
20.0
30.0
40.0
50.0
60.0
70.0
80.0
90.0
100.0
1992-2001 2002-2004 2005-2007 2008-2010 2011-2013
Pro
port
ion
of p
aper
s
YearDid not follow Somewhat followed Followed recommendations

APPENDIX G Worksheet to design self
Figure G1. Worksheet to design selfstudies was drafted as a part of this thesis researchconduct of self-controlled studies exists.
WORKSHEET TO DESIGN A NEW STUDYSTUDY QUESTION:
Outcome _____________________
(insert outcome)
� Acute (sudden) outcome
CAUTION: if not �
Data source(s): chart review,
Validity of source: details:__________________________________________________________________
Accuracy of start and stop time details:__________________________________________________________________CAUTION: need to consider accuracy of start and stop dates (e.g., hospital admission vs. discharge diagnoses
Exposure _____________________
(insert medication) NB! Fill out separate forms if > 1
Medication utilization patterns: � One-time use (e.g., vaccine) � Short course (e.g. antibiotic) � Long course (e.g.
antihypertensive) � As needed (e.g., NSAIDs)
a. Biology pharmacokinetics (e.g. half-life): __________________________ pharmacodynamics (e.g. effect timing): __________________________
b. Data Consumption: � Dispensing date � Prescription date � True consumption
Missing data: � Free samples are available
(e.g. new to market) � OTC available � Undetectable if used in hospital
Biology – timing of effect Risk of outcome of interest:
Early as (from initiation):________________ Late as (from last use): ________________
Exposure classificationData source(s): Completeness of data � 100% (e.g. complete LTC, hospital, outpatient, private…)
� Somewhat complete� Limited data
Dates known: prescriptionNB! Explore data to understand days supply, reporting, frequency of drug overlap,
Expected accuracy of exposure START DATE:
� Immediate (accurate to
� Intermediate (within a week)� Long (accurate to
Expected/possible time to event a. Based on biology
� � �
Bias and confounding Study period: _____________________
(insert study start/stop)
� Information bias � Selection bias
Exposure time trend during study period
� Drug entry into market: __________________� Drug coverage restrictions, policy or guideline change: _______________� Any other reason to aCAUTION: if YES, need to
178
Worksheet to design self -controlled studies
Figure G1. Worksheet to design self -controlled studies. A worksheet to plan selfstudies was drafted as a part of this thesis research—no formal set of guidelines to guide the
controlled studies exists.
WORKSHEET TO DESIGN A NEW STUDY
chart review, claims, self-report/diary (circle and/or, other: ______________________)
Validity of source: PPV__________, NPV:_________, Se_________, Sp_________, unknown details:__________________________________________________________________
Accuracy of start and stop time SKETCH IT details:__________________________________________________________________CAUTION: need to consider accuracy of start and stop dates (e.g., hospital admission vs. discharge diagnoses
timing of effect CAUTION: consider different formulations and outcomes separately if needed
Risk of outcome of interest: Early as (from initiation):________________ hrs, days (circle) Late as (from last use): ________________ hrs, days (circle)
classification CAUTION: may need to consider different formulations separately
Data source(s): chart review, claims, self-report/diary (circle and/or, other: ______________________)
Completeness of data source (i.e. measurable exposure based on data source)
(e.g. complete LTC, hospital, outpatient, private…) Somewhat complete (e.g. missing hospitalization, private) imited data (e.g., survey data, OTC)
prescription, dispensing, utilization (circle and/or, other: ______________________)Explore data to understand days supply, reporting, frequency of drug overlap, etc.
xpected accuracy of exposure timing SKETCH IT START DATE: END DATE:
accurate to same day) � Immediate (same day) Intermediate (within a week) � Not immediate: detail_________________
accurate to > week possible) E.g., estimated from start date based on tx course or days supplied?
xpected/possible time to event SKETCH IT b. Based on data CAUTION: if expected (bio) ≠ possible (data) time to event
� Immediate (<1 day to 3 days) e.g.
� Intermediate (4 days to 28 days) e.g.
� Long (> 29 days) e.g. “months to years”
Information bias (e.g. exposure misclassification) details: __________________________________________
Selection bias (e.g. reverse causality) details: ___________________________________________________
Exposure time trend during study period (if checked, �, enter date):
Drug entry into market: __________________ Drug coverage restrictions, policy or guideline change: _______________Any other reason to anticipate potential time trend: __________________
CAUTION: if YES, need to control for time trend using CTC or CCTC
A worksheet to plan self-controlled no formal set of guidelines to guide the
report/diary (circle and/or, other: ______________________)
PPV__________, NPV:_________, Se_________, Sp_________, unknown details:__________________________________________________________________
details:__________________________________________________________________ CAUTION: need to consider accuracy of start and stop dates (e.g., hospital admission vs. discharge diagnoses
CAUTION: consider different formulations and outcomes separately if needed
consider induction period and when exposure effect is diminished (i.e. t1/2)
CAUTION: may need to consider different formulations separately report/diary (circle and/or, other: ______________________)
based on data source):
(circle and/or, other: ______________________) etc.
END DATE:
Not immediate: detail__________________________ .g., estimated from start date based on tx course or days supplied?
possible (data) time to event
. “hours to days” e.g. “days to weeks” rs” CAUTION: time trend
__________________________________________ ___________________________________________________
Drug coverage restrictions, policy or guideline change: _______________ nticipate potential time trend: __________________