digest -...
TRANSCRIPT
Vol. 29
REPUBLIC OF MAURITIUS
Ministry of Finance and Economic Development
STATISTICS MAURITIUS
DIGEST
OF ROAD TRANSPORT
AND ROAD ACCIDENT STATISTICS
2013
October 2014 (Price Rs 75.00)

DIGEST
OF
ROAD TRANSPORT
AND
ROAD ACCIDENT STATISTICS
2013

Digest of Road Transport and Road Accident Statistics - 2013
FOREWORD
This is the twenty ninth issue of the Digest of Road Transport and Road
Accident Statistics published by Statistics Mauritius.
It presents statistics on road transport and road traffic accidents relating to
the Island of Mauritius. Data on vehicles have been compiled from the register of
the National Transport Authority (NTA) and those on road traffic accidents from
returns provided by police stations and insurance companies.
The figures published are the latest available. Some of them are provisional
and are therefore subject to revision in later issues. Figures in this issue of the
digest supersede those appearing in previous ones.
It is hoped that the data presented in this report will be of valuable help to
planners, policy-makers and the public in general.
This digest has been prepared with the collaboration of the National
Transport Authority, the Traffic Management and Road Safety Unit of the Ministry
of Public Infrastructure, National Development Unit, Land Transport and
Shipping, the Police Department and insurance companies. Their assistance is
gratefully acknowledged.
L. F. Cheung Kai Suet
Director of Statistics
Statistics Mauritius
Ministry of Finance and Economic Development
PORT LOUIS .
October 2014

Contact person: Mr. A. Bundhoo, Statistician or Mr. A. Poreema, Senior Statistical Officer
National Transport Authority MSI Building, Les Cassis Tel: (230) 202-2831 Fax: (230) 212-9399
Traffic Branch Police Road Safety Unit Line Barracks, P. Louis Tel: (230) 203-1205 Fax: (230) 208-6077 E-mail: [email protected]
Website: http://statsmauritius.gov.mu

CONTENTS Page
Definition and Explanatory Notes 5 - 7
Abbreviations and Symbols 8
Road Transport and Road Traffic Accident Statistics, 2013 - An overview 9
Main Road Transport and Road Accident Indicators, 2012 - 2013 11
PART 1 - VEHICLE STATISTICS
Table 1.1 - Road network as at end of year, 2009 - 2013 15
1.2 - Vehicles registered, 2004 - 2013 17
1.3 - New vehicles registered, 2009 - 2013 18
1.4 - Imported second-hand and re-registered vehicles, 2009 - 2013 19
1.5 - Vehicles off the road, 2009 - 2013 20
1.6 - Age composition of cars and dual purpose vehicles, 2012 - 2013 21
1.7 - Age composition of operational bus fleet, 2012 - 2013 22
1.8 - Bus operational statistics, 2009 - 2013 23
1.9 - Evolution of bus fares (adults), 2002 - 2013 24
1.10 - Receipts from the activities of the National Transport Authority, 2009 - 2013
25
1.11 - Driving licences issued during the year by type of licence, 2004 - 2013 26
1.12 - Imports of vehicles and spare parts by country of origin, 2012 - 2013 27 - 35
PART 2 - ROAD TRAFFIC ACCIDENT STATISTICS Table 2.1 - Road traffic accidents and casualties, 2004 - 2013 39
2.2 - Road traffic accidents, motor-vehicles involved and casualties, 2009 - 2013
41
2.3 - Number of casualties by degree of casualty and casualty rate, 2009- 2013 41
2.4 - Casualty accidents, pedestrian and rider (auto/moto cycle) casualties by police district, 2012 - 2013
42
2.5 - Pedestrian and total casualties by police district and semester, 2013 43
2.6 - Distribution of casualty accidents by day of the week and time, 2013 44
2.7 - Number of accidents by severity of accident, 2009 - 2013 46
2.8 - Number of casualty accidents involved in ''hit and run cases'', by semester, 2012 - 2013
46
2.9 - Number of casualty accidents by severity of accident and police district, 2012- 2013
47

- 2 -
Page
Table 2.10 - Number of casualty accidents by severity of accident and weather conditions, 2012 - 2013
48
2.11 - Number of casualty accidents by severity of accident and light conditions, 2012 - 2013
49
2.12 - Number of casualty accidents by severity of accident, type of road and collision type, 2013
50
2.13 - Number of casualty accidents by severity of accident and type of road, 2012 - 2013
51
2.14 - Number of casualty accidents by degree of casualties and junction type, 2013
52
2.15 - Number of vehicles involved in casualty accidents by type, 2012 - 2013 53
2.16 - Number of motor-vehicles involved in casualty accidents by type of vehicle and nature of damage, 2013
54
2.17 - Number of drivers and riders involved in casualty accidents by age group and sex, 2013
55
2.18 - Number of drivers/riders involved in casualty accidents by driving experience and sex, 2013
56
2.19 - Number of casualties by class of road users, 2012 - 2013 57
2.20 - Number of casualties by degree of casualty and class of road users, 2012 - 2013
58
2.21 - Number of casualties by class of road users, age-group and sex, 2013 59
2.22 - Number of pedestrian casualties by age-group, 2012 - 2013 60
2.23 - Number of fatalities by class of road users, age-group and sex, 2013 61
2.24 - Fatalities by category of road users, 2012 -2013 62
2.25 - Number of fatalities by police district and by class of road users, 2012 - 2013
63
PART 3 - PETROLEUM PRODUCTS
Table 3.1 - Evolution of price and sales of gasolene and gas oil, 2010 - 2013 67
3.2 - Imports of motor-spirit and gas oil by country of origin, 2012 - 2013 68
3.3 - Imports of lubricating oils and greases by country of origin, 2012 - 2013 69
CONTENTS ( cont'd )

- 3 -
ILLUSTRATIONS Page
Figure 1.1 - Stock of registered vehicles, 2004 - 2013 16
1.2 - Age composition of cars and dual purpose vehicles as at 31st December, 2012 - 2013
21
1.3 - Age composition of operational bus fleet, as at 31st December, 2012 - 2013
22
2.1 - Number of vehicles registered and road accidents, 2004 - 2013 40
2.2 - Number of casualty accidents by day of week, 2013 45
2.3 - Number of casualty accidents by time of day, 2013 45
2.4 - Vehicles involved in casualty accidents by type of vehicle, 2013
53
2.5 - Casualties by class of road users, 2013 57
2.6 - Fatalities by category of road users, 2012 - 2013 62
Appendix Police Form (PF 178)

- 5 -
Vehicle Statistics1
Definitions
Definitions as stipulated in Section 4 of Road Traffic Act of 1962 for types of vehicles
and subsequent amended Act No. 27 of 2012.
1. Motor cars
Motor cars are mechanically propelled vehicles, other than vehicles classified as motor cycles, which are constructed themselves to carry a load or passengers and whose unladen weight –
(i) in case of vehicles which are –
(A) constructed solely for the carriage of passengers and their effects;
(B) adapted to carry not more than 7 passengers exclusive of the driver; and
(C) fitted with tyres of the prescribed type, does not exceed 3 tons;
(ii) in any other case does not exceed 3 tons.
2. Heavy motor cars
Heavy motor cars are mechanically propelled vehicles, other than vehicles classified as motor cars, which are constructed themselves to carry a load or passengers and whose unladen weight exceeds 2½ tons.
3. Dual purpose vehicles
Dual purpose vehicles are vehicles constructed or adapted for the carriage both of passengers and of goods or burden of any description whose unladen weight does not exceed two tons and which either:-
(a) are so constructed or adapted that the driving power of the engine is, or by the appropriate use of the controls of the vehicle can be, transmitted to all the wheels of the vehicle; or
(b) satisfied the following conditions as to construction -
(i) the vehicle is permanently fitted with a rigid roof, with or without a sliding panel,
(ii) the area of the vehicle to the rear of the driver's seat is -
(A) permanently fitted with at least one row of transverse seats (fixed or folding) for 2 or more passengers and those seats are properly sprung or cushioned and provided with upholstered back-rests, attached either to the seats or to a side or the floor of the vehicle; and
1 excludes pedal cycles

- 6 -
(B) lit on each side and at the rear by a window or windows of glass or other transparent material having an area or aggregate area of not less than 2 square feet on each side and not less than 120 square inches on the rear.
(iii) the distance between the rearmost part of the steering wheel and the backrests of the row of transverse seats satisfying the requirements specified in subparagraph (ii) (A) (or, where there is more than one row of seats, the distance between the rearmost part of the steering wheel and the backrests of the rearmost row) is, when the seats are ready for use, not less than one-third of distance between the rearmost part of the steering wheel and the rearmost part of the floor of the vehicle.
4. Double cab pickup
Double cab pickup means a motor vehicle which has –
(i) a front passenger cabin which contain 2 rows of seats and is capable of seating a maximum of 4 persons excluding the driver,
(ii) at least 2 doors capable of being opened separately; and
(iii) an open pickup area behind the passenger cabin.
5. Motor cycles
Motor cycles are mechanically propelled vehicles, other than auto-cycles, with not more than 4 wheels and whose unladen weight does not exceed 400 kilograms.
6. Auto cycles
Auto cycles are bicycles which have pedals and a motor attached which can be propelled by means of those pedals and by mechanical or electrical power from that motor and the swept volume of the cylinders of that motor does not exceed 50 cubic centimeters.
7. Motor tractors
Motor tractors are mechanically propelled vehicles which are not constructed themselves to carry any load and whose unladen weight does not exceed 7¼ tons.
8. Trailer
(a) means a vehicle which has no independent motive power of its own and which is drawn, or designed to be drawn, by a motor vehicle,
(b) does not include a sidecar attached to a motor cycle, nor a farm implement that is not constructed or adapted for the conveyance of goods or burden of any description.
9. Weight Unladen
Means the weight of a vehicle which:-
(a) includes the body and all parts (the heavier being taken where alternative bodies or parts are used) which are necessary to, or ordinarily used with, the vehicle when working on a road;
(b) excludes the weight of water, fuel or accumulators used for the purpose of the supply of power for the propulsion of vehicle or of loose tools and loose equipment.

‐ 7 ‐
B. Road Traffic Accidents
1. In this report, data on accidents refer to all road accidents reported to police stations and to insurance companies.
2. Road Traffic Accident
A road traffic accident is an accident between two or more vehicles, a vehicle and a cyclist, a vehicle and a pedestrian, a vehicle and a fixed object such as a bridge, building, tree, post, etc, or a single vehicle that overturned on or near a public road.
3. Severity of accident
Road traffic accidents are classified into the following categories according to the severity of the accident:
Fatal accident - an accident resulting in the death of one or more persons. Prior to 2002, a fatal accident was defined as an accident where deaths occurred within 7 days. As from 2002, a fatal accident is defined as an accident where deaths occurred within 30 days.
Serious injury accident - An accident in which one or more persons are seriously injured.
Slight injury accident - An accident in which one or more persons are slightly injured.
Non injury accident - An accident in which no one is killed or injured but which results in damage to the vehicle/s and/or other property only.
4. Casualty
Any person killed or injured in a road accident is referred to as a casualty.
Fatality - Any person killed during an accident, or within 30 days as a result of an accident is referred to as a fatality.
Injury definition
(i) As from January 2013:
(a) Serious Injury - An injury for which a person is admitted to hospital as an "in-patient" for more than 24 hours.
(b) Slight Injury - An injury for which a person has received medical care but has not been admitted to hospital for more than 24 hours.
(ii) Prior to January 2013:
(a) Serious Injury - An injury for which a person is detained in hospital as an "in-patient" or any of the following injuries (whether or not he is detained in hospital): fractures, concussions, internal injuries, severe cuts and lacerations, crushings and severe general shock requiring medical treatment.
(b) Slight Injury - An injury of minor character such as a sprain, bruise and cut not judged to be severe.

- 8 -
Abbreviations
No. : Number
000 : Thousand
% : Percentage
km : Kilometre
sq : Square
M/ton : Metric ton : 1,000 kilos
Mn : Million
Rs : Rupees
c.i.f : Cost, insurance and freight
n.e.s : Not elsewhere specified
000 Litres: Thousand Litres
Symbols
- Nil or negligible
… Not available
Abbreviations and Symbols

- 9 -
Road Transport and Road Traffic Accident Statistics – An overview
(Island of Mauritius)
Year 2013
1. Vehicles registered in 2013
At the end of December 2013 there were 443,495 vehicles registered at the National Transport Authority (NTA). This represents a net increase of 21,569 vehicles (5.1%) as compared to end of year 2012 when the number of registered vehicles was 421,926.
During the year 2013, the fleet was strengthened with the registration of 26,351 vehicles, of which 17,607 (66.8%) were new, 7,764 (29.5%) were imported second-hand and 980 (3.7%) were re-registered vehicles; i.e., those which had been previously put off the road. During the same period 4,782 vehicles were put off the road. The net addition to the existing fleet worked out to 21,569 vehicles.
2. Composition of the fleet
A breakdown of the fleet by type of vehicle is given in Table 1.2. At the end of December 2013, the fleet consisted of 47.7% (211,586) cars, double cab pickup and dual purpose vehicles and 40.8% (180,785) auto/motor cycles. The remaining 11.5% comprised vans (26,624), lorries and trucks (14,061), buses (2,963) and other vehicles (7,476). It is to be noted that, prior to year 2013, double cab pickup was included in dual purpose vehicles.
3. Vehicles used for the transport of passengers 3.1 Cars, double cab pickup and dual purpose vehicles
At the end of 2013, the number of cars, double cab pickup and dual purpose vehicles was 211,586, a rise of 6.9% over the figure of 197,849 as at end of 2012. This increase resulted from the registration of 15,471 such vehicles (7,804 new, 7,207 imported second-hand and 460 re-registered), partly offset by 1,734 vehicles that were put off the road.
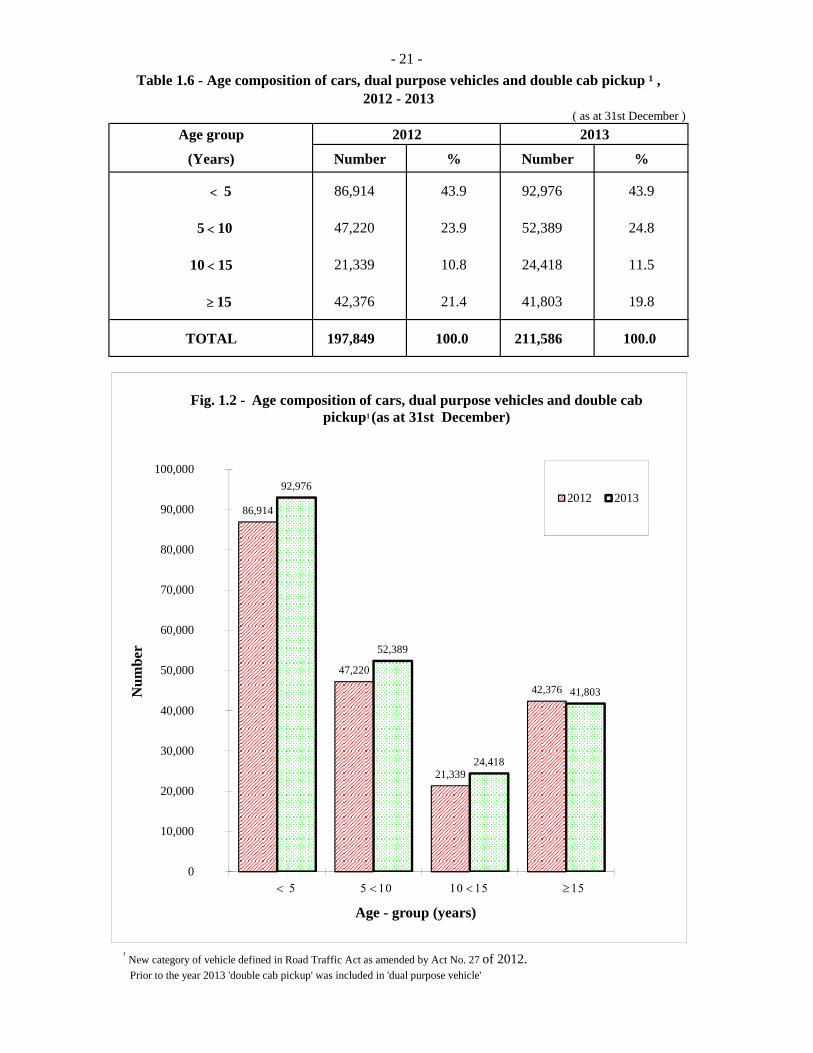
Table 1.6 shows the age distribution of cars and dual purpose vehicles. At the end of December 2013, 43.9% were less than 5 years, 24.8% between 5 and 9 years and the remaining 31.3%, 10 years and above.
3.2 Buses
At the end of December 2013, there were 2,963 registered buses, out of which 1,931 or 65.2% were ‘public’ buses operating with a road service licence. During 2013, some 91 new buses were registered while 85 buses were put off the road resulting in a net increase of 6 buses.
Table 1.7 which gives the age distribution of the fleet of public buses, shows that 31.2% of the buses were under 5 years, 35.5% between 5 and 9 years and 33.3%, between 10 and 20 years.

- 10 -
4. Motor cycles and auto cycles
At the end of 2013, there were 180,785 motor cycles and auto cycles. This represents a net increase of 7,277 (+4.2%) against 173,508 at the end of 2012.
5. Road traffic accidents
The number of road accidents registered during the year 2013 was 23,563 against 21,056 in the preceding year, showing an increase of 11.9%. Among these accidents, the majority, 20,985 (89.1%) were non-injury, 119 fatal, 389 caused serious injuries and 2,070 slight injuries (Table 2.7).
Compared to 2012, accidents causing casualties went down by 0.5% while non-
injury accidents went up by 13.6%. Fatal and serious accidents went down by 17.4% and 14.5% respectively whilst slight injury accidents increased by 13.6%.
The accident rate, expressed as the number of accidents per 100,000 mid-year population, increased from 1,733 in 2012 to 1,936 in 2013 and the number of accidents per 1,000 mid-year registered motor vehicles increased from 51 in 2012 to 55 in 2013 (Table 2.1).
6. Vehicles involved in road accidents
During the year 2013, the total number of vehicles (both motor and non-motor) involved in road accidents was 42,086 against 40,922 in the previous year. The number of motor vehicles involved in accidents resulting in casualties was 3,866 in 2013 against 3,904 in 2012. Table 2.15 shows that 29.9% of the vehicles were private cars, another 41.0% were motor/auto cycles, 5.7% were buses and 5.2% were vans.
7. Casualties
The number of casualties (fatalities and persons injured as a result of road accidents)
went down by 1.2% from 3,653 in 2012 to 3,610 in 2013. Among the casualties, 136 were fatal, 465 seriously injured and the remaining 3,009 slightly injured.
Table 2.19 reveals that, among the casualties in 2013, some 22.8% were passengers,
40.9% riders of auto/motor cycles, 17.1% pedestrians, 13.9% drivers and 5.3% pedal cyclists.
Compared to 2012, the number of persons who died as a result of road accidents
went down by 12.8%. The fatality rate, expressed as the number of persons who died as a result of road accidents per 100,000 mid-year population, decreased from 12.8 in 2012 to 11.2 in 2013. Out of the136 persons killed in road accidents during year 2013, the most vulnerable category of road users were pedestrians (47) followed by riders/pillion riders of motorised two-wheelers (42), (Table 2.24).
8. Hit and run cases of accidents causing casualties
In 2013, there were 192 "hit and run" cases causing casualties compared to 196 in 2012. Out of these 192 cases, 56.8% (109) involved vehicles only while the other 43.2% (83) involved both vehicles and pedestrians (Table 2.8).

- 11 -
2012 2013
Population (mid - year) 1,214,987 1,217,341
Area of Mauritius (sq km) 1,865 1,865
Length of roads (km) 2,170 2,275
Per Capita G.D.P at market prices (Rs)1 273,430 290,893 - Republic of Mauritius
2012 2013 % change
Vehicles on register 421,926 443,495 + 5.1
Motor cycle and auto cycle 173,508 180,785 + 4.2
Car and dual purpose vehicle 197,849 211,586 + 6.9
Other 50,569 51,124 + 1.1
Road Accidents 21,056 23,563 11.9
Number of non-injury accidents 18,466 20,985 13.6
Number of casualty accidents 2,590 2,578 - 0.5
Fatal accident 144 119 -17.4
Serious injury accident 455 389 - 14.5
Slight injury accident 1,991 2,070 + 4.0
Total casualties 3,653 3,610 - 1.2
Fatal 156 136 - 12.8
Seriously injured 549 465 - 15.3
Slightly injured 2,948 3,009 + 2.1
Motor vehicles involved in road accidents 40,759 41,888 + 2.8
Fatality rate
Rate per 1,000 registered motor vehicles 0.38 0.32 - 0.06
Rate per 100,000 population 12.84 11.17 - 1.7
Rate per 100 casualty accident 6.02 5.28 - 0.7
Rate per 100 casualties 4.27 3.77 - 0.5
¹ revised
2012 - 2013 (Island of Mauritius)
Main Road Transport and Road Accident Indicators,

PART I
VEHICLES
STATISTICS

Table 1.1 - Road network as at end of year, 2009 - 2013
MotorwaysMain roads
Secondary roads
Other roads
Total
2009 75 1,000 593 398 2,066 98 1.11 177
2010 75 1,014 593 398 2,080 98 1.12 185
2011 82 1,035 595 400 2,112 98 1.13 190
2012 2 86 1,068 608 408 2,170 98 1.16 194
2013 99 1,131 625 420 2,275 98 1.22 195
¹ density of total network in km per sq. km is the ratio of the total number of km of roads to the area of Mauritius (1,865 sq. km)2 revised
% of roads paved
Density¹ of total
network in km per sq km
Number of vehicles per km
of roadYear
Length of roads (km)
-15 -

Type of vehicle 2004 2005 2006 2007 2008 2009 2010 2011 2012 2013Car, dual purpose vehicle and double cab pickup1 118,009 126,844 135,132 144,405 155,528 165,036 175,634 185,357 197,849 211,586
Motor cycle and autocycle 129,500 133,430 138,174 142,606 147,988 152,935 159,329 165,706 173,508 180,785
Other 44,096 45,222 46,134 47,134 47,890 48,549 49,152 49,856 50,569 51,124
Total 291,605 305,496 319,440 334,145 351,406 366,520 384,115 400,919 421,926 443,495
1 New category of vehicle defined in Road Traffic Act as amended by Act No. 27 of 2012. Prior to the year 2013 'double cab pickup' was included in 'dual purpose vehicle'
0
50,000
100,000
150,000
200,000
250,000
300,000
350,000
400,000
450,000
2004 2005 2006 2007 2008 2009 2010 2011 2012 2013
Fig. 1.1 - Stock of registered vehicles, 2004 - 2013
Other Motor/autocycle Car, dual purpose vehicle and double cab pickup
-16 -

Table 1.2 - Vehicles¹ registered , 2004 - 2013Number
Type of vehicle 2004 2005 2006 2007 2008 2009 2010 2011 2012 2013
Car 77,342 84,818 91,911 99,770 109,507 117,890 127,363 136,225 147,733 160,701
(of which taxi car) (6,482) (6,798) (6,860) (6,885) (6,941) (6,921) (6,924) (6,907) (6,905) (6,915)
Dual purpose vehicle 40,667 42,026 43,221 44,635 46,021 47,146 48,271 49,132 50,116 49,730
Double cab pickup 2 - - - - - - - - - 1,155
Heavy motor car 1,020 1,045 1,118 1,223 1,290 1,275 1,249 1,230 1,244 1,250
Motor cycle 28,646 30,927 33,936 36,969 40,804 44,222 48,655 53,410 59,637 65,827
Auto cycle 100,854 102,503 104,238 105,637 107,184 108,713 110,674 112,296 113,871 114,958
Lorry and truck 11,774 12,047 12,272 12,536 12,726 12,950 13,186 13,539 13,902 14,061
Van 23,326 23,989 24,522 24,934 25,334 25,622 25,914 26,090 26,293 26,624
Bus 2,457 2,560 2,612 2,753 2,762 2,803 2,845 2,912 2,957 2,963
Tractor and dumper 2,935 2,982 3,001 3,025 3,045 3,102 3,119 3,173 3,202 3,226
Prime mover 388 412 436 452 505 558 596 650 689 715
Trailer 1,771 1,765 1,756 1,795 1,809 1,823 1,821 1,834 1,845 1,846
Road roller 99 96 96 96 96 97 98 99 101 102
Other 326 326 321 320 323 319 324 329 336 337
TOTAL 291,605 305,496 319,440 334,145 351,406 366,520 384,115 400,919 421,926 443,495
¹ Excluding pedal cycles, but including government vehicles.
2 New category of vehicle defined in Road Traffic Act as amended by Act No. 27 of 2012.
Prior to the year 2013 'double cab pickup' was included in 'dual purpose vehicle'
-17 -

- 18 -
Table 1.3 - New vehicles¹ registered, 2009 - 2013Number
Type of vehicle 2009 2010 2011 2012 2013
Car 3,524 4,828 5,970 7,207 6,651
Dual purpose vehicle 1,435 1,325 1,214 1,341 74
Double cab pickup 2 - - - - 1,079
Heavy motor car 38 18 27 28 25
Motor cycle 3,822 4,331 5,020 6,517 6,481
Auto cycle 2,874 3,019 2,944 2,942 2,444
Lorry and truck 202 261 245 334 209
Van 283 291 354 362 452
Bus 118 157 147 151 91
Tractor and dumper 92 66 73 57 59
Prime mover 21 6 17 15 11
Trailer 71 55 37 55 24
Road roller - 1 1 1 -
Other 3 2 9 8 11 7
Total 12,482 14,367 16,057 19,021 17,607
1 Includes government vehicles
2 New category of vehicle defined in Road Traffic Act as amended by Act No. 27 of 2012.
Prior to the year 2013 'double cab pickup' was included in 'dual purpose vehicle'
3 Includes, inter alia, tanker lorries, excavators and industrial tractors
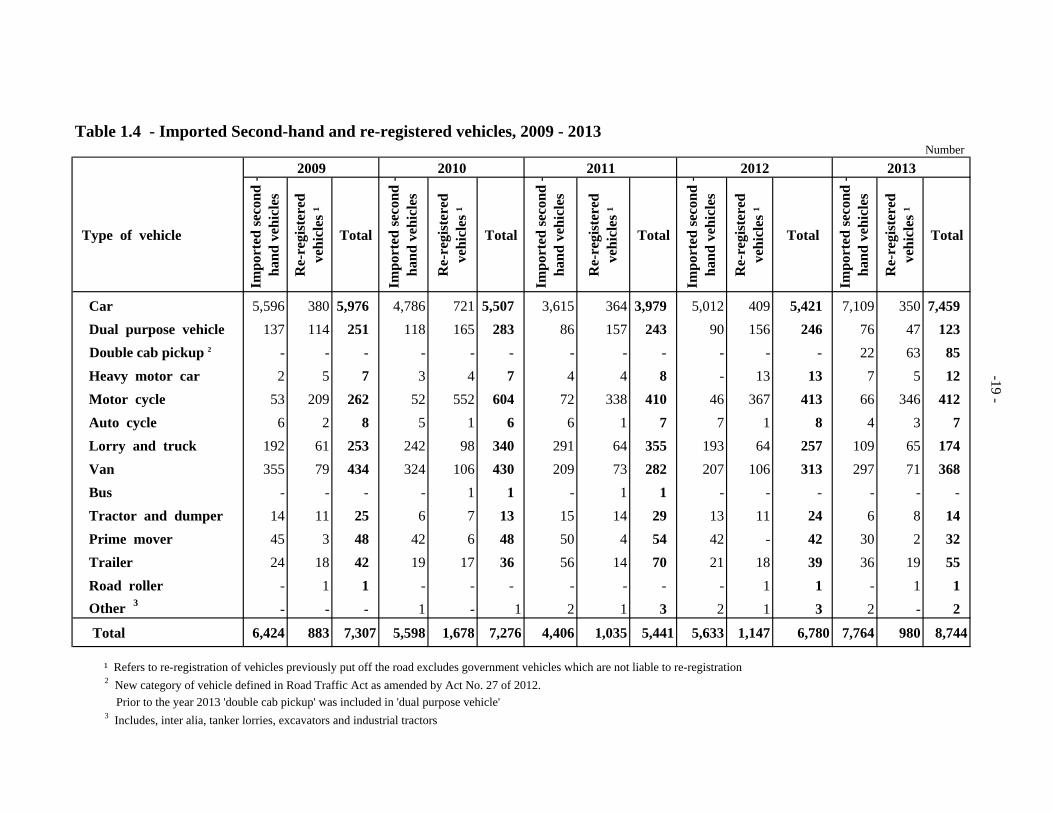
Table 1.4 - Imported Second-hand and re-registered vehicles, 2009 - 2013Number
Type of vehicle
Imp
orte
d s
econ
d -
han
d v
ehic
les
Re-
regi
ster
ed
veh
icle
s ¹
Total
Imp
orte
d s
econ
d -
han
d v
ehic
les
Re-
regi
ster
ed
veh
icle
s ¹
Total
Imp
orte
d s
econ
d -
han
d v
ehic
les
Re-
regi
ster
ed
veh
icle
s ¹
Total
Imp
orte
d s
econ
d -
han
d v
ehic
les
Re-
regi
ster
ed
veh
icle
s ¹
Total
Imp
orte
d s
econ
d -
han
d v
ehic
les
Re-
regi
ster
ed
veh
icle
s ¹
Total
Car 5,596 380 5,976 4,786 721 5,507 3,615 364 3,979 5,012 409 5,421 7,109 350 7,459
Dual purpose vehicle 137 114 251 118 165 283 86 157 243 90 156 246 76 47 123
Double cab pickup 2 - - - - - - - - - - - - 22 63 85
Heavy motor car 2 5 7 3 4 7 4 4 8 - 13 13 7 5 12
Motor cycle 53 209 262 52 552 604 72 338 410 46 367 413 66 346 412
Auto cycle 6 2 8 5 1 6 6 1 7 7 1 8 4 3 7
Lorry and truck 192 61 253 242 98 340 291 64 355 193 64 257 109 65 174
Van 355 79 434 324 106 430 209 73 282 207 106 313 297 71 368
Bus - - - - 1 1 - 1 1 - - - - - -
Tractor and dumper 14 11 25 6 7 13 15 14 29 13 11 24 6 8 14
Prime mover 45 3 48 42 6 48 50 4 54 42 - 42 30 2 32
Trailer 24 18 42 19 17 36 56 14 70 21 18 39 36 19 55
Road roller - 1 1 - - - - - - - 1 1 - 1 1
Other 3 - - - 1 - 1 2 1 3 2 1 3 2 - 2
Total 6,424 883 7,307 5,598 1,678 7,276 4,406 1,035 5,441 5,633 1,147 6,780 7,764 980 8,744
¹ Refers to re-registration of vehicles previously put off the road excludes government vehicles which are not liable to re-registration
2 New category of vehicle defined in Road Traffic Act as amended by Act No. 27 of 2012.
Prior to the year 2013 'double cab pickup' was included in 'dual purpose vehicle'
3 Includes, inter alia, tanker lorries, excavators and industrial tractors
201320122009 2010 2011
-19 -

- 20 -
Table 1.5 - Vehicles off the road¹, 2009 - 2013Number
Type of vehicle 2009 2010 2011 2012 2013
Car 1,117 862 1,087 1,120 1,142
Dual purpose vehicle 561 483 596 603 583
Double cab pickup 2 - - - - 9
Heavy motor car 60 51 54 27 31
Motor cycle 666 502 675 703 703
Auto cycle 1,353 1,064 1,329 1,375 1,364
Lorry and truck 231 365 247 228 224
Van 429 429 460 472 489
Bus 77 116 81 106 85
Tractor and dumper 60 62 48 52 49
Prime mover 16 16 17 18 17
Trailer 99 93 94 83 78
Road roller - - - - -
Other 3 6 4 6 7 8
Total 4,675 4,047 4,694 4,794 4,782
2 New category of vehicle defined in Road Traffic Act as amended by Act No. 27 of 2012.
Prior to the year 2013 'double cab pickup' was included in 'dual purpose vehicle'
3 Includes, inter alia, tanker lorries, excavators and industrial tractors
road again. Includes government vehicles which have been sold by auction.
1 A vehicle may be withdrawn from the register of vehicles (off the road) either temporarily or permanetly.
Any such vehicle (except a government vehicle) must register with the N.T.A before it is put on the
- 21 -
Age group 2012 2013
(Years) Number % Number %
5 86,914 43.9 92,976 43.9
510 47,220 23.9 52,389 24.8
1015 21,339 10.8 24,418 11.5
15 42,376 21.4 41,803 19.8
TOTAL 197,849 100.0 211,586 100.0
¹ New category of vehicle defined in Road Traffic Act as amended by Act No. 27 of 2012. Prior to the year 2013 'double cab pickup' was included in 'dual purpose vehicle'
( as at 31st December )
Table 1.6 - Age composition of cars, dual purpose vehicles and double cab pickup ¹ , 2012 - 2013
86,914
47,220
21,339
42,376
92,976
52,389
24,418
41,803
0
10,000
20,000
30,000
40,000
50,000
60,000
70,000
80,000
90,000
100,000
Num
ber
Age - group (years)
Fig. 1.2 - Age composition of cars, dual purpose vehicles and double cab pickup1 (as at 31st December)
2012 2013

- 22 -
Table 1.7 - Age composition of operational bus fleet ¹, 2012 - 2013
Number % Number %
5 556 29.5 602 31.2
510 689 36.6 686 35.5
1015 359 19.0 397 20.6
15 20 281 14.9 246 12.7
TOTAL 1,885 100.0 1,931 100.0
¹ Refers only to buses with a Road Service License, i.e, buses which operate on proclaimed routes and charge individual fares
Age group(Years)
(as at 31st December)
2012 2013
442
585 574
229
496 485
605
283
0
100
200
300
400
500
600
700
< 5 5 < 10 10 < 15 15 < 18
Nu
mb
er
Age group (Years)
Fig. 1.3 - Age composition of operational bus fleet vehicles (as at 31 st December)
2003 2004
556
689
359
281
602
686
397
246
0
100
200
300
400
500
600
700
800
< 5 5 < 10 10 < 15 15 < 20
Nu
mb
er
Age group (Years)
Fig. 1.3 - Age composition of operational bus fleet vehicles (as at 31st December)
2012
2013

Table 1.8 - Bus operational statistics¹, 2009 - 2013
Unit 2009 2010 2011 2012 2013 ²
Operational bus fleet (as at 30th June) Number 1,905 1,848 1,853 1,884 1,918
Total vehicle - journeys Thousand 4,823 4,899 4,905 4,900 4,959
Average vehicle - journeys per day " 8.4 8.8 8.8 8.7 8.6
Total vehicle - kilometres " 96,807 97,548 97,582 96,314 97,506
Average vehicle - kilometres per day " 169 176 176 170 169
Total gross receipts Rs Mn 2,169 2,219 2,239 2,247 2,266
Average gross receipts per day Rs '000 6,674 6,827 6,889 6,914 6,972
¹ refer only to buses with a Road Service Licence, i.e., buses which operate on proclaimed routes and charge individual
fares . Including data on special trips .
² provisional
-23 -

- 24 -
Table 1.9 - Evolution of bus fares (adults), 2002 - 2013Rupees
PeriodAug. 02 Oct. 04 May. 08 Dec. 10 Aug. 13
Stage
1 5.00 6.00 8.00 10.00 12.00
2 9.00 10.00 14.00 16.00 18.00
3 12.00 14.00 18.00 22.00 24.00
4 12.00 14.00 18.00 22.00 24.00
5 14.00 16.00 20.00 25.00 27.00
6 14.00 16.00 20.00 25.00 27.00
7 16.00 18.00 23.00 28.00 30.00
8 16.00 18.00 23.00 28.00 30.00
9 17.00 19.00 24.00 29.00 31.00
10 17.00 19.00 24.00 29.00 31.00
11 17.00 19.00 24.00 29.00 31.00
12 17.00 19.00 24.00 29.00 31.00
13 19.00 21.00 26.00 32.00 34.00
14 19.00 21.00 26.00 32.00 34.00
15 19.00 21.00 26.00 32.00 34.00
16 19.00 21.00 26.00 32.00 34.00
17 19.00 21.00 26.00 32.00 34.00
18 19.00 21.00 26.00 32.00 34.00
19 19.00 21.00 26.00 32.00 34.00
20 19.00 21.00 26.00 32.00 34.00
21 20.00 22.00 27.00 32.00 34.00
22 20.00 22.00 27.00 32.00 34.00
23 20.00 22.00 27.00 32.00 34.00
24 20.00 22.00 27.00 32.00 34.00
25 20.00 22.00 27.00 32.00 34.00
26 20.00 22.00 27.00 32.00 34.00
27 20.00 22.00 27.00 32.00 34.00
28 20.00 22.00 27.00 32.00 34.00
29 20.00 22.00 27.00 32.00 34.00
30 20.00 22.00 27.00 32.00 34.00
30 + 21.00 23.00 28.00 35.00 37.00

Table 1.10 - Receipts from the activities of the National Transport Authority, 2009 - 2013
Rs. '000
ActivityAs at end of December
2009 2010 2011 2012 2013¹
Issue of motor vehicle licences (Road tax) 1,050,847 1,106,398 1,154,699 1,210,757 1,290,830
Examination of vehicles 32,828 31,608 63,345 67,830 72,465
Issue of public service vehicle and carrier's licences 31,724 35,563 45,492 39,740 34,964
Registration of vehicles 67,869 65,370 83,503 94,246 96,598
Issue of special route permits 407 397 663 524 522
Issue of motor vehicles dealers and petrol service station licences
2,441 2,503 1,663 3,065 3,674
Total 1,186,116 1,241,839 1,349,365 1,416,162 1,499,053
¹ provisional
-25 -

Table 1.11 - Driving licences issued during the year by type of licence, 2004 - 2013Number
Type of Learner's licence Competent licence International
Licence First issue First issue Licence
Year Male Female Both Sexes Male Female Both Sexes Male Female Both Sexes
2004 7,019 6,065 13,084 11,212 2,595 13,807 4,126 903 5,029
2005 8,742 6,372 15,114 10,878 2,557 13,435 4,200 825 5,025
2006 9,809 7,317 17,126 11,212 2,465 13,677 4,200 1,014 5,214
2007 10,440 8,429 18,869 6,984 2,958 9,942 4,943 652 5,595
2008 10,434 8,817 19,251 7,575 3,297 10,872 4,526 1,542 6,068
2009 10,386 10,410 20,796 7,121 3,505 10,626 4,290 965 5,255
2010 9,587 6,036 15,623 7,762 3,816 11,578 4,073 1,078 5,151
2011 12,209 10,568 22,777 8,490 4,328 12,818 4,073 733 4,806
2012 11,980 9,509 21,489 7,477 4,697 12,174 2,905 1,453 4,358
2013 ¹ 9,919 7,173 17,092 8,152 4,647 12,799 3,235 1,330 4,565
¹ provisional
-26 -

Table 1.12 - Imports of vehicles and spare parts by country of origin, 2012 - 2013 C.I.F. Value Rs ' 000
2012 ¹ 2013 ²
Quantity Value Quantity Value
1 - Passenger motor cars France No. 154 52,245 51 19,357 - of engine capacity not India " 949 225,306 854 207,112 exceeding 1,250 c.c. Japan " 1,527 321,864 2,306 429,635
Korea Rep. " 564 144,832 525 139,767 Malaysia " 224 42,000 237 47,994 South Africa Rep. " 50 14,766 31 9,441 Spain " 17 6,153 41 9,746 Thailand " 162 54,195 239 69,548 Turkey " - - 100 30,703 Other Countries " 30 8,667 45 11,412
3,677 870,028 4,429 974,715 - of engine capacity exceeding China No. 51 11,585 28 8,465 1,250 c.c. but not exceeding France " 50 18,508 1 480 1,500 c.c. Germany " 55 21,511 71 25,620
India " 29 8,028 83 27,088 Indonesia " 10 3,661 67 24,626 Italy " 20 10,097 24 9,391 Japan " 3,531 968,060 4,886 1,118,781 Korea Rep. " 371 116,344 372 123,935 Malaysia " 56 14,109 3 794 South Africa Rep. " 34 11,727 32 11,953 Spain " 37 18,864 9 4,692 Thailand " 46 20,378 111 41,191 United Kingdom " 100 29,349 46 14,257 Other Countries " 7 4,080 19 7,545
4,397 1,256,301 5,752 1,418,818 ¹ revised
² provisional
Item Country of origin Unit
-27 -

Table 1.12 (cont'd) - Imports of vehicles and spare parts by country of origin, 2012 - 2013C.I.F. Value Rs ' 000
2012 ¹ 2013 ²Quantity Value Quantity Value
- of engine capacity exceeding Belgium No. 70 34,066 - -
1,500 c.c. but not exceeding China " 54 51,229 3 1,584
2,250 c.c. France " 287 167,901 253 137,229
Germany " 1,287 1,044,521 1,242 1,040,304
India " - - 93 35,915
Japan " 1,960 401,982 565 228,360
Korea Rep. " 1,116 454,460 770 339,232
Spain " 23 10,776 49 34,686
Thailand " 1 246 233 119,681
Turkey " 17 6,927 16 7,485
United Kingdom " 368 192,456 342 214,565
United States " 33 29,221 3 2,160
Other Countries " 44 24,695 36 25,010
5,260 2,418,480 3,605 2,186,211
- of engine capacity exceeding Germany No. 99 184,026 85 199,346
2,250 c.c. Japan " 42 29,588 22 14,666
Korea Rep. " 41 27,592 47 35,511
Slovakia (Slovak Rep.) " 11 14,271 - -
United Kingdom " 46 75,251 34 51,309
United States " 19 24,803 7 5,179
Other Countries " 3 4,161 6 5,753
261 359,692 201 311,764 ¹ revised ² provisional
Item Country of origin Unit
-28 -

Table 1.12 (cont'd) - Imports of vehicles and spare parts by country of origin, 2012 - 2013C.I.F. Value Rs ' 000
2012 ¹ 2013 ²
Quantity Value Quantity Value
- other, unspecified Germany No. 1 463 8 7,142
Japan " 342 123,183 522 149,388
United Kingdom " 38 13,727 16 9,017
381 137,373 546 165,547
2 - Trucks and lorries, trucks Argentina No. 29 20,673 53 41,041
of pick-up type, vans Belgium " - - 29 10,929
designed solely for the types China " 294 103,278 106 44,445
which are not derived solely France " 88 30,107 121 47,322
from ordinary passenger India " 57 21,629 16 6,479
motor-car Japan " 469 201,445 461 216,071
Korea Rep. " 102 33,523 115 43,326
South Africa Rep. " 818 485,243 886 520,323
Spain " - - 21 10,542
Thailand " 97 65,111 63 33,545
United Kingdom " 69 37,929 54 44,429
United States " - - 29 7,675
Other Countries " 5 2,275 12 11,516
2,028 1,001,213 1,966 1,037,643
¹ revised ² provisional
Item Country of origin Unit
-29 -

Table 1.12 (cont'd) - Imports of vehicles and spare parts by country of origin, 2012 - 2013C.I.F. Value Rs ' 000
2012 ¹ 2013 ²
Quantity Value Quantity Value
3 - Public service type passenger China No. 42 46,728 32 19,764
motor vehicle India " 2 5,120 38 32,132
Japan " 633 414,049 365 218,194
Korea Rep. " 33 30,976 11 8,112
Pakistan " 2 2,937 3 3,882
Other countries " 4 3,735 2 1,191
716 503,545 451 283,275
4 - Road tractors for semi-trailers France No. 8 19,513 8 25,434
Italy " 3 3,350 - -
Japan " 5 10,483 2 3,947
Korea Rep. " 3 5,805 - -
United Kingdom " 17 27,980 20 40,700
Other countries " 2 3,362 - -
38 70,493 30 70,081
5 - Dumpers Germany " 3 3,974 3 3,974
Spain " - - 1 426
United Kingdom " 10 6,966 2 1,316
13 10,940 6 5,716
¹ revised
² provisional
Item Country of origin Unit
-30 -

Table 1.12 (cont'd) - Imports of vehicles and spare parts by country of origin, 2012 - 2013
C.I.F. Value Rs ' 000
2012 ¹ 2013 ²
Quantity Value Quantity Value
6 - Other motor vehicles for the
transport of goods or materials
- of an engine capacity exceeding China No. 13 2,645 8 1,644
1,600 c.c. but not exceeding Japan " 6 2,184 36 8,620
2,250 c.c. 19 4,829 44 10,264
- of an engine capacity exceeding Japan No. 54 17,736 68 18,423
2,250 c.c. United Kingdom " 3 972 3 855
57 18,708 71 19,278
¹ revised ² provisional
Item Country of origin Unit
-31 -

Table 1.12 (cont'd) - Imports of vehicles and spare parts by country of origin, 2012 - 2013
C.I.F. Value Rs ' 000
2012 ¹ 2013²
Quantity Value Quantity Value
7 - Special purpose motor vehicles Brazil No. 4 5,944 4 4,953
and vans China " 176 31,291 247 17,922
France " 57 150,226 13 27,351
Italy " 22 41,907 11 23,814
Japan " 93 70,969 49 42,419
South Africa Rep. " 4 9,126 2 4,145
United Kingdom " 65 101,772 41 67,621
United States"
3 21,574 30 7,274
Other countries " 14 41,736 8 45,408
438 474,545 405 240,907
¹ revised ² provisional
Item Country of origin Unit
-32-

Table 1.12 (cont'd) - Imports of vehicles and spare parts by country of origin, 2012 - 2013C.I.F. Value Rs ' 000
2012 ¹ 2013 ²
Quantity Value Quantity Value
8 - Motor cycles, scooters and Austria No. 6 1,262 7 1,022
auto cycles Brazil " 26 1,621 2 78
China " 9,870 203,631 9,152 200,985
France " 3 239 41 990
India " 453 15,156 957 38,919
Italy " 64 4,997 39 2,953
Japan " 97 12,312 71 5,138
Pakistan " 21 320 - -
Spain " 126 5,213 27 1,579
Taiwan " 125 5,503 155 6,508
Thailand " 45 2,383 6 278
Turkey " 50 1,093 50 1,139
United States " 31 10,567 14 4,747
Other countries " 14 1,011 11 1,006
10,931 265,308 10,532 265,342
9 - Cycles not motorised China No. 47,322 57,306 32,168 40,935
France " 317 1,200 254 1,538
Netherlands " 449 2,826 589 2,381 South Africa Rep. " 1,887 1,887 133 1,187
Taiwan " 1,230 6,903 1,203 7,330
Other countries " 443 2,261 404 2,508
51,648 72,383 34,751 55,879 ¹ revised ² provisional
Item Country of origin Unit
-33 -

Table 1.12 (cont'd) - Imports of vehicles and spare parts by country of origin, 2012- 2013C.I.F. Value Rs ' 000
2012 ¹ 2013 ²
Quantity Value Quantity Value
10 - Chassis fitted with engines China No. 11 19,650 8 9,733 for tractors, and for motor India " 42 37,015 16 10,650 vehicles Japan " 98 124,140 33 44,368
Pakistan " 9 12,869 6 9,293 Other countries " 38 52,853 3 5,445
198 246,527 66 79,489
China M/ton 621 76,308 864 111,718
11 - Parts and accessories for France " 92 35,159 58 33,257 tractors and for motor Germany " 99 69,059 88 74,020 vehicles India " 73 23,758 102 23,866
Italy " 41 16,771 34 19,852 Japan " 515 151,587 734 186,860 Korea Rep. " 42 20,204 89 32,168 Malaysia " 129 23,040 119 20,700 Singapore " 27 5,715 30 6,762 South Africa Rep. " 35 18,489 42 24,430 Taiwan " 68 18,299 73 20,641 Thailand " 146 45,450 124 37,619 Turkey " 39 10,969 28 11,239 United Kingdom " 252 43,515 230 43,190 Other countries " 110 50,007 117 64,241
2,289 608,330 2,732 710,563
¹ revised
² provisional
Item Country of origin Unit
-34 -
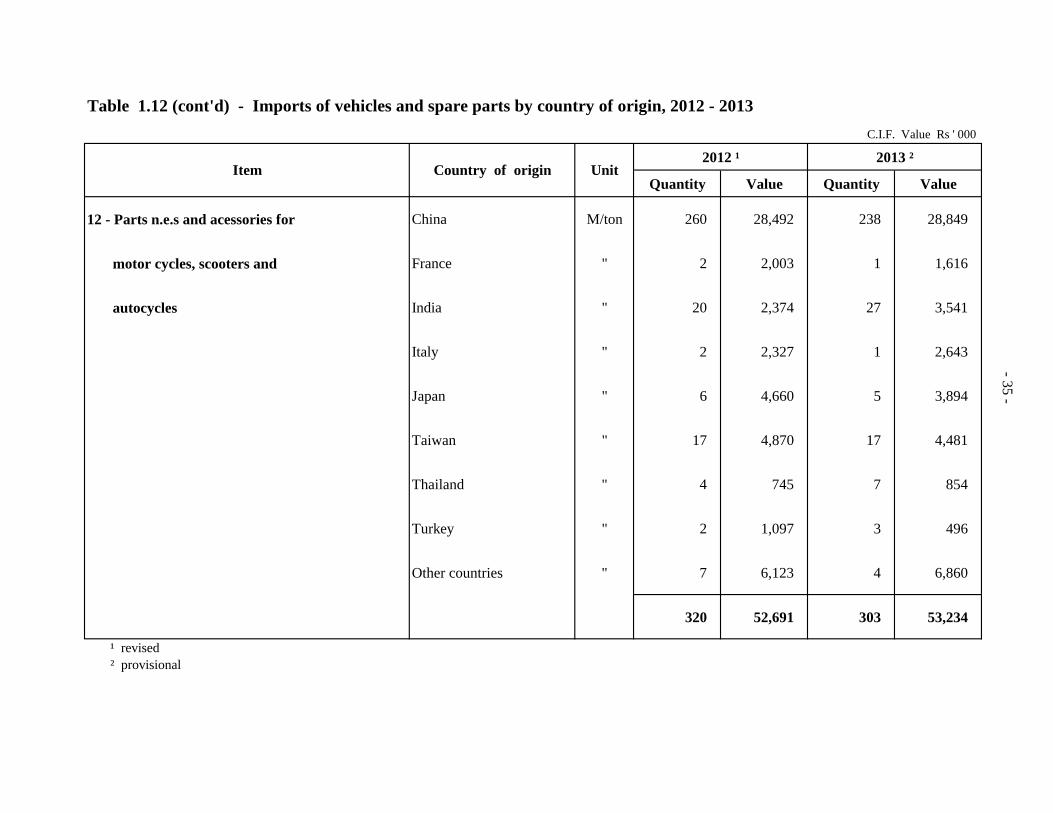
Table 1.12 (cont'd) - Imports of vehicles and spare parts by country of origin, 2012 - 2013
C.I.F. Value Rs ' 000
2012 ¹ 2013 ²
Quantity Value Quantity Value
12 - Parts n.e.s and acessories for China M/ton 260 28,492 238 28,849
motor cycles, scooters and France " 2 2,003 1 1,616
autocycles India " 20 2,374 27 3,541
Italy " 2 2,327 1 2,643
Japan " 6 4,660 5 3,894
Taiwan " 17 4,870 17 4,481
Thailand " 4 745 7 854
Turkey " 2 1,097 3 496
Other countries " 7 6,123 4 6,860
320 52,691 303 53,234
¹ revised ² provisional
Item Country of origin Unit
-35 -

PART II
ROAD
ACCIDENTS

Table 2.1 - Road traffic accidents¹ and casualties, 2004 - 2013
2004 2005 2006 2007 2008 2009 2010 2011 2012 2013
1. Road traffic accidents :Number 19,495 22,554 20,242 20,519 20,873 19,542 21,243 22,387 21,056 23,563Rate per 100,000 population 1,647 1,895 1,693 1,709 1,732 1,618 1,755 1,847 1,733 1,936Rate per 1,000 registered motor vehicles 69 76 65 63 61 54 57 57 51 55
2. Motor vehicle involved :Number 35,506 43,741 40,023 41,178 42,910 38,058 41,084 41,294 40,759 41,888
Rate per 1,000 registered motor vehicles2 125 147 128 126 125 106 110 105 99 97 3. Casualties :
Total number of casualties 2,951 2,760 2,522 3,055 3,435 3,661 3,640 3,422 3,653 3,610 of which
Fatal 3 144 136 134 140 168 140 158 152 156 136 Seriously injured 245 358 348 500 512 516 569 487 549 465
Slightly injured 2,562 2,266 2,040 2,415 2,755 3,005 2,913 2,783 2,948 3,009
4. Fatality : Rate per 100,000 population 12.2 11.4 11.2 11.7 13.9 11.6 13.1 12.5 12.8 11.2
Rate per 1,000 registered motor vehicles 0.5 0.4 0.4 0.4 0.5 0.4 0.4 0.4 0.4 0.3
Fatality index 4 4.9 4.9 5.3 4.6 4.9 3.8 4.3 4.4 4.3 3.8
¹ Exclude accidents involving bicycles only or bicycle and pedestrian. 2 Revised
3 As from 2002, figures are based on definition of fatal accidents where deaths occurred within 30 days as a result of road accidents. 4 Fatality index is the number of fatalities per 100 casualties.
Note: Indicators based on population figures have been revised in light of results obtained from the Population Census conducted in 2011.
-39 -

vehicles acccident2004 291,605 19,4952005 305496 225542006 319,440 202422007 334,154 205192008 351,406 208732009 366,520 195422010 384,115 212432011 400,919 223872012 421,926 210562013 443,495 23563
-40 -
0
5,000
10,000
15,000
20,000
25,000
0
50,000
100,000
150,000
200,000
250,000
300,000
350,000
400,000
450,000
500,000
2004 2005 2006 2007 2008 2009 2010 2011 2012 2013
Nu
mb
er o
f ac
cid
ents
Nu
mb
er o
f ve
hic
les
Year
Figure 2.1 - Number of vehicles registered and road accidents, 2004 -2013
vehicles acccident

- 41 -
Table 2.2 - Road traffic accidents, motor-vehicles involved and casualties, 2009 - 2013
2009 19,542 2,480 17,062 3,661 38,058 1,207,842 358,690
2010 21,243 2,549 18,694 3,640 41,084 1,210,391 374,547
2011 22,387 2,404 19,983 3,422 41,294 1,211,970 392,276
2012 21,056 2,590 18,466 3,653 40,759 1,214,987 411,527
2013 23,563 2,578 20,985 3,610 41,888 1,217,341 432,331
Table 2.3 - Number of casualties by degree of casualty and casualty rate, 2009- 2013
2009 140 516 3,005 3,661 1.5 303 10
2010 158 569 2,913 3,640 1.4 301 10
2011 152 487 2,783 3,422 1.4 282 9
2012 156 549 2,948 3,653 1.4 301 9
2013 136 465 3,009 3,610 1.4 297 8
Year Casualties
Motor vehicles
registered (mid-year)
Population (mid-year)
Per 1,000 Motor-vehicles
Degree of casualty
Casualty accidents
Non-injury
accidents
Motor Vehicles involved
Accidents
Per 100,000population
Casualty rate
YearFatal
Seriouslyinjured
Slightly injured
Totalcasualties
Per casualty accident

Table 2.4 - Casualty accidents, pedestrian and rider (auto/motor) casualties by police district, 2012 - 2013
2012 2013 2012 2013 2012 2013 2012 2013 2012 2013
Port Louis (South) 267 232 61 46 143 146 68 118 272 310
Port Louis (North) 364 248 112 85 221 276 185 141 518 502
Pamplemousses/Rivière du Rempart 451 652 99 94 338 351 361 321 798 766
Moka/Flacq 414 434 102 96 227 224 282 272 611 592
Grand Port/Savanne 349 319 69 89 132 143 316 233 517 465
Upper Plaines Wilhems 344 203 104 59 85 82 134 132 323 273
Plaines Wilhems/Black River 401 490 105 148 240 255 269 299 614 702
Whole Island 2,590 2,578 652 617 1,386 1,477 1,615 1,516 3,653 3,610
Police District
Casualties
PedestrianRider (auto/moto
cycle)Other Total
Casualty accidents
-42 -
-42 -
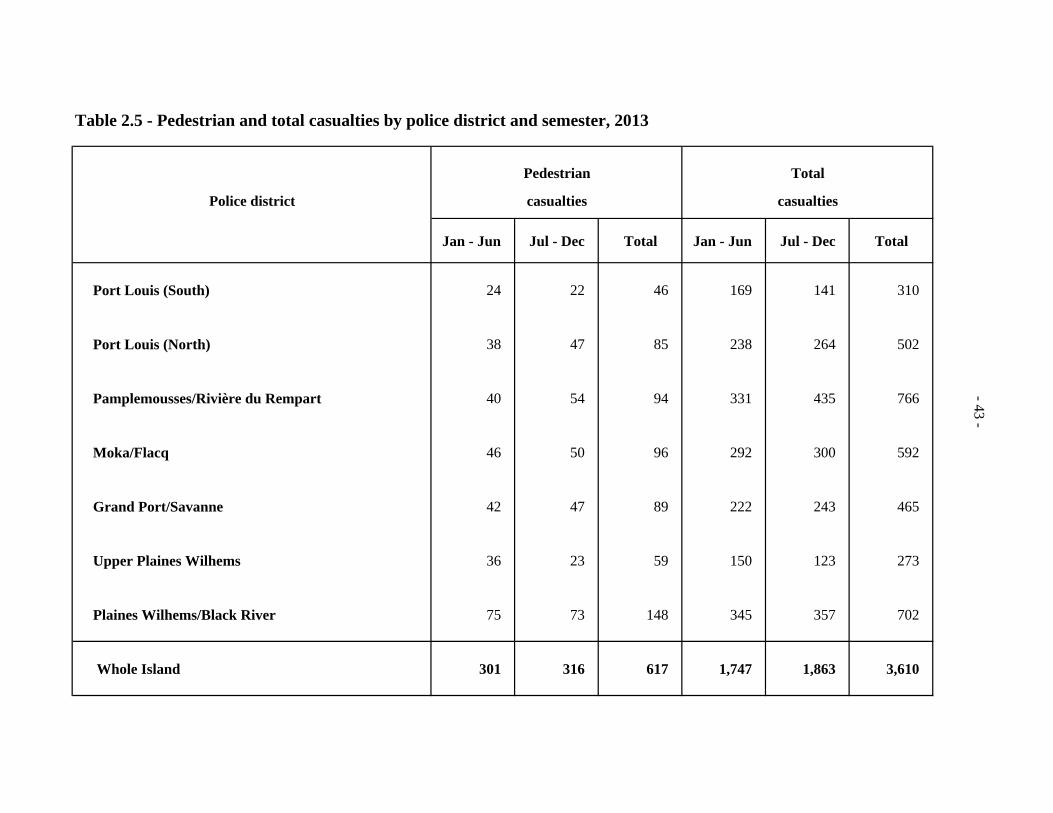
Table 2.5 - Pedestrian and total casualties by police district and semester, 2013
Pedestrian Total
Police district casualties casualties
Jan - Jun Jul - Dec Total Jan - Jun Jul - Dec Total
Port Louis (South) 24 22 46 169 141 310
Port Louis (North) 38 47 85 238 264 502
Pamplemousses/Rivière du Rempart 40 54 94 331 435 766
Moka/Flacq 46 50 96 292 300 592
Grand Port/Savanne 42 47 89 222 243 465
Upper Plaines Wilhems 36 23 59 150 123 273
Plaines Wilhems/Black River 75 73 148 345 357 702
Whole Island 301 316 617 1,747 1,863 3,610
-43 -
-43 -

Table 2.6 - Distribution of casualty accidents by day of week and time, 2013
Day
Monday Tuesday Wednesday Thursday Friday Saturday Sunday Total Time (Hour)
0 - 1 5 7 6 3 5 6 11 43 1 - 2 3 3 3 2 1 7 13 32 2 - 3 - 3 - 1 - 2 3 9 3 - 4 2 3 - 3 1 6 10 25 4 - 5 2 1 - 1 2 4 7 17 5 - 6 3 5 4 6 8 7 11 44 6 - 7 11 15 15 19 17 12 10 99 7 - 8 34 19 13 17 22 10 17 132 8 - 9 22 22 26 28 17 12 14 141 9 - 10 16 12 10 13 17 20 10 98
10 - 11 14 11 7 12 14 20 12 90 11 - 12 19 19 17 23 20 23 19 140 12 - 13 14 12 8 15 17 21 16 103 13 - 14 20 26 17 11 27 32 28 161 14 - 15 18 24 24 17 21 22 17 143 15 - 16 25 31 26 26 14 31 26 179 16 - 17 29 26 27 29 41 22 24 198 17 - 18 30 27 28 31 29 32 22 199 18 - 19 28 32 17 21 30 35 26 189 19 - 20 20 21 20 25 26 31 23 166 20 - 21 15 22 11 14 17 17 23 119 21 - 22 11 11 9 19 16 18 19 103 22 - 23 6 7 12 9 17 22 15 88 23 - 24 4 5 7 5 6 17 16 60
Total 351 364 307 350 385 429 392 2,578
-44 -

- 45 -
351364
307
350
385
429
392
0
50
100
150
200
250
300
350
400
450
500
Mon Tue Wed Thu Fri Sat Sun
Nu
mbe
r
Day of week
Fig. 2.2 - Number of casualty accidents by day of week, 2013
43
32
9
2517
44
99
132
141
9890
140
103
161
143
179
198 199
189
166
119
103
88
60
0
50
100
150
200
250
0 -
1
2 -
3
4 -
5
6 -
7
8 -
9
10 -
11
12 -
13
14 -
15
16 -
17
18 -
19
20 -
21
22 -
23
Num
ber
Time (Hour)
Fig. 2.3 - Number of casualty accidents by time of day, 2013

- 46 -
Table 2.7 - Number of accidents by severity of accident, 2009 - 2013
Year
Slight No injury
2009 1,946 17,062
2010 1,911 18,694
2011 1,865 19,983
2012 1,991 18,466
2013 2,070 20,985
¹ prior to 2002, a fatal accident was defined as an accident where deaths occurred within 7 days. As from 2002, a fatal
accident is defined as an accident where deaths occurred within 30 days.
Table 2.8 - Number of casualty accidents involved in "hit and run" cases by semester, 2012- 2013
Year
Accident Jan. - Jun. Jul. - Dec. Total % Jan. - Jun. Jul. - Dec. Total %
38 55 93 47.4 38 45 83 43.2
Vehicles v/s vehicles 50 53 103 52.6 52 57 109 56.8
Total 88 108 196 100.0 90 102 192 100.0
Vehicles v/s pedestrian
2012
119
129
132
405
487
2013
Serious
22,387
21,056
23,563
144
407
455
389
Severity of accident
Total
19,542
21,243
Fatal ¹
151

Table 2.9 - Number of casualty accidents by severity of accident and police district, 2012 - 2013Number
Fatal Serious Slight Total Fatal Serious Slight Total
Port Louis (South) 9 45 213 267 12 26 194 232
Port Louis (North) 30 54 280 364 4 36 208 248
Pamplemousses /Riviere-Du-Rempart 21 105 325 451 28 85 539 652
Moka/Flacq 22 48 344 414 16 54 364 434
Grand-Port/Savanne 17 59 273 349 29 58 232 319
Upper Plaine -Wilhems 22 78 244 344 8 21 174 203
Plaine - Wilhems/Black- River 23 66 312 401 22 109 359 490
Total 144 455 1,991 2,590 119 389 2,070 2,578
2012 2013
Severity of accident Severity of accident Police district
-47 -

Table 2.10 - Number of casualty accidents by severity of accident and weather conditions, 2012 - 2013Number
2012 2013
Fatal Serious Slight Total Fatal Serious Slight Total
Fine 120 406 1,795 2,321 104 339 1,867 2,310
Rainy 23 47 189 259 14 45 200 259
Foggy/misty 1 1 7 9 - 5 3 8
Other - 1 - 1 1 - - 1
Total 144 455 1,991 2,590 119 389 2,070 2,578
Severity of accident Severity of accidentWeather conditions
-48 -

Table 2.11 - Number of casualty accidents by severity of accident and light conditions, 2012 - 2013Number
Fatal Serious Slight Total Fatal Serious Slight Total
Day light 75 310 1,448 1,833 60 277 1,474 1,811
Dark - no street lighting 18 28 84 130 16 23 120 159
Dark - street lighting on 48 106 428 582 36 79 443 558
Dark -street lighting off 3 11 31 45 7 10 32 49
Not specified - - - - - - 1 1
Total 144 455 1,991 2,590 119 389 2,070 2,578
Light conditions
2012 2013
Severity of accident Severity of accident
-49-
-49-
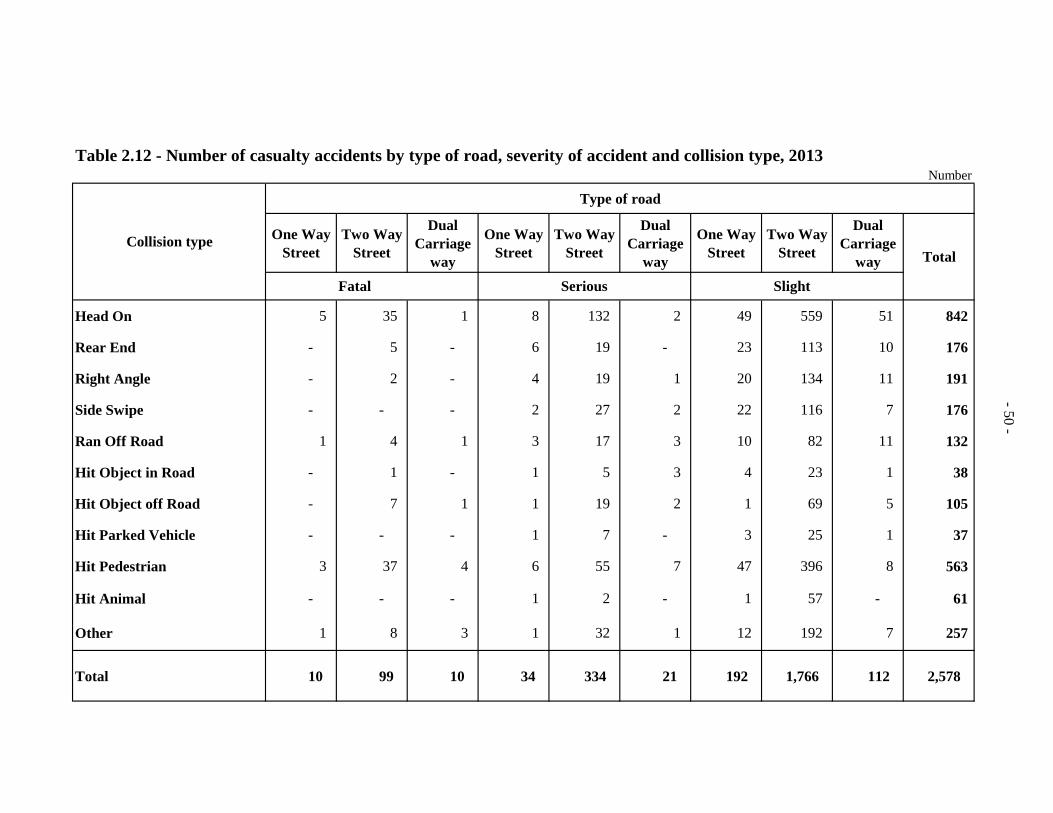
Table 2.12 - Number of casualty accidents by type of road, severity of accident and collision type, 2013Number
Type of road
One Way Street
Two Way Street
Dual Carriage
way
One Way Street
Two Way Street
Dual Carriage
way
One Way Street
Two Way Street
Dual Carriage
way
Head On 5 35 1 8 132 2 49 559 51 842
Rear End - 5 - 6 19 - 23 113 10 176
Right Angle - 2 - 4 19 1 20 134 11 191
Side Swipe - - - 2 27 2 22 116 7 176
Ran Off Road 1 4 1 3 17 3 10 82 11 132
Hit Object in Road - 1 - 1 5 3 4 23 1 38
Hit Object off Road - 7 1 1 19 2 1 69 5 105
Hit Parked Vehicle - - - 1 7 - 3 25 1 37
Hit Pedestrian 3 37 4 6 55 7 47 396 8 563
Hit Animal - - - 1 2 - 1 57 - 61
Other 1 8 3 1 32 1 12 192 7 257
Total 10 99 10 34 334 21 192 1,766 112 2,578
Collision typeTotal
Fatal Serious Slight
-50 -
-50 -
-50 -

Table 2.13 - Number of casualty accidents by severity of accident and type of road, 2012 - 2013Number
2012 2013
Type of roadLength of
Severity of accident Length of
Severity of accident
roads (kms) Fatal Serious Slight Total
roads (kms) Fatal Serious Slight Total
Motor-way 86 11 30 118 159 99 10 21 112 143
Main road 1,068 112 397 1,597 2,106 1,131 97 334 1,709 2,140
Secondary road 608 17 22 245 284 625 9 26 212 247
Other road 408 4 6 31 41 420 3 8 37 48
Total 2,170 144 455 1,991 2,590 2,275 119 389 2,070 2,578
-51 -
-51 -

Table 2.14 - Number of casualty accidents by degree of casualties and junction type, 2014
Number
Fatal Serious Slight Total
Not a Junction 94 249 1,390 1,733
Crossroads 4 60 260 324
T - Junction 9 56 263 328
Staggered - Junction 4 3 14 21
Y - Junction 2 2 23 27
Roundabout 4 10 87 101
Slip Road 2 2 18 22
Private Entrance - 7 15 22
Total 119 389 2,070 2,578
Junction type
2013
Degree of casualties
-52-

- 53 -Table 2.15 - Number of vehicles¹ involved in casualty accidents by type, 2012 - 2013
Private car 1,369 33.4 1,216 29.9
Taxi car 61 1.5 63 1.6
Bus 256 6.3 231 5.7
Lorry 92 2.2 78 1.9
Van 245 6.0 210 5.2
Motor/Auto cycle 1,569 38.3 1,669 41.0
Pedal cycle 192 4.7 201 4.9
Other motor vehicle 312 7.6 399 9.8
Other non-motor vehicle 0 0.0 0 0.0
All vehicles 4,096 100.0 4,067 100.0
¹ only three main vehicles have been considered in accidents involving more than three vehicles.
Type of vehicle
% %
Number of vehicles
Number of vehicles
2012 2013
Private car29.9%
Taxi car1.6%
Bus5.7%
Lorry1.9%
Van5.2%
Motor/Auto cycle41.0%
Other14.8%
Fig. 2.4 - Vehicles involved in casualty accidents by type of vehicle, 2013

Table 2.16 - Number of motor-vehicles 1 involved in casualty accidents by type of vehicle and nature of damage, 2013
Private car 242 835 258 1,335
Taxi car 11 45 7 63
Bus 25 132 71 228
Lorry 14 30 34 78
Van 37 120 48 205
Motor/Auto cycle 513 998 136 1,647
Other motor-vehicle 25 107 42 174
All vehicles 867 2,267 596 3,730
1 only three main vehicles have been considered in accidents involving more than three vehicles.
Total
Note: as from August 2004, most non-injury road traffic accidents are not reported to the police, but only to insurance companies. Consequently, disaggregated data on non-injury accidents by type of vehicle and nature of damage are not available .
Type of vehicle
2013
Seriouslydamaged
Slightlydamaged
No damage
-54 -

Age - group Drivers Riders Total
(years) Male Female Total Male Female Total Male Female Total
15 - 18 3 - 3 87 1 88 90 1 91
19 - 24 176 18 194 416 3 419 592 21 613
25 - 34 472 62 534 500 10 510 972 72 1,044
35 - 44 532 58 590 250 3 253 782 61 843
45 - 54 428 28 456 192 3 195 620 31 651
55 - 60 152 10 162 88 - 88 240 10 250
0ver 60 133 15 148 95 1 96 228 16 244
All ages 1,896 191 2,087 1,628 21 1,649 3,524 212 3,736
1 excluding drivers and riders involved in hit and run cases.
Table 2.17 - Number of drivers and riders¹ involved in casualty accidents by age-group and sex, 2013
Note: as from August 2004, most non-injury road traffic accidents are not reported to the police, but only to insurance companies. Consequently, disaggregated data on non-injury accidents by age group and sex are not available.
-55 -
-55 -

Table 2.18 - Number of drivers/riders1 involved in casualty accidents by driving experience and sex, 2013
Male Female Total
No licence 76 1 77
Learner driver's licence 863 17 880
Full licence 2,585 194 2,779
All categories 3,524 212 3,736
1 excluding drivers and riders involved in hit and run agreement cases
Driving experience
2013
Number of drivers/riders
Note: as from August 2004, most non-injury road traffic accidents are not reported to the police, but only to insurance companies. Consequently, disaggregated data on non-injury accidents by age group and sex are not available.
-56 -

- 57 -
Table 2.19 - Number of casualties by class of road users, 2012- 2013
Class of 2012 1 2013
Road users Number % Number %
Pedestrian 652 17.8 617 17.1
Passenger 854 23.4 827 22.9
Driver 590 16.2 499 13.8
Rider (auto/motor cycle) 1,374 37.6 1,477 40.9
Pedal cyclist 183 5.0 190 5.3
All road users 3,653 100.0 3,610 100.0
1 Revised
Pedestrian17.1%
Passenger22.9%
Driver13.8%
Rider(Auto/M cycle)
40.9%
Pedal cyclist5.3%
Fig. 2.5 - Casualties by class of road users, 2013

Table 2.20 - Number of casualties by degree of casualty and class of road users, 2012- 2013
Degree of casualty Degree of casualty
Pedestrian 44 103 505 652 17.8 47 68 502 617 17.1
Passenger 26 110 718 854 23.4 32 82 713 827 22.9
Driver 12 82 496 590 16.2 6 63 430 499 13.8
Rider ( auto / m - cycle ) 65 226 1,083 1,374 37.6 38 229 1,210 1,477 40.9
Pedal cyclist 9 28 146 183 5.0 13 23 154 190 5.3
All road users 156 549 2,948 3,653 100.0 136 465 3,009 3,610 100.0
Fatal Seriously injured
Slightly injured
Total %
2012 2013
Class of Road users
Fatal Seriously injured
Slightly injured
Total %
-58 -
-58 -

Table 2.21 - Number of casualties by class of road users, age-group and sex, 2013Number
Male Female Total Male Female Total Male Female Total Male Female Total
Under 5 11 2 13 8 4 12 1 - 1 20 6 26
5 - 14 43 37 80 42 33 75 24 - 24 109 70 179
15 - 29 72 66 138 192 153 345 885 25 910 1,149 244 1,393
30 - 44 66 47 113 97 106 203 637 38 675 800 191 991
45 - 59 85 54 139 67 83 150 388 16 404 540 153 693
60 - 69 41 47 88 17 14 31 118 1 119 176 62 238
Over 69 20 26 46 3 8 11 32 1 33 55 35 90
All ages 338 279 617 426 401 827 2,085 81 2,166 2,849 761 3,610
Age-group (years)
Road Users
Pedestrian Passenger Driver/Rider/Cyclist Total Casualties
-59 -
-59 -
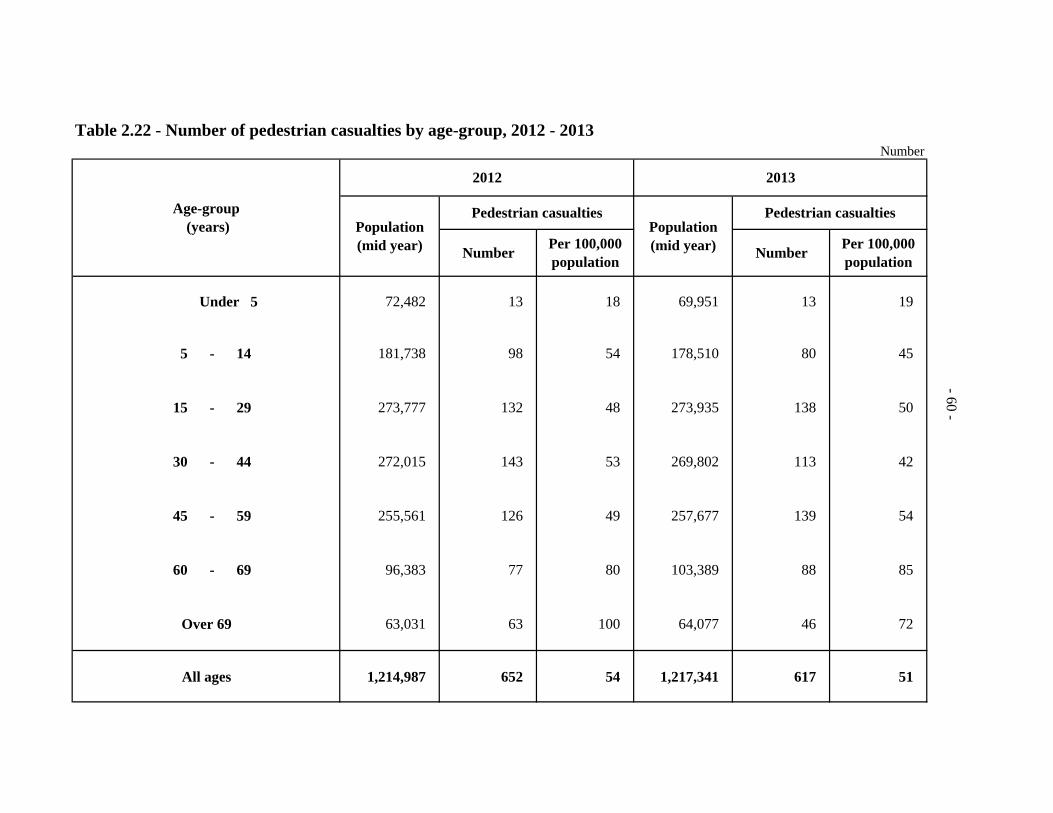
Table 2.22 - Number of pedestrian casualties by age-group, 2012 - 2013Number
Under 5 72,482 13 18 69,951 13 19
5 - 14 181,738 98 54 178,510 80 45
15 - 29 273,777 132 48 273,935 138 50
30 - 44 272,015 143 53 269,802 113 42
45 - 59 255,561 126 49 257,677 139 54
60 - 69 96,383 77 80 103,389 88 85
Over 69 63,031 63 100 64,077 46 72
All ages 1,214,987 652 54 1,217,341 617 51
Age-group (years) Population
(mid year) NumberPer 100,000population
Pedestrian casualties
2012
Population(mid year) Number
Per 100,000population
Pedestrian casualties
2013
-60 -
-60 -
-60 -

Table 2.23 - Number of fatalities by class of road users, age-group and sex, 2013Number
Male Female Total Male Female Total Male Female Total Male Female Total
Under 5 - - - - 1 1 - - - - 1 1
5 - 14 - - - 1 2 3 1 - 1 2 2 4
15 - 29 - - - 7 4 11 24 1 25 31 5 36
30 - 44 2 2 4 4 2 6 17 - 17 23 4 27
45 - 59 14 1 15 6 3 9 10 - 10 30 4 34
60 - 69 11 6 17 - - - 4 - 4 15 6 21
Over 69 4 7 11 1 1 2 - - - 5 8 13
All ages 31 16 47 19 13 32 56 1 57 106 30 136
Age-group (years)
Road Users
Pedestrian Passenger Driver/Rider/Cyclist Total Casualties
-61 -
-61 -

- 62 -
Table 2.24 - Fatalities by category of road users, 2012 - 2013
Number % Number %
Drivers of four wheeled vehicles 12 7.7 6 4.4
Passengers of four wheeled vehicles 21 13.4 27 19.9
Riders / pillion riders of motorised two - wheelers 70 44.9 43 31.6
Cyclists 9 5.8 13 9.6
Pedestrians 44 28.2 47 34.6
All road users 156 99.9 136 100.0
2012 2013
Fatalities
Category of road users
12
21
70
9
44
6
27
43
13
47
0
10
20
30
40
50
60
70
80
Drivers of fourwheeled vehicles
Passengers of fourwheeled vehicles
Riders / pillionriders of
motorised two ‐wheelers
Cyclists Pedestrians
Fig. 2.6 - Fatalities by category of road users, 2012 - 2013
2012 2013

Tab 2.25 - Number of fatalities by Police district and class of road users, 2012 - 2013Number
Pedestrian Passengers Drivers RidersPedal
Cyclist
All Road Users
Pedestrian Passengers Drivers RidersPedal
Cyclist
All Road Users
Port Louis (South) 2 1 2 5 - 10 6 10 1 3 2 22
Port Louis (North) 14 4 - 12 - 30 3 1 - 4 1 9
Pamplemousses/Riviere Du Rempart
4 4 1 15 2 26 8 3 1 10 1 23
Moka/Flacq 4 2 2 17 - 25 4 7 1 6 3 21
Grand-Port/Savanne 5 4 2 5 2 18 14 4 - 7 4 29
Upper Plaine -Wilhems 7 3 4 4 2 20 3 2 1 2 - 8
Plaine -Wilhems/Black-River 8 3 1 12 3 27 9 5 2 6 2 24
Total 44 21 12 70 9 156 47 32 6 38 13 136
Police district
2012 2013
Class of road users Class of road users
-63 -
PART III
PETROLEUM
PRODUCTS

- 67 -
Table 3.1 - Evolution of price and sales of gasolene and gas oil, 2010 - 2013
6-Jan-2010 40.40 32.65
4-Feb-2010 43.40 32.65
3-Mar-2010 43.40 34.40
3-Apr-2010 46.65 34.40
8-May-2010 43.15 36.95
3-Jun-2010 46.35 39.70
3-Jul-2010 42.90 36.75
4-Aug-2010 46.10 34.00
3-Sep-2010 42.65 35.50
5-Oct-2010 44.70 35.50
22-Jan-2011 48.50 39.90
14-Mar-2011 51.30 43.50
29-Mar-2011 49.30 41.20
27-Dec-2011 49.30 41.20
3-Feb-2012 49.30 41.20
2-Mar-2012 49.30 41.20
6-Apr-2012 49.30 41.20
8-Jun-2012 49.30 41.20
7-Jul-2012 49.30 41.20
1-Mar-2013 52.25 43.95
12-Apr-2013 52.25 43.95
5-Jul-2013 52.25 43.95
8-Aug-2013 52.25 43.95
4-Oct-2013 52.25 43.95
31-Oct-2013 52.25 43.95
6-Dec-2013 52.25 43.95
161,142 226,677
2011 166,889 222,981
2010
2013 179,834 219,731
2012 172,154 226,494
Year
Gasolene Gas oil
Price(Rs/Litre)
Sales(000 Litre)
Price(Rs/Litre)
Sales(000 Litre)
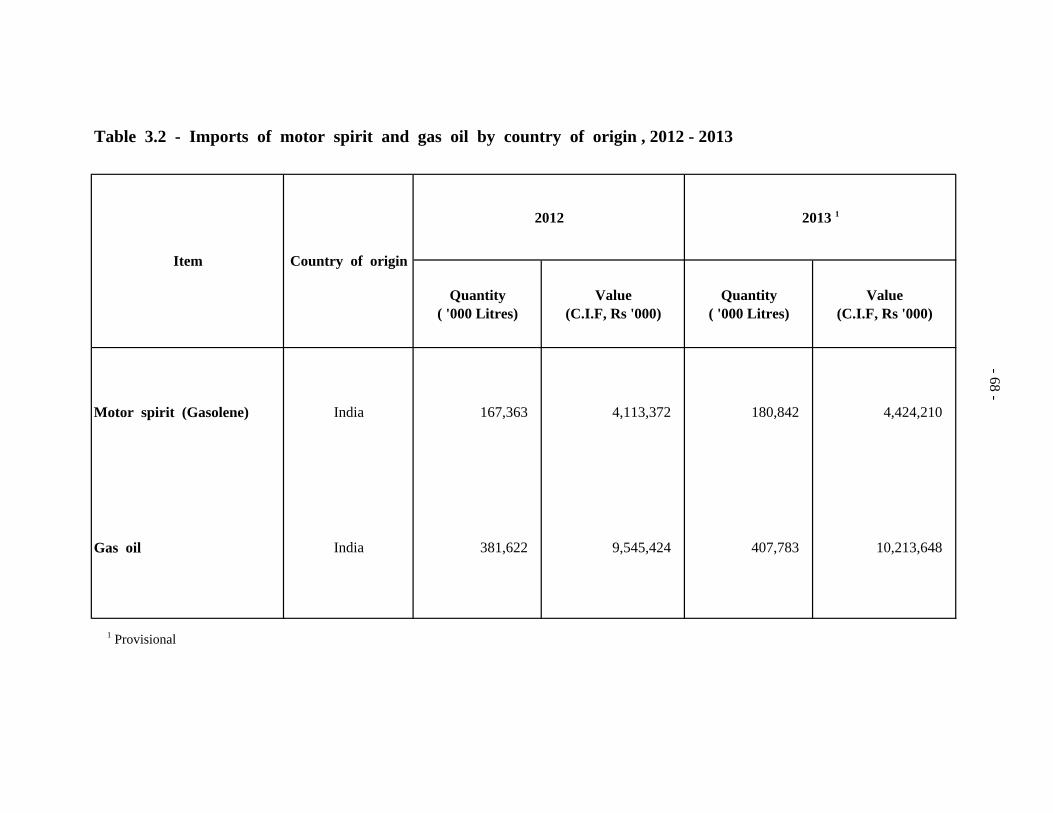
Table 3.2 - Imports of motor spirit and gas oil by country of origin , 2012 - 2013
2012 2013 1
Quantity( '000 Litres)
Value(C.I.F, Rs '000)
Quantity( '000 Litres)
Value(C.I.F, Rs '000)
Motor spirit (Gasolene) India 167,363 4,113,372 180,842 4,424,210
Gas oil India 381,622 9,545,424 407,783 10,213,648
1 Provisional
Item Country of origin
-68 -

Table 3.3 - Imports of lubricating oils and greases by country of origin, 2012 - 2013( C.I.F. Value Rs ' 000 )
2012 ¹ 2013 ²
Quantity Value Quantity Value
Lubricating oil containing not Belgium M/ton 121 10,995 80 7,650 less than 70% by weight of France " 389 34,710 212 22,764 petroleum products Germany " 65 8,548 59 9,438
India " 403 21657 483 26803 Italy " 13 1,547 23 2,289 Japan " 29 6,864 35 7,322 Korea Rep. " 51 4,786 38 4,072 Malaysia " 127 5,605 61 3,074 Saudi Arabia " 26 1,403 16 829 Singapore " 2,413 152,084 1,923 123,562 South Africa Rep. " 2,058 137,654 1,701 118,839 Turkey " 108 6,327 103 5,557 United Arab Emirates " 1,404 103,186 2,468 163,812 United Kingdom " 41 8,883 38 6,319 Other countries " 73 12,058 85 13,653
7,321 516,307 7,325 515,983 Lubricating greases containing not France M/ton 8 1,583 17 2,278 less than 70% by weight of India " 6 370 4 243 petroleum products Italy " 1 92 2 163
South Africa Rep. " 102 11,159 76 7,606 Turkey " 1 78 2 102 United Arab Emirates " 85 7,098 26 2,416 United Kingdom " 2 588 1 478 United States " 4 625 5 784 Other countries " 6 1,530 3 1,604
215 23,123 136 15,674 ¹ revised ² provisional
Item Country of origin Unit
-69 -

0 Reg. No Driver 1
Make Insured at: Pol No. Name
Name of Policy holder: Tel: Address and Telephone number
Address
9. Licence
Number
Reg. No Driver 2
Make Insured at: Pol No. Name
Name of Policy holder: Tel: Address and Telephone number
Address
9. Licence
Number
Accident Location SketchPASSENGER Casualties (Class 2) Completed tables using codes from the bottom panel
PEDESTRIAN Casualties (Class 3) Completed tables using codes from the bottom panel
Witnesses
Name Address Telephone (Res and Off.)
1
2
25. Police description of accident
Reporting Officer- Rank and Name
Name of town/village
MAURITIUS POLICE FORCE
ROAD ACCIDENT DATA FORM
PF 178
1.OB.No. Accident Key:Date entered :
2. Police 3. District: Station
4. Accident Severity:1. Fatal
2. Serious
3. Slight
4. Heavy Damage only
Day Month Year
5. Date
6. Day 1.Sun 2. Mon 3.Tues 4. Wed 5.Thurs 6. Fri 7.Sat
7. Time(24 hour clock)
No of vehicles involved:
Number of casulties (Killed and injured)
8. Junction Type
1. Not at Junction 5.
2. 6.
3. 7.Slip road
4. 8. Private entrance
9. Junction Control
1. Police Officer2. Traffic Signals3. STOP Sign4. GIVE WAY sign or Marking5. Uncontrolled
10. Collision Type1. Head on 9. Hit Pedestian2. Rear End 10. Hit Animal3. Right Angle 11.Other…………..4. Side Swipe5. Ran off Road6. Hit Object in Road7. Hit Object off Road8. Hit Parked Vehicles
11. Road Type1. One way Street2. Two Way Street3. Dual Carriageway
12. Weather1. Fair 2. Rain
3. Fog 4. Smoke/ Dust
5 Other…………...
13. Light Condition
1. Day light2. Dawn/ Dusk3. Darkness: Street light present and lit4. Darkness: Street light present but unlit5. Darkness: no street lighting
14. Road Character
1. Straight + Flat2. Curve only3. Incline only4. Curve + Incline5. Bridge
16. Surface Type
1. Asphalt
2. Gravel
3. Earth
15. Road Condition
1. Good
2. Damaged
17. Surface Condition
1. Dry2. Wet3. Muddy4. Flooded5. Oil or Diesel
18. Roadworks
1. Yes 2. No
19. Hit & Run
1. Yes 2. No
X = Y =
Route No. Km
Accident Location Sketch
Show site in relation to well -known places such as scholls, temples, mosques, churches, bridges, and road junctions. Mark distances to these places. Always
give street names.
Collision Diagram Sketch
Mark the position and direction of each vehicles and details of the road layout at the site of the accident.
Vehicle No. 1
3. Vehicle Type
1. Bicycle 7. Minibus2. Autocycle 8. Bus3. Motorcycle 9. Other4. Car5. Light Goods Vehicles6. Heavy Goods Vehicles
4. Vehicle Monoeuvre
1. Right turn 6. Diverging 11. Sudden stop2. Left turn 7. Overtaking 12. Parked Off road 3. U turn 8. Going ahead 13. Parked ON road4. Cross traffic 9. Reversing 14. Other...............5. Merging 10. Sudden start
10. Type of licence
1. Full licence 2. Provisional 3. No licence
11. Driver sex
M F
12. Age
5. Loading
1. Property loaded2. Overloaded3. Insecure load4. Protruding load5. Other omproper load
6. Apparent Vehicles Defest1. None2. Brakes3. Steering4. Tyres 5. Lights6. Multiple 7. Other
7. Vehicles Damage
1. None 7. Windscreen2.Front 8. Multiple3. Rear4. Right5. Left6. Roof
8. Owner1. Government2. Dilpomatic3. Private4. Company5.Hire Car6.Taxi7. Other…………...
13. Driver Injury
1. Fatal 2. Serious 3. Slight 4. Uninjured
14. Alcohol1. Not suspected 3. Test Positive2. Suspected 4. Test negative
15. Seat Belt / Helmet worn
1. Yes 2. No
Vehicle No. 2
3. Vehicle Type
1. Bicycle 7. Minibus2. Autocycle 8. Bus3. Motorcycle 9. Other4. Car5. Light Goods Vehicles6. Heavy Goods Vehicles
4. Vehicle Monoeuvre
1. Right turn 6. Diverging 11. Sudden stop2. Left turn 7. Overtaking 12. Parked Off road 3. U turn 8. Going ahead 13. Parked ON road4. Cross traffic 9. Reversing 14. Other...............5. Merging 10. Sudden start
10. Type of licence
1. Full licence 2. Provisional 3. No licence
11. Driver sex
M F
12. Age
5. Loading
1. Property loaded2. Overloaded3. Insecure load4. Protruding load5. Other omproper load
6. Apparent Vehicles Defest1. None2. Brakes3. Steering4. Tyres 5. Lights6. Multiple 7. Other
7. Vehicles Damage
1. None 7. Windscreen2.Front 8. Multiple3. Rear4. Right5. Left6. Roof
8. Owner1. Government2. Dilpomatic3. Private4. Company5.Hire Car6.Taxi7. Other…………...
13. Driver Injury
1. Fatal 2. Serious 3. Slight 4. Uninjured
14. Alcohol1. Not suspected 3. Test Positive2. Suspected 4. Test negative
15. Seat Belt / Helmet worn
1. Yes 2. No
Name
1.2.3
1.Cas Class
22
2
2. Veh. No
3 Sex 4.Age
5.Injury
6.Position
8. Belt/Helmet
7. Action
Name
1.2.
1.Cas Class
2. Veh. No
3 Sex 4.Age
5.Injury
6.Position
7. Action 8. Belt/Helmet
3
35. Injury
1. Fatal
2. Serious
Slight
6. Passenger Position
1. Front seat
2. Rear seat
3. M/cycle passenger
4. Bus passenger
5. Back of truck or pickup
7. Passenger Action
1. Sitting
2. Standing
3. Boarding
4. Alighting
5. Falling
8. Seat Belt/Helmet
used
1. Yes
2. No
6. Pedestrian Location
1. On pedestrian Crossing
2. Within 50m of Ped Xing
3. On Central Refuge
4. In centre of raod (not1-3)
5. On Footpath/verge
7. Pedestrian Action
1. Standing
2. Crossing road
3. Walking along middle
4. Walking along edge
5. Playing on road