digestion report aqua regia - ecn · 2.1 procedures of aqua regia digestion 8 ... and organic...
TRANSCRIPT

November 2005
HORIZONTAL – 18
Digestion of solid matrices Part 1: Digestion with Aqua Regia
Report of evaluation study
Monika I.Kisser
NUA-Umweltanalytik GmbH, Austria

Acknowledgement This work has been carried out with financial support from the following EU Member States: UK, Germany, France, Italy, Spain, Nordic countries, Netherlands, Denmark, Austria, EU DG
XI and JRC, Ispra. Cooperation in practical work has taken place with Fernwärme Wien, where the open
microwave digestion has been conducted and UBA Vienna, where experiments with high temperature digestions were conducted. Cooperation with Ricarda Koopmann of
“Landesbetrieb Hessisches Landeslabor, Kassel (LHL, Kassel)“ had taken place by changing digested solutions.

CONTENTS
1. INTRODUCTION 7 2. DESCRIPTION OF THE EVALUATION STUDY 8 2.1 Procedures of Aqua regia digestion 8 2.1.1 Thermal heating digestion with Aqua regia: 8 2.1.2 Closed Microwave digestion with Aqua regia: 8 2.1.3 Open Microwave digestion with Aqua regia: 9 2.2 Design of ruggedness study for Aqua regia digestion 9 2.2.1 Comparison of aqua regia digestion carried out in different laboratories: 10 2.2.2 Influence of particle size 12 2.3 Comparison of three digestion methods 13 2.4 Statistical evaluation of data 13 3. MATERIALS 14 4. RESULTS: 15 4.1 Recovery rate of aqua regia digestion 15 4.2 Results of ruggedness testing 17 4.2.1 Ruggedness testing of method A of horizontal draft standard, thermal heating
digestion – influence of reaction time before heating 17 4.2.2 Ruggedness testing of method B of horizontal draft standard, closed microwave
digestion 18 4.3 Statistical evaluation – comparison of the three digestion methods 27 4.4 Comparison of the three digestion methods 32 4.5 Influence of particle size 34 5. CONCLUSIONS 36
HORIZONTAL – 18 3

LIST OF TABLES
Table 1 Programme for closed microwave oven................................................................ 8 Table 2 Programme for open microwave digestion ........................................................... 9 Table 3 Performed aqua regia digestions at NUA ........................................................... 10 Table 4 Performed aqua regia digestions in Kassel ......................................................... 11 Table 5 Performed aqua regia digestions at Eurofins ...................................................... 11 Table 6 Performed aqua regia digestions at UBA Vienna ............................................... 11 Table 7 Performance characteristics of closed microwave digestion procedures at
different labs ....................................................................................................... 12 Table 8 Particle size of soil SO-16R Eurosoil for digestion with aqua regia................... 12 Table 9 Characterisation of playground samples for aqua regia digestion ...................... 14 Table 10 Recovery rate of aqua regia digestion in comparison to total content measured
by XRF................................................................................................................ 15 Table 12 Thermal heating digestion of CW1 – Influence of letting sample stand
overnight ............................................................................................................. 17 Table 13 Thermal heating digestion of SO13 – Influence of letting sample stand
overnight ............................................................................................................. 17 Table 14 Closed microwave digestion of compost CW 1 - Influence of mass of test
portion................................................................................................................. 18 Table 15 Example for variance analysis – compost sample CW1, Cadmium ................... 18 Table 16 Mass of test portion for soil samples .................................................................. 19 Table 17 Variance analysis of closed microwave digestion of clay soil SO4 - Influence
of mass of test portion......................................................................................... 19 Table 18 Calculation of digestion time/temperature according to ISO 15587-1 ............... 25 Table 19 Statistical evaluation of open and closed microwave digestion for soil sample
SO16R................................................................................................................. 27 Table 20 Statistical evaluation of open microwave and thermal heating digestion for
soil sample SO16R.............................................................................................. 28 Table 21 Statistical evaluation of closed microwave and thermal heating digestion for
soil sample SO16R.............................................................................................. 29 Table 22 Comparison of two methods of aqua regia digestion for sludge......................... 31 Table 23 Comparison of three methods of aqua regia digestion for clay soil SO4............ 32 Table 24 Comparison of different digestion methods........................................................ 33 Table 25 Influence of particle size ..................................................................................... 34
LIST OF FIGURES
Figure 1 Recovery rate of certified reference material CRM 143R – a Sewage sludge Amended Soil ..................................................................................................... 16
Figure 2 Recovery rate of certified reference material WQB-1 Lake Ontario Sediment .. 16 Figure 3 Example of temperature/pressure diagram of method B for the matrix
composted garbage, CW1 (UB0109) .................................................................. 20 Figure 4 Example of temperature/pressure diagram for clay soil, SO4 (UB0114) ........... 20 Figure 5 Example of temperature/pressure diagram for sludge, SL4 (UB0111)............... 20 Figure 6 Temperature diagrams for soil samples digested at high temperatures (UBA
procedure 2) with a mass of test portion of 0,3 g................................................ 21 Figure 7 Temperature diagrams for soil samples digested at high temperatures (UBA
procedure 2) with a mass of test portion of 0,5 g................................................ 21 Figure 8 Comparison of different digestion methods for soil sample SO16R –Cadmium 22
4 HORIZONTAL – 18

Figure 9 Comparison of different digestion methods for soil sample SO16R - Chromium ........................................................................................................... 22
Figure 10 Comparison of different digestion methods for soil sample SO16R – Copper... 23 Figure 11 Comparison of different digestion methods for soil sample SO16R - Nickel .... 23 Figure 12 Comparison of different digestion methods for soil sample SO16R – Lead ...... 24 Figure 13 Comparison of different digestion methods for soil sample SO16R – Zink....... 24 Figure 14 Temperature/pressure diagram for soil sample SO 13 terra rossa (UB0117) ..... 25 Figure 15 Comparison of different digestion methods for soil sample SO4 ....................... 26 Figure 16 Comparison of three digestion methods of aqua regia digestion for compost
CW1.................................................................................................................... 30 Figure 17 Comparison of three digestion methods of aqua regia digestion for compost
CW1 with standard deviation.............................................................................. 30 Figure 18 Comparison of thermal heating and closed microwave digestion for sludge
SL4...................................................................................................................... 31 Figure 19 Comparison of three methods for clay soil SO4 ................................................. 32 Figure 20 Influence of particle size on closed microwave digestion of SO-16R ................ 35
HORIZONTAL – 18 5

SUMMARY
The present report describes the robustness study for aqua regia digestion in the project HORIZONTAL. The three methods for aqua regia digestion described in the horizontal draft standard (2), thermal heating, closed microwave digestion and open microwave digestion were used for the digestion of different samples of compost, sludge and soil prepared by JRC (4). Statistical evaluation of the data and comparison of the three methods within limits for deviation of 10% respectively 20% have been done. The influence of performance parameters as digestion time, temperature, mass of test portion and particle size has been evaluated in this study. The experiments pointed out clearly that slight variations of performance parameters as well as the choice of the heating method have little influence on the analytic results for sludge and treated biowaste samples. But for some kinds of soil, especially clay soil, all these factors influence evidently the measured contents of elements. Similar effects have been found for refractory matrices during validation of EN 13657 and should be expected because of the chemical reaction taking place during digestion with aqua regia. The aqua regia digestion method is empirical and it might not release elements completely. However, for most environmental applications, the result is fit for purpose. It is not suitable for the digestion of refractory compounds such as SiO2, TiO2 and Al2O3; therefore it is more likely an extraction procedure than a digestion. Nevertheless aqua regia dissolves organic matrix and metals to a large amount but not refractory minerals and is therefore useful for environmental analysis, where the mineral composition of soil is not of interest. If the total content of elements for refractory matrices has to be analysed other methods as XRF analysis or digestion methods by the use of HF (18,23) or alkali fusion (19,20) have to be used (26,28). As aqua regia digestion is an empirical method digestion condition have to be laid down in detail in a standard method. Users should be aware that variations of performance characteristics may lead to deviations of the results for refractory matrices. As consequence of the robustness study the Horizontal draft standard (2) has been changed in some details:
• Method C “open microwave digestion” has been removed from the draft standard, as some results for soil samples indicate lower recovery than the other two methods
• Reaction time with aqua regia before digestion has been defined to be as short as necessary to let vigorous reaction occur
• Particle size of test portion was fixed with < 250µm • Mass of test portion has been reduced • Specification of digestion temperature at about 110°C to 120°C
6 HORIZONTAL – 18

1. INTRODUCTION
The overall objective of the European project "Horizontal" is to develop horizontal and harmonised European standards in the fields of sludge, soil and treated biowaste and to facilitate regulation of these major streams in the multiple decisions related to different uses and disposal governed by EU Directives. The revision of the Sewage Sludge Directive 86/278/EEC, the upcoming Directive on the Biological Treatment of Biodegradable Waste and the Soil Monitoring Directive calls for standards on sampling, on hygienic and biological parameters and on methods for inorganic and organic contaminants and for mechanical properties of these materials. The work for developing horizontal and harmonised European standards is split up in coherent Work Packages (WP), each of which addresses a main aspect of all relevant standards required, or likely to be required, in EU regulations regarding sludge, biowaste and soil. In many European countries, digestion methods used for solid environmental samples such as waste, sludge and soil are based on the use of aqua regia in accordance with the relevant European and International standards for the different areas. However, in some European countries, e.g. the Nordic countries, the digestion methods are primarily based on the use of nitric acid. In the previous desk study on digestion of solid matrices (1) a detailed comparison of standards for the digestion prior to the determination of trace elements demonstrated the possibilities of preparing horizontal standards in this field. It was concluded that partial methods, which are most frequently used for digestion in these fields are acceptable. More partial methods have been investigated, however with a focus on digestion using aqua regia and digestion using nitric acid. If results from different methods are used and compared it is of vital importance that the methods used provide comparable results with a sufficiently high reproducibility for the elements and matter in question. The present report describes the results of an evaluation study (Phase II) under WP 6: Inorganic Parameters: Evaluation of the draft horizontal standards for: • Digestion of solid matrices part 1: Digestion by Aqua regia Covering sludge, soil, treated biowaste and neighbouring fields.
HORIZONTAL – 18 7

2. DESCRIPTION OF THE EVALUATION STUDY
In the desk study on digestion of solid matrices (1) one major difference in the existing standards was identified. The ISO standard on aqua regia digestion of soil and the EN standard on digestion of soil improvers and growing media include only digestion by the use of hot-plate heating, while the EN standards on digestion of waste and sludge also include methods for microwave heating. To take into account the developments that have taken place in many European laboratories, the development of a harmonised horizontal standard that includes both hot-plate heating and microwave-oven heating (open and closed heating) was proposed (2). Data exist for waste and sludge samples that suggest that comparable data can be obtained, but for other matrices more investigations are needed.
2.1 Procedures of Aqua regia digestion In this evaluation study digestions of soil, sludge and treated biowaste were carried out by using the three different methods (thermal heating, closed microwave, open microwave) described in the proposed draft standard on aqua regia digestion (2). To evaluate the ruggedness of the proposed methods small variations of the digestion conditions have been made. The influence of particle size on the grade of digestion has been studied on a soil sample (SO16R Eurosoil), as it is known from previous studies that organic matrices as sludge and biowaste are digested rather totally (1).
2.1.1 Thermal heating digestion with Aqua regia: The procedure of method A of the draft standard (2) was followed by using of 3 g of test portion (respectively 1,5g at LHL KASSEL) and 30 ml of Aqua regia. The mixture was heated 2h under reflux conditions with condensation zone 1/3 the height of the condenser. More details are described in Annex 1.
2.1.2 Closed Microwave digestion with Aqua regia: The procedure of method B of the horizontal draft standard (2) was followed (unless it was not changed due to ruggedness testing) with 0,2 to 0,5 g of test portion and 4 to 8 ml of aqua regia. More details are described in Annex 1. Programme for a batch of 6 samples: Table 1 Programme for closed microwave oven Time (min) Power(W) 2 250 2 0 5 250 5 400 5 500
After digestion the vessels were allowed to cool down, transferred quantitatively to a volumetric flask and filled to 25 respectively 50ml with doubled deionised water. Before measurement the sample was allowed to settle down.
8 HORIZONTAL – 18

Recording of temperature and pressure was done during digestion.
2.1.3 Open Microwave digestion with Aqua regia: Procedure: The method C described in the horizontal draft standard (2) was followed by using 0,5 g of sample and 24 ml of aqua regia. More details are described in Annex 1. Programme for a batch of 2 samples Table 2 Programme for open microwave digestion
Time (min) Temperature(°C) 3 103 12 103 3 103 12 103
After digestion the vessels were allowed to cool down, transferred quantitatively to a volumetric flask and filled to 50ml with doubled deionised water. Before measurement the sample was allowed to settle down. Measurement: Instrument: ICP-OES. Optima 3000XL, Perkin Elmer Sample Preparation: sample dilution with aqua regia in following Steps 10,100, 1000 Internal Standardisation with Ytterbium Calibration in aqua regia matrix
2.2 Design of ruggedness study for Aqua regia digestion In the previous studies (1,8,9,15,16) the following factors proved to have an evident influence on the grade of digestion especially for refractory matrices:
• Particle size • Digestion temperature • Time of digestion • Reaction time before digestion • Mass of test portion - Solid/liquid ratio (sample to acid)
Therefore different digestions with variations of these factors were made for the method A – thermal heating - and method B – closed microwave digestion of Horizontal draft standard (2). Method C – open microwave digestion - proved to lead to rather not comparable results, therefore no further ruggedness tests were conducted for this method. The digestions were performed in different laboratories with different ovens, in order to lead to a rather realistic picture of possible variations of digestion conditions.
HORIZONTAL – 18 9

2.2.1 Comparison of aqua regia digestion carried out in different laboratories: Variations of time, temperature and mass of test portions were performed in different laboratories. Table 3 Performed aqua regia digestions at NUA
Number of digestions performed by NUA
Samples grain size
number of digestions/ method
closed microwave
open microwave
conventional heating
Internal sample number
SO4 clay soil <125µm 5 5 5 5 UB0114 SO13 soil <2mm 5 5 5 UB0117 SO16 R Eurosoil < 2mm 5 5 5 5 UB0118 CW1 compost <125µm 5 5 5 5 UB0109 CW5 compost <125µm 3 3 3 UB0110 SL4 sludge <125µm 3 3 3 UB0111 SL11S sludge <125µm 3 3 UB0112 Reference materials: CRM 143R <125µm 3 3 3 WQB 1 <125µm 3 3 3
Additional to these digestions carried out by NUA, digests made by LHL Kassel, another cooperation partner of project HORIZONTAL, were sent to NUA for analysis. Because the results of the round robin test for the validation of EN 13657 (6, 9) have indicated that the performance in different labs may influence reproducibility, this gives opportunity to check this possible influence. At LHL Kassel thermal heating digestions and closed microwave digestions were carried out. Before thermal heating or microwave digestion the samples were standing at room temperature over night. Closed microwave digestions were conducted in Teflon tubes with a digestion time of 30 minutes.
10 HORIZONTAL – 18

Table 4 Performed aqua regia digestions in Kassel
Number of digestions performed by LHL KASSEL
Samples grain size
number of digestions/ method
closed microwave
open microwave
conventional heating
Internal sample number
SO4 clay soil <125µm 3 3 3 UB0223 SO13 soil <2mm 3 3 3 UB0226 SO16 R Eurosoil < 2mm 3 3 3 UB0224 CW1 compost <125µm 3 3 3 UB0225
At Eurofins too several digestions with aqua regia according to method 2 of Horizontal draft standard (2) in addition to the nitric acid digestions have been performed: Table 5 Performed aqua regia digestions at Eurofins
Samples grain size
number of digestions/ method
closed microwave
open microwave
conventional heating
SO4 clay soil <125µm 2 SO1 Italian soil <125µm 2 SO7 Italian soil 2 SO9 German soil < 2mm 2 CW1 compost <125µm 2 CW5 compost <125µm 2 SL4 sludge <125µm 2 SL11S sludge <125µm 2
For further ruggedness testing additional digestions have been performed at UBA Vienna. Variations of mass of test portions and the influence of temperature on the digestion grade of soil samples have been investigated. Table 6 Performed aqua regia digestions at UBA Vienna
Samples grain size
number of digestions/ method
closed microwave remarks
SO4 clay soil <125µm 3 3 0,3 g sample, method B (2) SO4 clay soil <125µm 3 3 0,5 g sample, method B (2) SO4 clay soil <125µm 3 3 0,3 g sample, higher temperature SO4 clay soil <125µm 3 3 0,5 g sample, higher temperature SO16 R Eurosoil < 2mm 2 2 0,3 g sample, method B (2) SO16 R Eurosoil < 2mm 2 2 0,5 g sample, method B (2) SO16 R Eurosoil < 2mm 2 2 0,3 g sample, higher temperature SO16 R Eurosoil < 2mm 2 2 0,5 g sample, higher temperature
HORIZONTAL – 18 11

The main differences of the closed microwave digestion procedures performed in different labs are shown in the table below. Table 7 Performance characteristics of closed microwave digestion procedures at different
labs Performance characteristics
NUA Kassel UBA Eurofins
Mass of test portion 500 µg 200-400µg 300-500µg 250-400 µg Amount of aqua regia 8 ml 4-8 ml 8 ml 8 ml Digestion time 20 min 15 min
standing overnight
resp. 30 min 20 min 20 min
Let stand until no visible gas
Digestion temperature
100 – 120 °C 100 °C, resp.185 °C
More details of used procedures, apparatus and materials are described in Annex 1.
2.2.2 Influence of particle size Investigations were carried out for soil samples in order to estimate the necessary and sufficient pre-treatment for the different matrices, and to verify their applicability in terms of optimised reproducibility. Special emphasise is given to the necessary particle size. Coherence with the relevant horizontal standard on pre-treatment of soil, sludge and biowaste is secured. Robustness tests for the validation of EN 13657 (8) as well as pre-normative research (15) have shown, that for aqua regia digestion an influence of the particle size for refractory matrices has to be supposed. The influence of particle size on digestion with aqua regia was evaluated by using one of the soil samples, as the matrix soil seems to be a more refractory matrix. Eurosoil SO-16R was chosen for measuring the influence of particle size on recovery rates as this is a sample with well known characterisation available and a particle size of <2mm. the sample was milled and sieved at NUA to a grain size of < 500µm and < 100 µm with a ball mill of inert material (achat) used routinely for trace analysis of heavy metals. Table 8 Particle size of soil SO-16R Eurosoil for digestion with aqua regia Particle size
Number of digestions NUA/ thermal heating
Number of digestions NUA/ closed microwave
Number of digestions NUA/ open microwave
Number of digestions Kassel/ thermal heating
Number of digestions Kassel/ closed microwave
< 2mm 5 5 5 3 3 < 500 µm 5 < 100 µm 5
12 HORIZONTAL – 18

2.3 Comparison of three digestion methods The focus of the study on aqua regia digestion was laid on the comparability of the three methods described in the draft Horizontal standard (2). These tests were mainly conducted at NUA, the samples used are visible in Table 3 Performed aqua regia digestions at NUA”. As the validation data of EN 13346 (7) and EN 13657 (6) have proven the comparability of the three methods for sludge samples and organic matrix(see validation data of EN 13657 in Annex 2), mainly soil and partly compost samples were used for these tests on comparison.
2.4 Statistical evaluation of data The evaluation of the obtained analytical data was performed by statistical means. The elimination of outliers was done by Grubb’s test, for each method the arithmetic mean, the standard deviation and the coefficient of variation were calculated by excel sheets. For the comparison of 2 different methods the F-test according to ISO 16489 with P-95% and the mean t-test were used. In case where comparison of 3 methods should be performed, analysis of variances proved to be applicable (25).
HORIZONTAL – 18 13

3. MATERIALS
Samples (so-called playground samples) for the evaluation study were samples made available through Work package 1. The general characteristics of the samples used in the evaluation study are described in (4) and the respective reports of interlaboratory comparisons (10, 14). A list of the samples used in this study is given in the following table: Table 9 Characterisation of playground samples for aqua regia digestion Corg
Sample id. Sample description wgt. %
SO-4
(equivalent to BCR-144)
Clay soil,
Speyer, Germany
Ball-milled and sieved
< 125 µm
1,65
SO-13 Terra rossa,
Spain
Air dried, identical to BCR-484,
< 2 mm
1,69
SO-16R uncontaminated soil, UK,
EUROSOIL 3R, IRMM-433-3
Air dried, sieved
< 2 mm
2,6
CW-1 Composted garbage, Munich, Germany
Dried and ball-milled 12,1
CW-5 Compost,
Fulda, Germany
11,5
SL-4 Sewage sludge, domestic, Essen, Germany (= BCR 144)
Ball-milled and sieved
< 125 µm
29
SL-11 Sewage sludge, electronic industry, Turin, Italy
Ball-milled and sieved
< 125 µm
3,2
For control purposes and for checking the calibration status of the measurement device two additional certified reference materials, used normally for checking the routine analyses in the laboratory of NUA, were digested three times by each method and analysed. These reference materials are CRM-143R and WQB 1. The reference values are shown together with the results in Annex 2.
14 HORIZONTAL – 18

4. RESULTS:
4.1 Recovery rate of aqua regia digestion The recovery rate of aqua regia digestion depends strongly on the matrix of the sample (1), it decreases the more refractory the matrix of the sample is. This fact has to be taken into account also when comparing different methods or the same method conducted in different labs. Small variations in pre-treatment or digestion conditions may influence the recovery rate especially in case of refractory matrices. This well known fact was also proven in the pre-normative research study and the robustness study of EN 13657 (6, 8) and can be seen by comparing the data obtained for aqua regia digestion with the results from characterisation study of the samples(4) too. Table 10 Recovery rate of aqua regia digestion in comparison to total content measured by
XRF SO4 – Clay soil (Germany) SO13 – Terra Rossa (Spain) Parameter Aqua
regia closed vessel
Total content –XRF*
Recovery rate %
Parameter Aqua regia closed vessel
Total content –XRF*
Recovery rate
Cr mg/kg 26 110 23,6 Cr mg/kg 31 95 32,6 Cu mg/kg 13 77 16,9 Cu mg/kg 240 312 76,9 Hg mg/kg 0,25 0,64 39,1 Hg mg/kg 0,45 0,43 104 Ni mg/kg 14 75 18,7 Ni mg/kg 27 52 51,9 Pb mg/kg 41 81 50,6 Pb mg/kg 101 119 84,9 Zn mg/kg 52 290 17,9 Zn mg/kg 412 523 78,8 CW1 - Composted garbage SL4 – Sewage sludge Parameter Aqua
regia closed vessel
Total content –XRF*
Recovery rate %
Parameter Aqua regia closed vessel
Total content –XRF*
Recovery rate
Cr mg/kg 198 270 73,3 Cr mg/kg 445 729 61,0 Cu mg/kg 618 618 100 Cu mg/kg 636 645 98,6 Hg mg/kg 7,48 6,8 110 Hg mg/kg 1,57 1,39 113 Ni mg/kg 229 185 124 Ni mg/kg 872 956 91,2 Pb mg/kg 1661 1474 113 Pb mg/kg 476 580 82,1 Zn mg/kg 2002 1938 103 Zn mg/kg 2953 4033 73,2 * Results from characterisation study of JRC (4) To check the trueness of the results obtained two certified reference materials were analysed at the same time together with the samples.
HORIZONTAL – 18 15

CRM 143 R (11) is a sewage sludge amended soil with certificates for total content as well as aqua regia soluble fractions. The results are in detail in Annex 2, Table A.2.4.2.
CRM 143R
0,00
200,00
400,00
600,00
800,00
1000,00
1200,00
Cd AAS Cd ICP Cr Mn Ni Pb Zn
mg/
kg
arithmetic mean closed microwave arithmetic mean open microwavearithmetic mean thermal heating Certified value aqua regia soluble
Figure 1 Recovery rate of certified reference material CRM 143R – a Sewage sludge
Amended Soil The second certified reference material used is Lake Ontario sediment of the National Water Research Institute of Canada (12). The results were compared with the “Recoverable” (or environmentally available) metals; according to the certificate are these data comparable to those produced by aqua regia methods and to those produced by EPA Method 3051.
WQB-1
020406080
100120
Arsenic
Cobalt
Bor
Cobalt
Chromium
Coppe
r
Lithiu
m
Nickel
Lead
Stronti
um
mg/
kg
open vessel thermal heating closed vessel value aqua regia soluble
Figure 2 Recovery rate of certified reference material WQB-1 Lake Ontario Sediment
16 HORIZONTAL – 18

4.2 Results of ruggedness testing As aqua regia digestion is not a method to obtain “true contents” of species, special care has to be taken to perform it as equal as possible in each laboratory to obtain equivalent results. In analysing digests produced in different labs with the same methods in one lab, it was tried to check these possible sources of error. Variations in sample pre-treatment - with exclusion of the influence of particle size for soil samples that proved to have an essential influence on recovery rate (8) - were not checked in this study, as this is another work item of project “Horizontal”. As the thermal heating procedure is well known over years and the open microwave digestion proved to result in rather low recovery rates the ruggedness tests concentrated mainly on the closed microwave digestion (method B of draft horizontal standard, (2)).
4.2.1 Ruggedness testing of method A of horizontal draft standard, thermal heating digestion – influence of reaction time before heating
For the thermal heating procedure (method A of horizontal draft standard, (2)) only the influence of immediate digestion (NUA) versus overnight standing (Kassel) before heating were evaluated with the help of the statistical means of variance analysis: Table 11 Thermal heating digestion of CW1 – Influence of letting sample stand overnight Element Results in mg/kg Statistic evaluation
NUA 6,1 6,1 5,8 6,0 6,0Cadmium Kassel 5,8 6,1 6,0
NUA 14,7 15,1 14,4 14,3 14,9Cobalt Kassel 14,7 13,8 13,6
NUA 194,1 193,3 195,3 199,8 194,7Chromium Kassel 201,1 205,3 205,5 significant difference
NUA 644,0 709,3 720,0 706,7 622,0Copper Kassel 592,7 581,7 706,7
NUA 238,7 246,7 244,0 250,0 248,0Nickel Kassel 253,3 252,7 240,7
NUA 1653,3 1626,7 1673,3 1680,0 1660,0Lead Kassel 1720,0 1746,7 1746,7 significant difference
NUA 1838,0 2028,7 2033,3 1940,0 1793,3Zinc Kassel 1573,3 1413,1 1720,0 significant difference
Table 12 Thermal heating digestion of SO13 – Influence of letting sample stand overnight Element Results in mg/kg Statistic evaluation
NUA 1,05 0,91 0,99 1,03 1,00Cadmium Kassel 1,34 1,24 1,46 significant difference
NUA 10,33 10,60 10,33 10,67 10,27Cobalt Kassel 7,80 6,47 7,47 significant difference
NUA 33,33 33,67 34,53 33,87 33,67Chromium Kassel 33,33 30,80 33,27
NUA 252,00 240,67 246,00 246,00 240,00Copper Kassel 251,00 217,23 209,67
NUA 29,87 29,87 29,13 30,07 28,33Nickel Kassel 27,10 23,27 28,20 significant difference
NUA 131,33 102,00 99,33 114,87 102,00Lead Kassel 261,90 105,80 130,17
NUA 457,07 444,67 434,00 450,60 433,33Zinc Kassel 430,00 386,67 406,67 significant difference
HORIZONTAL – 18 17

The time how long the material is standing with aqua regia has an evident influence on the grade of digestion in compost and soil samples. In consequence the time how long the acid/sample mixture is standing before heating has to be fixed in the draft standard.
4.2.2 Ruggedness testing of method B of horizontal draft standard, closed microwave digestion
4.2.2.1 Influence of mass of test portion: The differences for the same methods performed in different laboratories are shown in the tables in Annex 2 for the three types of matrices. In table A.2.5.1 comparison data of digestions in two labs for the sludge sample SL4 with mass of test portions of 0,5 g respectively 0,25-0,4 g is shown. As conclusion of the results of the sludge sample in this table it can be stated, that the relevant metals show little differences, only B, Na and K differ evidently, which may also be due to analytical differences, as the solutions were analysed in the respective labs. Table 13 Closed microwave digestion of compost CW 1 - Influence of mass of test portion Compost CW 1
NUA 0,5 g
Kassel * 0,4 g
Eurofins 0,25-0,4 g
arithmetic
mean standard deviation
arithmetic mean
standard deviation
arithmetic mean
standard deviation
statistic evaluation
Cadmium 5,47 0,22 6,10 0,77 5,09 1,57 Copper 612 16,87 596 54 551 111 Chromium 192 7,04 188 34 195 34,4 Lead 1622 68,8 1451 604 1369 343 Nickel 235 8,19 227 9,34 208 56
Zink 1781 163 2372 43 1511 416 significant difference
*digestion time 15 minutes instead of 20 minutes, but power 850 W The statistic evaluation of data was performed by variance analysis as shown for one parameter in this example: Table 14 Example for variance analysis – compost sample CW1, Cadmium CW1: results of the parameter Cadmium in mg/kg NUA ICP 5,81 5,35 5,28 5,32 5,58 Kassel ICP 6,92 5,97 5,41 Eurofins ICP 3,99 6,20 Variance analysis
Groups number Sum mean Variance NUA ICP 5 27,34217 5,46843 0,050612 Kassel ICP 3 18,30119 6,1004 0,585262 Eurofins ICP 2 10,18663 5,09331 2,45448
differences (SS)
degrees of freedom
(df) (MS) (F) P-value critical F-value between groups 1,34831 2 0,67415 1,232957 0,34776 4,737414 within groups 3,827452 7 0,54678 overall 5,175762 9
As the F-value lies under the critical F-value, no significant difference can be determined.
18 HORIZONTAL – 18

The mass of test portion for this experiment was varied in this way: For the matrices sludge and compost no significant differences can be noticed for most elements even if the digestion is not carried out in the same way in the different labs. For soil samples this is not the case in the same extent, as the following example shows: Table 15 Mass of test portion for soil samples
Mass of test portion in g
NUA 0,5 Kassel 0,4 Eurofins 0,25-0,4 UBA 1 0,3 / 0,5
Table 16 Variance analysis of closed microwave digestion of clay soil SO4 - Influence of
mass of test portion Soil SO 4 Chromium mg/kg NUA-0,5 g 21,4 22,4 21,7 21,7 23,0 Kassel-0,4 g* 31,9 33,6 34,5 Eurofins- 0,25-0,4 g 35,9 33,2 UBA 1-0,3 g 22,0 21,7 21,0 UBA 1 – 0,5 g 24,0 22,5 24,3 Variance analysis
Groups number Sum Mean Variance NUA 5 110 22,0 0,4 Kassel 3 100 33,3 1,8 Eurofins 2 69 34,5 3,6 UBA 1 0,5 g 3 65 21,6 0,3 UBA 1 0,3 g 3 71 23,6 0,9 ANOVA
differences (SS) (df) (MS) (F) P-Value critical F-
Value between groups 460,7070287 4 115,1767572 112,3321226
7,67059E-09 3,356690021
within groups 11,27855773 11 1,02532343 overall 471,9855865 15
*digestion time 15 minutes instead of 20 minutes, but power 850 W For most of the metals of clay soil SO4 the data of the different digestion procedures are not comparable. As consequence the mass of test portion has to be fixed in a smaller range than in the draft Horizontal standard (2).
4.2.2.2 Closed microwave digestion – Influence of digestion time and temperature As described before and in more detail in Annex 1 the digestion time was varied at the different experiments performed in this study. While at NUA, Eurofins and at UBA for procedure 1 the instructions of method B of Horizontal draft standard were followed strictly and therefore a digestion time of 20 minutes was maintained, the digestion time in Kassel was 15 minutes and at UBA for procedure 2 it was 30 minutes. In order to check the influence of digestion temperature it was measured where possible and varied at UBA to reach about 185°C (for mass of test portion=0,3 g) till 200°C for mass of test portion=0,5g).
HORIZONTAL – 18 19

The following figures show the temperature/pressure diagram of method B for the three sample types characterised in this study.
Figure 3 Example of temperature/pressure diagram of method B for the matrix composted
garbage, CW1 (UB0109)
Figure 4 Example of temperature/pressure diagram for clay soil, SO4 (UB0114)
Figure 5 Example of temperature/pressure diagram for sludge, SL4 (UB0111)
0 102030405060708090
100110120
Temperature
Press
0 5 10 15 20 25 30 35
0 102030405060708090
100110120
Temperature
Press
0 5 10 15 20 25 30 35
0 102030405060708090
100110120
Temperature
0 5 10 15 20 25 30 35
Pressure
20 HORIZONTAL – 18
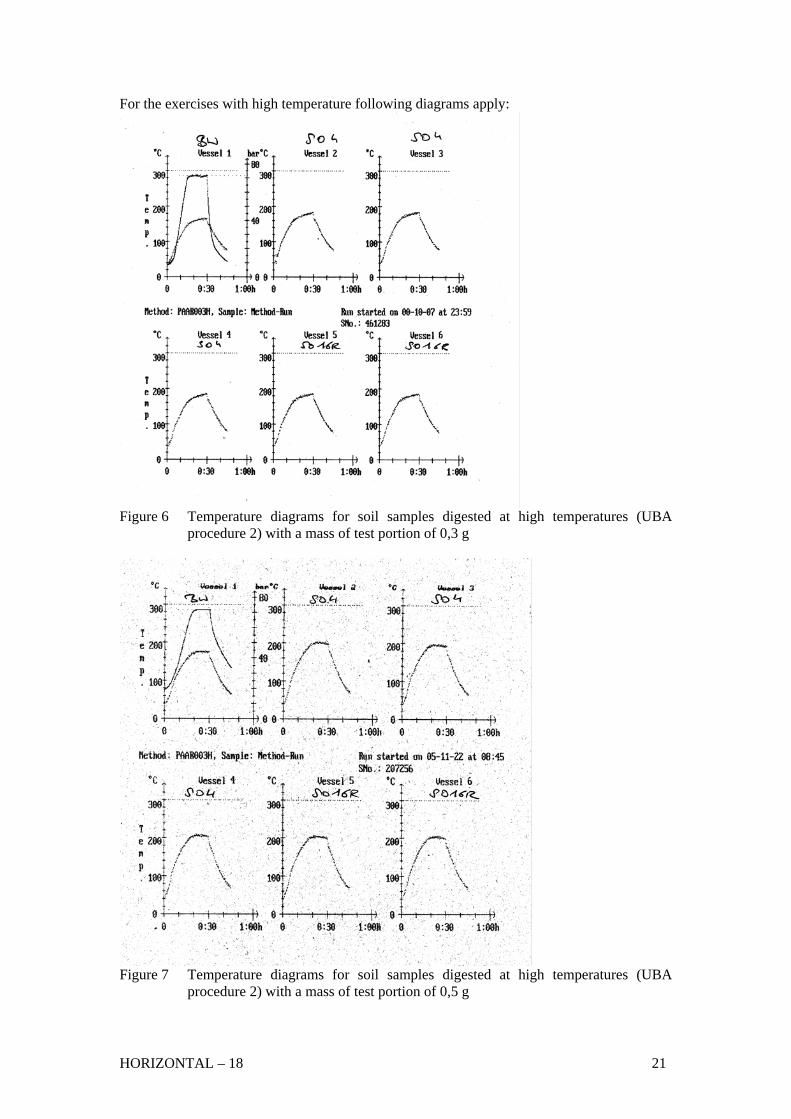
For the exercises with high temperature following diagrams apply:
Figure 6 Temperature diagrams for soil samples digested at high temperatures (UBA
procedure 2) with a mass of test portion of 0,3 g
Figure 7 Temperature diagrams for soil samples digested at high temperatures (UBA
procedure 2) with a mass of test portion of 0,5 g
HORIZONTAL – 18 21

The results of these exercises are listed in detail in Annex 2. In the following diagrams the single results for the relevant metals are shown in comparison with the thermal heating procedure.
SO 16R Ruggedness test Cadmium
0
0,1
0,2
0,3
0,4
0,5
0,6
0,7
0,8
0,9
Thermal heatingstanding over night
Thermal heating NUA closedmicrowave 0,5 g
UBA closedmicrowave 0,3g
UBA closedmicrowave 0,5 g
UBA 0,3g high temp UBA 0,5g high temp
mg/
kg
Figure 8 Comparison of different digestion methods for soil sample SO16R –Cadmium
SO 16 R Ruggedness test Cr
0
5
10
15
20
25
30
35
40
45
Thermal heatingstanding over
night
Thermal heating NUA closedmicrowave 0,5 g
UBA closedmicrowave 0,3g
UBA closedmicrowave 0,5 g
Kassel closedmicrowave, 15
min
UBA 0,3g hightemp
UBA 0,5g hightemp
mg/
kg
Figure 9 Comparison of different digestion methods for soil sample SO16R - Chromium
22 HORIZONTAL – 18

SO 16R Ruggedness test Copper
0
5
10
15
20
25
Thermal heatingstanding over
night
Thermal heating NUA closedmicrowave 0,5 g
UBA closedmicrowave 0,3g
UBA closedmicrowave 0,5 g
Kassel closedmicrowave, 20
min
UBA 0,3g hightemp
UBA 0,5g hightemp
mg/
kg
Figure 10 Comparison of different digestion methods for soil sample SO16R – Copper
SO 16R Ruggedness test Nickel
0
5
10
15
20
25
Thermal heatingstanding over
night
Thermal heating NUA closedmicrowave 0,5 g
UBA closedmicrowave 0,3g
UBA closedmicrowave 0,5 g
Kassel closedmicrowave, 15
min
UBA 0,3g hightemp
UBA 0,5g hightemp
mg/
kg
Figure 11 Comparison of different digestion methods for soil sample SO16R - Nickel
HORIZONTAL – 18 23

SO 16R Ruggedness test Pb
0
10
20
30
40
50
60
70
80
90
Thermal heatingstanding over
night
Thermal heating NUA closedmicrowave 0,5 g
UBA closedmicrowave 0,3g
UBA closedmicrowave 0,5 g
Kassel closedmicrowave, 15
min
UBA 0,3g hightemp
UBA 0,5g hightemp
mg/
kg
Figure 12 Comparison of different digestion methods for soil sample SO16R – Lead
Ruggedness test SO16 R
0
20
40
60
80
100
120
140
160
Thermal heatingstanding over
night
Thermal heating NUA closedmicrowave 0,5 g
UBA closedmicrowave 0,3g
UBA closedmicrowave 0,5 g
Kassel closedmicrowave, 15
min
UBA 0,3g hightemp
UBA 0,5g hightemp
mg/
kg
Figure 13 Comparison of different digestion methods for soil sample SO16R – Zink As the aqua regia extraction is an empirical method that releases more or less the environmentally relevant metals and shall be used for comparison reason with limit values, main focus in drafting a standard was laid on the robustness on the one hand and the comparability of the results of microwave digestion with the thermal heating procedure on the other hand. This was the reason why this empirical microwave procedure with a fixed power programme had been drafted in TC 292. Validation data of several European standards (6,7,8,9) had proven this comparability more or less for many waste and sludge matrices and a broad range of elements.
24 HORIZONTAL – 18

Nevertheless exists a contradiction between this empirical microwave method and the theoretical approach as pointed out for aqua regia digestion of water and soil samples (17,24): ISO TC 190/SC3/WG1 N 0326: “4 Principle The test portion is digested with aqua regia at a defined temperature and time. The temperature is at least the boiling point (103 °C at 101,3 kPa) and at most 175 °C. At the boiling point, the minimum duration to release the digestible fraction is 120 min at 103°C. The maximum duration is set at four times the minimum duration at that temperature. By convention, both the required minimum and maximum duration is assumed to halve with every 15°C increase in temperature above the boiling point … NOTE 1: Given the digestion period ∆t, expressed in minutes, the digestion temperature Td, expressed in degrees Celsius, shall meet the following condition: 206,2 – 21,64 x In(∆t)< Td<236,6 – 21,64 x In(∆t) Boundary conditions in equation (1) reflect the assumption of clause 4 on release kinetics and duration time.” Calculation of digestion time and temperature according to this formula results in the following table: Table 17 Calculation of digestion time/temperature according to ISO 15587-1 Time (minutes) ln(t)x 21,64 Tmin (°C) Tmax (°C) 206,6 236,6
5 34,8 171,8 201,810 49,8 156,8 186,815 58,6 148,0 178,020 64,8 141,8 171,830 73,6 133,0 163,060 88,6 118,0 148,0
120 103,6 103,0 133,0 Tmin in the last line of this table gives the condition as they are usually reached in the thermal heating procedure (method A of draft standard, 103 °C is the boiling temperature of aqua regia and atmospheric pressure and it is hold for 2 hours). Method B of draft standard results in digestion of about 5 min at 110°C as can be seen in Figure 3 Example of temperature/pressure diagram of method B for the matrix composted garbage, CW1 (UB0109) and Figure 5 Example of temperature/pressure diagram for sludge, SL4 (UB0111).
020406080
100120140
0 10 20 30 40
Ves 1Ves 2Ves 3Ves 4Ves 5Ves 6Press
Figure 14 Temperature/pressure diagram for soil sample SO 13 terra rossa (UB0117)
HORIZONTAL – 18 25

The results obtained by using method B indicate no significant differences for many parameters and matrices (see 4.3 and 4.4) compared with thermal heating procedure. Theoretically heating temperatures about 160°C to 185°C for about 10 minutes should lead to comparable results as indicated in the theoretic formula of ISO. The experiments at UBA Vienna maintain this range of temperature of about 10 minutes, but result in evident higher recovery for some parameters compared to thermal heating for soil sample SO16. Different is the situation for clay soil sample SO4: the temperatures reached with method B are laying about the boiling point of 103°C as can be seen in Figure 4 Example of temperature/pressure diagram for clay soil, SO4 (UB0114). In consequence the recovery rate of method B is for some parameters evidently lower than the one of thermal heating. But the closed vessel digestion at high temperature does not lead to comparable results, too, as can be seen in the tables of Annex 2 and in the next figure.
Comparison SO4
0,000
10,000
20,000
30,000
40,000
50,000
60,000
70,000
Cadmium Chromium Copper Lead Nickel Zink
mg/
kg
NUA Thermal heating NUA method B KasselEurofins method B UBA method B UBA high temperature
Figure 15 Comparison of different digestion methods for soil sample SO4 In consequence of these data the empirical method of method B of Horizontal draft standard can be used, but it was noted that the user should take care to hold a temperature of at least 110-120°C about 5 minutes.
26 HORIZONTAL – 18

4.3 Statistical evaluation – comparison of the three digestion methods The results of the different methods were evaluated by statistical means according to ISO 16489 by comparing method per method. Outliers were eliminated by Grubb’s test in case of at least 5 results per parameter and method available. Excel sheets with detailed results and statistical evaluation of all samples are amended as annex named. For the matrix compost playground sample CW 1, for the matrix soil the samples SO-4, SO-13 and SO-16R were evaluated extensively according 16489. For the matrix sludge has been validated for previous standards (6,7), only a comparison of the means has been done to check if any deviation occurred. As typical example for the results, the evaluation of the data of EUROSOIL SO-16R has been chosen. Statistical evaluation (F-test, mean-t-test) indicate equality only for some parameters, but these parameters vary from each pair of compared methods to the next. Table 18 Statistical evaluation of open and closed microwave digestion for soil sample
SO16R
SO 16R methode of reference closed microwave
methode of comparison open microwave
methode of reference
methode of comparison
arithmetic mean
coefficient of variation
arithmetic mean without outlier
coefficient of variation
recovery %
F-test result
arithmetric mean -t-test
"average" standard deviation
standard deviation without outlier
standard deviation without outlier
Arsenic 8,71 2,98 8,93 6,01 2,53 not equal equal 0,39 0,10 0,54Mercury 0,14 14,66 0,11 14,35 -19,96 not equal not equal 0,02 0,02 0,01Cadmium 0,48 5,43 0,45 3,33 -6,14 equal equal 0,02 0,03 0,01Cobalt 7,48 6,32 7,25 8,50 -3,16 equal equal 0,55 0,47 0,62Aluminium 14386,96 42,62 7385,57 6,27 -48,66 not equal not equal 4348,15 6131,74 463,25Calcium 1420,22 8,01 1292,14 3,23 -9,02 not equal not equal 85,66 113,71 41,77Chromium 22,94 23,85 15,00 4,80 -34,60 not equal not equal 3,87 5,47 0,15Copper 17,12 14,64 15,70 3,66 -8,28 not equal equal 1,27 1,71 0,57Iron 22563,11 7,67 21772,68 7,72 -3,50 equal equal 1515,99 1331,97 1679,97Potassium 2794,28 77,54 755,26 6,07 -72,97 not equal equal 1532,41 2166,67 45,87Magnesium 2906,16 21,40 1989,25 4,23 -31,55 not equal not equal 353,24 492,42 84,17Manganese 997,72 13,82 1001,21 2,76 0,35 not equal equal 57,67 76,71 27,68Nickel 17,56 12,93 14,39 5,01 -18,06 equal not equal 1,24 1,59 0,72Lead 60,02 14,79 55,36 4,94 -7,75 not equal equal 6,32 8,88 1,09Sulphur 1504,10 11,15 1158,09 1,60 -23,00 not equal not equal 119,26 167,64 18,50Zink 120,16 29,44 104,12 3,82 -13,36 equal not equal 3,81 3,63 3,98Phosphor 2481,15 11,61 1992,51 3,23 -19,69 not equal not equal 208,66 288,01 64,27
HORIZONTAL – 18 27

Table 19 Statistical evaluation of open microwave and thermal heating digestion for soil sample SO16R
methode of reference open microwave
methode of comparison thermal heating
methode of reference
methode of comparison
arithmetic mean without outlier
coefficient of variation
arithmetic mean without outlier
coefficient of variation
recovery %
F-test result
arithmetric mean -t-test
"average" standard deviation
standard deviation without outlier
standard deviation without outlier
Arsenic 8,93 6,01 8,87 0,67 -0,73 not equal equal 0,38 0,54 0,06Mercury 0,11 14,35 0,11 3,98 -2,76 equal equal 0,01 0,01 0,00Cadmium AAS 0,45 3,33 0,45 0,84 0,41 not equal equal 0,01 0,01 0,00Cobalt AAS 7,25 8,50 7,55 4,58 4,15 equal equal 0,50 0,62 0,35Aluminium 7385,57 6,27 12993,83 6,89 75,94 equal not equal 712,82 463,25 895,33Bor 3,61 17,16 12,68 76,86 251,45 not equal equal 8,96 0,62 12,66Barium 74,47 4,17 85,73 3,70 15,11 equal not equal 3,14 3,10 3,17Calcium 1292,14 3,23 1466,33 3,28 13,48 equal not equal 45,29 41,77 48,54Cobalt ICP 9,91 59,74 10,46 10,67 5,49 not equal equal 0,79 0,11 1,12Chromium 15,00 4,80 22,11 1,33 47,41 equal not equal 0,23 0,15 0,29Copper 15,70 3,66 17,10 6,68 8,91 equal not equal 0,90 0,57 1,14Iron 21772,68 7,72 24232,50 5,62 11,30 equal not equal 1529,10 1679,97 1361,60Potassium 755,26 6,07 2299,67 2,87 204,49 equal not equal 57,08 45,87 66,42Lithium 8,56 6,39 17,15 10,23 100,49 not equal not equal 1,25 0,21 1,75Magnesium 1989,25 4,23 3109,50 5,25 56,32 equal not equal 129,87 84,17 163,25Manganese 1001,21 2,76 1049,28 4,12 4,80 equal equal 36,30 27,68 43,24Nickel 14,39 5,01 18,48 4,39 28,41 equal not equal 0,77 0,72 0,82Lead 55,36 4,94 64,71 8,05 16,89 not equal not equal 3,76 1,09 5,21Sulphur as SO4 1158,09 1,60 1508,29 7,31 30,24 not equal not equal 79,02 18,50 110,21Zink 104,12 3,82 117,24 4,28 12,60 equal not equal 4,56 3,98 5,07Phosphor as P2O5 1992,51 3,23 2385,08 8,03 19,70 not equal not equal 142,92 64,27 191,63
28 HORIZONTAL – 18

Table 20 Statistical evaluation of closed microwave and thermal heating digestion for soil sample SO16R
methode of reference closed microwave
methode ofcomparison thermal heating
methode of reference
methode of comparison
arithmetic mean without outlier
coefficient of variation
arithmetic mean without outlier
coefficient of variation
recovery %
F-test result
arithmetric mean -t-test
"average" standard deviation
standard deviation without outlier
standard deviation without outlier
Arsenic 8,60 2,98 8,87 0,67 3,09 not equal 0,07 0,10 0,00Mercury 0,14 14,66 0,11 3,98 -22,17not equalnot equal 0,01 0,02 0,00Cadmium 0,48 5,43 0,45 0,84 -5,75not equalequal 0,02 0,03 0,00Cobalt 7,48 6,32 7,55 4,58 0,85equal equal 0,41 0,47 0,35Aluminium 14386,96 42,62 12993,83 6,89 -9,68not equalequal 4381,77 6131,74 895,33Calcium 1420,22 8,01 1466,33 3,28 3,25not equalequal 84,32 113,71 35,93Chromium 22,94 23,85 22,11 1,33 -3,59not equalequal 3,87 5,47 0,29Copper 16,43 14,64 17,10 6,68 4,07equal equal 1,45 1,71 1,14Iron 22992,45 7,67 24232,50 5,62 5,39equal equal 1346,87 1331,97 1361,60Potassium 2794,28 77,54 2299,67 2,87 -17,70not equalequal 1532,49 2166,67 51,17Magnesium 2756,59 21,40 3109,50 5,25 12,80not equalequal 366,83 492,42 163,25Manganese 955,95 13,82 1049,28 4,12 9,76equal equal 62,27 76,71 43,24Nickel 16,95 12,93 18,48 4,39 9,01not equalequal 1,19 1,59 0,55Lead 60,02 14,79 64,71 8,05 7,83equal equal 7,28 8,88 5,21Sulphur as SO4 1504,10 11,15 1508,29 7,31 0,28equal equal 141,86 167,64 110,21Zink 107,72 29,44 117,24 4,28 8,84equal equal 3,62 3,63 3,62Phosphor as P2O5 2481,15 11,61 2385,08 8,03 -3,87equal equal 244,61 288,01 191,63
HORIZONTAL – 18 29
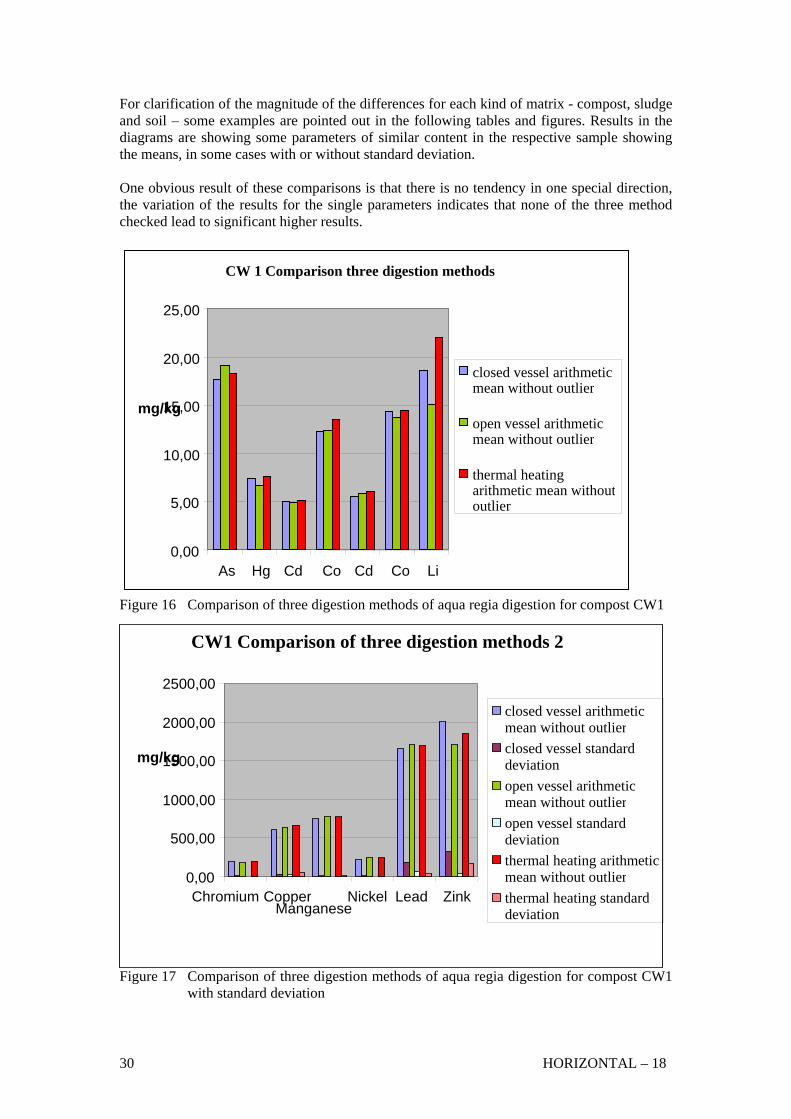
For clarification of the magnitude of the differences for each kind of matrix - compost, sludge and soil – some examples are pointed out in the following tables and figures. Results in the diagrams are showing some parameters of similar content in the respective sample showing the means, in some cases with or without standard deviation. One obvious result of these comparisons is that there is no tendency in one special direction, the variation of the results for the single parameters indicates that none of the three method checked lead to significant higher results.
CW 1 Comparison three digestion methods
25,00
20,00closed vessel arithmetic mean without outlier
15,mg/kg 00 open vessel arithmetic mean without outlier
10,00thermal heatingarithmetic mean without
5,00 outlier
0,00 As Hg Cd Co Cd Co Li
Figure 16 Comparison of three digestion methods of aqua regia digestion for compost CW1
CW1 Comparison of three digestion methods 2
2500,00
closed vessel arithmetic 2000,00 mean without outlier
closed vessel standard150mg/kg 0,00 deviation
open vessel arithmetic 1000,00 mean without outlier
open vessel standard500,00 deviation
thermal heating arithmeticmean without outlier0,00
Chromium Copper
Figure 17 Comparison of three digestion methods of aqua regia digestion for compost CW1
with standard deviation
Manganese Nickel Lead Zink thermal heating standard
deviation
30 HORIZONTAL – 18

Table 21 Comparison of two methods of aqua regia digestion for sludge
SL4 closed microwave mg/kg
thermal heating mg/kg
arithmetic mean
standard deviation
arithmetic mean
standard deviation
As 5,99 0,27 5,88 0,04 Hg 1,57 0,06 1,41 0,03 Cd 3,24 0,03 3,30 0,07 Co 7,47 0,69 6,92 0,10 Ag 16,21 0,45 16,67 0,29 Al 8575,53 450,38 9070,67 409,44 B 28,99 0,48 35,30 2,50 Ba 476,05 35,44 518,44 21,42 Be 3,02 0,07 3,01 0,05 Ca 36168,75 639,01 36731,11 308,42 Cd 3,91 0,19 3,90 0,04 Co 13,33 0,34 12,84 0,10 Cr 445,41 8,35 470,07 19,62 Cu 636,47 22,10 722,22 32,89 Fe 46638,65 1273,71 68688,89 7915,20 K 935,11 35,55 1155,56 30,96 Li 5,41 0,17 5,86 0,13 Mg 4529,30 75,33 4610,22 64,24 Mn 409,79 11,81 416,44 6,05 Na 1242,67 21,03 1280,22 24,13 Ni 871,53 50,93 906,67 37,12 Pb 476,37 7,96 479,22 17,60 SO4 15505,10 423,53 13982,22 274,25 Sr 103,04 1,48 86,44 0,77 Zn 2953,42 138,48 3406,67 41,63 P2O5 45901,03 2947,16 48688,89 2059,49
Figure 18 Comparison of thermal heating and closed microwave digestion for sludge SL4
SL4 Comparison of methods
18,00 16,00
closed microwave 14,00 arithmetic mean 12,00 closed microwave
0,00 2,00 4,00 6,00 8,00
10,00 mg/kg
standard deviation thermal heatingarithmetic mean thermal heating
Hg As Cd Co Ag Be Cd Co Li
standard deviation
HORIZONTAL – 18 31

Table 22 Comparison of three methods of aqua regia digestion for clay soil SO4 SO4 closed vessel microwave open vessel microwave thermal heating
mg/kg arithmetic mean
standard deviation
arithmetic mean
standard deviation
arithmetic mean
standard deviation
As 28,32 28,07 7 30,45 1,16 0,8 0,91Hg 0,25 0,05 0,21 0,01 0,20 0,00Cd (AAS) 0,24 0,00 0,23 0,00 0,23 0,01Co (AAS) 3,45 0,07 3,17 0,08 4,00 0,08Al 1178 428 448 10 1173 830,88 1,39 4,65 0,77 2,83 3,39B 6,28 4,41 3,70 1,01 18,68 7,00Ba 111,00 1 97,13 2,34 10,53 13,14 2,06Ca 4735,92 435,33 39 11 493,67 4,31 801,42 113,35Cr 26,27 5,91 17,58 0,50 26,34 1,04Cu 12,77 0,56 12,66 0,70 14,74 2,38Fe 150 78 117 50 145 8935,17 0,16 75,19 5,02 59,00 5,05K 1442,41 1164,18 512,25 18,28 1770,33 19,68Li 11,94 3,85 5,26 0,18 13,17 0,77Mg 1630,79 361,85 95 2 172,46 9,59 63,00 78,29Mn 288,29 13,42 273,08 6,10 294,54 10,32Na 170,16 44,63 179,37 7,63 209,00 73,15Ni 13,52 1,65 10,37 0,32 14,58 0,33Pb 39,47 2,05 37,93 4,35 38,92 4,69SO4 2492,16 7 21 2 259,16 47,10 9,21 76,58 88,78Sr 29,39 10,12 16,91 0,49 28,43 1,12Zn 51,26 1,93 40,18 4,08 50,42 1
5 1,22
P2O 1319,74 41,71 11 3 1419,71 58,2496,53 6,75
comparison of arithmetic means of the three digestion methods for clay soil SO4
0102030405060
As Cr Cu Li Ni Pb Sr Zn
mg/
kg
closed vessel microwave open vessel microwave thermal heating
Figure 19 Comparison of three methods for clay soil SO4
4.4 Comparison of the three digestion methods In order to summarise the results and to check the magnitude of eventual deviations, additional evaluation of the data has been done by comparing the means of all methods with
32 HORIZONTAL – 18

each other and with the overall mean. Limits were defined with ±5% and ±10% deviation of
5 SL4 results/ SO13 deviation
results/ deviation
the overall mean and checked for what type of sample, for which method and which parameter deviations bigger than ±5% (in the table shown as >10%) or ±10% (in the table shown as >20%) could be detected. Table 23 Comparison of different digestion methods Element
nalytical Compost CW1
CompostCW
Sludge Soil SO4 Soil Soil SO16Ramethod results/
deviation deviation results/
deviationdeviation
As-AAS ov>th>cv/ <10%
<10% cv>th <10%
th>cv>ov <10%
<10% ov>th>cv <10%
Hg-AAS th>cv>>ov/ >10%,<20%
>10%, <20%
- cv>ov>th >20%
<10% cv>ov=th >10%
Cd-AAS th>cv>ov/ <10%
<10% th>cv <10%
cv>ov=th <10%
<10% cv>ov=th <10%
Cd-ICP th>ov>cv/ <10%
- cv>th AS)<1%
cv>th(>>A<10%
<10% -
Co-AAS th>>ov>cv>10%,
/ %
v <20
<10% cv>th <10%
th>>cv>>o>10%,<20%
<10% th>cv>ov <10%
Co-ICP th=cv>ov/ <10%
<10% cv>th >ov>cv <10%
th>cv <10%
<10% th>10%
Cr-ICP th>cv>>ov/ >10%,<20%
<10% th>cv <10%
th>>cv>>ov >20%
<10% cv>th>ov >20%
Cu-ICP th>ov>cv <10%
<10% th>cv >10%, <20%
th>>cv>20%
>>ov %
<10% cv>th>ov >10%,<20
Ni-ICP th>ov>cv/ <10%
<10% th>cv <10%
th>>ov>cv >20%
<10% th>cv>ov >20%
Pb-ICP ov>th>cv/ <10% th>cv th >20% th>cv>ov <10% <1%
cv>ov><10% >10%,<20%
Zn-ICP cv>>th>ov/
>10%,<20%
<10% th>cv >10%,
<20%
th>>cv>>ov>20%
<10% cv>th>ov >10%,<20%
Explanatth>cv mean
ions: ve cl ; icrow ; th = t al heas: esu ined al h is han
results obtain with closed vessel microwav
deviation
>10% higher than Co-AAS
eating only; >20%, standard deviation very small
cv = microwa mean of all red by digestion
osed vessellts obta
ov = m ave open vesseleating digestione
hermbigger t
ting by therm means of all
Discussion of data evaluation in detail for each sample: CW1 (compost): In general good correlation, Hg, Co-AAS, Cr, Zn >10%, but <20%Results of Cd- ICP >10% higher than Cd-AAS Results of Co-ICP CW5 (compost): Comparison of closed microwave and thermal hVery good correlation, only Hg and K>10%, Al
HORIZONTAL – 18 33

SL4 (sludge): Comparison of closed microwave and thermal heating only; Correlation of Cu, Zn >10%, other heavy metals <10%, deviation of results between the two methods of B, Fe, K Results of Cd- ICP >10% higher than Cd-AAS Results of Co-ICP >10% higher than Co-AAS SO4 (clay soil): In general deviation in many cases > 20%, e.g. Cr deviation >20% (cv/ov/th=17,6/22/26,9), standard deviation strongly influenced by different labs performing digestion SO13 (soil): Comparison of closed microwave and thermal heating only; Very good correlation, only B (maybe error) does not correlate, K and Na >10% and Pb >20%, standard deviation strongly influenced by different labs performing digestion
4.5 Influence of particle size In order to check the influence of particle size one soil sample available with a grain size of <2mm, SO-16R, was milled to a particle size of <500µm and <100µm and digested 5 times for each particle size by closed microwave digestion. Evaluation of data was done by comparing mean and standard deviation of the analysed parameters. Table 24 Influence of particle size
SO 16R < 2mm < 0,5mm < 0,1mm
Parameter arithmetic mean
standard deviation
coefficient of variation
arithmetic mean
standard deviation
coefficient of variation
arithmetic mean
standard deviation
coefficient of variation
Cadmium 0,48 0,03 5,43 0,49 0,01 1,72 0,58 0,01 2,12Cobalt 7,48 0,47 6,32 5,41 0,23 4,21 6,34 0,26 4,07Aluminium 10026,93 729,31 7,27 10179,14 740,23 7,27 11996,27 1706,30 14,22Barium 84,24 3,13 3,71 79,48 2,01 2,52 80,50 39,73 49,36Calcium 1405,11 79,03 5,62 1497,21 92,15 6,15 1838,63 80,72 4,39Cobalt 9,77 1,74 17,82 6,60 0,31 4,71 8,26 0,16 1,99Chromium 19,06 0,32 1,66 18,85 0,53 2,81 23,09 0,92 3,97Copper 17,24 2,82 16,33 14,62 0,64 4,39 19,42 1,02 5,27Iron 22603,73 1259,70 5,57 23362,71 1288,82 5,52 26422,93 913,81 3,46Potassium 1236,71 66,46 5,37 1274,81 51,20 4,02 1638,81 155,23 9,47Lithium 12,32 0,44 3,56 13,32 0,35 2,59 16,30 0,93 5,71Magnesium 2504,56 141,48 5,65 2597,48 69,93 2,69 3145,48 134,24 4,27Manganese 1027,12 147,68 14,38 1020,89 21,73 2,13 1243,14 58,14 4,68Nickel 16,46 0,77 4,66 15,46 1,02 6,61 20,66 0,83 4,04Lead 54,10 2,69 4,96 56,86 5,81 10,21 76,39 2,92 3,83Sulphur as SO4 1435,94 46,85 3,26 1521,58 63,67 4,18 1783,75 35,12 1,97Strontium 7,70 0,88 11,45 8,39 0,39 4,60 9,71 0,63 6,44Zink 107,27 3,81 3,55 97,08 49,30 50,78 130,73 4,19 3,20Phosphor as P2O5 2480,92 153,62 6,19 2591,18 162,05 6,25 3059,10 86,46 2,83
34 HORIZONTAL – 18

To point out possible differences the results of selected parameters are shown in a diagram (figure 11). This makes the influence of smaller particle size for rather refractory matrix visible. This fact was already shown in previous studies (15, 16) for waste and soil materials, but it cannot be detected for sewage sludge and other organic matrices.
Influence of particle size
0,00
20,00
40,00
60,00
80,00
100,00
120,00
140,00
160,00
Co AAS Ba Co ICP Cr Cu Li Ni Pb Sr Zn
mg/
kg
UB0118A UB0118B UB0118C UB0118D UB0118E UB0118AF-500µmUB0118AG-500µm UB0118AH-500µm UB0118AI-500µm UB0118AJ-500µm UB0118AA-100µm UB0118AB-100µmUB0118AC-100µm UB0118AD-100µm UB0118AE-100µm
Figure 20 Influence of particle size on closed microwave digestion of SO-16R The influence of particle size on the grade of digestion (recovery rate) and therefore the representativity of results is visible for refractory matrix. Therefore it has to be laid down in the standard; the proposal is to prescribe the particle size with <250µm, as a particle size of <100µm leads to evidently higher results that may influence the robustness of the method.
HORIZONTAL – 18 35

5. CONCLUSIONS
Evaluation of the analytical results of this robustness study in combination with previous pre-normative research and validation of the two standards EN 13346 and EN 13657 lead to these conclusions: • The comparison of the three aqua regia digestion methods shows in most cases
deviations of smaller than 10%, several times till <20%. Only for very refractory matrices as clay soil, deviations of over 20% are possible for selected parameters, mainly because of lower results of method C. Results for organic matrix as sludge and compost correlate in most cases.
• One obvious result of the statistical evaluation of the data of the three digestion methods is that there is no evident tendency in one special direction for the two methods “Thermal heating” and “Closed microwave digestion”. The method C of Horizontal draft standard “Open microwave digestion” may lead especial for soil samples to lower recovery rates see table 24); therefore it was taken out of the final version of the Horizontal draft standard. This method may be used as well as other methods for this kind of matrices, for which the equivalency is proven (7,9,13,26,27,28,29).
• The differences obtained by using the same method in different labs with small variations of performance conditions lead for both methods checked in that way - closed microwave and thermal heating digestion – to one important conclusion: They are in the same order of magnitude as the differences obtained by different methods of aqua regia digestion in the same lab.
• The influence of particle size on the grade of digestion (recovery rate) and therefore the representativity of results is visible for refractory matrix. Therefore it has to be laid down in the standard; the proposal is to prescribe the particle size with smaller than 250µm, as a particle size of 100µm leads to higher results that may influence the robustness of the method.
• Pre-treatment and performance parameters of digestion have to be prescribed in very detail to succeed in comparable results: The time how long the material is standing with aqua regia has an evident influence on the grade of digestion in compost and soil samples. In consequence the time how long the acid/sample mixture is standing before heating has to be fixed in the draft standard. Mass of test portion and time and temperature of digestion have an evident influence on the results and therefore they have to be fixed in the draft standard in a rather small range. Only for not refractory matrices where aqua regia extraction leads to a rather “total” digestion, these influences may be negligible.
36 HORIZONTAL - 18

REFERENCES
1. K.J.Andersen and M.I Kisser. “Digestion of Solid Matrices – Desk study Horizontal”
March 2004. www.ecn.nl/library/horizontal.
2. K.J.Andersen and M.I Kisser. “Digestion soil, sludge, biowaste and waste for the extraction of aqua regia soluble elements – Horizontal Draft Standard” March 2004. www.ecn.nl/library/horizontal
3. K.J.Andersen and M.I Kisser. “Chemical Analysis - Digestion sediment, sludge, soil, biowaste and waste for the extraction of nitric acid soluble fraction of trace elements – Horizontal Draft Standard” March 2004. www.ecn.nl/library/horizontal
4. Gawlik, B.M., F. Bo, F. Sena, L. Roncari, G. Locoro & R. Vivian: Characterisation of “Playground” samples to be used in the context of Project “Horizontal”. Part 1: Inorganic parameters. SWCR-Report No 03/07/2004.
5. Youden, W.J. & E.H. Steiner: Statistical manual of the AOAC, Published by AOAC International. 1975.
6. EN 13657: Characterisation of waste – Digestion for subsequent determination of aqua regia soluble portion of elements, 2002
7. EN 13346 Characterisation of sludge – Determination of trace elements and phosphorus – Aqua regia extraction methods 2000
8. Giove,A.; Politi,M.; Cavallo,G.: Robustness study on standard methods developed by CEN TC 292/WG3, Italy 2000
9. Muntau, H.; Kisser, M. I.; Yuste, C.; Giove, A.; Bianchi, M.: The validation of CEN draft standards for the analysis of waste, Joint Research Centre, European Commission EUR 19680 EN, European Communities 2000
10. Certificate of BCR-144 (SL4), Community Bureau of Reference, Commission of the European Communities
11. Certificate of BCR-143, Community Bureau of Reference, Commission of the European Communities
12. Certificate of WQB-1, National Water Research Institute, Ontario, Canada
13. Roy, R.; Kainrath, P.: The EPA 3050 B Soil Digestion Method Versus EN 13346 Method Using a Graphite Digestion System, Soil Digestion Poster, Winter Conference, 2002
14. Gawlik, B.M., Crößmann, G., Bianchi, M., Muntau, H. (1999) In: B. M. Gawlik and H. Muntau (Eds.), EUROSOILS II – Laboratory reference materials for soil-related studies. EUR 18983 EN
15. Kisser, M.I.; Hollensteiner,C: Pre-normative research for EN 13657, “Vergleich von Königswasserauszügen mit und ohne Mikrowelle an 4 konkreten Abfallarten im Hinblick auf die Erstellung von Normen”, study for the Austrian Ministry of Environment, Ma. Enzersdorf, 1998
16. Dreher, P.; Kisser, M.I.; Peticka. R.; Scharf, W.: “Erden aus Abfällen”, study for the Austrian Ministry of Environment, Austria, 2000
17. EN ISO 15587-1 Water quality – Digestion for the determination of selected elements in water – Part 1: Aqua regia digestion, 2002
HORIZONTAL - 18 37

18. EN 13656: Characterisation of waste – Microwave assisted digestion with hydrofluoric (HF), nitric (HNO3) and hydrochloric (HCI) acid mixture for subsequent determination of elements, 2002
19. ISO/FDIS 14869-2 Soil quality – dissolution for the determination of total element content – Part 2: Dissolution by alkaline fusion, 2002
20. CEN TC 292/WG 3 WI 292042 “Characterisation of waste – Digestion of waste samples using alkali-fusion techniques”
21. EPA method 3015 A: Microwave assisted acid digestion of aqueous samples and extracts, Revision 1, 1998
22. EPA method 3051 A: Microwave assisted acid digestion of sediments, sludges, soils and oils, Revision 1,1998
23. EPA method 3052 A: Microwave assisted acid digestion of siliceous and organically based matrices, 1996
24. ISO TC 190/SC3/WG1 N 0326: Microwave assisted aqua regia digestion for the determination of selected elements
25. Rosenberg, E.: oral information, Technical University Vienna, November 2005
26. Lo, J.M.; Sakamoto, H.: Comparison of the Acid Combinations in Microwave assisted Digestion of Marine Sediments for Heavy Metal Analysis, Analytical Sciences, Vol 21, 1181-1184, October 2005
27. Lacort, G.; Camarero, L.: Characterisation of Lake Sediments – Extraction Method of Elements Soluble in Aqua Regia, University of Barcelona,
28. Chen, M; MA, L.Q.: Comparison of three Aqua Regia Digestion Methods for Twenty Florida Soils, Soil Science Society of America Journal 65:491-499 (2001)
29. Riebe,G.; Pritzkow, W.; Vogl,J.: A Comparative Study in the Field of Soil Analysis, Federal Institute for Material Research and Testing (BAM), 2004
38 HORIZONTAL - 18