digging into data white paper - university of...
TRANSCRIPT

White Paper
1
DIGGING INTO DATA WHITE PAPER
TRADING CONSEQUENCES
Ewan Klein School of Informatics, University of Edinburgh, UK
Beatrice Alex Claire Grover Richard Tobin Colin Coates Multidisciplinary Studies Department, Glendon
College, York University, Toronto, Canada Jim Clifford History Department, University of
Saskatchewan, Saskatoon, Canada Aaron Quigley SACHI, School of Computer Science, University
of St Andrews, UK Uta Hinrichs James Reid EDINA, University of Edinburgh, UK Nicola Osborne Ian Fieldhouse
March 2014

White Paper
2
1 Executive Summary: ...................................................................................... .............. 4
2 Introduction .................................................................................................... .............. 5
3 Research Results ........................................................................................... .............. 7
3.1 Historical Research ................................................................................................ 7
3.2 Research related to Text Mining ............................................................................ 9
3.2.1 Effects of OCR Errors on Text Mining .......................................................... 10
3.2.2 Lexicon Creation ........................................................................................... 11
3.2.2.1 Technical Description ............................................................................ 11
3.2.2.2 Manual Curation from Archival Sources ................................................ 13
3.2.2.3 Bootstrapping the Lexicon ..................................................................... 16
3.2.3 Text Mining .................................................................................................. 18
3.3 Visualisation Research ........................................................................................ 26
3.3.1 General Challenges and Goals .................................................................... 26
3.3.1.1 Enabling Open-Ended Explorations ....................................................... 27
3.3.1.2 Providing Multiple Entry Points into the Data Collection ........................ 28
3.3.1.3 Enable High-Level Overviews while Providing Direct Access to Documents ......................................................................................................... 29
3.3.2 Exploration 1: Interlinking Geospatial, Temporal, and Contextual Dimensions ............................................................................................................ 29
3.3.3 Exploration 2: Showing Relations Between Different Commodities ............. 34
3.3.4 Exploration 3: Mapping Location Mentions across Time ............................. 37
3.3.5 Exploration 4: Commodity Trading & Climate Change ................................. 42
3.3.6 Summary ...................................................................................................... 44
3.3.7 Visualisation user feedback .......................................................................... 44

White Paper
3
3.4 Prototype feedback .............................................................................................. 44
3.4.1 Challenges .................................................................................................... 45
4 Datasets, Software, Algorithms and Techniques ........................................... ............ 45
4.1 Lexicon Development .......................................................................................... 45
4.2 Text mining and Geo-referencing ........................................................................ 46
4.3 Database ............................................................................................................. 46
4.4 Visualisation ......................................................................................................... 52
5 Dissemination ................................................................................................. ............ 53
5.1 Publications and talks .......................................................................................... 53
5.2 Dissemination via Social Media ........................................................................... 54
6 Project Management ..................................................................................... ............ 59
7 Lessons Learned ............................................................................................ ............ 60
7.1 The value of big data for historical research ........................................................ 60
7.2 Data Access ......................................................................................................... 61
7.3 Cross-disciplinarity ............................................................................................... 62
7.4 Annotation ........................................................................................................... 63
7.5 Visualisation ......................................................................................................... 63
8 Conclusion ..................................................................................................... ............ 63
9 References ..................................................................................................... ............ 65
White Paper
4
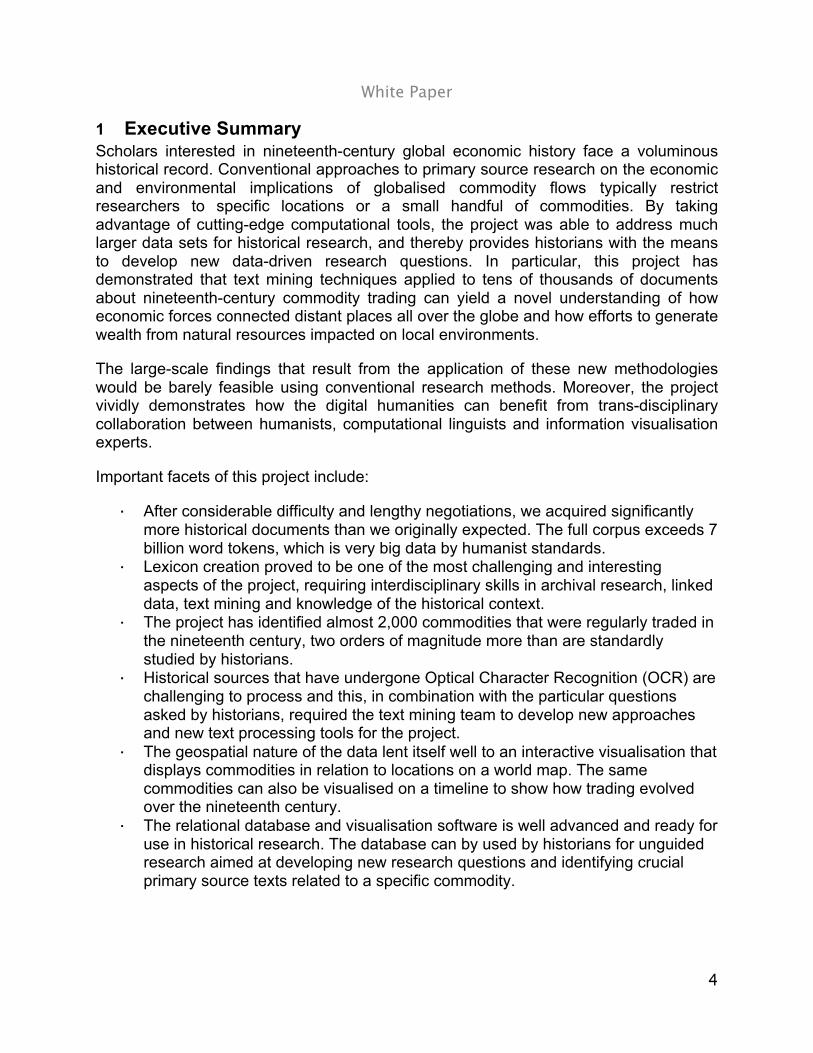
1 Executive Summary Scholars interested in nineteenth-century global economic history face a voluminous historical record. Conventional approaches to primary source research on the economic and environmental implications of globalised commodity flows typically restrict researchers to specific locations or a small handful of commodities. By taking advantage of cutting-edge computational tools, the project was able to address much larger data sets for historical research, and thereby provides historians with the means to develop new data-driven research questions. In particular, this project has demonstrated that text mining techniques applied to tens of thousands of documents about nineteenth-century commodity trading can yield a novel understanding of how economic forces connected distant places all over the globe and how efforts to generate wealth from natural resources impacted on local environments.
The large-scale findings that result from the application of these new methodologies would be barely feasible using conventional research methods. Moreover, the project vividly demonstrates how the digital humanities can benefit from trans-disciplinary collaboration between humanists, computational linguists and information visualisation experts.
Important facets of this project include:
· After considerable difficulty and lengthy negotiations, we acquired significantly more historical documents than we originally expected. The full corpus exceeds 7 billion word tokens, which is very big data by humanist standards.
· Lexicon creation proved to be one of the most challenging and interesting aspects of the project, requiring interdisciplinary skills in archival research, linked data, text mining and knowledge of the historical context.
· The project has identified almost 2,000 commodities that were regularly traded in the nineteenth century, two orders of magnitude more than are standardly studied by historians.
· Historical sources that have undergone Optical Character Recognition (OCR) are challenging to process and this, in combination with the particular questions asked by historians, required the text mining team to develop new approaches and new text processing tools for the project.
· The geospatial nature of the data lent itself well to an interactive visualisation that displays commodities in relation to locations on a world map. The same commodities can also be visualised on a timeline to show how trading evolved over the nineteenth century.
· The relational database and visualisation software is well advanced and ready for use in historical research. The database can by used by historians for unguided research aimed at developing new research questions and identifying crucial primary source texts related to a specific commodity.

White Paper
5
·
2 Introduction “Globalisation” has become a catchphrase for current times, demonstrating that the increasing exchange of ideas and goods is held to be a hallmark of contemporary society. Yet historians have shown that large-scale global trade, migration and exchange of ideas began long before the late twentieth century. Industrial development, such as the processes in Britain, helped accelerate global exchanges during the long nineteenth century (normally dated from the French Revolution in 1789 to the beginning of the First World War in 1914). Historian John Darwin estimates that world trade increased ten-fold between 1850 and 1913 (Darwin, 2009: 114). In this period, trade focused primarily on commodities, usually raw materials, and it occurred within the formal and informal bonds of imperial influences. The global economy expanded as European and American nations colonised frontiers rich with natural resources. Given the magnitude of demand from urbanising and industrialising core economies, the extraction of these commodities led to noticeable, sometimes dire, environmental consequences in the resource hinterlands. As a result, even in the nineteenth century, economic decisions made in financial and economic centres such as London, Paris, Berlin and New York touched the most remote regions of the globe.
Europeans reshaped the global environment as they voyaged across the oceans, moving plants and animals between ecosystems, and transporting natural resources back home. As Alfred Crosby’s classic study showed, this process started long before the nineteenth century (Crosby, 2004). The novelty of the long nineteenth century lay in the scale of activity: increased demands for a wide range of natural resources inaugurated a huge growth in the scale of the global commodity trade. In particular, new transportation technologies such as railways and steamships and the concurrent expansion of European empires intensified the pace of global trade in the second half of the nineteenth century.
Research questions relating to the implications of commodity trades were long a mainstay of Canadian economic history. Economic geographer Harold Innis, to whom the “Staple Theory” approach to Canadian history is attributed, explored the consequences of distant, external demand for Canadian primary resources, especially in the fields of the cod fishery off Newfoundland and the fur trade in the interior of the continent (Innis, 1978, 1999). In a series of short articles, Innis also examined other resources such as cheese, wheat, and minerals (Innis, 1956). Innisian approaches to Canadian economy history attracted a great deal of academic attention from the 1960s through the 1980s, but in subsequent decades, historians have shifted their focus to other features of Canadian social and cultural history.
The recent surge of interest in environmental history has brought earlier questions to the fore again, though in a different context. In the early “Staples Theory” literature, scholars paid some attention to questions of environmental impact and change, but these were far from their central focus. From the point of view of the historians involved in “Trading Consequences,” the goal of the project was to test the conclusions of an

White Paper
6
earlier generation of Canadian economic historians and develop these as test cases for the new digital humanities methodology. This project aimed to go far beyond the geographical borders of Canada, in examining the scope and understanding of resource trade and movement through the nineteenth-century British “world.” This involves of course the study of the formal British Empire, as well as countries with which Britain traded but did not politically subjugate. We therefore made early contacts with a cognate research group: the Commodities of Empire1 network based in London. Our goal was to make a research tool available to a range of scholars interested in global trading patterns.
This collaborative project between environmental historians in Canada and computational linguists and computer scientists in the UK used text mining software to explore over eleven million pages of historical documents related to trade in the British world during the nineteenth century. We amassed a large corpus of digitised historical documents, including the House of Commons Parliamentary Papers (ProQuest), the Early Canada Online collection (Canadiana.org), the Confidential Print Collection (Adam Matthew Digital), a metadata collection from the Kew Gardens Directors’ Correspondence project, the Asia and the West Collection: Diplomacy and Cultural Exchange (Gale) and a sub-part of the Foreign and Commonwealth Office Collection (JSTOR). The corpus is significantly larger than we had originally intended.
We used text mining – more specifically information and relation extraction as well as entity grounding – to transform unstructured text into a relational database. This digital resource will allow historians to discover new patterns and to explore new hypotheses, both through structured query and through a variety of innovative visualisation tools. We developed the interface not merely to advance our specific research interests, but also to make this tool available to a broad range of scholars. The timing of this White Paper has meant that while we will release the database publicly at the end of the grant period, the historians have had limited time to explore its functionality. Hence, the hypotheses we explore remain fairly preliminary at this stage. However, we will continue to work with these data over the coming months to pursue our research (and indeed have submitted new funding applications to allow this work to proceed). Throughout the project, we have solicited advice from potential user groups, and this iterative process has improved the functionality of the database interface.
Alongside the project’s success in adapting text mining and visualisation methods to historical research, we also demonstrated the value of interdisciplinary research in the digital humanities. While there is a lot to be gained by humanists learning to code and use advanced digital methods, the collaborative research with computational linguists and computer scientists opens up new opportunities for everyone involved. Using the techniques honed in the project, historians will gain invaluable experience in how vast amounts of data can be used to answer significant economic and environmental questions related to the past. The Canadian test case will act as a well-developed prototype that will provide a model for historians interested in other regions. 1 http://www.open.ac.uk/Arts/ferguson-centre/commodities-of-empire/index.shtml

White Paper
7
3 Research Results
3.1 Historical Research One of the starting points for the project was the creation of a list of commodities imported into Britain during the nineteenth century. In 2012, Jim Clifford spent several weeks in London at the National Archives, Kew Gardens Library and Archive, and the London Metropolitan Archive researching a few specific commodities (e.g. palm oil and cinchona, the tree whose bark produced anti-malarial quinine) and developing an initial list of commodities that the text mining team could use. The annual imports ledgers in the Customs records at the National Archives proved to be the most comprehensive source for this research. Over several months this list was expanded to include over four hundred commodities imported into Britain during the nineteenth century.
Early in the project, we committed to comparing traditional archives-based historical research methods to the results generated by the text mining and visualisations. To this end Clifford completed archival research on the relationship between industrial development in London, economic botany and the commodification of nature in the British World. He used this research to write a paper on the globalising supply of tallow, palm oil, coconut oil and other fats required by the expansion of London’s soap and candle industries. We quickly found that the knowledge developed through historical research helped us troubleshoot the early prototypes and allowed us to provide useful feedback to the text mining and visualisation teams in Scotland.
Further to aid in these efforts of refining the database and to help with the goals of the project, the history team hired a research assistant to compile a bibliography of scholarly works that focused on the environmental and economic effects of the nineteenth-century commodity trade. This bibliography was consulted when the database produced surprising or confusing results. We also shared this bibliography with the Commodities Histories project and allowed them to use it as the foundation of the bibliography2 on their website. By augmenting the historical research component of the project, the historians helped the computational linguists refine the database and develop a more historically minded research tool.
Although the relational database cannot replace archival research, in some cases it served as a kind of substitute. Jim Clifford’s initial visit to the archives revealed that an important ledger listing the imports of cinchona bark to London during the mid-nineteenth century had been destroyed. This ledger would likely have provided important insights into the trade of cinchona bark around the world and sparked some interesting avenues for further research. Mined from millions of pages of digitised text, however, the project’s relational database provided a great deal of information related to this commodity. By demonstrating how cinchona turned up in different places at different times, the relational database and visualisation software reflected and confirmed previous research by other scholars demonstrating the transnational connections of the trade during the nineteenth century (Philip, 1995). 2 http://www.commodityhistories.org/resources/bibliography

White Paper
8
The historians have also begun work on connecting the text-mined results with a historical geographic information system. This involved developing methods to extract subsets of data and import them into ArcGIS, while at the same time developing new HGIS data from other sources, including Ordinance Survey maps and trade ledgers. Over time we plan to build the different layers into maps showing the relationship between industrial development in London and global commodity frontiers spread throughout the world. The spatial and temporal database provides a powerful analytical tool for exploring and visualising our data.
The ability to connect commodities with a fairly specific and meaningful geographical context underpins our efforts to reach historically significant conclusions related to nineteenth-century commodity flows and their environmental and economic consequences. The database was accurate at parsing commodities, dates and place names from millions of pages of text. The Edinburgh Geoparser used an extensive list of place names contained in the Geonames Gazetteer. But in some cases, Geonames was unable to accurately identify place names that do not exist or are longer are in common use. To compensate for this weakness in the Geoparser, the history team hired a research assistant to review a test sample of place name errors, and annotate the list of place names used by the database. In many cases this involved finding places that were misread during the text mining phase due to OCR file errors. Most cases, however, involved finding places that were simply not included in the Gazetteer, no longer exist on contemporary maps, or were synonyms that are no longer used for current place names. Although this exercise was only used on a sample of 150 document extracts, the efforts succeeded in revealing that text mining requires constant feedback in order to refine and hone the data used to create insightful relationships between commodities and places over time. This work identified a future research project to develop a more complete gazetteer of nineteenth-century locations and a database of nineteenth-century geographies that would allow us to correctly associate a place name with the correct geography for any particular year. As was true about many parts of the globe, the political borders of Canada and the United States changed significantly over the course of the nineteenth century.
Throughout the prototype stages of this project, the history team focused on exploring commodities that would help refine the development of the text mining and visualisation programs. In other words, the use of the database for research was not done with specifically end user purposes in mind, but always included an aspect of project development. Now that the relational database is more finely tuned to the kind of entity recognition extraction (identifying a wide variety of commodities within their geospatial and temporal contexts) useful for historical research, the history team can now make the database available to historians for unguided research. This will allow the history team to determine the database’s strengths as a research and visualisation tool. Historians will be able to pursue relevant research topics by using the database to isolate crucial primary source texts related to a specific commodity. At the same time, the visualisation will provide historians exploring a defined research topic with more structured information that places a specific commodity in a changing geospatial and temporal context, enabling the historian to ask novel questions of his or her research

White Paper
9
topic. Moreover, the visualisation interface now allows historians to download the raw data behind the results and work with these more directly.
A very important part of the project involved exploring the methodological implications of the text-mined database and visualisation tools. Progress on this aspect of the project was delayed when Jim Clifford accepted a job as an Assistant Professor in the History Department at the University of Saskatchewan beginning July 2013. The SSHRC granted an extension to allow project work to continue beyond the initial end-date of the grant. The history team has now hired a replacement for Jim, Andrew Watson, who will explore how the database and visualisation may help historians with research. Specifically, the project wants to learn how historians may use the information contained in millions of pages of documents if they employ text mining methods to extract only the data related to a specific commodity. Somewhat related, we will explore to what extent text mining can help historians identify avenues of research and identify crucial primary sources that would otherwise have remained hidden in large data collections. Although the work on the database is complete, the history team at York University and the University of Saskatchewan will continue to work with the visualisation team at the University of St. Andrews to conduct research and explore the methodological contributions of this project to the study of history.
3.2 Research related to Text Mining The initial challenge from a text mining perspective was setting aside the knowledge of what text mining was capable of given current data and contemporary problems, and instead adjusting the focus to what text mining could do given available digitised historical sources and research questions. Rather than asking for coarse-grained, aggregate measures related to commodity flows using an expansive set of big data, this project asked more historically minded, subtle and challenging questions using a limited yet still extremely large amount of data. The text mining portion of the project was therefore less focused on what text mining is capable of and more on how text mining can serve the research agendas of historians. The text mining team mobilised their knowledge of natural language processing methods and isolated the features that contributed the most to approaching historical research on the trade of commodities during the nineteenth century. The kinds of information historians need in order to make sense of the past informed the types of data, mining, software, algorithms, layouts and methods that the text mining team used to create a relational database. In some cases, the technology available could not analyse the data contained in the sources available with high accuracy (e.g. text mining is incapable of making sense of information stored tables), but in most cases the types of information historians were interested in mining from unstructured digitised textual documents were obtainable through collaboration between both teams. Since historians ask precise questions, the text mining team developed a more nuanced approach to retrieving information from the millions of pages of text.

White Paper
10
3.2.1 Effects of OCR Errors on Text Mining Early on in the project it became clear that the quality of some of the OCRed content analysed was very low. We therefore did some analysis of the OCR word error rate for a random subset of Canadiana (25 page records). We created a manually corrected gold standard for this sub-set and determined the word error rate of the original OCR compared to the gold standard to be 0.224 (see Alex et al. 2012). We also found some systematic errors throughout the OCRed collection such as the confusion of the long ‘s’ as ‘f’ and the soft-hyphens at the end of lines splitting words into separate tokens. We devised two dictionary-based methods for correcting these problems. This improved the word error rate by 12% and our evaluation showed that both methods deal successfully with 72% of cases.
Throughout Trading Consequences we looked at many documents in the OCRed collections and found that in some of them the text quality was so bad that they were beyond post-correction. This could be, for example, as a result of poor paper and printing quality or the use of old fonts which were not easily recognisable by the OCR engine. Other reasons include the layout of the page (for example pages containing tables, multiple columns, headers and footers or notes in margins) or carelessness when scanning a page (scans at an angle or up-side-down). Given the economic history focus of this research, a great deal of relevant data was unusable because so much statistical information was expressed in tabular form. Therefore, we were unable to extract information on quantities and volumes of commodity trade, and we relied instead on more traditional archival work for obtaining these figures. For more standard textual documents, we were curious to determine whether estimating the text quality and applying a quality threshold would help to filter out documents with such a low text quality that readers would find them difficult to read and understand. We also wanted to understand how well text quality can be rated manually and how automatic scoring compares to manual rating.
We employed a simple quality estimate which counts the ratio of good words (words found in the dictionary, or numerals) versus all words in the document which we call the simple quality (SQ) score. We used the English aspell dictionary for this analysis. Using this method we computed a quality score for all English Early Canadian Online documents (55,313). We then selected a random sample of 100 documents with the SQ scores spread across the entire range (0>=SQ<1). We asked two raters to rate the quality of each document manually using a 5-point scale (with 5 representing high quality and 1 extremely low quality). This allowed us to determine inter-rater agreement using the weighted Kappa score (Cohen, 1968). It amounts to 0.516 (moderate agreement) for the 5 categories and 0.60 (the top end of moderate agreement) when collapsing the scale to 3 points by combining 5 and 4 as well as 1 and 2 into one category. The results show that the raters differentiate well between good and bad text quality but had difficulties reliably rating documents with mediocre quality. A similar pattern emerges when comparing the automatically computed SQ scores to the manual ratings. This evaluation shows that it would be advisable to set a quality threshold of 0.7 and ignore any documents with an SQ value below that threshold. For Early Canadiana Online, applying such threshold-based filtering results in 10.9% of data

White Paper
11
being discarded. As a result of error analysis of the text mining output, we also found that OCR errors have a negative effect on recall. This is more the case for proper nouns than for common nouns, presumably because OCR engines rely on language models or dictionaries which do not contain many proper nouns. When processing big data, it is the case that OCR errors often disappear in the volume of data. However, in cases where OCR errors lead to real world errors, text mining results can be skewed significantly (for example, time is often misrecognised as lime). More detailed results and discussion of this work are included in a paper to appear at DATeCH 2014 (Alex and Burns, 2014).
3.2.2 Lexicon Creation The list of commodities and places, which the text mining team used to create the relational database and the visualisation team used to create the maps and timelines, was one of the most critical but also challenging and time-consuming features of the project start-up and refinement. On its surface the task appeared simple enough: compile a list of commodities and the places they are associated with. The difficulty with doing this, however, is that absolutely every commodity and basically every place in the world has a variety of designations. In order for each entity to be recognised in its proper lexicon – in relation to other names for, or varying degrees of specificity of, the same commodity/place – all three teams had to work in close collaboration to structure the text mining and visualisation components of the project. This involved a significant amount of initial work to develop and working lexicon of commodities and place names, which was then modified and refined as each new iteration of the software was tested. Early tests revealed where text mining was failing to extract important data, which were corrected by making adjustments to how the software read associations between closely related terms within an improved lexicon. In some cases the difficulties related to poorly OCR-ed documents, which brought up inaccurate relationships within the data and misplaced data in the visualisations.
3.2.2.1 Technical Description In recent years, the dominant paradigm for NER has been supervised machine learning. However, to be effective, this requires a considerable investment of effort in manually preparing suitable training data. Since we lacked the resources to create such data, we decided instead to provide the system with a look-up list of commodity terms. While there is substantial continuity over time in the materials that are globally traded as commodities, it is difficult to work with a modern list of commodity terms as they include many things that did not exist, or were not widely traded, in the nineteenth century. There are also a relatively large number of commodities traded in the nineteenth century that are no longer used, including a range of materials for dyes and some nineteenth-century drugs. As a result, we set out to develop a new lexicon of commodities traded in the nineteenth century.
Before discussing in detail the methods that we used, it is useful to consider some of our requirements. First we wanted to be able to capture the fact that there can be multiple names for the same commodity; for example, rubber might be referred to in several ways, including not just rubber but also India rubber, caoutchouc and caou-

White Paper
12
chouc. Second, we wanted to include a limited amount of hierarchical structure in order to support querying, both in the database interface and also in the visualisation process. For example, it ought be possible to group together limes, apples and oranges within a common category (or hypernym) such as Fruit. Third, we wanted the freedom to add arbitrary attributes to terms, such as noting that both nuts and whales are a source of oil.
These considerations argued in favour of a framework that had more structure than a simple list of terms, but was more like a thesaurus than a dictionary or linguistically-organised lexicon. Thus our priorities were distinct from those addressed by the lemon lexicon model (McCrae et al., 2010). This made SKOS (Simple Knowledge Organization System) an obvious choice for organising the thesaurus (Miles and Bechhofer, 2009). SKOS assumes that the ‘hierarchical backbone’ of the thesaurus is organised around concepts. These are semantic rather than linguistic entities, and serve as the hooks to which lexical labels are attached. SKOS employs the Resource Description Framework (RDF)3 as a representation language; in particular, SKOS concepts are identified by URIs. Every concept has a unique ‘preferred’ (or canonical) lexical label (expressed by the property skos:prefLabel), plus any number of alternative lexical labels (expressed by skos:altLabel). Both of these RDF properties take string literals (with an optional language tag) as values.
Figure 1 below illustrates how SKOS allows preferred and alternative lexical labels to be attached to a concept such as dbp:Natural_Rubber.
Figure 1: Preferred and Alternative Lexical Labels in SKOS.
3 http://www.w3.org/RDF/
dbp:Natural_Rubber
skos:Concept
"rubber"@en
"India rubber"@en
rdf:type
skos:prefLabel
skos:altLabel
skos:altLabel"caoutchouc"@fr

White Paper
13
The graph illustrates a standard shortening for URIs, where a prefix such as dbp: is an alias for the namespace http://dbpedia.org/resource/. Consequently dbp:Natural_Rubber is an abbreviation that expands to the full URI http://dbpedia.org/resource/Natural_Rubber. In an analogous way, skos: and rdf: are prefixes that represent namespaces for the SKOS and RDF vocabularies.
While a SKOS thesaurus provides a rich organisational structure for representing knowledge about our domain, it is not in itself directly usable by our toolset; a further step is required to place the prefLabel and altLabel values from the thesaurus into the XML-based lexicon structure required by LTXML tools during the named entity recognition. We will discuss this in more detail in the following section.
Next, we described how we created a seed set of commodity terms manually and used it to bootstrap a much larger commodity lexicon.
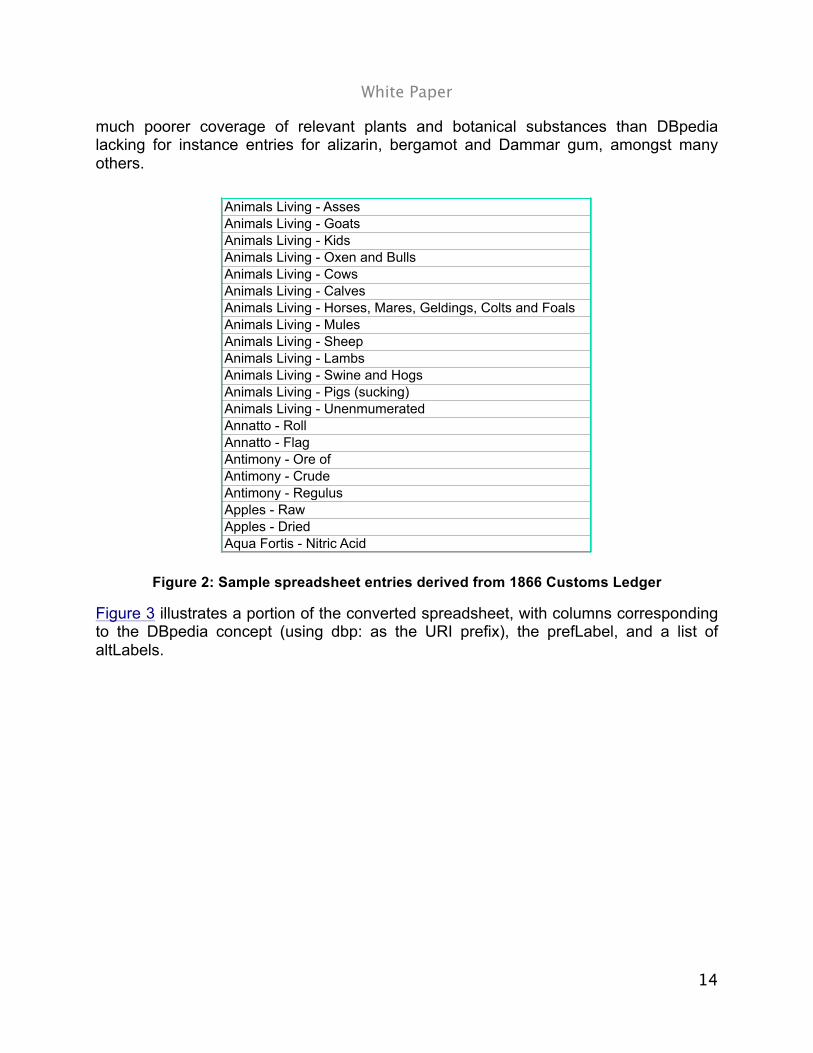
3.2.2.2 Manual Curation from Archival Sources We took as our starting point the records of the Boards of Customs, Excise, and Cus- toms and Excise, and HM Revenue and Customs (CUST 5). They include a collation of annual ledger books listing all of the major goods, ranging from live animals to works of art, imported into Great Britain during any given year during the nineteenth century. These contain a wealth of material, including a list of the quantity and value of the commodities broken down by country. For the purpose of developing a list of commodities, we focused on the headings at the top of each page, drawing on the four books of the 1866 ledgers, which were the most detailed year available. All together, the 1866 ledgers listed 760 different import categories. This data was manually transferred to a spreadsheet in a manner which closely reflected the original, and a portion is illustrated in Figure 2. Since we restricted our analysis to raw materials or lightly processed commodities, we discarded all commodities which did not fit this definition. We used the selected commodities as a seed set for expanding our commodity lexicon automatically.
As can be observed, the bipartite structure of these entries conveyed by the hyphen is semantically quite heterogeneous. For example, in Animals Living - Asses, the ‘X - Y ’ pattern corresponds to ‘X is a superclass of Y ’, while in Apples - Raw, it corresponds to something like ‘X is in state Y ’. Finally, in Aqua Fortis - Nitric Acid, it seems to be indicating that the two terms are synonyms.
The two major steps in converting the Customs Ledger records into a SKOS format were (i) selecting a string to serve as the SKOS prefLabel, and (ii) associating the prefLabel with an appropriate semantic concept. Both these steps were carried out manually. For obvious reasons, we wanted as far as possible to use an existing ontology as a source of concepts. While we initially experimented with UMBEL, an extensive upper ontology in SKOS format based on OpenCyc, we eventually decided in favour of DBpedia instead. One minor irritation with UMBEL was that while it made quite fine, and potentially useful, ontological distinctions, it did so inconsistently or with inconsistent naming conventions. A more substantial concern was that UMBEL had
White Paper
14
much poorer coverage of relevant plants and botanical substances than DBpedia lacking for instance entries for alizarin, bergamot and Dammar gum, amongst many others.
Animals Living - AssesAnimals Living - GoatsAnimals Living - KidsAnimals Living - Oxen and BullsAnimals Living - CowsAnimals Living - CalvesAnimals Living - Horses, Mares, Geldings, Colts and FoalsAnimals Living - MulesAnimals Living - SheepAnimals Living - LambsAnimals Living - Swine and HogsAnimals Living - Pigs (sucking)Animals Living - UnenmumeratedAnnatto - RollAnnatto - FlagAntimony - Ore ofAntimony - CrudeAntimony - RegulusApples - RawApples - DriedAqua Fortis - Nitric Acid
Figure 2: Sample spreadsheet entries derived from 1866 Customs Ledger
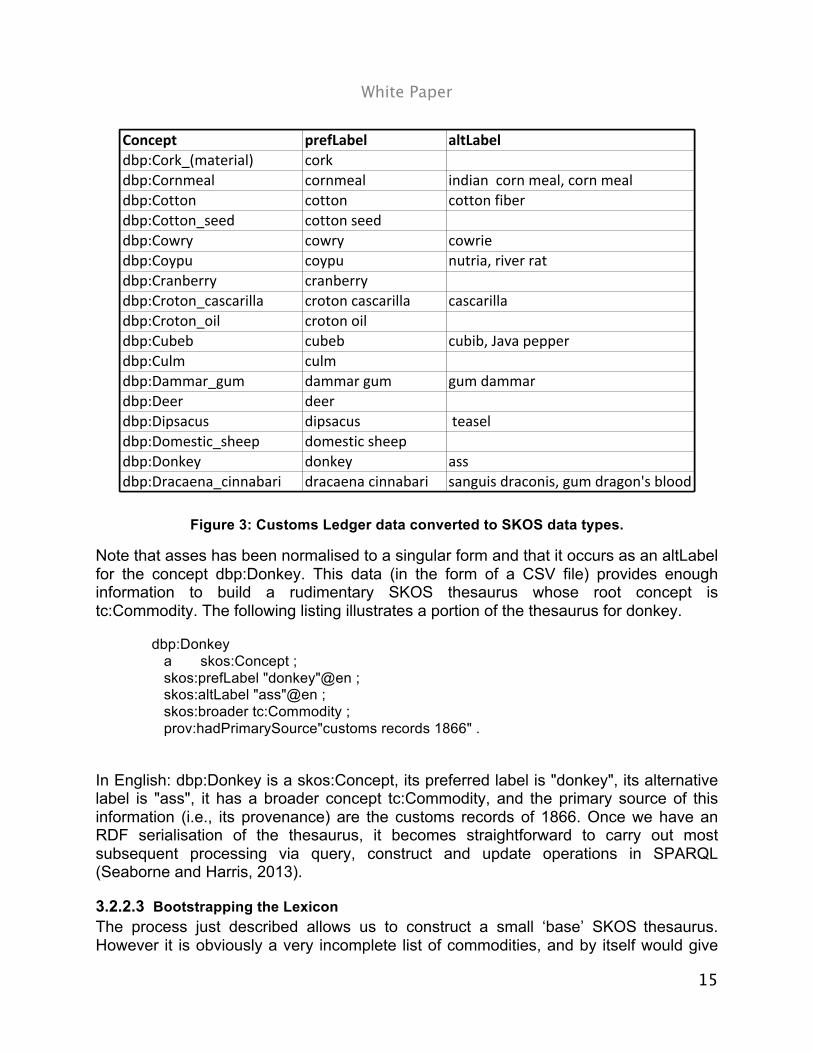
Figure 3 illustrates a portion of the converted spreadsheet, with columns corresponding to the DBpedia concept (using dbp: as the URI prefix), the prefLabel, and a list of altLabels.
White Paper
15
Concept prefLabel altLabeldbp:Cork_(material) corkdbp:Cornmeal cornmeal indian44corn4meal,4corn4mealdbp:Cotton cotton cotton4fiberdbp:Cotton_seed cotton4seeddbp:Cowry cowry cowriedbp:Coypu coypu nutria,4river4ratdbp:Cranberry cranberrydbp:Croton_cascarilla croton4cascarilla cascarilladbp:Croton_oil croton4oildbp:Cubeb cubeb cubib,4Java4pepperdbp:Culm culmdbp:Dammar_gum dammar4gum gum4dammardbp:Deer deerdbp:Dipsacus dipsacus 4teaseldbp:Domestic_sheep domestic4sheepdbp:Donkey donkey assdbp:Dracaena_cinnabari dracaena4cinnabari sanguis4draconis,4gum4dragon's4blood
Figure 3: Customs Ledger data converted to SKOS data types.
Note that asses has been normalised to a singular form and that it occurs as an altLabel for the concept dbp:Donkey. This data (in the form of a CSV file) provides enough information to build a rudimentary SKOS thesaurus whose root concept is tc:Commodity. The following listing illustrates a portion of the thesaurus for donkey.
dbp:Donkey a skos:Concept ; skos:prefLabel "donkey"@en ; skos:altLabel "ass"@en ; skos:broader tc:Commodity ; prov:hadPrimarySource"customs records 1866" .
In English: dbp:Donkey is a skos:Concept, its preferred label is "donkey", its alternative label is "ass", it has a broader concept tc:Commodity, and the primary source of this information (i.e., its provenance) are the customs records of 1866. Once we have an RDF serialisation of the thesaurus, it becomes straightforward to carry out most subsequent processing via query, construct and update operations in SPARQL (Seaborne and Harris, 2013).
3.2.2.3 Bootstrapping the Lexicon The process just described allows us to construct a small ‘base’ SKOS thesaurus. However it is obviously a very incomplete list of commodities, and by itself would give

White Paper
16
us poor recall in identifying commodity mentions. Many kinds of product in the Customs Ledgers included open ended subsections (i.e., Oil - Seed Unenumerated or Fruit - Unenumerated Dried). Similarly, while the ledgers provided a comprehensive list of various gums, they only specified anchovies, cod, eels, herring, salmon and turtles as types of “fish,” grouping all other species under the ‘unenumerated’ subcategory.
One approach to augmenting the thesaurus would be to integrate it with a more general purpose SKOS upper ontology. In principle, this should be feasible, since merging two RDF graphs is a standard operation. However, trying this approach with UMBEL4 threw up several practical problems. First, UMBEL includes features that go beyond the standard framework of SKOS and which made graph merging harder to control. Second, this technique made it extremely difficult to avoid adding a large amount of information that was irrelevant to the domain of nineteenth century commodities.
Our second approach also involved graph merging, but tried to minimize manual intervention in determining which subparts of the general ontology to merge into. We have already mentioned that one of our original motivations for adopting SKOS was the presence of a concept hierarchy. In addition to a class hierarchy of the usual kind, DBpedia contains a level of category, derived from the categories that are used to tag Wikipedia pages. The screenshot below illustrates categories, such as Domesticated animal, that occur on the page for donkey.
We believe that such Wikipedia categories provide a useful and (for our purposes) sufficient level of abstraction for grouping together the ‘leaf’ concepts that correspond to lexical items in the SKOS thesaurus (e.g., a concept like dbp:Donkey). Within DBpedia, these categories are contained in the namespace http://dbpedia.org/resource/Category: and are related to concepts via the property dcterms:subject. Given that the concepts in our base SKOS thesaurus are drawn from DBpedia, it is simple to augment the initial SKOS thesaurus G in the following way: for each leaf concept L in G, merge G with a new graph G′ containing edges of the form L dcterms:subject C whenever L belongs to category C in DBpedia. We can retrieve all of the categories associated with each leaf concept by
4 http://umbel.org

White Paper
17
sending a federated query that accesses both the DBpedia SPARQL endpoint and a local instance of the Jena Fuseki server5 which hosts our SKOS thesaurus.
Since some of the categories recovered in this way were clearly too broad or out of scope, we manually filtered the list down to a set of 355 before merging the graph G′ into the base thesaurus. To illustrate, the addition of the category dbc:Domesticated_animal to our previous example of SKOS triples yields the following output.
dbp:Donkey a skos:Concept ; skos:prefLabel "donkey"@en ; skos:altLabel "ass"@en ; skos:broader tc:Commodity , dbc:Domesticated_animal ; prov:hadPrimarySource "customs records 1866" .
Our next step also involved querying DBpedia, this time to retrieve all new concepts C which belonged to the categories recovered in the first step; we call this sibling acquisition, since it allows us to find siblings of leaf concepts that are already children of the Wikipedia categories already present in the thesaurus. The key steps in the procedure are illustrated in Figure 4 (where the top node is the root concept in the SKOS thesaurus, viz. tc:Commodity).
base thesaurus category acquisition sibling acquisition
Figure 4: Sibling Acquisition
5 http://jena.apache.org/documentation/serving_data/

White Paper
18
Given a base thesaurus with 319 concepts, sibling acquisition expands the thesaurus to a size of 17,387 concepts. We accessed DBpedia via the SPARQL endpoint on 16 Dec 2013, which corresponds to DBpedia version 3.9.
We mentioned earlier that in order to identify commodity mentions in text, we had to convert our SKOS thesaurus into an XML-based lexicon structure. This is illustrated in the XML shown below.
<lex> ... <lex category="Rubber|Nonwoven_fabrics" concept="Natural_rubber" word="caoutchouc"/> <lex category="Rubber|Nonwoven_fabrics" concept="Natural_rubber" word="indian rubber"/> <lex category="Rubber|Nonwoven_fabrics" concept="Natural_rubber" word="rubber"/> ... </lex>
The preferred and alternative lexical labels are stored as separate entries in the lexicon, with their value contained in the word attribute for each entry. The concept and category information is stored in corresponding attribute values; the pipe symbol (|) is used to separate multiple categories. We have already seen that alternative lexical labels will include synonyms and spelling variants (chinchona versus cinchona). The set of alternative labels associated with each concept was further augmented by a series of post-processing steps such as pluralisation, hyphenation and dehyphenation (cocoanuts versus cocoa-nuts versus cocoa nuts, and the addition of selected head nouns to form compounds (apple > apple tree, groundnut > groundnut oil); these are also stored in the lexicon as separate entries. The resulting lexicon contained 20,476 commodity terms.
During the recognition step, we perform case-insensitive matching against the lexicon in combination with context rules to decide whether or not a given string is a commodity. The longest match is preferred during lookup. The linguistic pre-processing is important in this step. For example, we exclude word tokens tagged as verb, preposition, particle or adverb in the part-of-speech tagging. As each lexicon entry is associated with a DBpedia concept and at least one category, both types of information are added to the extracted entity mentions for each successful match, thereby linking the text-mined commodities to the hierarchy present in our commodity thesaurus.
3.2.3Text Mining The text-mining component of the Trading Consequences architecture was developed iteratively in collaboration with database experts at EDINA and visualisation researchers at St. Andrews and as a result of interactive feedback by the environmental historians on the project as well as users not directly involved in the project. We developed the first text mining prototype approximately nine months into the project. Its output included commodity, location and date mentions, relations between commodities and locations as well as commodities and dates. With respect to identifying commodity mentions, we rely on gazetteer matching against a lexicon which was bootstrapped from a list of several hundred commodities and their alternative names provided to us by the

White Paper
19
historians. They manually extracted a list of several hundred raw materials or lightly processed commodities from customs ledgers stored at the National Archives (collection CUST 5), ranging from resources and related staples imported into Great Britain during the nineteenth century. The locations were recognised and geo-referenced using an adapted version of the Edinburgh Geoparser (Grover, 2010).
This prototype was integrated into an end-to-end system by month 12. The system architecture is visualised in Figure 5. Input documents are processed by the text mining component, and its output is stored in a relational database. This database is the back-end to two user interfaces.
Figure 5: Trading Consequences System Architecture.
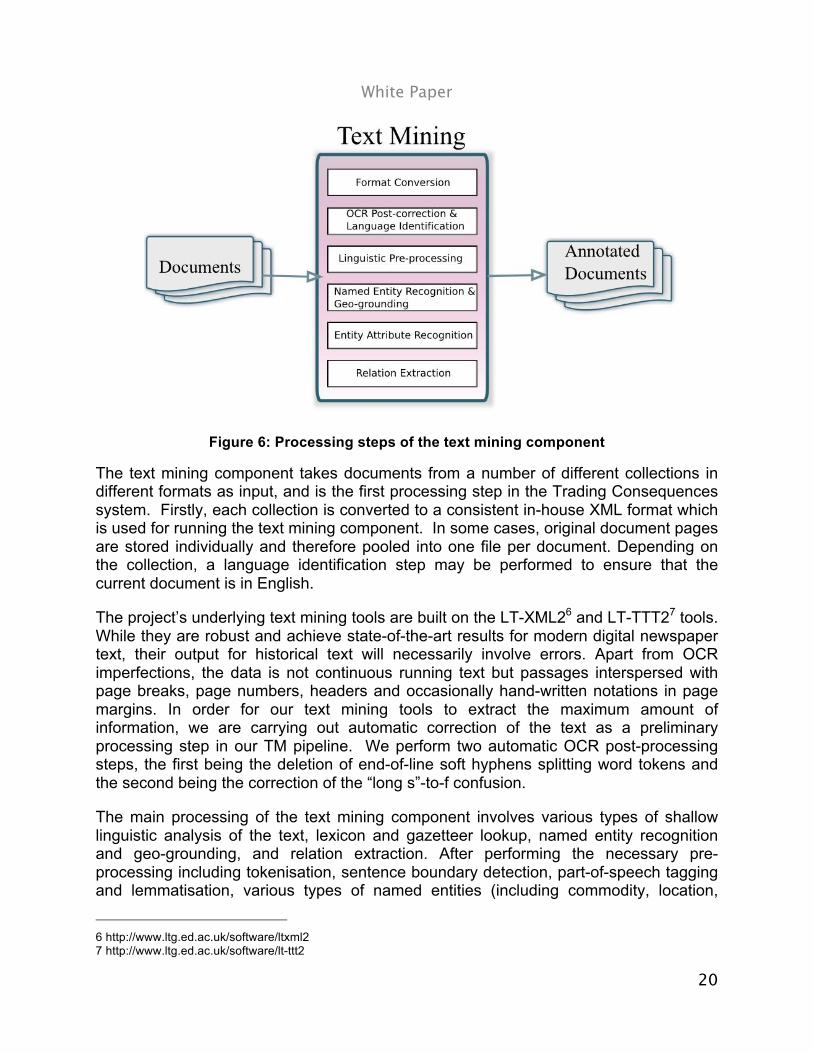
The text mining component is made up of several steps which are visualised in Figure 6.
White Paper
20
Figure 6: Processing steps of the text mining component
The text mining component takes documents from a number of different collections in different formats as input, and is the first processing step in the Trading Consequences system. Firstly, each collection is converted to a consistent in-house XML format which is used for running the text mining component. In some cases, original document pages are stored individually and therefore pooled into one file per document. Depending on the collection, a language identification step may be performed to ensure that the current document is in English.
The project’s underlying text mining tools are built on the LT-XML26 and LT-TTT27 tools. While they are robust and achieve state-of-the-art results for modern digital newspaper text, their output for historical text will necessarily involve errors. Apart from OCR imperfections, the data is not continuous running text but passages interspersed with page breaks, page numbers, headers and occasionally hand-written notations in page margins. In order for our text mining tools to extract the maximum amount of information, we are carrying out automatic correction of the text as a preliminary processing step in our TM pipeline. We perform two automatic OCR post-processing steps, the first being the deletion of end-of-line soft hyphens splitting word tokens and the second being the correction of the “long s”-to-f confusion.
The main processing of the text mining component involves various types of shallow linguistic analysis of the text, lexicon and gazetteer lookup, named entity recognition and geo-grounding, and relation extraction. After performing the necessary pre-processing including tokenisation, sentence boundary detection, part-of-speech tagging and lemmatisation, various types of named entities (including commodity, location,
6 http://www.ltg.ed.ac.uk/software/ltxml2 7 http://www.ltg.ed.ac.uk/software/lt-ttt2

White Paper
21
organisation and person names), temporal information, amounts and units are extracted and grounded.
We use an existing rule-based named entity recognition system which has been developed inhouse over a number of years and adapted to different types of text. It was last used in the SYNC3 project (Sarris et al. 2011) and includes the Edinburgh Geoparser which extracts location names and grounds them to the GeoNames8 gazetteer. It has also been applied in the GeoDigRef and Embedding GeoCrossWalk projects to identify named entities in eighteenth century parliamentary papers and enable more sophisticated indexing and search (see Grover et al., 2008 and Grover et al., 2010). We also determine date attributes for commodity entities and direction attributes (destination, origin or transit) for location entities, if available. In the case of the former, we choose date entities in close textual proximity of a commodity mention as the attribute value. If none are available, we assign the year of the document’s publication date as the date attribute value. The direction attributes are assigned on the basis of prepositions that signal direction occurring in front of locations, e.g. to, from, in etc. We also identify vocabulary referring to animal diseases and natural disasters in the text by means of two small gazetteers which we compiled manually. They contain entries like scabies, Rinderpest and ticks as well as drought, flood and tsunami, respectively.
Once the various entity mentions are recognised, a relation extraction step is performed where we determine which commodities are related to which locations. In the first prototype, we applied the simple baseline that a relation holds between a commodity and a location occurring in the same sentence. We decided against using syntactic parsing to identify such relations as we expected the OCRed text to be too noisy, resulting in too many failed parses. In summary, we determine which commodities were traded when and in relation to which locations. We also determine whether locations are mentioned as points of origin, transit or destination, reflecting trade movements to and from certain locations and whether vocabulary relating to diseases and disasters appears in the text. All these pieces of information are added back into the XML document as different layers of annotation. This allows us to visualise documents for the purpose of error analysis. Figure 7 shows some of the entities we extract from the text, e.g. the locations Pandang and America, the year 1871, the commodity cassia bark and the quantity and unit 6,127 piculs. The text mining component further extracts that Pandang is an origin location and America is a destination location and geo-grounds both locations to latitudes and longitudes, information not visible in this figure. The commodity-location relations cassia bark-Pandang and cassia bark-America, visualised by the red arrow.
8 http://www.geonames.org

White Paper
22
Figure 7: Excerpt from "Spices" (Ridley, 1912). The text mined information is highlighted in colour and relations are visualised using arrows.
Examples of what this extracted and enriched information looks like in our in-house XML format are listed below:
<ents> … <ent id="rb5370" type="location" lat="-0.9492400" long="100.3542700" in-country="ID" gazref="geonames:1633419" feat-type="ppla" pop-size="840352" direction="origin"> <parts> <part sw="w446944" ew="w446944">Padang</part> </parts> </ent> <ent id="rb5371" year="1871" type="date"> <parts> <part sw="w446968" ew="w446968">1871</part> </parts> </ent> … <ent id="rb5373" type="commodity" dates="1871"> <parts> <part sw="w446990" ew="w446997">cassia bark</part> </parts> </ent> … </ents> <relations> … <relation type="com-loc" id="r591"> <argument ref="rb5373" text="cassia bark"/> <argument ref="rb5370" text="Padang"/> </relation> … </relations>
The extracted information is entered into the Trading Consequences database. More information on the TC prototype is included in the book chapter “User-driven Text Mining of Historical Text” which is to appear at part of the book “Working with text: Tools, techniques and approaches for text mining” published by Chandos.

White Paper
23
Figure 8: Trading Consequences query interface.
The first TC prototype included a query interface developed by EDINA (Figure 8). Further visualisation interfaces were created for prototype 2 and 3 (see Section 2.3).
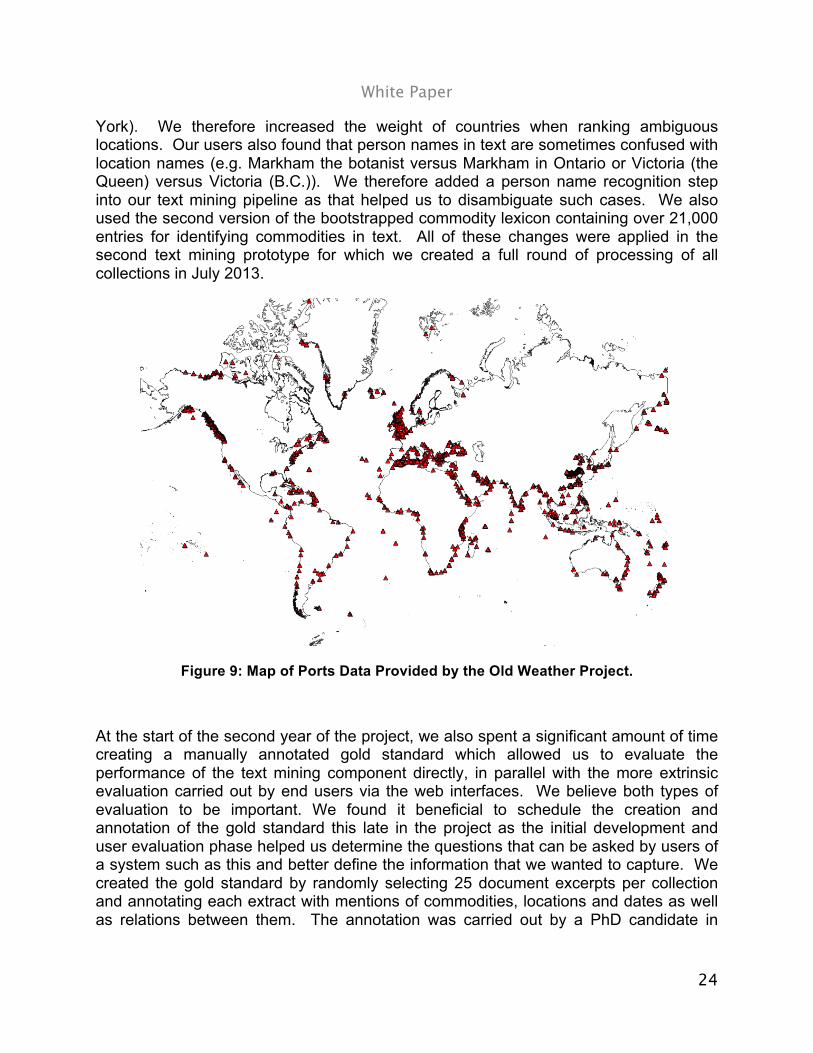
The initial query interface allowed users to search the TC database for commodities and/or related locations and displayed information on a heat map. This system was used for the first user evaluation which resulted in extremely useful feedback to improve the text mining. As a result we adapted our tools, extracted new types of information and improved the accuracy of existing output. For example, the historians noted early on that locations which are and were ports would be of more importance with respect to trade. We therefore adapted the Edinburgh Geoparser to give a higher ranking to locations which coincide with an entry in a geo-referenced list of ports which we aggregated from different sources as part of the project (Figure 9).9 The information presented via the query interface also showed examples of country names being wrongly geo-referenced to smaller locations (e.g. Jamaica was located in Queens, New
9 http://blog.oldweather.org/category/data/ (base layer provide by OpenStreetMaps under a ODb licence).
White Paper
24
York). We therefore increased the weight of countries when ranking ambiguous locations. Our users also found that person names in text are sometimes confused with location names (e.g. Markham the botanist versus Markham in Ontario or Victoria (the Queen) versus Victoria (B.C.)). We therefore added a person name recognition step into our text mining pipeline as that helped us to disambiguate such cases. We also used the second version of the bootstrapped commodity lexicon containing over 21,000 entries for identifying commodities in text. All of these changes were applied in the second text mining prototype for which we created a full round of processing of all collections in July 2013.
Figure 9: Map of Ports Data Provided by the Old Weather Project.
At the start of the second year of the project, we also spent a significant amount of time creating a manually annotated gold standard which allowed us to evaluate the performance of the text mining component directly, in parallel with the more extrinsic evaluation carried out by end users via the web interfaces. We believe both types of evaluation to be important. We found it beneficial to schedule the creation and annotation of the gold standard this late in the project as the initial development and user evaluation phase helped us determine the questions that can be asked by users of a system such as this and better define the information that we wanted to capture. We created the gold standard by randomly selecting 25 document excerpts per collection and annotating each extract with mentions of commodities, locations and dates as well as relations between them. The annotation was carried out by a PhD candidate in
White Paper
25
History using the brat annotation tool10 for which we developed a tutorial with very detailed annotation guidelines (see Section 3.2). This resulted in a manually annotated gold standard of 150 document excerpts. We also asked an MSc in economics student to mark up a sub-part of this data in order to determine inter-annotator agreement. The creation of the gold standard was completed by month 18 of the project. We then asked the first annotator to geo-reference all of the locations names (which he had manually annotated in the gold standard in the first annotation phase) to Geonames locations. This second level of annotation allowed us to evaluate the geo-resolution part of the text mining independently. We also created detailed annotation guidelines for this annotation task (see Section 3.2).
We spent the remaining 6 months of the project improving the text mining component as result of extensive error analysis on the output of the second prototype. This analysis was done jointly with the historians. We created sorted counts of extracted commodity mentions (and concepts), so that we could easily determine errors in the most frequently appearing terms. We also created most frequently occurring bigrams for a set of terms like “import,” “export,” “plantation,” etc. in order to identify commodities that were still missing from the lexicon. Finally, we asked the historians to check several ambiguous commodities like (“ice” or “lime”) in context in order to determine their use. A journal article on the results of the commodity extraction and how we improved this by cleaning the commodity lexicon and adding context-dependent boundary extension rules is currently in progress. We also submitted a journal article on the Edinburgh Geoparser in which we describe how we adapted it for Trading Consequences for a special edition in the International Journal for Humanities and Arts Computing which will appear later in 2014 (Alex et al., 2014). In summary we made following findings:
· the text mining output for the most frequent commodities is not 100% accurate but generally of good quality.
· named entity recognition performance suffers significantly in terms of precision and recall as a result of boundary errors, which is the main reason why applying boundary extension rules were effective.
· named entity recognition performance also suffers significantly in terms of recall as a result of OCR errors in the digitised text. This effect is worse for proper nouns than for common nouns.
· the Edinburgh Geoparser performs best when the number of ambiguous locations returned by GeoNames is set to 15.
· adapting the Geoparser to a particular domain can improve its performance.
Overall, we found the historians’ input and feedback to be vital for improving the performance of the text-mining component. We integrated all changes into the third
10 http://brat.nlplab.org
White Paper
26
prototype, most importantly the cleaned commodity lexicon, and performed a last full round of processing for all collections in month 24 of the project. This output is stored in the final Trading Consequences database which is at the back-end of the user interfaces that will be launched in parallel with the publication of this white paper.
3.3 Visualisation Research When considering questions of large-scale global trade, migration or the exchange of ideas the amount of data available from historical document collections makes the analysis task difficult. It is becoming increasingly apparent that more powerful information exploration tools are required as the amount and complexity of data that these tools are expected to handle steadily increases. One approach to this problem is to convert aspects of the documents (i.e. the data or meta-data) into pictures and models that can be graphically displayed. The intuition behind the use of such graphics is that human beings are inherently skilled at understanding data in visual forms. Such interactive graphical displays or visualisations provide access to both the data and the mined data from the earlier stages of the trading consequences project.
Our goal here with visualisation is to graphically represent large amounts of abstract information on screen, which a user can interpret in ways not possible from the raw data alone. While our visualisations are primarily targeted toward environmental historians, they can also make the document collection available to a larger audience. These audiences can hence explore and study the data from a range of perspectives with different intents and interests.
We have developed a number of visualisation prototypes that expose different aspects of the mined data. All these prototypes have been developed in close collaboration with the text mining and history teams. In addition, we conducted a preliminary evaluation with a larger group of Environmental Historians as part of a workshop in Canada. In the following sections we describe the general goals and challenges we aimed at addressing with the visualisation tools. This is followed by a description of each visualisation prototype and a brief summary of our achievements and future research directions.
3.3.1 General Challenges and Goals Text mining and information visualisation approaches have the potential to enhance traditional research methodologies in the humanities because they allow a higher-level point of view when considering large document collections (Moretti, 2005). Instead of the close reading of a single text, we can support the exploration and study of thousands of documents. Information visualisations can provide general overviews of the entire or selected parts a document collection, revealing patterns and relations within and between the documents that close reading methods cannot achieve. Furthermore, interactive visualisations can enable a “dialogue with data”; a fluid exploration that enables the information seeker to probe and interrogate certain aspects of the data in an interactive manner, refining the focus or changing paths during the exploration.

White Paper
27
Within the scope of this project, we aimed at developing visualisations that would largely fulfil two main purposes:
Document Seeking: Based on the extracted data, the visualisations should provide overviews of certain themes or relations within the data to facilitate the discovery of original documents to be studied in more detail.
Analytical Tools: The visualisation should facilitate an in-depth analysis of general themes of areas of interest within the document collection to (a) enable new discoveries (e.g., a change in discussion of a certain commodity over time) and to (b) support the verification of previous hypotheses and assumptions.
In order to develop suitable and accessible visualisation tools fit for purpose, it was important for us to identify the research questions that our target audience (environmental historians) was interested in and the approaches that they typically apply as part of their research. In collaboration with the history team, we identified three high-level design goals for our visualisation tools (1) enabling open-ended explorations, (2) providing multiple entry points into the data collection, and (3) enabling high-level overviews alongside direct document access. We describe each of these high-level design goals in detail.
3.3.1.1 Enabling Open-Ended Explorations Historians often do not have clearly defined questions in mind when they start their research on a certain topic. In fact, their research questions often form and develop as part of their exploration of the available historic documents. Oftentimes, extensive sifting through the collections is necessary to allow the forming of more focused research questions; getting to know the collection and the (potentially) available information is an important first step in history research.
For this reason we aimed at developing visualisation tools that would enable an open-ended exploration of the data collection. This means, that we provide high-level overviews alongside visual and textual query functionality, allowing historians to specify and refine their exploration as they move through the collection. We follow the idea of ``Generous Interfaces’’ that has been discussed in the context of visual interfaces for digital cultural collections (Whitelaw, 2012). Traditional search interfaces force people to specify a query before they provide a glimpse of the collection. While this approach works well for targeted search, it becomes more difficult with more open-ended research questions. In contrast, generous interfaces promote the idea of offering the information seeker a glimpse of the collection from the beginning, without requiring initial query requests, such as with Design Galleries (Quigley, 2002). Providing a general overview of what is available, they allow information seekers to refine this view based on their particular interests (which may form and change as part of the exploration process). Along these lines we also draw from research in the area of serendipity. Previous work has specified a number of guidelines on how to enable open-ended exploration through visual interfaces and, in this way, promote serendipitous discoveries which are not only fruitful in our everyday life but also in research (Thudt,
White Paper
28
2012). Translating this design goal into system design cuts across each of the visualisations and results in generous overview features as a starting point.
3.3.1.2 Providing Multiple Entry Points into the Data Collection Environmental history is a vast field and, obviously, different researchers focus on different topics and may have different approaches towards the exploration of document collections. For example, some historians may focus on specific locations (e.g. Vancouver Island) and their relationships to a variety of commodities. Other researchers will have a broader geographic area of interest (e.g. a particular continent or country) and focus on a very particular commodity and time period.
The data collection that resulted from the text mining procedure is multifaceted where a facet is one perspective from which the data can be probed (Collins, 2009). These facets include, for example, commodities and geographic locations mentioned in the documents, the publication year of a document, the collection the document is part of, and other terms mentioned in relation to particular commodities and/or locations.
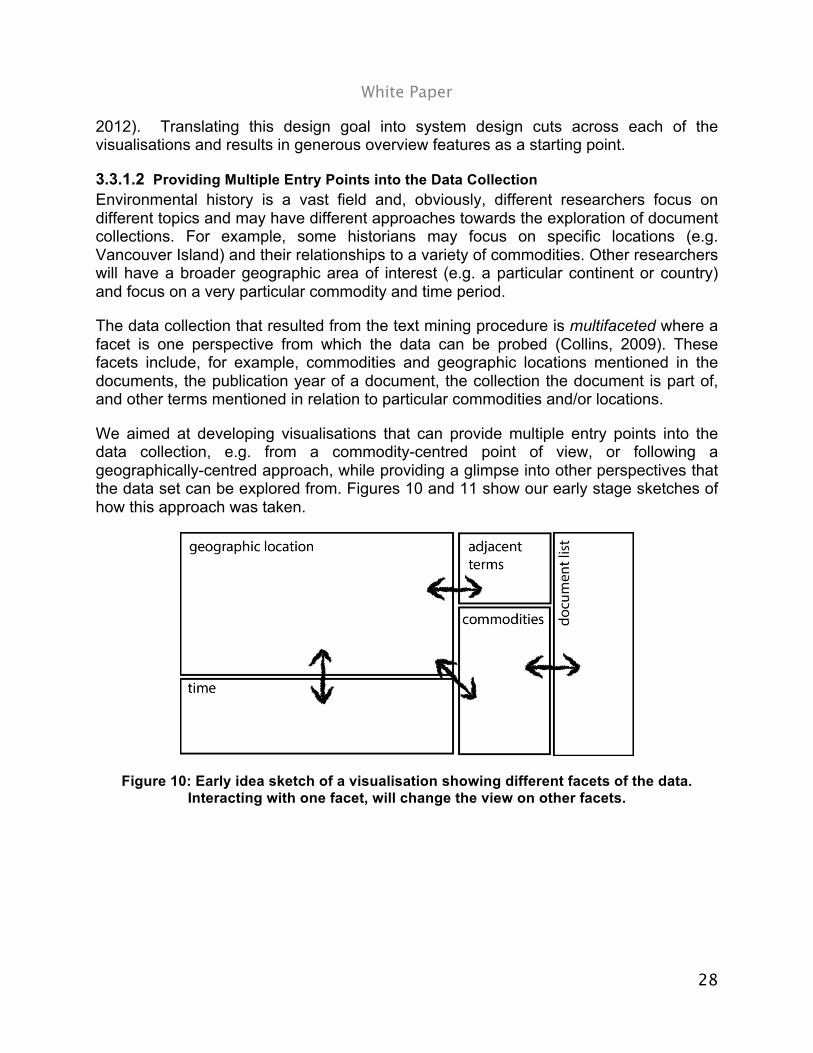
We aimed at developing visualisations that can provide multiple entry points into the data collection, e.g. from a commodity-centred point of view, or following a geographically-centred approach, while providing a glimpse into other perspectives that the data set can be explored from. Figures 10 and 11 show our early stage sketches of how this approach was taken.
Figure 10: Early idea sketch of a visualisation showing different facets of the data. Interacting with one facet, will change the view on other facets.

White Paper
29
Figure 11: Early sketch juxtaposing geographic locations, commodities, related terms and temporal changes in three interlinked visualisations.
3.3.1.3 Enable High-Level Overviews while Providing Direct Access to Documents Our visualisation prototypes aim to create visual abstractions from text in order to enable high-level overviews of a vast number of textual documents. To achieve this, we have extracted key terms from the textual documents in the text mining process as described earlier. This abstraction can potentially provide new, quite analytical, perspectives on historic documents that traditional close-reading approaches cannot. However, we do not aim at exchanging the close-reading approach with this distant-reading abstraction approach. Ultimately, our visualisations can only provide a glimpse of the data we mined from the documents; they cannot replace the study of the rich historic documents. We therefore aimed for providing high-level, abstract visual overviews of the mined data (considering its different facets as described above), but linking these overviews directly to the actual historic documents, so the connection between abstracted data and the actual information source is there at all times.
3.3.2 Exploration 1: Juxtaposing Geospatial, Temporal, and Contextual Dimensions
Following the idea of presenting the data sets along multiple facets, most importantly commodities, geospatial references, and temporal dimensions, we created an interlinked visualisation that would allow the exploration of the document collections along these lines.
Our first visualisation prototype developed in this project consists of three interlinked visual representations (Figure 12): a map showing the geographic context in which commodities were mentioned, a vertical tag cloud showing the 50 most frequently mentioned commodities (font size represents frequency of mentions), and a bar chart representing the temporal distribution of documents within the collection along decades. A ranked document list provides direct access to the relevant articles.

White Paper
30
Figure 12: Interlinked visualisation of commodity mentions, geospatial references and temporal dimensions.
Figure 13: Zooming into the map adjusts the timeline and the related commodity list.

White Paper
31
Figure 14: Selecting particular decades further refines the location mentions shown in the map as well as the list of commodities. Both filtering operations
refine the document list to the right. Interaction with one visualisation causes changes in the others as can be seen in Figure 13. For example, zooming into the map will narrow down the commodity list to only include commodities mentioned in relation to the shown locations, and bar chart will only show documents that include these location mentions (see Figure 13). Similarly, particular time frames can be selected, to narrow down the documents of interest or to explore changes in the commodity list or of location mentions shown in the map. Again, interactions with the timeline cause the other visualisations to update accordingly (see Figure 14). Lastly, historians can specify commodities of interest, either by textual query or by selecting commodities from the weighted list. All visualisations adjust, with the commodity list now showing commodities related to the selected ones. An additional line chart presents the frequency of mentions of the selected commodities across time (Figure 15).

White Paper
32
Figure 15: Specifying a commodities brings up a line chart of mentions of this commodity across the years. Also, the other visualisations are updated, reflecting on the
selected commodity.
To gain expert feedback on this first approach of representing different facets of the data set in an interlinked form to facilitate research in history, we conducted a half-day workshop where we introduced our visualisation prototype to environmental historians. The workshop was part of CHESS, the yearly Canadian History & Environment Summer School with over 20 environmental historians participating.11
11 http://70.32.75.219/2013/04/12/cfp-canadian-history-and-environment-summer-school-2013-vancouver-island/
White Paper
33
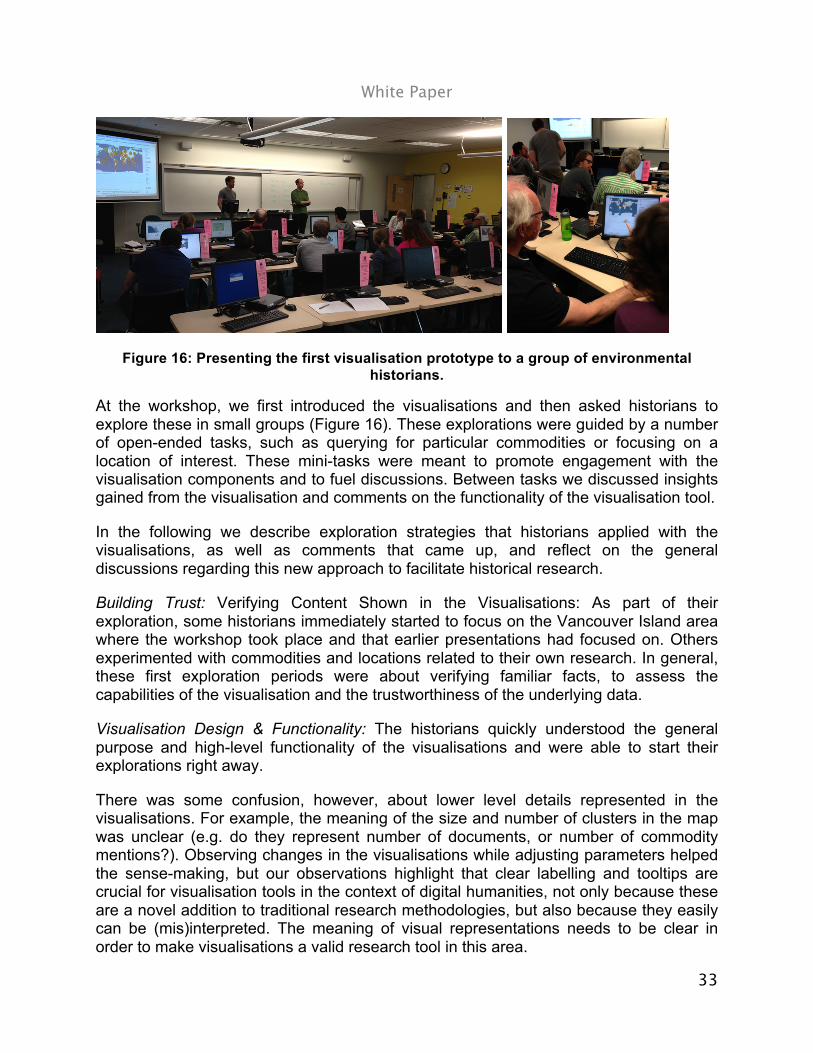
Figure 16: Presenting the first visualisation prototype to a group of environmental historians.
At the workshop, we first introduced the visualisations and then asked historians to explore these in small groups (Figure 16). These explorations were guided by a number of open-ended tasks, such as querying for particular commodities or focusing on a location of interest. These mini-tasks were meant to promote engagement with the visualisation components and to fuel discussions. Between tasks we discussed insights gained from the visualisation and comments on the functionality of the visualisation tool.
In the following we describe exploration strategies that historians applied with the visualisations, as well as comments that came up, and reflect on the general discussions regarding this new approach to facilitate historical research.
Building Trust: Verifying Content Shown in the Visualisations: As part of their exploration, some historians immediately started to focus on the Vancouver Island area where the workshop took place and that earlier presentations had focused on. Others experimented with commodities and locations related to their own research. In general, these first exploration periods were about verifying familiar facts, to assess the capabilities of the visualisation and the trustworthiness of the underlying data.
Visualisation Design & Functionality: The historians quickly understood the general purpose and high-level functionality of the visualisations and were able to start their explorations right away.
There was some confusion, however, about lower level details represented in the visualisations. For example, the meaning of the size and number of clusters in the map was unclear (e.g. do they represent number of documents, or number of commodity mentions?). Observing changes in the visualisations while adjusting parameters helped the sense-making, but our observations highlight that clear labelling and tooltips are crucial for visualisation tools in the context of digital humanities, not only because these are a novel addition to traditional research methodologies, but also because they easily can be (mis)interpreted. The meaning of visual representations needs to be clear in order to make visualisations a valid research tool in this area.
White Paper
34
Insights Gathered from the Visualisations: Workshop participants found meta-level overviews that the visualisations provide highly valuable as these can aggregate information about the collection beyond human capacity. In the short time of the workshop, historians made (sometimes surprising) discoveries that sparked their interest to conduct further research. While it is unclear if these discoveries withstand more detailed investigation (there is still some noise in the data set), this shows that visualisation has the potential to support exploration and insight construction in the context of historical research.
A large aspect of the discussions focused on what kind of insights can be gathered from the visualisations. Some historians pointed out the visualisations really represent the rhetoric around commodity trading in the 19th century: they show where and when a dialogue about particular commodities took place, rather than providing information about the occurrence of commodities in certain locations. This raises the question of how we can clarify what kind of data the visualisations are based on to avoid misinterpretation.
In general, we received positive feedback about our approach of combining text mining and visualisation to help research processes in environmental history. Historians saw the largest potential in the amounts of data that can be considered for research but also in the open-ended character of the explorations that the visualisations support in contrast to common database search interfaces. Similar approaches of interlinked visualisation tools have been proposed earlier (e.g. Dörk, 2008), but never been applied and evaluated in the context of vast document collections to facilitate research in the humanities. The addition of other types of visualisations was suggested to can help analyse and discover relations and patterns in the data. The suggestion mirrored ideas by the history team, who suggested we develop visualisations that could provide a more analytical perspective on the data set. Following up on this, we developed a number of visualisation prototypes that specifically highlight the relations between different commodity entities as well as the flow of location mentions over time for selected commodities, as we describe in the following sections.
3.3.3 Exploration 2: Showing Relations Between Different Commodities The Commodity Arcs visualisation prototype is a brief exploration of how we could represent relations between selected commodities, i.e., what other commodities are mentioned in relation to a selected commodity. While “relatedness” could be defined in different ways, we chose to count two commodities as related if they are mentioned on the same document page.
The Commodity Arcs visualisation shows a list of all unique commodities that were identified in a pass of the text mining process in alphabetical order (Figure 16). From this first data mining pass, 1000 commodities were extracted, resulting in a long, scrollable list. Each commodity is shown as a text label and a grey circle, where the radius of the circle represents the frequency of mentions of the commodity across all document collections – the larger the circle, the more often the corresponding commodity is mentioned.

White Paper
35
Figure 17: Scrollable list of commodities. The sizes of circles represent the frequency of mentions of a commodity within the entire document collection.
A commodity of interest can be selected in two different ways: historians can scroll through the list and click on the text label or corresponding circle, or they can just type in a commodity name into the text field to the upper left (Figure 17). Specifying a commodity in this way, results in the appearance of arcs connecting the selected commodity with other commodities that are mentioned on the same document pages (Figure 18). Related commodities are highlighted in orange, while unrelated ones remain grey. The strength (thickness) of the arcs represents the strength of relation between two connected commodities: the more pages exist where a pair of commodities is mentioned together, the stronger the corresponding arc between these commodities.
Selecting or querying for a particular commodity also reveals its connected DBpedia categories, if they apply. For instance, in the case of chinchona, four related DBpedia categories were found. Since the development of the commodity list and related category data was still in progress when we developed this visualisation prototype, we had two different category data sets. One of them applies a stricter commodity-category assignment which results in a larger number of commodities without categories. The other applies a more loose matching, resulting in a larger amount of commodities assigned to one or several categories. However, this latter matching includes more false positives. We provide an option to apply a “more strict” or “less strict” matching (upper right corner of Figure 18).

White Paper
36
Figure 18: Selecting or querying for a particular commodity, brings up arcs that connect the selected commodities with related ones.
Because of the large number commodities and their list-based alignment, it is not possible to see all related commodities in one view. However, it is possible to scroll through the list to explore related commodities – the arcs toward the selected commodity are cut off but still reveal the strength of relation (Figure 19).
Figure 19: Scrolling through the list of related commodities: cut-off arcs still reveal the strength of relation to the selected commodity.
Initial explorations of the data using this visualisation prototype raised questions as to why certain commodities are mentioned in relation to each other. Additional functionality is required to further reveal the context in which certain pairs of commodities are discussed. This would include an integration of adjacent terms, mentioned within the sentences that the selected commodity terms were extracted from, an integration of

White Paper
37
document (pages) that include related commodity terms, as well as an analysis of connections between related commodities across time.
Since the development of this first prototype, the underlying list of commodities has expanded from approx. 1000 to 5000. Future research will include refining the initial representation of commodities, since navigating a list of 5000 terms is not feasible. As part of this, we may show a list of DBpedia concepts first that will reveal connected commodities and their relations to other commodity terms upon request. The query functionality will remain in place to enable targeted search for commodity terms.
3.3.4 Exploration 3: Mapping Location Mentions across Time As mentioned in Section 2.3.1, the workshop with environmental historians on Vancouver Island revealed that, while the representation of location mentions on a world map nicely highlights their geospatial distribution, it can cause some confusion about the meaning of this mapping. While visualisation reflects on the rhetoric of commodity trading, the geospatial mapping may suggest that certain commodities have either come from the highlighted areas or are shipped there. We, therefore, explored another approach to visualise how for a selected commodity location mentions change over time within our document collections, focusing more on text-based representation techniques.
Figure 20: The Location Cloud shows all location mentions and their frequencies for a selected commodity (in this case cinchona).

White Paper
38
We call the resulting visualisation prototype the Location Cloud that shows all the location mentions and frequencies for a selected commodity over time (Figure 20). Loading the visualisation first brings up a text field where a commodity can be specified (Figure 21).
Figure 21: Text field to specify a commodity of interest.
Once a commodity term is entered, all location data for this particular commodity is loaded and represented from three different perspectives. The main part of the interface consists of columns of location terms listed in alphabetical order and grouped by decade (Figure 20). The Location Cloud borrows from previous text visualisation approaches such as Parallel Tag Clouds (Collins, 2009; Viégas, 2006). The font size of each location mention is represents the frequency in which it is mentioned. In this way, frequent location mentions are highlighted. In the example as shown in Figure 20, we quickly see that places in India including the country itself are often associated with the commodity cinchona in the 1870s and 80s. Alphabetical ordering of the location mentions makes it easy to find particular locations of interest in the lists.
One limitation of representing location mentions in this way is that overlapping location labels cannot be avoided for commodities associated with large amounts of location mentions. Figure 22 shows this heavy overlap when showing all location mentions associated with the commodity “Blubber” (the most frequently mentioned commodity after the 2nd text mining pass). In this representation general trends cannot be deciphered and interaction is not possible. We address this problem in different ways.
Limiting the View to Top 50 Location Mentions
We limit the number of location mentions shown in each decade to the top most frequent location mentions which reduces clutter (see Figure 23). While not all location mentions are shown in this overview, a location query text field in the upper left corner of the interface allows for searching for particular locations of interest. In future iterations, we also plan to implement a “show all” functionality that allows scrolling through the entire list of location mentions in each decade.
Limiting the View to “Mentioned” Decades
We limit the decades shown in the timeline to those who are actually populated by location mentions associated with the selected commodity. This optimises the usage of horizontal space and reduces clutter due to overlapping location labels from adjacent decades.

White Paper
39
Figure 22: Mapping all location mentions associated with the frequently mentioned commodity "Blubber" leads to heavy overlapping problems with location labels.
Figure 23: Top 50 location mentions for the commodity "Blubber".

White Paper
40
Several tools are available to filter the location data. A world map on the top of the interface provides a high-level overview of the distribution of location mentions across continents and, at the same time, allows for filtering by geographic continent-like areas (Northamerica, Southamerica, Europe, Africa, Asia and Oceania). Hovering over a geographic area reveals its absolute number of location mentions; selecting an area filters the location cloud down to all locations that are associated with this area (Figure 24). Several continents can be selected.
Figure 24: Locations can be filtered by geographic area.
Furthermore, a histogram shows the distribution of locations by their frequency of mention (Figure 24). Some high-level analysis revealed that most locations are only mentioned very few times. The minimum and maximum number of location mentions can be specified, filtering out locations with particularly high or low frequency. The location cloud timeline is adjusted accordingly.
Both the interactive map and histogram are interlinked with each other: adjusting location selections in the map automatically adjusts the frequency histogram and vice versa.
Hovering over a location label in one of the decades highlights it in other decades in which it occurs (Figure 25). Selecting a location label brings up a detailed graph with the distribution of mentions of the selected location across the years. Other details about associated documents are shown as well.

White Paper
41
Figure 24: Hovering over a particular location label highlights it across decades.
Selecting a location, brings up a chart showing all mentions of the selected commodity in relation to the selected location across the different years (see Figure 25). The chart is normalized by the overall number of commodity/location mentions each year. To the right of the chart, 10 sample sentence are shown that include the selected commodity/location pairing, to provide some context.
Figure 25: Selecting a location, brings up a chart with details about the commodity/location mentions across years as well as some sample sentences.

White Paper
42
Upon request, a full document list is shown, including all sentences in which the commodity/location pairing is mentioned (see Figure 26).
Figure 26: Document list including sentences where the commodity/location pair has been mentioned.
3.3.5 Exploration 4: Commodity Trading & Climate Change One important research interest of the history team is to explore how commodity trading in the 19th century influenced the climate or other environmental factors. As a last exploration we therefore developed a visualisation prototype that combines an early version of our data on commodity and location mentions with historic temperature data from the National Climate Data Center (NCDC) of the National Oceanic and Atmospheric Administration (NOAA). These latter data contain the monthly mean temperatures, estimated across the globe going back as far as the 1600s.
Our visualisation prototype shows a geographic map that is overlaid with a Voronoi diagram interpolating the temperature points across locations (Figure 27). Colours reflect on temperature values where warm colours represent higher temperatures.

White Paper
43
A timeline underneath the map shows the total amount of temperature data points for the northern and southern hemisphere. It becomes clear that the historic temperature data for the southern hemisphere in particular are quite sparse, which limits the interpretative value of the visualisation. However, particular time ranges can be selected and interactively explored.
Figure 27: Juxaposing the commodity and location mentions with temperature data.
Furthermore, particular commodities can be specified using a text query field. Their frequency of mentions in selected time ranges is shown in form of pie charts, while the distribution of total mentions across all years is shown in form of bar charts below the map (Figure 27). The corresponding document lists are available by selecting particular bars within the charts.
Preliminary exploration revealed that the prototype raises interesting questions regarding the potential relations between the mentions of particular commodities in certain locations and temperature changes over time. However, the sparseness of the historic temperature data set limits conclusions. Furthermore, temperatures were averaged across the year which hides growing seasons - an important aspect when researching certain commodities such as plants.

White Paper
44
3.3.6 Summary Overall, the visualisation prototypes that we have developed as part of the Trading Consequences Projects demonstrate potential to support historians’ research at different stages. However, within the limited time frame of the project it was not possible to conduct profound studies on how exactly they will be used. Our future research will further refine the visualisation tools, add more analytical functionality, and explore how our approach integrates into current historical research processes and how it can produce profound outcomes.
3.3.7 Visualisation user feedback Representing the information contained in the relational database visually was an important aspect of the project. Visualising the data helped to identify potential problems such as the contextual discrepancies. But visualisation also revealed important trends over time and relationships between different places associated with a particular commodity. By using a subset of the data taken from the relational database, these visual trends and relationships had the potential either confirm the historians’ research questions, or else inspire entirely new sets of questions. The first visualisations supported single-year maps for individual commodities. The maps located commodities by place name using circles of various sizes to denote the number of times a given commodity was mentioned in relation to a particular place in the documents. The larger the circle the more times a commodity was mentioned in relation to that particular place. These first-generation maps revealed spatial patterns, but the history team needed to make sense of the temporal dimension as well. The need to visualise the changing spatial relationship between commodities and places was met with a dynamic visualisation that displayed a time-lapse series of static first-generation maps. In order to obtain a larger picture of the changing significance of a commodity over time, the visualisation team also created a tool to produce time-series graphs of the number of incidents of a particular commodity mentioned in the texts over time. Finally, in an effort to demonstrate patterns between commodities, the visualisation team also created a tool that displayed the significance of additional commodity terms as they related to the particular commodity under investigation. Additional commodity terms appear as a word cloud in fonts of varying sizes. The larger the font the more often that commodity was mentioned in close proximity to the commodity under investigation in the texts. By addressing the kinds of questions historians might ask of the data available, the visualisation team was not only able to enhance the mapping feature by combining spatial and temporal components, but also by adding additional tools that displayed other relational information to help contextualise a particular commodity.
3.4 Prototype feedback Critical to the success of the project was the feedback that the history team provided the text mining team. Equipped with a thorough list of commodities and places from the Geonames Gazetteer, the text-mining program succeeded in connecting thousands of recognised entities and organising them, along with relevant years, into a relational database. Occasionally, however, the early prototype of the text-mining program made inaccurate connections between recognized entities. The problem was not in the entity

White Paper
45
recognition feature of the text mining program, but rather in the absence of nuanced details that could add context to the entity recognition. Without detailed commands, the text mining program might mis-identify particular named entities from either the list of commodities or place names. For example, early attempts to experiment with the relational database using the commodity ‘cinchona’ as a test case revealed that the text-mining program was producing inaccurate relationships with place names. When information from the relational database on cinchona was loaded into the visualisation software, the map showing incidents of cinchona and quinine mentioned in relation to place names contained within tens of thousands of documents revealed a surprisingly high correlation with Markham, Ontario, a suburb north of Toronto. The history team determined that Markham actually referred to Clements Markham, the British official who smuggled cinchona seeds out of Peru. By pointing out this nuance to the context of the recognised entities, the text mining team adapted the code that helped distinguish people from place to allow for this distinction. By testing the prototype and communicating contextual discrepancies, the history and text mining teams refined the program to produce a more accurate relational database.
3.4.1 Challenges Our initial proposal aimed to develop text mining infrastructure for English and French. The project time span and the challenges of processing just English documents were substantial enough, that we did not have the time and resources to port our tools to a new language. Some of the Early Canadiana Online documents are in French and other languages. We simply applied an automatic language identification step to filter out any non-English material. Furthermore, we recognised early on that data mining could not extract information from tables with a high enough accuracy. Table recognition and parsing is a difficult task and more research in this area is required in order to be able to mine them more accurately.
4 Datasets, Software, Algorithms and Techniques
4.1 Lexicon Development We are in the process of publishing our lexical resources on Github, more specifically at https://github.com/digtrade/digtrade. We are currently using CC-BY as the license for the static resources. We will include not only primary resources, such as the base lexicon, but also derived resources, such as the SKOS thesaurus and the XML lexicon. We also plan to publish the Python scripts, SPARQL queries and Makefile scripts (again, under a suitable open source license) used to derive the thesaurus and lexicon. However, to make these properly portable, we need to provide a SPARQL endpoint for some of our SKOS data, and the location of this is still under consideration.
We believe that the availability of the resources will be adequately underpinned by the stability of Github for the foreseeable future.

White Paper
46
4.2 Text mining and Geo-referencing We mined historical collections from several data providers and a small set of manually collected documents relevant to Trading Consequences (see Section 1: Introduction). In total, these amount to over eleven million page images and over 7 billion word tokens. The original collections are used for research purposes in Trading Consequences and none of the original full text is included in the outputs of this project. All of the mined information (extracted and enriched named entities, attributes and relations) and snippets containing this information is stored in the Trading Consequences database (see 3.3.) but linked back to original sources via URLs where possible. Some of the collections processed in TC are accessible on a subscription basis only (e.g. the House of Commons Parliamentary Papers from ProQuest and the Confidential Print collections from Adam Matthews), so viewing their original images is dependent on a user’s individual subscription or subscriptions held by their institution.
The methods used for the OCR analysis and post-correction, the development of text mining component and adaptation of the existing tools like the Edinburgh Geoparser are already published or submitted for publication and thereby made publically available for future research. We are currently preparing an Open Source release of the Edinburgh Geoparser. Adaptations made for Trading Consequences are documented and can be released as an extension to this package. The annotation guidelines developed for annotating data for research carried out in Trading Consequences are released in the digtrade GitHub repository in a subdirectory called annotation.12 The guidelines for the OCR rating and the rated data from both annotators are also provided in the annotation directory on GitHub in a sub-directory called ocr-rating.13 The guidelines for the geo-referencing annotation are also made available in the sub-directory geo-referencing.14
The text mining pipeline developed in Trading Consequences is also going to be made available in this way. We will spend some time over the coming weeks making the pipeline work as a stand-alone application on plain text input and writing documentation to explain how it can be used.
The annotated gold standard sets contains a small sample (25 document extracts) from each collection processed in Trading Consequences annotated with named entities, relations and geo-referencing information. We will contact each data provider to determine if this data can be released. If so, then we will use the GitHub repository to make this data public as well.
4.3 Database EDINA had responsibility for ingesting and pre-processing the LTG XML output documents representing the original OCR scanned historical documents that had been passed through the natural language parser pipeline to identify and expose inherent relations between commodities, locations, disasters, diseases, pandemics and potential
12 https://github.com/digtrade/digtrade/tree/master/annotation 13 https://github.com/digtrade/digtrade/tree/master/annotation/ocr-rating 14 https://github.com/digtrade/digtrade/tree/master/annotation/geo-referencing

White Paper
47
commodity/location relationships. These XML documents were parsed by EDINA using bespoke processing scripts in order to store the 'flattened' XML tree structure into a 'flat' data model in a relational database.
A simple web application was also created to provide a means of querying the relational database for data of potential interest to researchers. Sample screen-shots of this are provided below.
Figure 28: Trading Consequences search query interface.
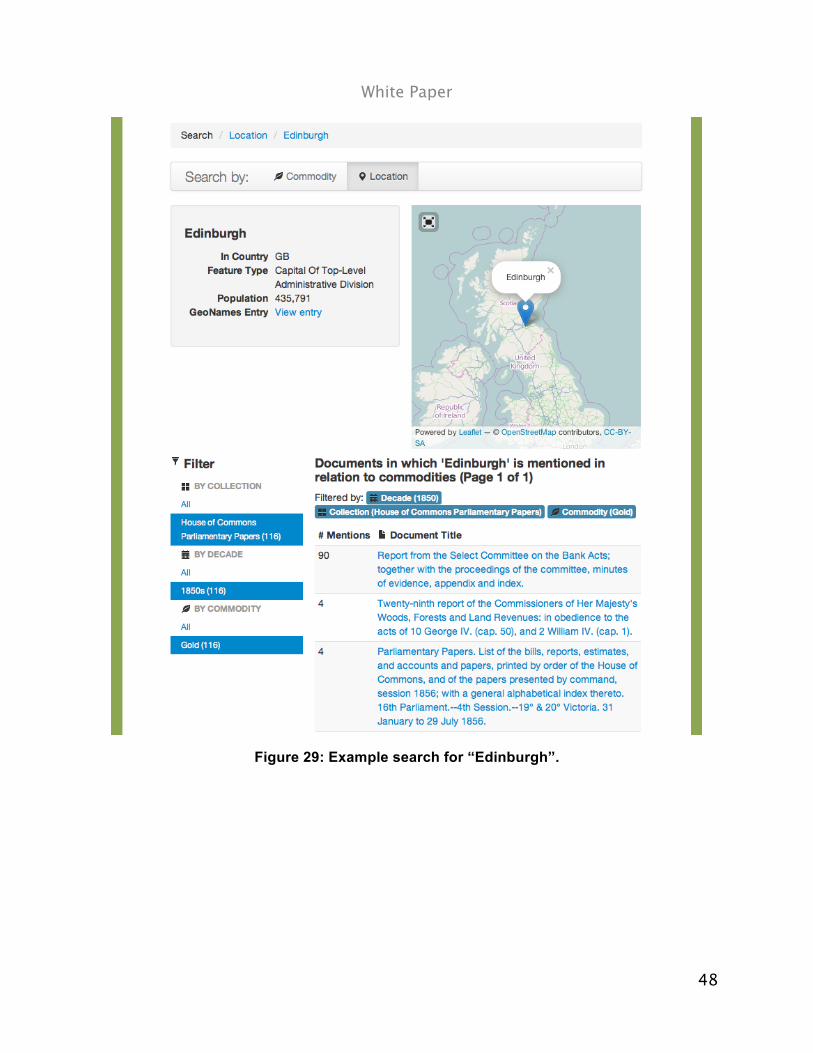
White Paper
48
Figure 29: Example search for “Edinburgh”.

White Paper
49
Figure 30: Example document view.
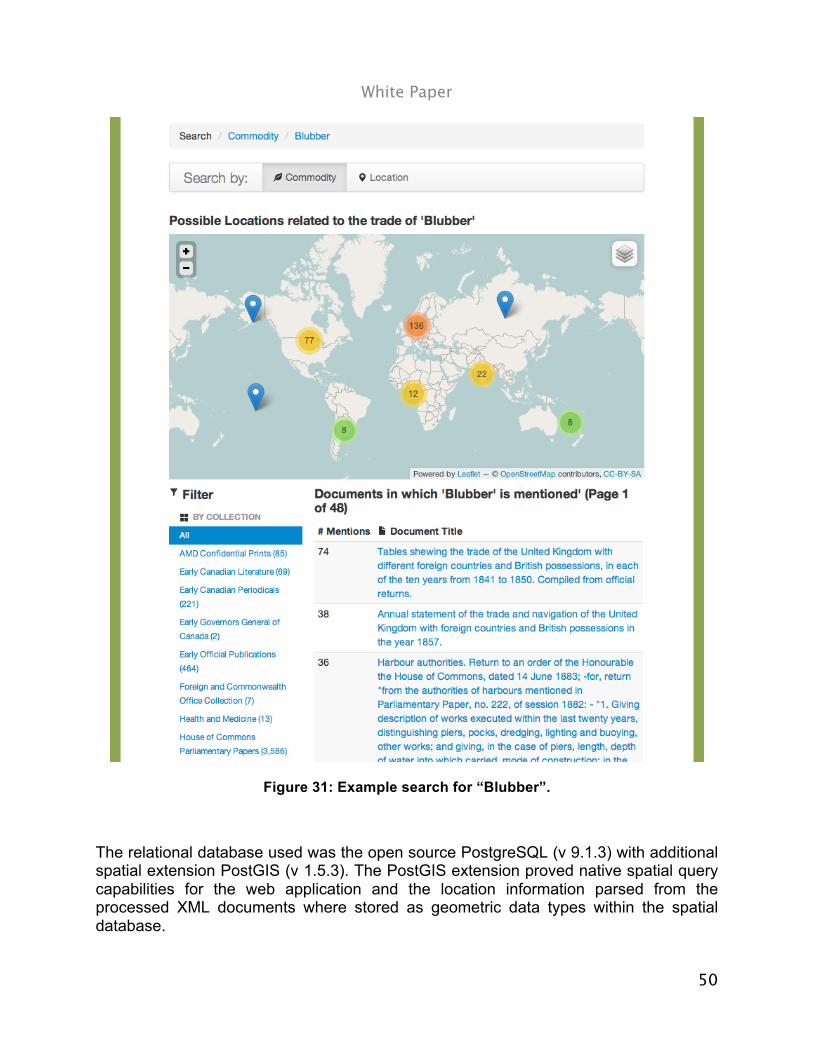
White Paper
50
Figure 31: Example search for “Blubber”.
The relational database used was the open source PostgreSQL (v 9.1.3) with additional spatial extension PostGIS (v 1.5.3). The PostGIS extension proved native spatial query capabilities for the web application and the location information parsed from the processed XML documents where stored as geometric data types within the spatial database.
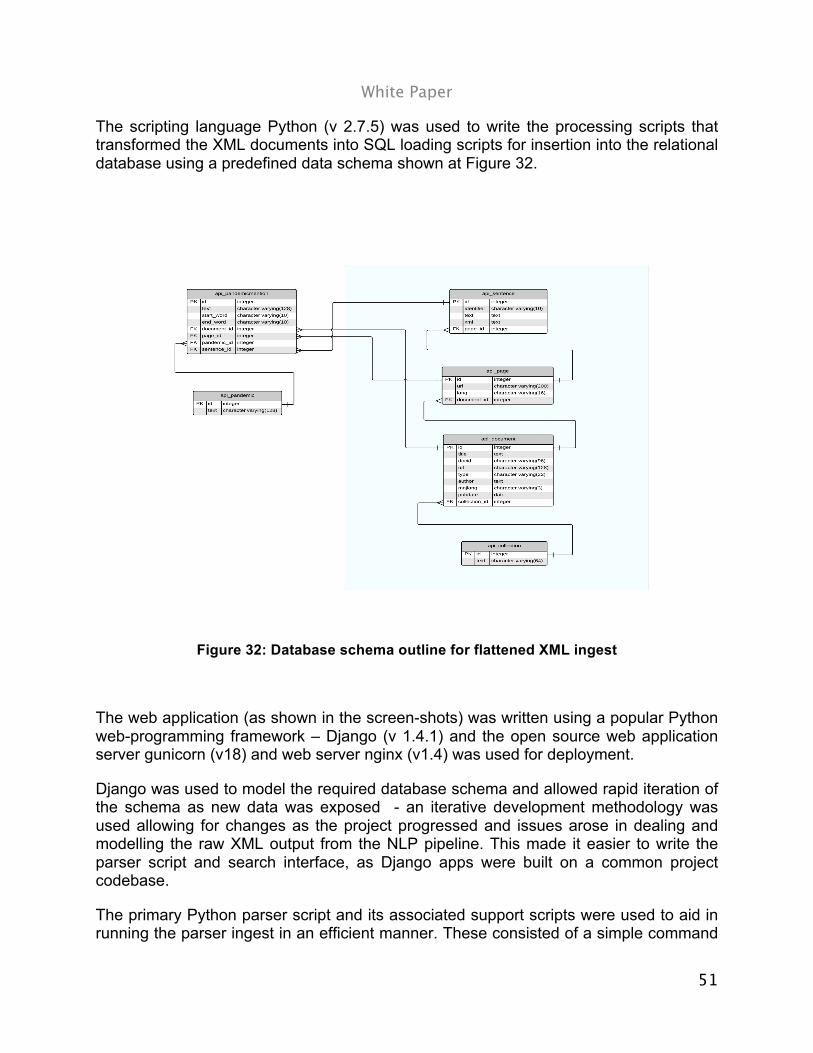
White Paper
51
The scripting language Python (v 2.7.5) was used to write the processing scripts that transformed the XML documents into SQL loading scripts for insertion into the relational database using a predefined data schema shown at Figure 32.
Figure 32: Database schema outline for flattened XML ingest
The web application (as shown in the screen-shots) was written using a popular Python web-programming framework – Django (v 1.4.1) and the open source web application server gunicorn (v18) and web server nginx (v1.4) was used for deployment.
Django was used to model the required database schema and allowed rapid iteration of the schema as new data was exposed - an iterative development methodology was used allowing for changes as the project progressed and issues arose in dealing and modelling the raw XML output from the NLP pipeline. This made it easier to write the parser script and search interface, as Django apps were built on a common project codebase.
The primary Python parser script and its associated support scripts were used to aid in running the parser ingest in an efficient manner. These consisted of a simple command
White Paper
52
line script that parsed the XML documents and an associated runner script that allowed the parser to be run in batches to make sure that the python process could manage system memory optimally (as noted below the ingest file sizes of the XML meant that there was a significant processing overhead requiring optimisation of available system resources).
A critical issue, which emerged over the project lifetime, was the time required to parse the full dataset. Initially the dataset was relatively small so having a single threaded parser script did not pose an operational issue. As the project developed however and the datasets volumes grew, (to in excess of 600GB of XML to be parsed), this proved to be a bottleneck and optimisations were sought. For any future work it is recommended that an investigation of a true multi-threaded parser approach be considered.
A corollary of the increasing file sizes was that the RDBMs database size itself grew and this had the effect of impacting queries run against it. The efficiency of previously performed queries degraded over the project duration requiring additional pre-caching, schema changes and query optimisation tuning in order to achieve real-time/near-time query performance.
4.4 Visualisation All visualisation prototypes that were developed as part of the Trading Consequences project are web-based to make them available to historian researchers and other interested audiences across the world. Our visualisations are based on JavaScript. In particular we use the popular visualisation library D3.js (Data Driven Documents) in combination with other common JS libraries such as jQuery and jQuery UI and web APIs such as Google Maps.
Data is loaded in form of comma separated value or .json files into the browser, processed, and interpreted into a visual form. For the early visualisation prototypes (Prototypes 1 and 4), data was loaded directly from the database using php scripts. That is every filtering interaction issued a query to the database. While this was feasible with the data set that resulted from the first round of processing, the growth of the size of data (and, hence, number of rows in the database tables) made these live queries too slow to ensure fluid interactions with the visualisations. We therefore re-implemented our first prototype, the interlinked visualisation, to be based on pre-stored, aggregated data that is loaded upon request. Only few queries to the database are executed life; for instance, the location filtering in Prototype 1. Similarly, Prototypes 2 and 3 are based on pre-loaded data.
Prototype 1 uses the Google Maps API to map location mentions to their geospatial locations in a map. Google Maps’ Marker Clusterer is used to cluster location mentions depending on the zoom level (Figure 8).
White Paper
53
5 Dissemination
5.1 Publications and talks We have been keen to take up opportunities to present and to publish our research and reflections on the project. As a result the project has been featured in numerous publications and talks combining the expertise of each team by bringing together historical research methods, data mining and visualisation perspectives.15 For instance, in 2012 Clifford, Hinrichs and Klein participated in the AHRC Commodity Histories Project Networking Workshop in London.16 This workshop was one of several in-person opportunities to both disseminate the process and results of Trading Consequences, and transfer knowledge about innovative research methods in the Humanities. Another important opportunity to disseminate the accomplishments of the project and obtain feedback took place in 2013 when Coates, Clifford, Alex and Hinrichs participated in the Canadian History and Environment Summer School in Victoria, British Columbia.17
For many historians computational approaches are relatively new and offer interesting potential but can also be intimidating. We therefore continues to contribute presentations and publications (including several currently in development owing to the longer publication timelines in this domain) on the research methods employed, such as Coates and Clifford’s (2013) presentation to the Canadian Historical Association18 reflecting on the use of computer-assisted methodologies in Trading Consequences. These contributions back to the wider historical and humanities community have already helped to generate dialogue and questions about the nature of research methods in the field and, we hope, help other researchers feel more confident in experimenting with computational and data mining techniques, and interdisciplinary research partnerships in their own research practice. Crucial to this process of knowledge exchange around research methods has been the complementary strand of papers and presentations beginning to share and explore the historical research results of Trading Consequences. For instance Clifford and Coates’ (2013) paper on initial historical research results from the Trading Consequences data mining work for the European Society for Environmental History Conference in Munich19.
Trading Consequences has not just been about advancing historical research methods. The data mining and geoparsing aspects of the project have been challenging and resulted in papers at several international conferences including Alex, Grover, Klein and Tobin’s (2012) paper on the challenges of OCR’ed text, at KONVENS2012, the first
15 A full up to date list may be found at: http://tradingconsequences.blogs.edina.ac.uk/publications-presentations/ 16 Clifford, J., Hinrichs, U. and Klein, E. 2012. “Text Mining for the Nineteenth-Century Commodity [Presentation].” AHRC Commodity Histories Project Networking Workshop 1, 6-7th September 2012, Open University London Regional Centre, London, UK. 17 Coates, C., Clifford, J., Alex, B. and Hinrichs, U. “Mining Big Data: Introduction to the Trading Consequences System.” Canadian History and Environment Summer School 2013. Nanaimo, Canada, 1st June 2013. 18 Coates C., and J. Clifford, “Computer-assisted research in large data sets: The lessons of ‘Trading Consequences’” Canadian Historical Association, Victoria, June 2013 19 Clifford, J., and C. Coates. 2012. Text mining Canadian commodity trades and environments: Results from the “Trading Consequences” project. Seventh European Society for Environmental History Conference, 20-24th August, 2013, Rachel Carson Center for Environment and Society, Munich.
White Paper
54
International Workshop on Language Technology for Historical Text(s) in Vienna20, Alex, Grover, Klein and Tobin’s (2012) paper on the challenges of data mining historical texts for Open Repositories 201221, and Alex, Byrne, Grover and Tobin’s (2013) reflections on adapting the Edinburgh Geoparser for Historical Geo-referencing, including its use in Trading Consequences22. This same spirit of sharing and collaboration has led to the establishment of a Trading Consequences GitHub presence23 allowing code and taxonomies used in the project to be accessed and reused by others interested in adapting or extending this work in the future. This sharing of code also enables transparent scrutiny of the research process by other historians and computer scientists interested in the techniques or research outcomes of the project.
Whilst exposure to the wider academic research communities nationally and internationally has been important throughout the project we have also been keen to ensure we engage local peers through presentations at scholarly events held at project partners’ institutions. These have included three presentations by Alex and one by Klein in 2013.24
In the months following the launch of Trading Consequences a number of presentations and publications will be taking place including the American Society for Environmental History Conference 2014; the Language Technology for Cultural Heritage, Social Sciences, and Humanities (LaTeCH) 2014; Digital Access to Textual Cultural Heritage (DATeCH) 2014, Digital Humanities 2014; and the World Congress of Environmental History 2014.
5.2 Dissemination via Social Media The Trading Consequences blog,25 was set up at the start of the project in January 2012 using WordPress and hosting provided and supported by EDINA. The blog has been used to reach out both to the academic historical research community, to those interested in data mining26 and visualisation,27 and to audiences more broadly
20 Alex, B., Grover, C. Klein, E. and Tobin, R. 2012. Digitised historical text: Does it have to be mediOCRe? Proceedings of KONVENS2012 (First International Workshop on Language Technology for Historical Text(s)), 19th-21st September 2012, University of Vienna. 21 Alex, B., Grover, C. Klein, E. and Tobin, R. 2012. Exploring Challenges of Mining Historical Text [Extended abstract and presentation]. Open Repositories 2012 Workshop: Working with Text – Tools, Techniques and Approaches for Data, 9th July 2012, University of Edinburgh, UK. 22 Alex, B., Byrne, G., Grover, C. and Tobin, R. Adapting the Edinburgh Geoparser for Historical Geo-referencing. Digital Texts and Geographical Technologies Symposium, Lancaster, UK, 9th July 2013. 23 https://github.com/digtrade/digtrade 24 Alex, B. Finding Commodities in the Nineteenth Century British World. Talk at the Robarts Centre for Canadian Studies. York University, Toronto, Canada, 11th October 2013; Alex, B. Digital History and Big Data: Text mining historical documents on trade in the British Empire [Presentation]. Invited talk at Digital Scholarship: Day of Ideas 2. Edinburgh, Scotland, 2nd May 2013; Alex, B. Identifying Trends in Commodity Trading in the Nineteenth Century British Empire. Invited talk at the Centre of Canadian Studies, University of Edinburgh, Edinburgh, Scotland, 17th October 2013. 25 http://tradingconsequences.blogs.edina.ac.uk/ 26 http://tradingconsequences.blogs.edina.ac.uk/2012/07/30/building-vocabulary-with-sparql/ 27 http://tradingconsequences.blogs.edina.ac.uk/2013/02/28/progress-to-date-on-trading-consequences-visualizations/

White Paper
55
interested in the nineteenth century and the history of international trade. All blog posts have been written by members of the Trading Consequences teams who have been supported and encouraged to craft engaging, entertaining and accessible posts which nonetheless share detailed information about the project and of the historical research process. Images have been central to these posts as they bring terminology, plant names and other commodities to life, or provide visual metaphors for key concepts, as well as helping to visualise some of the routes described, and to share emerging versions of the tools under development. These images help ensure that posts are more engaging, more memorable and more likely to be shared.
Figure 33: Trading Consequences Blog.
The blog has attracted over 2700 unique visitors making over 4000 visits to date (Jan 2012-Jan 2014). Our single busiest weeks (50 unique visitors) occurred in November 2012 with the publication of our Commodities, Vampires and Fashion: Making Connections in Victorian Research,28 a post timed to capitalise on the particular interest in the gothic around the release of the film Twilight: Breaking Dawn Part 2.
28 http://tradingconsequences.blogs.edina.ac.uk/2012/11/20/commodities-vampires-and-fashion-making-connections-in-victorian-research/
White Paper
56
Many of our posts have taken a more playful approach to discussing source texts, commodities and the research and data mining challenges encountered in Trading Consequences. Our most popular post to date, created by Jay Young, a researcher working with our historians in Canada, has been Gin and Tonic: A Short History of a Stiff Drink with over 600 views since publication in August 2012.29 Such posts are deliberately eye-catching, use appealing headlines, and have been accessibly written but do include real substance. The Commodities, Vampires and Fashion post is a critical reflection on the our presentation for the Victorian Studies Network at York; the Gin and Tonic post looks at the history of the ingredients of the drink and the role of trading and historical records in understanding the origins of the drink and its popularity. In similarly playful fashion we shared the findings of a major project meeting as 10 Things We Learned at the Trading Consequences Project Meeting,30 reflecting the creative and collaborative nature of those discussions, and the surprises and insights that came from sharing expertise across very different disciplines and interest areas.
As might be expected, given the collaboration in the project between researchers in Scotland and Canada, visitors to the blog are split relatively evenly between the UK (over 1800 visits) and North America (over 600 visits from Canada, and over 650 visits from the United States). The next biggest group of visits have come from India (137 visits to date) which might also be expected given the focus on colonial trading routes. Whilst most blog visitors have accessed the site from desktop machines (3624 visits to date) around 11% of visitors have accessed the site via tablets and mobile devices (487 visits to date) reflecting the usefulness of ensuring a mobile-friendly version of the blog was available (an early decision in the project facilitated by use of a flexible WordPress Plugin).
Whilst there have been few comments on the blog, mainly interactions amongst project members, the Gin and Tonic post attracted a new perspective on the topic from Paul Ward, a researcher at the University of Huddersfield who raised the issue of marketing and branding of gin.31 Other posts, whilst they have not attracted comments on the Trading Consequences blog, have attracted discussion when reposted on others’ sites with more established audiences, or comments on Twitter once shared there.
29 http://tradingconsequences.blogs.edina.ac.uk/2012/08/14/gin-and-tonic-a-short-history-of-a-stiff-drink-from-activehistory-ca/ 30 http://tradingconsequences.blogs.edina.ac.uk/2012/08/20/10-things-we-learned-at-the-trading-consequences-project-meeting/ 31 http://tradingconsequences.blogs.edina.ac.uk/2012/08/14/gin-and-tonic-a-short-history-of-a-stiff-drink-from-activehistory-ca/#comment-373

White Paper
57
Figure 34: Tweets about blog post.
Trading Consequences posts were not limited to the official project presences. Project members contributed guest posts to a number of other sites32 the Kew Gardens Library Art and Archive Blog (Bringing Kew’s Archive Alive, 2nd May 2013),33 NICHE: Network in Canadian History and Environment (Presenting Trading Consequences at CHESS’13, 30th July 2013),34 Commodity Histories Blog (Trading Consequences: a Digging into Data Project, 13th Feb 2012).35
The Trading Consequence project has been featured on partner institutions’ websites: York University website (Professor Colin Coates to dig into data on international commodity trading, 5th Jan 2012),36 University of Edinburgh website (Software to chart rise of Empire Trade, 6th February 2012),37 SACHI – the St Andrews HCI Research Website (Trading Consequences Grant Success, 8th Jan 2012, Seminar Aug 15th: London and the 19th Century Global Commodity Trade: Industrialists and Economic Botanists, 7th Aug 2013),38 EDINA website (Trading Consequences project sets sail, 7th
32 For full listing see: http://tradingconsequences.blogs.edina.ac.uk/publications-presentations/ 33 http://www.kew.org/news/kew-blogs/library-art-archives/bringing-kews-archive-alive.htm 34 http://niche-canada.org/2013/07/30/presenting-trading-consequences-at-chess13/ 35 http://www.open.ac.uk/blogs/CommodityHistories/?p=121 36 http://research.news.yorku.ca/2012/01/05/professor-colin-coates-to-dig-into-data-on-international-commodity-trading/ 37 http://www.ed.ac.uk/news/all-news/060212-empire?utm_source=feedburner&utm_medium=twitter&utm_campaign=Feed%3A+edinburgh-university-news+%28Edinburgh+University+-+Latest+news%29 38 http://sachi.cs.st-andrews.ac.uk/2012/01/trading-consequences-grant-success/; http://sachi.cs.st-andrews.ac.uk/2013/08/seminar-aug-15th-london-and-the-19th-century-global-commodity-trade-industrialists-and-economic-botanists/

White Paper
58
Feb 201239; Trading Consequences – Text mining 19th Century Place Names, 29th Nov 2013),40 and EDINA’s Newsline publication (Trading Consequences, March 2012).41
Figure 35: Discovery of Trading Consequences blog posts.
Trading Consequences members have also used their own established web presences, blogs and Twitter accounts to ensure the project reached already-engaged specialist audiences. For instance blog posts have included those under the “Digging Into Data” tag42 on Jim Clifford’s blog,43 “Vocabulary Hacking with SPARQL and UMBEL”,44 on Ewan Klein’s Separate Clouds blog,45 and “Visualisation Allsorts”46 on Nicola Osborne’s blog. Tweets from personal accounts often bring the everyday progress on of the project to life, for instance in Aaron Quigley’s tweet on the Trading Consequences virtual meeting experience (1st March 2012),47 Jim Clifford’s tallow supply chain investigations (11th Oct 2012),48 Bea Alex sharing some of the complications of OCRed text (24th Sept 2013),49 and Jay Young sharing his post on creating a bibliographic database of sources for the project (14th Nov 2012).50 This diverse content was retweeted or reposted to the official presences to reinforce that all of these specialist strands of work and specialist audiences are linked through the wider project.
39 http://edina.ac.uk/cgi-bin/news.cgi?filename=2012-02-07-trading-consequences.txt 40 http://edina.ac.uk/cgi-bin/news.cgi?filename=2013-11-29-trading-consequences.txt 41 http://edina.ac.uk/news/newsline17-1/trading_consequences.html 42 http://www.jimclifford.ca/category/digging-into-data/ 43 http://www.jimclifford.ca/ 44 http://blog.separateclouds.com/2012/07/vocabulary-hacking-with-sparql-and-umbel/ 45 http://blog.separateclouds.com/ 46 http://nicolaosborne.blogs.edina.ac.uk/2012/10/12/visualisation-allsorts/ 47 https://twitter.com/aquigley/status/175249553396736000 48 https://twitter.com/jburnford/status/256449565660676096 49 https://twitter.com/bea_alex/status/382626073978368000 50 https://twitter.com/jaywyoung/status/268702143236685824

White Paper
59
Figure 35: Tweet about our virtual meetings.
As the funding period comes to an end the project blog will remain available to access, but it is also being archived by JISC through the British Library-led UK Web Archive51, helping to ensure it will remain accessible long into the future. Tweets will continue on an ad hoc basis as appropriate (e.g. on publication of articles) but will be complemented by the Storify presence52 for the project which preserves tweets, mentions and blog posts around Trading Consequences.
6 Project Management Maintaining strong connections among an interdisciplinary group divided between two continents has been a challenge of this particular project. We believe that we have ensured on-going collaboration through a variety of means, largely using the internet. Nonetheless, one face-to-face meeting, held in Edinburgh in May 2012, provided a valuable opportunity for the teams to meet each other. After all, the historians had never worked with the computational linguists or computer scientists, although the latter two groups were acquainted with each other. Scheduled monthly project meetings brought together the participants on a regular basis. Bea Alex and Uta Hinrichs also met with larger groups of environmental historians in the U.K. and in Canada, thus familiarising themselves with the approaches taken by this group of scholars.
A second challenge has been to integrate workloads among colleagues with somewhat different professional schedules and commitments. We also believe that we have been able to manage these issues fairly well. Jim Clifford’s success in receiving a tenure-track position in the second year of the grant meant that he was able to commit less time to the project as his teaching term began. However, his dedication to the project has not lessened, and he has submitted a grant application through his new institution to continue the research. 51 http://www.webarchive.org.uk/ukwa/target/66158967/source/alpha 52 http://storify.com/digtrade/trading-consequences
White Paper
60
Thirdly, whilst Jim Clifford has unusually advanced computer skills for a historian, the same was not true of all the historians, including the Canadian principal investigator and the research assistants. We did not find that this was an impediment to our working with specialists in computational linguistics and computer science.
Further, we believe that the geographical concentration of the three teams has helped the project to mature. With the historians located in Canada, and the computational linguists and computer scientists in fairly close proximity in Scotland, the division of tasks never became complicated.
Details of project management events:
- Monthly project meetings (via Skype) with all partners lead by the project coordinator (LTG, School of Informatics, Edinburgh), all with documented agendas and minutes, see project wiki.
- A project kick-off meeting in Edinburgh attended by all project partners, May 2012.
- Additional technical meetings in Edinburgh.
- Use of the database in the context of a graduate history class in Environmental History at York University, February 2013.
- A user workshop in Canada attended by technical team members from LTG and SACHI (University of St. Andrews) in the UK, June 2013.
- Iterative development with 3 major prototypes (first two followed by user testing) and planned launch of the user interfaces again followed by further user testing in the future.
- The Digging Into Data end-of-project conference, October 2013.
7 Lessons Learned
7.1 The value of big data for historical research Scholars interested in nineteenth-century global economic history face a voluminous historical record. Conventional approaches to primary source research on the large-scale economic and environmental implications of globalised commodity flows restrict researchers to specific locations or fairly small-scale commodities. Discerning meaningful historical relationships on this scale requires computational tools that can process, organize, and represent the information contained in big data sets. Historians are becoming increasingly interested and skilled at using and thinking with big data. This project has demonstrated that important new historical methodologies can be developed in collaboration with computational linguists and data visualisation experts. The findings that result from the application of these new methodologies are very difficult to reproduce using conventional research methods. In particular, this project has demonstrated that parsing the data obtained from text mining tens of thousands of

White Paper
61
documents related to nineteenth-century commodity trading in order to obtain relationships between commodity type, place name and year is extremely valuable for economic and environmental history research. By pulling out information related to the changing relationship between commodity trade and particular places, this project’s parsing of big data presents historians with several new approaches to understanding how distant places all over the globe were connected over time by economic forces, and how efforts to generate wealth from resources located all over the world altered specific local environments. By working with big data historians may discover new insights and pursue new questions.
Our initial work with the database and visualisation serves to confirm and extend current understandings of well-researched commodities. For instance, gutta-percha trees produce latex used in underwater cables in the mid-nineteenth century and golf balls to this day. Historian John Tully reveals the environmental consequences of this trade, locating the origins of the product in the forests of Southeast Asia and the links to international trade networks (Tully, 2009). Consulting the database shows a restricted time range for mentions of the product, beginning in the 1860s, and a concentration in Borneo and Singapore, as well as the key markets in the United States and Great Britain. In Canada, a visualisation of wheat shows the growing prominence of Manitoba in the late nineteenth century, again confirming the text-mined data confirms well-known historical trends.
7.2 Data Access Data access will be a growing problem going forward unless the Digging Into Data consortium find a way to negotiate access with the major providers. This project would have been impossible without access to large data sets mined from relevant documents from the nineteenth century. Although we succeeded in obtaining permission to use several large data sets (for example, the House of Commons Parliamentary Papers, the Canadiana.org archive, and the Kew Gardens Director’s Correspondence Collection), the project would have been even more successful if the text-mining team had had access to even larger data sets. In particular, access to the nineteenth-century archives of The Economist would likely have proven quite valuable. Even when access was granted, unnecessary bureaucratic and legal obstacles wasted time and resources. One of the project’s lead researchers spent the majority of her time trying to secure data and sending reminder emails to lawyers. This was an unfortunate loss of time that could have been directed toward adapting the prototype. On a more positive note, the project benefitted immensely from the help of York University’s librarians, particularly Tim Bristow, Tom Scott and Catherine Davidson, who helped us secure some of the necessary data to develop the prototype. We would highly recommend including librarians on project teams at the application stage.
7.3 Cross-disciplinarity Communicating across disciplinary boundaries was key to the project’s success. Although the history, text mining and visualisation teams recognised the potential of this project early on and envisioned many aspects of the working prototype, the actual

White Paper
62
process of developing the relational database required on-going dialogue. Refining the text-mining and data visualisation components of the project required more than the historians simply telling the computer scientists that historical research does not employ the standard hypothesis-testing scientific methods. Collaborative meetings in which both teams learned about the other disciplines created the intellectual conditions necessary to produce an interdisciplinary research tool. For the text mining and visualisation teams the challenges had less to do with whether the tools were available to address the methodological questions that interested historians, and more to do with the identifying and refining the tools that would be most useful for historical research. The history team explained in detail how they formulated research questions as they work their way through archival sources, and how much of the time they did not find what they thought they were looking for, but instead made a different discovery. The visualisation team needed to understand how historians conducted research so they could craft a new tool that built on existing historical methodologies. In doing so, the project resulted in an intuitive website accessible to historians with no background in text mining or digital history.
Everyone needs to make an effort to learn something about the other disciplinary culture and face-to-face meetings and attending workshops or conferences in other disciplines help a great deal. In addition to regular collaborative meetings in which the three teams solved inter-disciplinary challenges, various members attended workshops and conferences as non-specialists in order to acquire a fuller understanding of other aspects of the project. For example, in May 2013 B. Alex attended two separate workshops hosted by environmental historians in British Columbia and digital history in Edinburgh. Not only did this give members the opportunity to explain their work to scholars working in a different discipline, but also to consider how other disciplinary approaches thought about the outcomes and potential of the project.
Computer scientists proved extraordinarily capable of comprehending the methodological and substantive questions related to historical research, and in translating that comprehension into computer programs and tools useful to historians. This tendency for the computer scientists to meet the historians on their terms, as opposed to the other way around, suggests that humanists likely have to make greater efforts in acquiring a comprehensive understanding of computer technology, even if they do not get to the point where they contribute to coding or database development. If humanists are incapable of understanding and accessing computer technology, they will have difficulty learning how to use the data created by text mining. As a result, potentially fruitful methods of aiding humanists in their research will be overlooked and under-utilised. Computer literacy is essential for humanists to avoid missing important intellectual opportunities to make significant contributions to their various fields of study. Being involved in the process of annotating the test results of the relational database showed the historians how text mining actually works, which in turn enabled historians to provide more helpful input in the text mining refinements. Moreover, by presenting the relational database and visualisation tools to other historians at workshops and conferences, the history team developed a practical understanding of the technology
White Paper
63
and became better able to provide useful feedback to the text mining and visualisation teams.
7.4 Annotation Annotation is very difficult and time consuming. Finding subject experts is really important. In order to refine the text mining to produce the most accurate relational database, a great deal of time was spent on annotating test results. Whenever text mining misidentified a recognised entity or failed to locate a place on the map of the world, the project relied on human experts to identify the problem and annotate the correct information in a gold standard so that the text mining team could refine their tools to avoid similar errors in the future. It is therefore extremely important that projects of this nature have subject experts who can more economically identify and annotate problems related to text mining and data visualisation. Although this aspect is less collaborative and inter-disciplinary than other aspects of the project, it is nevertheless an integral component of a very inter-disciplinary whole.
7.5 Visualisation Geographic Information Systems, such as ESRI’s ArcMap, is a useful tool for prototyping geo-parsed results. Throughout the project the text mining team ran scripts to extract subsets of data, such as all of the coal-location relationships53 in the Early Canada Online corpus, directly from their XML data. This allowed the history team to use their pre-existing knowledge of GIS to create maps and videos displaying the results. This allow us to explore the without waiting for it to be parsed into the relational database and to explore aspects of the data now available in early the visualisation prototypes. The ability of ArcMap to create videos showing change over time proved particularly useful in demonstrating the utility of the text-mined data in conference presentations and through blog post.[Extend]
8 Conclusion From the beginning, the goal of this project was both to explore an interdisciplinary methodology for studying and presenting big data and to create a research tool for scholars beyond those directly involved in this grant. With the release of the visualisation database at the end of February 2014, we shall have achieved this goal.
For historians, this project reveals some of the potentials of working with text mining, as well as the pitfalls of using historical texts, some of which are much more adaptable to computer-assisted research than others. Computers read in a linear fashion, and much useful data were presented in tabular forms. Currently, we cannot use these tabular data as effectively as we would like. We have also realised the importance of working with well-constructed lexicons that reflect categories as they made sense to people in the past as well as researchers today. In initial tests, the reliability of the project seems assured, as the database reproduces results that one would expect from current
53 http://www.jimclifford.ca/2013/05/28/coal-location-date-relationships-text-mined-from-early-canada-online-canadiana-ca/

White Paper
64
research on specific commodity trades. Therefore, exploring other commodities will likely reveal new insights. Whilst we will continue to undertake some of this research, we anticipate that other scholars will be able to make use of this tool as well. We do not believe that text mining will replace entirely the “close reading” that most historians cherish as a methodology, but it should supplement it. Moreover, in accessing vast amounts of digitised data, such computer-assisted techniques will undoubtedly reveal new insights that single historians – or even teams of historians – would simply not have the time to determine.
White Paper
65
9 References Bea Alex, Claire Grover, Ewan Klein and Richard Tobin (2012). Digitised Historical Text: Does it have to be mediOCRe? In Proceedings of KONVENS 2012 (LThist 2012 Workshop), Vienna, Austria.
Beatrice Alex and John Burns (to appear in 2014). Estimating and Rating the Quality of Optically Character Recognised Text. DATeCH 2014.
Beatrice Alex, Kate Byrne, Claire Grover and Richard Tobin (submitted in January 2014, currently under review). Adapting the Edinburgh Geoparser for Historical Georeferencing, submitted to the International Journal for Humanities and Arts Computing. Christopher Collins, Fernanda B. Viégas, and Martin Wattenberg (2009). Parallel Tag Clouds to Explore and Analyze Faceted Text Corpora. In Proceedings of the IEEE Symposium on Visual Analytics Science and Technology, pp. 91-98.
Jacob Cohen (1968). Weighted kappa: Nominal scale agreement with provision for scaled disagreement or partial credit. Psychological Bulletin, 70(4), pp. 213-220.
Alfred Crosby (2004). Ecological Imperialism: The Biological Expansion of Europe 900-1900, 2nd edition, Cambridge: Cambridge University Press.
John Darwin (2009). The Empire Project: The Rise and Fall of the British World-System, 1830-1970, Cambridge: Cambridge University Press.
Marian Dörk, Sheelagh Carpendale, Christopher Collins, and Carey Williamson (2008). VisGets: Coordinated Visualizations for Web-based Information Exploration and Discovery. TVCG: Transactions on Visualization and Computer Graphics, 14(6), pp. 1205-1212.
Claire Grover, Sharon Givon, Richard Tobin, and Julian Ball. Named entity recognition for digitised historical texts (2008). In Proceedings of the Sixth International Conference on Language Resources and Evaluation (LREC’08), Marrakech, Morocco, pp. 1343–1346.
Claire Grover, Richard Tobin, Kate Byrne, Matthew Woollard, James Reid, Stuart Dunn, and Julian Ball (2010). ‘Use of the Edinburgh Geoparser for georeferencing digitised historical collections.’ Philosophical Transactions of the Royal Society A, 368(1925), pp. 3875-3889.
Harold A. Innis (1956). Essays in Canadian Economic History, ed. by Mary Quayle Innis, Toronto: University of Toronto Press.

White Paper
66
Harold A. Innis (1978 [1940]). The Cod Fisheries: The History of an International Trade, revised edition, Toronto: University of Toronto Press.
Harold A. Innis (1999 [1930]). The Fur Trade in Canada: An Introduction to Canadian Economic History, Toronto: University of Toronto Press.
John McCrae, Guadalupe Aguado de Cea, Paul Buitelaar, Philipp Cimiano, Thierry Declerck, Asunción Gómez Pérez, Jorge Gracia, Laura Hollink, Elena Montiel-Ponsoda, Dennis Spohr, and Tobias Wunner (2010). The Lemon Cookbook. The Monnet Project. http://lemon-model.net/lemon-cookbook.pdf.
Alistair Miles and Sean Bechhofer (2009). SKOS simple knowledge organization system reference. W3C recommendation, W3C, August. http://www.w3.org/TR/2009/REC-skos-reference-20090818/.
Franco Moretti (2005). Graphs, Maps, Trees: Abstract Models for a Literary History. Verso.
Kavita Philip (1995). Imperial Science Rescues a Tree: Global Botanic Networks, Local Knowledge and the Transcontinental Transplantation of Cinchona, Environment and History. 1(2), pp. 173-200.
Henry Nicholas Ridley (1912). Spices. London: Macmillan and co. Ltd.
Aaron Quigley, Darren Leigh, Neal Lesh, Joe Marks, Kathy Ryall, and Kent Wittenburg. "Semi-automatic antenna design via sampling and visualization." In Antennas and Propagation Society International Symposium, 2002. IEEE, vol. 2, pp. 342-345. IEEE, 2002.
Nikos Saris, Gerasimo Potamianos, Jean-Michel Renders, Claire Grover, Eric Karsten, Kallipolitis, Vasilis Tountopoulos, Georgios Petasis, Anastasia Krithara, Matthias Gallé, Guillaume Jacquet, Beatrice Alex, Richard Tobin, and Liliana Bounegru (2011). A system for synergistically structuring news content from traditional media and the blogosphere. In: eChallenges 2011.
Andy Seaborne and Steven Harris (2013). SPARQL 1.1 query language. W3C recommendation, W3C, March. http://www.w3.org/TR/2013/REC-sparql11-query-20130321/.
Alice Thudt, Uta Hinrichs, and Sheelagh Carpendale (2012). The Bohemian Bookshelf: Supporting Serendipitous Discoveries through Visualization. In Proceedings of the SIGCHI Conference on Human Factors in Computing Systems, pp. 407-414.
John Tully (2009). A Victorian Ecological Disaster: Imperialism, the Telegraph, and Gutta-Percha. Journal of World History. 20(4), pp. 559-579.

White Paper
67
Fernanda B. Viégas, S. Golder and Judith Donath (2006). Visualizing Email Content: Portraying Relationships from Conversational Histories. In Proceedings of the SIGCHI Conference on Human Factors in Computing Systems, pp. 979-988.
Mitchell Whitelaw (2012). Towards Generous Interfaces for Archival Collections. ICA Congress, Brisbane.