digital a nalytics · overcome hurdles and ultimately make analytics a commonly used tool to affect...
TRANSCRIPT
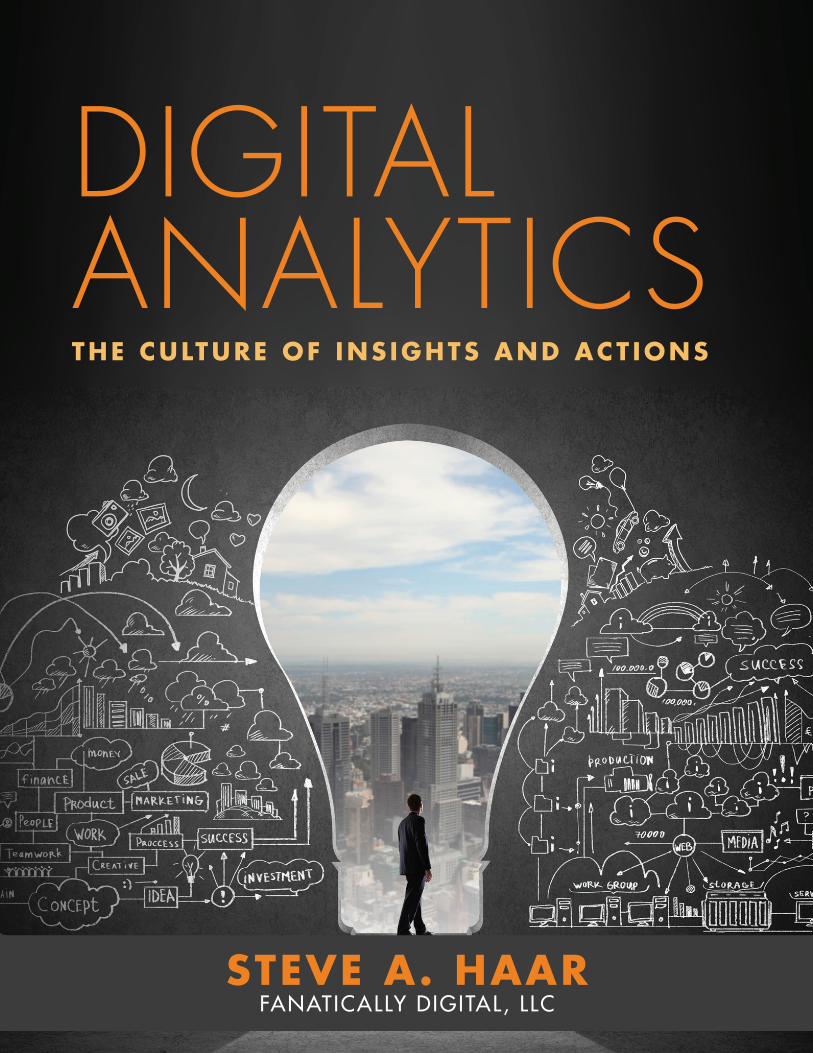
Digital analyticsThe CulTure of Ins IghTs and aCT Ions
sTeve a. haarFanatically Digital, llc

DIGITAL ANALYTICS: THE CULTURE OF INSIGHTS AND ACTIONS
2
Copyright © 2015 Steve A. Haar
CONTACT:
Steve A. Haar
Fanatically Digital, LLC
DIGITAL ANALYTICS: THE CULTURE OF INSIGHTS AND ACTIONS
3
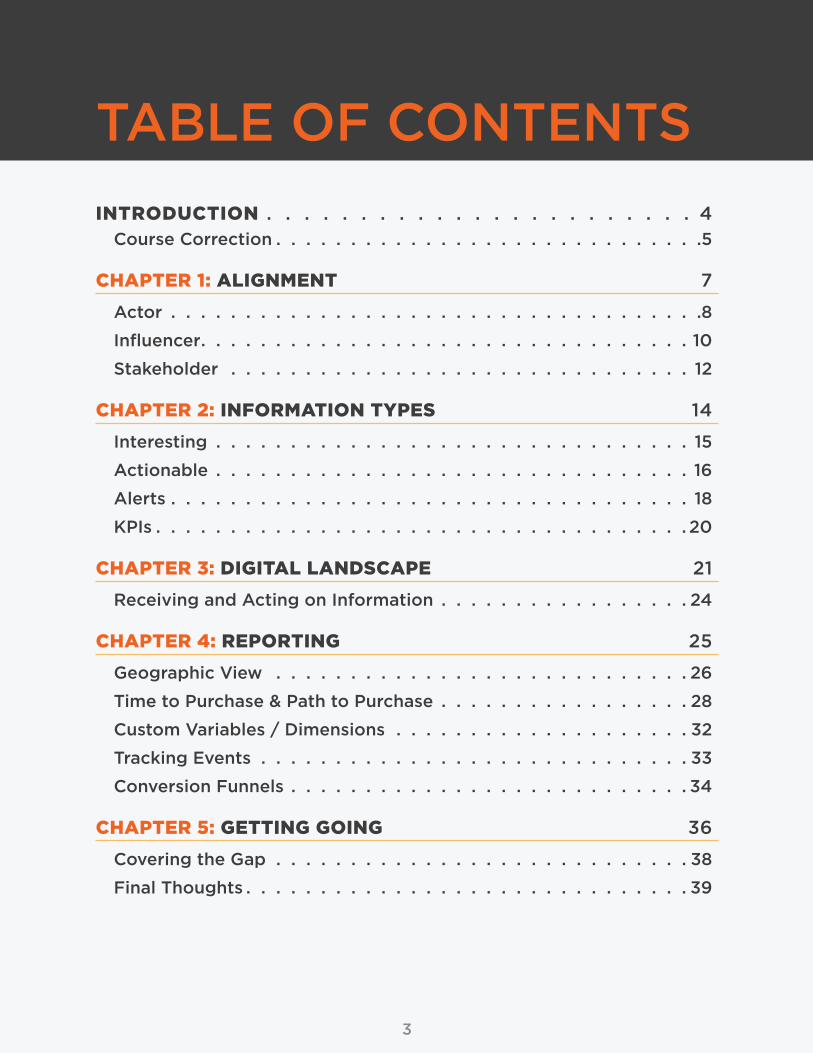
TABLE OF CONTENTS
INTRODUCTION . . . . . . . . . . . . . . . . . . . . . . . 4Course Correction . . . . . . . . . . . . . . . . . . . . . . . . . . . . .5
ChapTeR 1: aLIGNMeNT 7
Actor . . . . . . . . . . . . . . . . . . . . . . . . . . . . . . . . . . . .8
Influencer . . . . . . . . . . . . . . . . . . . . . . . . . . . . . . . . . 10
Stakeholder . . . . . . . . . . . . . . . . . . . . . . . . . . . . . . . 12
ChapTeR 2: INFORMaTION TYpeS 14
Interesting . . . . . . . . . . . . . . . . . . . . . . . . . . . . . . . . 15
Actionable . . . . . . . . . . . . . . . . . . . . . . . . . . . . . . . . 16
Alerts . . . . . . . . . . . . . . . . . . . . . . . . . . . . . . . . . . . 18
KPIs . . . . . . . . . . . . . . . . . . . . . . . . . . . . . . . . . . . . 20
ChapTeR 3: DIGITaL LaNDSCape 21
Receiving and Acting on Information . . . . . . . . . . . . . . . . . 24
ChapTeR 4: RepORTING 25
Geographic View . . . . . . . . . . . . . . . . . . . . . . . . . . . . 26
Time to Purchase & Path to Purchase . . . . . . . . . . . . . . . . . 28
Custom Variables / Dimensions . . . . . . . . . . . . . . . . . . . . 32
Tracking Events . . . . . . . . . . . . . . . . . . . . . . . . . . . . . 33
Conversion Funnels . . . . . . . . . . . . . . . . . . . . . . . . . . . 34
ChapTeR 5: GeTTING GOING 36
Covering the Gap . . . . . . . . . . . . . . . . . . . . . . . . . . . . 38
Final Thoughts . . . . . . . . . . . . . . . . . . . . . . . . . . . . . . 39

INTRODUCTION

DIGITAL ANALYTICS: THE CULTURE OF INSIGHTS AND ACTIONS
5
“Return on investment” (ROI) is an overused phrase, rendered nearly
meaningless through its misuse and most marketers’ inability to truly
measure anything in a useful way.
Frustratingly, the solution to this is at hand, but inertia, impatience and
outdated organizational views prevent most firms from reinvigorating
the usefulness of an ROI perspective. Often, companies have the tools
in place, but lack training and appropriate access. I equate this to a
well-equipped construction site, but you give the Mason’s trowel to the
electrician, the carpenters hammer to the glass installer and leave the
painters with nothing at all. The right tools are either not in the right
hands, or not present.
I have seen this many times. Companies invest six-figures in analytics
applications, but don’t know how to use them, severely restrict access,
and leave those most capable of acting on the information to wallow in
ignorance. This state is a result of neglect, readily corrected with focus,
patience, and persistence.
COURSe CORReCTION
We’ll go through steps to help you and your organization refocus,
overcome hurdles and ultimately make analytics a commonly used tool
to affect ROI at all levels. This is not just about how to use analytics
tools like Google Analytics, Omniture / Adobe (Adobe), Web Trends or
other technology. A good portion of our focus will be on the way we
incorporate the language of analytics… not nearly as onerous as some
“gurus” would have you to think.
In the pages to follow, we’ll address a range of topics, starting from
the simple notion of just gathering the questions you need to answer.
From here, and related, we are spending a fair amount of our content
on Alignment; Roles, Information Types and Actionable Information.
Before you touch data, set up analytics or generate reports, these
DIGITAL ANALYTICS: THE CULTURE OF INSIGHTS AND ACTIONS
6
aspects must be well understood within your organization. Without
these, your journey in analytics will be rudderless.
Once the organizational foundation is understood, and hopefully
set, you can start diving into Analytics. There are a host of tools with
varying degrees of sophistication. My short recommendation seems
a contradiction: Control the inputs, Provide universal access. Virtually
all tools can facilitated this dichotomy, but the methods of doing so
vary, some requiring much greater administrative support and technical
knowledge. As we walk through this portion of the discussion, we’ll use
Google Analytics (GA) as the representative tool. However, we’ll also
note how others can facilitate the same needs.
While we will delve into some detail along the way in order to provide
concrete applications during our conversation, this is not intended
to be an analytics manual. We will however provide reference and
resources. If you are hands on, or just curious, these will be great
sources for you.
A couple things before we move on. First, don’t wait for perfection.
You may not be able to implement the changes across the entire
organization, but you should endeavor to change within your area of
influence, providing a model for the rest of the organization. Second,
analytics are for everyone whose actions affect the consumers’
experience. We’ll get into detail further on, but all people who impact
the experiences of the consumers should see some metrics or KPI
related to their activity. Absent this, it is too easy to have people doing
work without any insight into its value.

C h a p T e R 1
ALIGNMENTSTART FROM THE SAME PLACE,
GO IN THE SAME DIRECTION
DIGITAL ANALYTICS: THE CULTURE OF INSIGHTS AND ACTIONS
8
There are so many possible objectives, ways to measure progress,
and views on what progress really means that it is virtually impossible
for all levels of an organization to simply “know” what is expected.
Expectations need to be clearly communicated, and the measure
against them clearly visible throughout the organization. To establish a
clear view of these, there must be alignment.
Achieving alignment requires an understanding of the Roles we all play
within an organization. These Roles determine our relationship with
others in the company, how we impact them, and how they impact
us. To meet our goals, we need to understand who the Actor is, The
Influencers and the Stakeholders are. As you will see, the interaction
between these Roles is pivotal to organizational success.
aCTOR
This is you. In fact, relative to our specific areas of responsibility, this is
everyone within the organization. Anyone who is not an Actor serves
no purpose.
actor: The person who has the authority, ability and resources to take
action to affect change or maintain direction.
The role of Actor is filled by different people at different levels
throughout the organization. As we view analytics, understanding
the scope of the Actor is vital to knowing the frequency and type of
information the Actor needs in order to make decisions and direct their
own effort.
At the senior levels of an organization, where structure and resource
allocation decisions must be made and executed, the type of
information is high-level, delivered monthly, quarterly or annually.
They set KPIs around revenue to cost ratios, revenue growth targets
and higher level metrics that point to the overall health and progress
of the organization. This information is used to decide product mix,

DIGITAL ANALYTICS: THE CULTURE OF INSIGHTS AND ACTIONS
9
organizational structure, or high-level funding. These are the strategic
decisions for the company, and the corresponding KPIs are gathered
over wider spans of time. Additionally, the action of the high-level
Actor takes longer to manifest itself in the data; their impact is longer
term.
Contrast the senior level position with the pay per click (PPC) manager.
At the PPC level, very minute data points, delivered at least daily are
necessary to perform the job properly. These are very tactical KPIs that
can radically change day to day. The PPC manager will see the impact
of their actions within 24 hours. It is vital that this person have a steady
stream of focused information in order to perform their responsibilities.
In between these two levels, depending on your organization, you may
have a Media Director, whose responsibility is to decide how much of
the budget allocated by senior level management should be directed
to PPC, display, email, and affiliate marketing and so forth. This mix
will be based on the target KPIs for media and the mix necessary
to achieve them. The information this person needs is the summary
performance of each medium relative to target KPIs, usually on no
more than a weekly basis, no less than monthly. This is about the
frequency needed to make adjustments to the digital media mix.
As you consider the Actor at different levels, you will note that the
nature and frequency of information that is needed changes. This
seems obvious, but when we look at the nature of the information
with which people are typically inundated, the “obvious” does not
necessarily match with the reality. We will cover Information Types
later, and consider ways to make it more focused.
Dysfunctional?
A common symptom of poor alignment is the involvement of
higher-level managers in the day to day activity of lower level
employees. This occurs most often for one of two reasons: 1) lack
of trust in the lower level employee, or 2) lack of visibility into the

DIGITAL ANALYTICS: THE CULTURE OF INSIGHTS AND ACTIONS
10
appropriate KPIs. Often, #1 is the result of #2. If you see managers
being pulled into activity one or two levels below their position,
don’t just tell them to “get out of the weeds.” Instead, review the
KPIs into which the two levels of employees have visibility, and
how they are aligned. Unless these KPIs indicate performance
problems, each level should focus on their own KPIs. We discuss
stakeholders below, where we touch on cascading KPIs. This is a
key attribute of good alignment.
INFLUeNCeR
By the very nature of an organization, no one person achieves results in
isolation. The Actor’s success or failure is significantly impacted by the
actions of others. And the organizational success is dependent on the
proper alignment of the influencers’ focus. Those whose actions impact
our success are Influencers and in turn, we are Influencers to others.
Typically, Influencers are reciprocal, but are not directly accountable
to each other. To understand who within in an organization is an
Influencer, you have to understand the KPIs upon which others are
measured. When the Actor has visibility into this, it becomes apparent
who they need to consider as they seek to achieve their goals.
As an example, for online retailers, the Product Buyers (PB) who decide
what products will be sold, establish suppliers, and buy inventory
are typically judged on how well the products sell and the margin
produced (just to keep it simple). PPC Managers are judged, to a large
extent, on the efficiency of the sales generated from search marketing.
If the Product Buyers do their job well and anticipate the market shifts,
it makes the job of the PPC Manager much easier. The opposite is also
true. If the PB poorly anticipates styles for the next season, the PPC
Manager will have a difficult time being efficient… the demand simply
isn’t there.

DIGITAL ANALYTICS: THE CULTURE OF INSIGHTS AND ACTIONS
11
Conversely, the PPC Manager who does a poor job with keyword
targets, poor campaign structure or bad ad copy, will cause the
products to not move quickly; pricing incentives are typical tactics for
poorly moving products. This affects the metrics by which the PB is
judged – inventory turnover and margin.
User Experience directors, creative and media are all Influencers
to each other. While none is directly accountable to another, their
success is intertwined. By establishing very transparent analytics, each
person has visibility into the others’ performance, allowing for greater
collaboration. Absent this visibility, the Actors may be at odds with
each other.
CONSIDeR:
Objective: Increase Revenue.
Media Strategy: Increase conversion Rates.
Tactics: Focus media on proven high-converting keywords and products.
UX Strategy: Increase the average order value.
Tactics: Implement cross sell / upsell decision engines across all shopping carts.
In this case, media is driving focused traffic, with a high propensity to
convert on specific products. This tactic can quickly be undermined
with the introduction of the UX tactics. Or the UX tactic can be
undermined by the Media tactic. In either case, they are both
Influencers of the other.
The obvious answer is to make sure these groups communicate with
each other. But, too often they don’t. Each is surprised by other’s
DIGITAL ANALYTICS: THE CULTURE OF INSIGHTS AND ACTIONS
12
actions. By knowing the Influencers and the respective KPIs (AOV
and conversion rate in this case), you can better manage the cross
functional impact of influencers.
Later we will address Types of KPIs. In the above example, we share
Result KPIs as well as Managing KPIs. Each is important and will be
elaborated upon shortly.
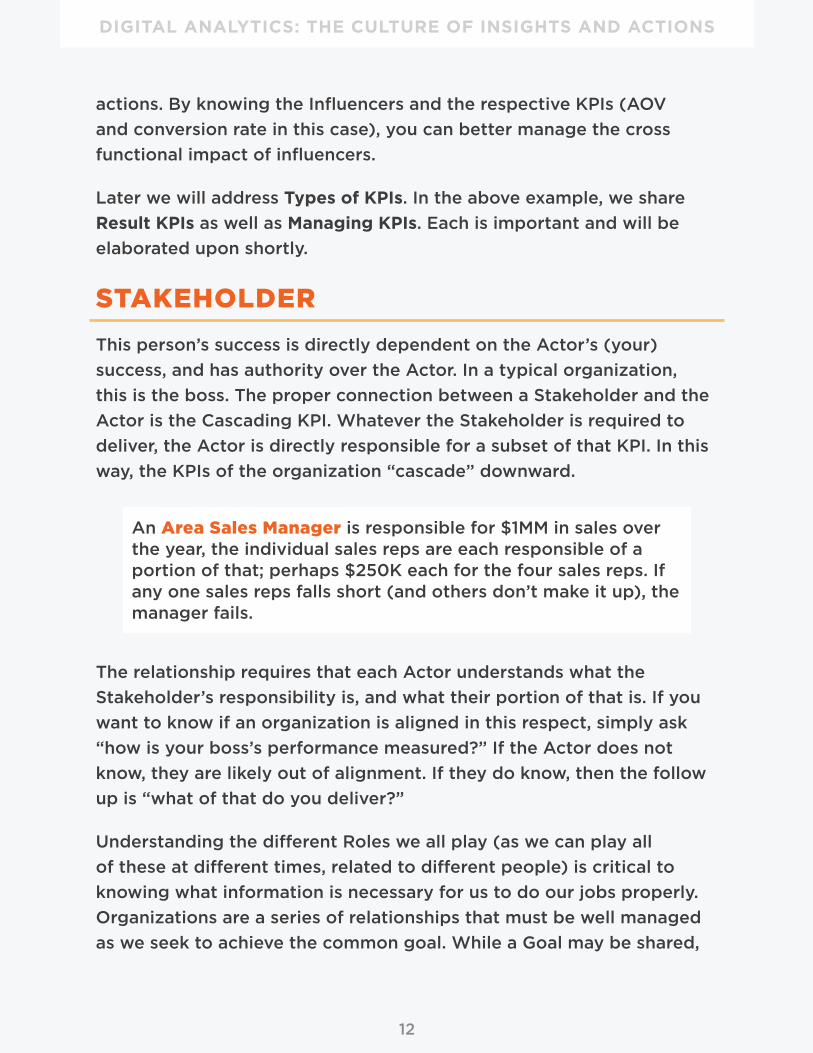
STaKehOLDeR
This person’s success is directly dependent on the Actor’s (your)
success, and has authority over the Actor. In a typical organization,
this is the boss. The proper connection between a Stakeholder and the
Actor is the Cascading KPI. Whatever the Stakeholder is required to
deliver, the Actor is directly responsible for a subset of that KPI. In this
way, the KPIs of the organization “cascade” downward.
An area Sales Manager is responsible for $1MM in sales over the year, the individual sales reps are each responsible of a portion of that; perhaps $250K each for the four sales reps. If any one sales reps falls short (and others don’t make it up), the manager fails.
The relationship requires that each Actor understands what the
Stakeholder’s responsibility is, and what their portion of that is. If you
want to know if an organization is aligned in this respect, simply ask
“how is your boss’s performance measured?” If the Actor does not
know, they are likely out of alignment. If they do know, then the follow
up is “what of that do you deliver?”
Understanding the different Roles we all play (as we can play all
of these at different times, related to different people) is critical to
knowing what information is necessary for us to do our jobs properly.
Organizations are a series of relationships that must be well managed
as we seek to achieve the common goal. While a Goal may be shared,

DIGITAL ANALYTICS: THE CULTURE OF INSIGHTS AND ACTIONS
13
absent good coordination between the different ways to achieve it,
Actors may negate each other’s impact.
Head of Ecom.
Head of Purchasing
Head of Advertising
Broadcast Director
Print Media Director
Creative Director
Designer
Copy Writer
BuyersMedia DirectorOrganic Search
DirectorUser Exp. Director
Paid Search
Display
Affiliate
Social Media Director
INFLUENCERS
STA
KE
HO
LD
ER
S

C h a p T e R 2
INFORMATION TYPES
STAY FOCUSED, AVOID SHINY OBJECTS

DIGITAL ANALYTICS: THE CULTURE OF INSIGHTS AND ACTIONS
15
As many ways as you can think of it, information is available. From
push technology that finds us wherever we are and pops up notices on
our phones, to e-readers that aggregate RSS feeds to social networks
that stream the exciting, mundane and inane with equal vigor, we are
inundated with information far beyond our ability to assimilate and
comprehend. Access to information is not the concern. Access to the
right information is.
In business, separating the valuable and important information from
the rest is the key to taking the right actions. In order to filter properly,
we need to establish categories of information, determine how we treat
each category and our following actions, if any.
For this purpose, we divide information to three primary categories:
1. Interesting
2. Actionable
3. Alerts
INTeReSTING
As you might surmise, interesting information is that which is pertinent
to us, either by some connection to our job, or simply by virtue of our
personal interest. This is obvious on its face. What is not so obvious is
just how much information we receive “related” to or job that is simply
interesting. It has no bearing on what actions we will take, or affect our
performance within our plan time lines.
Interesting information is not without value. It is good to be aware of
our business landscape, and may inform some future decision. But,
for the performance of our jobs and the effect on our KPIs, it is not
pertinent.

DIGITAL ANALYTICS: THE CULTURE OF INSIGHTS AND ACTIONS
16
If your job is to plan product merchandising for a US website, Global Internet usage figures are not terribly relevant. Knowing that Latin America has about 10% of Global internet users is not going to impact how you develop your merchandising programs for the US market. This is interesting, and as your scope expands in your career, this information may impact your decision for Global resource allocations. But, for now, it does not affect your job.
As we go up the ranks of an organization, the shift from Interesting
to Actionable begins to include broader strokes of information. For
instance, a PPC Manager is very dependent on the traffic generated
by their efforts. But total website traffic is not a great concern; they
should be aware of it if only to be aware of their company. To an
e-commerce manager or an IT manager however, total website traffic
becomes very important, and will affect how they allocate resources
and where they focus their time. The same information is simply
interesting to one level, while being Actionable to another.
aCTIONaBLe
We hear about the desire for Actionable information a lot. Perhaps so
much that it has lost its meaning. But, it is nonetheless important to
apply the term, returning to it its original importance.
For our purposes, Actionable Information is that which informs and is
affected by our actions. It is related to specific KPIs that are tied to our
performance. Based on our scope and our timelines, the impact of our
actions will be visible in the information we are using. The frequency of
the reporting will be contingent upon the time it takes our actions to
impact the results.
For conversion rate optimization (CRO) specialists, implementing new
layouts can impact the results as soon as they go live. Based on site
traffic, the results may be readable within a day (view Alerts below for

DIGITAL ANALYTICS: THE CULTURE OF INSIGHTS AND ACTIONS
17
more on this). PPC Managers need to see results daily to ensure their
programs are running according to their plans. As we rise through the
ranks, the impact of our decisions and actions take place over longer
spans of time. As such the reporting should also change – weekly,
monthly, or quarterly, etc.
From an Analytics perspective, the greatest focus should be providing
people with actionable information on a timely basis. This has proven
to be, perhaps, the most challenging aspect of Analytics.
Decide Next Action Take Action
Impacts Conversions
Report on Results
Specific Data Collected
aCTIONaBLe INFORMaTION
Actionable information:
• Tied to KPIs
• Indication of success or failure
• Your actions materially impact the numbers
• Timely delivery
• Received with enough information to be actionable
• Frequently enough to take action

DIGITAL ANALYTICS: THE CULTURE OF INSIGHTS AND ACTIONS
18
aLeRTS
Alerts inform us of something outside the expected. This can be
positive or negative. But, it has immediate implications.
As in the example above of a CRO specialist, when a new layout is
implemented, the specialist should implement Alert triggers related
to conversion rates / volume that indicates either something is
wrong with the implementation or that the results are well below
expectations. If the anticipation is that conversions should be 5%, but
in the first few hours, it drops to 1%, the CRO specialist needs to be
notified in order to determine if action is required.
Alerts need to go to two groups of people:
1) those who can address / fix the issue and
2) those whose jobs / KPIs are affected by the problem.
A common issue is website responsiveness. When page load times
increase significantly, the IT staff needs to address the problem,
but the marketers who are driving traffic also need to decide if the
programs should be paused. Each should be Alerted, and a protocol
for communicating the nature and severity of the issue must to be
implemented.
Alerts, usually, are a way of containing the negative impact of the
unexpected. They can be thought of as “hyper-actionable” information.
So what?
To focus our efforts, we have to minimize the distractions that stem
from so much information coming our way. This is true individually and
also organizationally.
Individually, identify the KPIs that are impacted by your actions, and
the targets you have. Develop the reporting, both content and timing
DIGITAL ANALYTICS: THE CULTURE OF INSIGHTS AND ACTIONS
19
that will allow you to measure your efforts, indicated actions and keep
you on track.
For all information not related to the KPIs, filter this into email folders
or hard files to be reviewed at specified times during the week. This
information is the Interesting information that should not be treated
with the same priority of the Actionable information. Schedule time to
review and explore Interesting information.
For the organization, minimize broadcast reports. Go through a
process of reviewing the reports and email distribution lists for them.
Remove those for whom it is not relevant. Limit the frequency of the
reports; Email blasts telling everyone in the organization what the
website traffic was the prior day is a distraction for the vast majority of
recipients. Limit or eliminate this type of reporting.

DIGITAL ANALYTICS: THE CULTURE OF INSIGHTS AND ACTIONS
20
KpIS
KPIs have been reference a lot. To leverage KPIs, it is important to
understand two types of KPIs.
The first is the Results KPI. This is the number that you are trying to
achieve, the one that lets you know if you have succeeded or failed. It
is usually tied to revenue, customer acquisition or profitability levels
or some such higher-level metric. While the term Result is an “end”
state, the Results KPI are what we look at for progress to the Goal. If
the target Result is to grow from $20MM to $24MM in annual sales, our
Results KPI might be a target of $2MM in sales each month.
To plan and track our path to the Results KPI, we need to also have the
second type, the Managing KPIs. These are the tactical numbers that
let us know if our actions are taking us in the right direction.
For instance, we may carve out 10% of the sales growth to come from cross sell / upsell activity. To do this, we’ll target increased average order values and upsell conversions as two Managing KpIs. On a day to day, week to week basis, we will look at these Managing KpIs, make changes and see if those changes are moving the metrics in the right direction.
Result KpIs cascade from the top down. As we manage the people
below us in the organization, our focus should be on the Result KpIs.
When these begin to trend short, we have our indicator that we need to
work with our direct reports and help them in their actions relative to
their Managing KpIs. Allowing direct reports to handle the Managing
KpIs without looking over their shoulders can be tough, especially for
a manager who rose through the same position. But, it is important to
allow those responsible for the performance to have control. It requires
trust.

C h a p T e R 3
DIGITAL LANDSCAPE
BEGIN WITH THE END IN MIND

DIGITAL ANALYTICS: THE CULTURE OF INSIGHTS AND ACTIONS
22
We are in business. Our goal is to sell something – product, service,
idea. In the process of selling, companies employ people to look after
the various aspects of digital marketing. One of the challenges in
digital marketing is the very different jobs that have to interact in order
to make it happen. For an individual to help the cause of selling, they
must have a clear perspective on their position in the digital landscape
and the applicable Managing KPIs they can affect.
One possible view of the landscape is below. At each step in the
buyers’ experience, Actors have an impact. Understanding that the end
game is a sale, each person can see the next step in the flow, and how
they can impact it.
Influence On-line
Influence Off-line
LANDSCAPE
On-line
Buy-flow
Visitor Patterns
Traffic Drivers
Sale
Off-lineAve. Sale Value Items Per Sale Product Mix
Entry Points Drop-out Points
Frequency Click Path/Content Recent Time
Off-lineOn-Line
Search—SEO/SEMDisplaySocialContentVideoE-mail
Cost Per SaleMargin/Rev.Volume...
...
Off-lineTelevisionPrintRadioEvents/News
SeasonalityGeographyProduct

DIGITAL ANALYTICS: THE CULTURE OF INSIGHTS AND ACTIONS
23
One of the common refrains from people on the ‘front-line’ is that they
can’t control or have visibility into the disposition of the users.
Copywriters are often not aware of the impact of their efforts.
Assessments are limited to peers or managers telling them “I like
what you wrote.” And, people generally accept this as the assessment.
But, with a more structured approach to copywriting and a well
implemented analytics platform, copywriters can obtain great visibility
into the impact of their efforts.
By testing multiple styles, terms or phrases, copywriters can see what
prompts users to take that next step in the sales process. If we find that
people who spend more time engaged with content convert better
over time, applying time spent KPIs or exit rates versus given target
performance benchmarks will let copywriters know if their content
works.
The key point is that every person’s (Actor’s) contribution to the sale
can be measured in some way. Whether it is how they help move a
person along the conversion path, or determine the cross-sell, upsell
opportunities, every action should have an intended result and a way to
measure it.
DIGITAL ANALYTICS: THE CULTURE OF INSIGHTS AND ACTIONS
24
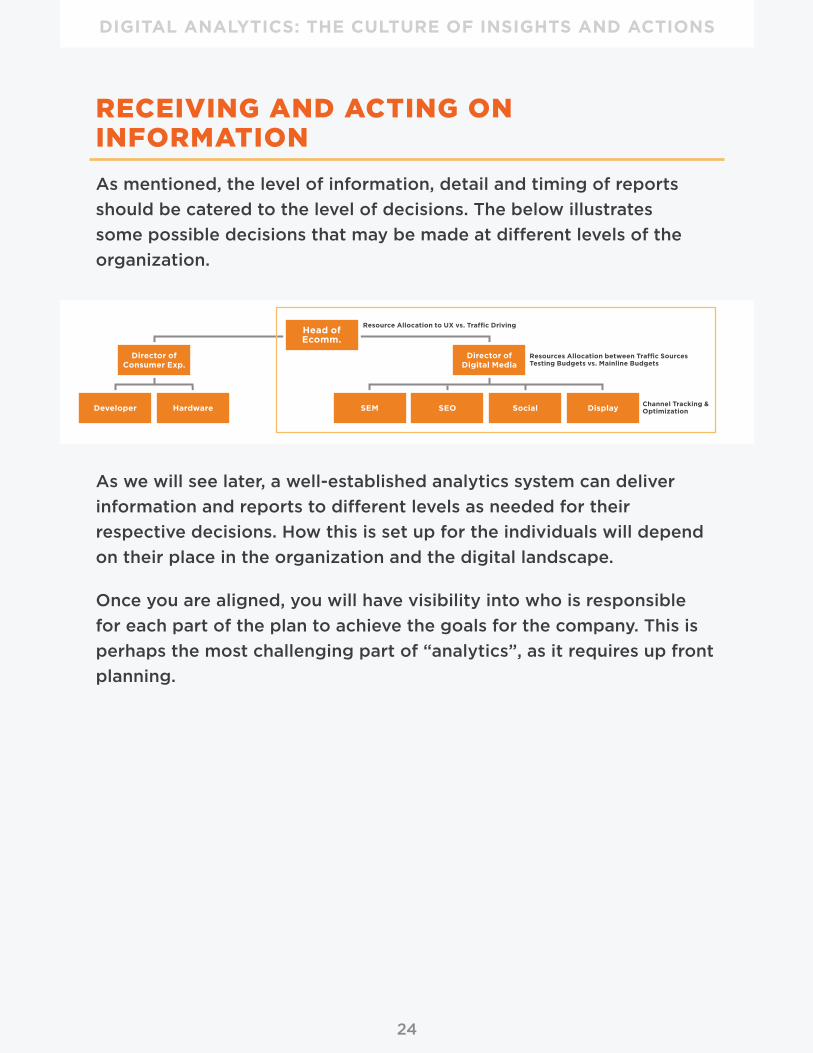
ReCeIVING aND aCTING ON INFORMaTION
As mentioned, the level of information, detail and timing of reports
should be catered to the level of decisions. The below illustrates
some possible decisions that may be made at different levels of the
organization.
Head of Ecomm.
DisplaySocialHardware SEMDeveloper SEO
Director of Digital Media
Director of Consumer Exp.
Channel Tracking & Optimization
Resources Allocation between Traffic SourcesTesting Budgets vs. Mainline Budgets
Resource Allocation to UX vs. Traffic Driving
As we will see later, a well-established analytics system can deliver
information and reports to different levels as needed for their
respective decisions. How this is set up for the individuals will depend
on their place in the organization and the digital landscape.
Once you are aligned, you will have visibility into who is responsible
for each part of the plan to achieve the goals for the company. This is
perhaps the most challenging part of “analytics”, as it requires up front
planning.
C h a p T e R 4
REPORTINGTHE INFORMATION YOU NEED,
WHEN YOU NEED IT
DIGITAL ANALYTICS: THE CULTURE OF INSIGHTS AND ACTIONS
26
Simply put, what are the questions you need to answer? Using this as a
starting point, you can identify the information you need. With this, you
have the ability to identify the Key Performance Indicators. Reporting
and the included information should be focused on answering
questions.
We will discuss a range of possible questions and ways that Analytics
can help answer them to provide seeds for consideration. While we
will cover reports and dashboards through Google Analytics, the focus
should be the concepts demonstrated. Once you know what you need
in order to answer your questions, creating the reports or dashboards
can be straight forward in Google Analytics or other platforms.
Following are some common areas where we find questions and the
corresponding settings for analytics.
GeOGRaphIC VIeW
Local lift
As we focus efforts geographically, we often drive people to our
website. The more television, radio, direct mail and so forth we use,
the more we expect to see the impact online. Perhaps searches for
locations, leads or user content contributions / uploads. This provides
an indication of our impact at the local level.
Setting target KPIs for store locator look ups, or inquiries by market
allows marketers to measure the impact of the off-line media on
specific actions. The key is to determine what the desired result is; foot
traffic, coupon downloads, local leads, etc. Set the target changes, and
the analytics reporting can easily show progress for the appropriate
KPI.

DIGITAL ANALYTICS: THE CULTURE OF INSIGHTS AND ACTIONS
27
Regional differences
On a broader stroke, we can see behavior differences by region, and
deliver experiences accordingly.
http://www.google.com/analytics/customers/pdfs/swissotel.pdf
Swissotel was able to identify nuances in user behavior in the UK,
Australia and the US by isolating traffic from regions and countries. In
Google Analytics, they used segmentation to separate the traffic and
review the behavior.
By identifying the different purchasing behaviors, Swissotel developed
landing pages with messaging geared toward the specific countries.
In the UK the average order value was twice that of Australia and
the US. What Swissotel also found was that the UK users spent much
more time reviewing the room information / photos and the amenities.
By making this content part of the landing pages, they were able to
increase the conversion rates of their highest value users.
Absent segmenting by Geography, all users would continue to be
treated the same way. Segmenting, in any number of ways, helps
isolate groups of traffic for deeper analysis allowing us to treat
segments differently and optimizing the experience.
DIGITAL ANALYTICS: THE CULTURE OF INSIGHTS AND ACTIONS
28
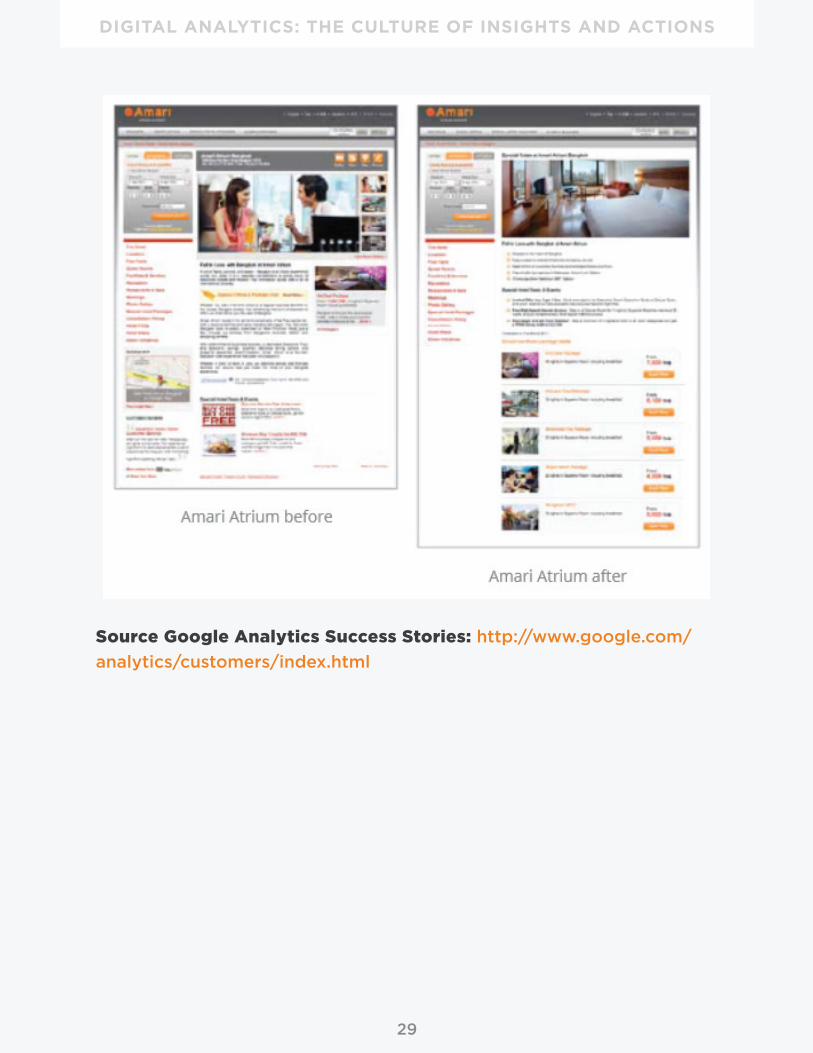
TIMe TO pURChaSe & paTh TO pURChaSe
How many days between the average buyer’s first visit and the
time the buyer actually purchased? How about how many visits it
takes? Knowing these data points can help identify ways to improve
conversions.
http://static.googleusercontent.com/external_content/untrusted_dlcp/
www.google.com/en/us/analytics/customers/pdfs/amari.pdf
The Amari hotel in Doha saw visitors making purchases on the same
day as the first visit. But, after taking a closer look, they also found that
there were multiple visits involved before the purchase was made.
Knowing this, Amari made two important changes. 1) They
implemented retargeting and 2) they changed the landing page to
provide better “decision” information for users. With this, they saw an
11% increase in conversions.
Time and path to purchase provide insight into possible issues and
opportunities with users to increase conversions.
DIGITAL ANALYTICS: THE CULTURE OF INSIGHTS AND ACTIONS
29
Source Google analytics Success Stories: http://www.google.com/
analytics/customers/index.html

DIGITAL ANALYTICS: THE CULTURE OF INSIGHTS AND ACTIONS
30
There are a lot of dimensions, or bits of information that are standard
parts of Google Analytics.
TRaFFIC SOURCeS CONTeNT CONVeRSIONS ReaL-TIMe
Overview Overview Goals Overview
Sources Behavior Flow Overview Locations
All Traffic Site Content Goal URLs Traffic Sources
Direct All PagesReverse Goal
PathContent
ReferralsContent
DrilldownFunnel
VisualizationEvents
Search Landing Pages Goal Flow Conversions
Campaigns Exit Pages Ecommerce Overview
Search Engine Optimization
Site Speed Overview Locations
Queries OverviewProduct
PerformanceTraffic Sources
Landing Pages Page TimingsSales
PerformanceContent
Geographical Summary
User Timings Transactions Events
SocialSpeed
SuggestionsTime to
PurchaseConversions
Overview Site SearchMulti-Channel
Funnels
Network Referrals
Overview Overview
DIGITAL ANALYTICS: THE CULTURE OF INSIGHTS AND ACTIONS
31
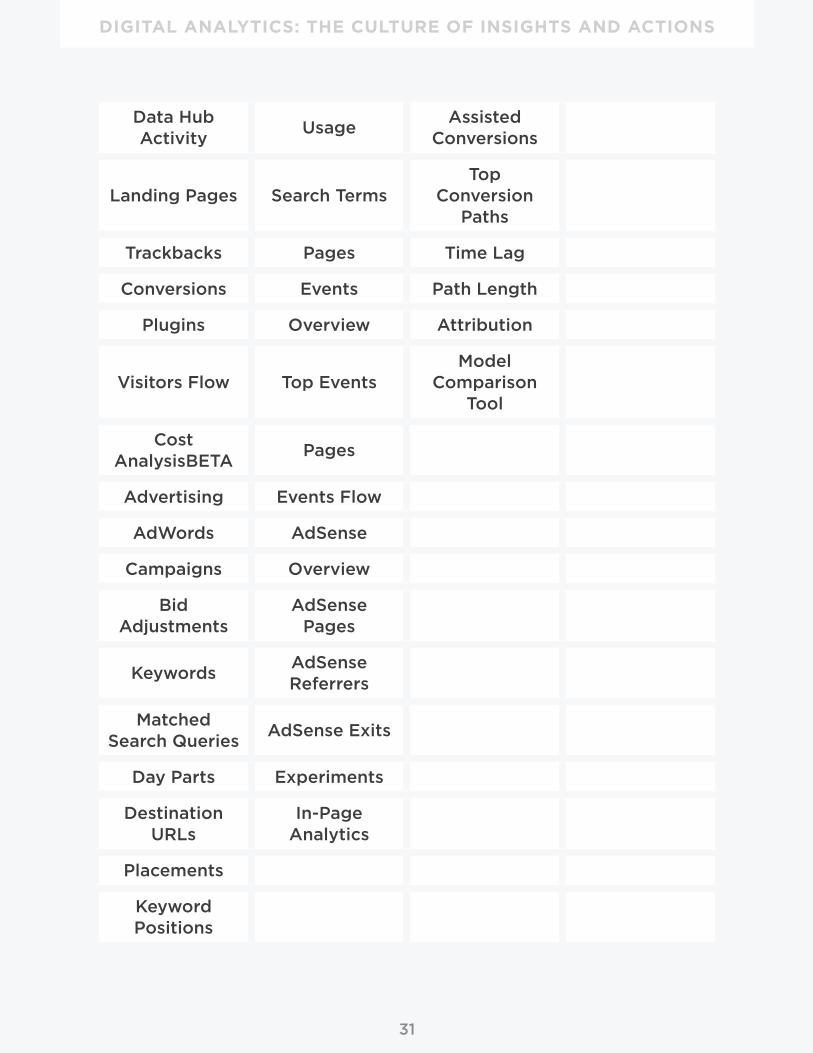
Data Hub Activity
UsageAssisted
Conversions
Landing Pages Search TermsTop
Conversion Paths
Trackbacks Pages Time Lag
Conversions Events Path Length
Plugins Overview Attribution
Visitors Flow Top EventsModel
Comparison Tool
Cost AnalysisBETA
Pages
Advertising Events Flow
AdWords AdSense
Campaigns Overview
Bid Adjustments
AdSense Pages
KeywordsAdSense Referrers
Matched Search Queries
AdSense Exits
Day Parts Experiments
Destination URLs
In-Page Analytics
Placements
Keyword Positions

DIGITAL ANALYTICS: THE CULTURE OF INSIGHTS AND ACTIONS
32
In addition to the standard dimensions, we can set up custom
dimensions for a website. This allows for a great deal of flexibility in
the level and content of tracking. Custom dimensions replace custom
variables (still available in the old version) in the new version, Google’s
Universal Analytics.
CUSTOM VaRIaBLeS / DIMeNSIONS
There are some aspects of user behavior or content that may be unique
to your website. The ability to set Custom Dimensions allows us to
track the users interactions related to this unique content.
Key to setting up custom dimensions is the ability to act on the data.
Consider how you might treat the segment identified in the Custom
Variables / Dimension differently than the rest, or how understanding
their different behavior can help inform your decisions, set targets, etc.
One of the most often used custom dimensions is to identify those
users who are purchasers, or members. One of the ways to increase
sales or conversion is to pattern the behavior of current customers and
adjust the content that is presented.
Within Google Analytics, you can set the scope of the variable. The
scope is defined as the amount of time that a user remains identified
as fitting into the custom dimension. These can be set at the user level,
meaning that they are identified as part of that group each time the
user visits the site. There is also a session scope that only holds during
the time the visitor is on the site, and will be erased once the user
leaves the site, or the session times out.
You can track particular types / categories of content consumption and
see if there is a connection to purchase or conversions. As users view
certain content on the web site, or come to the site through tagged
links, the customer dimension or variable can be set to identify them

DIGITAL ANALYTICS: THE CULTURE OF INSIGHTS AND ACTIONS
33
as such. Then during that visit, or subsequent visits depending on the
scope, we can see the propensity to purchase.
How engaged are your members or purchasers? By setting custom
dimensions, you can see what content they view on your site during
visits even if they are not logged in. This will provide the ability to
enhance their user experience and aid in increasing the life time value.
Do high value or frequent purchasers behave differently? Are there
other patterns to their behavior that we can leverage? By applying
the custom variables or dimensions we can identify opportunities.
But, these can be applied in other ways. Based on the nature of the
business and the data available, users can be identified in any number
of ways. Content consumption, traffic sources, purchase types,
whatever variable you can track or add from database sources during
the user visit can be used to understand, track and optimize the user
experience.
TRaCKING eVeNTS
On each website users take actions that can be tracked; things like
sliders, image rotators, same-page form submits, item selections (or
de-selections) can be tracked to provide us with information on how
users are interacting with the websites
The fact is website real estate is valuable. We create features that we
believe will be useful, but unless we track the interactions with the
features, we do not know.
Product sliders are a common feature on many e-commerce web site.
But, how many items do users ‘slide’ through as they shop. Is 5, 10,15
or more the right amount? You can tell by tracking the number of item
views, or number of times the users click on the sliders. Knowing how
users interact with the elements on the site informs us on how to make
the elements more useful.

DIGITAL ANALYTICS: THE CULTURE OF INSIGHTS AND ACTIONS
34
You have social media links on your site. How often do users click on
these. Absent some type of event tracking, you won’t know. Same for
document downloads / pdfs, or click on email links. All these elements
that are placed on a site should be tracked to understand their value or
utility to the users.
CONVeRSION FUNNeLS
Every analytics package worth a darn allows us to set up a conversion
funnel. This is the series of steps a user takes in order to convert. The
number and nature of steps is up to the marketer, but there are a few
ways these funnels can be set up, and they are NOT mutually exclusive;
you can have concurrent funnels.
The conversion funnel provides steps that users can reach and allows
us to see how many people progressed from one step to another. You
can see exit or drop off points, and if set up properly the entry points
along the funnel.
The shopping cart.
Each ‘proceed’ button / page should be marketed as a step in the
conversion funnel. With this visibility, we can see what parts of our cart
are causing drop offs. This can also be applied to form fields within the
pages, depending on the tracking package and setup.
Product navigation
Moving from the search to the category page to the detail page are
key milestones in a funnel. Properly set up, along with event tracking
(mentioned earlier), we can understand what parts of the shopping
experience are valuable and which cause the shoppers to drop off.
The key to a funnel is establishing an expected user path and
measuring the progress along it. You can segment the path, as
suggested above with a shopping cart funnel and a product navigation
funnel, or you can create an over arching funnel that overlaps the two.

DIGITAL ANALYTICS: THE CULTURE OF INSIGHTS AND ACTIONS
35
But, there are other conversions as well, such as member registrations,
downloads or inquiry submits. By identifying the key user actions, you
can create funnels that allow you or measure and optimize progress to
the goals.

C h a p T e R 5
GETTING GOING

DIGITAL ANALYTICS: THE CULTURE OF INSIGHTS AND ACTIONS
37
We’ve covered a lot, and admittedly this is not nearly exhaustive. But
you’ve gained enough to have an impact. Now it is time to turn the
information you’ve acquired into action.
Begin with the end in mind.
Take some time to articulate what the desired state is for you and your
organization. As Seneca said, “No wind is favorable if you do not know
to which port you sail.” So, consider how you want your day to look if
you have a good reporting and analytics framework. Start with simple
statements.
“When I come in each morning, I see the prior day’s performance and week-to-date performance for the 5 KPIs on
which I can take action.”
“My colleagues and I share the same definitions and views of company KPIs.”
“I have visibility into my colleagues KPIs if I want it.”
Your business is unique, so consider the Actionable information you
need and how best to receive it. Consider your interactions with
colleagues, clients and suppliers. What will help you communicate
better, make better decisions and take timely actions?
Now, “sketch out” the reports you will need to achieve your vision.
Your first pass is simply content. Determine KPIs should you see to
take action (or not) for the day, week or month. Then consider how
you best consume information to determine the format. We all absorb
information differently. Some are better with graphs while others are
looking for tables of information. Work with others in the organization
to determine the common framework for the reports. Timing, content
and display are key to effectively absorbing your KPIs so don’t rush
past this part of the process.

DIGITAL ANALYTICS: THE CULTURE OF INSIGHTS AND ACTIONS
38
COVeRING The Gap
Unless you are very fortunate, the vision you just outline and your
current state of affairs are probably far apart. That’s okay, it’s why
you’ve read this book. Bridging the gap between current and desired
state will take time and effort, but it is worth doing.
Unfortunately there is not a one size fits all solution to implementing
the vision. However, based on experience, there are some steps you can
take to make the process less frustrating and perhaps more valuable.
1) Focus first on your sphere of control. Create processes
and reports that mimic what you ultimately want. While the
company is going through the broader project, you have a
chance to “live with” the reports prior to the final version
being rendered. Take this time to make in-stride adjustments.
2) Work the broader plan in stages. Even unformatted, data
can be useful. As the process of putting together the final
vision proceeds, data will be gathered. Used spreadsheets or
tabular reports to view the data and see if it is providing the
foundation for your reports that you envisioned.
3) Keep regular tabs on your co workers who are involved
in the process. Depending on the tools you’re using or the
amount of data that needs to be gathered and processed,
you may see weeks or months before there is tangible output
for everyone. During this period, people’s enthusiasm slides.
Keep them engaged through the process to mitigate this
tendency.
I have been involved in million dollar data, analytics and reporting
projects that span more than a year as well as those that were relatively
simple changes to current data sets and reports. If you find yourself
in a very long project, create short, mid and long term plans for the
organization. This is key to keeping momentum going.

DIGITAL ANALYTICS: THE CULTURE OF INSIGHTS AND ACTIONS
39
The short and mid term plans are designed to provide truly actionable
reports (or data) that people use in their daily activity as the project
moves forward to the final vision. The key is that the short and
mid term outputs should be in stride with the long term plan, not
a divergence from it. It may be as simple as data being sent out in
spreadsheets, and people use their own pivot tables to summarize, or
sort and filter. This is intended to enact 25% or 50% of the project’s
usefulness as you move toward 100%. Doing this keeps people
engaged and shows value to senior management, who don’t want to
wait all the way to the end to see some return on the investments.
FINaL ThOUGhTS
You’re experiencing issues with your analytics and reporting, that’s why
you’ve read this book. Keep in mind that there are degrees of solutions
out there. Using a web analytics package, a CRM or a marketing
automation tool provides you with some pretty quick access to the
information and insights. So don’t wait for the organization to finally
“get it” and implement the project. Take control of your sphere of
influence, develop some of these reports for yourself and become a
microcosm of the solution you want the company to adopt. You’ll make
your life easier and may motivate the rest of the company to follow
suit.