digital ad spending benchmarks by industry the complete e-marketer series for 2015
TRANSCRIPT
MAY 2015
EXECUTIVE SUMMARY
DIGITAL AD SPENDING BENCHMARKS BY INDUSTRY: THE COMPLETE EMARKETER SERIES FOR 2015
DIGITAL AD SPENDING BENCHMARKS BY INDUSTRY: THE COMPLETE EMARKETER SERIES FOR 2015 ©2015 EMARKETER INC. ALL RIGHTS RESERVED 2
INTRODUCTION
US industries will collectively spend more than $58 billion on paid digital advertising in 2015, the sixth consecutive
year of robust growth. Spending increases in all sectors are being propelled by continued economic improvement
and technological advances that can deliver campaigns in more efficient and personalized ways. In 2015, mobile,
digital video and programmatic buying are the brightest stars in the digital advertising lineup.
While digital ad spend growth remains the story for all industries, it is not “one size fits all.” Nuances among sectors reflect a variety of trends and approaches unique to the ways each industry approaches its market, targets consumers and closes sales. This report series offers a deep dive into spending in each industry covered by eMarketer: automotive, computing products and consumer electronics, consumer packaged goods (CPG) and consumer products, entertainment, financial services, healthcare and pharmaceuticals, media, retail, telecom and travel. In addition to providing a comprehensive overview of total digital ad spending, the series also includes industry-specific data about ad spending channels and formats, marketing objectives and the use of automation and targeting.
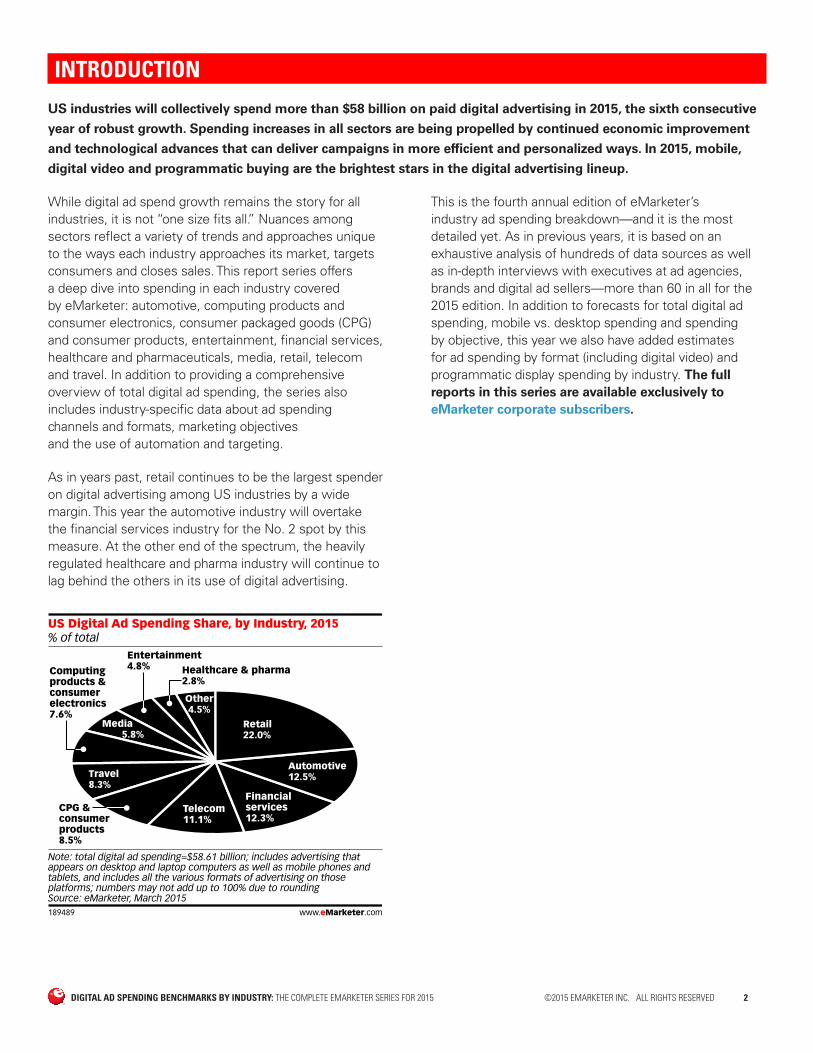
As in years past, retail continues to be the largest spender on digital advertising among US industries by a wide margin. This year the automotive industry will overtake the financial services industry for the No. 2 spot by this measure. At the other end of the spectrum, the heavily regulated healthcare and pharma industry will continue to lag behind the others in its use of digital advertising.
% of totalUS Digital Ad Spending Share, by Industry, 2015
Retail22.0%
Automotive12.5%
Financial services12.3%
Telecom11.1%
CPG & consumer products8.5%
Travel8.3%
Computing products & consumer electronics7.6%
Media 5.8%
Entertainment4.8% Healthcare & pharma
2.8%
Other4.5%
Note: total digital ad spending=$58.61 billion; includes advertising that appears on desktop and laptop computers as well as mobile phones and tablets, and includes all the various formats of advertising on those platforms; numbers may not add up to 100% due to roundingSource: eMarketer, March 2015189489 www.eMarketer.com
This is the fourth annual edition of eMarketer’s industry ad spending breakdown—and it is the most detailed yet. As in previous years, it is based on an exhaustive analysis of hundreds of data sources as well as in-depth interviews with executives at ad agencies, brands and digital ad sellers—more than 60 in all for the 2015 edition. In addition to forecasts for total digital ad spending, mobile vs. desktop spending and spending by objective, this year we also have added estimates for ad spending by format (including digital video) and programmatic display spending by industry. The full reports in this series are available exclusively to eMarketer corporate subscribers.
DIGITAL AD SPENDING BENCHMARKS BY INDUSTRY: THE COMPLETE EMARKETER SERIES FOR 2015 ©2015 EMARKETER INC. ALL RIGHTS RESERVED 3
INDUSTRY-BY-INDUSTRY MOBILE BREAKOUTS For the second year in a row, eMarketer’s digital ad spending reports feature industry-by-industry breakouts of mobile vs. desktop spending. We forecast particularly robust growth in mobile investment this year, with some sectors devoting more than half of their digital spending to the channel.
billions and % of totalUS Digital Ad Spending, by Industry and Device, 2015
Retail
Automotive
Financial services
Telecom
CPG & consumer products
Travel
Computing products & consumer electronics
Media
Entertainment
Healthcare & pharma
Other
Total
Desktop/laptop
$6.26
$3.87
$3.70
$3.21
$2.63
$2.47
$2.35
$1.66
$1.30
$0.98
$1.44
$29.89
% oftotal
48.5%
53.0%
51.5%
49.5%
53.0%
51.0%
53.0%
49.0%
46.5%
60.0%
54.6%
51.0%
Mobile*
$6.65
$3.43
$3.49
$3.27
$2.33
$2.38
$2.09
$1.73
$1.50
$0.66
$1.20
$28.72
% oftotal
51.5%
47.0%
48.5%
50.5%
47.0%
49.0%
47.0%
51.0%
53.5%
40.0%
45.4%
49.0%
Total
$12.91
$7.30
$7.19
$6.49
$4.97
$4.85
$4.44
$3.39
$2.80
$1.64
$2.64
$58.61
Note: digital ad spending includes advertising that appears on desktop andlaptop computers as well as mobile phones and tablets, and includes allthe various formats of advertising on those platforms; numbers may notadd up to total due to rounding; *includes classified, display (banners andother, rich media and video), email, lead generation, messaging-based andsearch advertising; ad spending on tablets is includedSource: eMarketer, May 2015188660 www.eMarketer.com
Increased mobile ad investment reflects evolving consumer behavior. eMarketer estimates that 59% of the US population will regularly use a smartphone this year, 49% will use a tablet and more than one-third will use both devices. As a result, the average US consumer now expects every digital experience—media consumption, shopping, social networking, communication and advertising—to move as seamlessly across devices as they do themselves.
Though mobile is a universal growth driver for digital ad spending, important differences among industries do exist. Entertainment has become the most aggressive mobile spender, committing the largest share of total digital dollars and using those dollars to drive game and app downloads and make digital content more discoverable. Retail is also a strong mobile spender, tapping the channel to help consumers compare prices, find product specs and drive prospective buyers to retail locations and ecommerce websites.
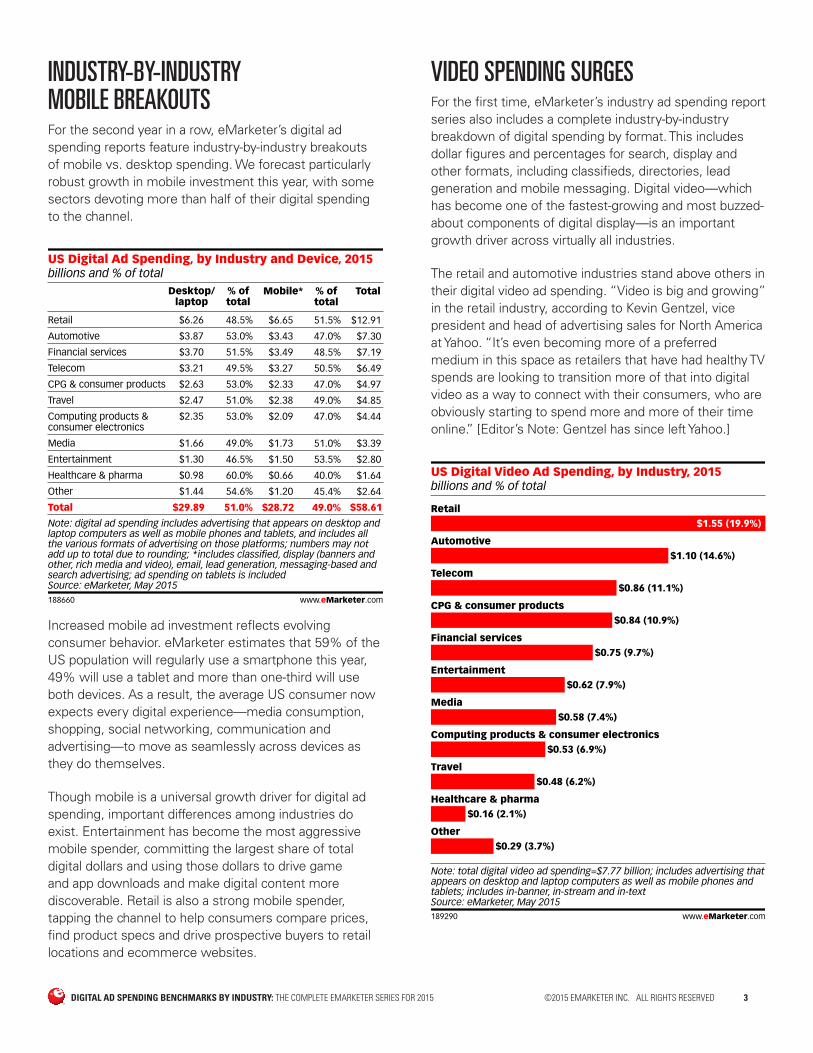
VIDEO SPENDING SURGES For the first time, eMarketer’s industry ad spending report series also includes a complete industry-by-industry breakdown of digital spending by format. This includes dollar figures and percentages for search, display and other formats, including classifieds, directories, lead generation and mobile messaging. Digital video—which has become one of the fastest-growing and most buzzed-about components of digital display—is an important growth driver across virtually all industries.
The retail and automotive industries stand above others in their digital video ad spending. “Video is big and growing” in the retail industry, according to Kevin Gentzel, vice president and head of advertising sales for North America at Yahoo. “It’s even becoming more of a preferred medium in this space as retailers that have had healthy TV spends are looking to transition more of that into digital video as a way to connect with their consumers, who are obviously starting to spend more and more of their time online.” [Editor’s Note: Gentzel has since left Yahoo.]
billions and % of totalUS Digital Video Ad Spending, by Industry, 2015
Retail$1.55 (19.9%)
Automotive$1.10 (14.6%)
Telecom$0.86 (11.1%)
CPG & consumer products$0.84 (10.9%)
Financial services$0.75 (9.7%)
Entertainment$0.62 (7.9%)
Media$0.58 (7.4%)
Computing products & consumer electronics$0.53 (6.9%)
Travel$0.48 (6.2%)
Healthcare & pharma$0.16 (2.1%)
Other$0.29 (3.7%)
Note: total digital video ad spending=$7.77 billion; includes advertising thatappears on desktop and laptop computers as well as mobile phones andtablets; includes in-banner, in-stream and in-textSource: eMarketer, May 2015189290 www.eMarketer.com
DIGITAL AD SPENDING BENCHMARKS BY INDUSTRY: THE COMPLETE EMARKETER SERIES FOR 2015 ©2015 EMARKETER INC. ALL RIGHTS RESERVED 4
BRANDING VS. DIRECT RESPONSE For the third consecutive year, eMarketer’s ad spending by industry series includes forecasts for advertising by objective—direct response vs. branding. eMarketer bases its definitions of branding and direct response on a marketer’s primary advertising objective rather than the specific way the advertising is priced, measured or formatted.
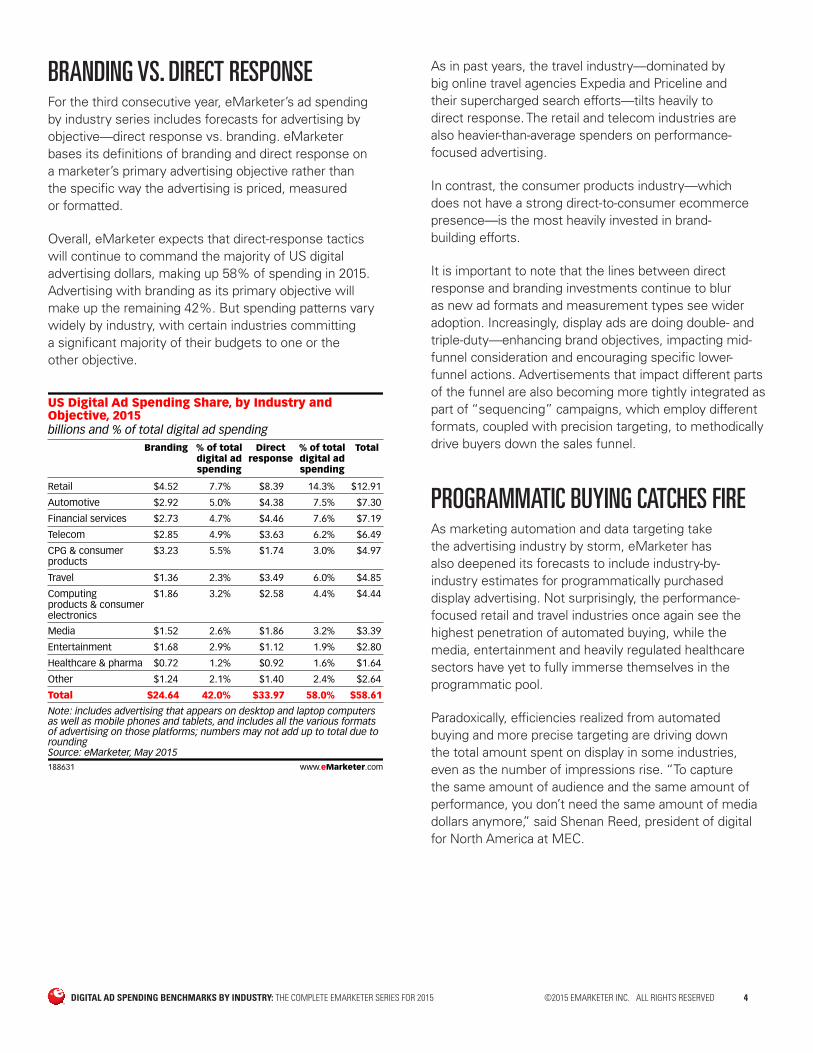
Overall, eMarketer expects that direct-response tactics will continue to command the majority of US digital advertising dollars, making up 58% of spending in 2015. Advertising with branding as its primary objective will make up the remaining 42%. But spending patterns vary widely by industry, with certain industries committing a significant majority of their budgets to one or the other objective.
billions and % of total digital ad spending
US Digital Ad Spending Share, by Industry andObjective, 2015
Retail
Automotive
Financial services
Telecom
CPG & consumer products
Travel
Computing products & consumerelectronics
Media
Entertainment
Healthcare & pharma
Other
Total
Branding
$4.52
$2.92
$2.73
$2.85
$3.23
$1.36
$1.86
$1.52
$1.68
$0.72
$1.24
$24.64
% of totaldigital adspending
7.7%
5.0%
4.7%
4.9%
5.5%
2.3%
3.2%
2.6%
2.9%
1.2%
2.1%
42.0%
Directresponse
$8.39
$4.38
$4.46
$3.63
$1.74
$3.49
$2.58
$1.86
$1.12
$0.92
$1.40
$33.97
% of totaldigital adspending
14.3%
7.5%
7.6%
6.2%
3.0%
6.0%
4.4%
3.2%
1.9%
1.6%
2.4%
58.0%
Total
$12.91
$7.30
$7.19
$6.49
$4.97
$4.85
$4.44
$3.39
$2.80
$1.64
$2.64
$58.61
Note: includes advertising that appears on desktop and laptop computersas well as mobile phones and tablets, and includes all the various formatsof advertising on those platforms; numbers may not add up to total due toroundingSource: eMarketer, May 2015188631 www.eMarketer.com
As in past years, the travel industry—dominated by big online travel agencies Expedia and Priceline and their supercharged search efforts—tilts heavily to direct response. The retail and telecom industries are also heavier-than-average spenders on performance-focused advertising.
In contrast, the consumer products industry—which does not have a strong direct-to-consumer ecommerce presence—is the most heavily invested in brand-building efforts.
It is important to note that the lines between direct response and branding investments continue to blur as new ad formats and measurement types see wider adoption. Increasingly, display ads are doing double- and triple-duty—enhancing brand objectives, impacting mid-funnel consideration and encouraging specific lower-funnel actions. Advertisements that impact different parts of the funnel are also becoming more tightly integrated as part of “sequencing” campaigns, which employ different formats, coupled with precision targeting, to methodically drive buyers down the sales funnel.
PROGRAMMATIC BUYING CATCHES FIRE As marketing automation and data targeting take the advertising industry by storm, eMarketer has also deepened its forecasts to include industry-by-industry estimates for programmatically purchased display advertising. Not surprisingly, the performance-focused retail and travel industries once again see the highest penetration of automated buying, while the media, entertainment and heavily regulated healthcare sectors have yet to fully immerse themselves in the programmatic pool.
Paradoxically, efficiencies realized from automated buying and more precise targeting are driving down the total amount spent on display in some industries, even as the number of impressions rise. “To capture the same amount of audience and the same amount of performance, you don’t need the same amount of media dollars anymore,” said Shenan Reed, president of digital for North America at MEC.
DIGITAL AD SPENDING BENCHMARKS BY INDUSTRY: THE COMPLETE EMARKETER SERIES FOR 2015 ©2015 EMARKETER INC. ALL RIGHTS RESERVED 5
AUTOMOTIVE DIGITAL AD SPENDING TRENDS The automotive industry will climb to second place, behind retail, when it comes to US digital ad spending by industry in 2015. A host of new product launches and the strongest sales market since before the 2008–2009 recession will fuel the industry’s spending increases.
Most growth in the sector is being driven by spending on mobile formats, with investment shifting in response to the evolving ways consumers research and shop for vehicles. While big-budget TV campaigns remain a staple for upper funnel brand awareness objectives, auto marketers are increasingly focused on using digital media to bolster mid-funnel consideration and to reach buyers post-sale in order to reinforce ownership-lifecycle messaging.
Savvy digital automakers will also use their solid understanding of digital media to improve audience targeting and drive traffic to dealers. Dealers and dealer associations continue to spend heavily on direct response-focused campaigns and programmatic executions to close sales.
Connected cars and mobile apps integrated with vehicles will provide future opportunities for advertising and customer outreach to vehicle owners.
The complete report, “The US Automotive Industry 2015: Digital Ad Spending Forecast and Trends,” addresses the following questions:
■ In which areas will US automakers and dealers increase digital ad spending?
■ How large a portion of this spending will go to video and mobile, and how much will be deployed programmatically?
■ How are the changing media habits of millennials and the rise of social media likely to affect ad spending now and in the future?
TABLE OF CONTENTS Market Overview: Auto Industry Ad Spending
Forecast
How Automotive Ad Spending Compares to Other Verticals
(Moderately) Bullish on Digital
The Direct Response/Branding Split
Mobile Spending Estimates and Trends
Digital Ad Spending by Format
DIGITAL AD SPENDING BENCHMARKS BY INDUSTRY: THE COMPLETE EMARKETER SERIES FOR 2015 ©2015 EMARKETER INC. ALL RIGHTS RESERVED 6
The complete report, “The US CPG and Consumer Products Industry 2015: Digital Ad Spending Forecast and Trends,” addresses the following questions:
■ How much will CPG and consumer products marketers spend on US paid digital advertising between 2014 and 2018?
■ How much of their digital budgets are CPG and consumer products companies spending on direct response vs. branding initiatives?
■ In what areas of digital marketing are US CPG and consumer products marketers increasing their budgets compared to past years? In what areas will they be spending less?
■ In what ways will CPG brands use mobile to target consumers?
TABLE OF CONTENTS CPG Shifts Digital into High Gear
Branding Still the Main Message
Programmatic: Problematic?
Brands Follow Consumers to Mobile
CONSUMER PRODUCTS DIGITAL AD SPENDING TRENDS CPG marketers are increasing their digital ad spending at double-digit growth rates, even as they cut overall advertising budgets. Traditional media buys are being shelved in favor of digital strategies that offer better targeting and return on investment (ROI). In fact, digital ad spending by CPG marketers is projected to have one of the highest compound annual growth rates among industries. Only the automotive, media and entertainment sectors will see higher growth through 2019.
CPG’s share of spending on mobile continues to be lower than in some other industries. But within the category itself, mobile spending is rapidly increasing. Advertisers are getting more mileage from mobile coupons, video and geotargeting, among other initiatives, to reach consumers at critical stages of the purchase path.
Branding campaigns will continue to make up the majority of industry digital ad spending in 2015. Ecommerce efforts are still nascent, although CPG brands are doing a much better job of using mobile tactics to find and connect with consumers in retail locations. “The challenge for CPGs is they don’t control the retail channel, so they don’t have a lot of insight into direct response,” said MEC’s Reed. “Putting dollars against [direct response] becomes a challenge, because we can’t necessarily prove ROI. And there’s a lot of market competition in the CPG category.”
Data is another big story for CPG, and it is driving the industry toward increased programmatic buying. For CPG brands, which have been able to amass client data from third-party sources such as retailers and loyalty programs, the challenge will be to corral that data and make it useful.
DIGITAL AD SPENDING BENCHMARKS BY INDUSTRY: THE COMPLETE EMARKETER SERIES FOR 2015 ©2015 EMARKETER INC. ALL RIGHTS RESERVED 7
The complete report, “The US Financial Services Industry 2015: Digital Ad Spending Forecast and Trends,” addresses the following questions:
■ How much will financial services marketers spend on paid digital advertising in the next five years?
■ How does spending break down by marketing objective and format?
■ What percentage of digital display advertising will financial marketers buy programmatically in 2015?
■ What digital advertising trends are notable for the industry for 2015 and beyond?
TABLE OF CONTENTS Digital Ad Spending Forecast
Mobile: Close to Half of All Digital Ad Dollars
Digital Ad Spending by Format
Programmatic to Dominate Digital Display Buying
FINANCIAL SERVICES DIGITAL AD SPENDING TRENDS Long the second-place US business sector by digital ad spending, the financial services industry—including banks, insurers and brokerages—will be eclipsed by the automotive industry this year. But even as its digital ad investment growth slows, financial services will remain one of the top-spending industries in 2015.
Mobile advertising, which will make up nearly half of the industry’s total digital investment in 2015, will fuel spending increases. Advertisers are shifting more dollars to mobile devices to promote their mobile transaction platforms and to service customers across channels. Digital video will be another bright spot in the advertising mix and will help advertisers’ stories and engage audiences in more dynamic ways.
The industry remains consistent in its focus on performance objectives over branding goals when using digital advertising, evidenced by its heavy spending on search and its growing adoption of programmatic buying for display media. Programmatic fits well with financial services’ heritage of data-driven marketing, so it’s no surprise that the industry is keeping pace with the broader market shift in this direction.
DIGITAL AD SPENDING BENCHMARKS BY INDUSTRY: THE COMPLETE EMARKETER SERIES FOR 2015 ©2015 EMARKETER INC. ALL RIGHTS RESERVED 8
The complete report, “The US Healthcare and Pharma Industry 2015: Digital Ad Spending Forecast and Trends,” addresses the following questions:
■ How much will US healthcare and pharma marketers invest in paid online and mobile advertising in the next five years?
■ How much does the industry spend on search, display, video and other ad formats?
■ What percentage of digital ad spending is earmarked for direct response vs. branding objectives?
■ How much are advertisers investing in programmatic display advertising?
TABLE OF CONTENTS Market Overview
Mobile and the Multichannel Mandate
Search and Display Work Together
Tech and Data Use Face Challenges
HEALTHCARE AND PHARMACEUTICAL DIGITAL AD SPENDING TRENDS Digital ad spending by healthcare and pharma marketers continues to rise, but sustained and dramatic growth remains a challenge. Marketers are becoming smarter in their use of data and technology, as well as innovative advertising formats—including mobile, social media, programmatic buying and personalized audience targeting—but remain mindful of privacy and regulatory constraints.
Pharma manufacturers, once again in growth mode, are expected to boost multichannel direct-to-consumer (DTC) and healthcare-provider (HCP) focused spending for a number of blockbusters and breakthrough product launches. At the same time, they will use digital tactics to promote more specialized therapies and “orphan” drugs to smaller audiences. Growth will also come from health insurers as they continue consumer outreach in response to the Patient Protection and Affordable Care Act (ACA), and by hospital and healthcare professionals boosting local and mobile spending.
Healthcare and pharmaceutical marketers continue to lag other industries in both mobile spending and programmatic buying. On a percentage basis, the industry spends less on mobile and less on programmatic digital than others. Still, advertisers are exploring new uses of data and more creative unbranded sponsorships, while working toward delivering seamless, omnichannel experiences.
DIGITAL AD SPENDING BENCHMARKS BY INDUSTRY: THE COMPLETE EMARKETER SERIES FOR 2015 ©2015 EMARKETER INC. ALL RIGHTS RESERVED 9
The complete report, “The US Media and Entertainment Industries 2015: Digital Ad Spending Forecast and Trends,” addresses the following questions:
■ Why is digital ad spending in the US media and entertainment industries expected to grow faster than in other industries?
■ What is the mix between branding and direct-response advertising in media and entertainment?
■ How do social media, native formats and programmatic buying fit into the media and entertainment mix?
■ What trends are media and entertainment brands seeing that will change the way they spend their digital ad dollars?
TABLE OF CONTENTS Ad Spending Overview
Branding vs. Direct Response
Mobile’s Growing Presence
Digital Ad Spending by Format
Programmatic: Slow to Adopt
MEDIA AND ENTERTAINMENT DIGITAL AD SPENDING TRENDS In 2015, US digital ad spending by both the media and the entertainment industries will grow faster than in other verticals tracked by eMarketer. A key driver behind this increase will be heavy use of video and rich media ads—the two fastest-growing ad formats—by marketers of news media, movies, TV shows, games and music. These marketers will also make big bets on mobile ads, as consumers turn to their smartphones and tablets for their media and entertainment needs. Beginning in 2015, industry marketers will spend slightly more on mobile ads annually than on desktop ads.
Of the two industry groups, the entertainment industry is more focused on branding efforts such as movie previews and video game promotions. Media is more evenly split among direct response to drive subscriptions and branding for content and awareness. But as in other industries, the lines are blurring between branding and direct response as marketers become better able to track consumers through the sales funnel.
Digital advertising has taken on increased importance for media and entertainment companies trying to reach audiences that are fragmenting across devices and bombarded with information. These marketers are using tactics such as programmatic ad buying and screen-neutral campaigns to increase the efficiency of their efforts. They are also experimenting with native advertising and enhanced search formats.
“There is viewer fragmentation, device proliferation and cord-cutting. So reaching audiences with immediacy—to get people either tuning in or into theaters—is mission critical,” said Yahoo’s Gentzel.
DIGITAL AD SPENDING BENCHMARKS BY INDUSTRY: THE COMPLETE EMARKETER SERIES FOR 2015 ©2015 EMARKETER INC. ALL RIGHTS RESERVED 10
The complete report, “The US Retail Industry 2015: Digital Ad Spending Forecast and Trends,” addresses the following questions:
■ How much will retailers spend on US paid digital advertising in the next five years?
■ How are direct response vs. branding initiatives shifting?
■ Which mobile formats are most effective for retailers?
■ How is programmatic advertising changing the way the retail industry approaches advertising?
TABLE OF CONTENTS Retail Leads US Industry Ad Spending
Mobile Spending Surpasses Desktop
Digital Spending by Format
Programmatic Ads Now the Norm
RETAIL DIGITAL AD SPENDING TRENDS Retail will remain the leader among US industries when it comes to digital ad spending between 2015 and 2019, with investment growing throughout, but at a slowing pace.
2015 will mark the first year that retailers earmark more than half of their digital advertising spending to mobile. Smartphone and tablet usage continues to surge, and mcommerce is growing along with it. As consumers turn to multiple screens for research and buying, retailers are increasing efforts to reach them across channels and throughout the purchase process.
Unsurprisingly, digital ad budgets for this industry are skewed toward direct-response efforts, with a strong focus on closing sales. But the proliferation of programmatic ad buying—and the associated efficiencies of automation—are expected free up cash for more brand-oriented initiatives. Search and display will remain as important as ever, but video, mobile and social ad spending will drive growth.
DIGITAL AD SPENDING BENCHMARKS BY INDUSTRY: THE COMPLETE EMARKETER SERIES FOR 2015 ©2015 EMARKETER INC. ALL RIGHTS RESERVED 11
The complete report, “The US Telecom and Computing Products and Consumer Electronics Industries 2015: Digital Ad Spending Forecast and Trends,” addresses the following questions:
■ How much will computing products and consumer electronics companies spend on US paid digital advertising over the next five years?
■ How much of industry digital advertising budgets are being spent on direct response vs. branding efforts?
■ How are mobile platforms changing the way ad dollars are being spent in the sector?
TABLE OF CONTENTS Digital Ad Investments Increase
Mobile Device Marketers Lead the Way
B2B Ad Spending: A Mixed Bag
Digital Gains a Larger Role in the Marketing Mix
Direct Response vs. Branding
TELECOM, COMPUTING PRODUCTS AND CONSUMER ELECTRONICS DIGITAL AD SPENDING TRENDSDigital ad spending in the telecom, computing and consumer electronics industries will increase modestly through 2019, powered by mobile, digital video and native formats—particularly in-stream and in-feed advertising delivered on mobile devices. Although each of these highly competitive industries has its own digital ad spending forecast, their symbiotic nature lends itself to coverage in one report.
As in other industries, ad campaigns are increasingly targeted to individuals, across a range of media, channels and screens. The continued shift among consumers to web-enabled devices is driving increases in targeted mobile advertising. In turn, telecoms are using mobile tactics to compete for customers, encourage loyalty and prevent churn. Mobile is also aiding electronics marketers in their efforts to differentiate themselves and their products from competitors.
Though both industries currently skew toward direct-response efforts, fierce competition among both telecoms and consumer electronics manufacturers—particularly smartphone manufacturers—has resulted in both verticals increasing branding spending as they compete for customers. These efforts have been further aided by an early shift to programmatic ad buying.
A device category still in its infancy but with long-term prospects, wearables will likely result in increased computer and consumer electronics industry ad spending. In addition, the much-touted internet of things is also likely to result in a slew of web-enabled consumer electronics product categories that will require additional marketing efforts.
DIGITAL AD SPENDING BENCHMARKS BY INDUSTRY: THE COMPLETE EMARKETER SERIES FOR 2015 ©2015 EMARKETER INC. ALL RIGHTS RESERVED 12
The complete report, “The US Travel Industry 2015: Digital Ad Spending Forecast and Trends,” addresses the following questions:
■ How much will US travel advertisers spend on digital advertising in the next five years?
■ To what extent are travel industry digital budgets dedicated to direct response vs. branding, mobile vs. nonmobile, and other tactics?
■ How are digital ad formats, industry spending and creative development evolving thanks to programmatic buying?
TABLE OF CONTENTS Digital Ad Spending Forecast
Mobile Ad Spending Nears 50%
Digital Travel Spending by Format
Programmatic Spending Grows
Next Steps: Dynamic Creative and Better Personalization
TRAVEL DIGITAL AD SPENDING TRENDS An uptick in digital ad spending by the US travel industry reflects a healthy US economic climate and an increasingly competitive marketing landscape. Online travel agencies—including market leaders Priceline.com and Expedia—dominate digital ad spending in a field that also includes hotels, airlines, cruise lines, rental car companies, destination-marketing organizations and tour operators.
The travel industry’s intense focus on driving digital purchases means that category spending overwhelmingly focuses on direct-response objectives rather than branding. Nearly three-fourths of the industry’s digital dollars in 2015 will be aimed at direct-response objectives—a greater proportion than for any other industry—and skewed heavily toward search.
Mobile advertising is also an increasingly critical investment for travel industry marketers. Rising ownership and use of smart mobile devices is pushing mobile ad spending ever higher, amounting to just under half of all travel industry outlays in 2015. Meanwhile, the growing migration to data-driven programmatic ad buying techniques is revolutionizing industry investment in digital display, making it much more efficient.
Coverage of a Digital WorldeMarketer data and insights address how consumers spend time and money, and what marketers are doing to reach them in today’s digital world. Get a deeper look at eMarketer coverage, including our reports, benchmarks and forecasts, and charts.
eMarketer Corporate Subscriptions: The Fastest Path to InsightAll eMarketer research is available to our clients via an annual corporate subscription. The subscription provides clients with access to all eMarketer analyst reports, signature charts, interviews, case studies, webinars and more. See for yourself how easy it is to find the intelligence you need. Learn more about subscription options.
Confidence in the NumbersOur unique approach of analyzing data from multiple research sources provides our customers with the most definitive answers available about the marketplace. Learn why.
Schedule a personalized demonstration or request a quote today.
Go to eMarketer.com, call 800-405-0844, or email [email protected].
The leading research firm for marketing in a digital world.