digital commons - university of rhode island research
TRANSCRIPT

University of Rhode Island University of Rhode Island
DigitalCommons@URI DigitalCommons@URI
Open Access Dissertations
2018
VALUE CHAIN IMPROVEMENTS IN SMALL-SCALE FISHERIES: VALUE CHAIN IMPROVEMENTS IN SMALL-SCALE FISHERIES:
CASE STUDIES FROM WEST AFRICA CASE STUDIES FROM WEST AFRICA
Kristine Beran University of Rhode Island, [email protected]
Follow this and additional works at: https://digitalcommons.uri.edu/oa_diss
Recommended Citation Recommended Citation Beran, Kristine, "VALUE CHAIN IMPROVEMENTS IN SMALL-SCALE FISHERIES: CASE STUDIES FROM WEST AFRICA" (2018). Open Access Dissertations. Paper 785. https://digitalcommons.uri.edu/oa_diss/785
This Dissertation is brought to you for free and open access by DigitalCommons@URI. It has been accepted for inclusion in Open Access Dissertations by an authorized administrator of DigitalCommons@URI. For more information, please contact [email protected].

VALUE CHAIN IMPROVEMENTS IN SMALL-SCALE
FISHERIES: CASE STUDIES FROM WEST AFRICA
BY
KRISTINE BERAN
A DISSERTATION SUBMITTED IN PARTIAL FULFILLMENT OF THE
REQUIREMENTS FOR THE DEGREE OF
DOCTOR OF PHILOSOPHY
IN
MARINE AFFAIRS
UNIVERSITY OF RHODE ISLAND
2018

DOCTOR OF PHILOSOPHY DISSERTATION
OF
KRISTINE BERAN
APPROVED:
Major Professor Richard Burroughs
Elin C. Torell
Brian R. Crawford
Hiro Uchida
Nasser H. Zawia
DEAN OF THE GRADUATE SCHOOL
UNIVERSITY OF RHODE ISLAND
2018

ABSTRACT
Seafood is one of the most traded food commodities in the world by value. Small-
scale fisheries contribute significantly to the global production and supply of seafood.
Yet, many small-scale fisheries in developing countries fail to maximize value of
seafood products due to post-harvest loss, production, distribution, and marketing
challenges. The purpose of this study is to examine how post-harvest innovations
might address some of these challenges, whom they benefit along the fisheries value
chain, and factors that influence adoption of innovations through two case studies in
West Africa.
A multi-methods approach was used to collect extensive quantitative and
qualitative data from two countries, The Gambia and Ghana, during the period
between 2015-2018. Data were collected in the field using paper and electronic survey
instruments. These data were analyzed statistically and supported with key informant
interviews, focus groups, and direct and participant observation.
The results of this study show that in the Gambian sole fishery a simple
innovation, icing at sea, improved quality and reduced loss, thus increasing revenue
from export-oriented sole for fishers and buyers. Results also suggest that increasing
the proportion of sole for export does not impact local trade and consumption of sole.
In Ghana, a slightly more complex innovation was introduced to improve quality of
smoked fish and reduce consumption of fuelwood used to smoke fish. Results indicate
that innovative technology reduces fuelwood consumption, improves quality and
points to increased profitability for processors. This study also measured factors that
influence adoption of innovative technology. Factors that influence adoption are

distinct technological features such as less consumption of fuelwood, hence, cost of
fuelwood, reduction of smoke, and hands-on training, plus the ability to pay for
innovative technology. This study highlights the importance of simplicity in designing
and implementing innovations within the post-harvest sector in small-scale fisheries in
developing countries. These findings suggest post-harvest innovations can have
positive socio-economic impacts for some nodes along the fisheries value chain,
however, the cost of the innovation may exceed the benefit for other nodes along the
chain in the case studies presented here.

iv
ACKNOWLEDGMENTS
I sincerely thank my co-advisors, Dr. Richard Burroughs and Dr. Elin Torell, for
their exceptional guidance, support and supervision of my research throughout my
time at the University of Rhode Island. I would also like to thank my committee,
beginning with Dr. Brian Crawford. Dr. Crawford, thank you for inspiring me to
pursue a Doctorate in Marine Affairs. Dr. Richard Pollnac, I thank you for dedicating
your time to my research, sharing your expertise and appreciating my passion for it.
Dr. Hiro Uchida and Dr. Donna Hughes, you have guided my research from distinct
yet very significant perspectives, I am grateful for the support you have shown me
over the years and your continued interest in my work. In addition to my committee, I
would like to thank Dr. Kathleen Castro and Ms. Laura Skrobe from the Fisheries
Center at the University of Rhode Island for building my skill set, beginning in the
field. I wish to thank Dr. Catherine McNally, Dr. Elizabeth McLean, and Dr. Dawn
Kotowicz for their guidance and friendship.
I extend my gratitude to the Coastal Resources Center at the University of Rhode
Island Graduate School of Oceanography which was instrumental in the development
and successful completion of my research. I give special recognition to Ms. Karen
Kent and Dr. Don Robadue, Jr. For research conducted in The Gambia, I would like to
thank Mr. Dawda Foday Saine from NASCOM, the Atlantic Seafood Company and
the Statistics Unit at the Department of Fisheries for collaborating and sharing their
knowledge with me. For research conducted in Ghana, I would like to thank the
USAID/Ghana Sustainable Fisheries Management Project, and especially Ms. Hannah
Antwi. My research would not have been possible, however, without fishers and

v
processors from Alaska to West Africa who shared their knowledge to increase mine.
To friends and family from Rhode Island to Bainbridge Island, I appreciate your
support of my academic pursuits. Gracias, Javier.

vi
PREFACE
This dissertation is comprised of four chapters, which are organized into three
manuscripts. Each manuscript follows the University’s requirements for “manuscript
format.” Chapter one provides an overview of theoretical frameworks and important
themes discussed throughout this dissertation, and introduces a conceptual model for
implementing value chain innovations in small-scale fisheries in developing countries.
Chapter two and chapter three are case studies from West Africa that inform the
conceptual model introduced in chapter one in slightly different ways. Chapter two is
an assessment of post-harvest loss of sole in The Gambia. Chapter three measures
adoption of improved fish smoking technology in Ghana. Each case study is presented
as a separate manuscript for publication. Chapter four summarizes each case study; it
discusses results, cross-cutting themes present in both case studies, practical and
theoretical implications of this research, and thematic areas for future research. I
intend to combine chapter one and chapter four into one manuscript for publication
after each case study is accepted for publication. Each manuscript is designed for the
following scientific journals:
Manuscript 11 has been submitted to Marine Policy.
Manuscript 22 to be submitted to World Development.
Manuscript 33 to be submitted to Global Food Security.
1 This manuscript refers to chapter two of this dissertation. 2 This manuscript refers to chapter three of this dissertation. 3 This manuscript is a combination of chapter one and chapter four of this dissertation.

vii
TABLE OF CONTENTS
ABSTRACT .................................................................................................................. ii
ACKNOWLEDGMENTS .......................................................................................... iv
PREFACE .................................................................................................................... vi
TABLE OF CONTENTS ........................................................................................... vii
LIST OF TABLES ....................................................................................................... x
LIST OF FIGURES ................................................................................................... xii
LIST OF ACRONYMS ............................................................................................ xiii
Chapter 1 ...................................................................................................................... 1
Abstract ...................................................................................................................... 2
Introduction ................................................................................................................ 2
Problem Statement ..................................................................................................... 3
State of Knowledge .................................................................................................... 4
Conceptual Framework ............................................................................................ 10
Cross-cutting Themes of the Framework ................................................................. 17
Discussion ................................................................................................................ 21
Conclusion ................................................................................................................ 24
Appendix A .............................................................................................................. 26
References ................................................................................................................ 28
Chapter 2 .................................................................................................................... 33
Abstract .................................................................................................................... 34
Introduction .............................................................................................................. 35
The Gambian Sole Fishery ....................................................................................... 38
A Management and Market in Transition ................................................................ 39
Methodology ............................................................................................................ 43
Results ...................................................................................................................... 46
Discussion ................................................................................................................ 55

viii
Conclusion ................................................................................................................ 58
Appendix A .............................................................................................................. 62
References ................................................................................................................ 68
Chapter 3 .................................................................................................................... 71
Abstract .................................................................................................................... 72
Introduction .............................................................................................................. 73
Background .............................................................................................................. 75
Evolution of Stove Technology in Ghana ................................................................ 76
Fuel-efficiency .......................................................................................................... 81
Definition of Innovation Attributes .......................................................................... 81
Communication Channels ........................................................................................ 83
Methodology ............................................................................................................ 83
Measurement of Variables and Results .................................................................... 89
Discussion .............................................................................................................. 112
Conclusion .............................................................................................................. 124
Appendix A ............................................................................................................ 127
Appendix B ............................................................................................................. 128
Appendix C ............................................................................................................. 129
Appendix D ............................................................................................................ 130
Appendix E ............................................................................................................. 152
Appendix F ............................................................................................................. 157
References .............................................................................................................. 158
Chapter 4 .................................................................................................................. 164
Introduction ............................................................................................................ 165
Summary of Results by Node ................................................................................. 166
Themes ................................................................................................................... 169
Discussion .............................................................................................................. 172
Conclusion .............................................................................................................. 181
Practical implications ............................................................................................. 185
Theoretical implications ......................................................................................... 189

ix
Next step ................................................................................................................. 191
References .............................................................................................................. 193
Bibliography ........................................................................................................... 196

x
LIST OF TABLES
TABLE PAGE
Table 2.1. Fisheries improvement projects in the Gambian sole fishery. .................... 40
Table 2.2. Quality scores of sole landings in kilograms (kg). ..................................... 46
Table 2.3. Quality scores of sole landings by proportion (%). .................................... 47
Table 2.4. Average fisherman’s proportion loss of sole. ............................................. 48
Table 2.5. Average fisherman’s proportion loss of red and black sole. ....................... 48
Table 2.6. Average fishermen’s daily revenue from sole excluding price of ice. ........ 49
Table 2.7. Average fishermen’s daily revenue from sole including price of ice. ........ 50
Table 2.8. Average buyer’s proportion loss from sole based on fishermen’s use of ice.
...................................................................................................................................... 51
Table 2.9. Average buyer’s daily revenue from sole based on fishermen’s use of ice. 51
Table 2.10. Difference between ranks of fish at two landing sites for sole in The
Gambia. ........................................................................................................................ 53
Table 2.11. Contribution of fish smoking to overall household income by fish
processors. .................................................................................................................... 54
Table 2.12. Impact of sole exports on local trade. ....................................................... 55
Table 3.1. Owners of ahotor stove by region (as of August, 2017). ............................ 86
Table 3.2. Selection criteria for ahotor stove beneficiaries by region. ........................ 87
Table 3.3. Reasons for non-adoption of the ahotor stove (N=9). ................................. 88
Table 3.4. Description of socio-economic variables. ................................................... 90
Table 3.5. Difference between and within groups of socio-economic variables. ........ 91
Table 3.6. Material style of life indicators. .................................................................. 93

xi
Table 3.7. Principal component analysis of material style of life (n=111). ................. 94
Table 3.8. Differences between groups with respect to Household goods. ................. 96
Table 3.9. Differences between groups with respect to Luxury items. ........................ 96
Table 3.10. Attributes, subset of questions, and measurement for scale construction. 98
Table 3.11. Principal component analysis of Rogers (1995) attributes (n=111). ...... 100
Table 3.12. Innovation attributes component scores across user groups. .................. 102
Table 3.13. Logit coefficients from model of adoption of ahotor stove. ................... 104
Table 3.14. Analysis of perceived changes of availability of fish and fuelwood. ..... 108
Table 3.15. Differences between ahotor and chorkor groups regarding FuelwoodT2-T1.
.................................................................................................................................... 108
Table 3.16. Expense of fuelwood by respondent type. .............................................. 109
Table 3.17. Sales of fish at the market by stove type. ................................................ 110
Table 3.18. Perception of quality of smoked fish by respondent type. ...................... 111

xii
LIST OF FIGURES
FIGURE PAGE
Figure 1.1. Value chain upgrading framework for small-scale fisheries. .................... 11
Figure 1.2. Nodes in a fishery value chain. .................................................................. 12
Figure 2.1. Governance structure for the sole fishery in The Gambia ......................... 40
Figure 2.2. Sole value chains. ...................................................................................... 42
Figure 2.3. Map of study sites and special management area for sole, The Gambia. .. 44
Figure 3.1. PAHs levels by stove types........................................................................ 80
Figure 3.2. Location of Ghana and study sites. ............................................................ 84
Figure 3.3. Location of sample sites by region in Ghana............................................. 85
Figure 3.4. Principal component scores for household goods and luxury items and
respondent. ................................................................................................................... 95
Figure 3.5. Coughing in relation to the ahotor stove.................................................. 111

xiii
LIST OF ACRONYMS ANOVA Analysis of Variance
BaP Benzo[a]pyrene
CAC Codex Alimentarius Code
CCLME Canary Current Large Marine Ecosystem
CSIR Council for Scientific and Industrial Research
DoFISH Department of Fisheries
EFLAM Exploratory Fish Loss Assessment Method
FAO Food and Agriculture Organization
FIP Fishery Improvement Project
FoN Friends of the Nation
FRI Food Research Institute
GSA Ghana Standards Authority
LACOM Landing Site Co-Management Committee
LT Load Tracking
MASLOC Microfinance and Small Loans Centre
MSC Marine Stewardship Council
MSL Material Style of Life
NASCOM National Sole Fishery Co-Management Committee
PAH Polycyclic Aromatic Hydrocarbon
PHLA Post-Harvest Loss Assessment Approach
QLAM Questionnaire Fish Loss Assessment Method

xiv
SDG Sustainable Development Goal
SFMP Sustainable Fisheries Management Project
SNV Netherlands Development Association
TASC The Atlantic Seafood Company
USAID United States Agency for International Development
VCA Value Chain Approach
WHO World Health Organization

1
Chapter 1
A FRAMEWORK FOR IMPLEMENTING VALUE CHAIN IMPROVEMENTS IN SMALL-SCALE FISHERIES IN DEVELOPING COUNTRIES
by
Kristine Beran1
To be submitted to Global Food Security
1 PhD Candidate, Department of Marine Affairs, University of Rhode Island, RI, 02881, USA, Email: [email protected].

2
Abstract
Seafood is one of the most traded food commodities in the world by value.
Yet, it is subject to various types of post-harvest loss that result in economic losses
and contribute to nutrition loss and food insecurity. A review of the literature suggests
there are opportunities for innovations in small-scale fisheries in developing countries
to improve quality of seafood and reduce loss. Promising innovations include
improved technologies used at-sea and on land. I propose a conceptual framework to
upgrade value chain nodes through post-harvest innovations. This framework includes
a five-step process that begins with describing the value chain, identifying losses to
design innovations that result in adoption and yield socio-economic benefits.
Keywords: Small-scale fisheries, value chains, upgrading, gender, food security,
biodiversity
Introduction
Globalization has redefined production, trade and consumption of products we
use and consume. Seafood is no exception. In fact, seafood is a prime example of
globalization. In terms of trade value, seafood is one of the most traded food
commodities in the world surpassing coffee, cocoa, sugar, maize and it is larger than
pork and poultry combined (Asche, Bellemare, Roheim, Smith, & Tveteras, 2015).
Beyond trade, fish and seafood is an important source of protein that many of the
world’s poorest economies depend on for food security (Food and Agriculture
Organization [FAO], 2008). Seafood originates from two primary production
techniques; marine capture and aquaculture (Asche et al., 2015). This dissertation

3
centers on value chains related to post-harvest seafood processing technologies from
marine capture production in small-scale fisheries in developing countries.
Small-scale fisheries2 contribute significantly to the global supply and
production of seafood. It is estimated that small-scale fisheries from developing
countries produce half of the world’s fish landings (FAO, 2018). Over 90 percent of
the catch from small-scale fishers is destined for human consumption (WorldFish,
2008). Small-scale fisheries often fail to maximize value of seafood products due to
production, distribution and marketing challenges (Da Silva, 2011). Challenges
include poor handling practices and infrastructure (e.g. storage, transportation, market)
that contribute to various types of post-harvest loss (Da Silva, 2011). Addressing loss
of fish is important to feed the world’s growing appetite and need for seafood as a
source of protein.
Problem Statement
According to the Food and Agriculture Organization of the United Nations
(FAO, 2014), small-scale fisheries in developing countries are subject to significant
post-harvest losses that lead to “reductions in the quantity, quality or monetary value
of fish” (109-110). The FAO (2014) estimates that the cumulative loss ranges between
20 and 75 percent from the point of production until consumption (110). Physical loss3
of fish is lowest, or less than 10 percent, whereas quality-related loss can account for
up to 70 percent of total loss (FAO, 2014). Poor and inefficient fish preservation
techniques contribute to quality-related post-harvest loss in small-scale fisheries. 2 FAO (2018) defines small-scale fisheries as fishing households that use a relatively small amount of capital and energy, use relatively small fishing vessels and make short trips mainly for local food consumption. 3 Defined as discard due to animal predation and insect infestation.

4
Upgrades, or innovations in quality and processing technology can improve fish
quality and reduce post-harvest loss. Upgrading is a broad term that is subsequently
discussed.
This dissertation empirically analyzes4 how a node, or a network of people in
the value chain are impacted by post-harvest5 innovations, or upgrades. Overarching
questions that lead to the development of a conceptual framework for implementing
upgrades are:
1. What is the theory behind reducing post-harvest loss and in that sense upgrading
small-scale fisheries in West Africa?
2. What are some socio-economic outcomes of value chain upgrades, who
benefits, and how do these outcomes align with or contradict theory?
3. What factors influence adoption of innovations among its users?
State of Knowledge
A literature review was conducted to search for theoretical frameworks
applicable for addressing both post-harvest loss and value chain upgrades in small-
scale fisheries in developing countries. The review extended beyond fisheries to
agriculture to understand how they differ with respect to upgrading of other perishable
food products.
The review was conducted in a systematic way by searching for information
using online databases. Relevant articles and studies were identified by searching
Aquatic Sciences and Fisheries Abstracts (ASFA), AGRICOLA (ProQuest),
4 Analytic process is shown in Appendix A. 5 Post-harvest refers to the moment a fish enters a net is captured in a trap, or on a hook (Ward & Jefferies, 2000).

5
Biological and Agricultural Index Plus, and Scopus. There was no limitation placed on
a time period, however, the term “upgrading” has been recently linked to fisheries
value chain literature. Most articles referenced were published post-2000. An
advanced search using key phrases and terms such as post-harvest loss, small scale,
value chains and upgrading were used in every database mentioned.
The FAO’s Post-Harvest Loss Assessment Approach (PHLA) is suited for
small-scale fisheries operating in the sub-Saharan African context (Akande & Diei-
Ouadi, 2010). Here, losses occur for many reasons such as poor handling, inefficient
processing and preservation techniques, exposure to high temperatures, lack of
storage, poor transportation and theft (Akande &Diei-Ouadi, 2010).
This framework assesses post-harvest physical, quality and market loss of fish
(Akande & Diei-Ouadi, 2010). It defines physical loss as discards, or fish that is
thrown away accidentally or intentionally (Akande & Diei-Ouadi, 2010). Accidental
discard is typically caused by severe spoilage (e.g. exposure to high temperature),
insect infestation or animal predation (Akande & Diei-Ouadi, 2010). An example of
intentional discard is the controversial practice of shark finning, or when only part of
the fish has market value and the rest (edible portions) is discarded. Eviscerated, or
gutted fish is not considered discard according to a report published by the FAO
(Kelleher, 2005). Drying fish (e.g. loss of moisture) results in weight loss, yet this
processing technique is not defined as physical loss in this study, because, eviscerating
wet medium to large fish species soon after they have been harvested not only
prevents spoilage but may increase its value (Huss, 1988). Likewise preserving the
natural moisture content of fish retains important nutrients and flavor. In fact, in sub-

6
Saharan Africa this technique prevents quality loss and is discussed in chapter 3.
Physical damage to fish, such as breakage or severe burning due to over smoking also
results in quality loss (Akande & Diei-Ouadi, 2010).
Quality loss is caused by spoilage, mishandling, poor packaging and lack of
storage facilities that can result in economic loss, expressed as lower prices (Akande
& Diei-Ouadi, 2010). Market loss results from unfavorable market conditions, such as
over-supply (Akande &Diei-Ouadi, 2010). Another type of loss discussed, but not
quantified by this approach is nutritional loss.6 All of these losses have financial, food
safety and security implications for consumers.
Similar types and magnitude of post-harvest loss occur in small-scale
agriculture in sub-Saharan Africa (Affognon, Mutungi, Sanginga, & Borgemeister,
2015). Like fish, fruits and vegetables are highly susceptible to post-harvest loss
(Affognon et al., 2015). A complimentary framework to the FAO’s PHLA (Akande &
Diei-Ouadi, 2010) is the Commodity Systems Assessment Methodology (LaGra,
1990). This method is used by the agri-food industry to qualify and quantify post-
harvest losses (LaGra, 1990). It focuses on shelf-life, or the length of time a product
remains usable. A shorter shelf-life translates to qualitative and quantitative losses
(LaGra, 1990). Given the globalized nature of seafood trade, this concept is highly
desirable and applicable to fisheries. Techniques used in the agri-food industry
6 Post-harvest nutrient loss of low-value fish processed by traditional methods in Africa is examined by Kabahenda, Omony, & Hüsken (2009). Fish (fresh or processed) is prone to microbial growth when it is exposed to various types of oxidation and enzymatic processes leading to rancidity and rapid degradation. Degradation of fish compromises intake of nutrients such as protein, essential fatty acids, vitamin A, among others, and decreases its nutritive value. In this context, loss of nutrients is caused by excessive exposure to high temperatures, poor handling, processing and storage of fish.

7
presented by Affognon et al. (2015) include modified atmosphere packaging, a
mixture of carbon dioxide and nitrogen gas that prevents spoilage and extends shelf-
life. This food preservation technique is commonly used in the retail-case ready meat
department and is gaining attention in seafood (Cooksey, 2014). This technique
requires substantial investment in processing equipment and temperature-controlled
infrastructure. Parry (2012) discusses use and expansion of this technique primarily in
North America and Europe. However, conceptually, the idea behind improved
packaging is transferable to small-scale fisheries, especially those with export markets.
Upgrading is a term used in value chain literature by a variety of industries,
including natural resources (Gereffi, 1999; Riisgaard, Bolwig, Ponte, Toit, Halberg, &
Matose, 2010; Barrientos, Gereffi & Rossi, 2011; Piertrobelli & Rabellotti, 2011;
Ponte, Kelling, Jespersen, & Kruijssen, 2014; Hamilton-Hart & Stringer, 2016).
Economic upgrading refers value addition generated by profits, technology or
knowledge (Bair, 2008). Examples of economic upgrading include process (e.g.
efficiencies) or product (e.g. diversification) upgrading (Hamilton-Hart & Stringer,
2016). Social upgrading refers to improvements to labor standards and quality of
employment (Hamilton-Hart & Stringer, 2016). Environmental upgrading aims to
improve performance standards in order to reduce damage (De Marchi, Di Maria, &
Micelli, 2013). Institutional or governance upgrading is defined as interactive
governance arrangements between state, private and civil society organizations and
discussed by Fabinyi (2016) and Wentink, Raemaekers and Bush (2017), but not
addressed in this dissertation. Wentink, Raemaekers and Bush (2017) use allocation of
communal fishing rights as an example of institutional upgrading.

8
Barrientos, Gereffi and Rossi (2011) and Riisgaard et al. (2010) both discuss
various types of economic upgrading within a node in global value chains. The type of
economic upgrade most relevant to this dissertation is product upgrading as defined
by Riisgaard et al. (2010). Product upgrading focuses on increasing or enhancing a
unit’s value by enhancing its features (e.g. physical quality, food safety standard,
certification, traceability, packaging). The value chain improvements discussed in this
dissertation fit the definition of product upgrading as defined by Riisgaard et al.
(2010).
Seafood consumption is increasingly subject to analysis using the value chain
approach (Porter, 1985, Gereffi & Fernandez-Stark, 2011, Kaplinsky, 2000; Kaplinsky
& Morris, 2000). Michael Porter (1985) popularized the value chain approach as a
means for corporations to identify ways to extract more value, or profit by
outperforming competitors through cost advantage7 and product differentiation.8
Porter (1985) asserts significant technological innovations can achieve both. Porter
(1998) describes these innovations as capital-intensive and state-of-the-art.
Descriptively, the value chain approach, or VCA, categorizes people along the
chain by occupation and location (O’Neill & Crona, 2017). Rosales et al. (2017) and
O’Neill and Crona (2017) use this approach to map and describe relationships in
small-scale fisheries between people and networks, or nodes. Simply defined, a node
is a group people occupying similar roles along the value chain (O’Neill & Crona,
2017). Terms vary by region. For example, describing the snoek value chain, some
7 Defined as “cutting costs,” or controlling for drivers that generate the highest cost in parts of the value chain (Porter, 1985). 8 Defined as distinguishing a product or service from competitors, typically making products more desirable or unique (Porter, 1985).

9
key nodes are termed producers (e.g. fishers or gleaners), buyers (e.g. intermediaries,
traders), retailers and consumers (Hara, 2014). Determining which nodes to upgrade
by diffusing an innovation is important given the perishable nature of fish in tropical
fisheries.
Empirically, the VCA is used to quantify profit and loss-through sales
transactions-between nodes (O’Neill & Crona, 2017). This can reveal distribution of
benefits within the value chain (Rosales et al., 2017; Purcell, Crona, Lalavanua, &
Eriksson, 2017). O’Neill and Crona (2017) highlight the absence of and need for data
on distribution of benefits in small-scale fisheries. Both Purcell et al. (2017) and
Rosales et al. (2017) conducted primary research on the distribution of benefits within
the value chain in small-scale fisheries in developing countries. Rosales et al. (2017)
cites fishermen earn the lowest margin among eight value chains analyzed in the
Philippines. Rosales et al. (2017) maps seven of the eight value chains analyzed by
species, actor or node, average selling price per actor, profit margin and governance of
the value chain. In chapter 2, the sole value chain is disaggregated by end market.
Purcell et al. (2017) reveal huge variation in prices fishers and middlemen
receive for the same species of dried sea cucumbers from large buyers in different
locations in the Pacific Islands. Many factors influence prices (e.g. economies of scale,
patron-client arrangements). This discussion is beyond the scope of this research.
However, it is noteworthy to address distribution of benefits. Unequal distribution of
benefits raises equity concerns and can influence the balance of power within a supply
chain. Distribution of benefits based on primary research is discussed in chapter 2.

10
The VCA, PHLA and Commodity Systems Assessment Methodology can lead
to upgrading in the fisheries sector. It cannot, however, predict factors that influence
adoption or rejection of innovations. Diffusion of innovation is a useful and
complimentary framework (Rogers, 1995). Diffusion theory has largely been informed
by social problems of rural life (Rogers, 1995). Diffusion theory informs how
innovations are implemented and the rate at which they are adopted, or not, based on
perceived attributes. According to diffusion theory, adoption is influenced by five
perceived attributes: Relative advantage, compatibility, complexity, trialability and
observability (Rogers, 1995). These attributes are discussed and empirically tested in
chapter 3.
Conceptual Framework
The objective of this paper is to introduce a conceptual framework to guide the
design, adoption and implementation of post-harvest value chain upgrades relevant in
the developing world context. Within this context are important cross-cutting themes
such as gender, biodiversity and food security that shape this framework. Their
particular relevance to this framework is discussed. Central to this framework is
designing and implementing improvements that align with sustainable natural resource
management measures. The framework is presented in Figure 1.1.

11
Figure 1.1. Value chain upgrading framework for small-scale fisheries.
Methods used to inform this framework include qualitative and quantitative
approaches. A desktop literature review was conducted on the value chain approach
and post-harvest loss related to fisheries. In step two, primary data collection (e.g.
quantitative) and key informant interviews were conducted to determine post-harvest
loss in the supply chain. In step three, secondary sources (e.g. value chain analyses) in
addition to results from step two inform the design of interventions. Primary data
collection, direct and participant observation informs implementation of programs in
step four. Analysis of results from previous steps informs the learning process.
Each step is subsequently discussed, where applicable, examples based on
primary research are provided by node.
Step 1: Map and describe the fisheries value chain
The first step is to understand the fisheries value chain. A value chain analysis
is a useful tool for identifying opportunities and constraints to economic growth by
identifying actors as nodes, describing relationships between them and structures that

12
govern them. A value chain analysis was conducted for each of the two case studies
discussed in this dissertation. The value chain analysis helped to identify and design
post-harvest improvements discussed in this dissertation. The goal behind using this
approach is to maximize value creation and/or usage of seafood products along the
chain.
Step 2: Assess where losses occur in the fisheries value chain
Post-harvest improvements are typically implemented to prevent loss, reduce
waste and improve usage of fish. Post-harvest loss can occur at various nodes in the
value chain. Figure 1.2 illustrates value chain nodes discussed in this study.
Innovations designed to reduce loss and upgrade nodes in this study are shown in
parentheses (Figure 1.2).
Figure 1.2. Nodes in a fishery value chain.
The FAO’s PHLA (Akande & Diei-Ouadi, 2010) is a useful method to identify
where losses occur along the value chain. This method focuses on three main types of
loss (e.g. physical, quality and market force). It uses qualitative and quantitative
methods to qualify and quantify losses. Akande & Diei-Ouadi (2010) identify
quantitative physical loss of fish at certain stages of distribution (not specifically by
node) in five sub-Saharan African countries. In Tanzania, this study estimates 5
percent of wet and dry sardines are thrown away or discarded as a result of being
stepped on aboard the vessel or infested by insects (e.g. blowflies) at the landing site
(Akande & Diei-Ouadi, 2010). Elements of the PHLA method are discussed and used

13
to determine post-harvest loss in chapter 2. This method is well-suited for small-scale
fisheries because it considers quality loss for domestic markets, where most fish is
consumed. Understanding the magnitude and frequency of loss within a value chain is
necessary to inform and design innovations that reduce loss in the value chain.
Step 3: Design innovations that reduce loss and strengthen the fisheries value chain
This step focuses on where and for whom to design innovations. While it is not
limited to particular nodes, it does place emphasis on innovations around fishers and
processors. As the literature suggests, these nodes often fail to capture economic gains
realized by others further along the value chain. Therefore, innovations that prevent
post-harvest loss, improve product quality or usage of seafood products are introduced
earlier in the chain as a means of capturing more economic benefits within the fisher
and processor node, but also in anticipation of strengthening nodes further along the
chain.
An example of value chain strengthening is extending shelf-life, because a
longer shelf-life has positive ripple effects along the entire value chain. Means used to
extend shelf-life can range from simple to complex depending on the size of the
investment or needs of the end market. For example, in developing world fisheries that
supply local or domestic markets, improvements to traditional techniques such as
salting, sun drying and smoking are rather simple, low-cost interventions that extend
shelf-life of fish products in the absence of refrigeration. For fisheries with export
markets, improvements to the cold chain (e.g. refrigeration or freezing) may require
more substantial investments in infrastructure and logistics in exchange for higher
returns. Cheke and Ward (1998) measure physical (and economic) loss using a

14
model.9 Cheke and Ward (1998) provide limited, yet insightful evidence of this using
a model for evaluating interventions designed to reduce post-harvest loss of Nile Perch
in Tanzania. The study concluded total physical and economic loss of fish was
reduced when transporting fresh fish by air rather than by rail from Lake Victoria to
Dar-es-Salaam (Cheke & Ward, 1998). In chapter 2, physical loss of sole is similarly
measured according to inputs used in this model.
Other measures to reduce loss and add value may come from the financial or
communication sector. For example, access to financial services such as credit and
insurance schemes may facilitate and secure investments in improvements by fishers
and processors. Use of electronic devices ranging from mobile phones to global
positioning systems may provide access to time-sensitive price and market
information that can reduce market-related losses or lead to traceability schemes that
open new markets for fish products. Regardless of the size or scope of innovations,
they should be highly contextualized bearing in mind the capacity of those within the
chain to implement, use, and benefit from them.
Step 4: Design a program that maximizes adoption of innovation
Diffusion of innovation (Rogers, 1995) is a useful lens through which to
evaluate adoption of innovations, or upgrades. It has been applied across various
disciplines to help extension officers, educational institutions and researchers
determine factors that influence adoption or rejection of innovations (Rogers, 1995).
Factors include perceived attributes of innovations, communication channels and
promotional efforts. In addition to these and other factors, there are stages a person,
9 As far as physical loss is concerned, the model requires weight of fish entering each stage. At the start of the chain, weight begins with the catch.

15
group or decision-making unit goes through before adopting an innovation (Rogers,
1995). In other words, it is not instantaneous. Each stage, beginning with knowledge
or awareness creation, is critical in the adoption process. Yet even at the learning
stage, there are factors that will influence-and potentially benefit-some actors more
than others according to diffusion theory. For example, those who hear or learn about
an innovation sooner than others tend to have a higher socio-economic status, more
formal education and extended social networks (Rogers, 1995).
Applied to the fisheries value chain, socio-economic status and education
characteristics differ according to nodes shown in Figure 2. Fisheries development
literature often suggests fishers and processors are socio-economically marginalized
with little to no formal education and high rates of illiteracy (Crawford, Herrera,
Hernandaez, Leclair, Jiddawi, Masumbuko, & Haws, 2010; Crawford, Gonzales,
Amin, Nyari-Hardi, & Sarpong, 2016; Neiland & Béné, 2013). This is important to
consider when designing-and communicating-post-harvest improvement projects
according to nodes along the chain. For example, if the intended beneficiary is
illiterate, printed communication about the innovation is not useful at the learning
stage. In this case, a hands-on approach with respect to how-to may be more
appropriate. Likewise, if the innovation is cost-prohibitive or the asset is fixed and
requires ownership of land, it may benefit fewer people. Some of these factors and
stages are discussed, evaluated and analyzed empirically in chapter 3.
Step 5: Determine scale
Generally, in the VCA literature scale is considered to represent impact or
outcome in relation to efficiency, or economies of scale (Porter, 1985). This is a good

16
measurement used in manufacturing. However, it may not be an ideal measure of
success for interventions in small-scale fisheries in developing countries. In this case,
the type of upgrade and its end market can also determine scale. For example, scale is
defined by the number of people who potentially benefit from an intervention, or
adopt an innovation. An innovation that focuses solely on export commodities may
benefit some, but not all simply because many small-scale fisheries do not supply
international markets (Béné & Heck, 2005). However, if interventions target multi-
species fisheries and domestic markets (e.g. small pelagic species in Ghana), the
opportunity for scale increases. In other words, the type of upgrade should be tailored
to the needs of the local context to achieve scale.
Learning and evaluation is an important component of this framework. Each
step presents opportunities that inform the process of designing and implementing
post-harvest improvement projects. For example, an evaluation of the fisheries value
chain and assessment of where losses occur will help design of the intervention in step
three. Step four and five will inform the future design of projects building off lessons
learned through the use of this framework. The framework presented in Figure 1.1 can
also inform how upgrades might impact the wider social-ecological system. Akande &
Diei-Ouadi (2010) identify a relationship between types of post-harvest loss and
gender using descriptive statistics, where men are affected by physical and quality loss
and women absorb market loss. Following steps 1-3 can inform and identify upgrades
that are gender-neutral or gender-specific. In step 3, designing upgrades that improve
preservation of fish (e.g. smoking, freezing) may extend shelf-life, improve storage
capacity and contribute to food security objectives by preserving nutritional value of

17
fish and avoid loss of nutrients. Based on a study by Kawarazuka & Béné (2011), the
nutritional value of small pelagics species such as anchovy, herring and mackerel is
generally higher than other animal and plant-source foods. Therefore, designing
upgrades that improve preservation of small pelagics species is the focus of chapter 3.
Improved preservation techniques can facilitate distribution, transportation, and sales
of fish from the coast to non-coastal areas. In Ghana, for example, smoked fish is
consumed as far as 600 km inland and traded beyond its borders with Burkina Faso
(Kawarazuka & Béné, 2011). Longer storage capacity provides protein to households
during lean seasons, or when fish is out of season.
Cross-cutting Themes of the Framework
Within the value chain upgrading framework are important cross-cutting
themes that warrant closer attention because of their direct relationship to small-scale
fisheries and their broader contribution within the social-ecological system. Themes
presented but not limited to the framework are food security, gender and biodiversity.
They are subsequently discussed.
Gender
Men are often associated with fishing; however, women are believed to
represent 47 percent of the fisheries workforce in developing countries (Pomeroy &
Andrew, 2011). Despite this significant figure, their roles and contribution within this
sector is often poorly understood. Women occupy key roles in the post-harvest sector
(Harper, Zeller, Hauzer, Pauly, & Sumaila, 2013). They are primarily involved in
processing and marketing activities, although in some places such as Ghana, women
also finance fishing trips (Weerantunge, Snyder, & Sze, 2010). Through these

18
activities, women generate income and provide food to their families. They also have
important and technical know-how of fisheries and possess local ecological
knowledge (Calhoun, Conway, & Russell, 2016). Men and women experience the
environment from different perspectives, as a result, they also perceive threats to it
differently (Santos, 2015). Therefore, women’s knowledge of fisheries is very useful
in designing and implementing post-harvest innovations. Their participation, however,
can be limited due lack of time and reproductive responsibilities and constrained by
illiteracy or social norms (Matsue, Daw, & Garrett, 2014). As a tool, a gender analysis
explains roles of men and women in the fisheries value chain and the reasons behind
those roles. Understanding these roles through a gender lens is important from the
design stage to scale. For example, is the type of upgrade (e.g. machinery or
equipment) suitable for its user? Are trainings tailored to the needs and skills by
gender? These are just a few questions to consider when diffusing an innovation so
that men and women have equal opportunity to participate and benefit from it.
Food security
Food security10 is an important cross-cutting theme of value chain
improvements in developing countries. The United Nations (2012) urges countries to
effectively manage fisheries to help ensure food security. The Millennium
Development Goals recognize the importance of fisheries to achieving their
objectives, including eradicating hunger (Heck, Béné & Reyes-Gaskin, 2007). The
primary objectives of Feed the Future, the U.S. Government’s Global Hunger and
10 Defined “when all people, at all times, have physical and economic access to sufficient, safe and nutritious food to meet their dietary needs and food preferences for an active and healthy life” (World Food Summit, 13-17 November, 1996).

19
Global Food Security Initiative is to improve people’s nutritional status, particularly
that of women and young children (USAID, 2011). Food security goals need to be
taken into consideration when post-harvest value chain improvements are introduced.
Food security is particularly important for developing countries that are highly
dependent on fish as an affordable source of protein (Golden, Allison, Cheung, Dey,
Halpern, McCauley… & Myers, 2016). These countries often cannot replace loss of
nutrients as easily as wealthier countries who can substitute the loss of domestic
production with imports (Golden et al., 2016). Before implementing improvements
within the value chain, it is important to evaluate the potential to boost or undermine
food security within that context. For example, technical interventions that increase
efficiency such as more powerful outboard engines or more durable gear may increase
income in the short-term but ultimately may have a negative impact on fishery
resources in the absence of management (Allison & Ellis, 2001). Likewise, capital-
intensive interventions can lead to increased fishing effort and comprise resource
sustainability if users are unable to earn sufficient returns on the investment (Allison
& Ellis, 2001). Interventions that lead to over-exploitation of fisheries can undermine
food security. The impact of trade on food security is an ongoing debate that is further
explored in chapter 2.
Biodiversity
Biodiversity is increasingly under threat due to various causes. Murawski,
Methot, & Tromble (2007) discuss biodiversity as it relates to fisheries in terms of
stock abundance and species diversity. In this context, threats to marine biodiversity
include overfishing, destructive fishing gears, and use of illegal fishing practices

20
(Pauly & Watson, 2003). A discussion of these causes is beyond the scope of this
paper. Yet, innovations in commercial fishing technology, such as gear types, are
partly to blame for these causes (Pauly & Watson, 2003). Small-scale fisheries are
known to employ relatively low technology and simple gear types (WorldFish, 2008).
Regardless of their sophistication, they can still destroy and degrade the environment.
For example, in Ghana illegal small mesh size nets are known to be used to catch
juvenile fish. This can have negative impacts on the ecosystem by shortening the food
web, a phenomenon discussed by Pauly and Watson (2003).
Mangrove depletion and deforestation from anthropogenic sources also
threaten biodiversity. Causes for mangrove depletion in fisheries are demand for fuel
wood and clearing for aquaculture development (Evangelista, 1992). Fuelwood is an
important source of energy for cooking and heating in sub-Saharan Africa. Between
1980 and 2005, it accounted for over 70 percent of the total energy use, followed by
petroleum and electricity, respectively (Kebede, Kagochi, & Jolly, 2010). Since then,
Africa has recorded one of the highest annual net losses of forests (FAO, 2015).
Continued reliance of fuel wood contributes to loss in biodiversity (FAO, 2015).
Similar to fish, loss of trees used for fuel wood can also be evaluated using the
framework presented in Figure 1.1 to inform the design of interventions that
regenerate this resource. Innovative technologies that reduce consumption of fuelwood
for smoking fish are discussed in chapter 3.
Many of these causes that lead to loss of biodiversity result from poor
management of natural resources. Therefore, it is important to design and implement
value chain upgrades that align with and do not detract from sustainable fishery and

21
terrestrial management objectives or tenure arrangements. Implementing value chain
improvements in fisheries that are engaged in some form of fishery improvement
project is recommended to minimize negative impacts or control for unintended
consequences.
The value chain upgrading framework (Figure 1.1) is designed based on
existing value chain, post-harvest loss and extension frameworks as well as the
experience conducting primary research related to value chain improvements in West
Africa. Results of this research are discussed in chapter 2 and 3. Each chapter
contributes to this framework in slightly different ways. Chapter 2 relates to step two
and three of the framework. Chapter 2 assesses post-harvest loss of sole in The
Gambia and designs an intervention to reduce it. Chapter 3 relates to step four of the
framework. Chapter 3 measures adoption of improved fish smoking technology in
Ghana. Chapter 4 summarizes and discusses results of research questions as they
pertain to two case studies in West Africa.
Discussion
Value chain research informs production and trade of products we consume
daily. Typically, the VCA is used by industrial manufacturers to make clothes we wear
and food we eat presumably better for less money. Increasingly, this approach is
applied to fisheries. So far, it seems to offer new perspectives on relationships and
links among networks of people, or nodes, along the chain. The VCA may help
identify opportunities to upgrade or improve a node’s position along the chain through
post-harvest innovations. Upgrading small-scale fisheries in developing countries is a

22
relatively new area of focus in value chain research based on review of the literature.
Particular types of innovations that upgrade certain networks of people are discussed.
O’Neill and Crona (2017) and Rosales et al. (2017) use the VCA to increase
our understanding of distribution of economic benefits by node along the chain.
Rosales et al. (2017) conduct value chain studies in eight small-scale fisheries in the
Philippines and conclude fishers are price takers or take what they can get. In this
study, fishers earn the lowest profit margin among all actors in the chain (Rosales et
al., 2017). Personal experience serves as a reminder that commercial harvesters (e.g.
fishers) in capture fisheries have to sell what they catch and soon, often at prices
dictated by others. In aquaculture there is more room to maneuver in this respect, for
example, one can schedule a harvest around favorable market conditions, which is not
a guarantee (of better prices), but at least an option.
Rosales et al. (2017) propose upgrades,11 or improvements in fish quality that
enhance value so primary harvesters “get a fairer share of the total economic value of
their catch” (Rosales et al., 2017, p.21). One example of increasing the economic
value of a fisher’s catch is through improved processing techniques on-board (e.g. ice)
or improved storage facilities available to fishers that minimize post-harvest quality
loss or rejection due to quality by buyers or others along the chain (Rosales et al.,
2017). This is a potential example of upgrading a node-comprised of primary
harvesters-through improvements aimed to enhance the value of their catch. Where
possible, it is important to account for the impact that upgrading one node has on
another node. Evidence of this is further discussed in Chapter 2.
11 Specific mention to ice plants and cold storage facilities.

23
O’Neill and Crona (2017) use the VCA to identify and highlight the role of
women along the chain. This awareness leads to questions about marginalization (of
certain actors) in fishery development projects. The conceptual framework in Figure
1.1 aims to prevent marginalization or displacement of both men and women in post-
harvest development projects. For example, Chapter 2 focuses on upgrading a node
dominated by men but simultaneously assesses impact on another node (and market)
dominated by women. Chapter 3 focuses on innovations that attempt to upgrade a
node dominated by women with the aim of benefitting others along the chain.
There are many factors to consider when upgrading a node beginning with the
type of innovation. An innovation is typically characterized by its newness; however,
it must satisfy a need with some degree of benefit in order for it to be adopted (Rogers,
1995). Diffusion theory is largely informed by agricultural innovations. Ryan and
Gross (1943) and Deutschmann and Fals Borda (1962) are seminal studies of
innovations that aim to increase productivity among farmers in the North and South.
In the Midwest, farmer nodes benefitted economically from an innovation (e.g. hybrid
corn seed) that increased corn yields (Ryan & Gross, 1943). The Deutschmann and
Fals Borda study (1962) took place in a different context but produced similar results
by diffusing a new potato variety among Andean farmers. These are hailed as success
stories, yet notable failures exist. One example of failure discussed by Rogers (1995)
is how tomato harvesters in California were displaced with the introduction of
improved machinery. In this case, the innovation not only adversely impacted the
processing node (by eliminating jobs) but also produced tomatoes consumers

24
rejected.12 Similar to this dissertation, innovations discussed in these studies center
around nodes closest to the resource they harvest or extract.
Innovations come with uncertainty and perceived risk (Rogers, 1995). Risk and
uncertainty affect people differently. The relative strength of a node with respect to
financial investments is a relevant topic in small-scale developing world fisheries.
Fishing is often characterized as an occupation of last resort for the poorest of the
poor (Allison & Ellis, 2001; Fauzi & Zuzy, 2010). Empirical studies conducted by
Pollnac & Poggie (2006) in North America and by Pollnac, Pomeroy and Harkes
(2001) in Southeast Asia demonstrate fishing is a desirable and satisfying occupation
despite risk and uncertainty with respect to variability of catch. Personal experience
also challenges this assumption but recognizes evidence that suggest primary
harvesters earn low margins. Therefore, upgrading nodes closest to the resource they
depend on drives this research.
Finally, fisheries innovations should not be confused with incentives that lead
to overexploitation. This research is mindful of unintended consequences that result
from technological innovations regardless of their degree of sophistication. Controls
within this framework are intended to avoid adverse impacts potentially caused by
innovations on its users, others along the chain and the environment, but places no
guarantee.
Conclusion
This chapter introduced the concept of upgrading nodes through post-harvest
innovations using a conceptual framework. The framework shown in Figure 1.1 was 12 To facilitate machine-picking, scientists bred hard tomatoes so they would not easily bruise during harvest (Rogers, 1995).

25
partly shaped by the research presented in chapters 2 and 3. The framework also
accounts for important cross-cutting themes relevant to the context in which these
fisheries operate. Through the learning and adaptation process this framework may
lead to wider application, or beyond types of innovations and nodes discussed in this
dissertation. Upgrade opportunities are not limited to technological innovations
discussed in this dissertation. Value chain research points to other market and
management measures, such as certification and financing schemes and collective
action13 as ways to upgrade nodes along the chain.
13 A node within the chain may be able to leverage their position through collective action. A fishing cooperative is an example of collective action relevant to fisheries (Uchida, 2017). It’s success, however, depends on various enabling conditions including membership, exclusion method and privileged group outlined by Uchida (2017).

26
Appendix A
Analytic process for addressing research questions in this dissertation (Figure adapted
from Rummel, 1970).

27

28
References
Affognon, H., Mutungi, C., Sanginga, P., & Borgemeister, C. (2015). Unpacking Postharvest losses in sub-Saharan Africa: A meta-analysis. World Development, 66, 49-68.
Akande, G., & Diei-Ouadi, Y. (2010). Post-harvest Losses in Small-scale Fisheries: Case Studies in Five sub-Saharan African Countries. FAO Fisheries and Aquaculture Technical Paper, (550). 77pp.
Allison, E. H., & Ellis, F. (2001). The Livelihoods Approach and Management of Small-scale Fisheries. Marine Policy, 25(5), 377-388.
Asche, F., Bellemare, M. F., Roheim, C., Smith, M. D., & Tveteras, S. (2015). Fair Enough? Food Security and the International Trade of Seafood. World Development, 67, 151-160.
Bair, J. (2008). Analysing Global Economic Organization: Embedded Networks and Global Chains Compared. Economy and Society, 37(3), 339-364.
Barrientos, S., Gereffi, G., & Rossi, A. (2011). Economic and Social Upgrading in Global Production Networks: A New Paradigm for a Changing World. International Labour Review, 150(3‐4), 319-340.
Béné, C., & Heck, S. (2005). Fish and Food Security in Africa. NAGA, WorldFish Center Quarterly, 28(3-4), 8-13.
Borda, O. F., & Deutschmann, P. (1962). Communication and Adoption Patterns in an Andean Village. San Jose, Costa Rica, Programa Interamericano De Informacion Popular.
Calhoun, S., Conway, F., & Russell, S. (2016). Acknowledging the Voice of Women: Implications for Fisheries Management and Policy. Marine Policy, 74, 292-299.
Cheke, R. A., & Ward, A. (1998). A Model for Evaluating Interventions Designed to Reduce Post-Harvest Fish Losses. Fisheries Research, 35(3), 219-227.
Cooksey, K. (2014). Modified Atmosphere Packaging of Meat, Poultry and Fish. Innovations in Food Packaging (second edition), pp. 475-493.
Crawford, B., Gonzales, L., Amin, D., Nyari-Hardi, B., & Sarpong, Y. (2016). Report on the Baseline Survey of Small Pelagic Fishing Households along the Ghana Coast. The USAID/Ghana Sustainable Fisheries Management Project (SFMP) Narragansett, RI: Coastal Resources Center, Graduate School of Oceanography, University of Rhode Island.GH2014_PGM187_CRC. 122pp.
Crawford, B., Herrera, M. D., Hernandez, N., Leclair, C. R., Jiddawi, N., Masumbuko, S., & Haws, M. (2010). Small scale Fisheries Management: Lessons from Cockle Harvesters in Nicaragua and Tanzania. Coastal Management, 38(3), 195-215.

29
Da Silva, D. (2011). Value Chain of Fish and Fishery Products: Origin, Functions and Application in Developed and Developing Country Markets. Food and Agriculture Organization. 63pp.
De Marchi, V. D., Maria, E. D., & Micelli, S. (2013). Environmental Strategies, Upgrading and Competitive Advantage in Global Value Chains. Business Strategy and the Environment, 22(1), 62-72.
Demont, M., & Ndour, M. (2015). Upgrading Rice Value Chains: Experimental Evidence from Eleven African Markets. Global Food Security, 5, 70-76.
Evangelista, D. (1992). Management of Mangrove Areas in Calauag Bay, Quezon Province, Philippines. WorldFish Centre. Http://agris.fao.org/agris-search/search.do?recordID=QW2012000945
Fabinyi, M. (2016). Producing for Chinese Luxury Seafood Value Chains: Different Outcomes for Producers in the Philippines and North America. Marine Policy, 63, 184-190.
Fauzi, A., & Zuzy, A. (2010). Social Resilience and Uncertainties: The Case of Small-scale Fishing Households in the North Coast of Central Java. Mast, 9(2), 55-64.
Food and Agriculture Organization of the United Nations (FAO). (2008). Many of the World's Poorest People Depend on Fish. Retrieved from http://www.fao.org/Newsroom/en/news/2005/102911/index.html
Food and Agriculture Organization of the United Nations (FAO). (2014). The State of Fisheries and Aquaculture. Opportunities and Challenges. ( No. E-ISBN 978-92-5-108276-8). Rome: FAO. Retrieved from http://www.fao.org/3/a-i3720e.pdf.
Food and Agriculture Organization of the United Nations (FAO). (2015). The Global Forest Resources Assessment. ( No. ISBN-978-92-5-108826-5). Rome: FAO. Retrieved from http://www.fao.org/3/a-i4808e.pdf.
Food and Agriculture Organization of the United Nations (FAO). (2018). Fisheries and Aquaculture Department. People and Communities. Retrieved from http://www.fao.org/fishery/ssf/people/en.
Gereffi, G. (1999). International Trade and Industrial Upgrading in the Apparel Commodity Chain. Journal of International Economics, 48(1), 37-70.
Gereffi, G., & Fernandez-Stark, K. (2016). Global Value Chain Analysis: A Primer. Second Edition. Duke University. Center on Globalization, Governance & Competitiveness at the Social Science Research Institute.
Gereffi, G., Humphrey, J., & Sturgeon, T. (2005). The Governance of Global Value Chains. Review of International Political Economy, 12(1), 78-104.
Golden, C., Allison, E. H., Cheung, W. W., Dey, M. M., Halpern, B. S., McCauley, D. J., . . . Myers, S. S. (2016). Fall in Fish Catch Threatens Human Health. Nature, 534(7607), 317-320.

30
Hamilton-Hart, N., & Stringer, C. (2016). Upgrading and Exploitation in the Fishing Industry: Contributions of Value Chain Analysis. Marine Policy, 63, 166-171.
Hara, M. M. (2014). Analysis of South African Commercial Traditional Linefish Snoek Value Chain. Marine Resource Economics, 29(3), 279-299.
Harper, S., Zeller, D., Hauzer, M., Pauly, D., & Sumaila, U. R. (2013). Women and Fisheries: Contribution to Food Security and Local Economies. Marine Policy, 39, 56-63.
Heck, S., Béné, C., & Reyes‐Gaskin, R. 2007. Investing in African fisheries: Building Links to the Millennium Development Goals. Fish and Fisheries, 8(3), 211-226.
Huss, H. H. (1988). Fresh fish quality and quality changes: A Training Manual Prepared for the FAO/DANIDA Training Programme on Fish Technology and Quality Control. Food & Agriculture Organization.
Kabahenda, M., Omony, P., & Hüsken, S. (2009). Post-Harvest Handling of Low-value Fish Products and Threats to Nutritional Quality: A Review of Practices in the Lake Victoria Region. Fisheries and HIV/AIDS in Africa: Investing in Sustainable Solutions, the WorldFish Center.
Kaplinsky, R. (2000). Globalisation and unequalisation: What Can Be Learned from Value Chain Analysis? Journal of Development Studies, 37(2), 117-146.
Kaplinsky, R., & Morris, M. (2000). A Handbook for Value Chain Research. University of Sussex, Institute of Development Studies.
Kawarazuka, N., & Béné, C. (2011). The Potential Role of Small Fish Species in Improving Micronutrient Deficiencies in Developing Countries: Building Evidence. Public Health Nutrition, 14(11), 1927-1938.
Kebede, E., Kagochi, J., & Jolly, C. M. (2010). Energy Consumption and Economic Development in sub-Saharan Africa. Energy Economics, 32(3), 532-537.
Kelleher, K. (2005). Discards in the World's Marine Fisheries: An Update Food & Agriculture Organization. Rome.
LaGra, J. (1990). A Commodity Systems Assessment Methodology for Problem and Project Identification. A Commodity Systems Assessment Methodology for Problem and Project Identification. A Post-Harvest Loss Assessment. http://ucanr.edu/datastoreFiles/234-1319.pdf.
Matsue, N., Daw, T., & Garrett, L. (2014). Women Fish Traders on the Kenyan Coast: Livelihoods, Bargaining Power, and Participation in Management. Coastal Management, 42(6), 531-554.
Murawski, S., Methot, R., & Tromble, G. (2007). Biodiversity Loss in the Ocean: How Bad Is It? Science (New York, N.Y.), 1281-4, DOI:316/5829/1281b [pii].
Neiland, A. E., & Béné, C. (2013). Poverty and Small-scale Fisheries in West Africa. Springer Science & Business Media.

31
O'Neill, E. D., & Crona, B. (2017). Assistance Networks in Seafood Trade: A Means to Assess Benefit Distribution in Small-scale Fisheries. Marine Policy, 78, 196-205.
Parry, R. (2012). Principles and Applications of Modified Atmosphere Packaging of Foods. Springer Science & Business Media.
Pauly, D., & Watson, R. (2003). Counting the Last Fish. Scientific American, 289(1), 42-47.
Pietrobelli, C., & Rabellotti, R. (2011). Global Value Chains Meet Innovation Systems: Are There Learning Opportunities for Developing Countries? World Development, 39(7), 1261-1269.
Pollnac, R. B., & Poggie Jr, J. J. (2006). Job Satisfaction in the Fishery in Two Southeast Alaskan Towns. Human Organization, , 329-339.
Pollnac, R. B., Pomeroy, R. S., & Harkes, I. H. (2001). Fishery Policy and Job Satisfaction in Three Southeast Asian Fisheries. Ocean & Coastal Management, 44(7-8), 531-544.
Pomeroy, R. S., & Andrew, N. (2011). Small-scale Fisheries Management: Frameworks and Approaches for the Developing World. Oxfordshire, UK and Cambridge, MA: Cabi.
Ponte, S., Kelling, I., Jespersen, K. S., & Kruijssen, F. (2014). The Blue Revolution in Asia: Upgrading and Governance in Aquaculture Value Chains. World Development, 64, 52-64.
Porter, M. E. (1985). Competitive Advantage: Creating and Sustaining Superior Performance. 1985.
Porter, M. E. (1998). Clusters and the New Economics of Competition. Harvard Business Review Boston.
Purcell, S. W., Crona, B. I., Lalavanua, W., & Eriksson, H. (2017). Distribution of Economic Returns in Small-scale Fisheries for International Markets: A Value-Chain Analysis. Marine Policy, 86, 9-16.
Riisgaard, L., Bolwig, S., Ponte, S., Du Toit, A., Halberg, N., & Matose, F. (2010). Integrating Poverty and Environmental Concerns into Value‐Chain Analysis: A Strategic Framework and Practical Guide. Development Policy Review, 28(2), 195-216.
Rogers E. M. (1995). Diffusion of innovations (fourth edition). The Free Press. New York.
Rosales, R. M., Pomeroy, R., Calabio, I. J., Batong, M., Cedo, K., Escara, N., . . . Sarahadil, M. (2017). Value Chain Analysis and Small-scale Fisheries Management. Marine Policy, 83, 11-21.
Rummel, R. J. (1970). Applied Factor Analysis. Northwestern University Press. Evanston.

32
Ryan, B., & Gross, N. C. (1943). The Diffusion of Hybrid Seed Corn in Two Iowa Communities. Rural Sociology, 8(1), 15.
Santos, A. N. (2015). Fisheries as a way of life: Gendered Livelihoods, Identities and Perspectives of Artisanal Fisheries in Eastern Brazil. Marine Policy, 62, 279-288.
Uchida, H. (2017). TURFs, Collective Fishery Management, and Fishery Cooperatives. Bulletin of Marine Science, 93(1), 83-99.
USAID. 2011. Feed the Future FY 2011-2015 Multi-year Strategy. U.S. Government Document Approved February 22, 2011. http://www.feedthefuture.gov/sites/default/files/country/strategies/files/GhanaFeedtheFutureMulti-YearStrategy 2011-08-03.pdf .
Ward, A., & Jeffries, D. (2000). A Manual for Assessing Post-Harvest Fisheries
Losses. Overseas Development Administration. Natural Resources Institute. University of Greenwich.
Washington, S. (2009). Private Standards in Fisheries and Aquaculture: Current Practice and Emerging Issues. GLOBEFISH Research Programme, 97, I.
Weerantunge, N., Snyder, K. A., & Sze, C. P. (2010). Gleaner, Fisher, Trader, Processor: Understanding Gendered Employment in Fisheries and Aquaculture. Fish and Fisheries, 11(4), 405-420.
Wentink, C. R., Raemaekers, S., & Bush, S. R. (2017). Co-governance and Upgrading in the South African Small-scale Fisheries Value Chain. Maritime Studies, 16(1), 5.
WorldFish Center. (2008). Small-scale Capture Fisheries: A Global Overview with Emphasis on Developing Countries: A Preliminary Report of the Big Numbers Project. The WorldFish Center Working Papers.
World Food Summit. (1998). Conference on Attaining the World Food Summit’s Objectives Through a Sustainable Development Strategy Following the Plan of Action at the World Food Summit in 1996. Rome. http://archive.ipu.org/splz-e/rome98.htm.

33
Chapter 2
IMPLEMENTING A VALUE CHAIN IMPROVEMENT IN THE GAMBIAN SOLE FISHERY: CONSEQUENTIAL IMPACTS ON FISHERY
STAKEHOLDERS
by
Kristine Beran1, Richard B. Pollnac2, Elin C. Torell3
Submitted to Marine Policy
1 PhD Candidate, Department of Marine Affairs, University of Rhode Island, RI, 02881, USA, Email: [email protected]. 2 Research Professor, Department of Marine Affairs, University of Rhode Island, RI, 02881, USA, Email: [email protected]. 3 Adjunct Professor, Department of Marine Affairs, University of Rhode Island and Director of International Programs, Coastal Resources Center, University of Rhode Island Graduate School of Oceanography, Narragansett, RI, 02882, USA, Email: [email protected].

34
Abstract
Small-scale tropical fisheries suffer from significant post-harvest losses. This
study applies the value chain and post-harvest loss assessment approach to identify
where and how much sole is subject to post-harvest loss along the supply chain in The
Gambia. Value chain improvement interventions, ice and ice coolers are introduced
on-board fishing vessels to reduce quality-related losses. The study reveals ice reduces
loss and increases revenue for some, not all value chain actors. Overall, fishermen
using ice on-board lost 14 percent less sole than fishermen not using ice. The cost of
ice; however, exceeded the difference in revenue earned on average. Hence, there is
no economic incentive for fishermen to purchase ice at the current market price just
for sole. Fishermen’s use of ice on-board fishing vessels had a statistically significant
positive impact on the buyer’s loss of sole, which became less than one percent. As a
result, a buyer’s revenue nearly doubled on average during the study period. This leads
to the conclusion that post-harvest loss of fish can be reduced in tropical developing
world small-scale fisheries, however, the cost may exceed the benefit for fishermen.
This study also confirmed that, in the case of the Gambian sole fishery, value chain
improvements benefiting the export supply chain does not affect the local market.
Keywords: Value chain, post-harvest loss, small-scale fisheries, fishery improvement
projects (FIPs)

35
Introduction
Small-scale fisheries around the world are increasingly recognized for their
contribution to food security and poverty alleviation (Akande & Diei-Ouadi, 2010;
Food and Agricultural Organization of the United Nations [FAO], 2014; Pomeroy &
Andrew, 2011), yet high levels of post-harvest loss within small-scale fisheries
prevent optimal utilization of natural resources (Akande & Diei-Ouadi, 2010). The
value chain approach was developed to identify where along the supply chain
opportunities exist to maximize value, or profit from products, services or raw
materials in a system (Harland, 1996; Porter, 1985). The value chain concept was
popularized by Michael Porter to help corporations compete more effectively and
maximize returns on investment (Porter, 1985). The value chain concept focuses on
the social distribution of economic growth and the application of this framework is
gaining recognition within development circles and marine policy (Pomeroy &
Andrew, 2011; Macfadyen, Nasr-Alla, Al-Kenawy, Fathi, Hebicha, Diab, Hussein,
Abou-Zeid & El-Naggar, 2012; Hamilton-Hart & Stringer, 2016). Both Hempel
(2010) and Pomeroy and Andrew (2011) apply the value chain concept to small-scale
fisheries operating in a developing world context. Pomeroy and Andrew (2011) stress
that small-scale fisheries in developing countries often fail to capture value due to
quality standards and poor product-holding infrastructure among other constraints. As
the supply of fish from developing countries to the international market increases
according to the FAO (2014), greater attention to quality standards may be warranted.
Small-scale fisheries in developing countries generate most of the world’s fish
landings, yet are highly susceptible to post-harvest quality losses, ranging between 20

36
to 75 percent (FAO, 2014). Post-harvest losses lead to reductions in the quantity,
quality, monetary and/or nutritional value of fish (FAO, 2014). The term post-harvest
refers to the period of time from when a fish is separated from its growth medium
(Morrissey, 1988; Ward & Jeffries, 2000), including the moment a fish is captured in a
net, caught on a hook or in a trap (Ward & Jeffries, 2000). The causes of post-harvest
loss vary from poor hygiene, handling and storage at-sea, on-board, and on shore
(Pomeroy & Andrew, 2011).
Small-scale fishermen and processors in developing countries rarely discard
fish. Rather, their harvest is subject to quality and monetary loss, or foregone revenue
due to poor handling and inefficient processing techniques (Akande & Diei-Ouadi,
2010). The type of loss discussed in this paper relates to quality, or difference between
export and domestic grade quality sole, which in turn is reflected by differences in
market price. All things being equal, fish subjected to deterioration or mishandling is
often sold at a lower or reduced price, not achieving its potential value in the market.
Economic calculations are based on loss in revenue due to quality captured at various
points along the supply chain (Ward & Jeffries, 2000).
Trends in losses vary across the entire fish supply chain and often are neither
quantified nor precisely defined (Akande & Diei-Ouadi, 2010). In the Philippines,
eight value chain studies among small-scale fisheries with domestic and export
markets showed that in general fishermen capture the least profit among actors in
those value chains (Rosales, Pomeroy, Calabio, Batong, Cedo, Escara, Facunla,
Gulayan, Narvadez, Sarahadil & Sobrevega, 2017). This paper examines the impacts
of a value chain improvement intervention that used ice and ice boxes, or coolers on-

37
board artisanal canoes on post-harvest quality loss of export-oriented sole in The
Gambia. The study combines elements of the value chain approach (Porter, 1985,
Gereffi & Fernandez-Stark, 2011, Kaplinsky, 2000; Kaplinsky & Morris, 2001) and
the United Nations Food and Agricultural Organization’s (FAO) post-harvest loss
assessment approach (Akande & Diei-Ouadi, 2010) to determine where losses occur
along the chain, who benefits, and where potential entry points for economic gains in
small-scale tropical fisheries exist.
The questions this study addresses are 1) does the use of ice on-board fishing
vessels reduce fishermen’s post-harvest quality loss of sole; 2) do reductions in post-
harvest loss lead to an increase in fishermen’s revenue from sole; 3) does purchasing
iced sole from fishermen reduce buyer’s post-harvest quality loss; 4) do reductions in
post-harvest loss increase buyer’s revenue from sole purchases; and 5) does sole have
economic importance to local processors. Sole is almost exclusively harvested for
export. The term export loss is introduced in this study to define product which does
not meet export quality standards and fails to achieve significant export trade earnings.
Export revenues from fish trade contribute to national and local economies in
developing countries (Bostock, Greenhalgh & Kleih, 2004), however, there is an
argument that wealth generated through trade does not necessarily trickle down to
those extracting resources (Béné, Lawton & Allison, 2010). This study differs from
recent value chain studies in small-scale fisheries in developing countries because it
considers the impact of an export-oriented value chain improvement on local trade and
consumption of sole.

38
The Gambian Sole Fishery
The Gambia is a small coastal country surrounded by the Republic of Senegal
on three sides. Like Senegal, it is situated in the highly productive upwelling zone of
the Canary Current Large Marine Ecosystem (CCLME) and benefits from cold,
nutrient rich waters. The CCLME flows southward from the Canary Islands and
Morocco, reaching the Senegambia plateau in March and April. This coincides with
the peak season for landings of many commercial fish species, including sole
(Fafanding, Tobey & Drammeh, 2010). Fishing is a major source of food and
employment in The Gambia (Belhabib, Asberr, Zeller, & Pauly, 2013). Small-scale
fisheries account for the majority of fish landed and contribute significantly to income
generation, exports and food security for coastal communities where most Gambians
live (Belhabib et al., 2013).
Sole is commercially processed to export specifications and shipped frozen on
container ships to markets within the European Union, South Africa and Asia (The
Gambia Department of Fisheries [DoFish], 2015; R. Eenennaam, personal
communication, October 23, 2017). Sole which does not meet export-quality
standards, determined by organoleptic and bacteriologic specifications (including
temperature of fish upon delivery to the export processing plant), is purchased at a
lower ex-vessel price by local fish processors. Local fish processors smoke, dry or salt
fish to preserve and sell for domestic consumption. Ninety-nine percent of all sole
exports are shipped frozen (R. Eenennaam, personal communication, October 23,
2017). Eight-five percent of exports are processed as value-added fillets and the
balance is exported as whole, head-on fish. The proportions are likely to shift in the
coming years given the growing demand for whole, head-on sole from China and
39
because it requires less labor to process (R. Eenennaam, personal communication,
October 23, 2017).
A Management and Market in Transition
Prior to 2008, the Gambian sole fishery operated as a de facto open access
fishery with little to no management measures in place (United States Agency for
International Development BaNafaa Project [USAID/BaNafaa], 2014). Since then,
various fisheries improvement projects have been implemented to improve ecological
productivity and market access through market-based approaches and collective,
rights-based fisheries management. These improvement projects resulted in a co-
management plan and a fisheries improvement project (FIP) work plan for sole
(Fishery Co-Management Plan for The Gambia Sole Complex, 2012).
The co-management plan, adopted by stakeholders in 2012 and as law in 2013,
declares a special management area from shore out to nine nautical miles (Fishery Co-
Management Plan for The Gambia Sole Complex, 2012). It also grants community-
based management institutions, the National Sole Fishery Co-Management Committee
(NASCOM) and currently nine Landing Site Co-management Committees
(LACOMs), territorial use-rights and management responsibilities for sole and marine
catfish to these groups in this area (Fishery Co-Management Plan for The Gambia
Sole Complex, 2012). Currently, this fishery remains open, managed access and input
measures such as closed areas, seasons, minimum sizes, and gear restrictions are used
to regulate it (USAID/BaNafaa, 2014). The co-management governance structure is
illustrated in Figure 2.1. The function of the governance structure in Figure 2.1 is to

40
jointly manage the sole fishery from shore to nine nautical miles in accordance with
the Fishery Co-Management Plan for The Gambia Sole Complex (2012).
Figure 2.1. Governance structure for the sole fishery in The Gambia
A combination of management and market-based incentives in the Gambian
sole fishery demonstrates sustained engagement among multiple stakeholders in the
supply chain.
Table 2.1. Fisheries improvement projects in the Gambian sole fishery.
Year Lead agency (Implementing partners) Donor Major activities
2008 Gambian Artisanal Fisheries Development Association
Marine Stewardship Council (MSC) MSC pre-assessment
2009-2014
University of Rhode Island
(Worldwide Fund for Nature, Department of Fisheries)
United States Agency for International
Development (USAID)
Co-management committees and plan
Data collection Stock assessment
Value chain analysis Fishery Performance Indicators
2015 National Sole Fishery Co-management Committee
Resources Legacy Fund/Sustainable
Fisheries Fund MSC pre-assessment
2015-2016
University of Rhode Island
(National Sole Fishery Co-management Committee, Department of Fisheries)
Rockefeller Foundation FIP+1 project
Value chain improvement Vessel registration
1 The FIP+ was a precursor to the accredited Fishery Improvement Project (FIP) work plan.

41
2017
University of Rhode Island
(National Sole Fishery Co-management Committee, Department of Fisheries)
Resources Legacy Fund/Sustainable
Fisheries Fund
FIP work plan http://fisheryprogress.org/fip-
profile/gambia-sole-bottom-set-gill-net
(Source: Fafanding et al., 2010; USAID/BaNafaa, 2014; Gambia sole, March 21, 2018, Fisheryprogress.org, URL: https://fisheryprogress.org/fip-profile/gambia-sole-
bottom-set-gillnet)
A value chain analysis conducted under the USAID funded BaNaafa project
revealed constraints for economic growth (Fafanding et al., 2010). The constraints
included inadequate cold chains, or temperature-controlled processes in the supply
chain (Fafanding et al., 2010). A baseline assessment using Fishery Performance
Indicators (FPIs) was conducted in 2012 for Gambian sole (USAID/BaNafaa, 2014;
Anderson, Anderson, Chu, Meredith, Asche, Sylvia, Smith, Anggraeni, Arthur &
Guttormsen, 2015). According to wealth enabling indicators identified by Anderson et
al. (2015), the Gambian sole fishery scored low for governance, including
participation in co-management and management methods. It also underperformed in
the post-harvest sector based on metrics used to measure wealth generation. These
measures included shrink or loss, product improvement, sanitation and capacity
utilization rate (Anderson et al., 2015). Fisheries improvement and development
projects have been implemented in these areas since 2010 as shown in Table 2.1
(USAID/BaNafaa, 2014; Fafanding et al., 2010).
A value chain improvement project was implemented in 2015 to test the
economic incentive component of the Fishery Improvement Project+ (FIP+). The
“FIP+” concept is a market-based model conceptualized under the Rockefeller
Foundation’s Oceans and Fisheries Initiative. Suitable for small-scale, export-oriented
fisheries in developing countries, the FIP+ model incorporates socio-economic

42
incentives (symbolized as the +), including livelihood support, social safety net
programs, and simple value chain improvements to the traditional FIP. The purpose of
the + components is to boost economic gains to small-scale fishers, which then acts as
an incentive for fisheries management. The ice project intervention that is the basis for
the study described in this paper aimed to socially and economically benefit fishers
and other value chain actors, by using ice and ice coolers to strengthen on-board
handling of fish, improve fish quality, and reduce export loss of sole – and in the long
run strengthen local support for the FIP process. The potential impact on local fish
processors was also investigated in this study. The sole value chain for both the export
and local market is illustrated in Figure 2.2.
Figure 2.2. Sole value chains.
The study was designed based on recommendations from previous projects and
was implemented by the Department of Fisheries (DoFish), the National Sole Fishery
Co-Management Committee and the Atlantic Seafood Company (TASC), key
stakeholders in the Gambian sole fishery representing state, civil society and market
sectors.
NETS
CANOE
OUTBOARD ENIGNES
ICE COOLERS
ICE
FUEL
Export (86%)
Industrial • Frozen
International • Retail markets • Restaurants
Landings
ICE
NO ICE
Local (14%)
Small-scale • Fresh • Smoked • Dried • Salted
Local-Regional • Traditional market • Households
INPUTS
FISHERS
BUYERS
PROCESSORS
CONSUMERS

43
Methodology
A multi-methods approach combining quantitative and qualitative methods
was used to determine post-harvest loss of sole within the supply chain. Data
collection was guided using elements from the FAO’s PHLA approach (Akande &
Diei-Ouadi, 2010), including the Questionnaire Fish Loss Assessment Method
(QLAM), Exploratory Fish Loss Assessment Method (EFLAM) and Load Tracking
method (LT). These methodologies are used by Diei-Ouadi & Mgawe (2011). At the
outset of the study, focus groups with fishermen and buyers were held to inquire about
post-harvest loss at-sea. The research team also held key informant interviews with ice
plant managers and a representative from the only ice box manufacturer in The
Gambia to assess the availability and cost of ice and ice boxes. Instruments used
during the survey period included new weighing scales, locally made ice boxes, data
sheets for enumerators (Appendix A), and prepaid vouchers for purchase of ice
provided to fishermen in the treatment group at both study sites. The instruments were
pre-tested days prior to beginning the study. Data sheets were regularly collected by
the Department of Fisheries Statistics Unit. Post-harvest loss data from each study site
were entered weekly and sent to the University of Rhode Island for review during the
six-week field-based study. The first author was on-site for half of the study period to
monitor research.
Brufut and Gunjur were selected as the study sites based on criteria that
included having functioning ice plants adjacent to the sites and the availability of data
collectors, fluent in local languages, trained by the Department of Fisheries Statistics
Unit. A map of the study sites and special management area is shown in Figure 2.3.

44
Figure 2.3. Map of study sites and special management area for sole, The Gambia.
This study was quasi-experimental in the sense that participants were not
designated at random to the control (fishers not using ice) and treatment (fishers using
ice group (Bernard, 2011). A nonprobability sampling technique (purposive) was used
to determine the sample size. The sample size was determined by NASCOM and other
relevant stakeholders to meet certain criteria and compliance requirements. This
technique was preferred because fishers were selected based on the following criteria
that included 1) willingness to participate voluntarily over the duration of the study
and 2) compliance with a new fishing vessel registration scheme (i.e. the participants
had to be registered). The fishermen identified as meeting the criteria were verified by
LACOM members and the Department of Fisheries. In total, twenty fishermen were
selected, ten at each site. At each site, five fishermen used ice on-board their fishing
vessels, whereas the control group of five fishermen fished without ice on-board.
Ideally, the sample size would’ve been larger (n=30), however, due to logistics and
financial constraints a larger sample size was not possible. The two groups were
similar in terms of vessel size, types of fishing gear, and outboard engines. In total, ten

45
buyers participated in the study – five at each site. The buyers, which are men, were
selected based on their affiliation with fishermen and the processing plant.
The unit of analysis is post-harvest loss (calculated as proportion lost) to
export at the individual fisherman and buyer level. The level of measurement for
physical loss is kilograms, an interval variable. The measurement for monetary loss is
calculated in Dalasi, the local currency, also considered to be an interval variable. The
dependent variable is proportion of sole lost at the individual fisherman boat level and
the independent variable is use or non-use of ice. Landings data were collected over 46
consecutive days in August and September, 2015. After the treatment with ice, a
survey questionnaire was administered to individual fishermen to determine perceived
benefits and challenges posed by the use of ice and ice boxes on-board fishing vessels.
To assess the impact of an export-oriented value chain improvement on local
trade and consumption of sole, semi-structured interviews were conducted among a
representative quota sample of 40 local fish processors, 20 in Brufut and 20 in Gunjur.
These interviews used an interview schedule and picture cards of common types of
fish caught and processed in The Gambia, including sole. A representative sampling
technique was used based on geographic locations of processing sheds in relation to
their socio-economic status. More affluent fish processors were located closest to the
beach and less affluent, based on the structure of their sheds, were located furthest
from the beach.
Upon landing each day during the study period, data collectors weighed
individual fisherman’s sole catches on scales. Buyers also weighed sole purchases
nearby. The processing plant used their own vehicle to collect sole purchases from

46
buyers at each study site daily. Individual weights and prices of good (export grade)
and poor-quality (non-export grade) sole were recorded on data sheets at various
nodes along the supply chain. Quality scores were classified as good if considered
acceptable for export and poor if rejected for export. All recorded weights and prices
were entered into an Excel spreadsheet by the statistics unit at the Department of
Fisheries. A total of 920 landings were recorded (20 fishermen x 46 days) and
collected. Data were analyzed using student’s t-test on SYSTAT version 13.1.
Results
Total weight in kilograms (kg) and proportion loss of sole was captured at
nodes along the supply chain and given quality scores at both study sites during the
entire study period shown in Table 2.2 and 2.3 respectively. Overall denotes kilograms
and proportion of sole sold to the processing plant. Differences in total landings
between study sites could be attributed to the number of nets used per vessel, a factor
not controlled for in this study.
Table 2.2. Quality scores of sole landings in kilograms (kg).
Good2 Poor3 Total Gunjur Fisherman 1,140.3 107.4 1,247.7
Buyer 1,135.8 4.5 1,140.3 Overall 1,135.8 111.9 1,247.7
Brufut Fisherman 1,579.1 319.1 1,898.2 Buyer 1,578.0 1.1 1,579.1 Overall 1,578.0 320.2 1,898.2
Overall both sites 2,713.8 432.1 3,145.9
2 Export grade. 3 Non-export grade.

47
Table 2.3. Quality scores of sole landings by proportion (%).
Good Poor Total Gunjur Fisherman 91.4% 8.6% 100%
Buyer 99.6% 0.4% 100% Overall 91.0% 9.0% 100%
Brufut Fisherman 83.2% 16.8% 100% Buyer 99.9% 0.1% 100% Overall 83.1% 16.9% 100%
Overall both sites 86.3% 13.7% 100%
Fishermen’s proportion loss of sole
Overall, ice on-board vessels fishing made a difference in total proportion loss
of sole (Table 2.4). The difference between fishermen using ice and those not using
ice on-board vessels is statistically significant for the total sample. Between fishing
sites, however, the total proportion of loss differs. In Brufut, ice did not have a
statistically significant impact on total proportion loss of sole, whereas in Gunjur the
use of ice is statistically significantly correlated with total proportion loss of sole. The
distribution and difference of proportion loss of sole clearly indicates variability
between sites.
In Table 2.4, mean proportion loss is calculated using total kilograms of sole
caught divided by total kilograms of export loss per individual fisherman and by site
during the study period. A two-sample t-test (one-tailed) was used to analyze
differences in proportion loss of sole.

48
Table 2.4. Average fisherman’s proportion loss of sole.
Site Mean proportion loss of sole t P-value df No ice Used ice Both sites 0.22 0.08 7.25 <0.001 566 Brufut 0.20 0.16 1.27 0.10 196 Gunjur 0.23 0.04 7.84 <0.001 368
The use of ice made a difference in proportion loss of red sole fish during the
study period (Table 2.5). The difference between fishermen using ice and those not
using ice on-board vessels is statistically significant for the total sample. Between
fishing sites, ice did not have a statistically significant impact on proportion loss of red
sole in Brufut, whereas in Gunjur, use of ice is statistically significantly related to
proportion loss of red sole in Gunjur. Once again this clearly indicates between site
variability. We find the same patterns of relationships for black sole (Table 2.5).
Impact of the use of ice clearly differs in the two communities and these differences
are discussed in the conclusion of the paper.
Table 2.5. Average fisherman’s proportion loss of red and black sole.
Site Mean proportion loss of sole t P-value df No ice Used ice Red sole
Both sites 0.18 0.07 5.18 <0.001 536 Brufut 0.18 0.16 0.36 0.36 179 Gunjur 0.19 0.02 7.08 <0.001 355
Black sole Both sites 0.35 0.19 3.98 <0.001 358 Brufut 0.32 0.25 1.38 0.08 169 Gunjur 0.37 0.14 4.03 <0.001 187
Fishermen’s revenue from sole
Overall and by site, fishermen using ice on-board vessels earned more from
sole landings when excluding the cost of ice (Table 2.6). The differences are

49
statistically significant (Table 2.6). This can be partially explained by a lower
proportion loss of sole. This study only measures revenue from sole, not other species
caught. Average daily revenue from sole is calculated multiplying total kilograms of
export-grade red and black sole landed daily by price per kilogram, minus any sole
rejected by the buyer (in kilograms). Revenue from sole also includes the price paid to
fishermen by local, small-scale processors for non-export grade sole. Table 2.6
represents fishermen’s average daily revenue from sole during the study period. A
two-sample t-test (one-tailed) was used to analyze differences in fishermen’s average
daily revenue from sole.
Table 2.6. Average fishermen’s daily revenue from sole excluding price of ice.
Site Revenue from sole t P-value df No ice Used ice Both sites 129.50 229.31 -4.74 <0.001 732 Brufut 219.36 292.20 -1.71 0.05 331 Gunjur 56.57 175.81 -10.00 <0.001 399
Sole prices vary by site and quality. The ex-vessel, export-grade price of sole
in Brufut is 53.2 Dalasi4 per kilogram whereas it is 40 Dalasi per kilogram in Gunjur.
The difference in ex-vessel price between sites is result of a credit scheme extended to
fishermen by buyers in Gunjur. Ex-vessel, export-grade prices are typically based on
supply and demand in existing European markets and emerging markets in Asia,
primarily driven by China (personal communication, TASC). Multiple factors, not
examined in this study determine pricing for non-export grade sole. Difference in
pricing is factored into the dependent variable, revenue from sole. The price of ice is
excluded in the dependent variable in Table 2.6. Table 2.7 represents fishermen’s 4 Dalasi (GMD) is the Gambian currency (1 USD/39 GMD in September, 2015).

50
average daily revenue from sole during the study period as calculated in Table 2.6;
however, this analysis includes the price of ice.
Overall and by site, the cost of ice exceeded the difference in revenue earned
on average for fishermen using ice (Table 2.7). There is not a statistically significant
difference in average revenue earned from sole for fishermen using and not using ice
after deducting the cost of ice. Ice plants sell ice to fishermen in Gunjur and Brufut by
the basket, a local unit of measure. Each basket carries between 30-40 kilograms of
ice. The price of ice varies by site. In Brufut, the price for one basket of ice is 100
Dalasi, and in Gunjur, 130 Dalasi. During the study period, ice was provided daily to
the treatment group (fishermen using ice on-board vessels).
Table 2.7. Average fishermen’s daily revenue from sole including price of ice.
Site Revenue from sole t P-value df No ice Used ice Both sites 129.50 113.09 0.77 0.78 732 Brufut 219.36 192.20 0.64 0.74 331 Gunjur 56.57 45.81 0.90 0.82 399
Buyer’s proportion loss of sole
Buyers purchase red and black sole from fishermen at fish landing sites and
sell it to the processing plant for export. Overall, the use of ice on-board fishing
vessels had a statistically significant (p = 0.05, one-tailed test) impact on the buyer’s
proportion loss of sole (Table 2.8). A buyer’s proportion loss was calculated dividing
total kilograms of red and black sole rejected at the factory by total kilograms
delivered to the factory. In Gunjur, the use of ice on-board fishing vessels had a
statistically significant (p = 0.03, one-tailed) impact on the buyer’s proportion loss of
sole (Table 2.8). In Brufut, ice did not have a statistically significant impact on a

51
buyer’s export loss. Compared to fishermen’s proportion loss of sole, there is less
variability overall and between sites among buyer’s proportion loss of sole. This could
be attributed to better quality post-harvest sole resulting from on-board use of ice.
Table 2.8. Average buyer’s proportion loss from sole based on fishermen’s use of ice.
Site Mean proportion loss of sole t P-value df No ice Used ice Both sites 0.008 0.002 1.64 0.05 546 Brufut 0.001 0.002 -0.40 0.65 196 Gunjur 0.012 0.002 1.84 0.03 348
Buyer’s revenue from sole
Table 2.9 represents buyer’s average daily revenue from sole during the study
period. This study only measures a buyer’s revenue from sole, not other species
purchased. A buyer’s average daily revenue from sole is calculated multiplying total
kilograms of export-quality red and black sole delivered to the factory minus any sole
rejected by the factory (in kilograms) multiplied by price per kilogram paid by the
factory. The price paid by the factory used for the study was 72.5 Dalasi/kg, the
average of the range for the period (70-75 Dalasi/kg).
Table 2.9. Average buyer’s daily revenue from sole based on fishermen’s use of ice.
Site Revenue from sole t P-value df No ice Used ice Both sites 187.49 351.71 -5.61 <0.001 732 Brufut 292.59 392.17 -1.73 0.04 331 Gunjur 102.19 317.30 -9.73 <0.001 399
Buyers ice sole upon purchase at the fishing site and during delivery to the
factory. Unlike fishermen, buyers are provisioned with ice from the factory; therefore,
they do not pay for ice. Overall and by site, the difference in a buyer’s revenue earned

52
from sole obtained from fishermen using ice and those not using ice on-board vessels
is statistically significant (Table 2.9).
Gambia fish processors survey
The Gambia is nutritionally dependent upon fish (Allison, Perry, Badjeck, Neil
Adger, Brown, Conway, Halls, Pilling, Reynolds & Andrew, 2009). It accounts for 59
to 67 percent of total animal protein consumed (Allison et al., 2009). Processing fish is
an important economic activity for women, it is estimated 80 percent of fish
processors in The Gambia are women (United Nations, 2014). In this survey, all but
one respondent was female (N=40). The mean number of years processing fish was 25
among survey respondents (SD 15.71).
To determine the economic importance of sole to the domestic market, local
fish processors were asked to list types of fish purchased on an average yearly basis
and rank them from greatest to least. The unit of measure used to rank types of fish
purchased was baskets. Accuracy of the unit of measure was not the focus of this
survey, rather, types of fish listed were. The first type of fish listed is assigned a score
of seven (indicating most important, the highest rank being seven) followed by lower
numerical values assigned to other types of fish purchased. Fish not mentioned receive
a rank of zero.

53
Table 2.10. Difference between ranks of fish at two landing sites for sole in The
Gambia.
Type of Fish Mean rank Mean
difference Mann-Whitney U test statistic p-Value Brufut (n=20) Gunjur (n=20)
Sardinella 0.25 5.65 -5.40 22.00 <0.001 Catfish 6.10 4.55 1.55 305.50 0.002 Bonga 0.45 5.60 -5.15 28.50 <0.001 Butterfish 0.25 0.60 -1.20 181.00 0.324 Stingray 3.85 1.95 1.90 291.00 0.008 Ladyfish 1.80 0.40 1.40 254.00 0.046 Sompat 0.85 0.70 0.15 216.50 0.523 Banda 1.40 0.05 1.35 253.00 0.030 Sole* 0.00 0.00 0 - - Mix of species* 0.00 0.45 0 - - Toofish 1.25 0.85 0.40 215.50 0.594 Grouper 0.60 0.10 0.50 220.50 0.287 Anything* 0.25 0.00 0 - - *Denotes N is too small for calculating statistic Number in parentheses indicates N associated with the rank at each site
A Mann-Whitney U test was used to determine whether significant differences
exist between landing sites in terms of the ranking assigned to the different species.
Sole is not listed as a type of fish purchased for domestic consumption using
traditional processing methods (Table 2.10). While 90 percent of survey respondents
stated that the ranking assigned to different species changes throughout the year, sole
remained unlisted. According to respondents, ranks changed throughout the year due
to seasonal upwelling and spawning cycles, which impacts the amount and type of fish
landed. For example, catfish was the most common type of fish purchased in Brufut,
while sardinella and bonga were the most common types of fish purchased in Gunjur.
This difference may be attributed to many factors, such as gear types or demand by
site. The two most common types of fish preferred for household consumption are
catfish and grouper.

54
Economic importance of fish processing
Ninety-five percent of all fish processors surveyed (n=40) stated processing
fish is their only source of revenue. Others partially depend on home gardens. Table
2.11 indicates the percentage of revenue derived from fish processing in relation to
overall household income. Higher revenues derived from fish processing in Brufut
than Gunjur can possibly be attributed to higher landings (Table 2.2) or its proximity
to Banjul, a major fish market and the capital of The Gambia. In Brufut, 90 percent of
the processors stated that they contribute 50 percent or more to overall household
income whereas only 50 percent contribute to the same degree in Gunjur. The
difference is statistically significant (Table 2.11).
Table 2.11. Contribution of fish smoking to overall household income by fish
processors.
Contribution to overall household
income
Landing site
Brufut % Gunjur % Total N, processors
25-50% 10.00 50.00 30.00 12.00 50-75% 50.00 25.00 37.50 15.00 75-100% 40.00 25.00 32.50 13.00 Total 100.00 100.00 100.00
N 20.00 20.00 40.00 Chi-square value = 7.69, DF = 2, p-Value = 0.02
Cramer’s V value = 0.44
Respondents were asked if sole destined for export impacts the domestic
market for sole. In Brufut, fish processors stated they were not impacted by sole
exports, whereas in Gunjur, 40 percent stated sole destined for export markets impacts
their business because “less catfish is landed (and the price is higher) when more sole

55
is caught.” The difference is statistically significant between landing sites (Table
2.12).
Table 2.12. Impact of sole exports on local trade.
Do sole exports affect your business?
Landing site
Brufut Gunjur Total N
No 100.00 60.00 80.00 32.00 Yes 0.00 40.00 20.00 8.00 Total 100.00 100.00 100.00
N 20.00 20.00 40.00 Chi-square value = 10.00, DF =1, p-Value 0.002
Yates Corrected Chi-square value = 7.66, DF = 1, p-Value = 0.006 Fisher Exact Test p-Value = 0.003
Phi = 0.50
Discussion
Fish is highly susceptible to post-harvest loss in small scale fisheries in
developing countries where the use of ice on-board is limited. Losses are rarely
quantified or precisely defined; however, this study defined quality-related losses as
export loss, or foregone revenue as a result of failing to meet higher quality standards.
Results from this study show that the quality-related losses in the supply chain were
approximately 9 to 17 percent (Table 2.3). This range is below or slightly below the
post-harvest loss range of 20-75 percent cited by the FAO (2014).
This study contributes to the growing literature on the distribution of profits, or
revenue from sales of fish among actors in the value chain in small-scale fisheries. The
value chain approach is a tool which can be used to reveal the distribution of economic
benefits across a chain. Using the approach showed that icing fish on-board – a simple

56
value chain improvement intervention aimed to boost economic gains to small-scale
fishermen – provided more economic benefits to buyers than fishermen.
Fisherman’s quality loss
Overall, fishermen using ice on-board lost 14 percent less sole on average due
to quality than fishermen not using ice. There was variability between sites and
species (Table 2.4 and 2.5), however, it was not statistically significant between sites.
Interviews with fishermen as key informants provided some explanation for the
comparatively higher quality losses of black sole reported during the study period.
Fishermen in Brufut stated that they argue with buyers about quality mostly with
regard to black sole because it spoils more easily. According to one key informant,
black sole loses body fat after spawning—making it more prone to deterioration.
Another fisherman explained that black sole has thicker skin and therefore, it takes
longer for ice to penetrate the fish. Black sole is reportedly caught furthest from shore;
and it may hang and deteriorate in the net longer in warmer sea temperature before
reaching the buyers. The average sea temperature at the time of this study was 28
degrees Celsius (https://seatemperature.info). Delays in hauling fish from the net can
contribute to post-harvest loss (FAO, 2014), a factor not adequately controlled for and
a limitation in this study. Overall and by site, the cost of ice exceeded the difference in
revenue earned on average for fishermen using ice for sole (Table 2.7). Based on the
prices of fish and ice alone, there is no economic incentive to purchase ice just for sole
at the current market price. This study only calculated revenues from sole because it is
an important export commodity with a unique value chain. However, fishermen catch
other fish species in addition to sole and for a better understanding of the financial

57
gains of using ice within the fisher-node of the value chain, future research should
look at the impacts of treating the entire catch with ice, not just sole.
Buyer’s quality loss
On average, a buyer purchasing sole for export from a fisherman using ice lost
less than one percent during the study period. Compared to fishermen, there is less
variability overall and between sites for the buyer’s mean proportion quality loss of
sole (Table 2.8). The minimal loss incurred by buyers could be explained as a result of
better-quality sole entering the value chain, or because they are more discerning
buyers. Once purchased, buyers reportedly assume the loss for any sole rejected at the
processing plant because there is no significant local market for sole. A buyer’s
average daily revenue related to buying from boats using ice nearly doubled in this
study (Table 2.9). Overall and by site, the difference in a buyer’s revenue from sole
based on the fishermen’s use of ice is statistically significant (Table 2.9). Buyers
purchasing sole for export are provisioned with ice from the processing plant in return
for the delivering fish. Therefore, they do not incur the additional cost of ice and as a
result capture more economic benefit. This finding is consistent with the literature that
economic benefits are accrued by buyers, traders and exporters more so than small-
scale fishermen.
Impact of exports on the local market
An important consideration in this study was the impact of increasing the
proportion of fish going to exports on local trade and consumption of sole. Results
from this study suggest that the intervention did not impact either. Sole was not ranked
as economically important species to local and regional markets and it was not

58
preferred for household consumption. Hence, there is no perceived loss of supply
(Table 2.10). According to respondents in Gunjur, exports of sole impact their local
market more than in Brufut (Table 2.12). In Brufut, respondents categorically stated,
“sole has a different market and is not our specialty.” In Gunjur, respondents felt
increased landings of sole (for export) resulted in less catfish which is desired locally.
Further studies might explore differences with respect to catfish landings between
sites.
The intervention to improve the value chain of sole economically favored
buyers more than fishermen but it did not appear to impact the local trade and
consumption of sole. For buyers and exporters, there is an economic incentive to
purchase iced sole because it results in better quality fish and yields more kilograms
for export. For fishermen, however, the economic incentive is eroded given the current
cost of ice. In many small-scale fisheries, fishermen target multiple species. Future
studies might examine if there are economic incentives to use ice for all species
caught. While the cost of ice for fishermen outweighed the economic benefits, the cost
of ice coolers was not perceived as prohibitive. The coolers are locally manufactured,
used by other fishermen, and bear similarities to those used by fishermen in Senegal.
A follow-on study could examine the durability or diffusion of ice coolers among
fishermen in The Gambia.
Conclusion
A dilemma facing developing-country small-scale fisheries engaged in the
early stages of the FIP process is attracting more people into the fishery in the absence
of controlled access or other exclusionary rights. Overcapacity and overfishing are

59
likely if access is not controlled – especially if there is an increase in revenue (e.g.
premium prices for higher quality fish) or increased fishing efficiency (e.g. allowing
more time at sea as a result of carrying ice on-board). This study recognizes those
risks but also acknowledges that the scale of impact seen in this study is small by
commercial standards. The management of the Gambian sole fishery is still in
transition. It went from little to no fisheries management prior to 2008, toward
collective, regulated fisheries management at present.
Fisheries improvement projects (FIPs) are designed to provide long-term
biological benefits. However, there is less emphasis placed on the short-term socio-
economic needs of those engaged in the value chain. Implementing the a FIP+ project
in The Gambia generated multiple lessons.
First, the study confirmed that ice improves quality and reduces export loss,
which is an economic benefit to the fishery. Fishermen reported that iced sole is
sought after by buyers who capture more economic benefits than fishermen. A lesson
is that if value chain improvements benefit some more than others in the value chain,
there may be cost-sharing opportunities such as negotiating a reduced cost of ice for
fishermen. This could be done through public or private partners, or a combination of
the two, or paying fishermen a premium for icing sole at-sea to offset the cost of ice
incurred by fishermen.
Second, fishermen revealed indirect benefits that were not measured
quantitatively in the study. Indirect benefits include: efficiencies, buy-in, and behavior
change. Fishermen stated that using ice contributed to fuel efficiency, because when
carrying ice on-board, fishermen perceived a lower fuel burn rate by not having to

60
hurriedly return to shore to sell their catch. The use of ice coolers contributed to vessel
cleanliness and hygiene, preventing injuries such as potentially infection producing
puncture wounds and cuts caused by broken shells and fish fins on deck. The use of
ice coolers made off-loading fish upon landing, quicker. Hence, a lesson is that using
ice onboard generated indirect and non-economic benefits that may make it
worthwhile even when it does not make direct economic sense to use ice.
Third, understanding the balance of control that exists within a supply chain is
important. One fisherman quoted a Gambian proverb to describe a fisherman’s
financial dependency on buyers, translated as “if I lend you my eye, I will direct you to
where you should look.” The underlying meaning is that fishers were dependent on
buyers to weigh and purchase their catch, which made them vulnerable to cheating.
However, the ice project was designed to increase transparency and collaboration
between fishers and buyers. By weighing the catch together, fishers learned that they
were entitled to participate in this process. Empowering the fishers to participate in the
weighing process was an unanticipated positive result as it leveled the relationships
between value chain actors.
The ice project (+) component of the FIP further consolidated supply chain
partnership and increased “buy-in” for future research and development projects. It
was as a precursor to the accredited FIP work plan, completed in 2017. Both were
implemented by key stakeholders in the Gambian sole fishery representing state, civil
society and market sectors. The ice project helped strengthen the supply chain and
built trust within it, which gave the broader FIP process a boost. It would be
interesting to assess how much the ice project strengthened the broader FIP process.

61
One idea is to repeat a baseline study conducted in 2012. The study, which used
Fishery Performance Indicators developed by the World Bank, found that the
Gambian sole fishery underperformed in post-harvest industry performance. Given the
improvements made in the value chain, a repeat application might reveal that the FIP+
initiative acted as an incentive to move towards more sustainable management of the
sole fishery.

62
Appendix A
Survey instruments
NATIONAL SOLE FISHERY CO-MANAGEMENT COMMITTEE
DATE:…………………………………
ENUMERATOR:………………………………………………………
ICE □ NO ICE □
FISHERMAN:…………………………………………………………..
SITE:…………………………… BOAT ID:…………………………….………….
TIME FISH ON:……………………………………...…
OBSERVATION/REMARKS:…………………………………………….………………………………………………
RED SOLE
BLACK SOLE
GOOD QUALITY
POOR QUALITY
GOOD QUALITY
POOR QUALITY
TOTAL CATCH
PRICE/KG
REJECTS BY BANA-BANA

63

64
Narragansett, Rhode Island 02882, USA
Email: [email protected]
Fish Processing Survey The purpose of this survey is to identify common types of fish processed at fish landing sites in The Gambia. The aim of this survey is to better understand the socio-economic importance of fish processing to households. This survey targets fish processors working at landing sites where fish is delivered after it has been caught at- sea.
Instructions: The interviewer will ask questions from the survey sheet and record the respondents answer either by checking off a box () or writing a respondent’s answer in the spaces provided. The survey will take approximately 15 minutes to complete.
Gender
Female Male
Landing site
Brufut Gunjur Other:
Number of times you have been asked to participate in a survey about your work?
0 times | 1+ times
Is fish processing your only source of individual income?
Yes | No
If no, list other sources of income:
Socio-economic information
Demographic information

65
On average, what percent of your individual income from fish processing contributes to your overall household income?
Less than 25% 25-50% 50-75% 75-100%
Does your daily income from fish processing vary throughout the year?
Never Sometimes Often Always
How many years have you been a fish processor?
years
How far do you live from this landing site?
0 to 10 minutes 5 to 20 minutes 20 to 40 minutes
How do you get from your house to the landing site to process fish?
Walk | Taxi Bus | Other:
Do any of your family members fish at this landing site?
Yes | No
If yes, check all that apply
Husband | Father Brother | Son Mother | Sister Cousin | Other:
Which of these family members live in your household?
Husband | Father Brother | Son Mother | Sister Cousin | Other:
How many people live in your household all year-round?
1-3 people 3-6 people 6 or more people
Do you buy fish from the fishermen at the beach?
Yes | No
What is the biggest challenge for you to get fish to process?
Explain:
Fish processing information

66
Do you have purchase agreements with specific boats?
Yes | No
List the types of fish you purchase in order of greatest (1.) to least (6.) quantity (kilograms, pieces, baskets). Circle all methods of processing that apply next to each type of fish.
Does this order change during other times of the year?
Yes | No
List the types of processed fish you sell the most of (in terms of volume, i.e. kilograms, pieces, baskets). List the most types of fish you sell (1.) to the least types of fish you sell (6.). Circle all methods of processing that apply next to each type of fish.
Does this order change during other times of the year?
Yes | No
Do you bring the fish that you process home to eat?
Yes | No
Fish type Processing method 1. Smoke/Dry/Salt/Other: 2. Smoke/Dry/Salt/Other: 3. Smoke/Dry/Salt/Other: 4. Smoke/Dry/Salt/Other: 5. Smoke/Dry/Salt/Other: 6. Smoke/Dry/Salt/Other:
Fish type Processing method 1. Smoke/Dry/Salt/Other: 2. Smoke/Dry/Salt/Other: 3. Smoke/Dry/Salt/Other: 4. Smoke/Dry/Salt/Other: 5. Smoke/Dry/Salt/Other: 6. Smoke/Dry/Salt/Other:

67
How important is eating fish on a weekly basis for feeding the family?
Not important Important Very important
What type of fish do prefer to eat in your household?
Explain:
Why do you prefer to eat this type of fish in your household?
Explain:
Does sole (fish) going to the export market in Europe affect your fish processing business?
Yes | No
If yes, please explain how sole going to the export market affects your fish processing business
Thank you for taking the time to respond to this survey. Your time and input is greatly appreciated.
Export information

68
References
Akande, G., & Diei-Ouadi, Y. (2010). Post-harvest Losses in Small-scale Fisheries: Case Studies in Five sub-Saharan African Countries. FAO Fisheries and Aquaculture Technical Paper, (550).
Allison, E. H., Perry, A. L., Badjeck, M., Neil Adger, W., Brown, K., Conway, D., . . . Andrew, N. L. (2009). Vulnerability of National Economies to the Impacts of Climate Change on Fisheries. Fish and Fisheries, 10(2), 173-196.
Anderson, J. L., Anderson, C. M., Chu, J., Meredith, J., Asche, F., Sylvia, G., . . . Guttormsen, A. (2015). The Fishery Performance Indicators: A Management Tool for Triple Bottom Line Outcomes. PloS One, 10(5), https://doi.org/10.1371/journal.pone.0122809.
Belhabib, D., Mendy, A., Zeller, D., & Pauly, D. (2013). Big Fishing for Small Fishes: Six Decades of Fisheries in The Gambia “The Smiling Coast of Africa.”
Béné, C., Lawton, R., & Allison, E. H. (2010). “Trade Matters in the Fight Against Poverty”: Narratives, Perceptions, and (lack of) Evidence in the Case of Fish Trade in Africa. World Development, 38(7), 933-954. DOI: 10.1016/j.worlddev.2009.12.010.
Bernard, H. R. (2017). Research methods in anthropology: Qualitative and Quantitative Approaches. Rowman & Littlefield.
Bostock, T., Greenhalgh, P., & Kleih, U. (2004). Policy Research-Implications of Liberalisation of Fish Trade for Developing Countries: Synthesis report.
Diei-Ouadi, Y., & Mgawe, Y. I. (2011). Post-harvest Fish Loss Assessment in Small-scale Fisheries. A Guide for the Extension Officer. FAO Fisheries and Aquaculture Technical Paper, (559).
Fafanding, S. Fatajo, James Tobey and Ousman Drammeh. (2010). Sole Fishery Value Chain Assessment. Narragansett, RI: Coastal Resources Center, University of Rhode Island. Retrieved from http://www.crc.uri.edu/download/Final_Sole_VCA_Report_August_20101.pdf.
Fishery Progress. (2018). Gambia Sole-Bottom Set Gillnet. Retrieved from https://fisheryprogress.org/fip-profile/gambia-sole-bottom-set-gillnet.
Food and Agriculture Organization of the United Nations (FAO). (2014). The State of World Fisheries and Aquaculture: Opportunities and challenges. Rome. Retrieved from http://www.fao.org/3/d1eaa9a1-5a71-4e42-86c0-f2111f07de16/i3720e.pdf.

69
Gereffi, G., & Fernandez-Stark, K. (2011). Global Value chain Analysis: A Primer. Center on Globalization, Governance & Competitiveness (CGGC), Duke University, North Carolina, USA.
Hamilton-Hart, N., & Stringer, C. (2016). Upgrading and Exploitation in the Fishing Industry: Contributions of Value Chain. Marine Policy, 63, 166-171. http://dx.doi.org/10.1016/j.marpol.2015.03.020.
Harland, C. M. (1996). Supply chain management: Relationships, Chains and Networks. British Journal of Management, 7(s1), S63-S80.
Hempel, E. (2010). Value Chain Analysis in the Fisheries Sector in Africa. Note: Study Carried Out in Collaboration with INFOSA and Funded by the Trade Working Group of the PARTNERSHIP FOR AFRICAN FISHERIES, an AU/NEPAD Programme.
Kaplinsky, R. (2000). Globalisation and Unequalisation: What Can Be Learned from Value Chain Analysis? Journal of Development Studies, 37(2), 117-146.
Kaplinsky, R., & Morris, M. (2001). A Handbook for Value Chain Research. IDRC Ottawa.
Macfadyen, G., Nasr-Alla, A. M., Al‐Kenawy, D., Fathi, M., Hebicha, H., Diab, A. M., . . . El-Naggar, G. (2012). Value-Chain Analysis—An Assessment Methodology to Estimate Egyptian Aquaculture Sector Performance. Aquaculture, 362, 18-27.
Morrissey, M. T. (1988). Postharvest Fishery Losses: Proceedings of an International Workshop Held April 12-16, 1987, at the University of Rhode Island, Kingston, RI.
Pomeroy, R. S., & Andrew, N. (2011). Small-scale Fisheries Management: Frameworks and Approaches for the Developing World. Oxfordshire, UK and Cambridge, MA: Cabi.
Porter, M. E. (1985). Competitive Advantage: Creating and Sustaining Superior Performance. New York: London: Free Press; Collier Macmillan.
Rosales, R. M., Pomeroy, R., Calabio, I. J., Batong, M., Cedo, K., Escara, N., . . . Sarahadil, M. (2017). Value Chain Analysis and Small-scale Fisheries Management. Marine Policy, 83, 11-21.
Sea Temperature. (2017). Water temperature Gambia in August. Retrieved from https://seatemperature.info/august/gambia-water-temperature.html.
The Gambia Department of Fisheries Statistics Unit. (2015).

70
United Nations. (2014). The Fisheries Sector in The Gambia: Trade, Value Addition and Social Inclusiveness with a Focus on Women. New York: United Nations.
United States Agency for International Development. (2014). Gambia-Senegal Sustainable Fisheries Project (USAID/BaNafaa) final report. (Final Report No. 624-A-00-09-00033-00). Narragansett, RI: Coastal Resources Center, University of Rhode Island Graduate School of Oceanography. http://pdf.usaid.gov/pdf_docs/PA00K5JG.pdf
Ward, A., & Jeffries, D. (2000). A Manual for Assessing Post-Harvest Fisheries Losses. Overseas Development Administration. Natural Resources Institute. University of Greenwich.

71
Chapter 3
ADOPTION OF IMPROVED SMOKING TECHNOLOGY AMONG FISH PROCESSORS IN GHANA
by
Kristine Beran1, Brian Crawford2, Richard B. Pollnac3
To be submitted to World Development
1 PhD Candidate, Department of Marine Affairs, University of Rhode Island, RI, 02881, USA, Email: [email protected]. 2 Adjunct Professor, Department of Marine Affairs and Senior Coastal Resources Manager, Coastal Resources Center, University of Rhode Island Graduate School of Oceanography, Narragansett, RI, USA, Email: [email protected]. 3 Research Professor, Department of Marine Affairs, University of Rhode Island, RI, 02882, USA, Email: [email protected].

72
Abstract
We measure factors that influence adoption of improved fish smoking
technology in Ghana. The improvement is a fuel-efficient fish smoking stove known
as ahotor. The ahotor stove is designed to consume less fuelwood and improve quality
of smoked fish products for local and export markets. We measure adoption of the
ahotor stove through a field survey. Perceived attributes in diffusion theory (relative
advantage, compatibility, complexity, trialability and observability) are tested using
principal component analysis. Fifty-one percent of the variance in the data is explained
by three components. The components are named technology, product differentiation
and labor. We statistically relate adoption of the ahotor stove through perceived
attributes and other explanatory variables found in fisheries literature. The best
predictors of adoption of the ahotor stove are its technological features except
complexity and the ability to pay. Benefits and challenges of implementing improved
fish smoking technology in Ghana are discussed. Benefits include energy efficiency,
smoke reduction, and hands-on training, while challenges relate to cost and
construction of the ahotor stove.
Keywords: Diffusion theory, value chain, post-harvest innovations, fish smoking,
West Africa, food security, food safety, energy efficiency

73
Introduction
Across sub-Saharan Africa, traditional fish smoking technology continues to
evolve primarily as a result of technology transfer and through extension services led
by international organizations. Since 1969, the Food and Agriculture Organization
(FAO) of the United Nations has played a key role designing and implementing
improved fish smoking technology across this region, including Ghana. Recently,
attention is placed on improving traditional fish smoking technology relative to food
safety, value addition and energy efficiency.
Traditional fish smoking stoves expose processors-most of whom are women-
to excessive heat and smoke, which raise environmental, economic, occupational and
health-related concerns. These concerns are discussed throughout this paper and
addressed by diffusing an innovation within this sector.
The FAO (2015) through its Voluntary Guidelines for Securing Sustainable
Small-Scale Fisheries in the Context of Food Security and Poverty Eradication,
referred to as The Guidelines, recognize the key role the small-scale fisheries post-
harvest sector plays in the value chain and recommends States should:
• Support the small-scale fisheries post-harvest subsector in producing good quality and safe fish and fishery products, for both export and domestic markets, in a responsible and sustainable manner, Section 7.3
• Address occupational health issues as part of fisheries management, Section 6.12
• Recognize the role of women in the post-harvest sector and support improvements to facilitate women’s participation in such work, Section 7.2
• Avoid post-harvest losses and waste and seek ways to create value addition, building not only on existing traditional and local cost-efficient technologies, innovations and culturally appropriate technology transfers, but environmentally sustainable practices with an ecosystem approach should also be promoted, deterring for example, waste of inputs (water, fuelwood, etc.) in small-scale fish handling and processing, Section 7.5

74
Fuel-efficient innovations could potentially generate social, economic, and
environmental benefits nodes within this sector. Improving energy efficiency through
cleaner cooking fuels and technologies is outlined in Goal 7 of the 2030 Agenda for
Sustainable Development (United Nations, 2016). However, in order for those benefits
to be fully realized, we need to identify factors that facilitate or hinder access or
adoption of energy-efficient innovations. We suggest the theory of the diffusion of
innovations as a window through which to examine these factors within this context.
Diffusion theory4 informs how innovations are implemented and the rate at
which they are adopted, or not based on perceived attributes and other explanatory
variables such as socio-economic characteristics and communication channels
(Rogers, 1995). Diffusion theory has been applied in a variety of disciplines, including
agriculture, education, public health and marketing (Rogers, 1995). Diffusion theory
has been applied to fishing equipment, such as nets, on-board electronics, and
marketing projects for high-end seafood products in industrial fisheries and open
ocean aquaculture (Stephenson, 1980; Dewees & Hawkes, 1988; Tango-Lowry &
Robertson, 2002, Dentoni & English, 2012).
In Ghana, we investigate factors that influence adoption of an improved fish
smoking stove through the lens of diffusion theory. We measure environmental,
economic, and health perceptions of the new fish smoking technology among fish
processors.
4 Defined as the process by which an innovation, often technological, is shared or communicated through certain channels over a period of time among members of a community or social system (Rogers, 1995).

75
Background
Fish processing is the main economic activity for women working along
Ghana’s 550 km coastline and around lake Volta. Women processors occupy a key
node along the supply chain after fishers (Weerantunge, Snyder, & Sze, 2010; Walker,
2001; Overa, 1993; Madanda, 2003). The most widely used method of processing fish
is smoking on stoves. The most common types of smoked fish are small pelagic
species.5 Small pelagic species account for approximately 70 percent of total marine
fish capture in Ghana (FAO, 2016). There are multiple benefits to smoking fish such
as enhanced flavor, reduced waste and longer shelf-life that facilitates storage and
distribution of fish within and outside of Ghana. Fish that is properly smoked has a
shelf-life of five months or more (Gordon, Pulis, & Owusu-Adjei, 2011).
In Ghana, the rainy season coincides with the peak fishing season for small
pelagic species. Post-harvest losses are associated with the rainy season; hence,
smoking fish is a necessary means of preserving fish in the absence of refrigeration or
sun drying (Akande & Diei-Ouadi, 2010). The FAO estimates post-harvest loss of
smoked fish in weight is between 3 and 17 percent in Ghana (Akande & Diei-Ouadi,
2010). Losses are attributed to “droppers,” or fish falling into the fire, burning,
infestation (insects) and breakage (Akande & Diei-Ouadi, 2010). Improving
preservation techniques, such as smoking, could yield more fish for direct human
consumption and increase income derived from processing fish. The average per
capita consumption of fish in Ghana is estimated at 26 kg/yr. (FAO, 2016) which is
above the world average of 20 kg per year (FAO, 2016). Fish accounts for 60 percent
of animal protein consumed in the Ghanaian diet (FAO, 2016). Between 22 and 26 5 Sardinella (i.e. sardines), anchovies and mackerel.

76
percent of a household’s food expenditure is allocated toward purchasing fish (FAO,
2016). Hence, Ghana is particularly dependent on fish as a shelf-stable source of
protein.
Essential inputs needed to smoke fish include fish and fuelwood, both
renewable natural resources. The nature of these resources in Ghana is open access.
The status of these resources in Ghana is declining (Ba, Schmidt, Dème, Lancker,
Chaboud, Cury, Thiao, Diouf, & Brehmer, 2017; Lazar, Asare, Nortey, Kankam, &
Agbogah, 2016). Inefficient fish smoking technology has prompted the development
and implementation of improved stove technology. Improved stove technology aims to
reduce fuelwood consumption while improving the quality of smoked fish, which in
turn benefits nodes further along the chain. The Fisheries Act (625) in Ghana supports
standardization of fish quality yet does not provide specifications. In Ghana, the
agency responsible for fish quality standards is the Ghana Standards Authority (GSA)
in consultation with the Fisheries Commission Post-Harvest Unit and Food and Drugs
Authority.
Evolution of Stove Technology in Ghana
Fish smoking technology is marked by a few notable innovations (Appendix
A). Before 1970, stoves used for smoking fish were cylindrical and made of mud or
metal (Hall, 2011). The cost of construction was low, yet there were considerable
disadvantages, such as inefficient use of inputs (i.e. fuelwood and time) and
insufficient capacity to process fish (i.e. no use of trays). Insufficient capacity is a
problem in the peak season when most of the fresh fish catch is landed. The
introduction of the chorkor stove addressed incapacity.

77
Chorkor Stove
The chorkor stove was developed in Ghana in 1969 by the FAO in
collaboration with the Food Research Institute (FRI) and the Council for Scientific and
Industrial Research (CSIR) (Kwarteng, Nsiah, & Aziebor, 2016). The chorkor stove
uses trays to smoke fish. Fresh fish is placed on trays and then stacked on top of each
other. Chorkor is the most commonly used stove for smoking fish in Ghana.
Morrison Stove
The morrison stove was developed in 2008 by the Netherlands Development
Association (SNV) in collaboration with the private Ghanaian company, Morrison
Limited Enterprise. For more information on the morrison stove refer to Odjidja,
Yeboah, Abgekpornu, Manu, & Beran, 2016. This stove was initially promoted by the
United States Agency for International Development Ghana Sustainable Fisheries
Management Project (USAID/SFMP) given its fuel-efficiency advantage over the
chorkor smoker. However, unacceptable levels of polycyclic aromatic hydrocarbons
(PAHs) discovered in fish using this stove type resulted in discontinuation of its
promotion and prompted a new phase of research and development to better
understand PAHs issues in relation to fish smoking technology in general and
specifically to design stove components that aim to reduce levels of PAHs and
consume less fuelwood (Council for Scientific and Industrial Research [CSIR], Ghana
Standards Authority [GSA], & Kwarteng, 2016).

78
Polycyclic Aromatic Hydrocarbons
Polycyclic aromatic hydrocarbons are carcinogenic and genotoxic substances
that pose potential food safety and health hazards concerns (European Food Safety
Authority, 2008). According to the FAO/WHO Codex Alimentarius Commission,6
formation of PAHs in smoked fish is dependent on various factors some of which
include type of wood used to smoke fish, duration of and temperature during smoking,
cleanliness and maintenance of equipment and its design, specifically the combustion
chamber which influences smoke density inside the chamber (CAC/RCP 68, 2009).
Food with direct contact to combustion gases, such as smoking and grilling,7
especially over an open flame, contribute to PAHs levels in food products
(Akpambang, Purcaro, Lajide, Amoo, Conte, & Moret, 2009). These processing
techniques are common in Nigeria, Ghana and other developing countries
(Akpambang et al., 2009). Developed countries have replaced traditional, direct
smoking systems with computerized, temperature-controlled systems that are able to
reduce formation of PAHs in commercial food production (Horst & Leinemann,
1996).
The maximum permitted level of benzo[a]pyrene, a key PAH marker, in
smoked fish is 2.0 µg/kg (Commission Regulation European Union 1881/2006). A
study of commercially smoked fish products in Nigeria reveal high dietary exposure to
benzo[a]pyrene (Akpambang et al., 2009). In that study, levels of benzo[a]pyrene
exceed the maximum permitted level set by the European Commission in 5 of 6 types
6 The Codex Alimentarius is a collection of standards related to food safety and quality adopted by the Commission formed by the FAO/World Health Organization (WHO) Food Standards Program (FAO/WHO, 2018). 7 Charcoal grilling usually yields small amounts of PAHs (Akpambang et al., 2009).

79
of fish sampled, including mackerel at 6.6 µg/kg and mudfish at 38 µg/kg
(Akpambang et al., 2009). These fish were smoked using a metal barrel stove
(Akpambang et al., 2009). Formation of PAHs, including benzo[a]pyrene in smoked
fish in Ghana is discussed in the next section.
Ahotor Stove
The ahotor stove is the focus of this study. It was developed in 2016 by local
and international consultants with guidance from SNV, and public institutions such as
the Council for Scientific and Industrial Research (CSIR) and the Fisheries
Commission Post-Harvest Unit and the Ghana Standards Authority (GSA), with
financial support from the United States Agency for International Development Ghana
Sustainable Fisheries Management Project, or USAID/SFMP (Avega & Tibu, 2017).
The ahotor incorporates specific design features shown to reduce PAHs levels for
benzo[a]pyrene and PAH4, another indicator of PAHs in food (CSIR et al., 2016). The
specific design features that differentiate ahotor from previous stove models is a drip
collector and combustion system. A combustion chamber permits faster-flowing,
cooler air temperature designed to prevent formation of high PAHs levels on smoked
fish. A drip collector that sits on top of the combustion chamber is designed to prevent
fat and water released by fish during smoking from dripping into the fire (Kwarteng,
Fianko, Amaning, Morrison, Nketia, & Abbey, 2016).
Chemical analytical tests conducted in Ghana by GSA and in Germany by
Eurofins WEJ Contaminants detect lower levels of BaP and PAH4 in fish smoked by
the ahotor than chorkor and morrison stoves (Figure 3.1).

80
Figure 3.1. PAHs levels by stove types.
Source of data:8 Eurofins (2015) and GSA (2017)
Results from analyses shown in Figure 3.1 indicate levels of PAH4 and BaP
found in fish smoked by the ahotor stove in 2016 and 2017 are lower than fish smoked
by the chorkor and morrison stove in 2015. Results are based a very limited set of
samples taken over time. Results from the chorkor and morrison stove are based on
one sample, of 1014 and 1005 grams each, respectively. The sample size for the
analysis conducted in 2016 for the ahotor stove is 200 grams. Results from the ahotor
stove taken in 2017 is based on three samples of smoked fish, each weighing 1 kg. A
mean average is calculated if there is more than one sample. Sprinkling ash on top of
the drip collector while smoking fish is believed to lower BaP and PAH4 levels
because it absorbs excessive fat and fluid released from fish during the smoking
process. Based on a very limited sample, results confirm this hypothesis (BaP = 0.6 8 Data provided by Netherlands Development Association (H. Etsra, personal communication, April 24, 2018).
-200
20406080
100120140
Chorkor(2015)
Morrison(2015)
Ahotor(2016)
Ahotor with ash(2017)
Ahotor withoutash
(2017)
EU limit
Uni
t (µg
/kg)
Stove type(year test conducted)
Comparing stoves by PAH and BaP levels
BaP levels PAH4 levels

81
µg/kg, PAH4 = 10.9 µg/kg). Two of three samples of fish smoked by ahotor stove
with ash exceed the European Union maximum residue limit (12 µg/kg). At the time
of this study only one sample is within the European Union maximum residue limit.
Therefore, these data are too limited to draw any conclusions.
Fuel-efficiency
The ahotor is more fuelwood-efficient than the chorkor stove. Mean difference
for fuelwood consumption between the chorkor (306 g/kg) and ahotor (208.6 g/kg)
stove is statistically significant9 (CSIR et al., 2016). This result is based on comparing
consumption of fuelwood between the ahotor and chorkor stoves using a Control
Cooking Test10 (CSIR et al., 2016). The type of fuelwood used for this test is yaya
wood (a local type of hard wood). The same weight of fuelwood was used for three
tests conducted according to the Control Cooking Test. See Appendix B for results of
the Control Cooking Test.
Definition of Innovation Attributes
We follow a standardized set of perceived attributes of innovations according
to diffusion theory to determine factors that influence adoption of the ahotor stove in
Ghana. Perceived attributes are relative advantage, compatibility, complexity,
trialability, and observability (Rogers, 1995). According to diffusion theory, 49-87
percent of variance in rate of adoption is explained by these five attributes (Rogers,
9 T-test = 9.513, df=2. 10 An experimental method that compares stove performance following a standardized cooking scheme (Rob Bailis, 2004). In this study, equal weights of fuelwood and fish are used to compare the stoves’ performance with respect to fuel-efficiency under similar conditions and procedures.
82
1995). The rate of adoption is measured by the number of individuals that adopt an
innovation within a specific period, such as a year (Rogers, 1995).
Relative advantage is often associated with economic profitability, low initial
cost, savings of time and effort and social prestige (Rogers, 1995). However, more
non-economic factors are needed to understand different motivations for adopting an
innovation (Rogers, 1995). In this study, we explore non-economic attributes of
relative advantage such as less smoke nuisance (to the eyes), a personal health benefit.
Compatibility is the degree to which the innovation, or idea is consistent with
the one it supersedes (Rogers, 1995). Innovations can fail if they counter strongly held
cultural beliefs and values (Rogers, 1995). For example, a variety of rice promising
higher yields was introduced in South India but it was not adopted because it failed to
account for consumer taste. In this study, we measure compatibility with questions
related to labor and workload given the different stove designs.
Complexity is measured by the degree to which an innovation is perceived as
difficult to understand or use (Rogers, 1995). It is the only attribute negatively
correlated with adoption (Rogers, 1995). This study measures complexity based on the
stove’s construction and maintenance. Trialability is defined as the relative ease of
trying-out new ideas or innovations which reduces uncertainty (Rogers, 1995). In this
study, we measure trialability by asking respondents if they were trained to use the
stove before adopting it.
Observability is characterized by an innovation’s results (Rogers, 1995). Some
innovations are more visible than others, especially physical or material objects, such
as cellular phones, which is positively correlated with adoption. Innovations that are

83
hard to describe or are not visible are negatively correlated with adoption (Rogers,
1995). In this study, we measure observability based on a stove’s visibility (to others)
and quality (of fish) it produces.
Communication Channels
The means through which an idea or innovation is communicated from one
individual to another influencing adoption (Rogers, 1995). For example, mass media
channels convey information rapidly and efficiently, while interpersonal channels (i.e.
face-to-face) do not, yet, they may be more persuasive (Rogers, 1995). In this study,
channels used to convey information about the ahotor stove include newspapers, radio
and television, peer-to-peer contact and change agents. Change agents work with the
USAID/SFMP, the lead donor agency behind the development of the ahotor stove.
Methodology
A field study was conducted in five regions across Ghana from June, 2017 to
May, 2018 to better understand perceptions and attributes that may impact adoption of
the ahotor and chorkor stove.
Research Design and Survey Instruments
A mixed-methods, qualitative and quantitative approach was used to collect
primary and secondary data (Robson, 2011). Key informants (n=10) provided
information related to construction of both stoves, and communication channels and
financing mechanisms specific to the promotion of the ahotor stove under the
USAID/SFMP (Appendix C). Reliability of key informants was tested through the
agreement technique, or when two informants from the same organization provide the
same response (Poggie, 1972). Direct and participant observation determined

84
concordance between actual versus intended use of improved fish processing
technology. A GoPro video camera was used to record processors load wood, arrange
fish on trays, stack and alternate trays while smoking fish on different stove types.
Video recordings were later used by the researcher to complete field notes. A
structured survey was administered to fish processors (N=112) to test the research
questions (Appendix D). A sampling frame was built comparing two stoves, or
treatments among the processor population in Ghana. They are 1) ahotor treatment
group, and 2) chorkor treatment group.
Study Sites
Study sites for the ahotor treatment group is based on their location in five
regions across Ghana. The chorkor group sample was also drawn from five regions
across Ghana. All study sites are marked using a global positioning device. See Figure
3.2 and 3.3 for locations of sample sites.
Figure 3.2. Location of Ghana and study sites.

85
Figure 3.3. Location of sample sites by region in Ghana.
Location of sample sites by region in Ghana. In the legend, control means those currently using the chorkor stove while treatment means those that own and use an
ahotor stove regardless how it was acquired.11
Ahotor Treatment Group
The sample frame is built based on a census using a list of names of fish
processors who own the ahotor stove (n=49). The list was provided by the SFMP.
Means of ownership, however, differ. In 2016, the SFMP fully subsidized the ahotor
stove to select beneficiaries. Thereafter, it has been available for direct purchase. Most
of those who own the ahotor stove previously-or in addition to-use the chorkor stove.
Types of owners of the ahotor stove is subsequently discussed.
11 Respondents within the treatment group may also own a chorkor stove in addition to the ahotor stove.

86
Demonstration user is a term used for fish processors who received the ahotor
stove based on certain criteria established by project partners under this project.
Criteria for selection of demonstration users is determined by project partners under
the SFMP (USAID/SFMP, personal communication, June-August, 2017). Vulnerable
household is another term used under this project for a person, or household
susceptible to child labor and trafficking. This project provisioned a subset of
vulnerable households with the ahotor stove to generate income, because there is
reason to believe that economic hardship contributes to child labor and trafficking
(Avega & Tibu, 2017).
The self-finance group are individuals who have purchased the ahotor stove at
current market price. Fish processors who have made a deposit, or payment toward a
purchase of the ahotor stove-at the time of this study-form a group called deposits.
Location (i.e. region in Ghana) and means of ownership of the ahotor stove is
summarized in Table 3.1. The terms used to describe owners in Table 3.1 implies that
those that own the ahotor stove are potential adopters of it. Rogers (1995, p. 21)
defines adoption as “a decision to make full use of an innovation as the best course of
action available.”
Table 3.1. Owners of ahotor stove by region (as of August, 2017).
Region Ahotor owners
Demonstration Vulnerable household
Self-finance Deposits
Western 10 0 1 0 Central 11 16 0 0 Volta 6 0 0 2 Greater Accra 1 0 0 0 Ashanti 0 0 2 0
Total 28 16 3 2

87
Criteria used to select beneficiaries of the ahotor stove was established by
region under the SFMP. Refer to Table 3.2 for selection criteria. Criteria varies by
region (Table 3.2). There are no standardized criteria for demonstration users,
however, there is for vulnerable households as described in Beran and Crawford
(2018).
Table 3.2. Selection criteria for ahotor stove beneficiaries by region.
Region Selection criteria
Volta • Accessible (willing to demonstrate) • Position of authority
Central
• Accessible (based on location) • Position of authority • Active participant during trainings (of stove) • Past experience with morrison stove
Western • Active participant during trainings (of stove) • Cleanliness of processing area • Position of authority
Greater Accra • Accessible (based on location)
Ashanti • N/A because respondents in this region were self-
selected, and not selected by the USAID/SFMP project
Not all owners of the ahotor stove have fully adopted it. Therefore, a new
category within the treatment group is formed and referred to as non-adopter. A non-
adopter is someone who owns the ahotor stove but has used it one time or not at all.
Reasons for non-adoption include lack of land to place the stove, lack of raw material
or access to preferential markets (e.g. export or high-end supermarkets in Ghana), lack
of working capital and missing stove components, such as a grate and drip collector.
Refer to Table 3.3. Table 3.3 also accounts for individuals who were selected to
demonstrate use of the stove to other fish processors but have not done so given
reasons provided.

88
Table 3.3. Reasons for non-adoption of the ahotor stove (N=9).
Interview number
Region Type of respondent Reason
19 Central Vulnerable household Does not own land. Ahotor was built on someone else’s land far away from where the person lives12
26 Central Vulnerable household Missing component (grate)13 27 Central Vulnerable household Missing component (drip
collector)14 34 Central Demonstration user Lack of raw material (fish
from cold storage) 38 Central Vulnerable household Lacks working capital to buy
fish to process 44 Central Vulnerable household Lacks working capital to buy
fish to process 49 Western Demonstration user Lack of preferential market
(export) 50 Western Demonstration user Lack of raw material and
high-end markets (quality fish such as redfish, cassava to sell to supermarkets in Ghana)
74 Central Vulnerable household Lacks working capital to buy fish to process
Chorkor Treatment Group
The chorkor stove treatment group consists of sixty-three fish processors.
Previously, this group used traditional round, mud stoves or later, metal barrel stoves.
The chorkor treatment group is drawn using a convenience sample, a non-probability
sampling technique. This technique was chosen due to time constraints. Selection of
participants was based on availability and willingness to participate in the study. This
study coincided with the peak season when processors are buying, processing (e.g.
smoking) and trading fish. To minimize sampling bias, half of the sample is drawn
12 Re-location pending (February, 2018). 13 Grate replaced (February, 2018). 14 Drip collector replaced (February, 2018).

89
from non-SFMP project sites in Ghana. In theory, these sites are not targeted for
promotion of ahotor stove.
All structured interviews were conducted using primarily one, and as needed
two local translators between English and the local dialect spoken. Prior to
administering the survey, the phrasing of the survey instrument was reviewed by
native speakers and changes are made to the wording of questions as needed to ensure
local understanding. For data quality assurance, survey instruments were pre-tested
four times, twice with fish processors and twice with translators.
A cloud-based paperless survey instrument was used for the structured
questionnaire administered to 112 fish processors using a tablet to enter responses and
sent via Wi-Fi to a cloud-based server for storage at the conclusion of the interview.
Data are downloaded into an Excel workbook. One respondent is removed from the
data set due to mis-entry of data. Hence, the sample size in this study is 111.
Measurement of Variables and Results
Measurement of variables to determine adoption of ahotor and chorkor stoves
is discussed in this section. Results of quantitative and qualitative data are presented.
Communication Channels
Information about the ahotor stove is conveyed through trainings (e.g.
workshops and demonstrations), radio, television and newspapers. Thirty-one percent
first heard about the stove through SFMP-led trainings, 6 percent through media

90
outlets15 and 63 percent from other sources such as peer-to-peer contact with relatives
or other processors.
Socio-economic Variables
Personal and socio-economic variables are chosen based on prior innovation
studies related to fisheries (Dewees & Hawkes, 1988; Tango-Lowy & Robertson,
2002). Descriptions and measurements of these variables are shown in Table 3.4.
Table 3.4. Description of socio-economic variables.
Variable Measurement Description Personal and Socio-economic Characteristics
Age Ratio (years) Respondent’s age Years of
experience Ratio (years) Years of experience smoking fish
Cosmopolitanism Ratio (markets) Number of markets fish is sold
Income Ordinal Percentage of income from smoking
Material style of life Scale
Scale calculated based on presence/absence of household structure, contents, and access
to electricity water and sanitary facilities
Age, years of experience and number of markets where fish was sold is
measured within the ahotor treatment group (e.g. types of owners) and between
treatment groups, or those an ahotor or chorkor stove (Table 3.5).
15 Media outlets used by the SFMP to promote the ahotor stove includes newspapers, television and radio (USAID/SFMP, personal communication, June-August, 2017).

91
Table 3.5. Difference between and within groups of socio-economic variables.
Variable Ahotor group Chorkor vs. Ahotor groups
MeanTD MeanVH MeanNA F-ratio p-Value MeanA MeanC F-ratio p-Value Age 48.1 45.4 45.6 0.34 0.71 47.1 49.3 0.99 0.32 Years smoking 25.3 25.2 23.6 0.06 0.95 24.9 31.3 2.33 0.02 (#) Markets 2.7 2.4 2.3 0.22 0.80 2.6 2.5 -0.10 0.92
N 29 10 9 - - 48 63 - - TD = Ahotor demonstration users, VH = Ahotor vulnerable household users, NA = Ahotor Non-adopters, A = Ahotor group, C = Chorkor group
Analysis of variance (ANOVA) is used to analyze differences between group
means for the ahotor treatment group (Table 3.5).16 A two-sample t-test compares
difference of means between groups (i.e. ahotor and chorkor) among these variables
in Table 3.5. The ahotor group has less experience smoking fish than the chorkor
group (Table 3.5). The difference is statistically significant (p-Value=0.02, df = 109).
Illiteracy is high in coastal fishing communities in Ghana. A study conducted
by Crawford, Gonzales, Nyari-Hardi, & Sarpong (2016) reveals 77 percent of
respondents are illiterate. Older persons and females are more likely to be illiterate
(Crawford et al., 2016). To gage financial literacy, this study asks respondents how
they record their earnings from processing fish. The question is open-ended; however,
respondents ether state they keep record of it “in their head” or “written.” Within the
chorkor group (n=63), 56 percent state that they keep record of in it in their head and
44 percent keep written records. Within the ahotor group (n=48), 58 percent keep
record of expenses in their head while 42 percent keep written records. The difference
is not statistically significant (Chi-square = 0.09, df = 1, p-Value = 0.77).
16 MeanA is defined as respondents using the ahotor stove whereas MeanC is defined as respondents using the chorkor stove.

92
Respondents are asked to state their dependence on fish processing for income
generation. The level of measurement is ordinal (categories: 0-25 percent, 25-50
percent, 50-75 percent and 75-100 percent). Data are transformed into two groups, 0-
75 and 75-100 percent due to low cell frequency counts in resultant tables (<5).
Within the 75-100 percent range, the chorkor group claim higher dependence on fish
processing as a source of household income (87.3 percent), whereas the ahotor group
is slightly less (73.9 percent). The differences are not statistically significant (Chi-
square = 3.18, df = 1, p-Value = 0.07, Fisher Exact Test two-tailed p = 0.09, n=109).
Income is difficult to measure in fishing households as daily income varies
widely, seasonally and annually based on variations in fish catch. Therefore, a material
style of life (MSL) scale is used as a wealth indicator, or substitute for income.
Previous studies use MSL to determine social status within the community based on
possession of household assets and structure (Pollnac & Crawford, 2000; Cinner,
Daw, & McClanahan, 2009).
In this study, the MSL scale is determined by the presence or absence of select
household contents such as a radio or refrigerator, type of house structure, such as roof
and floor and access to services such as electricity and water, or indoor plumbing. A
total of 17 indicators are scored in dichotomous form, or 1 for presence and 0 for
absence of this item or access to it. The indicators are shown in Table 3.6.

93
Table 3.6. Material style of life indicators.
Dichotomous Variable17 Sewing machine 0,1 Tape player 0,1 Radio 0,1 Refrigerator 0,1 Television 0,1 Roof (metal) 0,1 Roof (slate) 0.1 Roof (other or thatched) 0,1 Floor (dirt) 0,1 Floor (cement) 0,1 Floor (others, or mixture, or tile) 0,1 Indoor plumbing 0,1 Electricity 0,1 Toilet (public) 0,1 Toilet (private) 0,1 No toilet Kumasi Ventilated Improved Pit (KVIP)
0,1 0,1
Principal component with varimax rotation is used to reduce these indicators
into scales that reflect patterns of interrelationships among the indicators (Pollnac &
Poggie, 2006). Principal component analysis reduces multiple variables down to a
smaller number of components. The scree test (Cattell, 1966) is used to select the
number of components. Three components are selected, in total they account for 47
percent of the variance in MSL items (Table 3.7).
Items18 loading highest (>.40) on each component helps to identify what each
component represents and defines the underlying dimension that binds them together.
In other words, items with high positive loadings contribute more strongly to a
positive component score than those with low or negative loadings (Pollnac & Poggie,
2006). 17 1=presence of or access to, 0=absence. 18 One of items (a type of toilet called KVIP) is removed from the data set because of a low component loading (<.40).

94
The first component is defined primarily by positive loadings on household
electrical appliances and a metal roof. A metal roof is less expensive than “slate”.
Slate is a mixture of cement, sand and water. It is typically used as building material in
coastal communities because it does not rust. The first component is named household
goods. The second component reflects the construction of a house consisting of
positive loadings for a slate roof and cement floor. The second component is named
house construction. The third component is defined by positive loadings on access to
services such as indoor plumbing for a private toilet and electricity to run a
refrigerator. These items are considered a luxury to purchase and maintain. Therefore,
the third component is named luxury items.
Table 3.7. Principal component analysis of material style of life (n=111).
Household goods House construction Luxury items
Variables and Loadings
Variables and Loadings
Variable and Loadings
Sewing machine 0.56 -0.04 0.06 Tape player 0.63 0.08 0.02 Radio 0.63 0.13 0.04 Refrigerator 0.46 0.09 0.50 Television 0.67 0.24 0.20 Roof (metal) 0.70 -0.03 -0.04 Roof (slate) -0.67 0.53 -0.02 Roof (other) 0.17 -0.67 0.07 Floor (dirt) -0.11 -0.58 -0.01 Floor (cement) 0.14 0.73 0.21 Floor (others) -0.07 -0.38 -0.22 Indoor plumbing 0.06 0.02 0.59 Electricity 0.34 0.15 0.29 Toilet (public) 0.06 0.12 -0.92 Toilet (private) 0.13 0.23 0.78 No toilet -0.22 -0.49 0.36 Percent of Explained Variance 18.44 13.46 15.10
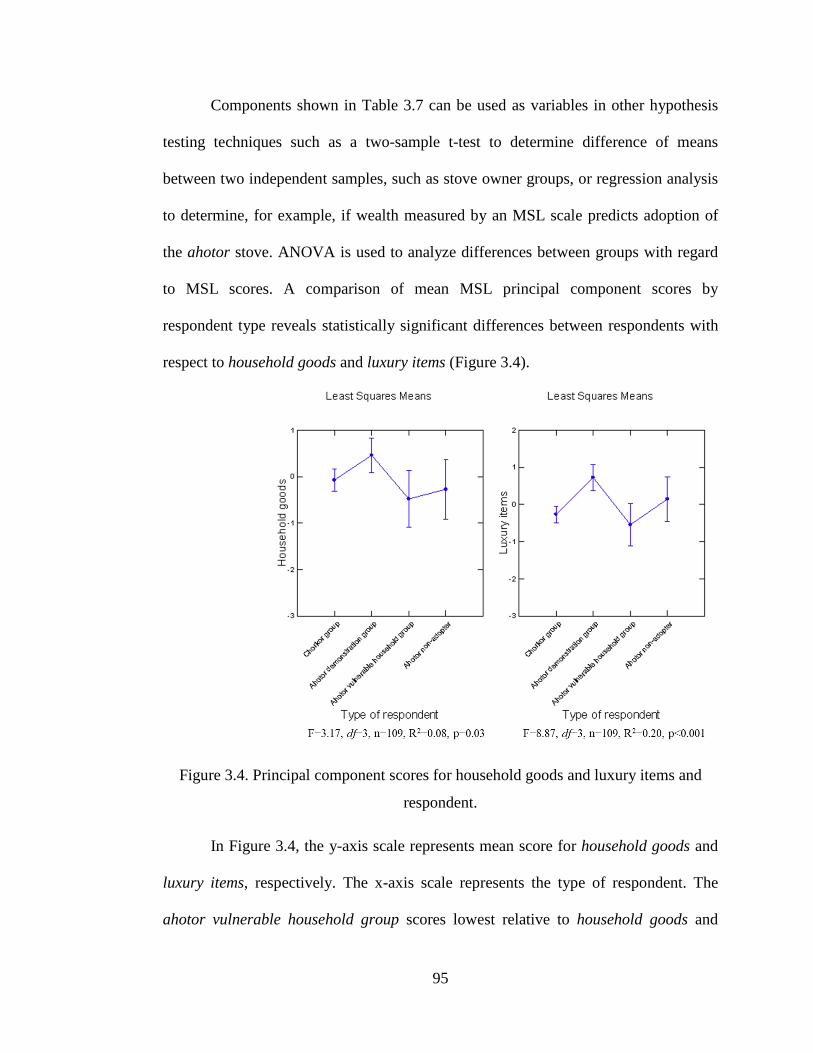
95
Components shown in Table 3.7 can be used as variables in other hypothesis
testing techniques such as a two-sample t-test to determine difference of means
between two independent samples, such as stove owner groups, or regression analysis
to determine, for example, if wealth measured by an MSL scale predicts adoption of
the ahotor stove. ANOVA is used to analyze differences between groups with regard
to MSL scores. A comparison of mean MSL principal component scores by
respondent type reveals statistically significant differences between respondents with
respect to household goods and luxury items (Figure 3.4).
Figure 3.4. Principal component scores for household goods and luxury items and
respondent.
In Figure 3.4, the y-axis scale represents mean score for household goods and
luxury items, respectively. The x-axis scale represents the type of respondent. The
ahotor vulnerable household group scores lowest relative to household goods and

96
luxury items, whereas the ahotor demonstration group score highest. The ahotor
vulnerable household group is economically marginalized, as per criteria for their
selection, therefore it is reasonable they score lowest on costlier household goods
(television, refrigerator), building materials (metal roof) and luxury items such as a
private toilet and indoor plumbing. According to theory, those who are first to adopt
an innovation typically have control or access to substantial financial resources
(Rogers, 1995). In this study, all but three respondents were given an ahotor stove that
was fully subsidized. Respondents did not differ with respect to the house construction
component scores (F=1.29, df=3, n=109, p=0.28).
A Tukey’s HSD (honest significant difference) test is used to calculate
differences within treatment groups. Only statistically significant differences within
groups is reported, refer to Table 3.8 and 3.9.
Table 3.8. Differences between groups with respect to Household goods.
Respondent type Respondent type Difference P-Value Ahotor demonstration user group
Ahotor vulnerable household group 0.94 0.05
Table 3.9. Differences between groups with respect to Luxury items.
Respondent type Respondent type Difference P-Value Chorkor group Ahotor demonstration
user group -0.99 <0.001
Ahotor demonstration user group
Ahotor vulnerable household group 1.27 0.001
The ahotor vulnerable household group (Table 3.8 and 3.9) score lowest
relative to household goods and luxury items, whereas the ahotor demonstration user
group score highest across these variables. For household goods, the difference is

97
statistically significant (Table 3.8). Differences between groups with respect to luxury
items are statistically significant (Table 3.9). Luxury items are defined by indoor
plumbing, private toilet and a refrigerator (Table 3.7). These items are costly to
purchase and maintain, therefore, it is likely that the ahotor demonstration group
possesses more wealth-inferred by the MSL scale-than the chorkor and ahotor
vulnerable household group.
Innovation Attributes
We investigate perceived attributes based on diffusion theory likely to predict
adoption of stove innovations. The attributes are relative advantage, compatibility,
complexity, trialability and observability. Refer to Table 3.10 for definitions of
diffusion of innovation attributes and sub-variables. A positive or negative sign in
parentheses next to each attribute indicates whether the attribute is positively or
negatively related to adoption based on past investigations discussed by Rogers
(1995). For example, the relative advantage of an innovation is positively related to
adoption, whereas, complexity is negatively related to adoption (Rogers, 1995).
Each of the five attributes is measured by sub-variables. Sub-variables are
scaled questions used to test the five perceived attributes of diffusion theory. The
scaled questions are relevant to smoking technology. The direction of the scale is
reversed for some variables to ensure directional continuity with other scales. For
example, if cost is a barrier for buying an ahotor stove, a “yes” response would be a
negative with respect to relative advantage. Each subset question compares the current
stove to the previous stove used. Refer to Appendix E for construction of scales for
each sub-variable in Table 3.10.

98
Table 3.10. Attributes, subset of questions, and measurement for scale construction.
Attribute19 Sub-variables Measurement
Relative Advantage (+) The extent to which an innovation is perceived as being better than the one before it
Do you use less fuelwood? Do you spend less money on fuelwood? How is the smoke nuisance to your eyes? How is the breakage of fish? How is the color of fish? Is demand higher? Does it cost less? Is the cost of the stove a barrier to buy20? Is the cost worth the benefit?
Dichotomous21 (Yes, No, DK) Dichotomous (Yes, No, DK) 5-point Likert 22 5-point Likert 5-point Likert Dichotomous (Yes, No, DK) Dichotomous (Yes, No, DK) Dichotomous (Yes, No) Dichotomous (Yes, No, DK)
Compatibility (+) The extent to which an innovation is consistent with existing values, past experiences and needs of potential adopters
Does it work well for types of fish you process? Is it easy to load trays? Does it come with enough trays? Do you need extra assistance?
Dichotomous (Yes, No, DK) Dichotomous (Yes, No, DK) Dichotomous (Yes, No, DK) Dichotomous (Yes, No, DK)
Complexity (-) The extent to which an innovation is perceived easy or difficult to use
How difficult is it to use? Can you build it? How difficult is it to find someone to build it? Is it easy to repair?
5-point Likert Dichotomous (Yes, No, DK) 4-point Likert23 Dichotomous (Yes, No, DK)
Trialability (+) The extent to which an innovation may be experimented with or tested
Did you get trained on it? Did you get enough training until you were satisfied?
Dichotomous (Yes, No) Dichotomous (Yes, No)
Observability (+) The extent to which results of an innovation are visible to others
Is it visible to others? Do others ask you about it? Is it noticeable to others that fish smoked by your current stove looks different than fish smoked by your previous stove?
Dichotomous (Yes, No, DK) Dichotomous (Yes, No, DK) Dichotomous (Yes, No, DK)
We use principal component analysis to measure the underlying dimensions
among sub-variables, or indicators likely to influence adoption of the ahotor stove.
Principal component analysis takes a large number of variables (e.g. sub-variables or
indicators shown in Table 3.10) and reduces them into a smaller set of variables,
19 Defined by Rogers (1995). 20 Score reversed to ensure directional continuity with other scales 21 Dichotomous variables are scored 1 for positive or yes response, 0 for I don’t know (DK), and -1 for no, or a negative response unless the scale is reversed where no is coded 1 and yes -1. 22 5-point Likert scale questions were scaled as +1 for much better, +0.5 for better, 0 for same, -0.5 for worse and -1 for much worse 23 4-point Likert scale questions were created scaled as +1 for very easy, +0.5 for easy, -0.5 for difficult and -1 for very difficult.

99
known as principal components. Principal component analysis is used to explore
which variables in Tables 3.10 are interrelated. In other words, it looks for underlying
meanings among variables.
Principal component analysis also looks for unrelated variables. For example,
four of the 22 sub-variables or indicators manifest low (<0.40) loadings across all
components, so they are eliminated24 from the analysis and data are reanalyzed. The
four items that are eliminated relate to difficulty of use (complexity), visibility of the
stove to others (observability), visible differences of smoked fish (observability), and
sufficient smoking trays (compatibility).
The scree test results in three components that account for 51.4 percent of the
variance in the data (Table 3.11). Components are named according to the items
included in them. Items with high positive loadings contribute more strongly to a
positive component score than those with low or negative loadings.
A high negative loading subtracts from the overall component score but
provides insights with respect to the interpretation of that component. Refer to Table
3.11 for component scores. Loadings are sorted by attributes (Table 3.11).
24 Removal of these variables can simply mean they do not have enough in common, or are related, to other variables (Harlow, 2014).

100
Table 3.11. Principal component analysis of Rogers (1995) attributes (n=111).
Technology Product differentiation Labor
Attribute, sub-variables Variables and Loadings
Variables and Loadings
Variable and Loadings
Relative advantage Is the cost of the stove a barrier to buy?
-0.75
-0.07 0.08
Do you use less fuelwood? 0.70 0.41 0.08 Do you spend less on fuelwood? 0.66 0.35 -0.00 How is the smoke nuisance to the eyes? 0.64 0.43 0.16 How is the color of fish? 0.19 0.71 -0.07 How is the breakage of fish? -0.38 0.69 0.15 Is there higher demand? 0.21 0.60 0.10 Is the cost worth the benefit? -0.11 0.47 -0.05 Does it cost less than the previous stove? 0.02 -0.47 0.03 Compatibility Is extra assistance needed?
-0.01
-0.02 0.84
Ease of loading trays 0.04 0.20 0.80 Does it work well for your types of fish? -0.10 0.45 -0.55 Complexity How difficult is it to find someone to build the stove?
-0.73
0.21 -0.20
Can you build the stove yourself? -0.57 0.13 -0.03 Is it easy to repair? -0.56 0.31 0.03 Observability Do others ask you about your stove?
0.66
-0.02 0.18
Trialability Did you get trained to use the stove?
0.73
-0.06 -0.05
Did you get enough training? 0.72 0.02 -0.10 Percent of Explained Variance 26.64 14.77 9.99
Technology component contributes most to the variance in the data (Table
3.11). This component is named technology because it is characterized by positive and
negative loadings reflecting a stove’s design, interest expressed by others about the
ahotor stove, instructions (e.g. training on its use), cost and construction. High
positive loadings for this component relate to a stove’s design, instructions related to
use or training. For example, high positive loadings include less fuelwood
consumption, less money spent on fuelwood and less smoke nuisance to the eyes.

101
These items potentially provide economic and non-economic benefits. Economic
profitability is associated with relative advantage, a perceived attribute according to
diffusion theory (Rogers, 1995). High positive loadings for this component also relate
to satisfactory training on use of a stove and interest (in the stove) expressed by others.
Training is important to diffusion of innovations because it reduces uncertainty
(Rogers, 1995). Training is associated with trialability, a perceived attribute according
to diffusion theory (Rogers, 1995). Innovations that are visible to others are associated
with observability, another perceived attribute according to diffusion theory (Rogers,
1995).
High negative loadings on the first component relate to a stove’s cost and
construction. High cost (of an innovation) is a disadvantage according to diffusion
theory (Rogers, 1995). On average, the ahotor stove25 costs twice as much the chorkor
stove to build (SFMP, personal communication, June-August, 2017). Items related to
construction (of a stove) load high negative on the technology component. Difficulty
building, repairing or finding someone to construct a stove is associated with
complexity, the only perceived attribute according to diffusion theory that is negatively
correlated with adoption of an innovation (Rogers, 1995). At the time of this study,
nine artisans were trained to build the ahotor stove in Ghana (SFMP, personal
communication, June-August, 2017).
The second component is named product differentiation, a term borrowed from
Porter (1985) and defined as a type of competitive advantage. High positive loadings
for this component relate to important features of smoked fish products in the
25 Single unit ahotor stove with ten trays costs 1,280 Cedis (~270 USD).

102
marketplace, such as color, breakage and demand of fish. High positive loadings for
product differentiation also relate to equipment or technology used to smoke fish, such
as less consumption of fuelwood and smoke nuisance (Table 3.11).
The third component is termed labor because the highest positive loadings
relate to it. Extra assistance and ease of loading trays depends on the amount of fish
being smoked, which in this case, coincided with the peak fishing season. We posit
ease of use (of machinery) depends on the degree of physical labor involved. Ease of
use is associated with complexity and compatibility, the fifth perceived attribute
according to diffusion theory (Rogers, 1995).
Analysis of between-stove differences among the three components
(technology, product differentiation and labor) indicates the only statistically
significant difference is found with regard to technology. Refer to Table 3.12. Aspects
of technology that differentiate the ahotor stove from the chorkor stove are less
consumption of fuelwood, less money spent on fuelwood, and less smoke nuisance.
Table 3.12. Innovation attributes component scores across user groups.26
Variable Respondent type Mean N t
Technology Chorkor -0.67 63 -12.41 * Ahotor 0.87 48 Product differentiation
Chorkor 0.09 63 1.12 Ahotor -0.12 48
Labor Chorkor -0.10 63 -1.17 Ahotor 0.13 48
*p-Value <0.001 (based on Student’s t-test, two-tailed)
Binary logistic regression is used to investigate whether socio-demographic,
attitudinal or innovation attributes predict future adoption of the ahotor or chorkor
26 User groups are classified by the type of stove the survey questions are based on.

103
stove. Logistic regression is a multivariate prediction method. It is used to estimate
models for binary, dependent variables using both continuous and categorical
independent variables. The goal is to test whether the set of independent variables is
significantly related to the dichotomous dependent variable (chorkor=0; ahotor=1),
the ahotor or chorkor stove. Eleven independent or predictor variables are selected
based on previous fishing-equipment related studies (Dewees & Hawkes, 1988;
Tango-Lowy & Robertson, 2002). All independent variables meet assumptions for
normality and linearity except cosmopolitanism. A log transformation is conducted on
this binary variable to satisfy assumptions.
The overall model is statistically significant (p-Value = <0.001, df = 11,
Naglekerke’s R-squared = 0.85). Refer to Table 3.13. According to this model,
predictor variables that influence adoption of the ahotor stove are technology and
luxury items, a proxy for wealth measured by an MSL scale (Table 3.7). The variable
that statistically predicts adoption of the ahotor stove best is technology defined by
less fuelwood consumption, less money spent on fuelwood, less smoke nuisance to the
eyes, interest expressed by others about the stove, and instructions or training on use
of the stove (Table 3.13). Luxury items, a proxy for wealth also predicts adoption of
the ahotor stove (Table 3.13).

104
Table 3.13. Logit coefficients from model of adoption of ahotor stove.
Variable Ahotor stove Coef. Std error
Age 0.00 0.07 Years’ experience smoking fish -0.04 0.05 Financial literacy -1.90 1.19 Cosmopolitanism -0.23 2.94 Household goods 0.86 0.68 House construction 0.93 *** 0.54 Luxury items 1.71 ** 0.73 Availability of wood (today-past) -0.24 0.22 Technology 3.79 * 0.91 Product differentiation 0.33 0.53 Labor 0.11 0.48 Constant -0.30 2.74
Coefficients significant at <0.001 level*, 0.05 level** and 0.10 level***.
Relevance of Quantitative Results to Theory
This study examines perceived attributes of innovations consistent with
diffusion theory. They are relative advantage, compatibility, complexity, observability
and trialability (Rogers, 1995). This study concludes that a combination of perceived
attributes influence adoption of the ahotor stove in Ghana. Tables 3.11, 3.12 and 3.13
suggest technology plus simplicity will influence adoption of the ahotor stove in
Ghana. Simplicity is the opposite of complexity measured by construction and repairs
to stoves in this study. According to diffusion theory, complexity is the only attribute
negatively correlated with adoption (Rogers, 1995). Innovations that are simple to
understand and use are adopted more rapidly according to Rogers (1995). Rogers
(1995) states innovations are classified as two extremes along a spectrum, complex or
simple, but does not provide metrics or measurements to determine classification
along the continuum. This study measured complexity on a scale.

105
High positive and negative component loadings for technology shown in Table
3.11 reflect consistency with diffusion theory. For example, high positive loadings for
technology include less money spent on fuelwood, a direct economic benefit
associated with relative advantage in diffusion theory. Less smoke nuisance (result of
design) is a non-economic benefit associated with relative advantage. This finding
supports Roger’s (1995) proposition that more non-economic factors are needed to
understand different motivations for adopting an innovation. High positive loadings on
training are positively correlated with adoption because they reduce uncertainty
according to diffusion theory (Rogers, 1995). Items loading high negative on the first
component shown in Table 3.11 relate to complexity. Low initial cost is a relative
advantage in diffusion theory, which is confirmed in this study because the cost of a
stove is a barrier to adoption (the highest negative loading in Table 3.11).
A seminal meta-analysis27 of innovation attributes conducted by Tornatzky &
Klein (1982) concluded relative advantage and compatibility were consistently
positively correlated with adoption, whereas complexity was negatively correlated
with adoption. The Tornatzky & Klein (1982) study was critical of other studies that
only examined one or few attributes in a given study stating “single characteristic
studies are not particularly useful for the purpose of clarifying the relative predictive
power of attributes” and called for the need to examine several innovation attributes
within a study (Tornatzky & Klein, 1982, p.32). This study identifies that several
innovation attributes combined into one meta-variable termed technology predict
adoption.
27 Seventy-five studies were analyzed and in almost one half of the studies, only one innovation characteristic was examined (Tornatzky & Klein, 1982).

106
Differences in mean scores between stove types for each innovation attribute
component is shown in Table 3.12. The only statistically significantly difference (p-
Value <0.001) between stoves by innovation attributes is found with respect to
technology (Table 3.12).
A logistic regression model suggests technology (coefficient significant at <
0.001) and luxury items (coefficient significant at <0.05), a proxy for wealth, predict
adoption of the ahotor stove (Table 3.13). Coefficients in this model indicate the
stove’s attributes more so than socio-economic (and attitudinal) variables increase
likelihood of adopting the ahotor stove. According to diffusion theory, those first to
adopt an innovation (e.g. innovators) typically have control of substantial financial
resources (Rogers, 1995).
Environmental, Economic, and Health Perceptions
We measure environmental, economic and health perceptions of the ahotor stove
among fish processors.
Fish and fuelwood are primary inputs needed to smoke fish. Perceptions
regarding changes to their availability-past, present and future-may reveal how users
view environmental attributes associated with new smoking technology. The
technique chosen for this measurement is a visual, self-anchoring ladder-like scale
(Cantril & Livingston, 1963) which allows for making finer ordinal judgements,
places little demand on the respondent’s short-term memory. In this study, both the
ahotor and chorkor treatment groups are shown ladder-like diagram with 10 steps (See
Appendix F). The respondent is told that the first step represents the worst possible
conditions. For example, with respect to the availability of fuelwood, the worst

107
possible condition is when you have to travel further to get wood, pay more, or delay
smoking fish because fuelwood is scare or expensive. The highest step was described
as the opposite of the worst, or when fuelwood is plentiful and easy to get and you do
not need to pay more for it because it is abundant. The respondent is then asked where
on this ladder availability of fuelwood is today, 5 years ago and 5 years in the future.
This technique is repeated with a similar example for availability of fish. After pre-
testing the diagram, pictures of fuelwood and fish are added next to each step to
indicate availability and facilitate comprehension.
Analysis of variance is used for differences between group means with respect
to change in availability of fish and fuelwood (Table 3.14). Table 3.14 indicates that
there are no statistically significant differences between the 4 groups except for
availability of fuelwood today versus 5 years ago (FuelwoodT2-T1). The ahotor
demonstration user and chorkor groups see less of a difference regarding availability
of fuelwood today versus 5 years ago than ahotor vulnerable households and non-
adopters (Table 3.14).

108
Table 3.14. Analysis of perceived changes of availability of fish and fuelwood.
Variable
Ahotor Demonstration
Ahotor Vulnerable household
Chorkor Ahotor non-adopter
Mean N Mean N Mean N Mean N Squared Multiple
R
F Ratio
Effect size
FuelwoodT2-T1 -1.793 29 -4.200 10 -2.000 63 -5.000 9 0.125 5.105* Large
FuelwoodT3-T2 -1.517 29 -2.500 10 -2.079 63 -2.111 9 0.029 1.056 -
FishT2-T1 -3.276 29 -4.900 10 -3.429 63 -4.444 9 0.050 1.876 -
FishT3-T2 -1.069 29 -2.700 10 -1.613 62 -2.667 9 0.053 1.996 -
T2-T1 = Availability today – past. T3-T2 = Availability future – today. *p<0.01, df = 3. For ANOVA, R2 is used for effect size indicator. A Tukey’s test is used to calculate differences within the ahotor and chorkor
groups. Table 3.15 shows statistically significant differences between the ahotor and
chorkor groups with respect to perceived changes of availability of fuelwood today
versus 5 years ago (FuelwoodT2-T1).
Table 3.15. Differences between ahotor and chorkor groups regarding FuelwoodT2-T1.
Respondent type 1 Respondent type 2 Difference P-Value CI (lower,upper) Chorkor Ahotor non-adopter 3.00 0.014 0.46, 5.54 Ahotor
Demonstration Ahotor non-adopter 3.21 0.014 0.49, 5.92
The perception of greater change in availability of fuelwood among ahotor
non-adopters is not a compelling reason to adopt fuelwood-efficient technology
(Table 3.14). Ahotor vulnerable households demonstrate least control of substantial
financial resources with respect to MSL variables (Figure 3.4) and cite lack of
working capital needed to smoke fish (Table 3.3). Hence, their perception may be

109
informed by price (of fuelwood), an additional financial burden for those living at the
margin.
Economic
Perceived economic benefits of improved fish smoking stoves are measured
according to three variables; cost of fuelwood, sales and quality of smoked fish. In the
ahotor group, an overwhelming majority of beneficiaries (95%) state less money is
spent on fuelwood using the ahotor versus the chorkor stove, whereas 5 percent do not
know (Table 3.16). Responses within the chorkor group are more evenly divided
(Table 3.16). The difference is statistically significant.
Table 3.16. Expense of fuelwood by respondent type.
Do you spend less money on fuelwood?
Respondent type (%) Chorkor group Ahotor group N
No 33.33 0.00 21.00 I don’t know 22.22 5.13 16.00 Yes 44.44 94.87 65.00 Total 100.00 100.00
N 63.00 39.00 102.00 Chi-square value = 27.10, df = 2, p-Value = <0.001
Cramer’s V value = 0.52, Contingency coefficient = 0.46 Respondents are asked if fish smoked by their current stove sells faster at the
market than fish smoked by their previous stove. Data are transformed into two
groups, yes and no or do not know due to low cell frequency counts in resultant tables
(<6). Within the ahotor group, 66.7 percent state fish sells faster at the market,
whereas 33.3 percent state no or they do not know. Within the chorkor group,
respondents state 47.6 and 52.3 respectively. The difference is statistically significant
(Table 3.17).

110
Table 3.17. Sales of fish at the market by stove type.
Does fish from ahotor? sell faster at the market?
Respondent type (%) Chorkor group Ahotor group N
No or I don’t know 52.38 33.33 47.00 Yes 47.62 66.67 58.00 Total 100.00 100.00
N 63.00 42.00 105.00 Chi-square value = 3.70, df = 1, p-Value = 0.05 Fisher Exact Test two-tailed p = 0.07, n= 105
Owners of the ahotor stove are trained to separate-not mix-fish smoked by
different types of stoves and sold at the market. The SFMP-led trainings may have
some influence on this practice (i.e. not to mix fish) and contribute to differences
between groups.
Respondents compared quality of smoked fish by stove types with use of a
scale.28 An ordinal rank test reveals statistically significant differences between stoves
with respect to quality of smoked fish (Kruskal-Wallis = 6.72, df =1, p = 0.01). A two-
sample t-test of the mean demonstrates the difference is statistically significant (t=-
2.69, df=103, p-Value = 0.008). Refer to Table 3.18 for descriptive statistics. The
median score for the ahotor group is 1.00 and .50 for the chorkor group. The ahotor
group perceived much better quality of smoked fish by stove type than the chorkor
group. This finding is also consistent with the goal behind the design of the ahotor
stove.
28 5-point Likert scale question was scaled as +1 for much better, +0.5 for better, 0 for same, -0.5 for worse and -1 for much worse.

111
Table 3.18. Perception of quality of smoked fish by respondent type.
How is the quality of
smoked fish with your current stove?
Respondent type
Chorkor Ahotor
Minimum -1.00 -0.50 Maximum 1.00 1.00 Median 0.50 1.00 Mean 0.53 0.77
N 63 42
Health
Improved fish smoking technology is associated with personal health benefits
such as less exposure to direct smoke. The majority of those using the ahotor stove
experience less coughing while using it compared to previous stoves (Figure 3.5).
Irritated eyes (i.e. red, watery eyes) is commonly noted among respondents.
Figure 3.5. Coughing in relation to the ahotor stove.

112
Discussion
There are clear differences between the ahotor and chorkor stove according to
fish processors in Ghana. In order to understand what stands in the way of widespread
adoption of the ahotor stove, we discuss these findings more closely, recognize
implementation gaps, and try to understand the beneficiaries we target-and capture-
through extension. Findings are discussed in the context of diffusion theory,
development and extension practices.
Rogers (1995) did not foresee that a combination of any five perceived
attributes (relative advantage, compatibility, complexity, observability, and
trialability), into one meta-variable could predict adoption. Rogers (1995) also
recognizes that these five attributes may not be the most important characteristics for a
specific group of respondents. Other studies have built on or replaced Rogers’
perceived attributes with new constructs, or scales to predict adoption of innovations
in the health education and information technology sector (Moore & Benbasat, 1991;
Steckler, Goodman, McLeroy, Davis, & Koch, 1992; Pankratz, Hallfors, & Cho,
2002). The most notable methodological contribution discussed by Rogers (1995)
came from Moore & Benbasat (1991). Moore & Benbasat (1991) created eight scales,
replacing complexity with ease of use and adding others such as voluntariness and
image through an exhaustive instrument development process applicable to any
innovation. Replacing complexity with simplicity as a means of measuring adoption is
also recommended as a result of this study.
In this study, attributes of stove technology plus simplicity and attributes of
fish smokers such as possession of luxury items, a proxy for wealth predict adoption of
the ahotor stove in Ghana (Table 3.13). Technology is defined by less consumption

113
and cost of fuelwood and smoke nuisance which are positive attributes, but it is also
defined by complexity measured by cost and construction that negatively influence
adoption of innovations. Rogers (1995) uses the word “innovation” and “technology”
as synonyms. Merriam-Webster defines technology as “the use of science in industry
to invent useful things or to solve problems.” The ahotor stove is designed29 to
consume less fuelwood. A controlled experiment presented in Appendix B and
discussed earlier in this paper confirms the ahotor stove is more fuel-efficient than the
chokor stove. The difference is statistically significant (t=9.513, df=2). A high positive
loading for fuel-efficiency in Table 3.11 reflects a statement made by one respondent
who notes “the ahotor uses 4 sticks of wood, whereas the chorkor uses twice as much,
or 8 sticks of wood.” These findings mirror the definition of technology but also
support specific recommendations made by the FAO through its Guidelines30 and
toward achieving goals outlined by the United Nation’s 2030 Agenda for Sustainable
Development.31
All things being equal, consuming less fuelwood results in lower costs per unit
(of smoked fish). On average, processors using the ahotor stove can expect to spend
33 percent less on fuelwood per week in the peak season than those using a chorkor
stove (Kwarteng, 2016). The majority of respondents using the ahotor stove perceive
they spend less money on fuelwood (Table 3.16). A high positive loading for this
variable contributes to the first component in Table 3.11. Perceptions among
29 Fuelwood is placed on an elevated grate inside a small combustion chamber with primary and secondary air inlets to help it burn more efficiently. 30 Deter waste of inputs (water, fuelwood) in small-scale fish handling and processing (FAO, 2015, Section 7.5). 31 Access to clean cooking fuels and technologies (United Nations, 2016, Goal 7).

114
respondents such as “fuelwood is very expensive now” and “hard to get” validate the
status of this resource.
A high positive loading for smoke nuisance contributes to the first component,
technology, in Table 3.11. The majority of those using the ahotor stove cite less
coughing while smoking fish (Figure 3.5). Smoke, regardless of its source, is
unhealthy. Fish processors have been exposed to smoke for many years. The average
number of years processing fish among the chorkor group is 31, or more than half
their age on average. Fish processors recognize the impact it has on their health. As
one respondent states “people do say the smoke makes your heart black,” while
another accepts “we are used to smoke, we have no choice.” The ahotor stove is
equipped with a roof that has a hole to direct smoke away from the operator. Yet, with
so many stoves producing smoke nearby, it is difficult to attribute less coughing by
type of stove as one respondent observes. New research indicates dermal adsorption of
PAHs may be a more significant intake pathway than inhalation, but not more than
ingestion (Lao, Xie, Wu, Bao, Tao, & Zeng, 2018).
Exposure to PAHs while smoking fish is not only an occupational health risk
within this node, but it is also a dietary or food safety issue for those who consume
smoked fish with high levels of PAHs. Specific design features of the ahotor stove
such as a drip collector and combustion system appear to reduce levels of PAHs in
smoked fish compared to other stove types based on a very limited sample (Figure
3.1). To-date, only one sample test shows the ahotor stove meets the European Union
maximum residue limit for PAHs. It is premature to determine whether the ahotor
stove will comply with EU PAHs requirements, however, the USAID/SFMP is

115
conducting subsequent studies on levels of PAHs with the Ghana Standards Authority
to establish consistent results showing lower PAHs levels and potential compliance
with EU PAHs requirements. To-date, the ahotor stove design shows lower levels of
PAHs in smoked fish than other stove designs such as the chorkor and morrison stove.
The Guidelines advocate producing good quality and safe fish products for both
markets (FAO, 2015). Efforts to comply with these recommendations warrant more
attention with respect to food safety, especially linked to controlling PAHs in smoked
fish. Additional research is needed to understand the impacts of PAHs on consumers
of smoked fish in West Africa and elsewhere traditional smoking techniques are used.
Innovations that are easily observed (and communicated) to others are
positively correlated with adoption according to theory. One of the variables measured
according to this attribute relates to inquiry (by others) about the stove and contributes
to the first component, technology, in Table 3.11. For example, two respondents asked
“is it (ahotor) used to bake bread?” While another asks how does “the new stove in
town” process fish? Questions such as these suggest the innovation may not be so
apparent (to others).
According to theory, knowledge of an innovation is gained during the first
stage of the innovation-decision process (Rogers, 1995). At the knowledge stage, an
individual or group is introduced to an innovation and gains some understanding of its
function through communication channels (mass media or interpersonal) and change
agents (i.e. USAID/SFMP). The most relevant types of knowledge discussed by
Rogers (1995) that relate to this study are how-to-use the innovation properly and
principles underlying the purpose and function of the innovation. For example, if the

116
innovation is complex, there should be more emphasis placed on the how-to-use the
innovation according to diffusion theory (Rogers, 1995). Similarly, understanding the
underlying principle which in this case is energy efficiency will prevent
discontinuance and mis-use of the innovation. Finally, some individuals are more pre-
disposed to acquiring knowledge given their socio-economic status, such as higher
education, greater exposure and access to media channels and change agents (Rogers,
1995).
Training reduces uncertainty especially in the early stages of diffusing an
innovation. High positive loadings on questions related to training contribute to the
first component, technology, in Table 3.11. Ahotor stove demonstration trainings are
part of the intervention package under the SFMP. The chorkor stove has been
promoted for decades and transfer of knowledge is generational according to
statements made by fish processors who learned how to use it from their mothers,
relatives and neighbors. Interestingly, 63 percent of those using the ahotor first heard
about the stove through peer-to-peer contact. Given the nature of this work (e.g.
generational) and high rate of illiteracy in fishing communities, relying on
interpersonal communication channels is a logical and cost-effective means of
communicating an innovation. There is also a relationship between communication
channels and perceived attributes of innovations according to diffusion theory
(Rogers, 1995). For example, interpersonal contact is more important than mass media
channels with respect to relative speed of adoption for innovations that are perceived
as complex (Rogers, 1995).

117
High negative loadings in the first component, technology, in Table 3.11 relate
to a stove’s complexity measured by construction and maintenance. The two stoves
differ significantly with respect to this attribute. At the time of the study, nine artisans
were trained to build the ahotor stove in Ghana. According to statements made by
respondents using the ahotor stove, this presents a challenge. As one respondent
stated, “they have to call a project partner under the SFMP to come and build the
stove for them,” while another commented “you have to go and ask for the telephone
number of an artisan because there is no one in the community who can build it.”
Another respondent explained that a local chorkor artisan who came to look at the
ahotor stove said it was “too complicated for him to build.” Recently, the
USAID/SFMP acknowledged this problem and is training more artisans to build the
ahotor stove in Ghana (D. Owusu, personal communication, April 26, 2018).
The highest negative loading in the first component in Table 3.11 is related to
cost suggesting cost is a barrier to adoption of stove technology. Conversely, presence
of or access to luxury items is a variable used to predict adoption (Table 3.13). The
ahotor stove costs approximately twice as much as its predecessor, the chorkor stove.
The Guidelines advocate post-harvest processing innovations should be cost-efficient
(FAO, 2015, Section 7.5). At the time of this study, only three respondents had self-
financed the purchase of an ahotor stove. In this study, respondents that own the
ahotor stove were asked how long it would take for the stove to pay for itself. Sixty-
three percent stated it would take one year or less for this stove to pay for itself, 30
percent stated it would take more than one year and 7 percent did not know (n=43).

118
This information is useful to financing institutions that extend loans to fish processors
in Ghana.
Financing options are available to fish processors through microfinance
institutions, such as the Microfinance and Small Loans Centre (MASLOC). MASLOC
is responsible for implementing the Government of Ghana’s poverty reduction
programs. There is a MASLOC office in every district in Ghana that extends small
loans from 1,000 to 10,000 Cedis to support the development of small-scale
businesses. Microfinance is helpful; however, the cost of a stove is clearly a hurdle
that may cause sticker shock. Affordability is a constraint for diffusion of technology
in developing countries discussed by James (2013). Given what we have learned from
this study with respect to perceived attributes of innovation according to diffusion
theory, we suggest a change in diffusion terminology. We suggest replacing
complexity with simplicity so this attribute reflects a positive correlation with adoption
similar to other attributes such as relative advantage, compatibility, trialability, and
observability, instead of being the only attribute negatively correlated with adoption.
Re-wording this attribute creates a conditional statement, expressed as, if an
innovation is simple, then it is more likely to be adopted. The purpose behind creating
this statement is to guide practice, for example, if post-harvest fish processing
innovations are simple to use and understand, then they are more likely to be adopted.
In this study, an innovation that is simple to use and understand is a stove that is easy
to build and repair. Complexity of using fish finding technology (e.g. chronoscope and
track plotter) by fishermen in the Pacific Coast Trawl Fishery was considered a barrier
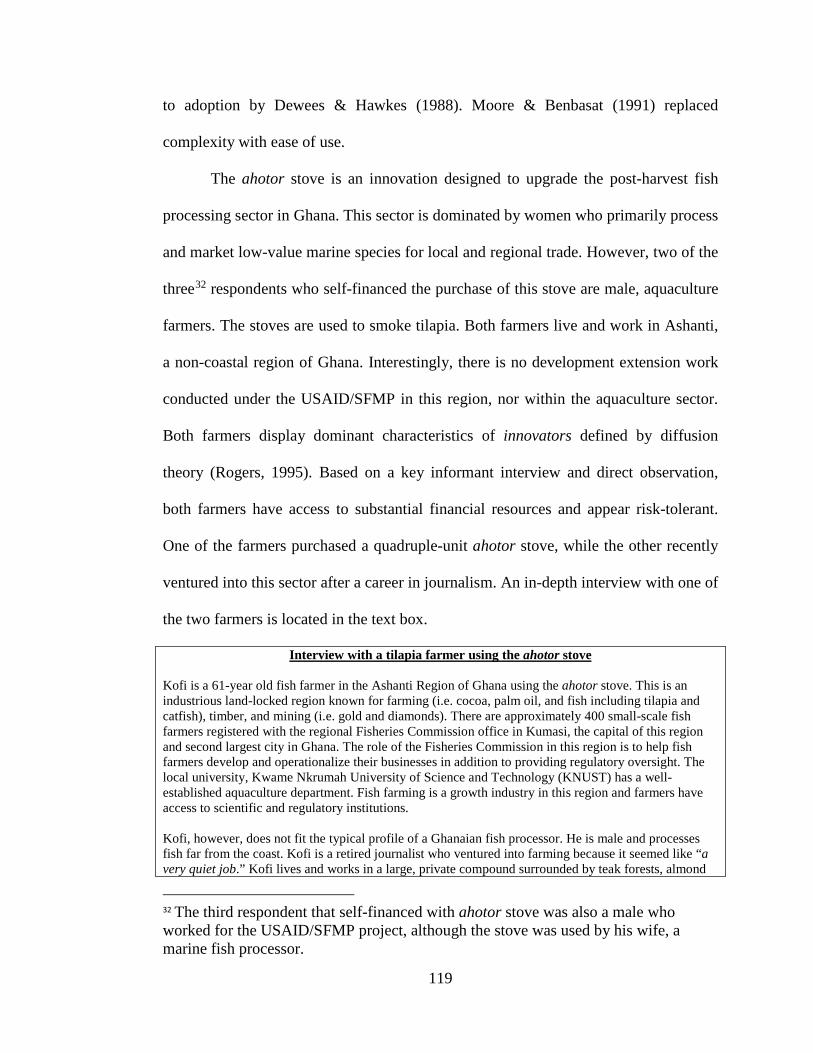
119
to adoption by Dewees & Hawkes (1988). Moore & Benbasat (1991) replaced
complexity with ease of use.
The ahotor stove is an innovation designed to upgrade the post-harvest fish
processing sector in Ghana. This sector is dominated by women who primarily process
and market low-value marine species for local and regional trade. However, two of the
three32 respondents who self-financed the purchase of this stove are male, aquaculture
farmers. The stoves are used to smoke tilapia. Both farmers live and work in Ashanti,
a non-coastal region of Ghana. Interestingly, there is no development extension work
conducted under the USAID/SFMP in this region, nor within the aquaculture sector.
Both farmers display dominant characteristics of innovators defined by diffusion
theory (Rogers, 1995). Based on a key informant interview and direct observation,
both farmers have access to substantial financial resources and appear risk-tolerant.
One of the farmers purchased a quadruple-unit ahotor stove, while the other recently
ventured into this sector after a career in journalism. An in-depth interview with one of
the two farmers is located in the text box.
Interview with a tilapia farmer using the ahotor stove Kofi is a 61-year old fish farmer in the Ashanti Region of Ghana using the ahotor stove. This is an industrious land-locked region known for farming (i.e. cocoa, palm oil, and fish including tilapia and catfish), timber, and mining (i.e. gold and diamonds). There are approximately 400 small-scale fish farmers registered with the regional Fisheries Commission office in Kumasi, the capital of this region and second largest city in Ghana. The role of the Fisheries Commission in this region is to help fish farmers develop and operationalize their businesses in addition to providing regulatory oversight. The local university, Kwame Nkrumah University of Science and Technology (KNUST) has a well-established aquaculture department. Fish farming is a growth industry in this region and farmers have access to scientific and regulatory institutions. Kofi, however, does not fit the typical profile of a Ghanaian fish processor. He is male and processes fish far from the coast. Kofi is a retired journalist who ventured into farming because it seemed like “a very quiet job.” Kofi lives and works in a large, private compound surrounded by teak forests, almond
32 The third respondent that self-financed with ahotor stove was also a male who worked for the USAID/SFMP project, although the stove was used by his wife, a marine fish processor.

120
trees and tilapia ponds. Every morning, Kofi feeds his fish and then goes back to writing as a hobby. As a farmer, Kofi is concerned about post-harvest loss of fish due to spoilage. He would like to improve the quality of his fish and was thinking about ways to add value to his product because “when you have fish it rots and fishmongers want to buy it cheap, instead of selling them rotten fish, I decided to start smoking it.” In early 2017, Kofi came across an advertisement in the Daily Graphic, a national newspaper, that talked about a new fish processing stove called ahotor and how this stove reduces post-harvest loss of fish in other regions of Ghana. Such advertisements are part of the USAID/SFMP’s mass communication messaging strategy, albeit not directed at this region, nor sector. Intrigued by the advertisement given his concerns with post-harvest loss, Kofi contacted the Business Advisory Council (similar to a Chamber of Commerce) who introduced him to a USAID/SFMP project partner (i.e. SNV). Within 2 weeks, Kofi had met with SNV to discuss details of purchasing and delivering the ahotor stove and secured a bank loan for 2,200 cedis to pay for it. The loan was paid off in 3 months from his own line of credit, not from fish sales. However, Kofi believes fish smoking will contribute to 40 percent of his household income in the future. His business strategy is to wait until all the “bad, cheap fish is off the market, harvest his fish ponds in September (2017) and sell into the market in December when supply of fish is low.” Kofi has been using the ahotor stove with fish from the cold storage and sends smoked fish to the market with women because in Ghana they say “market women, not market men.” Kofi believes tilapia smoked by the ahotor stove will sell faster at the market because it is “well smoked, more palatable and sumptuous looking.”
- Interview conducted on July 18, 2017 in Ashanti region
This is an example of unintended, yet beneficial, consequence of upgrading
aquaculture farmers by diffusing an innovation designed for the marine capture
fisheries value chain in Ghana. This may lead to diffusion of the ahotor stove within a
new node (e.g. tilapia farmers). The aquaculture sector in Ghana is growing at a rate of
10 percent year primarily through production of tilapia, which accounts for 90 percent
of aquaculture production (FAO, 2016).
The innovation, however, failed to benefit some it targeted. For example, one-
fifth of those who own the ahotor stove had not adopted it despite being fully
subsidized. Non-adoption occurred for various reasons shown in Table 3.3. One
reason suggests a gap in implementation. We learned that two beneficiaries were not
using the stove at the time of the study due to missing parts, or incomplete delivery of
the stove. For them, the new technology was not fully assembled nor ready for use.

121
The “implementation gap” in the context of coastal management policy and practice is
characterized by Lowry (1985) as essentially a disconnect between the design and
execution of a program. While this is an acute example of a gap in implementation
(that was rectified as a result of this study), we also observed no improvising to
compensate for missing components, not even a grate. This leads to other reasons for
non-adoption identified in this study such as lack of working capital to purchase fish
and fuelwood, no land to build a stove and lack of preferential markets to sell fish
smoked by the ahotor stove. These reasons give us a lens into the problems facing
many poor and why they may perceive the risk (of an innovation) higher than its
reward.
Vulnerable households provisioned with an ahotor stove demonstrate least
possession of wealth, inferred from an MSL scale (Figure 3.4). While this is consistent
with criteria used to select this group of under the SFMP, we also learned that some
fish processors were not able to benefit from this stove because they simply did not
have sufficient working capital to purchase primary inputs needed to smoke fish nor
did they own land to place a fixed asset (Table 3.3). This depicts a “poverty trap,” or
remaining in poverty because one has too little to invest. It is the beginning of a cycle
that leads to a poverty trap zone33 discussed by Banerjee & Duflo (2011) in Poor
Economics: A radical rethinking of the way to fight global poverty. Banerjee & Duflo
(2011) recognize the entrepreneurial spirit that exists among those living in this zone
but describe them as reluctant and risk-averse with respect to capital investments due
33 The poverty trap zone is illustrated in a diagram as the S-shape of a curve whereby the y-axis represents future income and the x-axis represents current income. If future income is lower than current income one becomes poorer and eventually trapped in poverty (Banerjee & Duflo, 2011, p.12).

122
to financial constraints, adversity and uncertainty. Banerjee & Duflo (2011) conclude
that if perceived risks outweigh anticipated rewards, it will prevent the poor from
pursuing capital-intensive investments. Other development economists similarly
observe aversion to risk among people living at the margin, or on the edge of
subsistence (Ascher, Brewer, Garry, Cheema, & Heffron, 2016).
Understanding the economic lives of the poor is important in order to design
innovations and policies that create pathways out of the poverty trap zone and achieve
broader development goals such as poverty alleviation. For example, for fish
processors that do not own land34 or frequently migrate in search of fish, a mobile fish
smoker is perhaps more beneficial than a fixed asset. A potential pathway out of
poverty in nodes dominated by women in fisheries are conditional cash transfer
programs linked to social welfare programs such as basic health and family planning
services, education, and small and medium-scale business training. This type of
program is discussed by Ascher et al. (2016) and proposed for this node in Beran &
Crawford (2018). Beran & Crawford (2018) discuss evidence of successful conditional
and unconditional cash transfer programs benefitting women in Africa. Results from a
randomized experimental design in Uganda showed that after four years of cash
transfers, incomes among female beneficiaries were 84 percent greater than incomes
among females in the control group, and 31 percent greater relative to incomes among
males in the control group (Blattman, Fiala, & Martinez, 2013). Conditional cash
transfer programs often require families to keep children in school and provide them
with basic health care. A Philippines program on conditional cash transfers
34 According to Crawford et al. (2016), only 30 percent of fishing households in Ghana own non-agricultural land (i.e. property on which is house is constructed).

123
demonstrated improved school enrollment of children aged 3-11 and reduced child
stunting among the beneficiary group (Chaudhury, Friedman, & Onishi, 2013). Ascher
et al. (2016) and Banerjee & Duflo (2011) recognize cash transfer programs are social
safety nets that benefit society as a whole. The high rate of illiteracy in fishing
communities and occupational environment created by smoking fish justifies
implementing this type of program within this node.
Other non-adopters voice suspicion and skepticism over the innovation (Table
3.3). For example, one respondent acknowledged she “is not using the stove because
it’s expensive and it puts nice fish out and she will not get any price addition from
customers at the traditional markets.” This statement exemplifies reluctance and
aversion to risk around this innovation. There is no economic incentive to use the
ahotor stove according to this processor.
While for other processors it appears, there are potential economic benefits
according to variables measured in this study. This study provides some evidence of
economic benefits for fish processors using this innovation beginning with cost-
savings of fuelwood. Fish processors spend less money on fuelwood using the ahotor
versus the chorkor stove (Table 3.16). This is one form of immediate compensation,
but is this enough to overcome the initial cost of the investment? We propose another
value proposition, that consumer-driven demand for better quality and healthier fish
products will diffuse innovations. This may become more apparent and relevant as
supplies from small-scale fisheries to the international market increase or through
consumer awareness campaigns in the national market (e.g. where fish is processed
and consumed). We suggest raising awareness of health, environmental and improved

124
product attributes (e.g. color, texture and flavor of smoked fish) at the consumer node,
or those at the end of the value chain to create consumer-driven demand.
In this study, those using the ahotor stove perceive it produces much better
quality of smoked fish than the group using the chorkor stove. The difference is
statistically significant and points to potential economic and market benefits as a result
increased demand for better quality, and potentially healthier smoked fish. For
example, it was noted (and observed) that the chorkor stove “makes fish dark or burns
it more (e.g. smoke deposits),” while the ahotor stove “makes fish brown and appear
brighter.” With respect to higher demand, some respondents state fish smoked by
ahotor stove “sells faster at the market than fish smoked by chorkor,” while others
state “all fish sells at the market and customers cannot differentiate.”
Future evaluations could focus on economic and health benefits of fish smoked
by improved fish processing technology. For example, a controlled experiment to
determine changes in profitability using the ahotor stove or willingness to pay
estimation for its products could be next steps. This would require training,
coordination and communication with other nodes along the chain such as traders,
transporters and consumers. Yet if other nodes perceive, or directly benefit from
changes in fish processing technology, perhaps they will dictate or diffuse this
innovation that upgrades this node.
Conclusion
Fish smoking technology has evolved over the years in response to changes at-
sea and on land. The chorkor stove addressed capacity concerns at a time when fish
landings and forests were more abundant than they are today. Today, technology that

125
reduces fuelwood consumption and improves safety and quality of smoked fish
products is the driving force behind development of the ahotor stove.
The results presented in this paper identify factors that influence adoption of
the ahotor stove in Ghana through the lens of diffusion theory. We conclude that
certain technological features of the ahotor stove such as energy efficiency, smoke
reduction and hands-on training plus simplicity with the ability to pay predict adoption
of ahotor in Ghana. These results support recommendations made by The Guidelines
(FAO, 2015) that seek ways to create value addition and reduce waste through local,
energy-efficient and cost-effective innovations in small-scale fish processing.
However, the cost and construction of the ahotor stove is a potential barrier to
adoption. Therefore, we recommend that fuel-efficient innovations should be simple to
build, easy-to-use and affordable to buy within the context of small-scale fisheries in
developing countries.
In this study, we measure environmental, economic and health perceptions of
new technology among fish processors in Ghana. We conclude the ahotor stove is
more fuelwood-efficient than the chorkor stove. We learn that specific design features
of the ahotor stove are shown to reduce PAHs based on a limited sample. These
design features also prevent excessive exposure to heat and smoke, a personal health
benefit to fish processors and consumers of smoked fish. The environmental paradox,
however, is that complexity, or cost and construction of greener designs may outweigh
the benefits of cleaner, safer smoking technology. Finally, we learn that an
overwhelming majority of those using the ahotor stove state they spend less money on
fuelwood using this stove versus the chorkor stove. For some along the fisheries and

126
farming value chain, the trade-off is worth the investment. However, for vulnerable
people working in fisheries, the struggles of daily life often stand in the way of
improving it.
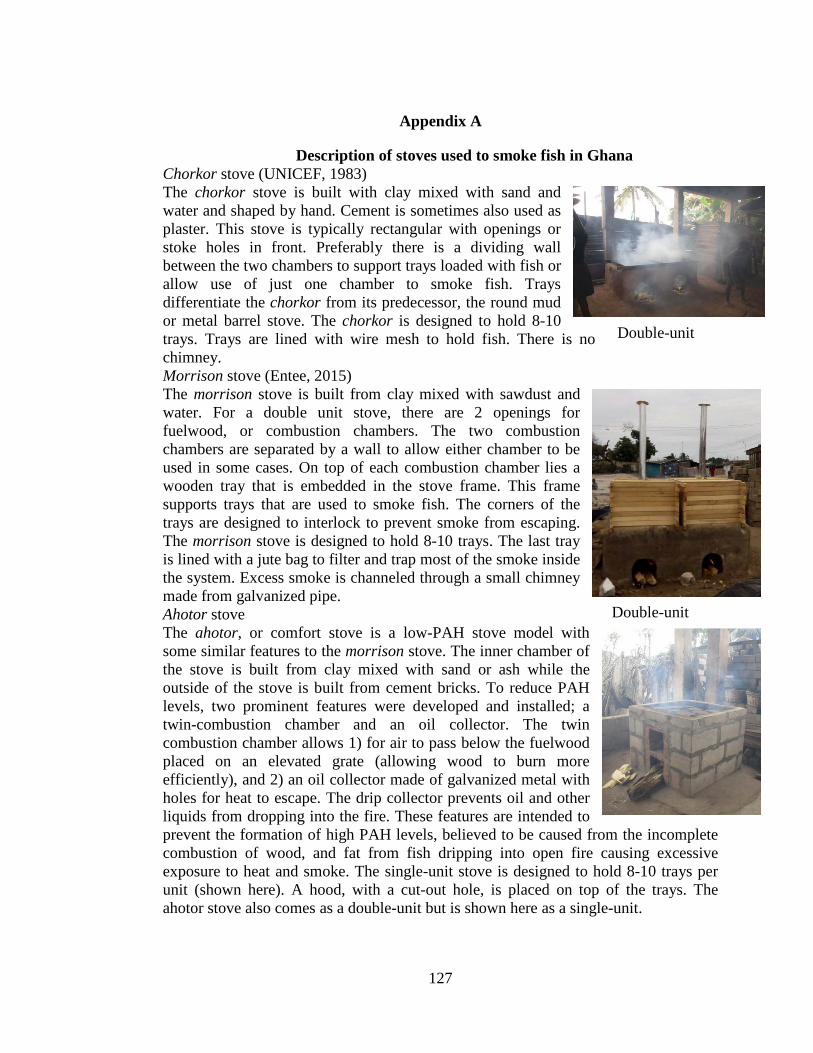
127
Appendix A
Description of stoves used to smoke fish in Ghana Chorkor stove (UNICEF, 1983) The chorkor stove is built with clay mixed with sand and water and shaped by hand. Cement is sometimes also used as plaster. This stove is typically rectangular with openings or stoke holes in front. Preferably there is a dividing wall between the two chambers to support trays loaded with fish or allow use of just one chamber to smoke fish. Trays differentiate the chorkor from its predecessor, the round mud or metal barrel stove. The chorkor is designed to hold 8-10 trays. Trays are lined with wire mesh to hold fish. There is no chimney. Morrison stove (Entee, 2015) The morrison stove is built from clay mixed with sawdust and water. For a double unit stove, there are 2 openings for fuelwood, or combustion chambers. The two combustion chambers are separated by a wall to allow either chamber to be used in some cases. On top of each combustion chamber lies a wooden tray that is embedded in the stove frame. This frame supports trays that are used to smoke fish. The corners of the trays are designed to interlock to prevent smoke from escaping. The morrison stove is designed to hold 8-10 trays. The last tray is lined with a jute bag to filter and trap most of the smoke inside the system. Excess smoke is channeled through a small chimney made from galvanized pipe. Ahotor stove The ahotor, or comfort stove is a low-PAH stove model with some similar features to the morrison stove. The inner chamber of the stove is built from clay mixed with sand or ash while the outside of the stove is built from cement bricks. To reduce PAH levels, two prominent features were developed and installed; a twin-combustion chamber and an oil collector. The twin combustion chamber allows 1) for air to pass below the fuelwood placed on an elevated grate (allowing wood to burn more efficiently), and 2) an oil collector made of galvanized metal with holes for heat to escape. The drip collector prevents oil and other liquids from dropping into the fire. These features are intended to prevent the formation of high PAH levels, believed to be caused from the incomplete combustion of wood, and fat from fish dripping into open fire causing excessive exposure to heat and smoke. The single-unit stove is designed to hold 8-10 trays per unit (shown here). A hood, with a cut-out hole, is placed on top of the trays. The ahotor stove also comes as a double-unit but is shown here as a single-unit.
Double-unit
Double-unit

128
Appendix B
Results from the Controlled Cooking Test (CSIR et al., 2016)

129
Appendix C
Key informant questionnaire
Date of Interview Name of Interviewer Position/Project partner Region Language
Key Informant Interview Guide
Purpose: The goal of conducting KII with SFMP project partners is to find out what types of promotional efforts, financing mechanisms and communication channels were used to promote the Ahotor stove. The information obtained from these interviews will be used to inform Section A. of the structured questionnaire administered to fish processors in various regions to determine the impact of these efforts (promotional, financial, communication) on fish processors to adopt or not.
Semi-structured Interview Questionnaire
Promotional efforts (clarify time period, ex: 1 year): 1. Has your organization conducted any demonstration trainings of IFSS? (Y/N) 2. If yes, list all sites where a demonstration was conducted. 3. How many demonstrations were conducted at each site? (#/site)
Financial mechanisms (discuss financing options or subsidy amount) 1. Does your organization offer any financing options for IFSS? (Y/N) 2. If yes, explain all the types of financing options available to fish processors 3. Does your organization offer a subsidy for IFSS? (Y/N) 4. If yes, what is the amount of the subsidy? (%)
Mass communication strategies (discuss method of communication)
Communication method Number of times used (year?) Radio program Signage Peer contact with demo user Other:

130
Appendix D
Structured questionnaire for fish processors

131
Ghana Fish Processor's Survey
The purpose of this survey is to better understand how improved fish smoking stoves are being perceived by fish processors in Ghana. I will ask you questions specifically about the type of stove you are using and about the benefits and challenges of using this type of stove. This survey will take 45 minutes of your time.
You need to obtain verbal consent from the respondent before you can administer the survey. Carefully read aloud the consent form and clarify any ambiguities. Answer the following question based on the response from the respondent.
Do you, enumerator, affirm that you have read aloud the consent statement to the participant and they have consented to the enumerator through the translator?
yes
no
Interview number
Date and time
yyyy-mm-dd
hh:mm
Name of community
GPS GPS coordinates can only be collected when outside.
latitude (x.y °)
longitude (x.y °)
altitude (m)
accuracy (m)

132
May I take your picture?
Region
Western
Central
Volta
Greater Accra
What language do you speak?
Fanti
Ewe
Ga
Other
Communication channels Have you heard of Ahotor?
yes
no
How many months ago did you first hear about the Ahotor stove?
From whom did you first hear about Ahotor?
Training
Demo
Media
Other
Specify other.
Are you using the Ahotor stove?
yes
no

133
Have you already signed up to finance the Ahotor?
yes
no
How did you obtain your Ahotor stove?
Self finance
Demo
Morrison retrofit
Vulnerable household
Other
Specify other.
Describe how you got it in more detail
How many months ago did you get the Ahotor stove?
From which of these sources did you get information about Ahotor?
Media
Training
Relative
Other
Specify other.
Which source of information influenced you (to get Ahotor) the most?
Media
Training
Relative
Other
Specify other.

134
Which stoves do you own now?
Chorkor
Traditional cylindrical/rectangular metal drum stove
Morrison
Morrison being converted to Ahotor
Kosmos/Frismo Oven
FTT/Thiarove stove
Other
Specify other.
Which stove(s) were you using before the Ahotor stove? (Tick all that apply)
Chorkor
Traditional cylindrical/rectangular metal drum stove
Morrison
Morrison being converted to Ahotor
Kosmos/Frismo Oven
FTT/Thiarove stove
Other
Specify other.
Which stove(s) were you using before your current stove? (Tick all that apply)
Chorkor
Traditional cylindrical/rectangular metal drum stove
Morrison
Morrison being converted to Ahotor
Kosmos/Frismo Oven
FTT/Thiarove stove
Other
Specify other.

135
How many stoves do you own now?
Why did you decide to start using the Ahotor stove?
Why are you not using Ahotor stove?
Relative Advantage (of Ahotor compared to previous smokers used) Does Ahotor use less fuelwood (to smoke) compared to other stoves?
Yes
No
I don't know
Compared to other stoves, do you spend less money on fuelwood with Ahotor?
Yes
No
I don't know
How is the smoke nuisance (to eyes) when using Ahotor compared to other stoves?
Better
Worse
About the same
Is the smoke better or much better?
Better
Much better
Is the smoke worse or much worse?
Worse
Much worse
Do you get injuries when you smoke fish?
Yes
No
Explain the injuries

136
How is the (accidental) breakage of fish during smoking with Ahotor compared to other stoves?
Better
Worse
About the same
Is the breakage better or much better?
Better
Much better
Is the breakage worse or much worse?
Worse
Much worse
How is the color of fish smoked by Ahotor compared to other stoves?
Better
Worse
About the same
Is the color of the smoked fish better or much better?
Better
Much better
Is the color of the smoked fish worse or much worse?
Worse
Much worse
Is there more demand (from the people who buy your fish) for fish smoked by Ahotor compared to fish smoked by other stoves during the bumper season?
Yes
No
I don't know
If yes, explain why
Does the Ahotor stove cost less money to buy compared to other stoves you have used?
Yes
No
I don't know

137

138

139
Is the cost of the your current stove a barrier (to buy) compared to other stoves?
yes
no
If yes, please explain what the barrier or difficulty of buying your current stove is?
Explain what the benefits are from investing in your current stove
Is the cost of your current stove worth the benefit you get compared to other stoves?
Yes
No
I don't know
Compatibility Does the Ahotor stove work well for types of fish you process?
Yes
No
I don't know
If no, why?
Is it easy load trays?
Yes
No
I don't know
Do you have enough trays for the amount of fish you smoke with the Ahotor stove?
Yes
No
I don't know
If no, why don’t you have enough trays

140
Because of this type of stove, do you need to hire extra assistance (a person to help you) to smoke?
Yes
No
I don't know
Compatibility Does your current stove work well for types of fish you process?
Yes
No
I don't know
If no, why?
Is it easy load trays?
Yes
No
I don't know
Do you have enough trays for the amount of fish you smoke with your current stove?
Yes
No
I don't know
If no, why don’t you have enough trays
Because of this type of stove, do you need to hire extra assistance (a person to help you) to smoke?
Yes
No
I don't know
Complexity

141
How difficult is it to learn how to use the Ahotor stove?
Very difficult
Difficult
Easy
Very easy
Can you build the stove yourself?
Yes
No
I don't know
If no, why not?
How difficult is it to find someone (artisan) to construct/install the Ahotor stove?
Very difficult
Difficult
Easy
Very easy
Is it easy to repair the Ahotor stove if it breaks?
Yes
No
I don't know
Complexity How difficult is it to learn how to use your current stove?
Very difficult
Difficult
Easy
Very easy
Can you build the stove yourself?
Yes
No
I don't know

142
If no, why not?
How difficult is it to find someone (artisan) to construct/install your current stove?
Very difficult
Difficult
Easy
Very easy
Is it easy to repair your current stove if it breaks?
Yes
No
I don't know
Trialability Did you receive training on how to use the Ahotor stove before getting it?
yes
no
Did you experiment with the Ahotor stove enough times until you were satisfied before deciding to get it?
yes
no
Trialability Did you receive training on how to use your current stove before getting it?
yes
no
Did you experiment with your current stove enough times until you were satisfied before deciding to get it?
yes
no
Observability Is your stove located in an area where other smokers can easily see it?
Yes
No
I don't know

143
Do other fish processors who do not have an Ahotor ask you about your stove?
Yes
No
I don't know
Is it noticeable to other people that fish smoked by Ahotor is different?
Yes
No
I don't know
If yes, how do other people describe the difference between fish smoked by Ahotor and fish smoked by other stoves?
Observability Is your stove located in an area where other smokers can easily see it?
Yes
No
I don't know
Do other fish processors who do not have your stove ask you about your stove?
Yes
No
I don't know
Is it noticeable to other people that fish smoked by your current stove is different?
Yes
No
I don't know
If yes, how do other people describe the difference between fish smoked by your current stove and fish smoked by other stoves?
Socio-demographic information What is your age?

144
How many years have you been smoking fish?
How do you know how much money you are making?
Do you leave your community to sell your fish?
Often
Occasionally
Rarely
Never
At approx. how many different markets do you sell your fish?
List the most important market.
Why is this the most important?
What much of your household income is from fish smoking?
Less than 25%
25-50%
50-75%
75-100%
Which of the following do you have in your household?
Radio
Tape player
TV
Sewing machine
Refrigerator

145
Type of roof
Asbestos or slate
Corrugated metal sheets
Other
Type of floor
Cement or concrete
Earth, mud, mud bricks
Other
Do you have water supply in house?
yes
no
Do you have electricity supply in the house?
yes
no
Dwelling toilet type
KVIP
Public toilet
No toilet facility
Other
Perceived economic, health and environmental benefits Does fish smoked by Ahotor sell faster (to buyer/market) than fish smoked by other stoves?
Yes
No
I don't know
How is the quality of fish smoked using Ahotor compared to previous stoves?
Better
Worse
About the same
Is the quality better or much better?
Better
Much better

146
Is the quality worse of much worse?
Worse
Much worse
Do you believe the Ahotor stove will pay for itself in
Less than 1 year
1 year
More than 1 year
I don't know
With Ahotor, do you experience less asthma and coughing?
Yes
No
I don't know
Are you concerned about scarcity of fuelwood?
Yes
No
I don't know
Is scarcity of fuelwood a reason why you use Ahotor?
yes
no
Ahotor helps protect forest (fuelwood) habitat
Strongly disagree
Disagree
Agree
Strongly agree
Perceived economic, health and environmental benefits Does fish smoked by your current stove sell faster (to buyer/market) than fish smoked by other stoves?
Yes
No
I don't know

147
How is the quality of fish smoked using your current stove compared to previous stoves?
Better
Worse
About the same
Is the quality better or much better?
Better
Much better
Is the quality worse of much worse?
Worse
Much worse
With your current stove, do you experience less asthma and coughing compared to previous stoves?
Yes
No
I don't know
Are you concerned about scarcity of fuelwood?
Yes
No
I don't know
Is scarcity of fuelwood a reason why you use your current stove?
yes
no
Your current stove helps protect forest (fuelwood) habitat
Strongly disagree
Disagree
Agree
Strongly agree
Perceived environmental benefits of fuelwood Suppose the bottom square represents the worst possible overall condition of availability of fuelwood and the top represents the best. For example, the worst possible availability of fuelwood is when you have to travel further to get wood or pay more for fuelwood and sometimes you do not smoke fish because fuelwood is scarce or expensive. The best availability of fuelwood is when you can easily get fuelwood and you do not need to pay more for it because it is abundant, there is plenty of fuelwood nearby.

148
Where on the ladder is the availability of fuelwood this year?
10 (Best)
9
8
7
6
5
4
3
2
1 (Worst)
Where was it 5 years ago?
10 (Best)
9
8
7
6
5
4
3
2
1 (Worst)
Where will the availability of fuelwood be 5 years from now?
10 (Best)
9
8
7
6
5
4
3
2
1 (Worst)

149
Perceived environmental benefits of fishing
Suppose the bottom square represents the worst possible overall economic fishing conditions and the top represents the best. For example, the worst possible fishing conditions is when when one goes out to sea and catches no fish at all and sometimes do not even go to sea because you think there will be no fish to catch. The best possible fishing conditions is if you go to sea and fill your whole boat with fish in a short period of time and there is plenty of fish to catch.
Where on the ladder are fishing conditions this year?
10 (Best)
9
8
7
6
5
4
3
2
1 (Worst)
Where were they 5 years ago?
10 (Best)
9
8
7
6
5
4
3
2
1 (Worst)

150
Where will fishing be 5 years from now?
10 (Best)
9
8
7
6
5
4
3
2
1 (Worst)
Women's participation in fisheries management of sardinella Do you belong to any organizations that discuss rules and laws about fishing?
yes
no
Why not?
Which organizations?
Select your level of particpation
Very active
Somewhat active
Rarely active
Are you comfortable speaking up at these meetings about problems in the fishery that affect you?
Yes
No
I don't know
If no, why not?

151
Do you feel you have influence (over friends and family) about their fishing practices?
Yes
No
I don't know
Do you own any fishing boats?
yes
no
Do you finance any fishing trips?
yes
no

152
Appendix E
Scale construction to measure innovation attributes Definition: Relative advantage is the degree to which an innovation is perceived as being better than the one before it. In this study, we ask respondents about the degree to which their current stove is better than their previous stove. Measurement: Nine sub-variables, or indicators, measure relative advantage. The sub-variables35 are scaled questions. Sub-variables XLWG = do you use less fuelwood? [-1 = no, 0 = I don’t know, 1 = yes] XSPG = do you spend less money on fuelwood? [-1 = no, 0 = I don’t know, 1 = yes] EG = how is the smoke nuisance to your eyes? [1= much better, 0.5 = better, 0 = same, -0.5 = worse, -1 = much worse] BG = How is the breakage of fish? [1= much better, 0.5 = better, 0 = same, -0.5 = worse, -1 = much worse] CT = How is the color of fish? [1= much better, 0.5 = better, 0 = same, -0.5 = worse, -1 = much worse] XHDG = Is demand higher? [-1 = no, 0 = I don’t know, 1 = yes] XCOSG = Does the stove cost less than the previous stove? [-1 = no, 0 = I don’t know, 1 = yes] XBARG36= Is the cost of the stove a barrier to buy? [1= yes, -1 = no] XCOBEG = Is the cost worth the benefit? [-1 = no, 0 = I don’t know, 1 = yes] Ahotor treatment group: n=48 Chorkor treatment group: n=63 35 Sub-variables are transformed based on stove treatment group. For example, XLWG is a transformed variable from XLESSWOOD + XCLESSWOOD. XLESSWOOD is a scaled question about use of fuelwood directed at the ahotor treatment group, whereas XCLESSWOOD is the same question but directed at the chorkor treatment group. 36 Score reversed to ensure directional continuity with other scales.

153
Definition: Compatibility is the extent to which an innovation is consistent with existing values, past experiences and needs of potential adopters. In this study, we ask respondents if their current stove is consistent with their needs of a stove based on the evolution of smoking technology, or past stoves. Measurement: Four sub-variables, or indicators, measure compatibility. The sub-variables37 are scaled questions. Sub-variables XWORG= does the stove work well for the types of fish you process? [-1 = no, 0 = I don’t know, 1 = yes] XEZLG = is it easy to load trays? [-1 = no, 0 = I don’t know, 1 = yes] XSUFG = do you have enough trays for the amount of fish you smoke? [-1 = no, 0 = I don’t know, 1 = yes] EXTG38 = do you need to hire extra assistance to help you smoke? [-1 = no, 0 = I don’t know, 1 = yes] Ahotor treatment group: n=48 Chorkor treatment group: n=63
37 Sub-variables are transformed based on stove treatment group. For example, XWORG is a transformed variable from XWORKWELL + XCWORKWELL. XWORKWELL is a scaled question about compatibility of stove with types of fish processed directed at the ahotor treatment group, whereas XCWORKWELL is the same question but directed at the chorkor treatment group. 38 Score reversed to ensure directional continuity with other scales.

154
Definition: Complexity is the extent to which an innovation is perceived easy or difficult to use. In this study, we ask respondents about the degree to which their current stove is easier or more difficult to use, build and repair. Measurement: Four sub-variables, or indicators, measure complexity. The sub-variables39 are scaled questions. Sub-variables DIFG = how difficult is it to use? [1= very easy, 0.5 = easy, -0.5 = difficult, -1 = very difficult] XBLDG = can you build it? [-1= no, 0 = I don’t know, 1 = yes] EZFG = how difficult is it to find someone to build it? [1= very easy, 0.5 = easy, -0.5 = difficult, -1 = very difficult] XEZRG = is it easy to repair? [-1= no, 0 = I don’t know, 1 = yes] Ahotor treatment group: n=48 Chorkor treatment group: n=63
39 Sub-variables are transformed based on stove treatment group. For example, DIFG is a transformed variable from DIFFICULT + CDIFFICULT. DIFFICULT is a scaled question about ease of use (of stove) directed at the ahotor treatment group, whereas CDIFFICULT is the same question but directed at the chorkor treatment group.

155
Definition: Trialability is the extent to which an innovation may be experimented with or tested. In this study, we ask respondents about the degree to which they were trained on their current stove compared to their previous stove and level of satisfaction with the training(s). Measurement: Two sub-variables, or indicators, measure trialability. The sub-variables40 are scaled questions. Sub-variables XTRIG = Did you get trained on it? [0 = no, 1 = yes] XTXPG = did you get enough training until you were satisfied before using it? [0 = no, 1 = yes] Ahotor treatment group: n=48 Chorkor treatment group: n=63
40 Sub-variables are transformed based on stove treatment group. For example, XTRIG is a transformed variable from XTRITRAIN + XCTRITRAIN. XTRITRAIN is a scaled question about training (of stove) directed at the ahotor treatment group, whereas XCTRITRAIN is the same question but directed at the chorkor treatment group.

156
Definition: Observability is the extent to which results of an innovation are visible to others. In this study, we ask respondents if the stove they are being asked about is visible to others, or if others express interest in the stove, or if fish smoked by the stove looks different than fish smoked by a previous stove. Measurement: Three sub-variables, or indicators, measure observability. The sub-variables41 are scaled questions. Sub-variables XECG = is it (stove) visible to others? [-1 = no, 0 = I don’t know, 1 = yes] XASKG = do other fish processors ask you about your stove? [-1 = no, 0 = I don’t know, 1 = yes] XVISG = is it noticeable to others that fish smoked by your current stove looks different than fish smoked by your previous stove? [-1 = no, 0 = I don’t know, 1 = yes] Ahotor treatment group: n=48 Chorkor treatment group: n=63
41 Sub-variables are transformed based on stove treatment group. For example, XECG is a transformed variable from XEASYSEE + XCEASYSEE. XEASYSEE is a scaled question about visibility of the stove directed at the ahotor treatment group, whereas XCEASYSEE is the same question but directed at the chorkor treatment group.

157
Appendix F
Self-anchoring ladder (Cantril, 1963)
10 (Best)
9
8
7
6
5
4
3
2
1 (Worst)

158
References
Akande, G., & Diei-Ouadi, Y. (2010). Post-harvest Losses in Small-scale Fisheries: Case Studies in Five sub-Saharan African Countries. FAO Fisheries and Aquaculture Technical Paper, (550). 77p.
Akpambang, V., Purcaro, G., Lajide, L., Amoo, I., Conte, L., & Moret, S. (2009). Determination of Polycyclic Aromatic Hydrocarbons (PAHs) in Commonly Consumed Nigerian Smoked/Grilled Fish and Meat. Food Additives and Contaminants, 26(7), 1096-1103.
Ascher, W., Brewer, G. D., Cheema, G. S., & Heffron, J. M. (2016). Evolution of Economic Development Theories and Doctrines Since World War II. The Evolution of Development Thinking. Springer. 15-39pp.
Avega, B., & Tibu, G. (2017). Performance evaluation survey (Ahotor oven). The USAID/Ghana Sustainable Fisheries Management Project (SFMP). Narragansett, RI: Coastal Resources Center, Graduate School of Oceanography, University of Rhode Island and Netherlands Development Organisation.GH2014_ACT099_SNV. 33p.
Ba, A., Schmidt, J., Dème, M., Lancker, K., Chaboud, C., Cury, P., . . . Brehmer, P. (2017). Profitability and Economic Drivers of Small Pelagic Fisheries in West Africa: A Twenty-year Perspective. Marine Policy, 76, 152-158. doi:https://doi.org/10.1016/j.marpol.2016.11.008
Bailis, R. (2004). Controlled Cooking Test. Version 2.0. Shell Foundation (Household Energy and Health Programme). https://cleancookstoves.org/binary-data/DOCUMENT/file/000/000/80-1.pdf
Banerjee, A. V., Banerjee, A., & Duflo, E. (2011). Poor Economics: A Radical Rethinking of the Way to Fight Global Poverty. Public Affairs. New York.
Beran, K., Crawford, B. (2018). Assessment of Ahotor Stove Grants on Households Vulnerable to Child Labor and Trafficking. The USAID/Ghana Sustainable Fisheries Management Project (SFMP). Narragansett, RI: Coastal Resources Center, Graduate School of Oceanography, University of Rhode Island and CEWEFIA and DAA. 30 pp.
Blattman, C., Fiala, N., & Martinez, S. (2013). Generating Skilled Self-Employment in Developing Countries: Experimental Evidence from Uganda. The Quarterly Journal of Economics, 129(2), 697-752.
Cantril, H., & Livingston, W. K. (1963). The Concept of Transaction in Psychology and Neurology. Journal of Individual Psychology, 19(1), 3.

159
Cattell, R. B. (1966). The Scree Test for the Number of Factors. Multivariate Behavioral Research, 1(2), 245-276.
Chaudhury, N., Friedman, J., & Onishi, J. (2013). Philippines Conditional Cash Transfer Program Impact Evaluation 2012. Manila: World Bank Report, (75533-PH).
Cinner, J., Daw, T., & McClanahan, T. (2009). Socioeconomic Factors that Affect Artisanal Fishers’ Readiness to Exit a Declining Fishery. Conservation Biology, 23(1), 124-130.
Codex Alimentarius Commission. (2009). Code of Practice for the Reduction of Contamination of Food with Polycyclic Aromatic Hydrocarbons (PAH) from Smoking and Direct Drying Processes. Cac/rcp, 68.
Cohen, J. (1988). Statistical Power Analysis for the Behavioral Sciences. 2nd.
Crawford, B., Gonzales, L., Amin, D., Nyari-Hardi, B., & Sarpong, Y. (2016). Report on the Baseline Survey of Small Pelagic Fishing Households Along the Ghana Coast. The USAID/Ghana Sustainable Fisheries Management Project (SFMP) Narragansett, RI: Coastal Resources Center, Graduate School of Oceanography, University of Rhode Island.GH2014_PGM187_CRC. 122pp.
Dentoni, D., & English, F. (2012). Dealing with Cultural Differences in Public-Private R&D projects: The Experience of the Australian Seafood Sector. International Food and Agribusiness Management Review, 15(A), 127-132.
Dewees, C., & Hawkes, G. (1988). Technical Innovation in the Pacific Coast Trawl Fishery: The Effects of Fishermen's Characteristics and Perceptions on Adoption Behavior. Human Organization, 47(3), 224-234.
European Food Safety Authority. (2008). Polycyclic Aromatic Hydrocarbons in Food. Scientific Opinion of the Panel on Contaminants in the Food Chain. European Food Safety Authority Journal 724, 114p.
Entee, S. (2015). Post-harvest Processing Value Chain Literature Review Report. The USAID/Ghana Sustainable Fisheries Management Project (SFMP). Narragansett, RI: Coastal Resources Center, Graduate School of Oceanography, University of Rhode Island and Netherlands Development Organization.GH2014_ACT022_SNV. 36pp.
Food and Agriculture Organization of the United Nations. (February, 2016). Fishery and Aquaculture Country Profiles. The Republic of Ghana. Retrieved August 12, 2018 from http://www.fao.org/fishery/facp/GHA/en.

160
Food and Agriculture Organization of the United Nations. (2015). Voluntary guidelines for securing sustainable small-scale fisheries in the context of food security and poverty eradication. Food and Agriculture Organization of the United Nations. Rome.
Gordon, A., Pulis, A., & Owusu-Adjei, E. (2011). Smoked Marine Fish from Western Region, Ghana: A Value Chain Assessment. World Fish Center. 41pp.
Hall, G. M. (2011). Fish Processing: Sustainability and New Opportunities. John Wiley & Sons. Oxford, UK.
Harlow, L. (2014). The Essence of Multivariate Thinking: Basic Themes and Methods. Routledge. New York.
Institute for Industrial Research [CSIR], Ghana Standards Authority [GSA], Kwarteng, E. (2016). Testing of low PAH Improved Fish Smoking Stove (Ahotor oven). The USAID/Ghana Sustainable Fisheries Management Project (SFMP), Narragansett, RI: Coastal Resources Center, Graduate School of Oceanography, University of Rhode Island. GH2014_ACT067_SNV. 19p.
James, J. (2013). The Diffusion of IT in the Historical Context of Innovations from Developed Countries. Social Indicators Research. 111(1), 175-184.
Karl, H., & Leinemann, M. (1996). Determination of Polycyclic Aromatic Hydrocarbons in Smoked Fishery Products from Different Smoking Kilns. Zeitschrift Für Lebensmittel-Untersuchung Und Forschung, 202(6), 458-464.
Kwarteng, E. (2015). Fuelwood Value Chain Analysis Literature Review Report. The USAID/Ghana Sustainable Fisheries Management Project (SFMP). Narragansett, RI: Coastal Resources Center, Graduate School of Oceanography, University of Rhode Island and SNV Netherlands Development Organization.GH2014_SCI010_SNV. 91pp.
Kwarteng, E., Nsiah, A., & Aziebor, E. (2016). Energy Expenditure and Comparative Economics of Fish Processing Techniques Report. The USAID/Ghana Sustainable Fisheries Management Project (SFMP). Narragansett, RI: Coastal Resources Center, Graduate School of Oceanography, University of Rhode Island.GH 2014_ACT076_SNV. 34pp.
Lao, J., Xie, S., Wu, C., Bao, L., Tao, S., & Zeng, E. Y. (2018). Importance of Dermal Absorption of Polycyclic Aromatic Hydrocarbons Derived from Barbecue Fumes. Environmental Science & Technology, 52(15), 8330-8338.
Lazar, N., Asare, C., Nortey, D., Kankam, S., & Agbogah, K. (2016). The Small Pelagic Fisheries Profile: Analysis of Regional Results. USAID/Sustainable
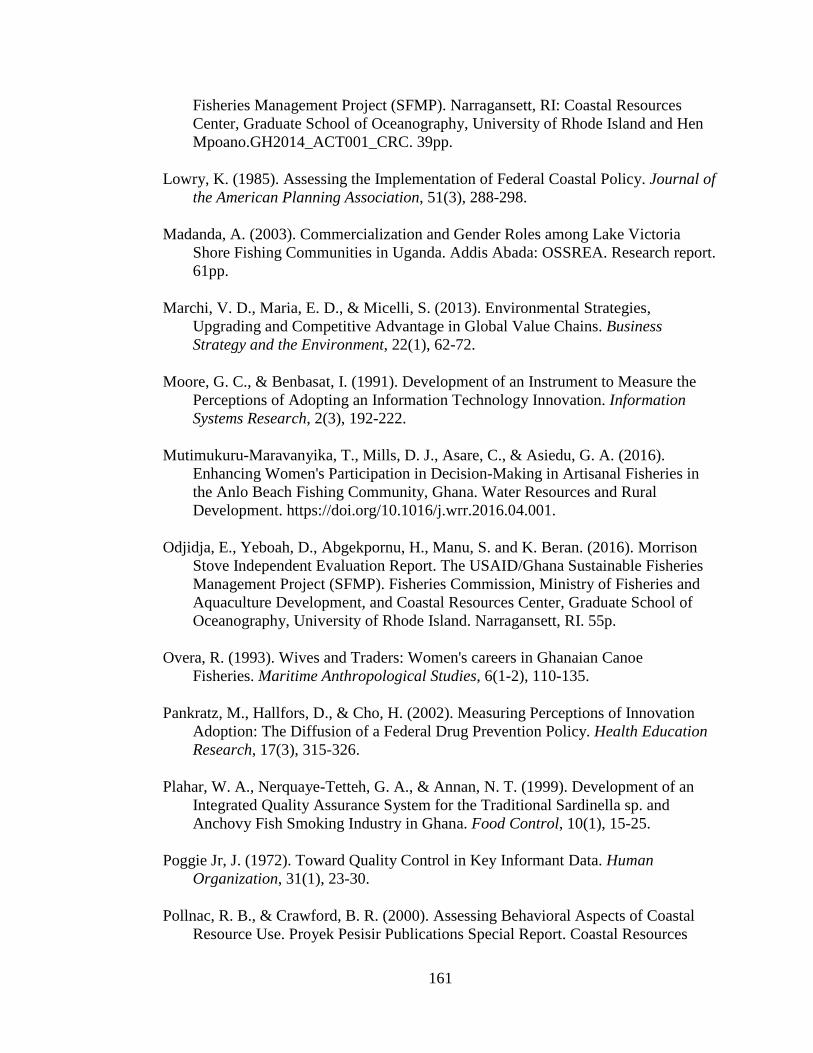
161
Fisheries Management Project (SFMP). Narragansett, RI: Coastal Resources Center, Graduate School of Oceanography, University of Rhode Island and Hen Mpoano.GH2014_ACT001_CRC. 39pp.
Lowry, K. (1985). Assessing the Implementation of Federal Coastal Policy. Journal of the American Planning Association, 51(3), 288-298.
Madanda, A. (2003). Commercialization and Gender Roles among Lake Victoria Shore Fishing Communities in Uganda. Addis Abada: OSSREA. Research report. 61pp.
Marchi, V. D., Maria, E. D., & Micelli, S. (2013). Environmental Strategies, Upgrading and Competitive Advantage in Global Value Chains. Business Strategy and the Environment, 22(1), 62-72.
Moore, G. C., & Benbasat, I. (1991). Development of an Instrument to Measure the Perceptions of Adopting an Information Technology Innovation. Information Systems Research, 2(3), 192-222.
Mutimukuru-Maravanyika, T., Mills, D. J., Asare, C., & Asiedu, G. A. (2016). Enhancing Women's Participation in Decision-Making in Artisanal Fisheries in the Anlo Beach Fishing Community, Ghana. Water Resources and Rural Development. https://doi.org/10.1016/j.wrr.2016.04.001.
Odjidja, E., Yeboah, D., Abgekpornu, H., Manu, S. and K. Beran. (2016). Morrison Stove Independent Evaluation Report. The USAID/Ghana Sustainable Fisheries Management Project (SFMP). Fisheries Commission, Ministry of Fisheries and Aquaculture Development, and Coastal Resources Center, Graduate School of Oceanography, University of Rhode Island. Narragansett, RI. 55p.
Overa, R. (1993). Wives and Traders: Women's careers in Ghanaian Canoe Fisheries. Maritime Anthropological Studies, 6(1-2), 110-135.
Pankratz, M., Hallfors, D., & Cho, H. (2002). Measuring Perceptions of Innovation Adoption: The Diffusion of a Federal Drug Prevention Policy. Health Education Research, 17(3), 315-326.
Plahar, W. A., Nerquaye-Tetteh, G. A., & Annan, N. T. (1999). Development of an Integrated Quality Assurance System for the Traditional Sardinella sp. and Anchovy Fish Smoking Industry in Ghana. Food Control, 10(1), 15-25.
Poggie Jr, J. (1972). Toward Quality Control in Key Informant Data. Human Organization, 31(1), 23-30.
Pollnac, R. B., & Crawford, B. R. (2000). Assessing Behavioral Aspects of Coastal Resource Use. Proyek Pesisir Publications Special Report. Coastal Resources

162
Center Coastal Management Report #2226. Coastal Resources Center, University of Rhode Island, Narragansett, Rhode Island. 139pp.
Pollnac, R. B., & Poggie, J., John J. (2006). Job Satisfaction in the Fishery in Two Southeast Alaskan Towns. Human Organization, 65(3), 329-339.
Quinn, N. (1978). Do Mfantse Fish Sellers Estimate Probabilities in their Heads? American Ethnologist, 5(2), 206-226.
Quisumbing, A. R., & Pandolfelli, L. (2010). Promising Approaches to Address the Needs of Poor Female Farmers: Resources, Constraints, and Interventions. World Development, 38(4), 581-592. doi:https://doi.org/10.1016/j.worlddev.2009.10.006.
Richardson, J. T. (2011). Eta Squared and Partial Eta Squared as Measures of Effect Size in Educational Research. Educational Research Review, 6(2), 135-147.
Robson, C. (2011). Real World Research: A Resource for Users of Social Research Methods in Applied Settings. Third edition.
Rogers, E, M. (1995). Diffusion of Innovations. Fourth edition. The Free Press. New York.
Steckler, A., Goodman, R. M., McLeroy, K. R., Davis, S., & Koch, G. (1992). Measuring the Diffusion of Innovative Health Promotion Programs. American Journal of Health Promotion, 6(3), 214-224.
Stephenson, G. O. (1980). " Pushing for the highline": The Diffusion of Innovations in the Oregon Otter Trawl Fishery. Master of Arts Thesis. Retrieved August 12, 2018 from https://ir.library.oreganstate.edu/downloads/7h149t88k.
Tango-Lowy, T., & Robertson, R. A. (2002). Predisposition Toward Adoption of Open Ocean Aquaculture by Northern New England's Inshore, Commercial Fishermen. Human Organization, 61(3), 240-251.
Tornatzky, L. G., & Klein, K. J. (1982). Innovation Characteristics and Innovation Adoption-Implementation: A Meta-Analysis of Findings. IEEE Transactions on Engineering Management, (1), 28-45.
United Nations. (2016). Sustainable Development Goals Report. 2016. United Nations. New York.
Walker, B. L. E. (2001). Sisterhood and Seine-Nets: Engendering Development and Conservation in Ghana's Marine Fishery. The Professional Geographer, 53(2), 160-177.

163
Weeratunge, N., Snyder, K. A., & Sze, C. P. (2010). Gleaner, Fisher, Trader, Processor: Understanding Gendered Employment in Fisheries and Aquaculture. Fish and Fisheries, 11(4), 405-420.
World Health Organization. (2018). International Food Standards (FAO/WHO Codex Alimentarius). Retrieved August 12, 2018 http://www.who.int/foodsafety/areas_work/food-standard/en/.

164
Chapter 4
IMPLEMENTING VALUE CHAIN IMPROVEMENTS IN SMALL-SCALE FISHERIES: CASE STUDIES FROM WEST AFRICA
by
Kristine Beran1
To be submitted to Global Food Security
1 PhD Candidate, Department of Marine Affairs, University of Rhode Island, RI, 02881, USA, Email: [email protected].

165
Introduction
Seafood is one of the most traded food commodities worldwide by value. It is
estimated half of the world’s fish landings come from small-scale fisheries in
developing countries. Many fisheries, however, fail to maximize value of seafood
products due to post-harvest loss, production, distribution and marketing challenges.
This research investigates ways post-harvest innovations address some of these
challenges, whom they benefit, and factors that influence adoption through two case
studies in West Africa. The overarching questions summarized in this chapter are:
1. What is the theory behind reducing post-harvest loss and in that sense upgrading
small-scale fisheries in West Africa?
2. What are some socio-economic outcomes of value chain upgrades, who benefits
and how do these outcomes align with or contradict theory?
3. What factors influence adoption among its users?
The value chain approach (VCA) and diffusion of innovation theory is used to
address these questions. The objective of this dissertation is to design and implement a
framework to upgrade nodes along the chain by diffusing an innovation in small-scale
fisheries in developing countries. The value chain upgrading framework is introduced
in chapter 1 (Figure 1.1). It is informed by two case studies presented in chapter 2 and
3. Application of this framework is summarized by node, innovation undertaken and
results obtained, fulfilling this objective. The different characteristics of each case
study suggest wider application of the framework within this sector. This chapter
discusses results and presents practical implications within the broader context of
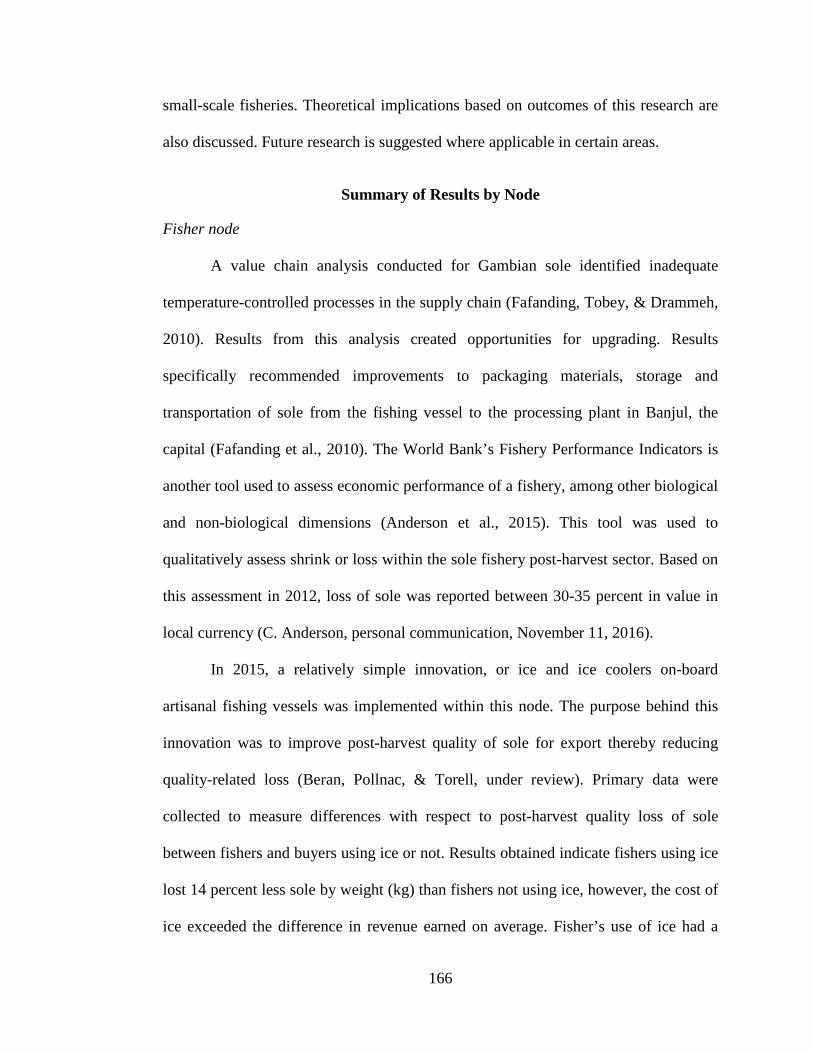
166
small-scale fisheries. Theoretical implications based on outcomes of this research are
also discussed. Future research is suggested where applicable in certain areas.
Summary of Results by Node
Fisher node
A value chain analysis conducted for Gambian sole identified inadequate
temperature-controlled processes in the supply chain (Fafanding, Tobey, & Drammeh,
2010). Results from this analysis created opportunities for upgrading. Results
specifically recommended improvements to packaging materials, storage and
transportation of sole from the fishing vessel to the processing plant in Banjul, the
capital (Fafanding et al., 2010). The World Bank’s Fishery Performance Indicators is
another tool used to assess economic performance of a fishery, among other biological
and non-biological dimensions (Anderson et al., 2015). This tool was used to
qualitatively assess shrink or loss within the sole fishery post-harvest sector. Based on
this assessment in 2012, loss of sole was reported between 30-35 percent in value in
local currency (C. Anderson, personal communication, November 11, 2016).
In 2015, a relatively simple innovation, or ice and ice coolers on-board
artisanal fishing vessels was implemented within this node. The purpose behind this
innovation was to improve post-harvest quality of sole for export thereby reducing
quality-related loss (Beran, Pollnac, & Torell, under review). Primary data were
collected to measure differences with respect to post-harvest quality loss of sole
between fishers and buyers using ice or not. Results obtained indicate fishers using ice
lost 14 percent less sole by weight (kg) than fishers not using ice, however, the cost of
ice exceeded the difference in revenue earned on average. Fisher’s use of ice had a

167
statistically significant positive impact on the buyer’s loss of sole which was less than
one percent by weight. Buyers are provisioned with ice from the processing plant in
return for delivering fish, therefore, they do not incur the additional cost of ice and as
a result captured more economic benefits in this study.
This study also examined cross-cutting themes discussed in the author’s
framework (Figure 1.1) such as gender, food security and biodiversity. For example,
the innovation only targeted fishers and buyers of export-oriented sole, nodes
dominated by men. No prior assessment was conducted to determine how this
innovation might impact the domestic market for sole, a sector dominated by women.
However, field experience and a value chain analysis indicate sole is typically not
processed using traditional methods (e.g. salting, drying), nor consumed fresh in large
amounts in The Gambia (Fafanding et al., 2010). This assumption was confirmed
through a survey administered to processors supplying the domestic market with fish.
Results from this survey suggest increasing the proportion of fish for export does not
impact local trade and consumption of sole unless sole replace other species, for
example if fishers target sole and catch less catfish which is purchased by local
women processors. Sole was not ranked as economically important species for the
domestic market and it was not a preferred species for household consumption.
Overcapacity and overfishing may occur as a result of post-harvest innovations
that increase revenue in the absence of fisheries management measures. Tangible
benefits, however, may serve as incentives to improve fisheries management (Uchida,
2017). The concept of quick, tangible benefits that garner support for collective
fisheries management in the long-term is discussed by Uchida (2017). The value chain

168
upgrading framework (Figure 1.1) recommends implementing innovations that align
with sustainable harvesting practices in fisheries engaged in some type of fishery
improvement project. The Gambian sole fishery is currently in an accredited Fishery
Improvement Project (Fisheryprogress.org, URL: https://fisheryprogress.org/fip-
profile/gambia-sole-bottom-set-gillnet). A Fishery Improvement Project brings
together multiple fishery stakeholders such as sellers and buyers to collectively
improve the management, and thus sustainability of a fishery.
Processor node
Like in The Gambia, a value chain analysis was conducted by Nunoo, Asiedu,
Belhabib, Lam, Sumaila, and Pauly (2015) for small pelagic species (e.g. sardinella)
and by Kwarteng (2015) for fuelwood in Ghana. Based on these assessments,
recommendations include, 1) better hygiene and handling practices for fish, improved
packaging and labeling of smoked fish, and 2) establishing woodlots to supply
fuelwood for fish processing (Nunoo et al., 2015; Kwarteng, 2015). Post-harvest loss
of smoked fish in Ghana-caused by burning, infestation and insects-is reported
between 3 and 17 percent of weight (Akande & Diei-Ouadi, 2010). Akande and Diei-
Ouadi (2010) estimate this loss has a macroeconomic impact valued at 60 million
USD. Further, net loss of forests in Africa is among the highest worldwide (FAOb,
2015).
A slightly more complex innovation is introduced within this node to address
both types of loss. The innovation is a fuel-efficient fish smoking stove known as the
ahotor. This stove is designed to produce healthier, better quality smoked fish for the
Ghanaian market. This study measured factors that influence adoption of the ahotor

169
stove according to diffusion theory using principal component analysis. Fifty-one
percent of the variance in the data is explained by three components, the first
component is named technology. Results obtained indicate technology characterized
by energy efficiency, smoke reduction and hands-on training plus simplicity and the
ability to pay predict adoption of the ahotor stove in Ghana. Factors that could hinder
adoption of the ahotor stove relate to complexity, the only perceived attribute that is
negatively correlated with adoption according to theory (Rogers, 1995). In this study,
complexity is measured by cost and construction. These factors could prevent scale of
the number of people who could potentially benefit from new technology. The
potential for scale is high given the number of processors smoking fish in Ghana and
local (and regional) consumer demand for smoked fish. Results from this study point
to other socio-economic benefits of improved fish smoking technology through
improved quality, food and occupational safety.
Themes
Cross-cutting themes present in both case studies relate to gender, food
security and biodiversity. The role of gender varies by node. In The Gambia, men
dominate the fisher and buyer node, whereas in Ghana, women dominate the processor
node. Women are primarily involved in processing and marketing of fish on land.
Many women fish processors in The Gambia stated they had never or rarely been
interviewed about their work, whereas fishermen were more accustomed to being
interviewed or asked to provide data about their work.
Innovations in both nodes (ice and ice coolers and smoking technology)
contribute to food security in the same way, by extending shelf-life so different

170
markets (export and domestic) benefit from consuming and trading it. With respect to
marine and terrestrial biodiversity, the processor node is directly impacted (cost and
supply) by loss of trees used as fuelwood to smoke fish. All nodes are threatened by
loss of marine biodiversity; therefore, innovations must align with sustainable
management of marine resources. The learning and evaluation component of the value
chain upgrading framework (Figure 1.1) can control for negative impacts or
unintended consequences but places no guarantee.
Other themes that emerge in both studies relate to equity, or distribution of
benefits between nodes along the chain, as well as food and occupational safety with
respect to improved fish smoking technology. The concept of equity emerged in
chapter 2 between the fisher and buyer node. Results indicate economic benefits of
using ice and ice coolers is accrued by buyers purchasing sole for export, not fishers
for whom the innovation is designed around. Buyers benefit from fisher’s use of ice.
Buyers do not incur the additional cost of ice because they are provisioned with ice
from the processing plant in return for delivering fish, whereas, fishers pay for ice.
Therefore, as stated previously, for fishers the cost of ice exceeds the difference in
revenue earned on average for fishers using ice just for sole. This result contributes to
the growing literature on distribution of economic benefits within the value chain. We
also learned fishers are vulnerable to cheating when selling their catch. By weighing
the catch together during the six-week study period, fishers learned that they were
entitled to participate in this process and even discussed collectively purchasing a
scale, thus becoming less dependent on the buyers recorded weight of catch.

171
These results raise equity concerns but also create leverage points (e.g. fishers
commanding a premium price for iced sole in The Gambia). Food and occupational
safety are central to the design and implementation of value chain improvements.
Innovations that control temperature of fish in tropical regions can prevent growth of
microorganisms and histamine-producing bacteria that accumulate in fish and
compromise food safety. Occupational safety with respect to value chain innovations
is a theme that emerged in chapter 3 but is also applicable to the innovation discussed
in chapter 2. In chapter 3, dermal absorption of PAHs while smoking fish is
potentially an occupational safety concern. In chapter 2, ice coolers were a newly
introduced piece of equipment on-board fishing canoes. At the time, it was unclear
how this equipment would affect stability of the canoe or interfere with the crew’s
mobility on-board the canoe. Therefore, to ensure safety-at-sea, life jackets were
issued to each pilot participant and their crew in this study. Innovations that improve
equity along the chain, food and occupational safety should be logistically feasible to
implement and financially affordable.
Based on these studies, there are additional refinements that could improve the
value chain upgrading framework (Figure 1.1). The innovation, for example, should
accommodate or adapt to multi-species fisheries. Small-scale fisheries in developing
countries harvest multiple species at the same time (Berkes, 2003). In this study, ice
coolers and fish smoking stoves accommodate multiple species but minor adjustments
are needed (e.g. increase storage capacity of ice coolers for sole and build trays with
different mesh size to smoke different types of fish). Emphasis should be placed on

172
low-cost, locally manufactured innovations in order to maximize adoption and scale-
up.
Discussion
The theory behind upgrading small-scale fisheries in West Africa is to
optimize usage of renewable natural resources through innovative, post-harvest value
chain solutions. This research examines innovations that reduce post-harvest quality-
related loss and loss of inputs (e.g. fuelwood) via product upgrading. Not only does
quality-related loss of fish and waste of inputs (e.g. fuelwood, labor) prevent
maximum use of scarce resources, it also reduces quality and arguably quantity of
nutritious food that can result in economic loss, expressed as lower prices. Loss of
food, especially such an important source of protein, has financial, food safety and
security implications for those along the chain and ultimately, for consumers. The
upside of reducing loss and improving product quality is potentially more meals
served and income earned. The downside leads to a vicious cycle that affects some
more than others. This cycle includes loss of nutrients and foregone revenue.
A recent article in Nature argues nutrition-sensitive fisheries policies are
urgently needed in many developing countries that depend on fish for food because
they have fewer options to compensate for lost nutrients (Golden, Allison, Chueng,
Dey, Halpern, McCauley, & Myers, 2016). This is especially true for West Africa
which is highly dependent on fish as an affordable source of protein and faces
depleting fishery resources (Golden et al., 2016). Golden et al. (2016) attributes fish-
catch decline to weak governance, illegal fishing, population and climate change. In
this case, maximizing quality of fish within each node along the chain is one strategy

173
to mitigate the impact of declining fish stocks while better fisheries management is
needed to sustain long-term benefits. Management deficiencies give rise to other
coping strategies to make up for declining catches, including increased fishing effort.
According to Akande and Diei-Ouadi (2010), “fishers will increase fishing effort to
compensate for the lost income due to quality loss” (p.28). Therefore, it is important to
address post-harvest loss within the context of fisheries management decisions.
This research contributes to growing literature on the value chain approach to
upgrade small-scale fisheries. In theory, this approach aims to capture more value
along the chain by cutting costs or through product differentiation (e.g. creating
different and presumably better products relative to the status quo). The overarching
goal is to increase profits. This is not uncommon or unrealistic expectation for anyone
in business, but in practice, how and for whom does this work in small-scale fisheries
in West Africa?
Socio-economic outcomes of value chain upgrades vary by node in this study.
In The Gambia, the innovation undertaken, or use of ice and ice coolers reduced post-
harvest quality loss of sole within the fisher and buyer node. Overall, fishermen using
ice on-board lost 14 percent less sole (based on weight in kg) on average than
fishermen not using ice. However, within the fisher node, the cost of ice exceeded the
difference in revenue earned on average. Hence, for fishers it appears there is no
economic incentive to purchase ice just for sole at the current market price. Fishers did
not economically benefit from the innovation because the cost of ice exceeded the
difference in revenue earned from using ice. The innovation did, however, have a
statistically significant positive economic impact for export buyers, another node. On

174
average, a buyer purchasing sole for export from a fisherman using ice lost less than
one percent during the study period This finding provides empirical evidence on
distribution of benefits from diffusing an innovation. O’Neill and Crona (2017)
highlight the need for data on distribution of economic benefits in small-scale
fisheries. The innovation did not appear to economically impact local trade of sole
within the processor node.
In the case of the Gambian sole fishery, results also validate that small-scale
fisheries in developing countries rarely discard fish. Yet, their catch is often subject to
down-grades or sold at a reduced price that results in foregone revenue. A new term,
export loss, is introduced in this study to capture this phenomenon. Export loss is
defined as product that does not meet export quality standards and fails to achieve
export trade earnings. As supplies of fish from developing countries to the
international market increase, so will revenue from trade. Export markets may require
higher product quality standards or compliance with certification and traceability
schemes, in other words product upgrading, as defined by Riisgaard, Bolwig, Ponte,
Du Toit, Halberg, and Matose (2010). Export revenues from fish trade contribute to
national and local economies in developing countries (Bostock, Greenhalgh & Kleih,
2004). Béné, Lawton and Allison (2010), however, remind us that wealth generated
through trade may not necessarily trickle down to those extracting resources. Future
research could quantify export loss in small-scale fisheries (in relation to gross
domestic product) in countries dependent on fisheries in terms of trade. Thorpe, Reid,
Van Anrooy, and Brugere (2005) hypothesize in countries where fisheries enhance
trade, they are more likely to be incorporated into national economic development

175
plans (e.g. poverty reduction strategy papers) and less likely to be marginalized (as a
sector through policies). Thorpe et al. (2005) conclude countries such as Peru and
Philippines with high dependence on fisheries in terms of trade (and consumption) are
integrated into national growth and poverty reduction strategies.
Other economic benefits, while not realized in this study, point to price
premium for better quality fish. Anecdotal evidence from the Gambian sole study
suggests buyers would like to buy iced sole from fishers. Seeking price premiums in
small-scale developing world fisheries can be problematic if it attracts more people in
the fishery (e.g. result of open access fishery) or negatively impacts low income
consumers with higher priced fish. The FAO suggests policy interventions that
mitigate the effects from price increases including access to alternative cheap protein,
but does not specify type of protein (Akande & Diei-Ouadi, 2010). Alternatives with
potential downsides that warrant further examination include like-species substitution
(e.g. comparable economic and nutritive value) from imports or aquaculture.
In Ghana, a direct economic and environmental benefit of the innovation
undertaken is less consumption of fuelwood, a cost-saving. Fuelwood is a primary
input cost to smoke fish. Non-economic benefits of this innovation relate to
occupational safety and ease of work within the processing node. This node is exposed
to excessive exposure to smoke using traditional fish smoking techniques. New
research suggests dermal absorption is also a significant intake pathway of PAHs
contaminants (Lao, Xie, Wu, Bao, Tao, & Zeng, 2018). Evidence from research in
Ghana suggests less coughing and smoke nuisance are factors that influence adoption
of the ahotor stove. More downstream coordination and communication with

176
consumers about the health benefits of fish smoked by the ahotor stove may help
processors improve return on investment of innovations.
The small-scale fisheries value chain can learn from small-scale farmers in
Ghana. A new variety of pineapple was introduced to small-scale farmers to help
exporters, another node, meet changing demands from international markets through
government and academic institutions in Ghana. With the help of an international
loan, the Ministry of Agriculture and the University of Ghana subsidized the cost of a
new variety of pineapple (MD2) and controlled quality in order to increase exports of
this new variety and avoid losing market share (Röling, 2010). Access to inputs such
as fertilizer, transportation and credit also helped small-scale farmers in Ghana gain
relevance in the marketplace for non-export crops (Röling, 2010).
Thorpe and Bennett (2004) highlight that much of the literature on fishery
value chains focus on export-oriented fish commodities and Thilsted, Thorne-Lyman,
Webb, Bogard, Subasingle, Phillips, and Allison (2016) and Bene, Abban, Abdel-
Rahman, Ayyappan, Brummett, Dankwa, Habib, Katiha, Kolding, Obiririh-Opareh,
Orori, Shehata, Shrivastava and Vass (2009) suggest fisheries value chains comprised
of low-value species processed primarily by women for local and regional trade
warrant closer attention. This research contributes to both by implementing
innovations at different nodes along the value chain each with different end markets.
Deciding which node to upgrade is an important consideration with respect to food
safety, optimal usage and equity. Fish is highly perishable. Shelf-life begins the
moment fish is immobilized by a net or trap or removed from water. Shelf-life ends
when fish is determined no longer fit for consumption. In tropical fisheries,

177
implementing innovations immediately after harvest is a good starting point for
extending shelf-life of fish products. This analysis indicates that improvements to
chilling, freezing, smoking, salting or drying processes and more modern methods
such as modified atmosphere packaging-where applicable-help to preserve fish for a
longer period of time so that more people can benefit from consuming or trading it.
Value chain innovations, however, benefit some more than others in the value chain as
evidenced by the Gambian case study. Therefore, ways to distribute, or share the cost
of implementation should be evaluated.
This research aims to level the playing field by creating conditions that
promote equitable economic growth among nodes in the chain regardless of the end
market. In essence, it tries to avoid creating “winners and losers,” a phrase often
associated with property rights in fisheries. Once fish is out of the water, it is
important to be mindful of markets and margins. For example, innovations intended to
benefit the export market should not jeopardize supply of fish to the local market.
Likewise, innovations that aim to improve profit margins might benefit those earning
the least in the chain, but that is not a guarantee.
The value chain approach aims to increase profits, but it is also important to
acknowledge why this approach might fail to benefit certain nodes along the chain.
This approach gave us a lens into poverty. Being aware of the economic lives and
conditions of fisherfolk may lay the ground work for implementing equitable
innovations in the fisheries value chain. Designing innovations around weaker1 nodes
might help strengthen the chain as a whole. In fisheries for example, designing
1 A term used by Bolwig et al. (2010) that includes artisanal fishers.

178
innovations around nodes that record high post-harvest loss could yield more fish for
direct human consumption, a benefit to the entire chain. This notion conflicts with the
value chain concept popularized by Porter (1985). Since then, Porter stresses the
importance of shared value that benefits both business and society (Porter & Kramer,
2006). I propose extending the concept of shared value beyond corporations to coastal
fishing communities and to equalizing value along the chain thus creating a balanced
win. An immediate implication of this expansion is shifting and equalizing the balance
of power that exists within the supply chain by understanding how their markets
function. For example, by weighing the catch together, transparency and collaboration
between fishers and buyers increased as evidenced in chapter 2. Exploring cost-
sharing opportunities with other value chain actors may offset the cost of ice incurred
by Gambian fishers in exchange for better quality fish reducing export loss.
Factors that influence adoption of the ahotor stove are the focus of chapter 3.
A model predicts technology plus simplicity with respect to cost and construction-
influence adoption of the ahotor stove. Simplicity and affordability are crucial when
designing and implementing innovations in small-scale fisheries. Innovations that are
mobile (e.g. easily moved) and adapt to multi-species fisheries are a plus within the
fisher and processor node. For example, ice coolers used by fishers and buyers in The
Gambia (and Senegal) are locally manufactured, mobile, adapt to multi-species and
modestly priced (~15 USD). For processors, the ahotor stove is not mobile nor
modestly priced. The ahotor stove can be manufactured in every community, but
artisans (or processors) must be trained to build it. The ahotor stove can also adapt to

179
multiple species but that requires replacing mesh size and depth of trays used to smoke
fish.
Catch fluctuates seasonally and differ year-to-year in capture fisheries,
therefore, innovations designed around fisher and processor nodes should be capital-
sensitive, not intensive requiring significant cash outlay. Allison and Ellis (2001)
caution capital-intensive interventions can lead to increased fishing effort if users are
unable to earn sufficient returns on the investment. This not only compromises
resource sustainability but also personal safety-at-sea if fishers take higher risks in
order to re-pay a capital-intensive investment.
Innovations introduced within any node should not be confused with incentives
that can lead to overexploitation. In open access fisheries like Ghana, diffusing
innovations within the fisher node, or those closest to the resource is risky if the
innovation contributes to overfishing. In the past, a series of innovations within the
fisher node in Ghana have contributed to overfishing of small pelagic species in
absence of harvest and input control measures. Motorized canoes were first introduced
in 1946 (Nunoo et al., 2014), followed by monofilament nets. Today, the capacity of
these innovations is enhanced by a fuel subsidy to small-scale fishers targeting small
pelagic species. The impacts of the fuel subsidy program are discussed by Tobey,
Normanyp, Osei, Beran, and Crawford (2016). In theory, innovations that aim to
increase profit should be nested into larger fisheries improvement or development
projects to control for unintended consequences such as overfishing.
Implementing innovations in short supply chains comprised of a single species
is prudent when first using the value chain upgrading framework (Figure 1.1). Shorter

180
supply chains of single species (e.g. Gambian sole) are easier to map than multi-
species fisheries with complex supply chains (e.g. small pelagics in Ghana). The
Gambian sole fishery differs by size and management from the small pelagic fishery in
Ghana. According to a frame survey conducted in 2015 by the Department of
Fisheries in The Gambia, there are 175 canoes fishing for sole along Gambia’s 80 km
coastline. While in Ghana, approximately 12,000 artisanal canoes harvest small
pelagic species along the 550 km coastline (Nunoo et al., 2014). The Gambian sole
fishery went from little to no management in 2008 to a special management area for
sole with a management plan to a Fishery Improvement Project. These management
measures do not guarantee that innovations will not become perverse incentives that
lead to overfishing, but they do provide some assurance, especially given the relatively
small size of the Gambian sole fishery. Hence, introducing innovations to fisher nodes
should be evaluated on a case-by-case basis in fisheries with management controls in
place. In value-added export fisheries like Gambian sole, diffusing an innovation that
reduces export loss is a starting point, albeit fewer benefit.
Finally, upgrades that make use of existing, functioning infrastructure will
facilitate implementation and adoption. For example, in The Gambia there are two
functioning ice plants that sell crushed ice at fish landing sites. In Ghana, ice is sold in
blocks within communities but there is limited use of the cold-chain for processing of
small pelagic species. However, fish smoking infrastructure such as smoking houses
and drying racks are in place and used by many.

181
Conclusion
The chapters presented in this dissertation address ways to upgrade nodes in
small-scale fisheries by implementing post-harvest innovations. The first chapter
provided an overview of the theoretical concepts used to reduce post-harvest quality
loss of fish, improve usage of fish and fuelwood within nodes in small-scale fisheries
and upgrade nodes by diffusing an innovation. Chapter 1 introduced a framework to
design innovations that result in adoption. Chapter 2 assessed post-harvest quality loss
of sole in The Gambia within the fisher and buyer node. Chapter 3 measured adoption
of improved smoking technology within the processor node in Ghana. This chapter
summarizes results as they pertain to each case study based on the overarching
questions of this study.
First, the theory behind upgrading small-scale fisheries in West Africa differ
by node and end market. In the Gambian sole study, the theory behind upgrading the
fisher node by diffusing an innovation (e.g. ice and ice coolers on-board fishing
canoes) is to reduce export loss of sole, or product that does not meet export quality
standards and is subsequently sold at a reduced price that results in foregone revenue.
In the Ghana, the theory behind upgrading the post-harvest processor node by
diffusing an innovation (e.g. ahotor stove) is to improve processing methods (e.g. less
smoke emission and smoke deposit on fish) and profitability (e.g. less consumption of
fuelwood and better price for improved quality) of fish for domestic sale and
consumption. The theory behind upgrading these nodes, which are closest to the
resource is to help strengthen the chain further along. For example, improved chilling
or smoking techniques preserve fish for a longer period of time so that more people
can benefit from trading and ultimately consuming it. In theory, innovations that
182
upgrade one node should not jeopardize quality or supply of fish to another node. The
goal behind upgrading post-harvest small-scale fisheries is to equalize value along
chain thus creating a balanced win.
Second, summarizing socio-economic outcomes of value chain upgrades in the
Gambia concludes that ice improves quality and reduces export loss of sole. Fishers
using ice and ice coolers on-board canoes lost 14 percent less sole by weight (kg) on
average due to quality than fishers not using ice on-board canoes. The difference is
statistically significant (p-Value <0.001, t=7.25, df=566, one-tailed). The cost of ice to
fishers, however, exceeded the difference in revenue earned from sole on average.
Therefore, based on the current market price of sole and ice, there is no economic
incentive for fishers to purchase ice just for sole. Non-economic benefits realized by
fishers included better fuel efficiency, improved hygiene and cleanliness on-board and
quicker off-loading of fish upon landing. Fisher’s use of ice had a statistically
significant positive impact on the buyer’s loss of sole due to quality which was less
than one percent (p-Value=0.05, t=1.64, df=546, one-tailed test). A buyer’s average
daily revenue from purchasing sole from fishers using ice nearly doubled during the 6-
week study period. In this case, the buyer node benefited more than the fisher node for
whom the innovation was designed to benefit. These outcomes align with theory in
that the innovation reduces export loss and improves preservation of fish. However,
the innovation did not achieve a balanced win between the fisher and buyer node,
although it did not negatively impact local trade and consumption of sole processed
primarily by women.

183
Socio-economic outcomes of value chain upgrades in Ghana indicate the
ahotor stove improves processing methods and points to increased profitability of
smoked fish within the processor node. The ahotor stove is more fuelwood-efficient
than the chorkor, or current stove widely used in Ghana to smoke fish. According to a
study conducted by CSIR et al. (2016), mean difference for fuelwood consumption
between stoves is statistically significant (t=9.51, df=2). Specific design features2 of
the ahotor stove are shown to reduce polycyclic aromatic hydrocarbons3 (PAHs)
based on chemical analytical tests using limited samples. These design features
prevent excessive exposure to heat and smoke among fish processors. The majority of
fish processors using the ahotor stove (92%, n=37) state they experience less
coughing while using it compared to the previous stove used (chorkor). Economic
outcomes of using the ahotor stove point to increased profitability within this node.
An overwhelming majority of those using the ahotor stove state less money is spent
on fuelwood using this stove versus the chorkor stove, whereas 5 percent state they do
not know. The difference between the ahotor and chorkor stove with respect to money
spent on fuelwood is statistically significant (χ2=27.10, df=2, n=102, p-Value <0.001,
Cramer’s V=0.52, Contingency coefficient=0.46). Those using the ahotor stove state
their fish sells faster at the market than fish smoked by the chorkor stove. The
difference by stove type with respect to sales of fish at the market approaches
significance (χ2=3.70, df=1, n=105, p-Value=0.05, Fisher Exact Test two-tailed
2 Specific design features include a twin combustion chamber, oil drip collector and a hood with a cut-out hole to deter smoke away from the operator. 3 Polycyclic aromatic hydrocarbons are carcinogenic and genotoxic substances that pose potential food safety and health hazard concerns (European Food Safety Authority, 2008).

184
p=0.07). An ordinal rank test reveals statistically significant differences between
stoves with respect to quality of smoked fish (Kruskal-Wallis = 6.72, df = 1, p = 0.01).
Those using the ahotor stove perceive it produces better quality smoked fish than fish
smoked by the chorkor stove based on a median score of 1.00 and .50, respectively.
These findings are consistent with the goal behind the design of the ahotor stove.
These economic outcomes do not confirm increased profitability but point to its
potential. These outcomes could potentially benefit fish processors economically in
Ghana. The outcomes align with the theory behind upgrading this node, which is to
improve processing methods and increase profitability.
Third, factors that influence adoption of the ahotor stove in Ghana are less
consumption of fuelwood, hence, cost of fuelwood, less smoke nuisance (to the eyes),
interest in the stove expressed by other fish processors and trainings on use of the
stove. Factors that influence adoption are summarized in one meta-variable named
technology. Complexity measured by construction and maintenance of the ahotor stove
factors in negatively. Access to or possession of luxury items, a proxy for wealth, is
another factor that influences adoption of the ahotor stove. A logistic regression model
suggests technology plus simplicity and wealth, or luxury items are the most
significant predictors of adoption of the ahotor stove (Coefficient significant at <0.001
and 0.05 level, respectively). This study did not determine factors that influence
adoption of ice and ice coolers used within the fisher node for Gambian sole. We
assumed the relative low cost of construction and ease of construction of ice coolers
would be an incentive rather than a barrier to adoption, however, we learned that there
is no economic incentive for fishers to purchase ice just for sole. Therefore, we concur

185
that the degree of benefit (of an innovation) is an important factor for adoption as
stated by Rogers (1995).
Practical implications
This dissertation demonstrates the importance of upgrading small-scale
fisheries to achieve equitable economic growth, improve food and occupational safety,
and alleviate poverty by diffusing a post-harvest innovation. Findings from this
research enhance the FAO’s (2015) Voluntary Guidelines for Securing Small-scale
Fisheries in the Context of Food Security and Poverty Alleviation and Sustainable
Development Goals (United Nations, 2016) through multiple lessons learned that
relate to energy efficiency, post-harvest loss and value addition, distribution of
economic benefits along the chain, gender and occupational safety within the post-
harvest fish processing sector. Practical implications of this research are directed at
policy makers, practitioners and industry to consider during implementation of post-
harvest innovations. Practical implications are listed as recommendations and
discussed in relation to sections within The Guidelines (FAO, 2015) and Sustainable
Development Goals (United Nations, 2016).
The FAO’s PHLA (Akande & Diei-Ouadi, 2010) which updated Ward and
Jeffries (2000) manual for assessing post-harvest fisheries losses identifies three main
types of loss, physical, quality and market-force. The FAO’s PHLA (Akande & Diei-
Ouadi, 2010) is widely used to generate fish loss data and guide implementation of the
FAO’s Code of Conduct for Responsible Fisheries. This dissertation identified another
type of loss, export loss. The amount lost to export may be significant in countries
dependent on fisheries for trade, therefore, it is recommended to account for export

186
loss in small-scale fisheries with export markets. A revision of the FAO’s PHLA
(Akande & Diei-Ouadi, 2010), future manual or step within the value chain upgrading
framework (Figure 1.1) could account for this type of loss, especially as supplies of
fish from small-scale fisheries to the international market increase.
When implementing post-harvest innovations that benefit the export market, it
is important to consider the potential impact it may have on the local market and
consumption of fish. The Guidelines acknowledge this in section 7.7 (FAO, 2015),
however, provide no means of verification. This study considered the impact of an
export-oriented value chain improvement on local trade and consumption of sole by
administering a field survey among local women processors in The Gambia. Results
from this study indicated that the innovation did not impact either. Therefore, it is
recommended to consult reliable, representative key informants when implementing
value chain improvements that benefit the export market to gain some assurance that it
doesn’t impact the local market.
The value chain approach aims to increase profits by node, however, it is
important to understand distribution of economic benefits between nodes along the
chain. Unequal distribution of benefits shifts the balance of control within the value
chain as evidenced in this study. As stated previously, Gambian sole fishers were
dependent on buyers to weigh and purchase their catch which make them vulnerable to
cheating. By weighing the catch together during the 6-week study period, transparency
and collaboration between these nodes increased.
The value chain approach also provided us with a lens into poverty as
evidenced during implementation of the ahotor stove in Ghana. Poverty is multi-

187
faceted. In this context, drivers of poverty include economic hardship caused by a
steady decline in marine capture fisheries combined with single, female-headed
households with large family sizes (Friends of the Nation [FoN], 2015; Beran &
Crawford, 2018). Under the premise that economic hardship is a driver of poverty, a
subset of fish processors referred to as vulnerable households in this study received a
fully subsidized ahotor stove to generate income. This research validates section 7.1
of The Guidelines, that vulnerable groups in fisheries require special support (FAO,
2015).
There are multiple opportunities to design post-harvest innovations that reduce
post-harvest loss and add value to fish along the chain in small-scale fisheries. The
innovations examined in this dissertation are the ahotor stove used by processors in
Ghana and insulated coolers used by fishers in The Gambia. Both innovations achieve
their purpose. The purpose behind the ahotor stove is to reduce fuelwood consumption
while producing better quality smoked fish for the domestic market. Achieving this
purpose advances section 7.5 of The Guidelines (FAO, 2015) and Goal 7 of the SDGs
(United Nations, 2016) that advocate building on traditional and local innovations that
reduce waste of inputs, specifically fuelwood, and advocate energy efficiency in the
value chain, respectively. The purpose behind insulated coolers is to improve quality
of sole for export and reduce export loss. Achieving this purpose advances section 7.3
and 7.5 of The Guidelines (FAO, 2015), to produce good quality, safe fish for export
markets and avoid post-harvest loss in small-scale fish handling and processing,
respectively. Implementing innovations in small-scale fisheries, however, is not
straight forward. Results from this study recommend that fuel-efficient innovations

188
should be simple to build, easy-to-use and affordable to buy within the context of
small-scale fisheries.
The post-harvest fish processing sector in The Gambia and Ghana, as
elsewhere, is dominated by women. This study showed that on average, individual
women have processed fish for a quarter of a century while the tradition of fish
processing and fish trading extends back in time to the early 1900s (Walker, 2002).
Processing fish is an important economic activity for women. Both case studies
indicate women are dependent on fish processing for income generation. Their
dependence on fish processing for income combined with their knowledge of fisheries
make them a key-yet underutilized-stakeholder. In addition to recognizing the role of
women, it equally important to elevate their status in this sector with respect to gender
equality, or Goal 5 of the 2030 Agenda for Sustainable Development (United Nations,
2016) and section 8 within The Guidelines (FAO, 2015). Therefore, it is recommended
to increase participation of women as decision-makers in management of renewable
natural resources.
This research shows fish processors-many of whom are women-are exposed to
excessive amounts of smoke from traditional smoking stoves. In many cases, children
are nearby and thereby also exposed to excessive amounts of smoke. This is an
occupational safety concern and potential health hazard according to a recent study
that suggests dermal absorption is a significant intake pathway of PAHs. Improved
smoking technology such as the ahotor stove offers personal health benefits such as
less coughing and smoke nuisance to the eyes. The Guidelines (FAO, 2015) stress the
importance of occupational health issues as an integral part of fisheries management
189
but do not provide details of specific health issues (FAO, 2015, section 6.12).
Therefore, it is recommended to conduct further research on excessive exposure to
smoke to ensure worker’s safety-on-land.
Theoretical implications
The outcomes of value chain upgrades in this research have theoretical
implications with respect to the post-harvest loss assessment (PHLA) and value chain
approach and diffusion theory.
Over time, Porter’s (1985) value chain concept has evolved from maximizing
value, or profit, within the chain to shared value along the chain (Porter & Kramer,
2006). Both innovations presented in this research align with the goal behind Porter’s
approach, which is to create value and optimize usage of a product or good. The
innovation designs presented in the Gambian and Ghana case studies, however,
challenge Porter’s description of innovations to outperform competitors by using
capital-intensive and state-of-the-art technology. In the context of this research, less
(cost and complexity) is more. The case studies presented in this dissertation highlight
the double-edged nature of technology and innovation. To innovate requires capital,
however, in small-scale fisheries in the developing world, innovations should be
capital-sensitive and tailored to the context and capacities of its users and their end-
markets. Socio-economic outcomes of this research align more closely with Porter and
Kramer’s (2006) vision of shared value along the chain. For example, the Gambian
sole study contributes to the growing literature on distribution of profits, or revenue
from sales of fish. Rosales et al. (2017) similarly propose ways to enhance the value of

190
catch so primary harvesters get a fairer share. These studies suggest further expansion
from shared value toward more equitable distribution along the chain.
This study measured post-harvest quality-related fish loss using elements of
the PHLA. This study identified another type of loss, or export loss not addressed by
the PHLA approach but could potentially expand it. In specific, I contend that small-
scale fisheries from developing countries with export markets should account for
export loss. This is an important policy development driver for two reasons. First,
assessing export loss contributes to our understanding of the potential economic value
of small-scale fisheries with established export markets. The potential economic value
is the value derived if there is no export loss. Second, this information may be useful
to fisheries managers, policy makers and the private sector alike who may push to put
in place measures that protect valuable resources and prevent post-harvest losses
motivated by the potential economic value of the fishery. This information may also
lead to investments that strengthen the post-harvest sector or nodes along the chain.
Finally, quick and cost-effective ways to measure nutritional loss are also needed
given its relevance to food security and poverty alleviation in small-scale fisheries.
Factors that influence adoption of improved fish smoking stoves align with
perceived attributes of innovations according to diffusion theory. Socio-economic
characteristics of adopters of the ahotor stove also align with theory. According to
theory and evidenced in this study, early adopters are more likely to be literate,
educated and have higher social status indicated by possession of wealth and standard
of living. In this study, male aquaculture farmers serve as an example of an early
adopter of the ahotor stove. In this case, the innovation spread beyond the targeted

191
audience, or was “auto-diffused,” a term used by Rogers (1995). This illustrates the
innovativeness-needs paradox discussed by Rogers (1995) whereby those who adopt
first typically have the least need with respect to benefits of the innovation. One aspect
of this research that contributes to diffusion theory is the idea that one meta-variable,
or technology plus simplicity, may predict adoption. Diffusion theory has relied on
five standardized attributes of innovations, four of which-except complexity-are
somewhat empirically related although conceptually different (Rogers, 1995). Results
from this research suggest a combination of attributes are empirically related. Future
research could predict adoption using one meta-variable named technology plus
simplicity.
Next step
Thematic areas for future research relate to food safety, trade and fisheries
management. Additional research (e.g. structured trials) is needed to understand the
health impact of PAHs on consumers of smoked fish in West Africa and elsewhere
traditional smoking techniques are employed. Results of this research could contribute
to the FAO’s Codex Alimentarius Code of Practice for the Reduction of
Contamination of Food PAHs from smoking and Direct Drying Processes (CAC/RCP
68-2009). With respect to trade, future research could examine the impact of export
loss on poverty alleviation and food security in countries dependent on fisheries with
export markets. Finally, future research might investigate if adding value to fish
products is an incentive for better fisheries management within small-scale fisheries in
developing countries. Future research might examine how reducing loss of fish

192
contributes to food equity or better fisheries management within small-scale fisheries
in developing countries.

193
References
Akande, G., & Diei-Ouadi, Y. (2010). Post-Harvest Losses in Small-scale Fisheries: Case Studies in Five sub-Saharan African Countries. FAO Fisheries and Aquaculture Technical Paper, (550).
Allison, E. H., & Ellis, F. (2001). The Livelihoods Approach and Management of Small-scale Fisheries. Marine Policy, 25(5), 377-388.
Anderson, J. L., Anderson, C. M., Chu, J., Meredith, J., Asche, F., Sylvia, G., . . . Guttormsen, A. (2015). The Fishery Performance Indicators: A Management Tool for Triple Bottom Line Outcomes. PloS One, 10(5), e0122809.
Béné, C., Abban, E., Abdel-Rahman, S., Ayyappan, S., Brummett, R., Dankwa, H., Kolding, J. (2009). Improved Fisheries Productivity and Management in Tropical Reservoirs. CPWF Project number 34. CGIAR Challenge Program on Food and Water Report Series. www.waterandfood.org.
Béné, C., Lawton, R., & Allison, E. H. (2010). “Trade Matters in the Fight Against Poverty”: Narratives, Perceptions, and (lack of) Evidence in the Case of Fish Trade in Africa. World Development, 38(7), 933-954.
Beran, K., Crawford, B. (2018). Assessment of Ahotor Stove Grants on Households Vulnerable to Child Labor and Trafficking. The USAID/Ghana Sustainable Fisheries Management Project (SFMP). Narragansett, RI: Coastal Resources Center, Graduate School of Oceanography, University of Rhode Island and CEWEFIA and DAA. 30 pp.
Berkes, F. (2003). Alternatives to Conventional Management: Lessons from Small-scale Fisheries. Environments, 31(1), 5.
Bostock, T., Greenhalgh, P., & Kleih, U. (2004). Policy Research-Implications of Liberalisation of Fish Trade for Developing Countries: Synthesis report.
Bolwig, S., Ponte, S., Du Toit, A., Riisgaard, L., & Halberg, N. (2010). Integrating Poverty and Environmental Concerns into Value‐Chain Analysis: A Conceptual Framework. Development Policy Review, 28(2), 173-194.
Codex Alimentarius Commission. (2009). Code of Practice for the Reduction of Contamination of Food with Polycyclic Aromatic Hydrocarbons (PAH) from Smoking and Direct Drying Processes. Cac/rcp, 68.
European Food Safety Authority. (2008). Polycyclic Aromatic Hydrocarbons in Food. Scientific Opinion of the Panel on Contaminants in the Food Chain. European Food Safety Authority Journal 724, 114p.
Fafanding, S. F., Tobey, J., & Drammeh, O. (2010). Sole Fishery Value Chain Assessment. Narragansett, RI: Coastal Resources Center, University of Rhode

194
Island. Retrieved from http://www.crc.uri.edu/download/Final_Sole_VCA_Report_August_20101.pdf
Fishery Progress. (2018). Gambia Sole-Bottom Set Gillnet. Retrieved August 12, 2018 from https://fisheryprogress.org/fip-profile/gambia-sole-bottom-set-gillnet.
Food and Agriculture Organization of the United Nations. (2015). Voluntary guidelines for securing sustainable small-scale fisheries in the context of food security and poverty eradication. Food and Agriculture Organzation of the United Nations. Rome.
Food and Agriculture Organization of the United Nations (FAOb). (2015). The Global Forest Resources Assessment. ( No. ISBN-978-92-5-108826-5). Rome. Retrieved from http://www.fao.org/3/a-i4808e.pdf
Friends of the Nation (2015). The USAID/Ghana Sustainable Fisheries Management Project (SFMP), Anti-Child Labour and Trafficking Field PRA Survey Report. Narragansett, RI: Coastal Resources Center, Graduate School of Oceanography, University of Rhode Island. 90p.
Golden, C., Allison, E. H., Cheung, W. W., Dey, M. M., Halpern, B. S., McCauley, D. J., . . . Myers, S. S. (2016). Fall in Fish Catch Threatens Human Health. Nature, 534 (7607), 317-320.
Kwarteng, E. (2015). Fuelwood Value Chain Analysis Literature Review Report. The USAID/Ghana Sustainable Fisheries Management Project (SFMP).Narragansett, RI: Coastal Resources Center, Graduate School of Oceanography, University of Rhode Island and SNV Netherlands Development Organization.GH2014_SCI010_SNV. 91pp.
Lao, J., Xie, S., Wu, C., Bao, L., Tao, S., & Zeng, E. Y. (2018). Importance of Dermal Absorption of Polycyclic Aromatic Hydrocarbons Derived from Barbecue Fumes. Environmental Science & Technology, 52(15), 8330-8338.
Nunoo, F., Asiedu, B., Amador, K., Belhabib, D., Lam, V., Sumaila, R., & Pauly, D. (2014). Marine Fisheries Catches in Ghana: Historic Reconstruction for 1950 to 2010 and Current Economic Impacts. Reviews in Fisheries Science & Aquaculture, 22(4), 274-283.
O'Neill, E. D., & Crona, B. (2017). Assistance Networks in Seafood Trade–A Means to Assess Benefit Distribution in Small-scale Fisheries. Marine Policy, 78, 196-205.
Porter, M. E. (1985). Competitive Advantage: Creating and Sustaining Superior Performance. The Free Press. New York.
Porter, M. E., & Kramer, M. R. (2006). The Link Between Competitive Advantage and Corporate Social Responsibility. Harvard Business Review, 84(12), 78-92.
Riisgaard, L., Bolwig, S., Ponte, S., Du Toit, A., Halberg, N., & Matose, F. (2010). Integrating Poverty and Environmental Concerns into Value‐Chain Analysis:

195
A Strategic Framework and Practical Guide. Development Policy Review, 28(2), 195-216.
Röling, N. (2010). The Impact of Agricultural Research: Evidence from West Africa, Development in Practice, 20:8, 959-971, DOI: 10.1080/09614524.2010.513724.
Rogers, E. M. (1995). Diffusion of Innovation. Fourth edition. The Free Press. New York.
Rosales, R. M., Pomeroy, R., Calabio, I. J., Batong, M., Cedo, K., Escara, N., . . . Sarahadil, M. (2017). Value Chain Analysis and Small-scale Fisheries Management. Marine Policy, 83, 11-21.
Thilsted, S. H., Thorne-Lyman, A., Webb, P., Bogard, J. R., Subasinghe, R., Phillips, M. J., & Allison, E. H. (2016). Sustaining Healthy Diets: The Role of Capture Fisheries and Aquaculture for Improving Nutrition in the post-2015 Era. doi:https://doi.org/10.1016/j.foodpol.2016.02.005
Thorpe, A., & Bennett, E. (2004). Market-driven International Fish Supply Chains: The Case of Nile Perch from Africa's Lake Victoria. International Food and Agribusiness Management Review, 7(4), 40-57.
Thorpe, A., Reid, C., Van Anrooy, R., & Brugere, C. (2005). When Fisheries Influence National Policy-making: An Analysis of the National Development Strategies of Major Fish-producing Nations in the Developing World. Marine Policy, 29(3), 211-222.
Tobey, J., Normanyo, A., Osei, P., Beran, K., & Crawford, B. (2016). Subsidies in Ghana’s marine artisanal fisheries sector. USAID/Ghana Sustainable Fisheries Management Project (SFMP). Narragansett, RI: Coastal Resources Center, Graduate School of Oceanography, University of Rhode Island.GH2014_POL059_CRC. 53pp.
Uchida, H. (2017). TURFs, Collective Fishery Management, and Fishery Cooperatives. Bulletin of Marine Science, 93(1), 83-99.
United Nations. (2016). Sustainable Development Goals Report. 2016. United Nations. New York.
Walker, B. L. E. (2002). Engendering Ghana's Seascape: Fanti Fish, Traders and Marine Property in Colonial History. Society &Natural Resources, 15(5), 389-407.

196
Bibliography
Affognon, H., Mutungi, C., Sanginga, P., & Borgemeister, C. (2015). Unpacking Post-Harvest Losses in sub-Saharan Africa: A Meta-Analysis. World Development, 66, 49-68.
Akande, G., & Diei-Ouadi, Y. (2010). Post-Harvest Losses in Small-scale Fisheries: Case Studies in Five sub-Saharan African Countries. FAO Fisheries and Aquaculture Technical Paper, (550). 77pp.
Akpambang, V., Purcaro, G., Lajide, L., Amoo, I., Conte, L., & Moret, S. (2009). Determination of Polycyclic Aromatic Hydrocarbons (PAHs) in Commonly Consumed Nigerian Smoked/Grilled Fish and Meat. Food Additives and Contaminants, 26(7), 1096-1103.
Allison, E. H., & Ellis, F. (2001). The Livelihoods Approach and Management of Small-scale Fisheries. Marine Policy, 25(5), 377-388.
Allison, E. H., Perry, A. L., Badjeck, M., Neil Adger, W., Brown, K., Conway, D., . . . Andrew, N. L. (2009). Vulnerability of National Economies to the Impacts of Climate Change on Fisheries. Fish and Fisheries, 10(2), 173-196.
Anderson, J. L., Anderson, C. M., Chu, J., Meredith, J., Asche, F., Sylvia, G., . . . Guttormsen, A. (2015). The Fishery Performance Indicators: A Management Tool for Triple Bottom Line Outcomes. PloS One, 10(5), https://doi.org/10.1371/journal.pone.0122809.
Asche, F., Bellemare, M. F., Roheim, C., Smith, M. D., & Tveteras, S. (2015). Fair Enough? Food Security and the International Trade of Seafood. World Development, 67, 151-160.
Ascher, W., Brewer, G. D., Cheema, G. S., & Heffron, J. M. (2016). Evolution of Economic Development Theories and Doctrines Since World War II. The Evolution of Development Thinking. Springer. 15-39pp.
Avega, B., & Tibu, G. (2017). Performance Evaluation Survey (Ahotor oven). The USAID/Ghana Sustainable Fisheries Management Project (SFMP). Narragansett, RI: Coastal Resources Center, Graduate School of Oceanography, University of Rhode Island and Netherlands Development Organisation.GH2014_ACT099_SNV. 33p.
Ba, A., Schmidt, J., Dème, M., Lancker, K., Chaboud, C., Cury, P., . . . Brehmer, P. (2017). Profitability and Economic Drivers of Small Pelagic Fisheries in West Africa: A Twenty-Year Perspective. Marine Policy, 76, 152-158. doi:https://doi.org/10.1016/j.marpol.2016.11.008.

197
Bailis, R. (2004). Controlled Cooking Test. Version 2.0. Shell Foundation (Household Energy and Health Programme). https://cleancookstoves.org/binary-data/DOCUMENT/file/000/000/80-1.pdf.
Bair, J. (2008). Analysing Global Economic Organization: Embedded Networks and Global Chains Compared. Economy and Society, 37(3), 339-364.
Belhabib, D., Mendy, A., Zeller, D., & Pauly, D. (2013). Big Fishing for Small Fishes: Six Decades of Fisheries in The Gambia “The Smiling Coast of Africa.”
Banerjee, A. V., Banerjee, A., & Duflo, E. (2011). Poor Economics: A Radical ethinking of the Way to Fight Gobal Poverty. Public Affairs. New York.
Barrientos, S., Gereffi, G., & Rossi, A. (2011). Economic and Social Upgrading in Global Production Networks: A New Paradigm for a Changing World. International Labour Review, 150(3‐4), 319-340.
Béné, C., Lawton, R., & Allison, E. H. (2010). Trade Matters in the Fight Against Poverty: Narratives, Perceptions, and (lack of) Evidence in the Case of Fish Trade in Africa. World Development, 38(7), 933-954. DOI: 10.1016/j.worlddev.2009.12.010.
Béné, C., Abban, E., Abdel-Rahman, S., Ayyappan, S., Brummett, R., Dankwa, H., Kolding, J. (2009). Improved Fisheries Productivity and Management in Tropical reservoirs. CPWF Project number 34. CGIAR Challenge program on food and water report series. www.waterandfood.org.
Béné, C., & Heck, S. (2005). Fish and food security in africa. NAGA, WorldFish Center Quarterly, 28(3-4), 8-13.
Beran, K., Crawford, B. (2018). Assessment of Ahotor Stove Grants on Households Vulnerable to Child Labor and Trafficking. The USAID/Ghana Sustainable Fisheries Management Project (SFMP). Narragansett, RI: Coastal Resources Center, Graduate School of Oceanography, University of Rhode Island and CEWEFIA and DAA. 30 pp.
Berkes, F. (2003). Alternatives to Conventional Management: Lessons from Small-scale Fisheries. Environments, 31(1), 5.
Bernard, H. R. (2017). Research Methods in Anthropology: Qualitative and Quantitative Approaches Rowman & Littlefield.
Blattman, C., Fiala, N., & Martinez, S. (2013). Generating Skilled Self-Employment in Developing Countries: Experimental Evidence from Uganda. The Quarterly Journal of Economics, 129(2), 697-752.

198
Borda, O. F., & Deutschmann, P. (1962). Communication and Adoption Patterns in an Andian Village. San Jose, Costa Rica, Programa Interamericano De Informacion Popular.
Bolwig, S., Ponte, S., Du Toit, A., Riisgaard, L., & Halberg, N. (2010). Integrating Poverty and Environmental Concerns into Value‐Chain Analysis: A Conceptual Framework. Development Policy Review, 28(2), 173-194.
Bostock, T., Greenhalgh, P., & Kleih, U. (2004). Policy Research-Implications of Liberalisation of Fish Trade for Developing Countries: Synthesis Report.
Calhoun, S., Conway, F., & Russell, S. (2016). Acknowledging the Voice of Women: Implications for Fisheries Management and Policy. Marine Policy, 74, 292-299.
Cantril, H., & Livingston, W. K. (1963). The Concept of Transaction in Psychology and Neurology. Journal of Individual Psychology, 19(1), 3.
Cattell, R. B. (1966). The Scree Test for the Number of Factors. Multivariate Behavioral Research, 1(2), 245-276.
Chaudhury, N., Friedman, J., & Onishi, J. (2013). Philippines Conditional Cash Transfer Program Impact Evaluation 2012. Manila: World Bank Report, (75533-PH).
Cheke, R. A., & Ward, A. (1998). A Model for Evaluating Interventions Designed to Reduce Post-Harvest Fish Losses. Fisheries Research, 35(3), 219-227.
Cinner, J., Daw, T., & McClanahan, T. (2009). Socioeconomic Factors that Affect Artisanal Fishers’ Readiness to Exit a Declining Fishery. Conservation Biology, 23(1), 124-130.
Cohen, J. (1988). Statistical Power Analysis for the Behavioral Sciences. 2nd.
Codex Alimentarius Commission. (2009). Code of Practice for the Reduction of Contamination of Food with Polycyclic Aromatic Hydrocarbons (PAH) from Smoking and Direct Drying Processes. Cac/rcp, 68.
Cooksey, K. (2014). Modified Atmosphere Packaging of Meat, Poultry and Fish. Innovations in Food Packaging (second edition) (pp. 475-493) Elsevier.
Crawford, B., Gonzales, L., Amin, D., Nyari-Hardi, B., & Sarpong, Y. (2016). Report on the Baseline Survey of Small Pelagic Fishing Households Along the Ghana Coast. The USAID/Ghana Sustainable Fisheries Management Project (SFMP) Narragansett, RI: Coastal Resources Center, Graduate School of Oceanography, University of Rhode Island.GH2014_PGM187_CRC. 122pp.

199
Crawford, B., Herrera, M. D., Hernandez, N., Leclair, C. R., Jiddawi, N., Masumbuko, S., & Haws, M. (2010). Small Scale Fisheries Management: Lessons from Cockle Harvesters in Nicaragua and Tanzania. Coastal Management, 38(3), 195-215.
Da Silva, D. (2011). Value Chain of Fish and Fishery Products: Origin, Functions and Application in Developed and Developing Country Markets. Food and Agriculture Organization. 63pp.
De Marchi, V. D., Maria, E. D., & Micelli, S. (2013). Environmental Strategies, Upgrading and Competitive Advantage in Global Value Chains. Business Strategy and the Environment, 22(1), 62-72.
Demont, M., & Ndour, M. (2015). Upgrading Rice Value Chains: Experimental Evidence from 11 African Markets. Global Food Security, 5, 70-76.
Dentoni, D., & English, F. (2012). Dealing with Cultural Differences in Public-Private R&D Projects: The Experience of the Australian Seafood Sector. International Food and Agribusiness Management Review, 15(A), 127-132.
Dewees, C., & Hawkes, G. (1988). Technical Innovation in the Pacific Coast Trawl Fishery: The Effects of Fishermen's Characteristics and Perceptions on Adoption Behavior. Human Organization, 47(3), 224-234.
Diei-Ouadi, Y., & Mgawe, Y. I. (2011). Post-Harvest Fish Loss Assessment in Small-Scale Fisheries. A Guide for the Extension Officer. FAO Fisheries and Aquaculture Technical Paper, (559).
Entee, S. (2015). Post-Harvest Processing Value Chain Literature Review Report. The USAID/Ghana Sustainable Fisheries Management Project (SFMP). Narragansett, RI: Coastal Resources Center, Graduate School of Oceanography, University of Rhode Island and Netherlands Development Organization.GH2014_ACT022_SNV. 36pp.
European Food Safety Authority. (2008). Polycyclic Aromatic Hydrocarbons in Food. Scientific Opinion of the Panel on Contaminants in the Food Chain. European Food Safety Authority Journal 724, 114p.
Evangelista, D. (1992). Management of Mangrove Areas in Calauag Bay, Quezon Province, Philippines.
Fafanding, S. F., Tobey, J., & Drammeh, O. (2010). Sole Fishery Value Chain Assessment. Narragansett, RI: Coastal Resources Center, University of Rhode Island. Retrieved from http://www.crc.uri.edu/download/Final_Sole_VCA_Report_August_20101.pdf.

200
Fabinyi, M. (2016). Producing for Chinese Luxury Seafood Value Chains: Different Outcomes for Producers in the Philippines and North America. Marine Policy, 63, 184-190.
Fauzi, A., & Zuzy, A. (2010). Social Resilience and Uncertainties: The Case of Small-Scale Fishing Households in the North Coast of Central Java. Mast, 9(2), 55-64.
Fishery Progress. (2018). Gambia Sole-Bottom Set Gillnet. Retrieved from https://fisheryprogress.org/fip-profile/gambia-sole-bottom-set-gillnet.
Food and Agriculture Organization of the United Nations (FAO). (2008). Many of the World's Poorest People Depend on Fish. Retrieved from http://www.fao.org/Newsroom/en/news/2005/102911/index.html.
Food and Agriculture Organization of the United Nations (FAO). (2014). The State of Fisheries and Aquaculture. Opportunities and Challenges. ( No. E-ISBN 978-92-5-108276-8). Rome: FAO. Retrieved from http://www.fao.org/3/a-i3720e.pdf.
Food and Agriculture Organization of the United Nations. (2015). Voluntary Guidelines for Securing Sustainable Small-Scale Fisheries in the Context of Food Security and Poverty Eradication. Rome. Food and Agriculture Organzation of the United Nations.
Food and Agriculture Organization of the United Nations (FAO). (2015). The Global Forest Resources Assessment. ( No. ISBN-978-92-5-108826-5). Rome. Retrieved from http://www.fao.org/3/a-i4808e.pdf.
Food and Agriculture Organization of the United Nations. (February, 2016). Fishery and Aquaculture Country Profiles. The Republic of Ghana. Retrieved August 12, 2018 from http://www.fao.org/fishery/facp/GHA/en.
Food and Agriculture Organization of the United Nations (FAO). (2018). Fisheries and Aquaculture Department. People and Communities. Retrieved from http://www.fao.org/fishery/ssf/people/en
Friends of the Nation (2015). The USAID/Ghana Sustainable Fisheries Management Project (SFMP), Anti-Child Labour and Trafficking Field PRA Survey Report. Narragansett, RI: Coastal Resources Center, Graduate School of Oceanography, University of Rhode Island. 90p.
Gereffi, G. (1999). International Trade and Industrial Upgrading in the Apparel Commodity Chain. Journal of International Economics, 48(1), 37-70.
Gereffi, G., & Fernandez-Stark, K. (2011). Global Value Chain Analysis: A Primer. Center on Globalization, Governance & Competitiveness (CGGC), Duke University, North Carolina, USA.

201
Gereffi, G., Humphrey, J., & Sturgeon, T. (2005). The Governance of Global Value Chains. Review of International Political Economy, 12(1), 78-104.
Golden, C., Allison, E. H., Cheung, W. W., Dey, M. M., Halpern, B. S., McCauley, D. J., . . . Myers, S. S. (2016). Fall in Fish Catch Threatens Human Health. Nature, 534 (7607), 317-320.
Gordon, A., Pulis, A., & Owusu-Adjei, E. (2011). Smoked Marine Fish from Western Region, Ghana: A Value Chain Assessment. World Fish Center. 41pp.
Hamilton-Hart, N., & Stringer, C. (2016). Upgrading and Exploitation in the Fishing Industry: Contributions of Value Chain Analysis. Marine Policy, 63, 166-171.
Hall, G. M. (2011). Fish Processing: Sustainability and New Opportunities. John Wiley & Sons. Oxford, UK.
Harland, C. M. (1996). Supply Chain Management: Relationships, Chains and Networks. British Journal of Management, 7(s1), S63-S80.
Hara, M. M. (2014). Analysis of South African Commercial Traditional Linefish Snoek Value Chain. Marine Resource Economics, 29(3), 279-299.
Harlow, L. (2014). The Essence of Multivariate Thinking: Basic Themes and Methods. Routledge. New York.
Harper, S., Zeller, D., Hauzer, M., Pauly, D., & Sumaila, U. R. (2013). Women and Fisheries: Contribution to Food Security and Local Economies. Marine Policy, 39, 56-63.
Heck, S., Béné, C., & Reyes‐Gaskin, R. 2007. Investing in African Fisheries: Building Links to the Millennium Development Goals. Fish and Fisheries, 8(3), 211-226.
Hempel, E. (2010). Value Chain Analysis in the Fisheries Sector in Africa. Note: Study Carried Out in Collaboration with INFOSA and Funded by the Trade Working Group of the PARTNERSHIP FOR AFRICAN FISHERIES, an AU/NEPAD Programme.
Huss, H. H. (1988). Fresh Fish-Quality and Quality Changes: A Training Manual Prepared for the FAO/DANIDA Training Programme on Fish Technology and Quality Control Food & Agriculture Org.
Institute for Industrial Research [CSIR], Ghana Standards Authority [GSA], Kwarteng, E. (2016). Testing of low PAH Improved Fish Smoking Stove (Ahotor oven). The USAID/Ghana Sustainable Fisheries Management Project (SFMP), Narragansett, RI: Coastal Resources Center, Graduate School of Oceanography, University of Rhode Island. GH2014_ACT067_SNV. 19p.

202
James, J. (2013). The Diffusion of IT in the Historical Context of Innovations from Developed Countries. Social Indicators Research, 111(1), 175-184.
Kabahenda, M., Omony, P., & Hüsken, S. (2009). Post-Harvest Handling of Low-Value Fish Products and Threats to Nutritional Quality: A Review of Practices in the Lake Victoria Region. Fisheries and HIV/AIDS in Africa: Investing in Sustainable Solutions, the WorldFish Center.
Kaplinsky, R. (2000). Globalisation and Unequalisation: What Can be Learned from Value Chain Analysis? Journal of Development Studies, 37(2), 117-146.
Kaplinsky, R., & Morris, M. (2000). A Handbook for Value Chain Research University of Sussex, Institute of Development Studies.
Karl, H., & Leinemann, M. (1996). Determination of Polycyclic Aromatic Hydrocarbons in Smoked Fishery Products from Different Smoking Kilns. Zeitschrift Für Lebensmittel-Untersuchung Und Forschung, 202(6), 458-464.
Kawarazuka, N., & Béné, C. (2011). The Potential Role of Small Fish Species in Improving Micronutrient Deficiencies in Developing Countries: Building Evidence. Public Health Nutrition, 14(11), 1927-1938.
Kebede, E., Kagochi, J., & Jolly, C. M. (2010). Energy Consumption and Economic Development in sub-Sahara Africa. Energy Economics, 32(3), 532-537.
Kelleher, K. (2005). Discards in the World's Marine Fisheries: An Update Food & Agriculture Organization. Rome.
Kwarteng, E. (2015). Fuelwood Value Chain Analysis Literature Review Report. The USAID/Ghana Sustainable Fisheries Management Project (SFMP). Narragansett, RI: Coastal Resources Center, Graduate School of Oceanography, University of Rhode Island and SNV Netherlands Development Organization.GH2014_SCI010_SNV. 91pp.
Kwarteng, E., Nsiah, A., & Aziebor, E. (2016). Energy Expenditure and Comparative Economics of Fish Processing Techniques Report. The USAID/Ghana Sustainable Fisheries Management Project (SFMP). Narragansett, RI: Coastal Resources Center, Graduate School of Oceanography, University of Rhode Island.GH 2014_ACT076_SNV. 34pp.
Lao, J., Xie, S., Wu, C., Bao, L., Tao, S., & Zeng, E. Y. (2018). Importance of Dermal Absorption of Polycyclic Aromatic Hydrocarbons Derived from Barbecue Fumes. Environmental Science & Technology, 52(15), 8330-8338.
LaGra, J. (1990). A Commodity Systems Assessment Methodology for Problem and Project Identification. A Commodity Systems Assessment Methodology for Problem and Project Identification. Appendix A Post-Harvest Loss Assessment. http://ucanr.edu/datastoreFiles/234-1319.pdf.

203
Lazar, N., Asare, C., Nortey, D., Kankam, S., & Agbogah, K. (2016). The Small Pelagic Fisheries Profile: Analysis of Regional Results. USAID/Sustainable Fisheries Management Project (SFMP). Narragansett, RI: Coastal Resources Center, Graduate School of Oceanography, University of Rhode Island and Hen Mpoano.GH2014_ACT001_CRC. 39pp.
Lowry, K. (1985). Assessing the Implementation of Federal Coastal Policy. Journal of the American Planning Association, 51(3), 288-298.
Macfadyen, G., Nasr-Alla, A. M., Al‐Kenawy, D., Fathi, M., Hebicha, H., Diab, A. M., . . . El-Naggar, G. (2012). Value-Chain Analysis—an Assessment Methodology to Estimate Egyptian Aquaculture Sector Performance. Aquaculture, 362, 18-27.
Madanda, A. (2003). Commercialization and Gender Roles among Lake Victoria Shore Fishing Communities in Uganda. Addis Abada: OSSREA. Research Report. 61pp.
Marchi, V. D., Maria, E. D., & Micelli, S. (2013). Environmental Strategies, Upgrading and Competitive Advantage in Global Value Chains. Business Strategy and the Environment, 22(1), 62-72.
Matsue, N., Daw, T., & Garrett, L. (2014). Women Fish Traders on the Kenyan Coast: Livelihoods, Bargaining Power, and Participation in Management. Coastal Management, 42(6), 531-554.
Moore, G. C., & Benbasat, I. (1991). Development of an Instrument to Measure the Perceptions of Adopting an Information Technology Innovation. Information Systems Research, 2(3), 192-222.
Morrissey, M. T. (1988). Postharvest Fishery Losses: Proceedings of an International Workshop Held April 12-16, 1987, at the University of Rhode Island, Kingston, RI.
Mutimukuru-Maravanyika, T., Mills, D. J., Asare, C., & Asiedu, G. A. (2016). Enhancing Women's Participation in Decision-Making in Artisanal Fisheries in the Anlo Beach Fishing Community, Ghana. Water Resources and Rural Development. https://doi.org/10.1016/j.wrr.2016.04.001.
Murawski, S., Methot, R., & Tromble, G. (2007). Biodiversity Loss in the Ocean: How Bad is it? Science (New York, N.Y.), 316(5829), 1281-4; author reply 1281-4. doi:316/5829/1281b [pii].
Neiland, A. E., & Béné, C. (2013). Poverty and Small-Scale Fisheries in West Africa. Springer Science & Business Media.

204
Nunoo, F., Asiedu, B., Amador, K., Belhabib, D., Lam, V., Sumaila, R., & Pauly, D. (2014). Marine Fisheries Catches in Ghana: Historic Reconstruction for 1950 to 2010 and Current Economic Empacts. Reviews in Fisheries Science & Aquaculture, 22(4), 274-283.
Odjidja, E., Yeboah, D., Abgekpornu, H., Manu, S. and K. Beran. (2016). Morrison Stove Independent Evaluation Report. The USAID/Ghana Sustainable Fisheries Management Project (SFMP). Fisheries Commission, Ministry of Fisheries and Aquaculture Development, and Coastal Resources Center, Graduate School of Oceanography, University of Rhode Island. Narragansett, RI. 55p.
O'Neill, E. D., & Crona, B. (2017). Assistance Networks in Seafood Trade–A Means to Assess Benefit Distribution in Small-Scale Fisheries. Marine Policy, 78, 196-205.
Overa, R. (1993). Wives and Traders: Women's Careers in Ghanaian Canoe Fisheries. Maritime Anthropological Studies, 6(1-2), 110-135.
Pankratz, M., Hallfors, D., & Cho, H. (2002). Measuring Perceptions of Innovation Adoption: The Diffusion of a Federal Drug Prevention Policy. Health Education Research, 17(3), 315-326.
Parry, R. (2012). Principles and Applications of Modified Atmosphere Packaging of Foods. Springer Science & Business Media.
Pauly, D., & Watson, R. (2003). Counting the Last Fish. Scientific American, 289(1), 42-47.
Pietrobelli, C., & Rabellotti, R. (2011). Global Value Chains Meet Innovation Systems: Are There Learning Opportunities for Developing Countries? World Development, 39(7), 1261-1269.
Plahar, W. A., Nerquaye-Tetteh, G. A., & Annan, N. T. (1999). Development of an Integrated Quality Assurance System for the Traditional Sardinella sp. and Anchovy Fish Smoking Industry in Ghana. Food Control, 10(1), 15-25.
Poggie Jr, J. (1972). Toward Quality Control in Key Informant Data. Human Organization, 31(1), 23-30.
Pollnac, R. B., & Crawford, B. R. (2000). Assessing Behavioral Aspects of Coastal Resource Use. Proyek Pesisir Publications Special Report. Coastal Resources Center Coastal Management Report #2226. Coastal Resources Center, University of Rhode Island, Narragansett, Rhode Island. 139pp.
Pollnac, R. B., Pomeroy, R. S., & Harkes, I. H. (2001). Fishery Policy and Job Satisfaction in Three Southeast Asian Fisheries. Ocean & Coastal Management, 44(7-8), 531-544.

205
Pollnac, R. B., & Poggie, J., John J. (2006). Job Satisfaction in the Fishery in Two Southeast Alaskan Towns. Human Organization, 65(3), 329-339.
Pomeroy, R. S., & Andrew, N. (2011). Small-Scale Fisheries Management: Frameworks and Approaches for the Developing World. Oxfordshire, UK and Cambridge, MA: Cabi.
Ponte, S., Kelling, I., Jespersen, K. S., & Kruijssen, F. (2014). The Blue Revolution in Asia: Upgrading and Governance in Aquaculture Value Chains. World Development, 64, 52-64.
Porter, M. E. (1985). Competitive Advantage: Creating and Sustaining Superior Performance. The Free Press. New York.
Porter, M. E. (1998). Clusters and the New Economics of Competition. Harvard Business Review Boston.
Porter, M. E., & Kramer, M. R. (2006). The Link Between Competitive Advantage and Corporate Social Responsibility. Harvard Business Review, 84(12), 78-92.
Purcell, S. W., Crona, B. I., Lalavanua, W., & Eriksson, H. (2017). Distribution of Economic Returns in Small-Scale Fisheries for International Markets: A Value-Chain Analysis. Marine Policy, 86, 9-16.
Quinn, N. (1978). Do Mfantse Fish Sellers Estimate Probabilities in Their Heads? American Ethnologist, 5(2), 206-226.
Quisumbing, A. R., & Pandolfelli, L. (2010). Promising Approaches to Address the Needs of Poor Female Farmers: Resources, Constraints, and Interventions. World Development, 38(4), 581-592. doi:https://doi.org/10.1016/j.worlddev.2009.10.006.
Richardson, J. T. (2011). Eta Squared and Partial eta Squared as Measures of Effect Size in Educational Research. Educational Research Review, 6(2), 135-147.
Riisgaard, L., Bolwig, S., Ponte, S., Du Toit, A., Halberg, N., & Matose, F. (2010). Integrating Poverty and Environmental Concerns into Value‐Chain Analysis: A Srategic Framework and Practical Guide. Development Policy Review, 28(2), 195-216.
Robson, C. (2011). Real World Research: A Resource for Users of Social Research Methods in Applied Settings 3rd Edition.
Röling, N. (2010). The Impact of Agricultural Research: Evidence from West Africa, Development in Practice, 20:8, 959-971, DOI: 10.1080/09614524.2010.513724.
Rogers E. M. (1995). Diffusion of Innovations (Fourth Edition). The Free Press. New York.

206
Rosales, R. M., Pomeroy, R., Calabio, I. J., Batong, M., Cedo, K., Escara, N., . . . Sarahadil, M. (2017). Value Chain Analysis and Small-Scale Fisheries Management. Marine Policy, 83, 11-21.
Rummel, R. J. (1970). Applied Factor Analysis. Northwestern University Press. Evanston.
Ryan, B., & Gross, N. C. (1943). The Diffusion of Hybrid Seed Corn in Two Iowa Communities. Rural Sociology, 8(1), 15.
Santos, A. N. (2015). Fisheries as a Way of Life: Gendered Livelihoods, Identities and Perspectives of Artisanal Fisheries in Eastern Brazil. Marine Policy, 62, 279-288.
Sea Temperature. (2017). Water Temperature Gambia in August. Retrieved from https://seatemperature.info/august/gambia-water-temperature.html.
Steckler, A., Goodman, R. M., McLeroy, K. R., Davis, S., & Koch, G. (1992). Measuring the Diffusion of Innovative Health Promotion Programs. American Journal of Health Promotion, 6(3), 214-224.
Stephenson, G. O. (1980). " Pushing for the highline": The Diffusion of Innovations in the Oregon Otter Trawl Fishery. Master of Arts Thesis. Retrieved August 12, 2018 from https://ir.library.oreganstate.edu/downloads/7h149t88k.
Tango-Lowy, T., & Robertson, R. A. (2002). Predisposition Toward Adoption of Open Ocean Aquaculture by Northern New England's Inshore, Commercial Fishermen. Human Organization, 61(3), 240-251.
The Gambia Department of Fisheries Statistics Unit. (2015).
Thilsted, S. H., Thorne-Lyman, A., Webb, P., Bogard, J. R., Subasinghe, R., Phillips, M. J., & Allison, E. H. (2016). Sustaining Healthy Diets: The Role of Capture Fisheries and Aquaculture for Improving Nutrition in the Post-2015 Era. doi:https://doi.org/10.1016/j.foodpol.2016.02.005.
Thorpe, A., & Bennett, E. (2004). Market-Driven International Fish Supply Chains: The Case of Nile Perch from Africa's Lake Victoria. International Food and Agribusiness Management Review, 7(4), 40-57.
Thorpe, A., Reid, C., Van Anrooy, R., & Brugere, C. (2005). When Fisheries Influence National Policy-Making: An Analysis of the National Development Strategies of Major Fish-Producing Nations in the Developing World. Marine Policy, 29(3), 211-222.
Tobey, J., Normanyo, A., Osei, P., Beran, K., & Crawford, B. (2016). Subsidies in Ghana’s Marine Artisanal Fisheries Sector. USAID/Ghana Sustainable Fisheries Management Project (SFMP). Narragansett, RI: Coastal Resources Center, Graduate School of Oceanography, University of Rhode Island.GH2014_POL059_CRC. 53pp.

207
Tornatzky, L. G., & Klein, K. J. (1982). Innovation Characteristics and Innovation Adoption-Implementation: A Meta-Analysis of Findings. IEEE Transactions on Engineering Management, (1), 28-45.
Uchida, H. (2017). TURFs, Collective Fishery Management, and Fishery Cooperatives. Bulletin of Marine Science, 93(1), 83-99.
United Nations. (2014). The Fisheries Sector in The Gambia: Trade, Value Addition and Social Inclusiveness, with a Focus on Women. (Analytical report). New York: United Nations.
United Nations. (2016). Sustainable Development Goals Report 2016 United Nations. New York.
United States Agency for International Development. (2014). Gambia-Senegal Sustainable Fisheries Project (USAID/BaNafaa) Final Report. (Final Report No. 624-A-00-09-00033-00). Narragansett, RI: Coastal Resources Center, University of Rhode Island Graduate School of Oceanography. http://pdf.usaid.gov/pdf_docs/PA00K5JG.pdf.
USAID. 2011. Feed the Future FY 2011-2015 Multi-year Strategy. U.S> Government Document Approved February 22, 2011. http://www.feedthefuture.gov/sites/default/files/country/strategies/files/GhanaFeedtheFutureMulti-YearStrategy 2011-08-03.pdf.
Walker, B. L. E. (2001). Sisterhood and Seine-nets: Engendering Development and Conservation in Ghana's Marine Fishery. The Professional Geographer, 53(2), 160-177.
Walker, B. L. E. (2002). Engendering Ghana's Seascape: Fanti Fish Traders and Marine Property in Colonial History. Society &Natural Resources, 15(5), 389-407.
Ward, A., & Jeffries, D. (2000). A Manual for Assessing Post-Harvest Fisheries Losses. Overseas Development Administration. Natural Resources Institute. University of Greenwich.
Washington, S. (2009). Private Standards in Fisheries and Aquaculture: Current Practice and Emerging Issues. GLOBEFISH Research Programme, 97, I.
Weeratunge, N., Snyder, K. A., & Sze, C. P. (2010). Gleaner, Fisher, Trader, Processor: Understanding Gendered Employment in Fisheries and Aquaculture. Fish and Fisheries, 11(4), 405-420.

208
Wentink, C. R., Raemaekers, S., & Bush, S. R. (2017). Co-Governance and Upgrading in the South African Small-Scale Fisheries Value Chain. Maritime Studies, 16(1), 5.
WorldFish Center. (2008). Small-Scale Capture Fisheries: A Global Overview with Emphasis on Developing Countries: A Preliminary Report of the Big Numbers Project. The WorldFish Center Working Papers.
World Food Summit. (1998). Conference on Attaining the World Food Summit’s Objectives Through a Sustainable Development Strategy Following the Plan of Action at the World Food Summit in 1996. Rome. http://archive.ipu.org/splz-e/rome98.htm.
World Health Organization. (2018). International Food Standards (FAO/WHO Codes Alimentarius. Retrieved August 12, 2018 http://www.who.int/foodsafety/areas_work/food-standard/en/.