digital footprints as collateral for debt collection 2021
TRANSCRIPT

Digital Footprints as Collateral for Debt Collection
Lili Dai, Jianlei Han, Jing Shi, and Bohui Zhang☆±
Current Version: March 2021
☆ Lili Dai is from UNSW Business School, UNSW Sydney, Sydney, Australia; Jianlei Han and Jing Shi are from Macquarie Business School, Macquarie University, Sydney, Australia; Bohui Zhang is from the School of Management and Economics and Shenzhen Finance Institute, The Chinese University of Hong Kong, Shenzhen (CUHK-Shenzhen), Longxiang Boulevard, Longgang District, Shenzhen, China, 518172. Authors’ contact information: Lili Dai, [email protected]; Jianlei Han, [email protected]; Jing Shi, [email protected]; Bohui Zhang, [email protected]. We are grateful for the valuable comments from Yi-Chun Chen, Junshan Duan, Yongheng Deng, Hanming Fang, Yan Guo, Yi Huang, Guangzhong Li, Jian Wang, Yongxiang Wang, Shang-Jin Wei, Tom Smith, Susan Thorp, Daniel Xu, Hongjun Yan, Xiaoneng Zhu, Wu Shu, and the conference and seminar participants at Fudan University, Guangdong University of Finance and Economics, La Trobe University, Lanzhou University, Macquarie University, Renmin University of China, Shanghai Jiao Tong University, Sichuan University, Tianjin University, Xi’an Jiao Tong University, Zhongnan University of Economics and Law, the 2020 NBER Chinese Economy Working Group Meeting, the 2020 Summer Research Workshop of China Journal of Accounting Research, and the 2020 Academic Forum of Young and Middle-aged Committee of Guangdong Economic Society.

Digital Footprints as Collateral for Debt Collection
Abstract
We examine the role of borrowers’ digital footprints in debt collection. Using a large sample of personal loans from a fintech lender in China, we find that the information acquired by the lender through borrowers’ digital footprints can increase the repayment likelihood on delinquent loans by 18.5%. The effect can be explained by two channels: bonding borrowers’ obligations with their social networks and locating borrowers’ physical locations. Moreover, the lender is more likely to approve loan applications from borrowers with digital footprints, even though these borrowers may occasionally have a higher likelihood of delinquency. The use of digital footprints can remain legitimate under stringent privacy protection regulations and fair debt collection practices. Our findings suggest that digital footprints, as a new type of collateral, can ultimately enhance financial inclusion by facilitating the lender’s collection of delinquent loans. JEL classification: D14, G14, G23, G51 Keywords: delinquency, collateral, debt collection, digital footprints, fintech

1
1. Introduction
Delinquency is a pervasive issue in consumer credit markets worldwide. According to the 2020
report of the Consumer Financial Protection Bureau (CFPB), outstanding credit card debt
reached $927 billion in 2019 in the U.S., and 8.4% was more than 90 days in arrears. Similarly,
in the same year, Chinese credit card holders accumulated a comparable amount of $13 billion
overdue for more than six months. This enduring problem of loan delinquency indicates there
is a need for new tools to help creditors obtain repayments. The wide use of smartphones and
internet services generates information about the online activities of users, such as their
contacts, the mobile applications they use, and the websites they frequent. We refer to such
information as digital footprints and propose the use of debtors’ digital footprints as a novel
channel to facilitate creditors’ debt collection.
Creditors’ efforts in the loan process mainly involve credit scoring and debt collection.
Recent research suggests that digital footprints are useful in evaluating borrowers’ default risk
and thereby can assist creditors’ loan approval decisions (Berg et al. 2020; Agarwal et al. 2021;
Jiang et al. 2021).1 Different from these studies, we consider the role of digital footprints in
debt enforcement when loans are delinquent. In particular, we argue that the information
acquired by lenders through borrowers’ digital footprints can be used as collateral to recover
the delinquent debt.
Pledged collateral has long been regarded as a commitment device to enforce debt
repayment (e.g., Jimenez, Salas, and Saurina 2006; Benmelech and Bergman 2009; Rampini
and Viswanathan 2010, 2013; DeMarzo 2019). However, as featured with unsecured loan
contracting without any collateral, consumer credit often lacks such a guarantee. Especially in
fast and small consumer credit contracts like those in marketplace lending, borrowers typically
do not provide collateral assets. Thus, lenders need to look for other commitment technologies
to secure debt claims (Thakor 2020). In such scenarios, we view borrowers’ digital footprints
as a new form of collateral – digital collateral.
Digital collateral could be effective in debt collection for at least two reasons. First, by
using the information contained in borrowers’ digital footprints, lenders can identify who
borrowers contact via mobile phones, email, or instant messaging applications, and thus might
be able to discover their social networks. When a loan is delinquent, the lender can contact the
1 Digital footprints are the traceable digital activities, actions, communications, and contributions that people leave on the Internet or through mobile devices when they access and register websites and mobile applications. Other studies on debt markets have examined the general role of technology-based lenders in mortgage lending markets (Fuster et al. 2019), the online shadow banks (Buchak et al. 2018), and the peer-to-peer (P2P) lending platforms (Tang 2019; Vallée and Zeng 2019; Du et al. 2020).

2
borrower’s family members and friends to collect further information about the borrower. As
long as the lender’s conduct is not abusive and deceptive, such contact is usually allowed by
the U.S. Fair Debt Collection Practices Act. However, in countries with weak debtor protection,
the lender sometimes shares the borrower’s debt delinquency information with her key contacts
and asks them to urge the borrower to repay. Either possibility might threaten the borrower’s
trustworthiness among her social network, and more generally, her social capital. If the
borrower’s social capital is at risk, the borrower might be incentivized to repay the debt (e.g.,
Karlan et al. 2009; Lee and Person 2016; Diep-Nguyen and Dang 2020).2 Therefore, digital
footprints as collateral could be used to bond borrowers’ social capital with debt claims. We
consider this view as the social capital channel through which digital collateral can facilitate
debt collection.
Second, lenders may obtain borrowers’ address information such as postal addresses for
online shopping from their digital footprints. Such information would enable lenders to identify
borrowers’ physical locations. In case of delinquency, by knowing the borrower’s address,
lenders can employ local legal institutions to go after her income and assets without resorting
to violence (Djankov, McLiesh, and Shleifer 2007; Djankov et al. 2008). For example, lenders
can exercise liens to seize goods from a borrower’s dwellings or other addresses.3 Moreover,
if the delinquent borrower knows that the lender has her address, additional pressure may be
imposed on the borrower due to a reduced psychological distance and a heightened threatening
stimulus (McGraw et al. 2012; Williams, Stein, and Galguera 2014; Boothby et al. 2016).
Therefore, when a delinquent borrower receives a phone call from the debt collector
mentioning her address information, she could believe the lender would come and go after her
assets for debt enforcement, and may also face more pressure caused by the shortened
psychological distance with the lender. Both possibilities can motivate the borrower to make
loan repayments. We regard this conjecture as the physical location channel underlying the
digital collateral effect on debt collection.
We also acknowledge that the effect of digital footprints as collateral on debt collection
could be marginal. First, the information in digital footprints may simply reflect borrowers’
2 Karlan et al. (2009) develops a theory by adopting sociologists’ concept of social capital, which “constitutes a particular kind of resource available to an actor” (Coleman 1988), and “refers to features of social organization such as networks, norms, and social trust that facilitate coordination and cooperation for mutual benefit” (Putnam 1995). Using the data on informal lending from Peru, Karlan et al. (2009) empirically documents the importance of using individuals’ social capital to facilitate personal borrowings. 3 Here, we refer the judgment liens to involuntary or non-consensual liens arise via statute or operation of the common law. When creditors seek legal actions for loan delinquency, liens can be imposed on borrowers’ properties and chattels.

3
characteristics, such as age, income, and gender, which may render digital footprints less
incremental information in facilitating debt collection. Second, the data from borrowers’ digital
activities could be noisy, leading to low information quality, which could make debt
enforcement mechanisms less effective. Third, fintech lenders may complement banks and
mainly serve low credit quality borrowers, who often have a high delinquency likelihood and
are insensitive to debt collection tactics. Taken together, whether digital footprints can help in
debt collection is an open empirical question.
We examine our conjectures using data on personal loan contracts from a leading fintech
company in China. The fintech company only asks a borrower to provide her mobile number
and national identity number. With such information, the lender can obtain other information
about the borrower from third-party data providers, such as her credit score, the balance of her
online payment accounts, and the historical record of past loan applications. The lender then
computes the internal credit score and evaluates the borrower’s creditworthiness.
More importantly, this fintech creditor can also obtain a borrower’s digital footprints from
data providers, including her frequent mobile contacts and delivery addresses provided when
shopping online. When the loan is delinquent, the fintech lender will make phone calls to both
the borrower and her key contacts.4 According to our conjecture of digital collateral, the
borrower’s digital footprints would allow the lender to enforce debt collection by reaching the
borrower’s social network and/or locating her physical address. We expect borrowers with
digital collateral to be more likely to repay their loans upon receiving the lender’s phone calls.
We focus on the information of frequent contacts and online shopping addresses both
sourced from digital footprints, because the two types of digital footprints have sufficient data
allowing us to investigate their debt recovery effects. Although not explored in our study, other
types of digital footprints might also be feasible for debt collection. Hypothetically, lenders
can depict borrowers’ personality traits using the contents of personal pages and posts on social
media platforms and adopt a borrower-specific debt collection strategy to effectively pursue
delinquent loans from a certain type of borrowers, as an example.
Our empirical analyses start with a sample of 41,711 delinquent personal loan contracts
over the period from July 2017 to November 2019. To examine the effect of digital collateral
on the repayment of delinquent loans, we employ a difference-in-differences (DID) approach.
4 Prior to the due date, the fintech lender sends reminder messages to borrowers via mobile phones (Cadena and Schoar 2012; Karlan, Morten, and Zinman 2015; Medina 2018; Bursztyn et al. 2019; Du et al. 2020). Three months after a delinquency, if the borrowers still fail to make repayments, the lender will hand over the cases to debt collection agencies for further debt enforcement (Fedaseyeu and Hunt 2018; Fedaseyeu 2020).

4
Specifically, we first perform the propensity score matching (PSM) strategy by matching
borrowers with digital collateral (the treatment group) to those without collateral (the control
group). This step provides us with two samples. One sample consists of 14,768 delinquent
borrowers having frequent mobile contacts in their social networks, together with the same
number of borrowers with no frequent contact information. Another sample includes 9,994
delinquent borrowers with online shopping delivery addresses and the matched ones without
the address information.5
Second, in a timeline after delinquency, the lender will make five rounds of phone calls to
these delinquent borrowers in the following quarter: the fourth day after the repayment due
date (hereafter, Day 4), followed by another four dates (i.e., Day 16, Day 31, Day 61, and Day
91). If repayment does not occur within the chasing period, after Day 93, the delinquent loans
will be turned over to external debt collection agencies. 6 We examine the likelihood of
repayment in several six-day windows surrounding the dates when delinquent borrowers
receive phone calls from the lender. This enables us to compare the changes in the likelihood
of repayment after collection calls between the treatment and control groups.
Consistent with our conjectures on the social capital and physical location channels, we
find that after receiving the lender’s chasing calls, borrowers with digital collateral are more
likely to repay their delinquent loans than those with no digital collateral. The effect is
economically significant. For instance, in the first round of phone calls on Day 4, a delinquent
borrower with frequent mobile contact (physical address) information has a 1.8% (1.8%) higher
daily likelihood of loan repayment than those without such information from Days 4 to 6,
compared to that from Days 1 to 3. The economic magnitude accounts for an increase of 16.6%
(18.5%) relative to the sample mean of the daily repayment likelihood in the six-day window
around Day 4. The results remain qualitatively similar for the second round of chasing calls on
Day 16.
Next, we conduct two placebo tests to validate our baseline findings. First, we repeat the
DID tests using a placebo sample period for the six-day window centered on the repayment
due date (i.e., Day zero), during which the lender makes no phone call but sends repayment
reminders through mobile messages in three days before the due of repayment. We find no
5 Frequent mobile contacts are defined as a borrower’s mobile contacts who have made phone calls to the borrower for more than ten times, with each conversation longer than 20 seconds. For the online shopping delivery addresses, we exclude non-residential addresses, such as the delivery addresses of convenience stores in the local residential communities that provide the services of dropping and picking up the delivered shopping packages. 6 See Figure 2 regarding the timeline. The fintech lender will send reminding messages from Days -3 to 0 (delinquency date), and then make chasing calls on Day 4, Day 16, Day 31, Day 61 and Day 91. After Day 93, the delinquent loans will be handed over to external debt collection agencies.

5
significant difference in the loan repayment likelihood between borrowers backed by digital
collateral and those with no collateral during the pre-event payment period. Second, to ensure
that our baseline findings are not simply driven by chance, we conduct a simulation by
artificially constructing pseudo borrowers with digital collateral. We randomly assign half of
our sample borrowers as the pseudo borrowers with digital collateral to the new treatment
groups and the remaining half of them to the pseudo control groups. We generate the
randomized pseudo samples 1,000 times and then reconduct the DID analyses in these pseudo
samples. We find that the mean and median values of the pseudo coefficients are statistically
insignificant and much smaller in magnitude than those in our main tests, thus mitigating the
by-chance concern.
Moreover, we perform several additional tests concerning the amount of digital collateral,
the sequence of chasing calls, and the separation of the two types of digital footprints. We first
decompose the metrics of digital collateral based on the median numbers of borrowers’
frequent contacts and addresses. The results show that there is a marginal decline in the
coefficients on collateral proxies for borrowers with a large amount of collateral compared to
those with a small amount of collateral. This is likely because multiple pieces of digital
footprints may distract debt collectors’ efforts to borrowers’ less important personal
information, reducing the effectiveness of using digital collateral. Second, we compare the
effect of digital collateral in the first two rounds of chasing calls with that in the next three
rounds (i.e., Day 31, Day 61, and Day 91). We find that the effect of these further chasing calls
on debt collection remains significant, but the magnitude of such an effect is significantly
reduced. These results indicate that the borrowers, who continue to be delinquent after the first
two chasing calls, are less concerned about their social capital and physical locations,
suggesting the declining value of their digital footprints as collateral in sequence. Third, we
examine whether our baseline findings are driven by one type of digital footprints rather than
both (i.e., key contacts and physical locations). We conduct a subsample test to separate the
effects of the two types of digital footprints and find that both types of digital footprints play
significant roles in facilitating the debt collection process.
To provide further evidence on the social capital and physical location channels, we
perform cross-sectional analyses to investigate whether the digital collateral effect on debt
collection is more pronounced for subgroups of borrowers who are more subject to these two
economic mechanisms. When borrowers are from hometowns where people have more social
spending and attend more veneration events honoring ancestors, they are typically concerned
about their social capital (Yang 1994; Lakos 2010). Thus, they are more likely influenced by

6
the digital collateral with frequent contacts. For the borrowers living further away from the
lender’s headquarters and in areas with stronger law enforcement, the availability of their
physical locations to the lender may incentivize them to make repayments because of the
potential judicial enforcement (Djankov, McLiesh, and Shleifer 2007; Djankov et al. 2008) and
additional psychological pressure (Williams, Stein, and Galguera 2014; Boothby et al. 2016).
The results of these cross-sectional analyses are consistent with the two economic channels,
corroborating our main findings.
To provide a complete picture of the role of borrowers’ digital footprints in the loan
process, we examine how digital footprints affect the repayment amount, delinquency
likelihood, and loan approval. First, we study the impact of digital collateral on the magnitude
of debt recovery after delinquency. Among the 41,711 delinquent loans, we find that the
amount of debt repayment scaled by total debt outstanding is positively associated with the
availability of borrowers’ digital collateral. Furthermore, we focus on the dummy of debt
recovery, indicating whether the repayment amount is equal to or more than total debt
outstanding caused by the penalty of delinquency. We observe that the likelihood of debt
recovery also increases with the availability of digital collateral. These results provide further
confirmation on the role of digital footprints as collateral in debt collection.
Second, we examine whether the likelihood of loan delinquency is associated with the
presence of borrowers’ digital footprints. One possible concern on our headline findings is that
the existence of frequent mobile contacts and physical addresses might proxy for borrowers’
creditworthiness rather than collateral. For example, the availability of digital footprints could
imply a low likelihood of delinquency. To test this possibility, we investigate our sample of
97,783 approved loan contracts, consisting of both delinquent and non-delinquent loans. We
find that the incidence of delinquency is positively associated with the presence of borrowers’
frequent contact information, while other conventional proxies for creditworthiness are
negatively associated with the loan delinquency rate, consistent with prior studies. This finding
helps to alleviate the concern that digital footprints are merely a measure of borrowers’ credit
quality.
Third, we investigate the impact of digital collateral on the fintech lender’s loan approval
decisions based on a sample of 236,967 loan applications, including unapproved contracts.
Intuitively, we find that the lender is more likely to approve the loan for a borrower with digital
collateral available, after controlling for credit quality proxies, such as the borrower’s online
credit score, payment account balance, and historical record of past loan applications. This
finding suggests that digital collateral has an incremental effect on top of the information
7
regarding the borrower’s credit quality. That is, the lender does take the borrower’s digital
footprint information into account when evaluating the loan application, partly because the
lender would be able to collect repayment effectively from the borrower in the case of
delinquency.
Finally, we provide further discussions about the practical implications of our study in
terms of the data privacy concerns, the fair debt collection practices, and the fintech impacts
on financial inclusion. First, even under public awareness and policy debate about how to
protect individuals’ right to data privacy, the use of digital collateral can be maintained as
legitimate if the collection and use of personal data are in accordance with a country’s laws
and regulations. Second, the debt collection tactic based on borrowers’ digital collateral can be
feasible not only in countries with weak debtor protections but also in those with strict laws
and regulations against abusive debt collection practices, such as the U.S. Third, according to
the 2014 report by World Bank, only seven percent of adults in developing countries have
credit cards. Thus, our study offers a novel approach based on digital techniques to promote
financial inclusion and especially help borrowers with no physical collateral available.
The rest of the paper is organized as follows. Section 2 discusses the related literature.
Section 3 describes the institutional background, variable construction, and summary statistics
of the variables used in our study. Sections 4 presents the main results for the association
between digital footprints and debt collection. Section 5 reports the additional tests of economic
mechanisms and other outcome variables of the loan process, and Section 6 provides further
discussions. Section 7 concludes the paper.
2. Related literature
We contribute to four strands of literature. First, previous literature examines the risk relevance
of digital footprints for borrowers’ credit assessment, complementing the credit bureau scores
in debt markets (Berg et al. 2020; Agarwal et al. 2021). Jiang et al. (2021) show that big data
credit scores (e.g., borrower’s record of previous loan applications) can have an incremental
predictive power for loan delinquency likelihood. In a similar vein, other novel characteristics
of borrowers can be factored into the lending process, including, for example, borrowers’
appearances (Duarte, Siegel, and Young 2012), online friendships (Lin, Prabhala, and
Viswanathan 2013), peer lenders’ creditworthiness (Iyer et al. 2016), and employment and
income verification (Chan et al. 2020). Different from these studies, we consider the particular
role of digital footprints in debt enforcement. We find that the information in digital footprints
can be used as collateral to facilitate debt collection.

8
Second, more broadly, our study adds to the research on the impacts of big data analytics
in capital markets in terms of reducing macro uncertainty (Mukherjee, Panayotov, and Shon
2020), improving informational efficiency (Zhu 2019; Grennan and Michaely 2020),
disciplining corporate managers (Zhu 2019), increasing information asymmetry between
sophisticated investors and individual investors (Katona et al. 2020), and predicting firm
performance and stock returns (Froot et al. 2017; Huang 2018; Green et al. 2019; Agarwal,
Qian, and Zou 2020). As one type of big data, our findings highlight that the usage of digital
footprints can effectively increase the repayment likelihood on delinquent loans.
Third, we contribute to the literature on debt collateral and collection. Prior theoretical
studies suggest the roles of collateral in mitigating financial frictions (Johnson and Stulz 1985;
Aghion and Bolton 1992; Hart and Moore 1994, 1998), and in incentivizing repayments in debt
markets (Kiyotaki and Moore 1997; Rampini and Viswanathan 2010, 2013). Empirically,
Benmelech and Bergman (2009) has documented that debt collateral can lower the credit
spread, and Schiantarelli, Stacchini, and Strahan (2020) finds that debt collateral backed by
assets can mitigate the likelihood of delinquency. The literature on debt collection documents
the determinants of the recovery of delinquent loans, including information technology
development (Drozd and Serrano-Padial 2017), debt collection agencies (Fedaseyeu and Hunt
2018; Fedaseyeu 2020), and lenders’ communications with borrowers via phone calls and
reminder messages (Laudenbach, Pirschel, and Siegel 2018; Bursztyn et al. 2019; Du et al.
2020; Liao et al. 2020). Our study complements these studies by documenting that digital
collateral backed by borrowers’ social and physical capital is effective in enforcing debt
repayments.
Fourth, our paper provides fresh insight on an emerging stream of literature examining the
relation between fintech and traditional lenders. Prior studies have shown that fintech lenders
can act as substitutes for banks (Tang 2019) and provide services in lending markets exited by
traditional lenders (Erel and Liebersohn 2020). For example, the extant research suggests that
fintech lenders tend to supply credit when banks face stringent regulatory constraints (Buchak
et al. 2018; De Roure, Pelizzon, and Thakor 2019), when new credit regulations are introduced
to limit borrowers’ access to traditional lenders (Braggion, Manconi, and Zhu 2020), and when
banks tighten credit standards (Allen, Shan, and Shen 2020). Moreover, fintech lenders
typically process loan applications faster and adjust supply more elastically than traditional
lenders (Fuster et al. 2019), and rely on investors’ information production, different from the
conventional banking paradigm (Vallee and Zeng 2019). In this paper, we document another

9
key distinction of fintech lenders from the debt collection perspective, deviating from the
traditional banking model.
3. Institutional background, variable definitions, and descriptive statistics
In this section, we describe the institutional background of our research setting and present the
definitions and summary statistics of the variables used in our main analyses.
3.1. Institutional background
We obtain the data of personal loan contracts from a leading fintech company in China with
the lending business starting from 2017. To allow the potential borrowers to submit their loan
applications, the company set up application terminals in retail stores across most major cities
in China, with staffs assisting loan applicants in the application process. Figure 1 illustrates the
process of the loan application, approval, repayment, and collection.
[Insert Figure 1 Here]
An applicant can apply for a loan at the fintech company’s terminal, which is a tablet with
a touchscreen display designed for the submission of loan applications. The applicant will fill
in the information in her national identity card as well as her mobile number in the loan
application.7 Subsequently, for each loan application, the lender will use an applicant’s mobile
number and national identity number to obtain her personal data in digital footprints from third-
party data providers. The third-party information covers the applicant’s mobile phone call logs
from mobile carriers, delivery addresses for online shopping, credit score from Tencent (the
largest social media company in China), Alipay account balance from Alibaba (the largest e-
commerce company in China), and historical record of loan applications from other online
lending companies.8 With the information from the loan applicant’s digital footprints, the
fintech lender will determine whether the loan application should be approved. Then, the lender
will inform the applicant with the decision of either loan approval or rejection, normally within
ten minutes.
If the loan application is approved, the borrower will obtain money from the fintech lender
and either use it to purchase goods or keep the cash for future use. In the next six or twelve
months, subject to loan maturity, the borrower needs to pay the monthly principal and interest
7 The lender’s staff can verify the mobile number and national identity number through a nationwide verification system after an applicant presents her physical national identity card to the staff. 8 The applicant’s digital footprints can be directly sourced from online and mobile service providers or extracted by the data providers using crawler technologies from internet websites.

10
back to the lender. When a borrower fails to make a monthly repayment before the due date,
the fintech lender will execute a standardized debt collection process against the delinquent
borrower. Figure 2 illustrates the timeline of the company’s debt collecting process.
As shown in the timeline, in a four-day window [-3, 0] up to the repayment due date (Day
zero), the lender starts to send mobile messages as reminders to borrowers. If a borrower still
does not make the repayment, on Day 4 the lender will call the borrower and tell her that debt
delinquency may negatively impact her nationwide credit score, which is widely shared and
used by financial institutions and public services in China. In general, it would be hard for a
person with a low credit score to obtain future mortgage loans and even travel on high-speed
trains and airlines.
[Insert Figure 2 Here]
The lender will also make phone calls to the borrower’s frequent mobile contacts if such
information can be obtained from her digital footprints. In addition, if the lender can obtain the
borrower’s physical location from her digital footprints, the borrower will be informed that
failure to repay the debt could result in a visit by a debt collector at her physical location and
probably the case will also be reported to the borrower’s neighborhood committee.9 Further,
the lender will warn the borrower with penalties enforced by the police and a potential lawsuit
in court. Especially, when a borrower’s address information is available, the lender will inform
the borrower about the possible enforcement actions in phone calls, such as releasing a legal
notice to the borrower’s physical location through personal service.
After Day 4, when the borrower still fails to make the loan repayment, the lender will call
the borrower and her frequent contacts if available again on Day 16, Day 31, Day 61, and Day
91, if needed. Finally, following the last chasing call after Day 93, the fintech lender will hand
over the delinquent loan to a third-party debt collection agency, who will make further efforts
on loan collection. Figure 3 illustrates the role of digital collateral in the loan collection process
compared to the debt recovery role of traditional collateral.
[Insert Figure 3 Here]
3.2. Variable construction
9 In China, a neighborhood committee administers the dwellers living in the residential community. Reporting to the committee may enable the spread of a borrower’s loan delinquency news, thereby damaging the borrower’s social capital in the residential community.
11
3.2.1. Loan repayment and collection variables
Our sample starts with 236,967 personal loan applications from July 2017, when the fintech
company started the lending business, to November 2019. The sample consists of unique
borrower-loan observations. For a borrower engaging with multiple loan applications, the first
application will be selected.10 Among these loan applications, 97,783 applications have been
approved. Figure 4 presents the geographical distribution of the loan application density, (i.e.,
the number of applications per million of the population across the provinces in China).11 As
indicated in the figure, the sample of applications is widely spread over across the country and
well represents the population in China.
[Insert Figure 4 Here]
Within the 97,783 approved loans, 41,711 borrowers experience loan delinquency. Our
main analyses focus on first-time delinquency for these borrowers. To measure the outcome of
loan repayment on a daily basis, we construct an indicator variable, Paid t, equal to one if a
borrower makes the repayment on Day t, and zero otherwise, with Day zero referred to the due
date. We define Chasing Day t as an indicator variable equal to one for days in a three-day
window [t, t+2] after the lender calls delinquent borrowers and zero otherwise for the DID
analyses. Day t refers to Day 4, Day 16, Day 31, Day 61, and Day 91. To better identify the
loan repayment triggered by chasing calls, we restrict the sample by only including borrowers
who remain delinquent until Day t-3 for a chasing call on Day t. For example, we study the
borrowers who remain delinquent on Day 1 (Day 13) in the analyses for chasing calls on Day
4 (Day 16).
In additional analyses, we further construct the loan outcome variables as follows.
Repayment Ratio is defined as the ratio of the repayment amount to total debt outstanding.
Repayment Complete is an indicator variable for loan recovery if the repayment amount is equal
to the total debt outstanding, or more than the outstanding amount caused by the penalty of
delinquency. Delinquency is an indicator variable that equals one if a loan is delinquent, and
Approval is an indicator variable that equals one if a loan application is approved.
10 We focus on the first loan deals because the borrowers’ behavior of debt repayment in the first loan can be different from the behavior in further rounds of loans. The subsample of borrowers with multiple loans accounts for less than one percent of the full sample and including these repeated loans will not alter our analyses’ inferences. 11 The geographical distribution is estimated based on borrowers’ hometown cities indicated in their national identity cards.

12
3.2.2. Digital collateral variables
We construct two measures of digital collateral in our main analyses. First, we define
Contact as the indicator variable if a borrower’s frequent mobile contacts can be obtained from
her digital footprints (i.e., through phone call logs provided by mobile carriers). We apply the
following filters to identify frequent contacts: 1) a frequent contact number should not be a
phone number for commercial services; 2) a frequent contact should have made more than ten
phone calls with the borrower; and 3) each phone call to be counted toward a frequent contact
should last for more than 20 seconds.
Second, we construct the digital collateral metric, Address, as an indicator variable for
whether a borrower’s physical address can be obtained from her digital footprints. Specially,
the fintech lender acquires the address data from the borrower’s online shopping transactions
in Taobao, the largest Chinese online shopping site operated by Alibaba. The online shopping
address collected from digital footprints can better facilitate debt collection compared to the
hometown address indicated in the national identity card. This is because the shopping address
timely reflects a borrower’s current location, allowing the lender to apply the debt collection
strategy based on the current address information. We filter out the addresses that do not appear
to be the borrower’s residential or office address, or those that are not helpful in identifying the
borrower’s location. First, we exclude the addresses with keywords in relation to convenience
stores that provide the services for customers to pick up delivered packages. Second, we further
exclude the addresses with no street or unit number.
In further analyses, we construct several additional digital collateral proxies in the
following ways. We first construct two pseudo digital collateral measures, Contact Pseudo and
Address Pseudo, by randomly assigning sample borrowers to treatment groups as if they have
digital collateral. Moreover, to consider the amount of digital collateral, we count the number
of the borrower’s frequent mobile contacts, Contact Number, and the number of the borrower’s
physical addresses, Address Number. When a borrower has no digital collateral, we code Contact
Number and Address Number as zero. We also decompose Contact Number (Address Number) by the
median value of the contact number (address number) in our sample, i.e., greater versus smaller
than or equal to seven (one) for the contact number (address number), into Contact 1≤Number≤7
and Contact Number>7 (Address Number=1 and Address Number>1). For example, Contact 1≤Number≤7
indicates whether a borrower has at least one and at most seven frequent contacts.
3.2.3. Control variables

13
We have three sets of control variables in our regression analyses. First, we include loan
characteristics in the model. Du et al. (2020) finds that the loan size is negatively associated
with the loan payoff likelihood and the repayment rate. We control the amount of loan principal
in thousands of Chinese Yuan (Amount), which is converted to the logarithm value in
regressions. We expect delinquent borrowers to be less likely to make repayments when they
have higher debt levels. We also control for the interest rate of loan on an annual basis (Rate),
as Iyer et al. (2016) has documented that the interest rates of loans are correlated with borrowers’
credit scores, both predicting loan performance in terms of default and repayment.
Second, we control for the borrower’s personal characteristics, including the age of the
borrower in years (Age), which is converted to the logarithm value in regression analyses, and
the indicator variable for the female borrower (Gender). Duarte, Siegel, and Young (2012)
documents that lenders take borrowers’ demographics, such as age and gender, into
consideration, and charge low rates for old and female borrowers. Lusardi and Mitchell (2014)
documents the gender differences in financial literacy around the world, which could lead to
different repayment behaviors between female and male borrowers in our analyses.
Third, we control for the borrower’s creditworthiness metrics (Iyer et al. 2016; Berg et al.
2020), such as the credit risk score provided by Tencent, with a high value suggesting a high-
risk profile (Score), the balance of a borrower’s Alipay account from Alibaba in Chinese Yuan
(Wealth), and the number of a borrower’s loan applications rejected by other online lending
platforms (History). These credit quality proxies are converted to logarithm values in our
regressions. We expect borrowers with higher credit scores to be more likely to make loan
repayments. See Appendix A for detailed variable definitions.
3.3. Descriptive statistics
Table 1 presents the summary statistics of the main variables used in our analyses. We find that
the average likelihood of loan delinquency, Delinquency, is 42.7% in a sample of 97,783 loans
(41,711/97,783), and that of loan approval is 41.3% in a sample of 236,967 loan application
(97,783/236,967). For 41,711 delinquent borrowers, 61.9% of them make repayments (Paid
[1,6] = 61.9) within a six-day window [1, 6] after the first round of chasing calls. The average
likelihood increases to 75.2% and 84.7% in an 18-day window [1, 18] and a 93-day window
[1, 93], respectively.
The average ratio of repayment to total debt outstanding, Repayment Ratio, is 1.07, and the
average recovery likelihood, Repayment Complete, is 73.8%, which is lower than the repayment
likelihood in the window [1, 93]. This suggests that not all the repayments fully recover the

14
outstanding loan amount. Indeed, in untabulated statistics, we find that among all the
delinquent loans, 73.8% of borrowers make payments equal to or above the outstanding loan
amount, accounting for 123.6% of the amount outstanding,12 while 12.0% of borrowers make
underpayments equal to 29.0% of the outstanding loan amount. The remaining 14.2% of
borrowers make no payments.
Turning to the digital collateral metrics, 65.1% of delinquent borrowers have the
information of frequent mobile contacts (Contact = 1), and the counterpart group includes 34.9%
of borrowers with no contact that makes more than ten phone calls (Contact = 0), lending to a
fairly large variation in the sample. For a typical borrower, the mean value of Contact Number is
7.49, and the median and upper quartile values are 3.00 and 9.00, respectively, suggesting a
right-tailed skewness distribution. With regard to the physical address, the lender can find this
information from digital footprints for 76.5% of delinquent borrowers (Address = 1). The mean
and median values of Address Number are 1.06 and 1.00, respectively.
The average principal amount of personal loans in our sample is 3,966 Chinese Yuan,
which is equivalent to about 567 U.S. dollars. This amount can be economically significant to
an average borrower in China, considering the comment by the Premier of China, Keqiang Li,
at the close of China’s Two Sessions Congressional Meeting on May 28, 2020. That is, “600
million people have monthly incomes of just 1,000 Yuan” (around 143 U.S dollars), who are
likely to borrow cash to complement their low incomes through fast and small lending contracts,
typically with no collateral. The annual nominal interest rate is 29.5%, substantially higher than
the prime loan rate at 4.3% between 2017 and 2019, but lower than the cut-off rate for the
usurious loan equal to 36.0% as per statute in China.13
The average age of borrowers in our sample is 27.1, with the top quartile equal to 31 and
the bottom quartile equal to 21, representing a group of young borrowers who are generally
familiar with the use of online services, and likely to leave their digital footprints through the
use of electronic devices. Only about 18.2% of delinquent borrowers are female. Compared to
the untabulated 19.2% of females in the full sample, this suggests that male borrowers are more
likely to experience loan delinquency. On average, a typical borrower has the credit score at
12 There is a likelihood of overpayment because the fintech lender charges delay-repayment penalties on delinquent borrowers. 13 There are two cut-off rates for the usurious loans in China, 24% and 36%. For example, when a borrower enters a loan contract with an annual interest rate equal to 30%, the interest proportion below 24% needs to be paid by the borrower, but the proportion between 24% and 30% will not be protected by the law. However, if the borrower has paid the interest between 24% and 30%, she cannot require the lender to return the interest payment. In another example, if a borrower enters a loan contract with an annual interest rate equal to 40% and has paid the interest, she has a right to ask the lender to return the interest proportion between 36% and 40%, and this request will be supported by the court.

15
Tencent equal to 56.8, and personal wealth in the Alipay’s account amounting to 4.22 Chinese
Yuan, who has been rejected by other online lending platforms 0.12 times.
[Insert Table 1 Here]
4. Main results
We employ a difference-in-differences approach by matching borrowers with digital collateral
(treatment group) to those with no collateral (control group). We conduct the tests based on the
two matched samples: one for borrowers with or without the frequent contact information, and
the other for borrowers with or without the physical address information.
4.1. Matched samples
We use the propensity score matching strategy to construct our matched samples on a one-to-
one basis without replacement. The PSM approach accounts for both loan characteristics
(Amount and Rate) and borrower characteristics (Age, Gender, Score, Wealth, and History),
which may influence the debt collection process. Given that there are more delinquent
borrowers with digital collateral than those with no collateral (e.g., the mean of Contact =
65.1%), it is likely that a borrower in the treatment group would have no match in the control
group when the distance of her propensity score to any control borrower is not the least
compared to all other treatment borrowers.14
This approach provides us with two matched samples. One sample consists of 14,768
delinquent borrowers having frequent mobile contacts in their social networks as the treatment
group, together with the same number of borrowers with no frequent contact information as
the control group. Another sample includes 9,994 delinquent borrowers with delivery addresses
for online shopping as the treatment group and those without the address information as the
control group.
Table 2 presents the results of a comparison of loan and borrower characteristics between
the treatment and control groups. In Panel A, we focus on a treatment group of 14,768
borrowers with frequent contact information and find no statistical difference in loan and
borrower characteristics between the two groups. This finding validates that our PSM process
is well executed.
In Panel B, we find similar results for a treatment group of 9,994 borrowers with physical
14 We find similar results when we perform the PSM strategy on a one-to-one basis with replacement, resulting in matched samples in which each treatment borrower can be matched to a borrower in the control group, while a control borrower can be re-used matching to multiple borrowers in the treatment group.

16
addresses, except that the borrowers in the treatment group encounter higher interest rates (Rate)
and have lower balances in their online payment accounts (Wealth) than the borrowers in the
control group. Although the significant differences in Rate and Wealth between the two groups
may suggest some imperfection of our matching process, the direction of such differences is
actually biased against our main analyses. That is, we conjecture that the borrowers with digital
collateral in the treatment group are more likely to make loan repayments, while the higher
interest rates and lower wealth balances, on the contrary, may make it more difficult for
borrowers to repay the outstanding loans.
[Insert Table 2 Here]
4.2. Univariate analyses
We conduct the univariate analyses in Table 3 along the timeline of loan delinquency. In Panel
A, we find that the likelihood of repayment is 11.7% in a three-day window [1, 3] after the
delinquency for the treatment borrowers with frequent mobile contacts (Contact=1) in a sample
of 44,304 borrower-day observations for 14,768 delinquent borrowers. The likelihood is 11.8%
for the control borrowers with no frequent contact information (Contact=0). It is noteworthy
that the pre-event difference between the two groups is insignificant.
After the fintech lender makes chasing calls on Day 4, the borrowers in the treatment group
have a significantly higher repayment likelihood (9.5%) in the window [4, 6] than the
borrowers in the control group (7.8%). This is because the lender tells the treatment borrowers
and their frequent contacts that debt delinquency may cause a negative impact on borrowers’
nationwide credit scores, but only warns the control borrowers themselves given the
unavailability of frequent contacts. The difference in the likelihood between the two groups is
equal to 1.7% and statistically significant at the one percent level. Economically, moving from
the control group to the treatment group, there will be a 21.5% (1.7%/7.8%) increase in the
repayment rate in the post-call period.
[Insert Table 3 Here]
Our findings are similar around the second wave of chasing calls on Day 16 for 4,412
borrowers who remain delinquent on Day 13.15 Specifically, the lender will warn the borrowers
15 We focus on the first and second phone calls on Day 4 and Day 16 in our main analyses because, after the first two calls, a majority of delinquent borrowers in the treatment group have made the repayments (69.6% and 66.8% for those with contact and address information, respectively). In additional tests, we find results hold for subsequent calls.

17
in the treatment group (Contact=1) and their frequent contacts again, as opposed to the control
group in which only borrowers will be called. The results again show that in a three-day
window [13, 15] prior to the phone call, there is no significant difference in the repayment
likelihood between the treatment and control groups. However, in the post-call window [16,18],
borrowers in the treatment group have a significantly higher repayment rate (3.7%) than those
in the control group (2.5%), with the difference equal to 1.2% and significant at the one percent
level. This finding is also economically significant. Compared to the control group, there is a
46.0% (1.2%/2.5%) increase in the repayment rate for the treatment group.
The DID results suggest that the differences between the pre- and post-windows are also
significant for the two groups of borrowers. For example, we find that although in the post-
window [4, 6] there are reductions in the repayment rates for both groups, the decrease in the
repayment likelihood is lower for the borrowers with the frequent contact information (−2.2%,
Contact=1) than the borrowers without such information (−4.0%, Contact=0). The difference
in differences is 1.8% and significant at the one percent level (t-statistic=6.21). We find similar
results for the second wave of chasing calls on Day 16 (DID=1.0%, and t-statistic=3.72).
Moreover, these results also hold in Panel B for 9,994 borrowers in the treatment group
with physical addresses for the first round of chasing calls on Day 4. The difference in the
repayment rate between borrowers with physical addresses (Address=1) and those with no
address (Address=0) is only -0.2% and insignificant in the pre-call window [1, 3], while this
difference is 1.6% in the post-call window [4, 6] and significantly positive at the one percent
level. The difference in the pre-post difference between the two groups is 1.8%, significant at
the one percent level (t-statistic=5.38). This is because the lender will tell the treatment
borrowers that the lender’s staffs would come to their places for debt collection, report the
delinquency to their neighborhood committees, and possibly take further legal action to enforce
loan repayments at the borrowers’ physical address. It is also likely that these borrowers will
face more pressure due to reduced psychological distance and heightened threatening stimulus,
with their addresses known by the lender. However, the lender will only warn the borrowers in
the control group of the potential damages to their credit scores. In addition, we examine the
second wave of chasing calls, when the lender will call the borrowers in the treatment group
(Address=1) with physical addresses again on Day 16. We find similar results for 3,459
borrowers who remain delinquent until Day 13 (DID=0.9%, and t-statistic=3.20).
Lastly, we illustrate these prepayment likelihood patterns in Figures 5 and 6. The figures
show that there are larger increases in repayments over periods after the fintech lender makes
the chasing calls to the borrowers backed by digital collateral than those with no digital

18
collateral.
[Insert Figures 5 and 6 Here]
4.3. Main findings
In this subsection, we examine the effect of digital collateral on debt collection using the
multivariate regression analysis. We specify our main DID analysis within a six-day window
[s-3, s+2] in the following linear probability model, with Day s indicating the date for the
lender to make chasing calls:
Paid t = α + βCD×DC Chasing Day s×Digital Collateral Proxy
+ βCD×Control Chasing Day s×Control Variables + βFE Fixed Effects + ε, (1)
where Paid t indicates if the repayment is made by a borrower on Day t, and Chasing Day s is
equal to one if Day t is in the three-day window [s, s+2], and zero if Day t is in the window [s-
3, s-1].16 Digital Collateral Proxy denotes the metrics of digital collateral constructed based on
digital footprints, i.e., Contact and Address, constructed for each borrower. We interact
Chasing Day s with the Digital Collateral Proxy to capture the DID effect of Digital Collateral
between the pre- and post-chasing call periods. We expect the coefficient of the interaction
term to be significantly positive when digital collateral facilitates debt collection.
Control Variables denotes a vector of control variables of loan and borrower
characteristics, as described in Subsection 2.2, which are interacted with Chasing Day s to
account for the effects of chasing calls that may moderate the impact of control variables on
the repayment likelihood. We also include Fixed Effects, the borrower and day fixed effects,
to control for cross-sectional and time series omitted factors and cluster standard errors at the
borrower level.17
We perform the DID tests based on Equation (1) for the first two rounds of chasing calls.
Around the first chasing call on Day 4, for the 14,768 borrowers with in the treatment group
with frequent mobile contacts, the matched sample in the DID analyses consists of 177,216
borrower-day observations for both the treatment and control groups in the six-day window
(14,768×2×6). Appendix B provides a detailed sample selection process regarding the analysis
16 We employ the linear probability model throughout the paper for the analyses using indicators as dependent variables, to accommodate the inclusion of fixed effects (Berg et al. 2020). 17 In this DID specification, we do not control for the main effect of Chasing Day s, because this effect has been absorbed by the day fixed effects. We also do not control for the main effects of the control variables, because the interaction terms have absorbed them. We find similar results when we drop the interaction terms and only control for the main effects of the control variables.

19
for frequent mobile contacts. For the 9,994 treatment borrowers with the information of
physical addresses, the matched sample includes 119,928 borrower-day observations
(9,994×2×6). Similarly, we examine the second round of chasing calls on Day 16 for the
remaining 4,412 and 3,459 borrowers in the treatment group with contact and address
information who have not made repayments until Day 13. The two samples for the second
chasing call tests consist of 52,944 (4,412×2×6) and 41,508 borrower-day observations
(3,459×2×6), respectively.
The results in Table 4 suggest that digital collateral is useful for the fintech lender in the
debt collection process. For example, in Model 1, we find that delinquent borrowers with
frequent contact information have a significantly larger increase in the repayment likelihood,
from the pre-call window [1, 3] to the post-call window [4, 6], than those with no frequent
contact information. The coefficient on Chasing Day 4×Contact is 1.76, and significant at the
one percent level, which accounts for an increase of 16.6% relative to the average daily
repayment likelihood in the window [1, 6]. We find similar results when we examine Address.
For example, in Model 2, the coefficient on Chasing Day 4×Address is 1.79 and significant at
the one percent level (t-statistic=5.00), accounting for an increase of 18.5% relative to the
sample mean of daily repayment likelihood.
Regarding the control variables, in Model 1, we find that chasing calls have a significantly
positive impact on relatively old borrowers (coefficient on Chasing Day 4×Age=5.71 and t-
statistic=10.21) and borrowers with high credit risk profiles (coefficient on Chasing Day
4×Score=3.35 and t-statistic=6.50). This suggests that older and riskier borrowers are more
concerned about the possible detrimental impact on their credit scores if they do not make loan
repayments. In contrast, chasing calls have a significant and negative reciprocal effect on loan
repayment for loans with large amounts (coefficient on Chasing Day 4×Amount=-1.92 and t-
statistic=-4.62) and for loans with high interest rates (coefficient on Chasing Day 4×Rate=-12.74
and t-statistic=-6.98), and also for female borrowers who could be more annoyed by chasing
calls and thereby may be less motivated to repay the delinquent loans (coefficient on Chasing
Day 4×Gender=-2.29 and t-statistic=-5.72).
Further evidence shows that the inferences hold when we investigate the effect of digital
collateral for the second chasing call on Day 16. For instance, in Models 3 and 4, the
coefficients on Chasing Day 16×Contact and Chasing Day 16×Address are 1.03 and 0.90 and both
significant at the one percent level (t-statistics=3.67 and 3.04). However, these coefficients are
smaller in magnitude than those in Models 1 and 2 with z-statistics of differences in coefficients
equal to 1.76 and 1.93, respectively. Intuitively, this finding suggests that borrowers who

20
remain delinquent after the first round of chasing calls are less responsive to further calls,
because they are less concerned about the potential loss of their social capital and/or about
being chased by debt collectors through their physical locations.
Taken together, the results in Table 4 provide support for the use of digital collateral in
debt collection.
[Insert Table 4 Here]
4.4. Placebo tests
One potential concern regarding our main findings is that the DID analysis results are either
explained by a time trend effect around the chasing calls, which coincides with the presence of
digital collateral, or driven largely by chance. In this subsection, we employ two placebo tests
to alleviate this concern.
First, we re-run the DID analysis for a six-day window [-2, 3] by considering Day 1 as the
placebo date for chasing calls. If our previously documented results for chasing calls made on
Day 4 are driven by a time trend effect, we should observe a similar effect for digital collateral
in this placebo test. That is, borrowers with the information about frequent contacts or physical
addresses would have an increase in repayment likelihood from window [-2, 0] to window [1,
3] compared to those without such information.
The results are reported in Panel A of Table 5. We find that the coefficient on Chasing
Day 1×Contact is -0.074 and insignificant (t-statistics=-0.40) in Model 1. This suggests that
before receiving chasing calls, delinquent borrowers with key contact information in digital
footprints are indifferent from those without this information in terms of loan repayment. We
find similar results in Model 2 for borrowers in the treatment group with physical address
information (coefficient on Chasing Day 1×Address=-0.266 and t-statistic =-1.22). Therefore,
we find supportive evidence mitigating the concern about a time trend effect around the chasing
calls for the change in repayment likelihood from the window [-2, 0] to window [1, 3].
[Insert Table 5 Here]
Second, following the approach of Leary and Roberts (2014), we conduct simulations by
running placebo tests based on pseudo borrowers with digital collateral. Specifically, we begin
with the matched samples of delinquent borrowers based on Day 4, consisting of 177,216
(119,928) borrower-day observations for borrowers in the treatment group with key contact
(physical location) information. Next, we randomly assign half of the sample borrowers as the

21
pseudo borrowers with digital collateral and define the new indicator variables equal to one for
these pseudo treatment borrowers, Contact pseudo (Address pseudo). We assign the remaining
borrowers to the pseudo control groups with Contact pseudo (Address pseudo) denoted by zero.
We generate 1,000 randomly assigned samples for pseudo borrowers and then repeat the
DID analyses based on the chasing calls made on Day 4. Panel B of Table 5 presents the means
and distribution percentiles of the coefficients on Chasing Day 4×Contact Pseudo and Chasing Day
4×Address Pseudo based on the 1,000 reiterations of the regression. If our baseline findings are
largely driven by chance, we may find the coefficients on digital collateral in our main results
close to the mean and median values of coefficients in these placebo tests.
In contrast, we find that the mean and median values of the Chasing Day 4×Contact Pseudo
(Chasing Day 4×Address Pseudo) coefficients are 0.004 and -0.005 (-0.017 and -0.011) and
insignificant with t-statistics of 0.013 and -0.017 (-0.048 and -0.030), respectively. These
statistics are much smaller than the coefficients on Chasing Day 4×Contact and Chasing Day
4×Address reported in Table 4 (1.759 and 1.794), implying that our main findings are not driven
by chance.
Collectively, the findings in this subsection suggest that neither the time trend effect nor
the by-chance explanation can be the main force driving our baseline findings, and therefore
strengthen the inferences associated with the digital collateral effect in our main analyses.
4.5. Additional tests
In this subsection, we perform the additional tests concerning the amount of digital collateral,
the sequence of chasing calls, and the separation of the two types of digital footprints.
4.5.1. Amount of digital collateral
First, we investigate whether the variation in the amount of digital information impacts debt
collection. On the one hand, more relevant information from digital footprints may allow the
lender to reach a larger group of a borrower’s frequent contacts, and to discover her physical
addresses more completely. On the other hand, given the lender’s time and resource constraints
faced the lender’s staffs, a large amount of digital information may lead to information overload,
limited attention, and inferior outcomes (e.g., Abdel-Khalik 1973; Hirshleifer and Teoh 2003;
Campbell, Loumioti, and Wittenberg-Moerman 2019). Therefore, we expect that although a
greater amount of digital information effectively facilitates debt enforcement, such
effectiveness per se may decline with the information amount.
In Models 1 and 2 of Table 6, we employ the numbers of a borrower’s frequent contacts

22
and physical addresses (i.e., Contact Number and Address Number) as the main independent
variables of interest, and re-conduct our DID analyses for the first round of chasing calls around
Day 4. Consistent with our main results, we find that both Contact Number and Address Number
have positive impacts on the likelihood of loan repayment through chasing calls. The
coefficients on Chasing Day 4×Contact Number and Chasing Day 4×Address Number are 0.51 and 1.84,
respectively, and both are significant at the one percent level (t-statistics=3.93 and 4.43). These
findings indicate an average positive effect of the digital footprint amount on loan repayment.
Also, as discussed in Section 2, we decompose Contact Number and Address Number into
subcomponents, i.e., Contact 1≤Number≤7, Contact Number>7, Address Number=1, and Address Number>1,
based on the sample medians to examine the potential information overload effect (Abdel-
Khalik 1973; Campbell, Loumioti, and Wittenberg-Moerman 2019). In Model 3, we find that
the coefficients on Chasing Day 4×Contact 1≤Number≤7 and Chasing Day 4×Contact Number>7 are 2.13
and 1.31 and both are significant at the one percent level (t-statistics=5.96 and 3.30). The
difference between the two coefficients is significant at the ten percent level (z-statistic=1.83).
One possible explanation is that for a borrower with many frequent contacts, the lender’s
staff facing time and resource constraints may resort to simplified information processing and
heuristics, and thus overlook or underweight relevant information (Hirshleifer and Teoh 2003).
For example, the staffs may choose some contacts to make chasing calls rather than reaching
out all contacts. However, for such a borrower with lots of contacts, these selected contacts
may be less critical, compared to those for a borrower with a small number of key contacts.
In Model 4, we find a larger coefficient on Chasing Day 4×Address Number=1
(coefficient=1.85, t-statistic=4.74) relative to the coefficient on Chasing Day 4×Address Number>1
(coefficient=1.65, t-statistic=2.89), although the difference between the coefficients is
statistically insignificant.
In sum, these results suggest that on average the likelihood of loan repayment increases
with the amount of digital collateral, although the increase may not be linear. When there are
a large number of digital footprints, the lender may spend more time identifying the key
information, which could reduce the effectiveness of the digital collateral.
[Insert Table 6 Here]
4.5.2. Sequence of chasing calls
We focus on the first two chasing calls made on Day 4 and Day 16 in the main analyses. In this
subsection, we first investigate the overall effect of digital collateral on the repayment rate

23
along the whole collection timeline before the lender hands over delinquent loans to external
collection agencies. After that, we conduct the analyses to compare the effect of digital
collateral in the first two rounds of chasing calls (Day 4 and Day 16) with the effect in the next
three rounds of chasing calls (Day 31, Day 61, and Day 91), as illustrated in Figure 2.
We start by performing the DID tests using the five six-day windows for all chasing calls.
We construct an indicator variable, Chasing All, equal to one for days in windows [4, 6], [16,
18], [31, 33], [61, 63], and [91, 93], and zero otherwise. The number of borrowers in the
treatment group with frequent contact information who remain delinquent in the three days
before each chasing call (i.e., on Day 1, Day 13, Day 28, Day 58, and Day 88), is 14,768, 4,412,
3,346, 2,638, and 2,388 for calls on Day 4, Day 16, Day 31, Day 61, and Day 91, respectively.
Therefore, the sample testing the frequent contact information for all chasing calls includes
330,624 borrower-day observations.18 For borrowers in the treatment group with physical
location information, the sample consists of 241,812 observations, because the number of
treatment borrowers varies across the five calling days and is equal to 9,994, 3,459, 2,696,
2,102, and 1,900, respectively.19
Table 7 presents the results. In Models 1 and 2, we find that digital collateral has an overall
effect on facilitating the debt collection process in all the five windows. For example, in Model
1, we find that in general, the borrowers with frequent contact information are more likely to
repay debt after chasing calls than those with no contact information. The coefficient on
Chasing All×Contact is 1.17, significant at the one percent level (t-statistic = 6.68).
Next, we decompose Chasing All into Chasing Day 4,16 and Chasing Day 31,61,91 to differentiate
the first two rounds of chasing calls from the last three chasing calls. The psychology literature
suggests that repeated notifications may result in a boredom effect, making people feel irritated,
bothered, or bored (Bornstein 1989; Bornstein, Kale, and Cornell 1990). Accordingly, we
expect the effect of Chasing Day 31,61,91 to be smaller than that of Chasing Day 4,16. In Models 3
and 4, we find positive and significant coefficients on both interaction terms. For instance, in
Model 3, the coefficients on Chasing Day 4,16×Contact and Chasing Day 31,61,91×Contact are 1.40
and 0.63, respectively, significant at the one percent level (t-statistics=6.46 and 4.89).
Consistent with our expectation, the differences in these coefficients are statistically significant
(z-statistics of difference=3.11 and 2.04) in Models 3 and 4.
These findings suggest that although chasing calls using digital information in the last
18 The sample for treatment borrowers with contact information consists of (14,768+4,412+3,346+2,638 +2,388)×2×6 = 330,624 borrower-day observations. 19 Accordingly, the sample size is equal to (9,994 +3,459 +2,696 +2,102 +1,900) ×2×6 =241,812.

24
three rounds are still effective in enforcing debt collection, the magnitude of the effect declines,
consistent with our results in Table 4 for a comparison between chasing calls on Day 4 and
Day 16. A potential explanation is that delinquent borrowers, who have been warned but fail
to make repayments after the first two calls, are less concerned about their digital collateral
(Bornstein 1989; Bornstein, Kale, and Cornell 1990). As a result, these remaining delinquent
borrowers are less responsive to further calls.
[Insert Table 7 Here]
4.5.3. Separation of the two types of digital footprints
In the main analyses, we treat the two types of digital footprints separately. However, for some
delinquent borrowers, the lender can obtain both the frequent contact and physical address
information from the third-party data providers. Therefore, it is plausible that our main findings
are driven mainly by one type of digital footprint. To address this concern, we conduct
additional tests to differentiate the effects of the two types of digital footprints.
Specifically, we start with 14,768 borrowers in the treatment group with key contact
information in the matched sample based on Contact. We then focus on those with only
frequent contact information, which provides us with a subsample of 2,914 borrowers. The
matched sample includes 34,968 borrower-day observations (2,914×2×6). We define Contact
Only as an indicator variable equal to one if a borrower has at least one frequent contact but has
no information about online shopping delivery address, and zero otherwise. In Model 1 of
Table 8, we re-run the DID analyses with these contact-only borrowers. We find that the
coefficient on Chasing Day 4×Contact Only remains positive and significant (coefficient=2.57 and
t-statistic=3.63).
In Model 2, we follow a similar sample selection approach to construct a subsample of
3,024 address-only borrowers from the matched sample with 9,994 borrowers in the treatment
group based on Address. We obtain a matched sample with 36,288 borrower-day observations
(3,024×2×6). We define Address Only in a similar manner as an indicator variable equal to one
if a borrower has at least one online shopping delivery address but has no information about
frequent contact. We find that the coefficient on Chasing Day 4×Address Only is also positive and
significant (coefficient on Chasing Day 4×Address Number=1.40 and t-statistic=2.19).
In Model 3, we investigate a sample with 15,334 borrowers in the treatment group who
have both frequent contact and physical address information. To construct this sample, we first
obtain 11,854 borrowers with both types of digital information from the Contact-based
25
matched sample, and then complement it with 3,480 borrowers from the Address-based sample
but not included in the Contact-based sample. The sample in Model 3 includes 184,008
borrower-day observations (15,334×2×6). We construct Collateral Both as an indicator variable
equal to one if a borrower has at least one frequent contact and at least one online shopping
delivery address, and zero otherwise. The coefficient on Chasing Day 4 × Collateral Both is 1.44
and significant (t-statistic=4.42).
Finally, in Model 4, we include Chasing Day 4×Contact Only, Chasing Day 4×Address Only, and
Chasing Day 4 × Collateral Both in the same model based on an aggregated sample. The sample
includes 255,264 borrower-day observations used in Models 1 to 3 (34,968+36,288+184,008).
We find positive and significant coefficients for all the interaction terms for Contact Only,
Address Only, and Collateral Both (coefficients=1.93, 2.37, and 1.39, and t-statistics=4.04, 5.26,
and 4.27, respectively).
These findings collectively suggest that both types of digital footprints play significant
roles in facilitating debt collection, and thus mitigate the potential concern regarding the
contamination effect between the social capital channel and physical location channel.
[Insert Table 8 Here]
5. Additional tests
In this section, we first perform cross-sectional tests for the economic channels of social capital
and physical location. Then, we conduct the analyses for other outcome variables along the
loan process, including the repayment amount, the likelihood of loan delinquency, and the
decision of loan approval.
5.1. Cross-sectional analyses of social capital channel
We conjecture that the digital collateral effect on debt collection operates through the social
capital and physical location channels. In this subsection, we conduct the cross-sectional
analyses to validate the economic mechanism in relation to borrower’s social capital.
We employ the 2017 China Household Finance Survey (CHFS) data to test the social
capital channel. Since 2011, this survey has been conducted biannually by the Survey and
Research Center for China Household Finance (Clark, Yi, and Huang 2019; Lugauer, Ni, and
Yin 2019). The 2017 survey questions in relation to social capital were designed to ask
participants about their social behavior in 2016, one year prior to our sample period from July

26
2017 to November 2019. 20 We construct two social capital metrics, Social Spending and
Veneration Ancestor, based on the 2017 CHFS data.
First, we estimate Social Spending as the average amount of annual social spending by a
household scaled by the average annual household income at the province-year level. This is
because gift-giving is considered to be an important mechanism of social exchange in China to
establish and maintain personal social networks (Hwang 1987; Yang 1994). Social spending
by a household is measured as the value of cash and non-cash gifts given to and received from
family members and friends, for festivals like Lunar New Year and personal social events, such
as a birthday.
Second, we construct Veneration Ancestor to be the average percentage of households
attending veneration events of honoring ancestors at the province-year level. Ancestor
veneration and worship can stress social unity and are associated with familism, the basis of
Chinese religious conception (Lakos 2010). In Chinese society, the family is deemed the most
important social group of an individual (Hwang 1987).
We match the province information in the CHFS data to the address information indicated
in a borrower’s national identity card. We choose to use the address information in the national
identity card, not the delivery address information in digital collateral, for three reasons. First,
the social capital effect that we examine operates through a borrower’s social network, which
connects to her family members and friends mostly built in her hometown, as reflected in the
national identity card. Second, the culture and social norm in a borrower’s hometown help form
her social awareness and therefore shape her behavior, potentially influencing her future
decision making in the lending process. Third, our results in this analysis on the social capital
channel would be less subject to the physical location channel because we perform the tests in
a large sample, rather than in a restricted sample that requires the existence of borrowers’
physical locations in digital footprints.
We then split our matched sample for Contact by the sample medians of Social Spending and
Veneration Ancestor and re-run our regression analysis as in Model 1 of Table 4.21 We expect the
digital collateral effect based on key contact information to be more pronounced for borrowers
from hometowns with higher Social Spending and more frequent Veneration Ancestor. This is
because borrowers from hometowns, where people are more incentivized to maintain social
20 For example, one relevant question in the 2017 survey is: “In the last year (2016), what is the value of cash and non-cash gifts that you receive from family members and friends for festivals like Lunar New Year and Mid-Autumn Festival?” 21 We split the sample based on the values of Social Spending and Veneration Ancestor for the treatment borrowers, and the borrowers in control group are assigned to subsamples aligned with their matched treatment borrowers.

27
networks and believe in familism (Yang 1994; Lakos 2010), and can be more concerned about
the potential impairment on their social capital and thus are more likely to make repayments
when the lender communicates with their frequent contacts.
The results are reported in Panel A of Table 9. Consistent with our prior, we find that the
coefficients on Chasing Day 4×Contact are larger in the subsamples characterized as high Social
Spending and Veneration Ancestor (in Models 1 and 3, coefficients=2.41 and 2.37 and t-
statistics=5.78 and 5.97, respectively), compared to borrowers from provinces with the low
values of Social Spending and Veneration Ancestor (in Models 2 and 4, coefficients=1.16 and 1.51
and t-statistics=2.66 and 2.26). The differences are statistically significant for both Social
Spending and Veneration Ancestor (z-statistics of differences=2.07 and 2.14).22
Taken together, these results are consistent with our conjecture on the social capital
channel. That is, when the potential loss of a borrower’s social capital is more substantial, the
borrower would be more motivated to repay the loan (Karlan et al. 2009). The results are also
generally aligned with the literature on corporate decisions and outcomes, which documents a
positive role of social capital regarding, for example, debt contracting (Hasan, Hoi, and Zhang
2017), management compensation (Hoi, Wu, and Zhang 2019), and corporate innovation
(Gupta, Raman, and Shang 2020).
[Insert Table 9 Here]
5.2. Cross-sectional analyses of physical location channel
In this subsection, we perform the cross-sectional analyses to validate the physical location
channel, based on two metrics related to borrowers’ physical addresses identified in digital
footprints.
We first estimate the geographical distance between the city of a borrower’s physical
location, as indicated in her digital footprints, and Shanghai, where the fintech lending
company is headquartered. The majority of the fintech lender’s staffs are employed in the head
office of Shanghai, taking responsibility for the company’s main business activities such as the
implementation of the debt collection process. We denote this distance as Distance FinTech. For
a borrower with multiple physical locations, the most frequently used online shopping delivery
address will be chosen to estimate the distance. When there are multiple addresses deemed the
most frequent, the most recently used address will be selected.
22 The sum of the subsamples can be slightly smaller than that in our main analysis, because not all of the provinces in our main sample are surveyed in the CHFS data.

28
The extant lending literature suggests that greater geographical distance can make it more
difficult for lenders to renegotiate with borrowers and recover funds (Mian 2006). Also, lenders
tend to reduce lending to long-distance borrowers during the financial crisis (De Haas and Van
Horen 2013), and demand collateral and grant loans of short maturity (Beck, Ioannidou, and
Schäfer 2018). Therefore, we expect that it would be more likely for the lender to recover
delinquent loan when a borrower is geographically closer. Furthermore, a close-by borrower
may psychologically face more threatening pressure from the lender (McGraw et al. 2012).
This leads to a weaker digital collateral effect through the physical location channel, because
a nearby borrower can be concerned about being chased by the lender, regardless of whether
her physical location is mentioned or not in the chasing calls. In contrast, for a remote borrower,
having identified physical address will substantially increase her concern about being
physically located by the debt collector and induce pressure due to the reduced psychological
distance between the lender and borrower and the heightened threatening stimulus (Williams,
Stein, and Galguera 2014; Boothby et al. 2016).
Next, we again exploit the CHFS data to construct a confidence measure of law
enforcement. The relevant question asked in the 2017 CHFS survey is: “Could you please give
your satisfaction rating for the enforcement by the local police office and local court system?”
We adopt the average satisfaction rating by households at the province-year level, Litigation
Confidence, and match it to a borrower’s physical location in digital footprints. The rating varies
between one and five, with a higher value indicating more satisfaction. In alignment with the
physical location channel, we expect the digital collateral effect to be stronger when the local
police and court systems are perceived as more satisfactory in terms of law enforcement
(Djankov et al. 2008). This is because delinquent borrowers believe that the lender will use the
information of their physical location to pursue judicial enforcements, leading to judgment
liens on the borrowers’ assets.
The results are presented in Panel B of Table 9. Consistent with the physical location
channel, we find a stronger digital collateral effect for borrowers in subsamples with long
Distance FinTech and high Litigation Confidence (in Models 1 and 3, coefficients=2.56 and 2.55 and
t-statistics=5.41 and 5.16, respectively) than their counterparties (in Models 2 and 4,
coefficients=0.88 and 1.19 and t-statistics=1.71 and 2.43). The differences are statistically
significant, with z-statistics of 2.39 and 1.97 for Distance FinTech and Litigation Confidence,
respectively.
Overall, these findings corroborate our main results in Table 4 and provide further support
for the physical location channel. We document the scenarios under which delinquent

29
borrowers will face pressure and are incentivized to make loan repayments.
5.3. Repayment amount for delinquent loans
To this end, we mainly focus on the probability of repayment for delinquent loans. In this
subsection, we will investigate the impact of digital collateral on the amount of debt recovery.
This analysis can provide important payoff implications for the lender (Karlan and Zinman
2010). When a delinquent borrower makes the loan repayment, she may underpay the overdue
amount because of a shortfall of cash or make payments over the original amount for the
overdue penalty. Therefore, from the lender’s perspective, the expected payoff for an average
delinquent loan is a function of the likelihood of repayment, and the perceived amount of
contingent repayment.
We construct two measures for debt recovery, Repayment Ratio, and Repayment Complete. The
former is the ratio of the amount of repayment for the delinquent loan divided by the payment
amount due, and the latter is the indicator variable equal to one if a borrower makes the
repayment equal to or greater than the delinquent amount. The analyses are performed in the
following model for a sample of 41,711 delinquent borrowers:
Repayment Ratio / Repayment Complete = α + βDC Digital Collateral Proxy
+ βControl Control Variables + βFE Fixed Effects + ε, (2)
where Digital Collateral Proxy and Control Variables denote the metrics of digital collateral
and control variables, which have been adopted in Equation (1). Fixed Effects denote the
province and year fixed effects to control for the cross-sectional variations across geographic
areas and the time series variations. The standard errors are clustered at the province level. We
expect to find results consistent with the analyses of the repayment likelihood, i.e., a significant
and positive coefficient on Digital Collateral Proxy, suggesting that the amount of debt
recovery also increases with the availability of digital collateral.
Table 10 presents the results for the tests on the amount of debt recovery. In Models 1 and
2, we find that the coefficients on Contact and Address are 2.37 and 6.12 for Repayment Ratio
and significant at the one percent level (t-statistics=5.50 and 7.19). Regarding our control
variables, we find the intuitive results confirming that borrowers with higher risk profiles make
the lower amounts of repayments, and borrowers with larger balances in online payment
accounts pay off more outstanding debts. For example, in Model 1, the coefficients on Score
and Wealth are -9.81 and 1.01 and significant at the one percent level (t-statistics=-12.00 and
10.25), respectively.

30
Furthermore, we focus on the completion of repayment, Repayment Complete, in Models 3
and 4. The results show that borrowers with frequent contact information and physical address
information are more likely to fully pay off the overdue amounts. The coefficients on Contact
and Address are 1.22 and 5.21, respectively, both significant at one percent level (t-
statistics=3.49 and 9.67).
These results suggest that the magnitude of debt recovery increases with the availability
of borrowers’ social network and physical location information in digital footprints.
[Insert Table 10 Here]
5.4. Loan delinquency likelihood
Another possible concern regarding our main findings is that digital collateral measures could
also reflect borrowers’ creditworthiness (Iyer et al. 2016). We have largely alleviated such
concern by performing DID analyses and controlling for borrowers’ characteristics, including
the metrics of credit quality, such as Score, Wealth, and History.
Nevertheless, in this subsection, we intend to further mitigate this concern by examining
the association between digital collateral and the likelihood of loan delinquency. The test will
be performed in the model below with a sample including 97,783 loan contracts for both
delinquent and non-delinquent borrowers:
Delinquency = α + βDC Digital Collateral Proxy + βControl Control Variables
+ βFE Fixed Effects + ε, (3)
where Delinquency is an indicator variable equal to one if a borrower fails to make a loan
payment by the due date at least once during the loan term. The control variables and fixed
effects are the same as specified in Equation (2).
If the availability of digital collateral metrics mainly reflects borrowers’ high credit quality,
we would expect a significantly negative association between Delinquency and Digital
Collateral Proxy. However, the results in Table 11 indicate that the incidence of loan
delinquency is even positively associated with the presence of borrowers’ frequent contact
information. That is, in Model 1, we find that the coefficient on Contact is 3.85 and significant
at the one percent level (t-statistic=15.73). Economically, this coefficient accounts for 8.98%
of the average likelihood of the loan delinquency in our sample. We do not find a significant
coefficient on Address in Model 2 (coefficient=-0.848, and t-statistic=-1.65). These findings
suggest that our digital footprint proxies cannot be interpreted as borrowers’ credit quality

31
measures with respect to their delinquency probability.
Regarding our control variables, we find that older and female borrowers are less likely to
be delinquent as older people typically have built up a long-term credit record, and female
borrowers may be less aggressive in making borrowing decisions (e.g., the coefficient on Age=-
8.99 and t-statistic=-7.15, and the coefficient on Gender=-4.10 and t-statistic=-6.89 in Model
1), consistent with prior studies (Duarte, Siegel, and Young 2012; Du et al. 2020). For other
conventional creditworthiness measures, we find that they are negatively associated with the
loan delinquency rate. For instance, the coefficients on Score are significantly positive across
all the models, aligned with the notion that risky borrowers tend to engage in loan delinquency
(e.g., coefficient=11.41, and t-statistic=16.79 in Model 1). Borrowers with less wealth and
more rejections in previous loan applications are also more likely to experience loan
delinquency. For example, in Model 1, the coefficient on Wealth is -1.86 (t-statistic=-27.36),
while that on History is 3.20 (t-statistic=5.15).
Overall, the findings in this subsection mitigate the concern that the digital footprint
information mainly reflects the credit quality of borrowers rather than capturing the effect of
digital collateral.
[Insert Table 11 Here]
5.5. Loan approval decision
We finally examine the effect of digital collateral on the loan approval decisions made by the
fintech lender. Fuster et al. (2019) finds that fintech lenders tend to process loan applications
faster without having higher default rates than traditional lenders. Agarwal et al. (2021) shows
that digital footprints, such as the number of mobile applications and the use of the iOS mobile
operating system, have predictive power for a fintech lender’s loan approval decision in India.
Following the literature, we conduct the analyses in a sample of 236,967 loan applications in
the following model:
Approval = α + βDC Digital Collateral Proxy + βControl Control Variables
+ βFE Fixed Effects + ε, (4)
where Approval is an indicator variable equal to one if a borrower’s loan application is
approved by the fintech lender, and zero otherwise. We include the same control variables and
the province and year fixed effects as in Equation (2).
In Table 12, we present the evidence indicating that the fintech lender is more likely to
approve the loan application from a borrower with digital collateral. We find that the

32
coefficients on Contact and Address are 0.97 and 4.67, respectively, and are significant at the
one percent level (t-statistics=3.17 and 14.42).23 Concerning the economic magnitude, these
results imply that borrowers with frequent mobile contacts (physical address information) have
an increased loan application approval likelihood of 2.21% (11.27%) higher than those with no
digital collateral, compared to the sample mean.
Moreover, we also find that the coefficients on control variables are consistent with prior
studies (e.g., Berg et al. 2020). A borrower with a higher risk profile (Score), less wealth in
online balance (Wealth), and more rejections from other lending platforms (History), is less
likely to be approved by the fintech lender for her loan application. For example, the
coefficients on Score, Wealth, and History are -35.25, 3.22, and -9.26 in Model 1, respectively,
and all significant at one percent level.
In sum, the results show that the lender does consider borrowers’ digital collateral during
the loan application process. This is possibly due to the fact documented in our main findings
that digital collateral can be used in debt collection when borrowers fail to make repayment on
time in the future due date.
[Insert Table 12 Here]
6. Further discussion
In this section, we present further discussions about the practical implications of our study in
terms of the data privacy concerns, the fair debt collection practices, and the fintech impacts
on financial inclusion.
6.1. Data privacy
Recent information technology development has made substantial progress in collecting,
transferring, and using the personal information in digital footprints, leading to public
awareness and policy debate about how to protect individuals’ right to data privacy.
For example, the California Right to Know Act Bill of 2013, which would have given
consumers the right to know how their personal information is used, did not pass after facing
a forceful opposition campaign from technology companies in Silicon Valley (Harmon 2013).
In 2018, the California Consumer Privacy Act was passed by the state legislature. This Act
provides the California residents with the rights to understand and control the use of their
personal data effectively from January 2020 (Hautala 2020). Similarly, in 2016, the European
23 Different from our analyses, Agarwal et al. (2021) does not investigate the digital footprints containing the information of borrowers’ physical addresses and finds insignificant results for the number of contacts.

33
Union passed the General Data Protection Regulation on data privacy protection, which
became effective in May 2018.
Prior economic studies have documented that economic agents can take individuals’
information privacy concerns into consideration (e.g., Abowd and Schmutte 2019; Ali and
Bénabou 2020). In the fintech literature, Tang (2020) quantifies the monetary value of loan
applicants’ personal data. Liao et al. (2020) shows that when a lender makes phone calls to a
delinquent borrower’s contacts, there will be an increased likelihood of ultimate default
because such a collection tactic can infringe on the borrower’s privacy, leading to a negative
reciprocity effect.24
Practically, to maintain legitimacy for the use of digital collateral, the fintech lender in our
study has reached detailed legally binding agreements with the loan applicants in relation to
information privacy. These legal agreements comply with China’s laws and regulations and
are also aligned with the drafted China Personal Information Protection Law (Blackmore and
Yang 2020). For instance, when submitting the loan application, in corresponding legal
documents, an applicant authorizes the lender with the rights of collecting and assessing her
personal information in digital footprints from the third-party data providers, along with credit
score information provided by other financial institutions. The applicant also agrees that the
lender has the right to use such information to chase the loan repayment in case of delinquency.
A successful borrower in our study thus faces a tradeoff between the disclosure of privacy and
the access to cash in marketplace lending (Acquisti, John, and Loewenstein 2013).
To provide further supportive evidence, we conduct additional tests in the Internet
Appendix (IA). We focus on subsamples with the loan repayment due dates after the adoption
of the China Internet Personal Information Security and Protection Guidelines. The guidelines
were issued by the China Ministry of Public Security and became effective on April 10, 2019,
as a measure to protect personal information privacy while the Personal Information Protection
Law was being drafted. In Table IA1, we find that the effect of digital collateral on debt
collection remains the same after the regulations are strengthened to protect individuals’ right
to data privacy.
Taken together, it is likely that the use of digital collateral can be maintained as legitimate,
as long as the collection and use of personal data are in accordance with laws and regulations,
24 One difference between our paper and Liao et al. (2020) is that their lender has limited resources to make phone calls. Thus, the lender strategically chooses some of the borrowers to apply the debt collection tactic on selective dates. In contrast, the lender in our paper applies one collection strategy consistently to all delinquent borrowers by making chasing phone calls on several given days after delinquency, exogenous to loans and borrowers’ characteristics.

34
even in the markets with strong data privacy rules.
6.2. Fair debt collection practices
Another concern for the use of digital collateral is the legitimacy of debt collection practices
(Fedaseyeu 2020). People may cast doubts on whether the Chinese lender’s practices of making
phone calls to borrowers’ contacts can be generalized to the personal lending markets in other
countries.
For example, in the U.S., the Fair Debt Collection Practices Act (FDCPA) was passed by
the Congress in 1977 to “eliminate abusive debt collection practices by debt collectors.” The
debt collection efforts, such as phone calls, letters, and emails, must comply with various laws
and regulations, including FDCPA. In 2019, there were approximately 75,200 debt collection
complaints received by the Consumer Financial Protection Bureau (CFPB 2020). Among those,
some complaints were associated with communication tactics (12 percent), threatening to take
negative or legal action (12 percent), and threatening to share information improperly (3
percent).
Under the FDCPA, when borrowers owe debts, U.S. debt collectors cannot disclose the
information to third parties, such as borrowers’ contacts and employers.25 However, they can
reach borrowers’ contacts and ask questions about these borrowers’ location information (e.g.,
address and phone number), usually no more than once (Hunt 2007). They may contact the
third parties again if they believe that they were given false information previously. The
collectors can even disclose their employers’ names if the contacted parties specifically request
such information (e.g., asking questions like “who do you work for?”). Moreover, the debt
collectors may threaten to take legal actions that they intend to do so, but they are not allowed
to threaten borrowers with illegal actions or actions that they do not intend to take (Hunt 2007;
CFPB 2020).
Using the above communication strategies, debt collectors may expect that reaching
borrowers’ contacts would make borrowers pay off the debts to “prevent further embarrassment”
(Irby 2020). Also, threatening to take intended legal actions (e.g., placing liens on borrowers’
homes) can in some instances effectively facilitate debt collection.
In the Internet Appendix, we further conduct the analyses in the subsamples of 20
provinces in China that had implemented the province-level rules to regulate fintech lenders’
25 Our discussion in this subsection mainly refers to the debt collection practices by lenders. For studies on third-party debt collectors, see Fedaseyeu and Hunt (2018) and Fedaseyeu (2020).

35
abusive behavior by April 2018.26 We incorporate the province regulation information into our
baseline sample using borrowers’ hometown information in their national identity cards.27 We
consider borrowers in these subsamples to be better protected against the lender’s potential
aggressive debt collection practices, because provincial governments are more concerned about
the practices in the fintech lending markets, acting promptly to implement corresponding
regulations. In Table IA2, we find that the effect of digital collateral on debt collection remains
unchanged in provinces with strong fintech lending regulations.
In summary, the debt collection tactics based on borrowers’ digital collateral may apply
not only to the markets with weak debtor protections but also to those with strong laws and
regulations against abusive debt collection practices.
6.3. Fintech and financial inclusion
Our study provides important policy implications for the roles of fintech development in
enhancing financial inclusion. According to the World Bank’s 2014 Global Financial
Development Report, more than 2.5 billion adults (about half of the world’s adult population)
have no bank account, and many of them would “benefit from financial services but cannot
access them due to market failures” (World Bank 2014). The lack of access to financial services
caused by market imperfection can lead to poverty and inequality (Banerjee and Newman 1993;
Galor and Zeira 1993; Aghion and Bolton 1997).
In credit markets, individuals in low-income countries have limited access to borrow from
formal sources. According to the World Bank’s 2014 Report, only seven percent of adults in
developing economies have credit cards; however, they have essential reasons for borrowing
(e.g., the most common reason for the outstanding loan is due to emergencies or health issues).
One possible way to expand financial inclusion is to adopt new technologies and novel business
models that can “lower the cost and inconvenience of accessing financial services” (World
Bank 2014).
The extant fintech research has shown that advances in financial technologies can help
enhance financial inclusion, one of the key promises of fintech for overall welfare (Goldstein,
Jiang, and Karolyi 2019). For instance, Berg et al. (2019) and Agarwal et al. (2021) find that
26 The information about the province-level regulation implementation was collated in a survey as reported by online media outlets such as the Sina Corporation. See, for example, the Sina’s coverage in Mandarin on April 8, 2018: https://cj.sina.com.cn/articles/view/6298435788/1776a80cc019006p67 (accessed September 9, 2020). 27 We use borrowers’ hometown information in the matching process because a lawsuit against a delinquent borrower will be judged in the borrower’s hometown, and the physical address in digital footprints is not available to all the borrowers.

36
digital footprints complement credit bureau information and are associated with the likelihood
of loan approvals and defaults. Moreover, fintech lenders fill the credit gap in areas where
traditional banks face more regulatory constraints (Buchak et al. 2018) and when banks tighten
credit standards (Allen, Shan, and Shen 2020). These findings suggest that fintech lending can
boost financial inclusion, especially in countries where traditional banks provide limited
financial services.
We document a new perspective on the role of fintech in enhancing financial inclusion.
The World Bank’s 2014 Report underscores that financial inclusion needs to be promoted
properly and responsibly, and that the credit overextension can lead to defaults and exacerbate
financial instability (World Bank 2014). This is evidenced by the U.S. subprime mortgage
crisis in the 2000s, and India’s microfinance crisis in 2010.28 Traditional financial institutions
rely on physical collateral to overcome default risk in the retail debt markets. Given information
asymmetry between the lender and borrowers, collateral in general allows for hedging against
borrowers’ potential moral hazardous behavior.29 Our study provides an alternative mechanism
to address moral hazards, typically for individuals with no physical collateral in low financial
inclusion economies. That is, when loans are unsecured by physical assets, fintech
advancement allows lenders to target borrowers’ personal information in their digital footprints
as collateral and adopt a debt collection tactic based on digital collateral in case of debt
delinquency.
Our analyses in Table 12 have shown supportive evidence that digital collateral can expand
financial inclusion by increasing the likelihood of loan approval. This is because loan
applicants may have low personal wealth and limited access to traditional lenders, partly
indicated by the average balance of their Alipay’s accounts equal to 4.30 Chinese Yuan. In
Table IA3 of the Internet Appendix, we re-conduct the loan approval analysis in subsamples
of applicants with low creditworthiness. Specifically, we focus on the loan applicants with
credit risk scores (Score) higher than the sample median. The results remain qualitatively
similar to those in Table 12, providing further evidence for the digital collateral’s role in
enhancing financial inclusion.
28 See studies on microfinance, for example, Pitt and Khandker (1998) and Kaboski and Townsend (2011). 29 When a borrower becomes delinquent, the financial institution will be protected by collateral. The assets used as collateral will be seized and sold to recover debt claims. Thus, individuals without adequate collateral may find it difficult to secure a loan from conventional financial institutions, resulting in the inefficiency of resource allocation and low financial inclusion (Gine, Goldberg, and Yang 2012; Lin, Prabhala, and Viswanathan 2013; Hildebrand, Puri, and Rocholl 2017).

37
7. Conclusion
In this paper, we find that the information contained in borrowers’ digital footprints can be
used by lenders as collateral for debt collection when borrowers fail to make loan repayments.
The role of digital collateral in debt collection operates through two potential channels: the
possible damages to borrowers’ social capitals and the accessibility to their physical locations.
Our findings add to the fintech literature by documenting that technological innovations can
create value for innovators and adopters in the financial markets. We also complement the debt
literature by showing that digital footprints, used as one type of non-physical collateral, can
facilitate the collection of delinquent loans.

38
Appendix A Variable Definitions
Variable Definition
Paid t An indicator variable equal to one if a borrower makes the repayment on the Day t, and zero otherwise.
Paid [i, j] Cumulative repayment likelihood from Day i to Day j in percentage.
Chasing Day t An indicator variable equal to one for days in a three-day window [t, t+2], and zero otherwise.
Chasing All An indicator variable equal to one for days in windows [4, 6], [16, 18], [31, 33], [61, 63], and [91, 93], and zero otherwise.
Chasing Day 4,16 An indicator variable equal to one for days in windows [4, 6], and [16, 18], and zero otherwise.
Chasing Day 31,61,91 An indicator variable equal to one for days in windows [31, 33], [61, 63], and [91, 93], and zero otherwise.
Repayment Ratio Ratio of the amount of repayment for the delinquent loan by Day 93 divided by the amount required to be paid by the due date.
Repayment Complete An indicator variable equal to one if a borrower makes repayment equal to / more than delinquent amount by Day 93, and zero otherwise.
Delinquency An indicator variable equal to one if a borrower fails to make a loan payment by the due date at least once during loan term, and zero otherwise.
Approval An indicator variable equal to one if a borrower’s local application is approved by the fintech lender, and zero otherwise.
Contact An indicator variable equal to one if a borrower has at least one contact who has more than ten calls with borrower, and zero otherwise.
Address An indicator variable equal to one if a borrower has at least one online shopping delivery address, and zero otherwise.
Contact Number Number of contacts who have more than ten calls with a borrower. Logarithm value is taken in regression analysis.
Address Number Number of a borrower’s online shopping delivery addresses. Logarithm value is taken in regression analysis.
Contact Pseudo An indicator variable equal to one for a pseudo borrower assigned to a treatment group based on Contact, and zero otherwise.
Address Pseudo An indicator variable equal to one for a pseudo borrower assigned to a treatment group based on Address, and zero otherwise.
Contact 1≤Number≤7 An indicator variable equal to one if a borrower has at least one and at most seven contacts who have more than ten calls with borrower,
and zero otherwise.
Contact Number>7 An indicator variable equal to one if a borrower has more than seven contacts with more than ten calls with borrower, and zero otherwise.
Address Number=1 An indicator variable equal to one if a borrower has one online shopping delivery address, and zero otherwise.
Address Number>1 An indicator variable equal to one if a borrower has more than one online shopping delivery addresses, and zero otherwise.

39
Appendix A (Continued)
Variable Definition
Contact Only An indicator variable equal to one if a borrower has at least one contact who has more than ten calls with borrower, but has no information
about online shopping delivery address, and zero otherwise.
Address Only An indicator variable equal to one if a borrower has at least one online shopping delivery address, but has no information about contact
who has more than ten calls with borrower, and zero otherwise.
Collateral Both An indicator variable equal to one if a borrower has at least one contact who has more than ten calls with borrower and at least one online
shopping delivery address, and zero otherwise.
Amount Amount of loan principal in thousands of Chinese Yuan. Logarithm value is taken in regression analysis.
Rate Interest rate of loan on annual basis.
Age Age of a borrower in years. Logarithm value is taken in regression analysis.
Gender An indicator variable equal to one if a borrower is female, and zero otherwise.
Score Credit risk score provided by Tencent, with high value suggesting high risk profile. Logarithm value is taken in regression analysis.
Wealth Balance of a borrower’s Alipay account from Alibaba in Chinese Yuan. Logarithm value is taken in regression analysis.
History Number of loan applications of a borrower rejected by other online lending platforms. Logarithm value is taken in regression analysis.
Social Spending Average amount of annual social spending by household scaled by the average annual household income at province-year level. Social
spending by household is the cash and non-cash gifts given to and received from family members and friends for festivals like
Lunar New Year, and personal social events such as birthday and so on.
Veneration Ancestor Average percentage of households attending the veneration events of honoring ancestors at province-year level.
Distance FinTech Geographical distance between the city of borrower’s physical location and Shanghai, where the fintech lending company is
headquartered. For a borrower with multiple physical locations, the most frequently used delivery address will be chosen to estimate the
distance. When there are multiple addresses deemed as the most frequent ones, the most recently used address will be selected.
Litigation Confidence The average satisfaction rating by household at province-year level. The rating varies between 1 and 5. Higher value of the rating
indicates more satisfaction.

40
Appendix B Sample Selection
Step Selection Criteria Observations 1. Original sample of loan applications for borrowers with a fintech lender, 236,967 including borrowers with unapproved applications. For a borrower engaging with multiple loan applications, the first application will be selected. 2. Borrowers with approved loans after excluding rejected loan applications. 97,783 3. Delinquent borrowers after excluding those experiencing delinquency. 41,711
4. Matched sample of delinquent borrowers containing 14,768 borrowers in
the 29,536
treatment group (Contact = 1) and 14,768 borrowers in the control group (Contact = 0), who fail to make repayment by due date (Day zero). 5. Final sample of borrower-day observations for the analyses conducted in 177,216 in window [1, 6], where Day 4 is the date that the lender makes the first round of chasing calls for delinquent loans. This sample is expanded based
on the matched sample multiplying the window length (29,536 borrowers × 6 days = 177,216 borrower-days).
This appendix presents the sample selection procedure. We start with a dataset of 236,967 loan applications for borrowers engaged with a fintech lender from July 2017 to November 2019. We end up with a final sample of 177,216 borrower-day observations for the analysis conducted in window [1, 6] with borrowers in both treatment (Contact = 1) and control groups (Contact = 0).

41
References
Abdel-Khalik, A. R. 1973. The effect of aggregating accounting reports on the quality of the lending decision: An empirical investigation. Journal of Accounting Research, 11:104–38.
Abowd, J. M., and I. M. Schmutte. 2019. An economic analysis of privacy protection and statistical accuracy as social choices. American Economic Review, 109:171–202.
Acquisti, A., L. K. John, and G. Loewenstein. 2013. What is privacy worth? Journal of Legal Studies, 42:249–74.
Agarwal, S., S. Alok, P. Ghosh, and S. Gupta. 2021. Financial inclusion and alternate credit scoring for the millennials: Role of big data and machine learning in fintech. Working Paper, National University of Singapore.
Agarwal, S., W. Qian, and X. Zou. 2020. Disaggregated sales and stock returns. Working Paper, National University of Singapore.
Aghion, P., and P. Bolton. 1992. A theory of trickle-down growth and development. Review of Economic Studies, 64:151–72.
Aghion, P., and P. Bolton. 1997. An incomplete contracts approach to financial contracting. Review of Economic Studies, 59:473–94.
Allen, L., Y. Shan, and Y. Shen. 2020. Do FinTech lenders fill the credit gap? Evidence from local mortgage demand shocks. Working Paper, Baruch College.
Ali, S. G., and R. Bénabou. 2020. Image versus information: Changing societal norms and optimal privacy. American Economic Journal: Microeconomics, 12:116–64.
Banerjee, A. V., and A. F. Newman. Occupational choice and the process of development. Journal of Political Economy, 101:274–98.
Beck, T., V. Ioannidou, and L. Schäfer. 2018. Foreigners vs. natives: Bank lending technologies and loan pricing. Management Science, 64:3792–820.
Benmelech, E., N. K. Bergman. 2009. Collateral pricing. Journal of Financial Economics, 91:339–60. Berg, T., V. Burg, A. Gombovic, and M. Puri. 2020. On the rise of FinTechs: Credit scoring using
digital footprints. Review of Financial Studies, 33:2845–97. Blackmore, N., and S. Yang. 2020. Personal data protection under newly issued Civil Code. Lexology.
August 14, 2020. Boothby, E. J., L. K. Smith, M. S. Clark, and J. A. Bargh. 2016. Psychological distance moderates the
amplification of shared experience. Personality and Social Psychology Bulletin, 42:1431–44. Bornstein, R. F. 1989. Exposure and affect: Overview and meta-analysis of research, 1968-1987.
Psychological Bulletin, 106:265–89. Bornstein, R. F., A. R. Kale, and K. R. Cornell. 1990. Boredom as a limiting condition on the mere
exposure effect. Journal of Personality and Social Psychology, 58:791–800. Braggion, F., A. Manconi, and H. Zhu. 2020. Can technology undermine macroprudential regulation?
Evidence from online marketplace credit in China. Working Paper, Tilburg University. Buchak, G., G. Matvos, T. Piskorski, and A. Seru. 2018. Fintech, regulatory arbitrage, and the rise of
shadow banks. Journal of Financial Economics, 130:453–83. Bursztyn, L., S. Fiorin, D. Gottlieb, and M. Kanz. 2019. Moral incentives in credit card debt repayment:
Evidence from a field experiment. Journal of Political Economy, 127:1641–83. Cadena, X., and A. Schoar. 2012. Remembering to pay? Reminders vs. financial incentives for loan
payments. Working Paper, National Bureau of Economic Research. Campbell, D., M. Loumioti, and R. Wittenberg-Moerman. 2019. Making sense of soft information:
interpretation bias and loan quality. Journal of Accounting and Economics, 68:101240. Chan, T., N. Hamdi, X. Hui, and Z. Jiang. 2020. Digital verification and inclusive access to credit: An
empirical investigation. Working Paper, Washington University in St. Louis. Clark, W. A. V., D. Yi, and Y. Huang. 2019. Subjective well-being in China’s changing society.
Proceedings of the National Academy of Sciences, 116:16799–804. Coleman, J. S. 1988. Social capital in the creation of human capital. American Journal of Sociology,
94:95–120. Consumer Financial Protection Bureau (CFPB). 2020. Fair Debt Collection Practices Act, CFPB
Annual Report 2020.
42
DeMarzo, P. M. 2019. Presidential address: Collateral and commitment. Journal of Finance, 74:1587–619.
De Hass, R., and N. Van Horen. 2013. Running for the exit? International bank lending during a financial crisis. Review of Financial Studies, 26:244–85.
De Roure, C., L. Pelizzon, and A. Thakor. 2019. P2P lenders versus banks: Cream skimming or bottom fishing? Working Paper, Frankfurt School of Finance and Management.
Diep-Nguyen, H., and H. Dang. 2020. Social collateral. Working Paper, Purdue University. Djankov, S., O. Hart, C. McLiesh, and A. Shleifer. 2008. Debt enforcement around the world. Journal
of Political Economy, 111:1105–50. Djankov, S., C. McLiesh, and A. Shleifer. 2007. Private credit in 129 countries. Journal of Financial
Economy, 84:299–329. Drozd, L. A., R. Serrano-Padial. 2017. Modeling the revolving revolution: The debt collection channel.
American Economic Review, 107:897–930. Du, N., L. Li, T. Lu, and X. Lu. 2020. Prosocial compliance in P2P lending: A natural field experiment.
Management Science, 66:315–33. Duarte, J., S. Siegel, and L. Young. 2012. Trust and credit: The role of appearance in peer-to-peer
lending. Review of Financial Studies, 25:2455–84. Erel, I., and J. Liebersohn. 2020. Does FinTech substitute for banks? Evidence from the paycheck
protection program. Working Paper, Ohio State University. Fedaseyeu, V. 2020. Debt collection agencies and the supply of consumer credit. Journal of Financial
Economics, Forthcoming. Fedaseyeu, V., and R. M. Hunt. 2018. The economics of debt collection: Enforcement of consumer
credit contracts. Working Paper, China Europe International Business School. Froot, K., N. Kang, G. Ozik, and R. Sadka. 2017. What do measures of real-time corporate sales say
about earnings surprises and post-announcement returns? Journal of Financial Economics, 125:143–62.
Fuster, A., M. Plosser, P. Schnabl, and J. Vickery. 2019. The role of technology in mortgage lending. Review of Economic Studies, 32:1854–99.
Galor, O., and J. Zeira. 1993. Income distribution and macroeconomics. Review of Economic Studies, 60:35–52.
Gine, X., J. Goldberg, and D. Yang. 2012. Credit market consequences of improved personal identification: Field experimental evidence from Malawi. American Economic Review, 102:2923–854.
Green, T. C., R. Huang, Q. Wen, and D. Zhou. 2019. Crowdsourced employer reviews and stock returns. Journal of Financial Economics, 134:236–51.
Grennan, J., and R. Michaely. 2020. FinTechs and the market for financial analysis. Working Paper, Duke University.
Gupta, A., K. Raman, and C. Shang. 2020. Do informal contracts matter for corporate innovation? Evidence from social capital. Journal of Financial and Quantitative Analysis, 55:1657–84.
Harmon, S. 2013. Silicon Valley companies quietly try to kill Internet privacy bill. The Mercury News, April 19, 2013.
Hart, O., and J. Moore. 1994. A theory of debt based on the inalienability of human capital. Quarterly Journal of Economics, 109:841–79.
Hart, O., and J. Moore. 1998. Default and renegotiation: A dynamic model of debt. Quarterly Journal of Economics, 113:1–41.
Hasan, I., C. K. Hoi, and H. Zhang. 2017. Social capital and debt contracting: Evidence from bank loans and public bonds. Journal of Financial and Quantitative Analysis, 52:1017–47.
Hautala, L. 2020. CCPA is here: California’s privacy law gives you new rights. CNET. January 3, 2020. Hildebrand, T., M. Puri, and J. Rocholl. 2017. Adverse incentives in crowdfunding. Management
Science, 63:587–608. Hirshleifer, D., and S. H. Teoh. 2003. Limited attention, information disclosure, and financial reporting.
Journal of Accounting and Economics, 36:337–86. Hoi, C. K., Q. Wu, and H. Zhang. 2019. Does social capital mitigate agency problems? Evidence from
Chief Executive Officer (CEO) compensation. Journal of Financial Economics, 133:498–519.

43
Huang, J. 2018. The customer knows best: The investment value of consumer opinions. Journal of Financial Economics, 128:164–82.
Hunt, R. M. 2007. Collecting consumer debt in America. Business Review, Q2:11–24. Hwang, K. 1978. Face and favor: The Chinese power game. American Journal of Sociology, 92:944–
74. Irby, L. 2020. Can debt collectors contact relatives about my debt? The Balance, July 31, 2020. Iyer, R., A. J. Khwaja, E. F. Luttmer, and K. Shue. 2015. Screening peers softly: Inferring the quality
of small borrowers. Management Science, 62:1554–77. Jimenez, G., V. Salas, and J. Saurina. 2006. Determinants of collateral. Journal of Financial Economics,
81:255–81. Jiang, J., L. Liao, X. Lu, Z. Wang, and H. Xiang. 2021. Can big data defeat traditional credit rating?
Working Paper, Tsinghua University. Johnson, H., and R. M. Stulz. 1985. An analysis of secured debt. Journal of Financial Economics, 14:
501–21. Kaboski, J. P., and R. M. Townsend. 2011. A structural evaluation of a large-scale quasi-experimental
microfinance initiative. Econometrica, 79:1357–406. Karlan, D., M. Mobius, T. Rosenblat, and A. Szeidl. 2009. Trust and social collateral. Quarterly Journal
of Economics, 124:1307–61. Karlan, D., M. Morten, J. Zinman. 2015. A personal touch: Text messaging for loan repayment.
Working Paper, Yale University. Karlan, D., and J. Zinman. 2010. Expanding credit access: Using randomized supply decisions to
estimate the impacts. Review of Financial Studies, 23:433–64. Katona, Z., M. Painter, P. N. Patatoukas, and J. Zeng. 2020. On the capital market consequences of
alternative data: Evidence from outer space. Working Paper, University of California, Berkeley. Kiyotaki, N., and J. Moore. 1997. Credit cycles. Journal of Political Economy, 105:211–48. Lakos, W. 2010. Chinese ancestor worship: A practice and ritual oriented approach to understanding
Chinese culture. Cambridge Scholars Publishing, Newcastle, U.K. Laudenbach, C., J. Pirschel, and S. Siegel. 2018. Personal communication in a fintech world: Evidence
from loan payments. Working Paper, Goethe University Frankfurt. Leary, M. T., and M. R. Roberts. 2014. Do peer firms affect corporate financial policy? Journal of
Finance, 69:139–78. Liao, L., Z. Wang, H. Yan, and C. Zhou. 2020b. When FinTech meets privacy: The consequence of
personal information misuse in debt collection. Working Paper, Tsinghua University. Lin, M., N. R. Prabhala, and S. Viswanathan. 2013. Judging borrowers by the company they keep:
Friendship networks and information asymmetry in online peer-to-peer lending. Management Science, 59:17–35.
Lugauer, S., J. Ni, and Z. Yin. 2019. Chinese household saving and dependent children: Theory and evidence. China Economic Review, 57:101091.
Lusardi, A., and O. S. Mitchell. 2014. The economic importance of financial literacy: Theory and evidence. Journal of Economic Literature, 52:5–44.
Lee, S., and P. Persson. 2016. Financing from family and friends. Review of Financial Studies, 29:2341–86.
McGraw, A. P., C. Warren, L. E. Williams, and B. Leonard. 2012. Too close for comfort, or too far to care? Finding humor in distant tragedies and close mishaps. Psychological Science, 23:1215–23.
Medina, P. C. 2018. Selective attention in consumer finance: Evidence from a randomized intervention in the credit card market. Working Paper, Texas A&M University.
Mian, A. 2006. Distance constraints: The limits of foreign lending in poor economies. Journal of Finance, 61:1465–505.
Mukherjee, A., G., Panayotov, and J. Shon. 2020. Eye in the sky: Private satellites and government macro data. Working Paper, Hong Kong University of Science and Technology.
Pitt, M. M., and S. R. Khandker. 1998. The impact of group-based credit programs on poor households in Bangladesh: Does the gender of participants matter? Journal of Political Economy, 106:958–96.
Putnam, R. D. 1995. Bowling alone: America’s declining social capital. Journal of Democracy, 6:65–78.

44
Rampini, A. A., and S. Viswanathan. 2010. Collateral, risk management, and the distribution of debt capacity. Journal of Finance, 65:2293–322.
Rampini, A. A., and S. Viswanathan. 2013. Collateral and capital structure. Journal of Financial Economics, 109:466–92.
Schiantarelli, F., M. Stacchini, and P. E. Strahan. 2020. Bank quality, judicial efficiency, and loan repayment delays in Italy. Journal of Finance, 75:2139–78.
Tang, H. 2019. Peer-to-peer lenders versus banks: Substitutes or complements? Review of Financial Studies, 32:1900–38.
Thakor, A. V. 2020. Fintech and banking: What do we know? Journal of Financial Intermediation, 41: 100833.
Vallée, B., and Y. Zeng. 2019. Marketplace lending: A new banking paradigm? Review of Financial Studies, 32:1939–82.
Williams, L. E., R. Stein, and L. Galguera. 2014. The distinct affective consequences of psychological distance and construal level. Journal of Consumer Research, 40:1123–38.
World Bank. 2014. Global Financial Development Report 2014: Financial Inclusion. Washington, DC. Yang, M. M. 1994. Gifts, favors, and banquets: The art of social relationships in China. Cornell
University Press, Ithaca, NY. Zhu, C. 2019. Big data as a governance mechanism. Review of Financial Studies, 32:2021–61.

45
Figure 1 The Process of Loan Application, Approval, Repayment, and Collection
This figure illustrates the process of loan application, approval, repayment, and collection executed by the fintech lender. The sample analyzed in this paper includes 236,967 loan applications submitted to the fintech lender from July 2017 to November 2019, among which 97,783 loan applications have been approved and 41,711 approved loans experience borrower’s delinquency.
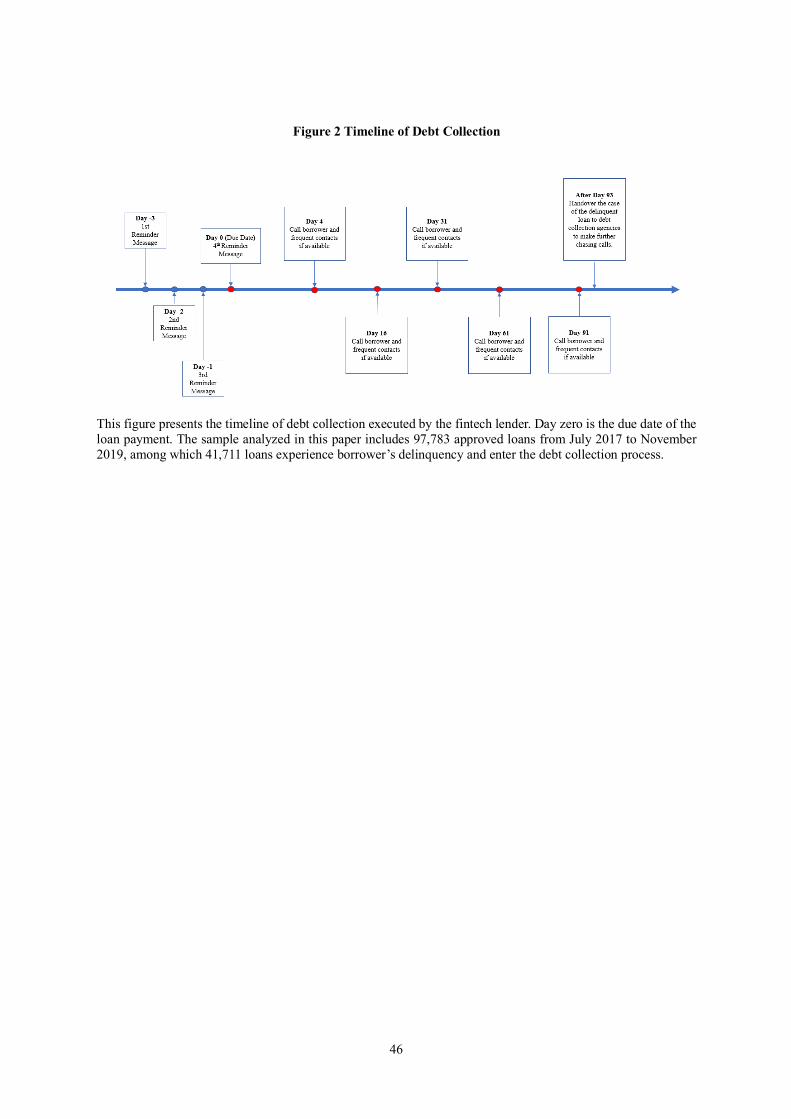
46
Figure 2 Timeline of Debt Collection
This figure presents the timeline of debt collection executed by the fintech lender. Day zero is the due date of the loan payment. The sample analyzed in this paper includes 97,783 approved loans from July 2017 to November 2019, among which 41,711 loans experience borrower’s delinquency and enter the debt collection process.

47
Figure 3 Digital Collateral for Debt Collection
This figure illustrates the different roles of traditional collateral and digital collateral in the loan recovery process.

48
Figure 4 Geographical Distribution of Loan Application
This figure shows the geographical distribution of the loan applications submitted to the fintech lender. The color depth denotes the application density regarding the number of applications per million population in a province of China. The sample analyzed in this paper includes 236,967 loan applications submitted between July 2017 and November 2019, among which 97,783 applications have been approved.
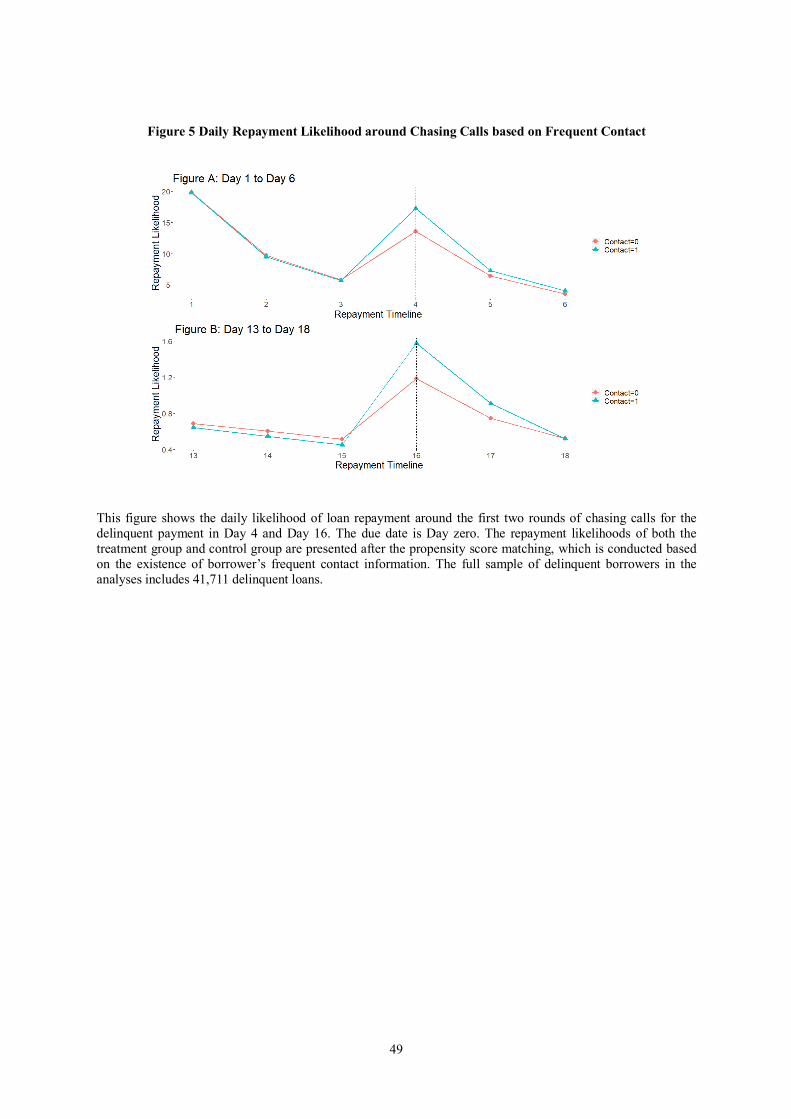
49
Figure 5 Daily Repayment Likelihood around Chasing Calls based on Frequent Contact
This figure shows the daily likelihood of loan repayment around the first two rounds of chasing calls for the delinquent payment in Day 4 and Day 16. The due date is Day zero. The repayment likelihoods of both the treatment group and control group are presented after the propensity score matching, which is conducted based on the existence of borrower’s frequent contact information. The full sample of delinquent borrowers in the analyses includes 41,711 delinquent loans.

50
Figure 6 Daily Repayment Likelihood around Chasing Calls based on Delivery Address
This figure shows the daily likelihood of loan repayment around the first two rounds of chasing calls for the delinquent payment in Day 4 and Day 16. The due date is in Day zero. The repayment likelihoods of both the treatment group and control group are presented after the propensity score matching, which is conducted based on the existence of borrower’s online shopping delivery address information. The full sample of delinquent borrowers in the analyses includes 41,711 delinquent loans.

51
Table 1 Summary Statistics
Variable OBS Mean STD 25% Median 75% Paid [1,6] 41,711 61.933 48.566 0 100 100
Paid [1,18] 41,711 75.247 43.158 100 100 100
Paid [1,93] 41,711 84.667 36.031 100 100 100
Repayment Ratio 41,711 1.071 0.541 0.928 1.292 1.392
Repayment Complete 41,711 0.738 0.440 0 1 1
Contact 41,711 0.651 0.476 0 1 1
Contact Number 41,711 7.494 14.500 0 3 9
Address 41,711 0.765 0.423 0 1 1
Address Number 41,711 1.06 0.808 0 1 1
Amount 41,711 3.966 1.297 3.000 3.980 4.780
Rate 41,711 0.295 0.083 0.205 0.357 0.359
Age 41,711 27.105 7.884 21 25 31
Gender 41,711 0.182 0.386 0 0 0
Score 41,711 56.761 15.261 48.000 60.200 66.750
Wealth 41,711 4.221 32.071 0.000 0.900 27.200
History 41,711 0.118 0.582 0 0 0
Delinquency 97,783 0.427 0.495 0 0 1
Approval 236,967 0.413 0.493 0 0 1 This table presents the summary statistics of the variables for the number of observations (OBS), mean (Mean), standard deviation (STD), the 25th (25%), median (Median), and 75th percentiles (75%) of the distributions of the variables. The samples of delinquent loans, approved loans, and loan applications consist of 41,711, 97,783, and 236,967 observations from July 2017 to November 2019, respectively. All variables are defined in the Appendix A.

52
Table 2 Treatment and Control Groups under Propensity Score Matching
Panel A: Propensity Score Matching based on Contact Contact = 1 Contact = 0 Mean Mean Difference t-statistic Paid [1,6] 63.591 58.830 4.761 8.421***
Paid [1,18] 77.594 71.777 5.817 11.538***
Paid [1,93] 86.301 81.827 4.474 10.313***
Amount 3.714 3.710 0.004 0.475
Rate 0.294 0.293 0.001 0.152
Age 27.611 27.679 -0.068 −0.858
Gender 0.175 0.174 0.001 0.068
Score 56.036 56.205 -0.169 −0.085 Wealth 6.080 6.203 -0.123 −0.982
History 0.046 0.045 0.001 0.947
Observations of borrowers 14,768 14,768
Panel B: Propensity Score Matching based on Address Address = 1 Address = 0 Mean Mean Difference t-statistic Paid [1,6] 58.065 54.072 3.993 5.708***
Paid [1,18] 72.297 67.681 4.616 7.149***
Paid [1,93] 83.711 78.907 4.804 8.645***
Amount 3.565 3.601 -0.036 −1.562
Rate 0.313 0.308 0.005 1.787*
Age 31.083 30.487 0.596 1.222
Gender 0.171 0.170 0.001 0.131
Score 58.323 58.382 -0.059 −0.329
Wealth 1.804 2.056 -0.252 −6.386***
History 0.052 0.060 -0.008 −1.387
Observations of borrowers 9,994 9,994
This table presents the comparison of the characteristics between the treatment and control groups after the propensity score matching. In Panel A, the treatment (control) group includes delinquent borrowers who have at least one frequent mobile contact (no frequent mobile contact) in digital footprints. In Panel B, the treatment (control) group includes delinquent borrowers who have at least one online shopping delivery address (no delivery address) in digital footprints. The samples of the treatment and control groups both consist of 14,768 (9,994) delinquent loans from July 2017 to November 2019 in Panel A (Panel B). ***, **, * denote statistical significance at the 0.01, 0.05, and 0.10 levels, respectively. All the variables are defined in the Appendix A.

53
Table 3 Univariate Analyses of Repayment Likelihood
Panel A: Univariate Analyses based on Contact Contact = 1 Contact = 0 Paid t Mean Mean Difference t-statistic Day 1 to Day 3 11.683 11.780 −0.097 -0.449
Day 4 to Day 6 9.514 7.830 1.684 8.926***
∆ [4,6] - [1,3] −2.169 −3.950 1.781 6.212***
Observations of borrowers 14,768 14,768
Day 13 to Day 15 2.023 1.874 0.149 0.869
Day 16 to Day 18 3.681 2.520 1.161 5.387***
∆ [16,18] - [13,15] 1.658 0.646 1.012 3.722***
Observations of borrowers 4,412 4,412 Panel B: Univariate Analyses based on Address Address = 1 Address = 0 Paid t Mean Mean Difference t-statistic Day 1 to Day 3 9.867 10.102 −0.235 -0.965
Day 4 to Day 6 9.488 7.921 1.567 6.828***
∆ [4,6] - [1,3] −0.379 −2.181 1.802 5.378***
Observations of borrowers 9,994 9,994
Day 13 to Day 15 1.834 1.663 0.171 0.936
Day 16 to Day 18 3.070 1.994 1.070 4.905***
∆ [16,18] - [13,15] 1.230 0.331 0.899 3.196***
Observations of borrowers 3,459 3,459 The table presents the univariate analyses of the daily loan repayment likelihood between the treatment group and control group after the propensity score matching. Paid t is an indicator variable equal to one if a borrower makes the repayment on the Day t, and zero otherwise. Day zero is the due date of loan repayment. In Panel A, the treatment (control) group includes delinquent borrowers who have at least one frequent mobile contact (no frequent mobile contact) in digital footprints. In Panel B, the treatment (control) group includes delinquent borrowers who have at least one online shopping delivery address (no delivery address) in digital footprints. Around Day 4 (Day 16), the samples of treatment and control groups both consist of 14,768 and 9,994 (4,412 and 3,459) delinquent loans from July 2017 to November 2019 in Panel A and Panel B, respectively. ***, **, * denote statistical significance at the 0.01, 0.05, and 0.10 levels, respectively. All the variables are defined in the Appendix A.

54
This table presents the difference-in-differences analyses of the daily loan repayment likelihood based on the lender’s first two rounds of chasing calls made on Day 4 and Day 16. The analyses are performed at the delinquent-borrower-day level. The dependent variable, Paid t, is an indicator variable equal to one if a borrower makes the repayment on the Day t, and zero otherwise. Day zero is the due date of loan repayment. In Models 1 and 2, the tests are conducted in window [1, 6], where Day 4 is the date that the lender makes the first round of chasing calls for delinquent loans. In Models 3 and 4, the tests are conducted in window [13, 18], where Day 16 is the date that the lender makes the second round of chasing calls for delinquent loans. Chasing Day T is an indicator variable equal to one for days in window [T, T+2], and zero for window [T-3, T-1]. The dependent variable, Paid t, is regressed on Chasing, Chasing × Digital Collateral Proxy (i.e., Contact or Address), controlling for the interactions between the Chasing dummies and other characteristics of loan and borrower, as well as the borrower and day fixed effects. In Models 1 and 2 (Models 3 and 4), the matched samples based on Contact and Address consist of 177,216 and 119,928 (52,944 and 41,508) borrower-day observations from July 2017 to November 2019, respectively. The t-statistics shown in parentheses are based on standard errors adjusted for heteroskedasticity and borrower-level clustering. ***, **, * denote statistical significance at the 0.01, 0.05, and 0.10 levels, respectively. All the variables are defined in the Appendix A.
Table 4 Repayment Likelihood around the First Two Rounds of Chasing Calls
Dependent Variable Paid t T=4 T=16 (1) (2) (3) (4)
Chasing Day T×Contact 1.759*** 1.033*** (5.805) (3.666) Chasing Day T×Address 1.794*** 0.898*** (5.002) (3.037) Chasing Day T×Amount −1.919*** −1.539*** 0.529 0.600* (−4.618) (−3.432) (0.359) (1.695) Chasing Day T×Rate −12.740*** −17.158*** −2.485 −3.527** (−6.976) (−8.254) (−1.477) (−2.010) Chasing Day T×Age 5.710*** 5.142*** −1.137* −0.252 (10.211) (8.407) (−2.410) (−0.524) Chasing Day T×Gender −2.289*** −1.243*** −0.031 −0.354 (−5.722) (−2.587) (−0.079) (−0.854) Chasing Day T×Score 3.349*** 3.210*** -0.329 -0.027 (6.497) (4.751) (-0.558) (-0.038) Chasing Day T×Wealth −0.327*** −0.158 0.089 −0.041 (−5.119) (−1.223) (1.434) (−0.342) Chasing Day T×History −0.553 −0.743 0.566 0.072 (−0.745) (−0.928) (0.832) (0.099) Borrower Fixed Effect Yes Yes Yes Yes Day Fixed Effect Yes Yes Yes Yes Observations 177,216 119,928 52,944 41,508 R2ADJ 10.9% 10.8% 1.8% 1.8%

55
Table 5 Placebo Tests Based on Pseudo Calls and Pseudo Borrowers
Panel A: Pseudo Chasing Call Dates
Dependent Variable Paid t (1) (2)
Chasing Day 1×Contact −0.074 (−0.400) Chasing Day 1×Address −0.266 (−1.220) Chasing Day 1×Amount 1.074*** 0.956*** (4.219) (3.507) Chasing Day 1×Rate 5.977*** 10.981*** (5.281) (8.508) Chasing Day 1×Age −4.664*** −3.804*** (−13.662) (−10.232) Chasing Day 1×Gender 1.566*** 1.048*** (6.312) (3.559) Chasing Day 1×Score −4.144*** −4.014*** (−13.515) (−9.839) Chasing Day 1×Wealth 0.419*** 0.305*** (10.831) (3.934) Chasing Day 1×History 0.795* 1.367*** (1.791) (2.902) Borrower Fixed Effect Yes Yes Day Fixed Effect Yes Yes Observations 177,216 119,928 R2ADJ 5.6% 4.2%

56
Table 5 (Continued)
Panel B: Pseudo Borrowers with Digital Collateral
Actual Estimate Mean 5% 25% Median 75% 95%
Chasing Day 4×Contact Pseudo 1.759*** 0.004 -0.525* -0.210 -0.005 0.225 0.519*
(5.805) (0.013) (-1.732) (-0.692) (-0.017) (0.740) (1.710)
Chasing Day 4×Address Pseudo 1.794*** -0.017 -0.605* -0.268 -0.011 0.231 0.597*
(5.002) (-0.048) (-1.690) (-0.749) (-0.030) (0.646) (1.667)
This table presents the placebo tests based on the pseudo calls and pseudo borrowers. Panel A reports the tests of the daily loan repayment likelihood in a six-day window [-2, 3] with no chasing call. Chasing Day 1 is an indicator variable equal to one for days in window [1, 3], and zero for window [-2, 0]. Paid t is regressed on Chasing, Chasing × Digital Collateral Proxy (i.e., Contact or Address), controlling for the interactions between the Chasing dummies and other characteristics of loan and borrower, as well as the borrower and day fixed effects. The matched samples based on Contact (Address) consist of 177,216 (119,928) borrower-day observations from July 2017 to November 2019. The t-statistics shown in parentheses are based on standard errors adjusted for heteroskedasticity and borrower-level clustering. Panel B reports the tests of the daily loan repayment likelihood in a six-day window [1, 6] for pseudo borrowers with digital collateral. Day zero is the due date of loan repayment. Chasing Day 4 is an indicator variable equal to one for days in window [4, 6], and zero for window [1, 3]. Paid t is regressed on Chasing, Chasing × Pseudo Digital Collateral Proxy (i.e., Contact Pseudo or Address Pseudo), controlling for the interactions between the Chasing dummies and other characteristics of loan and borrower, as well as the borrower and day fixed effects. The samples based on Contact Pseudo and Address Pseudo consist of 177,216 and 119,928 borrower-day observations from July 2017 to November 2019, in which half of the borrowers are randomly assigned to be pseudo borrowers with digital collateral, regardless whether they indeed have or not have digital collateral. The regression analysis has been conducted in 1,000 randomly generated samples with pseudo borrowers. The mean values and the 5, 25, 50, 75, and 95 percentiles of the coefficients on Chasing Day 4×Contact Pseudo and Chasing Day 4×Address Pseudo are reported for the 1,000 samples, together with their t-statistics shown in parentheses. The actual estimates are also reported. In both panels, the analyses are performed on the delinquent-borrower-day level. The dependent variable, Paid t, is an indicator variable equal to one if a borrower makes the repayment on the Day t, and zero otherwise. ***, **, * denote statistical significance at the 0.01, 0.05, and 0.10 levels, respectively. All the variables are defined in the Appendix A.

57
Table 6 Contact and Address Numbers
Dependent Variable Paid t (1) (2) (3) (4)
Chasing Day 4×Contact Number 0.514*** (3.931) Chasing Day 4×Address Number 1.843*** (4.425) Chasing Day 4×Contact 1≤ Number ≤ 7 2.134*** (5.961) Chasing Day 4×Contact Number>7 1.312*** (3.302) Chasing Day 4×Address Number=1 1.846*** (4.737) Chasing Day 4×Address Number>1 1.652*** (2.891) Chasing Day 4×Amount −1.941*** −1.537*** −1.941*** −1.537*** (−4.668) (−3.429) (−4.668) (−3.429) Chasing Day 4×Rate −12.903*** −17.230*** −12.903*** −17.230*** (−7.063) (−8.287) (−7.063) (−8.287) Chasing Day 4×Age 5.495*** 5.236*** 5.495*** 5.236*** (9.784) (8.545) (9.784) (8.545) Chasing Day 4×Gender −2.253*** −1.251*** −2.253*** −1.251*** (−5.628) (−2.602) (−5.628) (−2.602) Chasing Day 4×Score 3.366*** 3.230*** 3.366*** 3.230*** (6.525) (4.781) (6.525) (4.781) Chasing Day 4×Wealth −0.326*** −0.157 −0.326*** −0.157 (−5.093) (−1.215) (−5.093) (−1.215) Chasing Day 4×History −0.631 −0.735 −0.631 −0.735 (−0.850) (−0.916) (−0.850) (−0.916) Borrower Fixed Effect Yes Yes Yes Yes Day Fixed Effect Yes Yes Yes Yes Observations 177,216 119,928 177,216 119,928 R2ADJ 10.9% 10.8% 10.9% 10.8% This table presents the analyses based on the amount of digital information. The analyses are performed at the delinquent-borrower-day level. The dependent variable, Paid t, is an indicator variable equal to one if a borrower makes the repayment on the Day t, and zero otherwise. Day Zero is the due date of loan repayment. Day 4 is the date that the lender makes the first round of chasing calls for delinquent loans. Chasing Day 4 is an indicator variable equal to one for days in window [4, 6], and zero for window [1, 3]. In Models 1 and 2, the dependent variables are the number of borrowers’ frequent contacts and physical addresses, Contact Number and Address Number, respectively. In Models 3 and 4, we construct four indicator variables equal to one for borrowers with contact number between one and seven (Contact 1≤ Number ≤ 7), and greater than seven (Contact Number>7), and for borrowers with address number equal to one (Address Number=1), and greater than one (Address Number>1), and otherwise zero. The matched samples based on Contact (Address) consist of 177,216 (119,928) borrower-day observations from July 2017 to November 2019. The t-statistics shown in parentheses are based on standard errors adjusted for heteroskedasticity and borrower-level clustering. ***, **, * denote statistical significance at the 0.01, 0.05, and 0.10 levels, respectively. All the variables are defined in the Appendix A.

58
Table 7 Sequential Chasing Calls
Dependent Variable Paid t All Chasing Calls Early versus Later Calls
(1) (2) (3) (4) Chasing All×Contact 1.170*** (6.683) Chasing All×Address 1.188*** (6.151) Chasing Day 4,16×Contact 1.401*** (6.461) Chasing Day 31,61,91×Contact 0.631*** (4.893) Chasing Day 4,16×Address 1.376*** (5.643) Chasing Day 31,61,91×Address 0.804*** (5.417) Chasing All×Amount −1.054*** −0.801** −1.049*** −0.798*** (−4.484) (−3.371) (−4.465) (−3.357) Chasing All×Rate −6.745*** −8.850*** −6.725*** −8.827*** (−6.431) (−7.848) (−6.415) (−7.832) Chasing All×Age 2.571*** 2.475*** 2.578*** 2.447*** (8.583) (7.821) (8.610) (7.830) Chasing All×Gender −1.349*** -0.699*** −1.349*** −0.695*** (−5.707) (−2.644) (−5.717) (−2.630) Chasing All×Score 2.148*** 2.046*** 2.141*** 2.040*** (6.207) (4.725) (6.186) (4.713) Chasing All×Wealth -0.166*** -0.057 -0.165*** -0.057 (-4.248) (-0.786) (-4.242) (-0.773) Chasing All×History -0.157 -0.400 -0.163 -0.401 (-0.361) (0.866) (-0.373) (-0.869) Borrower Fixed Effect Yes Yes Yes Yes Day Fixed Effect Yes Yes Yes Yes Observations 330,624 241,812 330,624 241,812 R2ADJ 5.0% 5.4% 5.0% 5.4% This table presents the analyses of the daily loan repayment likelihood based on all the chasing calls made on Day 4, Day 16, Day 31, Day 61, and Day 91. The analyses are performed on the delinquent-borrower-day level. The dependent variable, Paid t, is an indicator variable equal to one if a borrower makes the repayment on the Day t, and zero otherwise. Day Zero is the due date of loan repayment. The tests are conducted in five six-day windows [1, 6], [13, 18], [28, 33], [58, 63], and [88, 93] after the due date. In Models 1 and 2, Chasing All is an indicator variable equal to one for days in windows [4, 6], [16, 18], [31, 33], [61, 63], and [91, 93], and zero otherwise. In Models 3 and 4, Chasing Day 4,16 is an indicator variable equal to one for days in windows [4, 6] and [16, 18], and zero otherwise, while Chasing Day 31,61,91 is an indicator variable equal to one for days in windows [31, 33], [61, 63], and [91, 93], and zero otherwise. Paid t is regressed on Chasing, Chasing × Digital Collateral Proxy (i.e., Contact or Address), controlling for the interactions between the Chasing dummies and other characteristics of loan and borrower, as well as the borrower and day fixed effects. The matched samples based on Contact (Address) consist of 330,624 (241,812) borrower-day observations from July 2017 to November 2019. The t-statistics shown in parentheses are based on standard errors adjusted for heteroskedasticity and borrower-level clustering. ***, **, * denote statistical significance at the 0.01, 0.05, and 0.10 levels, respectively. All the variables are defined in the Appendix A.

59
Table 8 Borrowers with Both or Either Contact and/or Address Information
Dependent Variable Paid t
Non-Overlapping Overlapping Full Sample (1) (2) (3) (4)
Chasing Day 4×Contact Only 2.567*** 1.933*** (3.625) (4.040) Chasing Day 4×Address Only 1.397** 2.371*** (2.186) (5.261) Chasing Day 4×Collateral Both 1.437*** 1.390*** (4.416) (4.273) Chasing Day 4×Amount -1.537* −1.416*** -1.749*** -1.632*** (−1.843) (−1.708) (-3.923) (-3.826) Chasing Day 4×Rate −19.441*** −19.945*** -11.942*** -15.162*** (−5.216) (−5.322) (-6.068) (-7.961) Chasing Day 4×Age 4.992*** 3.739*** 5.702*** 5.499*** (4.436) (3.244) (9.352) (9.535) Chasing Day 4×Gender −1.918** −1.614*** -2.172*** -2.105*** (−2.416) (−1.868) (-5.053) (-5.008) Chasing Day 4×Score 2.953** 2.752** 3.173*** 3.420*** (2.490) (2.353) (5.776) (6.355) Chasing Day 4 ×Wealth -0.213 0.043 -0.318*** -0.256*** (-1.283) (0.191) (-4.639) (-3.732) Chasing Day 4×History -0.075 -0.383 -0.184 -0.499 (-0.037) (-0.233) (0.247) (-0.693) Borrower Fixed Effect Yes Yes Yes Yes Day Fixed Effect Yes Yes Yes Yes Observations 34,968 36,288 184,008 255,264 R2ADJ 6.1% 6.2% 6.5% 6.8% This table presents the analyses of the daily loan repayment likelihood for subsamples with no overlapping on Contact and Address or fully sample, based on all the chasing call made on Day 4. The analyses are performed on the delinquent-borrower-day level. The dependent variable, Paid t, is an indicator variable equal to one if a borrower makes the repayment on the Day t, and zero otherwise. Day Zero is the due date of loan repayment. The tests are conducted in the full window [1, 6] after the due date. In Model 1 (Model 2), the matched sample includes borrowers in treatment group with only the information of Contact Number (Address Number). In Model 3, the matched sample includes borrowers in treatment group with the information of both Contact Number and Address Number. Model 4 uses a matched sample including borrowers in treatment group having at least one type of digital collateral. Chasing Day 4 is an indicator variable equal to one for days in windows [4, 6], and zero otherwise. Paid t is regressed on Chasing, Chasing × Digital Collateral Proxy (i.e., Contact, Address, or Collateral), controlling for the interactions between the Chasing dummies and other characteristics of loan and borrower, as well as the borrower and day fixed effects. In Models 1 and 2, the matched samples consist of 34,968 and 36,288 borrower-day observations from July 2017 to November 2019, respectively. In Model 4 (Model 3), the sample consists of 255,264 (184,008) observations. The t-statistics shown in parentheses are based on standard errors adjusted for heteroskedasticity and borrower-level clustering. ***, **, * denote statistical significance at the 0.01, 0.05, and 0.10 levels, respectively. All the variables are defined in the Appendix A.

60
Table 9 Economic Channels
Panel A: Economic Channel of Social Capital Dependent Variable Paid t Social Spending Veneration Ancestor
High Low High Low (1) (2) (3) (4)
Chasing Day 4×Contact 2.414*** 1.162*** 2.367*** 1.508** (5.775) (2.655) (5.967) (2.262)
Difference 1.252** 0.859** (2.069) (2.135)
Chasing Day 4×Amount -1.537* −1.416*** -2.087*** -1.444*** (−1.843) (−1.708) (-3.538) (-2.674) Chasing Day 4×Rate −19.441*** −19.945*** -9.125*** -18.231*** (−5.216) (−5.322) (-3.380) (-7.253) Chasing Day 4×Age 4.992*** 3.739*** 5.236*** 5.334*** (4.436) (3.244) (6.410) (6.829) Chasing Day 4×Gender −1.918** −1.614*** -1.712*** -1.484*** (−2.416) (−1.868) (-2.977) (-2.596) Chasing Day 4×Score 2.953** 2.752** 3.150*** 3.144*** (2.490) (2.353) (4.145) (3.973) Chasing Day 4×Wealth -0.213 0.043 -0.363*** -0.057 (-1.283) (0.191) (-3.406) (-0.362) Chasing Day 4×History -0.075 -0.383 0.283 -0.481 (-0.037) (-0.233) (0.306) (-0.514) Borrower Fixed Effect Yes Yes Yes Yes Day Fixed Effect Yes Yes Yes Yes Observations 91,764 83,568 101,832 73,482 R2ADJ 6.8% 6.8% 6.8% 6.8%

61
Table 9 (Continued)
Panel B: Economic Channel of Physical Location Dependent Variable Paid t Distance FinTech Litigation Confidence
Long Short High Low (1) (2) (3) (4)
Chasing Day 4×Address 2.557*** 0.881* 2.551*** 1.189** (5.413) (1.707) (5.156) (2.429)
Difference 1.676** 1.362** (2.394) (1.965)
Chasing Day 4×Amount -1.369** −1.679*** -1.334** -1.555** (−2.177) (−2.674) (-2.077) (-2.525) Chasing Day 4×Rate −16.819*** −16.982*** -18.477*** -16.856*** (−5.993) (−5.583) (-6.269) (-5.917) Chasing Day 4×Age 5.658*** 4.300*** 3.177*** 6.589*** (6.942) (4.969) (3.430) (8.107) Chasing Day 4×Gender −0.910 −1.535** -1.746*** -0.675 (−1.442) (−2.268) (-2.700) (-1.022) Chasing Day 4×Score 2.971*** 3.421*** 2.241*** 4.249*** (3.576) (3.596) (2.589) (4.681) Chasing Day 4×Wealth -0.017 -0.317* 0.040 -0.341** (-0.107) (-1.772) (0.237) (-1.999) Chasing Day 4×History -0.447 -1.181 -1.179 -0.150 (-0.488) (-1.078) (-1.92) (-0.150) Borrower Fixed Effect Yes Yes Yes Yes Day Fixed Effect Yes Yes Yes Yes Observations 65,124 54,804 60,456 59,184 R2ADJ 6.8% 6.5% 6.7% 6.5% This table presents the cross-analyses for the economic channels of social capital and physical location. The analyses are performed on the delinquent-borrower-day level. The dependent variable, Paid t, is an indicator variable equal to one if a borrower makes the repayment on the Day t, and zero otherwise. Day Zero is the due date of loan repayment. The tests are conducted in the full window [1, 6] after the due date. Day 4 is the date that the lender makes the first round of chasing calls for delinquent loans. Chasing Day 4 is an indicator variable equal to one for days in windows [4, 6], and zero otherwise. Paid t is regressed on Chasing, Chasing × Digital Collateral Proxy (i.e., Contact or Address), controlling for the interactions between the Chasing dummies and other characteristics of loan and borrower, as well as the borrower and day fixed effects. In Panel A, the subsample analyses are performed for the social capital channel based on Contact, and the sample is split by Social Spending and Veneration Ancestor. In Panel B, the subsample analyses are performed for the physical channel based on Address, and the sample is split by Distance FinTech and Litigation Confidence. The sample period spans from July 2017 to November 2019 and sample size varies across subsamples. The t-statistics shown in parentheses are based on standard errors adjusted for heteroskedasticity and borrower-level clustering. ***, **, * denote statistical significance at the 0.01, 0.05, and 0.10 levels, respectively. The differences in coefficients on Chasing × Digital Collateral Proxy are presented below the coefficients, with corresponding z-statistics reported in parentheses. All the variables are defined in the Appendix A.

62
Table 10 Repayment Amount for Delinquent Loans
Dependent Variable Repayment Ratio Repayment Complete (1) (2) (3) (4)
Contact 2.367*** 1.223*** (5.498) (3.487) Address 6.117*** 5.208*** (7.192) (9.672) Amount −7.523*** −7.711*** −5.964*** −6.133*** (−10.709) (−10.829) (−11.357) (−11.276) Rate 11.524*** 11.085*** −11.760*** −12.261*** (3.061) (2.860) (−3.430) (−3.538) Age −23.668*** −21.800*** −16.669*** −15.135*** (−11.834) (−11.206) (−11.379) (−10.272) Gender 4.683*** 4.522*** 5.188*** 5.044*** (6.581) (6.478) (9.722) (9.775) Score −9.806*** −9.338*** −8.765*** −8.342*** (−12.002) (−12.063) (−11.386) (−11.361) Wealth 1.005*** 0.780*** 1.038*** 0.843*** (10.248) (8.880) (14.487) (11.315) History 0.880 0.781 −0.009 −0.200 (0.967) (0.880) (−0.012) (−0.268) Province Fixed Effect Yes Yes Yes Yes Year Quarter Fixed Effect Yes Yes Yes Yes Observations 41,711 41,711 41,711 41,711 R2ADJ 3.8% 3.9% 2.9% 3.1% This table presents the analyses of the repayment amount for the delinquent loan. The analyses are performed on the loan level. In Models 1 and 2, the dependent variable, Repayment Ratio, is the ratio for the amount of repayment for the delinquent loan divided by the amount required to be paid by the due date. In Models 3 and 4, the dependent variable, Repayment Complete, is an indicator variable equal to one if a borrower makes the repayment for the amount equal to or greater than the delinquent amount, and zero otherwise. Repayment
Ratio and Repayment Complete are regressed on the Digital Collateral Proxy (i.e., Contact, or Address Number), controlling for other characteristics of loan and borrower, as well as the province and year fixed effects. The sample of delinquent loans consists of 41,711 observations from July 2017 to November 2019. The t-statistics shown in parentheses are based on standard errors adjusted for heteroskedasticity and province-level clustering. ***, **, * denote statistical significance at the 0.01, 0.05, and 0.10 levels, respectively. All the variables are defined in the Appendix A.

63
Table 11 Loan Delinquency Likelihood
Dependent Variable Delinquency (1) (2)
Contact 3.851*** (15.732) Address −0.848 (−1.652) Amount 5.089*** 5.124*** (7.788) (7.853) Rate 13.355*** 13.959*** (6.377) (6.862) Age −8.993*** −8.918*** (−7.152) (−6.688) Gender −4.097*** −4.042*** (−6.892) (−6.902) Score 11.412*** 11.223*** (16.788) (17.010) Wealth −1.857*** −1.807*** (−27.360) (−28.662) History 3.195*** 3.683***
(5.152) (6.218) Province Fixed Effect Yes Yes Year Quarter Fixed Effect Yes Yes Observations 97,783 97,783 R2ADJ 6.1% 6.0%
This table presents the analyses of the loan delinquency likelihood. The analyses are performed on the loan level. The dependent variable, Delinquency, is an indicator variable equal to one if a borrower fails to make the monthly loan payment by the due date for at least one time during the loan term, and zero otherwise. Delinquency is regressed on the Digital Collateral Proxy (i.e., Contact, or Address Number), controlling for other characteristics of loan and borrower, as well as the province and year fixed effects. The sample of loans consists of 97,783 observations from July 2017 to November 2019. The t-statistics shown in parentheses are based on standard errors adjusted for heteroskedasticity and province-level clustering. ***, **, * denote statistical significance at the 0.01, 0.05, and 0.10 levels, respectively. All the variables are defined in the Appendix A.

64
Table 12 Loan Approval
Dependent Variable Approval (1) (2)
Contact 0.974*** (3.167) Address 4.666*** (14.423) Amount −14.994*** −15.119*** (−20.758) (−20.931) Rate 107.984*** 107.514*** (18.402) (18.538) Age −7.820*** −6.317*** (−7.952) (−6.291) Gender 12.066*** 11.950*** (27.097) (27.367) Score −35.251*** −34.888*** (−95.932) (−97.897) Wealth 3.222*** 3.014*** (83.566) (82.717) History −9.259*** −9.482***
(−13.538) (−14.469) Province Fixed Effect Yes Yes Year Quarter Fixed Effect Yes Yes Observations 236,967 236,967 R2ADJ 13.2% 13.3%
This table presents the analyses of the loan approval likelihood. The analyses are performed at the loan application level. The dependent variable, Approval, is an indicator variable equal to one if a borrower’s local application is approved by the fintech lender, and zero otherwise. Approval is regressed on the Digital Collateral Proxy (i.e., Contact, or Address Number), controlling for other characteristics of loan and borrower, as well as the province and year fixed effects. The sample of loan applications consists of 236,967 observations from July 2017 to November 2019. The t-statistics shown in parentheses are based on standard errors adjusted for heteroskedasticity and province-level clustering. ***, **, * denote statistical significance at the 0.01, 0.05, and 0.10 levels, respectively. All the variables are defined in the Appendix A.

1
Internet Appendix (IA)
“Digital Footprints as Collateral for Debt Collection”
This online appendix provides additional tables for the paper, “Digital Footprints as Collateral
for Debt Collection.” We summarize the content as follows:
Table IA 1: Additional tests for the regulation on data privacy and protection
Table IA 2: Additional tests for the regulation in fintech lending market
Table IA 3: Additional tests for the role of digital collateral in financial inclusion

2
Table IA1 Tests for Data Privacy and Protection
Dependent Variable Paid t (1) (2)
Chasing Day 4×Contact 1.078*** (2.659) Chasing Day 4×Address 1.059*** (3.111) Chasing Day 4×Amount -2.044*** -1.591** (-3.382) (-2.215) Chasing Day 4×Rate 2.842 1.362 (1.022) (0.377) Chasing Day 4×Age 6.213*** 6.772*** (8.332) (7.917) Chasing Day 4×Gender -1.642*** -0.328 (-3.008) (-0.455) Chasing Day 4×Score 2.297*** 1.188 (3.274) (1.122) Chasing Day 4×Wealth -0.387*** -0.183 (-4.757) (-1.097) Chasing Day 4×History 0.091 -1.232 (0.120) (-1.097) Borrower Fixed Effect Yes Yes Day Fixed Effect Yes Yes Observations 101,688 54,780 R2ADJ 6.9% 6.2%
This table presents the additional tests for the change of regulation on data privacy and protection, focusing on the subsamples with the loan repayment due dates after the adoption of the China Internet Personal Information Security and Protection Guidelines on April 10, 2019. The analyses are performed at the delinquent-borrower-day level. The dependent variable, Paid t, is an indicator variable equal to one if a borrower makes the repayment on the Day t, and zero otherwise. Day zero is the due date of loan repayment. The tests are conducted in window [1, 6], where Day 4 is the date that the lender makes the first round of chasing calls for delinquent loans. Chasing Day 4 is an indicator variable equal to one for days in window [4, 6], and zero for window [1, 3]. The dependent variable, Paid t, is regressed on Chasing, Chasing × Digital Collateral Proxy (i.e., Contact or Address), controlling for the interactions between the Chasing dummy and other characteristics of loan and borrower, as well as the borrower and day fixed effects. The matched subsamples based on Contact and Address consist of 101,688 and 54,780 borrower-day observations from the adoption of the Guidelines to November 2019, respectively. The t-statistics shown in parentheses are based on standard errors adjusted for heteroskedasticity and borrower-level clustering. ***, **, * denote statistical significance at the 0.01, 0.05, and 0.10 levels, respectively. All the variables are defined in the Appendix A of the paper.
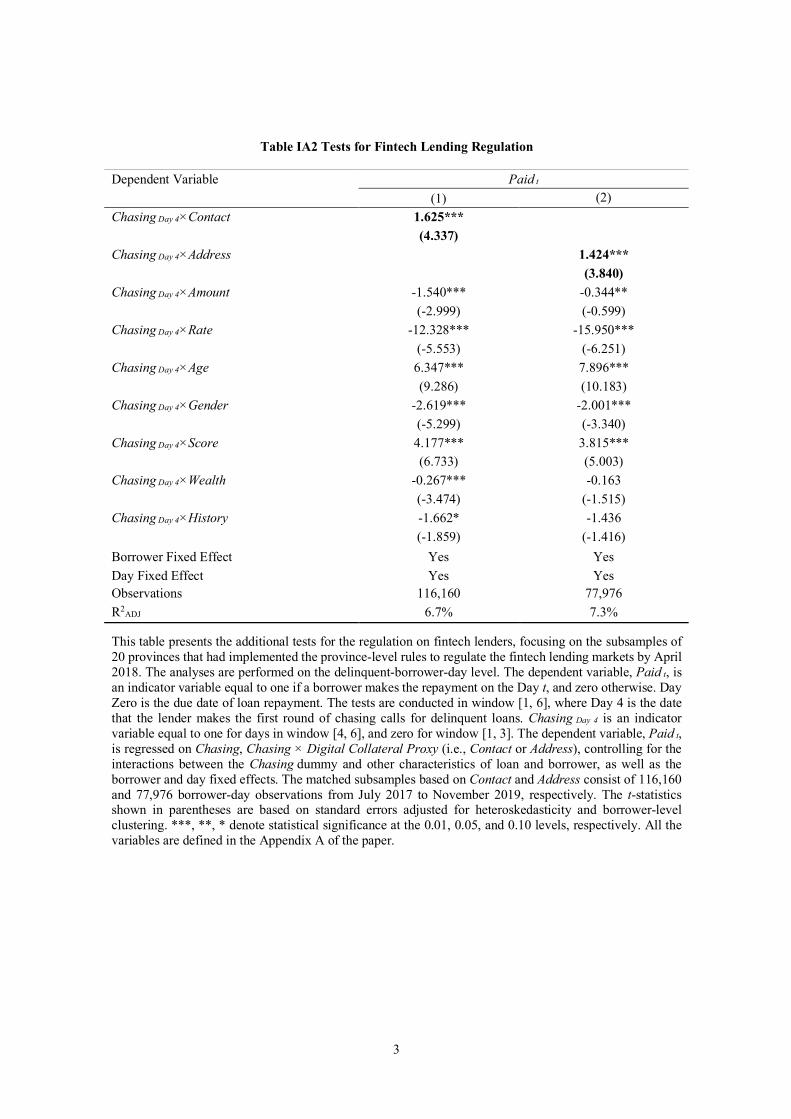
3
Table IA2 Tests for Fintech Lending Regulation
Dependent Variable Paid t (1) (2)
Chasing Day 4×Contact 1.625*** (4.337) Chasing Day 4×Address 1.424*** (3.840) Chasing Day 4×Amount -1.540*** -0.344** (-2.999) (-0.599) Chasing Day 4×Rate -12.328*** -15.950*** (-5.553) (-6.251) Chasing Day 4×Age 6.347*** 7.896*** (9.286) (10.183) Chasing Day 4×Gender -2.619*** -2.001*** (-5.299) (-3.340) Chasing Day 4×Score 4.177*** 3.815*** (6.733) (5.003) Chasing Day 4×Wealth -0.267*** -0.163 (-3.474) (-1.515) Chasing Day 4×History -1.662* -1.436 (-1.859) (-1.416) Borrower Fixed Effect Yes Yes Day Fixed Effect Yes Yes Observations 116,160 77,976 R2ADJ 6.7% 7.3%
This table presents the additional tests for the regulation on fintech lenders, focusing on the subsamples of 20 provinces that had implemented the province-level rules to regulate the fintech lending markets by April 2018. The analyses are performed on the delinquent-borrower-day level. The dependent variable, Paid t, is an indicator variable equal to one if a borrower makes the repayment on the Day t, and zero otherwise. Day Zero is the due date of loan repayment. The tests are conducted in window [1, 6], where Day 4 is the date that the lender makes the first round of chasing calls for delinquent loans. Chasing Day 4 is an indicator variable equal to one for days in window [4, 6], and zero for window [1, 3]. The dependent variable, Paid t, is regressed on Chasing, Chasing × Digital Collateral Proxy (i.e., Contact or Address), controlling for the interactions between the Chasing dummy and other characteristics of loan and borrower, as well as the borrower and day fixed effects. The matched subsamples based on Contact and Address consist of 116,160 and 77,976 borrower-day observations from July 2017 to November 2019, respectively. The t-statistics shown in parentheses are based on standard errors adjusted for heteroskedasticity and borrower-level clustering. ***, **, * denote statistical significance at the 0.01, 0.05, and 0.10 levels, respectively. All the variables are defined in the Appendix A of the paper.

4
Table IA3 Tests for Financial Inclusion
Dependent Variable Approval (1) (2)
Contact 1.748*** (6.342) Address 7.303*** (15.586) Amount −15.064*** −15.180*** (−20.347) (−20.330) Rate 79.102*** 82.348*** (17.984) (18.389) Age −7.909*** −5.654*** (−6.447) (−4.478) Gender 11.748*** 11.567*** (20.906) (21.774) Score −34.254*** −33.597*** (−58.232) (−61.108) Wealth 3.303*** 2.932*** (56.082) (73.669) History −10.933*** −10.797*** (−11.234) (−11.423) Province Fixed Effect Yes Yes Year Quarter Fixed Effect Yes Yes Observations 118,484 118,484 R2ADJ 12.4% 12.8%
This table presents the additional tests for the role of digital collateral in financial inclusion, focusing on the subsamples of loan applicants with low creditworthiness as indicated by their credit risk scores. The analyses are performed on the loan application level. The dependent variable, Approval, is an indicator variable equal to one if a borrower’s local application is approved by the fintech lender, and zero otherwise. Approval is regressed on the Digital Collateral Proxy (i.e., Contact, or Address Number), controlling for other characteristics of loan and borrower, as well as the province and year fixed effects. The subsample of loan applications consists of 118,484 observations from July 2017 to November 2019. The t-statistics shown in parentheses are based on standard errors adjusted for heteroskedasticity and province-level clustering. ***, **, * denote statistical significance at the 0.01, 0.05, and 0.10 levels, respectively. All the variables are defined in the Appendix A of the paper.