digital image processing based on line control and … · 6.1 determination of vibration 89 6.2...
TRANSCRIPT

1
DIGITAL IMAGE PROCESSING BASED ON LINE CONTROL AND MONITORING
Thesis submitted in partial fulfillment for the award of
Degree of Doctor of Philosophy in
Electronics and communication Engineering
By
RAJAPPAN. K
(Reg No M 698700004)
UNDER THE GUIDANCE OF
PROF. DR. R S D WAHIDA BANU
PRINCIPAL, GOVT. COLLEGE OF ENGINEERING, SALEM
FACULTY OF ENGINEERING AND TECHNOLOGY
VINAYAKA MISSIONS RESEARCH FOUNDATION DEEMED UNIVERSITY
(VINAYAKA MISSIONS UNIVERSITY)
SALEM – 636 308
DEC – 2014

2
CERTIFICATE
I, supervisor Dr.R.S.D. Wahidabanu Ph.D. certify that the thesis entitled “Digital Image
Processing based online control and monitoring” submitted for the award of Degree of Doctor of
Philosophy by Mr. Rajappan K is the record of research work carried out by him during the period
from 2008 – 2014 under my guidance and supervision. I also certify that this work has not formed the
basis for the award of any other degree, diploma, associate, fellowship or any other similar titles in this
University or Institution of higher learning.
Place: Date: Dr. R.S.D. WAHIDABANU (Guide and Supervisor)
Principal, Government College of Engineering, Salem.

3
DECLARATION
I, Rajappan. K declare that the thesis entitled “Digital Image Processing based online control
and monitoring” submitted by me for the award of Degree of Doctor of Philosophy is the record of
research work carried out by me during the period from 2008 – 2014 under the guidance of
Dr. R.S.D. Wahidabanu Ph.D., Principal, Govt. College of Engineering, Salem and has not formed
the basis for the award of any other degree, diploma, associate, fellowship or any other similar titles in
this University or Institution of higher learning.
Place: Date: (RAJAPPAN.K)

4
ABSTRACT
In Process industries, based upon geographic distribution of plant instrumentation, SCADA
(Supervisory control and data Acquisition system) or DCS (Distributed Control System) with real time
operating system are established.
The various parameters in a process plant to be monitored are pressure, flow, level, speed,
displacement, temperature, etc. Sensors are to be installed at hundreds of locations in the remote field
and the measured values are brought to the operator station. These signals are basically analog signals.
Hence these signals are converted to digital signals and fed to the computer for engineering unit
conversion through linear interpolation method for limit checking and generating alarms. Control
signals are subsequently generated for effective monitoring of the plant. Along with sensors
conventional cameras are installed at remote field site and the field images are viewed through Close
Circuit Televisions (CCTV) at the operator station.
The drawbacks in this environment are: a) Analog signals transmission from sensors to operator
station is error prone due to noise induction, b) Sensors do require calibration repeatedly, c) Sensors
exhibit the character of hysterics, d) Human errors in identifying the field images through CCTVs
related to a particular sensor in plant area may yield to generate wrong control signals.
In the recent days digital cameras are installed at field site and remote field images are directly
fed to the computer monitor instead of separate CCTVs. Both field images and sensor values are
available in the same computer monitor but the images are not used for any processing purpose.
Control and Monitoring is done using sensor signals only, which are error prone.

5
To overcome these hurdles a new research work is broughtforth to use digital images for control
sand monitoring. Digital image processing based control & monitoring is the technology used in this
work. As a first phase, digital cameras are installed at remote locations for monitoring each parameter.
As a second phase, the advanced cost effective digital cameras take photos of site locations and
forward the digital images to the computer at the operator station. Progressive image transmission
method is employed. Suitable image compression techniques are used. UDP protocol is used for high
latency.
As a third phase, the incoming digital field images are directly fed to the digital computer. The
DSP processor compares the incoming field images with already stored standard images of the
parameters (photographs) like various levels, speeds, etc.
As a fourth phase, control signals are generated when the standard image matches the incoming
image. PLCs do the control action. The image taken from the digital camera is stored in PC as JPEG
file format, which is a commonly used method of lossy compression for digital images.
For comparing the current photographed image with the standard image a suitable algorithm
namely distance matrix algorithm is used. This algorithm is simulated with powerful tool called
Matlab. By this method of parameter measurement, a mean absolute error of 0.13573% is achieved
compared to conventional method with mean absolute error 5.2%. Responsive time is increased from
45 ms to 11 ms for control action. Accuracy is increased from 85% to 96%.
The system gives real time display of various field images superimposing on the animated
mimic diagrams in the computer monitor, which is not possible earlier. Experiments are carried out for
control and monitoring level, pressure, moisture, vibration, pollution, displacement parameters and
simulated results are produced using digital cameras along with sensors like thermocouple, RTDs,
strain gauges, LVDT, etc.,

6
First and foremost, I thank from the depths of my heart Lord Jesus Christ my wonderful Saviour
and Lord God Almighty.
I am profoundly grateful to my supervisor Dr. R.S.D. Wahidabanu Ph.D., Principal,
Government College of Engineering, Salem for her invaluable guidance. Her kindness, gentleness
and patience enabled me a great deal to execute this research and put me at ease to overcome all
obstacles in the path.
I express my deep sense of gratitude to Dr. V.R.R. Rajendran Ph.D., Vice Chancellor and
Dr. K. Rajendran Ph.D., Dean (Research) Vinayaka Missions University for their continued
support to finish my research work.
I thank Dr. Nagappan, Principal, Vinayaka Missions, Engineering College, Seeragapadi,
Salem for his unending co-operation in executing my research activities.
I thank Prof. Justin Diraviam, Sardar Raja Engineering College, Thirunelveli who has spent
his valuable time right from the beginning to bring this entire thesis with valuable ideas and suggestion.
I thank my wife and children for their accompanied assistance to reach my target.
Place: (RAJAPPAN. K) Date:
Acknowledgement

7
CHAPTER
NO. TITLE PAGE NO.
ABSTRACT iv LIST OF TABLES x LIST OF FIGURES xi LIST OF SYMBOLS AND ABBREVIATIONS xiii 1 INTRODUCTION 1 1.1 Input characteristics of analog sensors 3 1.2 Transfer characteristics of analog sensors 4 1.3 Factors influencing the choice of transducers 5 1.4 Research problem and solution 6 1.4.1 Gross errors 6 1.4.2 Systematic errors 7 1.4.3 Random errors 7 1.4.4 Error Analysis 8 1.4.4.1 Arithmetic Error 8 1.4.4.2 Median 9 1.4.4.3 Mode 10 1.4.4.4 Probability of Error 10 1.4.4.5 Normal Distribution of Error 10 1.4.4.6 Probable Error 12 1.4.4.7 Limiting of Error 13 1.4.4.8 Odds in Specification 13 1.4.5 Errors in Transmitting analog signals from
analog sensors 14
1.4.5.1 Digital Vs. Signals 14 1.4.5.2 Analog Wave Forms 14 1.4.5.3 Digital Wave Forms 16 1.5 Summary 18 1.5.1 Control action- Previous method: 19 1.5.2 Control action – Existing method: 19 1.5.3 Control action – Proposed method - Aim : 20 2 REVIEW OF LITERATURE 22 2.1 Review of Literature 23 2.2 Principles of Image Integration 24 2.3 Background Study 24 2.3.1 Distance measurement using a single camera 28
TABLE OF CONTENTS t

8
2.3.2 Distance measurement using non-metric camera 29 2.4 Vision based distance measurement system 30 2.5 Liquid level measurement using a single camera 31 2.6 Process control system 32 2.7 Key control components 33 2.8 Process control system security 36 2.9 Programmable logic controller 37 2.10 3D Printing 37 3 NEED FOR THE STUDY AND OBJECTIVES 41 3.1 Need for the study 42 3.2 Objectives 43 3.3 Overview of the thesis 45 3.4 Organization of the thesis 47 4 METHODOLOGY ( TOOLS USED) 48 4.1 Hardware Setup 50 4.1.1 The control system structure 50 4.1.2 Modifications to the existing system 51 4.1.3 Operator station 51 4.1.4 Image capturing unit 52 4.1.5 Color video camera 53 4.1.6 Ethernet switches 53 4.2 Software Setup 54 4.2.1 Smartision screen copy 54 4.2.2 PLC program 55 4.2.3 Mimic component 56 4.2.4 Mat lab program 57 4.2.5 Transport protocols 57 5 METHODOLOGY (PROCEDURE) 61 5.1 Progressive Image Transmission 62 5.2 Point-to-point, multicast transmission 62 5.3 Constant-bit-rate / variable-bit-rate channel 63 5.4 Image compression 63 5.5 Compression standards 65 5.6 Video delivery via streaming 66 5.7 Data transfer through variable bandwidths 67 5.8 The need for rate control 68 5.9 Rate control for streaming media 68 5.10 Streaming media over rate- controlled UDP 68 5.11 Meeting transmission bandwidth constraints 68 5.11.1 Transcoding 69

9
5.12 Progressive image transmission interface 70 5.13 Attention model based ROI extraction 72 5.14 ROI extraction 73 5.15 Progressive image coding & JPEG2000 architecture 73 5.16 ROI coding 74
5.17 System Description 76 5.17.1 Image acquisition 79 5.18 Software Description 80 5.18.1 Real Time Field Image Processing 81 5.18.2 Process Animation Display 81 5.18.3 Command generation 85 6 RESULTS AND DISCUSSION 87 6.1 Determination of Vibration 89 6.2 Determination of critical speed 89 6.3 Whirling of Shaft rotation speed 90 6.4 Determination of Turbine/generator Speed 93 6.5 Control of Displacement 95 6.6 Moisture level 97 6.7 Drip irrigation 101 6.8 Lead placement in pencil 103 6.9 Oil density adulteration 104 6.10 Measurement of pollution 106 6.11 Measurement of pressure 106 6.12 Liquid level control 107 6.13 Test to Verify the Liquid Level 109 6.14 Summary 111 7 CONCLUSIONS& FUTURE WORK 115 7.1 Scope of Future Work 122 8 REFERENCE 125 LIST OF PUBLICATIONS 134

10
LIST OF TABLES
TABLE NO. TITLE PAGE NO.
1 Ten observations of pressure 9
2 Frequency Distribution 10
3 Tabulation of temperature readings 11
4 Video coding standard 66
5 Comparison of Image Acquisition sensors 79
6 Amiast File Format 82
7 Data file Format 83
8 Configuration File Format 83
9 Value of δ after image comparison algorithm 94
10 Value of δ after proposed algorithm and its result 100
11 value of δ after proposed algorithm and its actions 103
12 True liquid level, measured liquid level and its error 110
13 Image comparison speed analysis 113
14 Performance of proposed method 113

11
LIST OF FIGURES
FIGURE NO. TITLE PAGE NO.
1 Histogram showing the frequency of occurrence 12
2 Probable error curve 12
3 Analog signal 15
4 Analog signal after transmission 15
5 Digital waveform 16
6 Digital waveform after transmission 16
7 Key control monitoring system components 35
7 a Hardware setup 49
8 Video encoding scheme 62
9 Maxshift with layer progressive ordering 75
10 MAR ROI coding method 78
11 Network diagram 78
12 Experiment set up for determination of critical speed
89
13 Standard image 90
14 current image 90
15 Experimental set up for whirling shaft 91
16 Incoming image 92
17 Standard image 92

12
18 Experimental set up to measure the speed 93
19 Fully opened 96
20 Fully closed 97
21 Partially closed 97
22 The test environment to measure moisture 99
23 Dry soil 102
24 Wet soil 102
25 Incorrect position of the lead 104
26 Centre position of other lead 104
27 Impure oil 105
28 Pure oil 105
29 Carbon Content 106
30 Door Closure 107
31 Door Opening 107
32 Test Setup to measure Liquid level 108
33 Test setup to Verify the Liquid level 109
34 True liquid level versus measured liquid level 111

13
LIST OF SYMBOLS AND ABBREVIATIONS
A/D Analog to Digital CCD Charge Coupled Device
CCTV Close Circuit Television CBR Constant Bit Rate CMS Central Monitoring System D/A Digital to Analog DCS Distributed Control System DDE Dynamic Data Exchange DIP Digital Image Processing DSP Digital Signal Processing EMI Electro Magnetic Interference FBK Function Block
FELICS Fast Efficient Lossless Image Compression FGPA Field Gate Programmable Array Gbps Giga bits per second GUI Graphical User Interface HMI Human Machine Interface I EEE Institution of Electrical & Electronic Engineers
I/O Input Output
IBM International Business Machines ISRO Indian Space Research Organization LAN Local Area Network LCD Liquid Crystal Display
LVDT Linear Variable Detector Transformer MAR Most Appropriate Solution PIT Progressive Image Transmission PLC Programmable Logic Controller QoS Quality of Service
RAM Random Access Memory ROI Region of Interest RTD Resistance Temperature Detector
SCADA Supervisory Control and Data STL Statement List Programming
TCP/IP Transmission Control Protocol/Internet Protocol TPS Thermal Power Station TV Television
UDP User Datagram Protocal UUV Unmanned Under water Vehicle

14
CHAPTER-1
INTRODUCTION

15
INTRODUCTION
The majority of the industrial plants are harmful to nature. The technical advance in Electronics,
Information technology, Image processing and industrial computers resulted in the progress of remote
control and observing the plants. Remote operation field requires relatively a good amount of
instrumentation support for control and monitoring purposes. At this time, plant size has cultivated
larger which needs control of many parameters like flow, level, pressure, speed, temperature,
displacement, vibration, etc.,
In Process industries, based upon geographic distribution of plant instrumentation, SCADA
(Supervisory control and data Acquisition system) or DCS (distributed Control System) with real time
operating system are established. Linear interpolation method is applied, and limit checking before
generating report/control signal for corrective action is prepared for the signals from sensors, which
have to go through signal conditioning, A/D conversion, engineering unit conversion. The Generation
of D/A conversion signal from the SCADA/DCS for actuating the elements make the remedial action
conceivable.
Sensors like RTD, Thermocouple, strain gauges, tachometer, LVDTs etc., produce analog
signals. Faults in these sensors are inclined to happen. Getting accurate results are not possible from
now. Therefore many correcting methods are to be applied. In the past days, when the plant size was
smaller, isolated field images are brought to operation station to show through separate TVs. This is
since the cameras employed were conventional analog cameras which can never be linked to Real time
computers, as computer operate only with digital signals. This TV images provide only information
about the plants to view by the operators and site engineers however could not be used for any real
purpose. Control action is to be started physically.

16
Digital cameras are installed instead of analog cameras at the moment. Instead of detach TVs,
these digital camera signals (images) are given to the real time computer directly and inspected in the
computer monitor itself. Analog sensors are employed to bring measured variables of dissimilar
parameters to the control station. Manual intervention is decreased as the field images are furthermore
obtainable in the computer monitor itself along with physical parameter values got from analog sensors
after signal conditioning. Due to analog sensors signal transmission error, this method is not that
dependable because of sensors frequent calibration requirement, hysteresis condition existing in
sensors etc., Digital Image Processing based on line monitoring and control of various physical
parameters like level, speed, moisture and displacement leads
To develop integration of Data Acquisition System through Digital Image Processing.
To avoid analog errors such as gross error, systematic errors and random errors which are
encountered while using sensors?
To avoid hysteresis effect and calibration problem of analog sensors frequently.
To have reliable selection of field image, control and monitoring to be integrated along
real time field image processing.
1.1 INPUT CHARACTERISTICS OF ANALOG SENSORS
The primary consideration for the option of a transducer is the input quantity which is going to
be calculated and its operation range. A physical quantity may be calculated through use of a number
of transducers. The upper limit is determined by the transducer capability whereas the lower limit of
range is usually found out by the transducer fault or by the unavoidable noise origination in the
transducer. Moreover the transducer should keep up a good resolution during its operating range.
Ideally a transducer should hold no loading effect on the input quantity being calculated. The

17
magnitude of the loading effects can be conveyed in terms of force, power or energy extorted from the
quantity under measurement for quantity under measurement of working of the transducer. Hence, the
transducer that is chosen for a particular application should ideally extract no force, power or energy
form the quantity under measurement so that the latter is measured precisely.
1.2 TRANSFER CHARACTERISTICS OF ANALOG SENSORS
The transfer features of transducers need attention of transfer function, error and response of
transducer to environmental influences. The transfer function of a transducer describes a relationship
among the input quantity and the output. In common, the sensitivity of transducer is not stable however
is reliant upon the quantity.
Sensitivity error happens where the examined output moves away from the correct value by an
invariable value; non-conformity relates to case in which the experimentally attained transfer function
departs from the theoretical transfer function for nearly every input.
The output of a transducer is with Hysteresis effect which not only depends upon the input
quantity however furthermore upon input quantities formerly applied to it. Hence, a dissimilar output is
attained when the similar value of input quantity is used depending upon whether it is increasing or
decreasing.
The concert of the transducer is completely identified by its transfer function and errors, offered
that the transducer is in regular environments and not subject to any commotions like stray
electromagnetic and electrostatic fields, mechanical shocks and vibrations temperature changes,
pressure and humidity change, changes in supply voltage and inappropriate mechanical mountings. If
transducers are focused to the above environmental disorders and sufficient safety measures are not
taken, errors do happen in measurement.

18
1.3 FACTORS INFLUENCING THE CHOICE OF TRANSDUCERS
On the basis of operating code, the transducers are many times chosen. Resistive, inductive,
capacitive, optoelectronics and piezoelectric are the operating codes employed. The transducer must be
perceptive enough to create measurable output. The transducer should uphold the range necessities and
have an excellent resolution over its complete range. The rating to the transducer should be enough in
order that it does not break down while functioning in its précised operating range. High degree of
precision is declared if the transducer does not need repeated calibration and has a petite value for
repeatability. It may be highlighted that in most industrial applications, repeatability is of significantly
more meaning than total precision. When calculating mechanical quantities an extra factor is to be
taken into report.
The transducer should support the anticipated input-output relationship as described by its
transfer function with the intention of keeping away from faults. The transducer should convene the
wanted time domain requirements like peak overshoot, rise time, settling time and small dynamic
mistake. In order to stay away from loading effects, the transducer should have high input impedance
and low output impedance. It should be declared that the transducer chosen to work under particular
environmental conditions keeps its input-output relationship and does not break down. The transducer
should be plainly sensitive to discarded signals and highly sensitive to most wanted signals.
While choosing a proper transducer the ruggedness both of mechanical and electrical intensities
of transducer against its size and weight must be reflected on. The electrical features that require
consideration while choosing a transducer comprise the length and type of cable necessary. During its
operation and storage life, the transducer should show a high degree of constancy to be active. Away
from each other from low static error, the transducers should contain a low non-linearity, low
hysteresis, high resolution and a high degree of repeatability.

19
1.4 RESEARCH PROBLEM AND SOLUTION
In analog sensors, measurement can never be made without mistakes as conversed. These
mistakes can be merely minimized but not removed totally. It is necessary to make out the dissimilar
mistakes that can probably enter into the measurement.
The errors can be classified into three categories:
Gross errors
Systematic errors
Random errors
1.4.1 Gross Errors
Gross errors are mostly due to human factors such as misreading of instruments, incorrect
adjustment and improper application of instruments. The computational mistakes are moreover
collected under these type mistakes.
Gross errors will certainly be assigned when human beings are occupied in measurement. In
analog meters, absolute removal of gross errors is perhaps unfeasible. This error is approximately
eradicated in auto ranging digital meters. One frequent gross error regularly encountered in
measurement work engages the inappropriate choice of the instrument. The input impedance of the
voltmeter selected should be at least 10 times greater than the output impedance of the measuring
circuit when a voltmeter is applied to measure the potential difference across two points in a circuit.
When the output impedance of a circuit is usually not known before hand, the choice of the voltmeter
may not be made suitably, leading to a gross error.

20
1.4.2 Systematic Errors
Due to faults of the instrument and changes in external conditions, Systematic errors are found
affecting the measurement. These are categorized into two categories.
Instrumental errors
Environmental errors
Instrumental errors happen out of the changes in the properties of the elements employed in the
instrument. By regulating the instrument regularly, this can be evaded.
Environmental faults are discovered due to the modifications in the environmental conditions
such as temperature, humidity, pressure, electrostatic and magnetic fields. For example, the resistance
of a strain gauge varies with difference in temperature. These faults can be decreased by controlling the
environmental conditions in the laboratory. In an industrial atmosphere, it is tough to have a controlled
environment on the other hand.
Systematic errors can furthermore be separated into static and dynamic errors. By the
restrictions of the measuring device or the assumption in the physical laws governing its behavior,
Static errors are caused. By the instrument‟s slow reaction Dynamic errors are caused in following the
alters in the calculated variable.
Systematic faults have particular magnitude and direction. These are normally more taxing as
repeated measurement may not uncover them.
1.4.3. Random Errors
Random errors are changeable errors and take place even when all systematic errors are reported
for. Even though the instrument is applied under controlled environmental and precisely pre-calibrated
condition before measurement, it will be found that the readings differ a little over a period of

21
examination. Without specified investigation, this change can never be corrected by any method and it
can never be made clear. These errors can be decreased by taking more number of readings and by
means of statistical methods to attain the best approximation of the true value on the other hand.
1.4.4 Error Analysis
For acquiring the possible true value of the measured quantity, the analysis of the measurement
data is essential. With a definite amount of vagueness any measurement is related. The systematic
manner of stating this vagueness is the statistical method. In order to make statistical methods and
explanation meaningful a large number of measurements are frequently necessary. Moreover the
systematic errors should be petite compared with arbitrary errors, since statistical treatment of data can
never take out a fixed bias enclosed in all the measurements.
Using a Bourdon gauge, 10 readings are taken over a period of time when fluid pressure in a
container is to be calculated. Each of these 10 readings may be dissimilar from the others. One will be
surprising which one of these is the accurate reading. The statistical methods will present the most
apparent true value of the pressure. Terms like arithmetic mean, deviation, mode and median are
applied by the statistical methods which are clarified below.
1.4.4.1 Arithmetic Error
The most reasonable value of a measured variable is the arithmetic mean of the number of
readings obtained.
Example:
In an experiment, ten observations of pressure are made which are given in table 1.

22
Table 1: Ten observations of Pressure
Trial No. 1 2 3 4 5
Scale reading
(K Pa) 10.02 10.20 10.26 10.20 10.22
Trial No. 6 7 8 9 10
Scale reading
(K Pa) 10.13 9.97 10.12 10.09 9.90
Arithmetic mean is found out as follows.
1.4.4.2 Median
Median is furthermore applied to point out the most probable value of the measured quantity
when a set of readings are taken. The middle value of the set is taken as the median when the readings
are placed in the ascending or descending order of magnitude. For instance, the temperature of a bath is
noted down by eleven observers as follows.
66.50C, 63.80C, 65.70C, 66.10C, 64.80C, 67.00C, 65.30C, 63.90C, 64.40C, 65.90C, 66.50C
It is rearranged in the ascending order as follows
63.80C, 63.90C, 64.40C, 64.80C, 65.30C, 65.70C, 65.90C, 66.10C, 66.50C, 66.50C, 67.00C
Now the median is the sixth reading, ie. 65.70C.

23
1.4.4.3 Mode
In a set of observations, Mode is the value which takes place most often and around which other
items of the set cluster tightly. For instance, the frequency distribution of a set of 101 observations is
specified in Table 2 as follows.
Table 2: Frequency Distribution
Pressure reading KPa 50 51 52 53 54 55 56 57
No. of Readings 4 9 16 25 22 15 7 3
The value of pressure reading related to maximum number of occurrences is 53KPa, therefore
mode is 53 KPa.
1.4.4.4 Probability of Errors
By the very nature of the arbitrary mistakes, the vagueness related with any measurement can
never be predetermined. Using statistical error study, only the probable fault can be précised. In the
subsequent sections, a few of the statistical methods of analyzing the faults are conversed.
1.4.4.5 Normal Distribution of Errors
For an enhanced, visual appeal and quick understanding of information the measurement data
can be pictorially symbolized by a histogram. In a measurement, histogram is a bar graph display of the
number of occurrences of a specific observed value. For instance, 60 temperature readings were
acquired over a small period of time and tabulated as demonstrated in table 2. As illustrated in figure 1,
the histogram is plotted by taking temperature reading of the number of occurrences in the Y-axis.

24
Figure 1 explains that the largest number of readings come about distributed more or less
symmetrically on either side of the middle. If more readings were taken, the distribution of observation
would have stayed behind symmetric about the central value. The outline of the histogram would turn
out to be a smooth curve as demonstrated by the broken line in figure 1 with increased number of
observations taken with high resolution meters. The Gaussian curve is the bell shaped broken line
curve. One may utter with assurance if the curve is sharp that the most feasible true value is the central
value.
Table 3: Tabulation of temperature readings
Temperature reading (deg. C) Number of readings
78.5 2
79.0 5
79.5 12
80.0 22
80.5 14
81.0 4
81.5 1
60

25
0
5
10
15
20
25
78.5 79 79.5 80 80.5 81 81.5 82N
o. o
f O
ccur
renc
es
TEMP C
Figure 1: Histogram showing the frequency of occurrence.
1.4.4.6 Probable Error
Due to random fault, it is quite frequently constructive to state the probable error in a
measurement. If the Central value of a Gaussian curve is believed as the true value, then error V,
number of occurrences in the measurement can be plotted as demonstrated in figure 2.
Figure 2: Probable Error Curve
It is found that about 68% of the total numbers of observations have mistakes lying with in ±
for a Gaussian distribution of data. It is furthermore found that about 50% of the total number of
observations has mistakes lying inside ± 0.6745 and this is taken as the probable value of error since
Region of probable error
2σ σ 0.645σ 0.645σ σ 2σ Error (-) Error (+)
No. of occurrences

26
there is an even possibility for any one observation to have a arbitrary error more than this value.
Therefore probable error, r = ± 0.6745.
1.4.4.7 Limiting Error
The accuracy of a measuring instrument is frequently specified for different values of reading,
by its manufacturer as a percentage error. The percentage error for different values of readings taken
will be more than the percentage précised on the other hand. The limiting error is termed as the
maximum variation in the reading. For instance, the precision of a 0-150∘C thermometer is précised as
± 1 % of full scale reading. The limiting mistake of this thermometer is ± 1.5∘C. Thus, when the
thermometer reads 60∘C, the maximum possible variation is ± 1.5∘C and the percentage error at this
reading is ± 1.5/ 60 x 100 = ± 1.5∘C. Guarantee error is called as Limiting error.
1.4.4.8 Odds in Specification
The arrangement of limiting mistake is in itself unsure since the manufacturer himself is not
certain about the precision because of the presence of random errors. Kilns and McClintoch have
suggested specifying certain odds for the uncertainty in order to add a more specification of the
uncertainty in a measurement. For instance, a temperature reading may be expressed as,
T = 1100C± 1.50C (20 to 1)
This means that, if 21 readings are taken, one reading is likely to have a fault more than ± 1.50C.
The relation between probability of occurrence and odds is specified by Odds/ (odds+1) = probability
of occurrence. Table 4 presents the relation between deviation, probability and odds. Where, is
the standard deviation.
27
1.4.5 Errors in Transmitting Analog Signals from Analog Sensors
1.4.5.1 Digital Vs Analog Signal
Analog signals are produced by Analog sensors. Digital Cameras create digital signals.
Nowadays, almost all electronic tools are digitized. The main explanation for the change from analog
to digital is since digital signals are easier to convey and are as well more dependable. This is
demonstrated by the images beneath.
Clear and uncomplicated, a signal is the transmission of data as per Nyquist H (1928). During
the duration of our lives, we deal with signals always. We work together with signals from music,
power lines, telephones, and cellular tools. This means the utilization of antennas, satellites, and of
course wires. In “Computer land” signals are very significant. Anyone who employs a computer should
discern how the machine changes data into signals that other computers and devices can recognize.
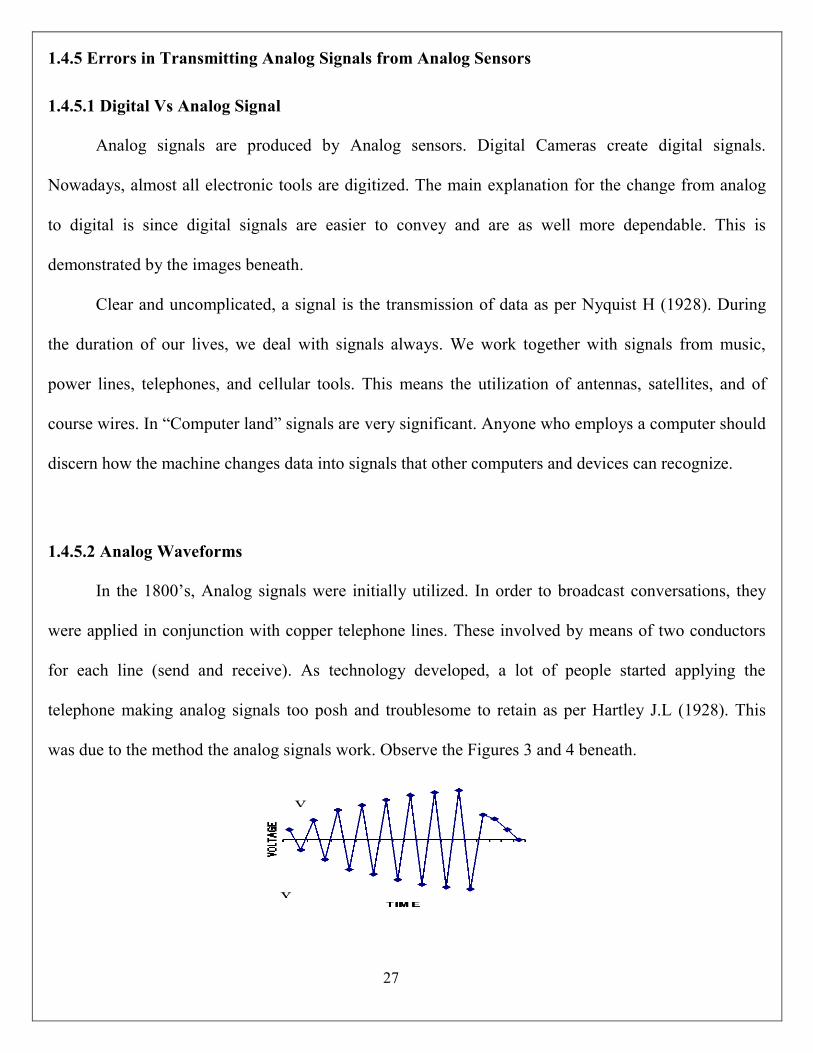
1.4.5.2 Analog Waveforms
In the 1800‟s, Analog signals were initially utilized. In order to broadcast conversations, they
were applied in conjunction with copper telephone lines. These involved by means of two conductors
for each line (send and receive). As technology developed, a lot of people started applying the
telephone making analog signals too posh and troublesome to retain as per Hartley J.L (1928). This
was due to the method the analog signals work. Observe the Figures 3 and 4 beneath.
X
Y

28
Figure 3: Analog Signal
The figure 3 shows the minimum and maximum value of voltage for the signal to travel clearly.
Figure 4: Analog Signal after Transmission
Now discern that the signals have chooses up “noise”. As per Kotelinikov (1947), Noise is just
an unnecessary electrical or electromagnetic energy that humiliates the quality of a signal. The signal
level crosses over the X and Y limits and has currently turned out to be degraded and rigid for the
device on the receiving to understand. Noise is now and then called “distortion” or “clipping”.
As per Proakis J.G et al (2003), definite factor will add more “noise” to the signal as signals
travel across a wire. These factors can comprise air conditioning units, fluorescent lights and magnetic
fields. There are techniques of sorting out or “filtering” noise from analog signals. Though, most of
these techniques are not precise and furthermore tools are required to change the signals from analog to
X
Y
X
Y

29
digital and back to analog. For these explanations, as per Proakis J (1995), the employ of digital
signaling offers an enhanced delivery method.
1.4.5.3 Digital Waveforms
As per Shannon C.E (1948), the physics of digital signals are dissimilar than analog signals as
they are separate waveforms. There is a limit on how high the voltage will increase or decrease
between the minimum X and the maximum Y. The subsequent Figures 5 and 6 are considered here.
Figure 5: Digital Waveform
It is observed that the signal takes 2 basic forms on (with a value of 1) and off (with a value of
0) and the signal is very unchanging in composition.
Figure 6: Digital Waveform after Transmission
TIME X
VO
LTA
GE
Y
NOISE
VO
LTA
GE
Y
TIME X
NOISE

30
Consequently, the major advantage of digital over analog is observed. As the signal is very
reliable, noise has not strictly adapted its shape or amplitude. The digital signal shows a far less change
to the real waveform than the previous analog signals. To send and receive data, Computers employ
digital signals. Even though digital signals can only be in the state 1 (on) and 0 (off), complex
combinations of these two values are applied to send / receive data as per Wicker .N et al (1995).
Currently, the potency of employing a digital system over analog is obvious. As per Clark G.C
et al (1981), Digital signals are easier to broadcast and present less room for mistakes to take place.
This leads to precise data transmission that in turn leads to quicker transmission rates and improved
productivity.
Analog sensors produce analog signals. Digital signals are created by Digital Cameras. At
present, almost all electronic appliances are digitized. The most important reason for the transform
from analog to digital is since digital signals are easier to broadcast and are as well more dependable.
Analog signals are created by sensors like RTDs, Thermocouples, Strain gauges, tachometers
and LVDTs for measuring temperature, pressure, speed and displacement correspondingly. The novel
method employs Digital Cameras in place of analog sensors for control and observing. Digital images
are created by Digital Cameras. The mistakes underlined with analog signals are not accessible with
digital signals. Therefore the novel method of applying digital cameras is better.
The novel method to work out these problems is to utilize Digital image signals from digital
cameras in place of analog sensors for control and watching only, however carry on to utilize the
analog sensors for measuring the physical parameters. There is a potential capacity to use digital
camera signals for measurement as well which is outside the capacity of this thesis.
31
The digital images are captured and incessantly broadcasted to the operator station. Digital
image processing covers way for generating control signals by comparing the just received image with
the standard image with the standard image previously accumulated in the computer.
This thesis mainly executes the following functions:
Control and watching different parameters (flow, Pressure, Temperature, Level,
displacement, speed, vibration and so on) using digital image signals from digital cameras.
Starting again and stopping the system
Altering between different operations modes (automatic, manual etc.)
Showing real time field images
Off-line processing incarcerated field image
Nonstop logging of command issues
Now DIP based on line control and monitoring as per C.S. Kim et.al (2001) covers way for the
systems itself to choose the field image and process it. In order to evade human intervention, Control
signal is created automatically.
1.5 SUMMARY
In the early days Process industries like thermal power stations generated 30 Mw powers.
Analog sensors like Thermo couples, RTDs, strain gauges, LVTDs, etc are applied to measure different
parameters like temperature, pressure, displacement, speed, vibrations, etc of the power plants. These
signals which are analog in nature are carried to control station, where recorders & indicators are there
to exhibit. There is no control act however in case of emergencies the plant is blackout.

32
1.5.1 Control Action- Previous Method
In the remote field locations of the plant, by mounting additional conventional (analog) cameras
the power generation capacity is increased to 100 Mw in 1970s. The analog camera signal can never be
fed to control station computer as the signals are analog. Hence separate TVs are mounted for field
view. Distant watching of field image during control and viewing facility implicate the installation of
contributed.
Hardware connections are established among field camera & TV monitor. Operational team has
to choose the view physically and watch both operator station terminal and TV monitor for each
control operation. This may redirect the operator attention and may end with incorrect control
operation. The operator depends on a manual switching unit for visualization of the field site.
1.5.2 Control Action – Existing Method
Digital cameras are mounted at isolated field site and digital camera signals are flexibly fed to
the computer in the current days. Together with real time field image processing, control and
monitoring system is incorporated. In the former generation sensor signal are delivered to computer
after A/D conversion but analog camera signal was supplied to separate TVs. The manual switching
problem of selecting the suitable camera during the length of field actuation, which was the job of an
operator, who with a wrong choice may send wrong control commands, is rise above.
Control and monitoring system is combined along with real time field image processing in order
to have dependable choice of field image and to overcome the human error. The manual switching is
taken out and Power generation capacity rose. Yet control operation is based upon sensor signals
however dependability is increased than preceding generation due the to field image accessibility in the
identical computer monitor, which decreases human mistakes.

33
1.5.3 Control Action – Proposed Method-Aim
A novel novelistic method is taken for research where extensive study and experimentation is
made to employ digital images (camera signal) in this thesis. Whereas the sensor signals are applied for
measuring different physical parameters, digital camera signals are employed for control and
monitoring. The digital camera itself is applied for control and watching to overcome the problems
pointed out below which take place in the preceding method:
1. Adjusting the sensors with hysteresis problem in analog sensors create a threat for correct
control and monitoring.
2. Analog signals transmission mistakes from sensors is a long time menace which
overcome in case of digital signal transmission.
The arriving digital image signals from digital cameras of the field outlook are compared with
standard images of the plant locations influencing physical parameters, previously accumulated in the
computer. Control signal is produced when both the images counterpart.
In order to make certain smooth operation, a large scale control and monitoring systems have
several hundred thousand control points which must be watched. Awareness of the current state of such
a system is frequently understood in the values of these points and operator must be aware of the state
while taking resolutions. Repetitive operations requiring human intervention lead to fatigue, which can
in turn lead to mistakes. This can be avoided through automation by providing a uses configurable
monitoring control points. Based on the grade of these control points, a particular action could be
taken.
Additionally these systems could construe unprocessed data in to meaningful strings of
engineering values through graphical design tools, letting for quick development of novel

34
configurations. In supplementary the system is openly upholding the data about the condition of the
control system parameters.
We can describe the subsequent functions in a nutshell.
a) Control and monitoring dissimilar parameters like flow, pressure, temperature level, etc., by
means of different actuators, motors, values fetishes (par03).
b) Re-starting and discontinuing the plant operation.
c) Changing between dissimilar operation modes: automatic, semiautomatic, diagnostic and
manual.
d) Display real-time field image
e) Off-line processing of apprehended field image
f) Displaying real time display of different field images super imposing on the animated mimic
diagrams in computer monitor.
g) Generation control signals by comparing the just obtained image with the standard image
formerly accumulated within the computer.
h) By an appropriate algorithm displayed image can be inspected that gives features of interest.
This information is then applied to execute corrective action. Power generation can be
increased to many folds by this method.

35
CHAPTER-2
REVIEW
OF
LITERATURE

36
2.1 REVIEW OF LITERATURE
In most industrial process plants and factories, Protection of people, equipment, processes and
environment must be apex precedence against harsh environmental conditions. In digital image
processing remote control and monitoring system is feasible due to the development of latest
technology as per Hao Wang (2004), L.Chiariglione (Feb 2004) and Andrew Secker et al August
(2004). Distant approaches are improved which let people to watch processes of hazardous systems
from great distances to carry out maintenance functions in risky environments without publicity to
dangers.
At different locations a hazardous industrial unit is presented with numerous video cameras all
over the capacity. At a central control station each camera is joined to a video capturing unit. As people
employs a control panel to watch and control remotely located systems, Control and monitoring is an
image processing based as per Andrew Secker et.al August 2004 human-in-the-loop system. The
human operator is engaged in the loop and propels control commands according to the observed real
time image. Just about 80% of industrial accidents are pointed to the human mistakes such as omitting
a step, indecent control of the system and falling asleep during nights etc.
On the other hand, the Image processing based control and monitoring system as per Andrew
Secker et.al (August 2004) offers few solutions for decreasing or eliminating the chance of human
mistakes by choosing the field images in accordance with the field operations. In order to make certain
smooth operation, a large scale control and monitoring system may have several hundred thousand
control points which must be always watched. Awareness of the current condition of such a system is
frequently understood in the values of these points and operators must be aware of the condition while
making resolutions.
37
Repetitive operations requiring human intervention lead to fatigue which in turn lead to
mistakes. By supplying a user configurable monitoring control points this can be evaded through
automation. A particular action could be full based on the grade of these control points. Moreover this
system could interpret raw information into meaningful strings of engineering values through graphical
design tools, letting for quick development of novel configurations. In addition the system is explicitly
maintaining the information about the state of the control system parameters. For decision making
processes as per Andrew Secker et.al (August 2004) this state information can be applied and shared
with other applications.
2.2 PRINCIPLES OF IMAGE INTEGRATION
With the objective of maintaining a Field target object, Image integration is a composite video
switching system. Lots of tasks are necessary of the system in order to execute image integration as per
C.S. Kim et.al, (2001) with a computer. Initially, the image as per H.Schulzrine,A.Rao (1998) must be
digitally attained from the imaging source, frequently a color video camera, by a sampling procedure to
create pixels. The pixels are constantly logged in the capturing system after sampling is fulfilled.
In the network, immediate field images are broadcasted. Corporation (1995) is chosen and
showed in the control and monitoring operator station based on the control operation appropriate image
as per Wonderware. By a suitable algorithm displayed image can furthermore be examined that
removes the features of Interest. After that this data is applied to carry out the corrective action.
2.3 BACKGROUND STUDY
In a Process Industry, it is very significant to calculate and control and watch different physical
parameters. Dissimilar kinds of Analog Sensors are employed to calculate the physical parameter for

38
that. The main problem is the analog signal errors which are encountered in the process in these
dimensions. Digital signal from digital cameras are applied in order to evade the analog signal errors.
The need of measuring physical parameters plays an important role in efficient function of industries.
The measurement and control of physical parameters like pressure, humidity, temperature, vibration,
speed, displacement, velocity etc are very vital factors which are necessary for agriculture and
industrial purposes for high class production. Several instruments are considered and these instruments
are highly susceptible. Sensor based system allocate their function at several levels from a low level to
high control level. For agriculture purpose Microcontrollers based system is used which has the low
cost application to perform the direct control processes within a plant. A control model based on
dispersed functions at diverse levels can be used to enhance control task effectiveness. With reference
to a preceding model, a competent and simple control system is suggested for industrial applications.
The planned system distributes its managerial and control tasks in dissimilar units using viable
microcontroller devices. The consequences gained with the previous system are depicted, which ensure
the dependability and suppleness of the projected model. Finally, several prepared alternatives for the
urbanized system are recommended by Sudhakar Singh et al (2014).By means of giving alarm signal to
the remote area in case of deviation of physical parameters from its standard values.
Microcontrollers have been used in the modern earlier period in various industrial applications
and Research & Development for scheming and observing different parameters. Automatic monitoring
and controlling of various process parameters, during the use of electronic techniques are in use since a
long time. Such systems have turn into necessity and it has always given way better consequences over
their manual complements. However such systems experience from some drawbacks like the exceeds
and undershoot in the restricted parameters, since they use relay type control and they permit the

39
observing and control of process parameters only from close neighborhood. In addition to regulate set
points and intermittent recording of parameters, an operator is necessary. Microcontroller applications
in devoted system understood an important place in engineering, particularly the large scale industries.
With the advancement in techniques for control systems and additional requirement of miniaturization,
microcontrollers have become the most suitable components. We find such application in which
microcontroller based temperature indicator & controller was developed which can be used in process
industry for monitoring & control of temperature. In the other application A. Rajendran et al (2014),
have developed a data acquisition system with AT89C52 microcontroller & PID algorithm.
Sudhindra.F et al (2014) aim at scheming a wireless entrenched system for multiple parameter
monitoring and control using thyristors and microcontrollers. A challenge is made to design hardware
and software for a dense, reliable, and low cost system to attain distant process automation. In this
system process automation is executed for the temperature and fluid level measurement. However, any
other physical parameters like pressure, flow, illumination, DC motor speed, AC motor speed,
conveyer belt speed etc can also be easily implemented. Digital to analog converter (DAC-0800) is
used to convert 8-bit binary number sent by the microcontroller into an analog DC voltage. The
microcontroller sends an appropriate binary count to DAC to set the required firing angle. This DC
voltage is fed to the inverting input of comparator to adjust the firing angle. The firing angle increases
as the DC voltage from the DAC increases and the firing angle decreases as the DC voltage from DAC
decreases. The power flow to the heater varies with the firing angle. The comparator produces a Pulse
Width Modulated (PWM) signal, which controls the firing angle of TRIAC to control the amount of
load current. The comparator circuit receives the ramp signal as one input and variable DC voltage
produced from the DAC as another input. The comparator output remains low as long as the ramp

40
amplitude is below the DC voltage level. It becomes high when the ramp amplitude crosses the DC
voltage level. This variation in the DC voltage changes the firing angle and permits the AND gate to
pass firing pulses to TRIAC to turn on the heater.
G.S. Nhivekar et al (2011) presented a design and implementation of microcontroller based
embedded system for data logging and remote monitoring of environmental parameters like
temperature and humidity with simplicity to users.
D.Sankowsky et al at University of Lodz, Poland have built a device which allows one to
measure such Properties of solid-liquid systems as surface tension (surface energy) and the density of
liquid, as well as the wetting angle over a wide temperature range: 700-1800oC. The theory of
interfacial phenomena can be found in the fundamental work. Both the surface tension and wettability
of solids by liquid at an elevated temperature are essential in many industrial branches, in the
metallurgy, foundry, surface engineering, welding, glass-making industry, etc. The vision unit of the
automatic system for the measurement of the wetting angle and surface tension performs the following
operations: ·
Acquisition and conversion of an image into a digital form; ·
Preliminary processing of the image (its filtration and sharpening as well as thresholding);
Image analysis (localization of the specimen under investigation in the image and measurement
of its geometrical features);
Determination of thermo-physical properties of the specimen on the basis of the geometrical
parameters measured.
The aim of this is to present the question of image acquisition, its conversion into digital form and then
its preliminary processing.

41
Now, the Digital camera takes part a very important role in control and monitoring the physical
parameters. The subsequent paragraphs make clear the practice of digital camera to calculate the
distance and liquid level and its detailed background study.
2.3.1 Distance Measurement Using a Single Camera
As per Hyongsuk Kim et.al (2005), Distance measurement is one needed competence for an
intelligent robot to realize its working environment. One category mimics the human vision and
assesses the distance by means of the spatial disparity of an object point in two images among
presented distance-measurement techniques. The measurement system naturally contains a pair of
cameras. The distance is calculated by means of the disparity of two related pixels with the
triangulation the two cameras must be vigilantly lined up and well regulated to reduce the measurement
inaccuracy. An important measurement error could be tough to avoid if the features of two cameras are
not the same due to a difference in fabrication, an impact on aging. A few researchers elaborated on
the monocular vision for probably overcoming the faults of the stereo-vision measurement system.
The distance information can be computed with two images taken at two different positions by a
single camera, in the similar way as that with the stereo-vision. The robotic eye-in-hand system, which
has a camera moved by a robot arm, is an example. Discovering the matching points on images could
be computationally costly as the movement of the camera on the robot arm is omni-directional. Danger
on the camera is more accountable due to the regular movement and impact. Bodily moving the robot
arm too causes a significant amount of delay on distance measurement.
A measurement system with a camera and two fixed plane mirrors has been proposed by other
researchers. The two mirrors that are imitated by Stereo images are obtained by the single camera. The

42
field of view is decreased and turns out to be narrower with two fixed mirrors. In order to put back
plane mirrors to increase the viewable and measurable area, convex mirrors had been proposed. Image
distortion caused by the convex mirrors turns out to be a main problem on the other hand. In this
lesson, a system that is compiled of a single camera and a rotating mirror is examined.
The camera gets a series of images from the rotating mirror. In the image series from the
rotating mirror, the distance is computed using the idea that the pixel for a point at a longer distance
has a higher movement speed. This one needs matching points in two images like other image-based
methods. As the mirror turns around an axis that is in parallel with the vertical axis of the image plane,
the image near the middle line will fundamentally move horizontally and those away from the middle
line will slightly move away from their related horizontal lines.
The image matching fault could be decreased as the images are taken by the similar camera. The
setup offers good flexibility on the view direction. Rotating the mirror is an easy task and will never
cause damage or parameter drift to the fragile measurement equipment. Precision development is one
of the eye-catching merits and it is possible. It is identified that most image based distance
measurement methods can never offer high precision because of the fact that pixel numbers are integer
and hence pixel locations are quantized values. Through making numerous measurements and taking
an average, the imprecision caused by the physical limit could be enhanced. More than one pair of
images can be taken and the average distance presents a more dependable measurement with a rotating
mirror.
2.3.2 Distance Measurement Using Non-Metric Camera
The utilization of image information to conduct distance measurement is a general practice in
photo grammetry and robot vision. Alternatively, to complete the measuring functions, photo
grammetry wants the use of metric cameras and specific software. Despite high resolution for study,

43
this technique can never deal with on-line process and associated equipment is as well costly. On a
real-time basis, Robot vision as per Ti-Ho Wang et.al (Aug, 2007), is competent of attaining
measurement on the other hand. However as per Lewis. M (2000), two or more cameras and obscured
cooperation among high-speed DSP chips are necessary. It will be really hard to search related points
by all of block matching technology via area-based or feature-based approaches if objects exist in a
region with the similar gray level. As an effort to develop the presentation of existing distance
measuring methods, an easy method is suggested by means of a non-metric CCD camera and a laser
thesisor set next to the CCD camera. The laser beam cast from laser thesisor is equivalent to the optical
axis of the CCD camera. Based on an uncomplicated procedure we can recognize the position of the
laser spot in images. The distance from an object of interest is computed from the calibration model of
CCD camera, going along with the recognized position of the laser spot.
2.4 VISION BASED DISTANCE MEASUREMENT SYSTEM
Design and development of several UV prototypes have been performed in a different place.
Vision based navigation has been scrutinized and an approach by using single laser pointer is
presented. UUV is normally furnished with camera as the eye of the operator. Alternatively camera
sustained by computer vision can furthermore gives some main information. The plan of the system
and the algorithm to be employed for calculating horizontal and vertical distance between an object and
camera is suggested here. Next to the camera, a laser pointer is applied for the setup. It is believed that
a standard computer is applied for image processing and data calculation.
Distinctive under water vehicle platform mounted with the camera and laser pointer is applied.
There are two main works in planning this distance measurement system. The initial is finding a real
time image processing algorithm as per Muljowidodo.K et.al (Sep 2009) required for laser spot/mark

44
detection The next is getting a scaling factor or formula that change the object position (Pixels) on the
image into real world position (Meters). It contains the associated aspects of image processing
requirement, image processing algorithm, camera mounting, laser pointer mounting, detail calculation
of distance measurement and the experimental effects.
2.5 Liquid Level Measurement Using A Single Camera
Under improvement, the pebbles of fill levels in liquid tanks is still as the measurement methods
have to meet the increasing necessities of modern processes in chemistry, food industry or
biotechnology. In some applications it is not possible to mount mechanical measurement tools, e.g.,
pressure sensors. For this reason, contactless and non-invasive techniques which do not include
electrical connections inside tanks have been progressed over the past years. During the measurement
of these techniques, however, can never record images for monitoring chemical reactions happening
inside the liquid tank. Existing image-based measuring methods as per Ti-Ho Wang et.al (2009)
Elsevier however worked to some extents in recording images while measuring the liquid level, needs
two laser beams exactly designed in parallel from the thermistors.
In addition, the float required to be centrally positioned on the liquid surface in the tank by
wires, which certainly enforced a decisive constraint on liquid-level measurement. Accordingly, the
establishment and calibration of these measuring systems were normally complicated for practical
completions. A new liquid-level measurement system by means of a single digital camera (or digital
video camera) and a circular float has been offered in order to develop measuring performance and
overcome the above-mentioned difficulties.
For capturing images of the circular float on the liquid surface, the arrangement of the
measuring system is easy and clear-cut that the digital camera is escalated above the liquid tank. An apt

45
size of the circular float is selected in accordance with the dimension of the liquid tank to get better
measuring presentation. For easier identification of the float color of the float should be dissimilar from
that of the liquid. Pixel counts of the float in the image incarcerated by the camera can be effortlessly
recognized for calculation with the apply of the chrominance filtering and thresholding techniques.
Consequently, with improved accuracy the diameter of the float in the image in terms of pixel
counts can be found out. The suggested system can efficiently calculate the liquid level (volume) while
recording images for observing process taking place in the tank based on an established relationship
among the pixel counts of the diameter of the float in the image and the photographing distance. A sub
pixel resolution during the measurement can be accomplished as pixel counts of the float in the image
are first worked out for finding out the diameter of the float.
Accordingly, measuring precision and accuracy through the suggested system can be
considerably enhanced. It is value noting that the measuring system executes adequately in measuring
liquid levels unrelated to the shape of the tank under measurement.
2.6 PROCESS CONTROL SYSTEM
As per Halang W.A., StoyenkoA.D (2004), Real-time computer control systems applied in
process control applications has many features that are dissimilar than traditional information
processing systems employed in business applications. Primary among this is design for competence
and time-critical response. Security is commonly not a strong design driver and hence tends to be
bypassed in support of performance. Computing resources (including CPU time and memory) available
to perform security functions tend to be very limited.
In addition, the objectives of safety and security sometimes clash in the design and operation
control systems. Digital industrial control systems can be moreover process-based or discrete-based. As

46
per L.Chiariglione (Feb 2004), Process-based controls are applied to control a nonstop process. In a
chemical plant, Discrete-based controls (otherwise known as batch controls) control separate parts
manufacturing or “batches” of material. Both employ the same sorts of control systems, sensors, and
networks.
The input control elements of an industrial control system, includes the control loop, the human
– machine interface (HMI) through operator station, remote diagnostics and maintenance utilities. A
control loop encloses sensors for measurement, control hardware, process actuators, and
communication of measurement variables. From the process sensors measurement variables are
conveyed to the controller. The controller construes the signals and produces related control signals
that it conveys to the process actuators. Process changes effect in novel sensor signals, recognizing the
condition of the process, to once more be conveyed to the controller. The human-machine interface
licenses the operator to put together set points, control algorithms and parameters in the controller.
The HMI also proposals displays of process status information, along with alarms and other
means of informing the operator of failures. From isolated locations, Diagnostic and maintenance tools,
frequently made available to notice and change controller, actuator, and sensor properties. A distinctive
industrial system encloses a proliferation of control loops, HMIs and Remote Diagnostics and
Maintenance tools assembled on an array of network protocols. Supervisory level loops and lower level
loops work incessantly over the duration of a process at cycle times ranging on the order of minutes to
milliseconds.
2.7 KEY CONTROL COMPONENTS
There may be numerous geographically allocated industrial plants in a large enterprise. Over the
local area network (LAN), Enterprise business operations can entrée plant information. The LAN of a

47
processing plant services all of the functions inside the plant while the actual control system as per
Parr.E.A. (1995) of the plant assembles on a somewhat remote peer-to-peer network. The systems at
these levels can be classified into two types of supervisory based control schemes, Distributed Control
Systems (DCS) and Supervisory Control and Data Acquisition Systems (SCADA). In figure 7, Key
control and monitoring system components are indicated.
A SCADA normally contains a Central Monitoring System (CMS), enclosed inside the plant
and one or more Remote Stations. The CMS houses the Control Server and the communication routes
as per C.H.Chou and C.W. Chen (Apr 1996) via a peer-to-peer network. By the isolated stations, the
CMS gathers and logs information collected and produces required actions for occasion identified. An
isolated station encloses a Programmable Logic Controller (PLC) as per Parr.E.A. (1995) which have
powers over actuators and monitors sensors.

48
Figure 7. Key control monitoring system components
Remote stations, normally, have the added ability to be interfaced by field operators through
hand held tools to carry out diagnostic and repair operations. As per C.H.Chou and C.W. Chen (Apr
1996), the communications network is the medium for transporting information between remote
stations and the CMS. Using fiber and copper cables this is executed. The practice of either DCS or
SCADA technology or execution depends on the geographic distribution of the operation. Network
architectures that include processing operations involving the transformation of raw materials into a
practical product in an incessant fashion track the DCS scenario.
Instead, the network architectures that contain distribution operations of the usable products,
naturally over large distances, follow the SCADA scenario. A SCADA system administers operation of
Human-Machine Interface (HMI)
Remote Diagnostics and Maintenance
Measured variables
Set points, Controls algorithms, Parameters constraints, Process
Data
Controlled variables
Process outputs Process
Inputs
Disturbances
Measured variables
Controller
Actuators Sensors/Digital
Cameras
Controlled Process
Remote Diagnostics and
Maintenance

49
plant by gathering data from and issuing commands to geographically remote field control stations
from a centralized location. Refining and practicing facilities make use of DCS while holding facilities
and distribution systems employ SCADA technology. The distribution operations employ SCADA
technology while the processing operations employ DCS technology.
2.8 PROCESS CONTROL SYSTEM SECURITY
Within the process controls community, Security has not been an important issue. Based on
proprietary hardware and communications, systems were proposed to meet performance, reliability,
safety, and flexibility requirements and were normally physically cut off. Centralized operation and
remote maintenance of industry systems carried out liberally over common networks opens the door for
threatening organizations to interfere with this decisive infrastructure.
DCS and SCADA systems that work on commercial off the shelf hardware and software, joined
with connections to external networks, permit for easy invasion and perhaps devastation of company
production and distribution systems. Warnings to these infrastructures could appear from several
sources like hostile governments, terrorist groups, disgruntled employees, malicious intruders,
complexities, accidents, and natural disasters. As per Parr.E.A. (1995), following two control modes
are implemented for remote control & monitoring. When the system is in normal control mode, the
automatic controller individually controls the manufacturing process deprived of user intervention (the
human operator only needs to push a button to start the control cycle). Generally, an active sequence
controller is employed to normally complete numerous functions in a certain order.
To manual control for different purposes, such as for test runs and fault diagnosis, a system
frequently must be opened. Now, we inspect the case in which the user can openly carry out each

50
operation. To make certain that safety constraints are not infringed, the supervisory agent is online
implemented to attain the system status and decide to either facilitate or stop particular operations.
2.9 PROGRAMMABLE LOGIC CONTROLLER
The Programmable Logic Controller based Controls are by far, the most generally
acknowledged means of industrial control today as per Parr.E.A (1995). Program Logic Controllers
(referred to as “PLC” by the industry) all have three basic functions. They are Control, Input and
Output. Based on Inputs, and the logic inscribed in the control (known as Ladder Logic, Sequence or
Statement list), outputs are stimulated. PLCs excel in speed, performance, and dependability. Planned
to last, as per Parr.E.A (1995), PLCs function dependably in virtually any environment PLC
programming system software has an automatic conversion from ladder logic to sequential logic. The
PLC is planned for high functionality, alleviate of use and whilst make certain that this litheness is
extended to the regions of Information, Control and Device level networking. As per Parr.E.A (1995),
the programmable logic controllers (PLCs), are obtainable, vary from nano-sized fixed I/O units to
modular systems with thousands of I/O. They are categorized into three classes.
2.10 3D PRINTING
As Campbell et al (2011) note, 3D printing is a truly revolutionary emerging technology that
could up-end the last two centuries of approaches to design and manufacturing.
Today‟s manufacturing increasingly involves the use of machinery, robots, computers etc. What
is essential to understand is that these technologies are “subtractive” techniques, which means that
objects are created through the subtraction of material from a work-piece (Campbell et al. 2011). Thus,

51
final products are dependent on the capabilities of the tools used in the subtractive manufacturing
processes.
Additive manufacturing is a group of emerging technologies that make objects from the
“bottom-up”, by adding layers of material in cross-sections, a process similar to creating objects by
blocks of Legos (albeit, smaller). The process starts by having a 3D model of the object that will
subsequently be printed, typically through the use of computer-aided design (CAD) software. Thus, 3D
printing, in simple terms, is a technology that allows one to transform a digital file to a physical object.
Thus, we can now print real objects in three dimensions, depending of course on the capabilities of the
printer.
So far, several additive manufacturing processes have been advanced, differentiated by the
manner in which they create each layer. Campell et al. (2011) include a series of such techniques.
“Fused Filament Fabrication”, for instance, involves extruding thermoplastic or wax material through
heated nozzles to develop a part‟s cross-sections (Campbell et al. 2011).
Other technologies range from jetting a binder into a polymeric powder (3D printing), using a
UV (ultraviolet) laser to harden a photosensitive polymer (Stereo lithography), to using a laser to
selectively melt metal or polymeric powder (Laser Sintering) (Camp-bell et al. 2011).
Additive manufacturing processes, of which 3D printing is a subset, offer significant
advantages. First, they entail reduced waste, when compared to subtractive manufacturing. Second,
additive manufacturing makes it possible to create functional parts in a decentralized fashion, without
the need for assembly, thus offering distinct advantages in time and cost. Finally, additive
manufacturing processes have the capacity to create advanced geometries that are not feasible by any
other means, thus offering significant geometrical freedom in engineering design (Campbell et al.
2011).

52
Even though additive processes have been available in the market for decades, we are seeing
their widespread adoption only recently. With the capability to efficiently manufacture customized
goods through 3D printers, one might envision that local manufacturing could start making a return to
developed countries. Indeed, 3D printing has the capacity to dramatically reduce costs related to
production, packaging, distribution and overseas transportation (Campbell et al. 2011). The process
itself, however, has the capacity to drive a change in tastes, namely a transition from mass production
to mass customization, in which each item produced, is customized for the end user at little or no
additional production cost.
The pace in which the technology is expected to develop is, of course, uncertain, and it will
probably vary widely for different types of products (Campbell et al. 2011). This means that many
consumer products may still be cheaper to mass produce through traditional methods and shipped to
points of consumption for a long time, despite the introduction of 3D printing.
The key question here is at which point will a product as complex as a laptop or an engine will
be printed in a single process? Campbell et al. (2011) note that for such products, the shift will be in
spurts, as certain parts are increasingly being printed and then assembled in a traditional fashion, but
with a declining number of individual parts to be assembled. This process will gradually lead to a
decline in the costs of production, and, thus, supply chains will increasingly be simplified and
shortened.
Furthermore, the increasing adoption of 3D printing should be expected to lead to less
unnecessary products, as most products will increasingly be printed on demand. This will significantly
resemble the «Just-In-Time» management philosophy of making only 10 «what is needed, when it is
needed and in the amount needed». Rendering inventories unnecessary will lead to having fewer of a

53
final product printed, with important monetary and environmental benefits. Printing will, thus, be on
demand, in a fashion similar to the transition from traditional books to e-books (Campbell et al. 2011).
As we increasingly speak about printing large items, such as a house, the key question will lie in
the size of the printer. There are already companies working on printing small residential buildings,
while Airbus is developing 3D printing to print entire wings of airplanes (Campbell et al. 2011).
Certain companies use additive manufacturing techniques in order to create custom braces for
hundreds of thousands of patients across the globe. Specifically, osteolithography is used to fabricate
molds from 3D scan date of each patient‟s dental impressions (Campbell et al. 2011). Finally, other
companies make use of laser sintering in order to quickly fabricate custom hearing aids, based on 3D
scans of impressions of the ear canal.
3D printing is also expected to reduce waste in the manufacturing process by the very nature of
additive versus subtractive manufacturing, as the latter has lower resource productivity by definition. In
fact, the printing process has almost zero waste. At the same time, the waste of excess or unsold
production will also be eliminated, as well as the cost of storage of inventory (Campbell et al. 2011).
3D printing is increasingly being considered capable to do for manufacturing what the Internet
did for information (Kyriakos Pierrakakis et al. 2014).

54
CHAPTER -3
NEED FOR THE STUDY
AND
OBJECTIVES

55
3.1 NEED FOR THE STUDY
With the introduction of DAS (Data Acquisition Systems) or SCADA, Process industries like
atomic, thermal or hydro power stations power generating capacity raised many fold From 30 MW to
1500 MW. Thousands of analog transducers are applied in the isolated field at different locations to
compute pressure, flow, level, temperature, speed, etc. The analog sensors used to calculate these
parameters need frequent calibration.
Hysteresis condition is present in the sensors. Therefore direct linear effects could not be
attained. In addition during signal measurement the faults like gross fault, systematic faults and random
faults happen. Besides, due to noise inducted by electrical interferences from motor bikes, thunder,
signal from mobile phones, etc analog signal transmission is fault prone. Hence while dealing with
analog signals many remedial measures are to be launched. Therefore for overcoming the problems
with analog signals it turns out to be necessary to find out an alternate solution.
For control and monitoring, the suggested alternate method is to use the Digital cameras in place
of sensors. With modern methods the digital images (photographs) of different levels, different speeds,
changing vibrations can be obtained and simply processed through suitable algorithms to produce
control signals. Power generation can increase if series of Event Recorders is used to calculate the plant
trip in millisecond interval along with digital image processing online and watching.
Hence there is a need to:
To create Digital Image Processing based on line control and watching of different physical
parameters like level, speed, moisture and displacement.
To develop the integration of Data Acquisition System through Digital Image Processing.
To apply digital cameras for taking photographs concerning to different physical parameters
(field image).

56
To have reliable choice of field image, control and monitoring is to be included along with real
time field image processing.
To avoid analog errors such as gross error, systematic errors and random errors which are
encountered while using analog signal generating sensors.
To avoid hysteresis effect and calibration problem of analog sensors frequently.
To overcome noise inducted by electrical interferences from motor bikes, thunder, signal
from mobile phone which occurs in analog signal generating sensors.
All the problems are not found in digital signal based sensors
o Concisely, this research work has to be done to slowly switch over from analog
environment to digital environment. At present, analog computers phased out. Digital
computers are in force now.
o Analog Televisions are obsolete. Digital televisions are in domestic use.
o Analog based modulation is replaced by digital based modulation for communication.
o Switched mode power supply (Digital technology) is being used in uninterrupted
power supply now a day‟s based upon pulse width modulation technique.
Finally since the whole world is switching over to digital technology, it becomes essential to replace
analog technology with digital technology for measuring various physical parameters like level, speed,
displacement, humidity, moisture, pollution, temperature, vibration, flow, pressure etc.
3.2 OBJECTIVES
Image integration is a composite video switching system with the purpose of maintaining a field
target object. A number of tasks are required in order to work out image integration with the computer.
At first the image must be accomplished digitally from the imaging source usually a color video

57
camera by a sampling procedure to create pixels. The pixels are continually logged in to the capturing
system after sampling is accomplished.
In the network, instantaneous field images are broadcasted. operation appropriate image is
chosen based on the control and showed in the control and monitoring operator station. By a suitable
algorithm displayed image can furthermore be examined that extracts the attributes of interest. This
data is after that employed to execute the corrective action. These processes will lead to an alternative
to analog sensors with digital cameras using Digital Image Processing technology to control and watch
the different physical parameters such as liquid level, vibration, speed, moisture, oil density and
displacement.
The objectives of the thesis are:
1. To suggest a method by means of digital images for control and monitoring different
physical parameters like flow, level, speed, displacement, vibration, etc rather than by analog
sensor signals for control and monitoring.
2. To study and verify progressive image transmission of acquired digital images from isolated
plant and transmitting to control station with image compression and transmission so as to
attain quality reconstructed image of hundred percent representation of real value of this
physical parameter.
3. To suggest processing of digital images with appropriate software algorithms to produce
control signals for successful control and monitoring of the plant at real time devoid of
manual intervention.

58
3.3 OVERVIEW OF THE THESIS
Based upon geographic distribution of the plant instrumentation, SCADA (Supervisory control
and data Acquisition system) or DCS (Distributed Control System) as per Parr.E.A.(1995) with real
time operating system are established in Process industries. The signals from sensors have to go
through signal conditioning, A/D conversion, engineering unit conversion by means of linear
interpolation method, and limit testing before generating report/control signal for corrective action. By
generating D/A conversion signal from the SCADA/DCS, the corrective action is prepared for
actuating the control elements.
Analog signals are produced by sensors like RTD, Thermocouple, strain gauges, tachometers,
LVDT‟s etc. Faults in these sensors are prone to occur. Therefore getting precise results are not
feasible. Hence several correcting methods are to be applied.
In the former days, to exhibit through separate TVs when the plant size was smaller, isolated
field images are brought to the operator station. This is since the used cameras were conventional
analog cameras which can never be connected to Real time computers, as computer work only with
digital signals. This TV images present only data about the plants, to see by the operators and site
engineers however could never be applied for any successful reason. Manually, control action is to be
instigated.
Currently to the control station, analog sensors are applied to bring measured variables of
dissimilar parameters. These signals are compared with normal values stored up inside computer and
control signals are produced by the system during abnormalities. This technique is not that dependable
due to analog signal transmission errors, sensor frequent calibration requirement, hysteresis condition
prevailing in sensors, etc. In place of analog sensors, a novel method to work out these problems is to

59
employ Digital Cameras; where in digital images from digital cameras are put together in the computer
and processed.
In order to put together the components of software system into a functioning whole, Bottom-up
integration is the traditional approach employed. Bottom-up integration contains unit testing, followed
by sub-system testing of the complete system. At first a system for controlling the field elements and
logging the status of issuing commands are proposed. Consequently watching parameters are
comprised and along with suitable mimic process diagrams. PLC programs for decoding the command
and attaining the field parameters are as well proposed. Along with the system, Video capturing unit is
interfaced.
Through system call back functions, Integration of real time field images are comprised and
processing of displayed image are furthermore developed. Image integration is a composite video
switching system with the goal of maintaining a field target object. Many tasks are needed of the
system in order to carry out image integration with computer which is recorded as follows:
1) The image must be digitally attained from the imaging sources generally a color video
camera by sampling Procedure to form pixels.
2) The Pixels are incessantly logged in to the capturing system.
3) Instantaneous field images are broadcasted in the network.
4) Suitable field image is chosen based on the control operation and exhibited in the operator
station.
As per Mackay D.J.C. (2003), Displayed image can be examined (compared with standard
image) by an apt algorithm to produce control signal. Control signals are produced when the standard
image matches the incoming image. PLCs carry out the control action. JPEG image files and
MATLAB are widely employed. The parameter measurement compared to conventional method by

60
this method, a mean absolute fault of 0.13573 from 5.2 is accomplished. Response time is raised from
45 ms to 11 ms. Precision is raised from 85% to 96% and above.
The system compromises real time display of different field images superimposing on the
animated mimic diagrams in the computer monitor, which is not possible in the old atmosphere. Test
experiments are implemented for the subsequent parameters and suggested results are generated.
1. Level measurement
2. Pressure measurement
3. Moisture measurement
4. Vibration measurement
5. Pollution measurement
6. Displacement measurement
Therefore sensors like strain gauges; LVDTS, etc are evaded for control and monitoring.
3.4. ORGANIZATION OF THE THESIS
The thesis compacts with digital image processing based online control and monitoring of
different physical parameters like pressure. Flow, Level, displacement, vibration etc.,
Chapter 1: General introduction of the thesis
Chapter 2: Review of literature from existing research work
Chapter 3: Need for the study and objectives
Chapter 4: Methodology (tools used)
Chapter 5: Methodology (Procedure)
Chapter 6: Results and Discussion
Chapter 7: Conclusion

61
CHAPTER-4
METHODOLOGY
TOOLS USED

62
4.0 METHODOLOGY
Digital cameras are used to take photographs (Digital Signal) of the desired physical parameters.
These digital image signals are compressed and progressive image technique transmission is used for
sending digital image signal to the control stations. These signals are received by the computer where
smartision screen copy software is installed. By setting the time interval by means of this software,
snapshots are taken from this video. This current snapshot image is compared with already stored
standard image. By means of distance vector matrix algorithm δ value is calculated. The value of δ is
the difference between the standard image and current image. Based on the δ value either control signal
has been generated or not. The detailed explanation is as follows:
Figure 7a: Hardware setup
This setup consists of a Intel dual core CPU based industrial computer for operator station,
devoted individual PC for image catching unit, Color video cameras, Programmable logic controllers
and Ethernet switches are shown in fig 7a. To implement the isolated control and monitoring system
the general hardware and software formation is recognized based on the application requirement.

63
According to the hardware point of view, programmable logic controller based control hardware‟s are
used. The programmable Logic Controller is furnished with several I/O modules and a non-
interruptible power supply for evolving the control program. Program development system is used for
evolving the control program .The resulting program is of “ladder login” type and this established
using an IBM –PC well-matched computer and then moved into the PLC.
Digital industrial control systems can be either process based or discrete based. Process based
controls are used to control a uninterrupted process of separate based controls (otherwise known as
batch controls) control separate parts manufacturing or “batches” of material in a chemical plant. Both
employ the same types of control systems, sensors and networks. The Key control components of an
industrial control system, comprises the control loop, the human machine interface through operator
station and far-off diagnostics and repairs utilities. A control loop contains of sensors for measurement,
control hardware, process actuators and communication of measurement variables.
4.1 HARDWARE SETUP
In process industry, both hardware and software setup are required in order to calculate the
physical quantities. As per Parr.E.A. (1995), the hardware setup contains a industrial computer for
operator station, Dedicated individual PC for image capturing unit, Color Video Cameras,
Programmable logic controllers and Ethernet switches.
4.1.1 The Control System Structure
In order to implement the remote control & monitoring system for the plant, the general
hardware and software configuration is launched based on the application obligations. Programmable
logic controller based control hardware is used from the hardware point of view. The Programmable
Logic Controller is supplied with multiple I/O modules and a non-interruptible power supply for

64
improving the control program the scan time for this PLC is 1 ms/K word of program and 0.225 ms for
the I/O. As per Rockwell Automation (1995), Program development system is useful for improving the
control program. By means of an IBM-PC compatible computer, the resulting program is of kind
“ladder logic” and was enhanced and then downloaded into the PLC. The in Touch SCADA package
on a PC is useful for the user interface development. By means of Dynamic Data Exchange (DDE)
communication as per Rockwell Automation (1995) protocol, the display windows that formed the
user interface are linked with the PLC in order to convey information as per Wonder ware Corporation
(1995).
4.1.2 Modifications to the Existing System
A number of modifications are made to the control system in order to attain an enhanced
functionality of the system. The most important aim of these modifications is to attain a better
presentation of the system with a higher dependability. The dependability and predictability of the
software program is enhanced by applying the cyclic approach. The cyclic approach paradigm is based
on a philosophy of resource adequacy that is, it depends upon the statement that there are enough
resources to promise that all processing necessities are met on times per L.Chiariglione (Feb 2004).
There are two means of accomplishing resource adequacy if processing resources are not enough to
accomplish all processing, using faster processing elements or paralleling and distributing functions to
multiple processing elements (nodes). Specified this paradigm, the programmed application logic could
be splitted into short code segments, each of these parts containing an unvarying structure and a pre-
defined functionality.
4.1.3 Operator Station
A standard Personal computer is at the core of the system running with real time operating
system. To perform the control & monitoring programs and image updating functions are the concepts

65
of the computers. As per Halang W.A., StoyenkoA.D (2004), Mat lab based interface software permits
real-time display of different field images in harmony with control operation. In sharable mode, the
program understands the live.dat file in server. The sharable file mode read operation is necessary
because the PLC updates the similar live.dat file in every 0.5 sec. Therefore concurrent access is
permitted only in sharable mode. In the control system, the data obtained is equivalent to binary value
of voltage or current given to analog input card. Using sensor Calibration constant the Analog binary
value obtained from analog input card is changed into Engineering value. In the server this calibration
constant will be set aside in Analog master file. The program understands the constant and changes
all binary voltage value into engineering value and is revised.
Based on the coefficients, field switched images are gradually renovated for final high resolution
image and are exhibited in the operator station. From the Mimic display, Pushbutton functions are
applied for issuing manual command. By the call back key press event code actuation of mouse over
the push buttons is identified. Key press event code is checked every 10 ms and alters the Tab.txt file
obtainable in the text format Identification. For offering both ON/OFF command with single key Push
button keys are employed under toggle configuration.
4.1.4 Image Capturing Unit
The image capturing unit contains an image capturing card with color image Acquisition front-
end. As per L.Chiariglione (Feb 2004), this card encloses the image acquisition front-end, dual-ported
color image buffer memory, and a digital signal processor for carrying out the necessary image
algorithms. Through an Ethernet Link Interface, it converses control and parameter information with
the server. As per B.Girod et.al (2002), Instantaneous images are flowed for image transmission.

66
4.1.5 Color Video Camera
For instantaneous image acquisition the color video camera conveys a complex video image
signal to the video capturing unit. For x and y dimension camera control the Pan-Tilt Unit of the
camera is a 2-degree of freedom. Control of the cameras is feasible through a serial port RS-485
interface. In multi drop mode, it is united to the COM1 serial port of the operator station with RS-232
to RS-485 converter for connecting necessary units. At a considerable pace, the cameras for modern
digital image processing applications are varying and CCD camera remains “universal”. Values of the
shutter speed as low as 500 ns are obtainable with commercially presented CCD video cameras even
though the more convectional speeds for video are 33.37 ms (NTSC) and 40.0 ms (PAL, SECAM).
4.1.6 Ethernet Switches
Ethernet switch is a high-performance, managed, stackable layer 2 switches that offers an ideal
solution interfacing various systems. The switch has 10/100 Mbps Fast Ethernet ports with support for
optional GBIC modules for fast connection speeds and litheness for trucking. For easy network
administration, the switch can be managed through a single IP address. Traditionally, PLC and Video
capturing unit are arranged comparatively close to field element. These elements joined through the use
of local networks promise almost infinite distance. Using ethernet converters tying existing control
system into a facility‟s existing network might be an enhanced decision.
Through fiber cables, Cabling between control and remote field network switches are
installed. Without Fiber Optic cabling all future adjusted LANs (Local Area Net-work) could never be
able to exist. Long term usage of Fiber Optic physical wiring will carry evolution of customer needs
and movement to the latest technologies. Using Fiber Optic permits long distance for the campus and
building backbone, servers in horizontal cabling and controllers.

67
Without risk from lightning strikes or EMI influences, all network components are planned to
run any future application protocols to the user‟s desk. Besides to these it offers data security. In more
recent years, Fiber cabling has one more property which has turn out to be more necessity for LAN
users. Its aptitude is to handle for greater signal band-width than copper cabling. For this cause usage
of fiber is turning into the wise selection in the backbone applications. For linking system UTP 8 core
cable is applied with network switch through RJ 45 connector. Data rate is restricted to 100Mbps.
4.2 SOFTWARE SETUP
For control and monitoring the physical parameters the software setup is required to offer the
prompt command. The software setup contain a PC-based user-interface component for progressive
image transmission named smartision screen copy, Command and Auto sequence programs named
PLC programs as per Parr.E.A.(1995) and control and watching based image-processing as per
L.Chiariglione (Feb 2004) component named Mimic. These components speak through an Ethernet
protocol. Next is a explanation of each component.
4.2.1 Smartision Screen Copy
From the video capturing unit the Smartision screen copy component is accountable for
progressively transmitting images. This is completed by initially loading the image processing
component onto the image capturing card. This component is particular in the settings. Next, the user-
interface is offered. Third, images are sending out to the control & watching system. In order to create
auto screenshots in a very simple and rapid way, Smartision Screen Copy is a device applied. With
Auto screen shot, screenshot interval is chosen.

68
As per Athanasios Skodras (2001), Jpeg image files are employed. As per Branover A. et al
(2004), the executable file is “C:\Program Files\smartision\ScreenCopy\SSC.exe” Video capturing unit
substitutes analogue standards of signal transmission. It as well launches novel fields of application
such as multimedia communications or tele collaboration. Two reasons are there for the achievement of
digital video. On the one hand the presented computing power of recent processors rises quickly.
Otherwise, as per Berrou C. et al (1993) and Anderson J.B. et al (1984) new sophisticated
coding algorithms has been suggested which use this computation power to achieve a high-quality
transmission. By removing redundant information from the video sequence, the main objective of
today‟s most normally employed video capturing card has been a high compression ratio Athanasios
Leontaris (2004 ) at low bit rates during the development. Data which can be renovated at the receiver
is omitted, only the rest of the part requires to be transmitted. As per Chevion et al (1992), the
disadvantage of this process is that the coded video will be very responsive to transmission faults. Still
very short transmission faults are likely to circulate spatially and temporally, a single fault will affect a
large area inside the picture for several frames. Regrettably, in the packet switched networks,
transmission faults such as lost or delayed packets happen relatively often. The recognized quality is
badly reduced in this case. As per Elias P. (1955), many research thesis spotlight on the improvement
of fault resilient coding algorithms or methods to hide faults in the decoded video sequence.
4.2.2 PLC Program
In the control system the presentation of the control system is improved with user-friendly
programming system software Tool for programming the user application. Application is worked out
with ladder diagrams, Functional blocks and statement lists as per Parr.E.A(1995). Programming
system Tool is run on IBMPC and Control System is connected to PC through Online – Interface

69
module during program development to make certain fast Online Operation. Statement list
Programming (STL) permits complex application Implementation. Function blocks (FBK) permit a
structured kind of programming. Program sections are exhibited on the screen as rectangles. Input and
output parameters are joined to form the applications.
Ladder diagram programming is particularly constructive for logic control. After that
Application programs are accumulated in the Local Hand disk of IBM-PC. An application program will
be loaded in RAM memory when down loading it from the programming system to the CPU, and
execution started. This PLC program Receive commands data and is decoded for facilitating the output
and is revised in the PLC output card. As per Parr.E.A.(1995), Card Output is interfaced with field
element and is activated based on the control system commands.
Comparison output is interfaced to the analog input card of PLC for Acquisition of field camera
images. Entire analog input is scrutinized by the program written in the PLC and data is sent to server
for sharing the parameter values via live.dat for on-line display and Data for offline study.
4.2.3 MIMIC Component
As per L.Chiariglione (Feb 2004), the Mimic component is accountable for implementing the
integration of image processing with control and watching system in real-time as per Halang W.A.,
StoyenkoA.D (2004). It accomplishes this by first communicating with the PC-based component via
Ethernet protocol for revised user-interface parameter and control information, second processing the
image frame according to the image control panel necessity and third storing the control events for off-
line study.
In sharable mode this program interprets the live.dat file in server. The sharable file mode read
operation is necessary because the PLC revises the parameters in live.dat file in every0.5 sec. Therefore

70
simultaneous access is permitted only in sharable mode. In the control system the data obtained is the
same to binary value of voltage or current specified to analog input card. Using sensor Calibration
constant, the Analog binary value obtained from analog input card is changed into Engineering value.
This calibration constant will be set aside in Analog master file in the server. The program interprets
the constant and changes all binary voltage value into engineering value.
From the Mimic display, Pushbutton, command button are assigned for issuing manual
command. By the call back key press event code actuation of key is identified. In the text format
Identification, Key press event code is checked every 10 ms and alters the MCOM.dat file obtainable.
Push button keys are employed under toggle mode configuration for offering both ON/OFF command
with single key. For dissimilar facilities, three mimics are proposed. In the relevant mimic, issuing
of commands is revised. Difference of process scheme can furthermore be simply executed through
software modification. Using MatLab, the image processing software was proposed.
4.2.4 MATLAB Program
All through this research work, MATLAB tool was employed widely as a test-bed for the
improvement of the image processing based control and monitoring system. Matlab is mainly high
level language which has different specialized toolboxes such as image acquisition, image processing
and computer vision system. Image processing tool box is used in our research work in which the
original standard image is compared with current digital photograph. By Matlab tool box, Image
comparison algorithm has been generated.
4.2.5 Transport Protocols
As per H.Schulzrine,A ( 1998), Transmission Control Protocol (TCP or TCP/IP) and User
Datagram Protocol (UDP or UDP/IP) are both transport protocols. Different kinds of communication

71
protocols are compared beneath. TCP/IP is a connection-based protocol, whereas UDP is a
connectionless protocol. In TCP/IP, the two ends of the communication link must be joined at all times
throughout the communication. An application using UDP sets up a packet and sends it to the
receiver‟s address without first checking to see if the receiver is set to obtain a packet. The packet is
lost if the receiving end is not set to receive a packet.
UDP is a packet-oriented protocol, while TCP/IP is a stream-oriented protocol. This means that
TCP/IP is regarded to be a long stream of data that is send out from one end of the connection to the
other end, and one longer stream as per B.Girod et.al (2002) of data pouring in the opposite direction.
The TCP/IP stack is accountable for breaking the stream of data into packets and driving those packets
while the stack at the other end is accountable for rebuilding the packets into a data stream by means of
information in the packet headers. UDP is a packet-oriented protocol where the application itself splits
the data into packets and conveys them to the other end on the other hand. The other end does not have
to reconstruct the data into a stream. It is noted that, some applications might proposal the data as a
stream when the underlying protocol is UDP. Conversely, this is the layering of an additional protocol
on top of UDP, and it is not something intrinsic in the UDP protocol itself.
The packets that are sent by TCP/IP have a distinctive sequence number. At the beginning of
communication the starting sequence number is conversed to the other side. The receiver admits each
packet, and the acknowledgement encloses the sequence number so that the sender makes out which
packet was acknowledged. This involves that any packets lost on the way can be retransmitted (the
sender would know that they did not reach their destination because it had not received an
acknowledgment). In addition, packets that appear out of sequence can be reconstructed in the suitable
order by the receiver. Additionally, timeouts can be launched as the sender knows (from the first few
packets) how long it takes on average for a packet to be sent and its acknowledgment received. On the

72
other hand, UDP sends the packets and does not keep follow of them. As a result, if packets appear out
of sequence, or are lost in transmission, the receiving end (or the sending end) has no way of knowing.
Note that “unreliable” is applied in the sense of “not guaranteed to succeed” as opposed to “will fail a
lot of the time”. In practice, UDP is quite dependable as long as the receiving socket is vigorous and is
processing data as rapidly as it arrives.
TCP/IP segment has 20 bytes of overhead, whereas UDP has only 8 bytes of overhead. Speed is
the main benefit of UDP over TCP/IP. Dependability features built into TCP/IP is costly in terms of
overhead at implementation time. Lack of dependability mechanism is regarded an advantage from
designer‟s point of view, as the cost of implementing dependability is high. Example: An interactive
real-time application may rarely select to retransmit a lost message. In this UDP verifies to be cost
successful than TCP/IP. As per Sang-Ho et al (2005), UDP has lower latency. UDP is preferable for
low-latency application.
With the above attributes of UDP & TCP/IP, it is favored that to employ UDP in the setup, as
the receiving socket is lively and is processing data rapidly as it appears. In addition all over the head
in TCP/IP can be evaded in UDP. UDP object can be formed with the UDP function. UDP does not
need the name of the isolated host as an input argument. On the other hand, if UDP object is applied to
communicate with a particular instrument, after that isolated host and the port number should be
précised. To form a UDP object related with the isolated host 127.0.0.1 and the isolated port 4012.
u=udp („127.0.0.1‟, 4012).
The properties are routinely allocating the values once the UDP object is formed. These
common purpose properties offer eloquent information about the UDP object based on the object that
are employed to communicate among two hosts. A UDP object is formed for the local host as u1=udp

73
(“,‟LocalPort‟, 4114). A UDP object is as well formed for the remote host. Note that the remote host
must state the local host name and port number. udp („doejohn.dhcp‟,4114).
To read write operations, text is applied with a UDP object joined to an isolated instrument.
UDP sends and receives information in blocks that are named datagram. Every time data is written or
read with a UDP object. For instance, the string sent to the echo server comprises a datagram with 13
bytes – 12 ASCII bytes plus the line feed terminator.

74
CHAPTER-5
METHODOLOGY
PROCEDURE

75
5.1 PROGRESSIVE IMAGE TRANSMISSION
For isolated monitoring of field process, Real time field image has been a major media. At first
video was confined and transmitted in analog form. The beginning of digital integrated circuits and
computers led to the digitization of video, and digital video permitted a revolution in the compression
and communication of video. The growth and popularity of the network stimulated video
communication over best-effort packet networks. Video over best-effort packet networks is made hard
by a number of factors comprising unknown and time-varying bandwidth, delay, and losses. (Yusuo Hu
et al 2004).
5.2 POINT-TO-POINT, MULTICAST TRANSMISSION
The universal form of communication is point-to-point or one-to-one Communication with
properties that stretch out between point-to-points and broadcast is multicast. As per Halang
W.A.,StoyenkoA.D (2004), Multicast is one-to-many communication field images are incarcerated and
encoded for real-time monitoring. Video encoding plan is specified in figure 8.
Figure 8 Video Encoding Schemes
Video Camera
Input
Video Capturing
unit
Switch
Switch
Operator stations
Fibre cable
Switch
Field
Switch
Control Room
Switch

76
5.3 Constant-Bit-Rate / Variable-Bit-Rate Channel
Some channels sustain VBR and some channels support CBR. Otherwise, a video sequence
frequently has time different complexity. Therefore coding a video to finish a steady visual quality
wants a variable bit rate, and coding for a constant bit rate would generate time-varying quality.
Evidently, it is very important to match the video bit rate to what the channel can endure. Buffer is
usually applied to attain this, to couple the video encoder to the channel, and a buffer control
mechanism proposals feedback based on the buffer fullness to control the coarseness/fineness of the
quantization and thus the video bit rate. A key network feature that disturbs the plan of media
streaming systems is whether they are packet-switched or circuit-switched. Packet-switched networks,
such as Ethernet LANs are shared networks where the individual packets of data may show variable
delay, may look out of order, or may be totally lost.
Network QoS sustain can very much make easy video communication, as it can facilitate a number of
capabilities together with provisioning for video data, prioritizing delay-sensitive video data
comparative to other forms of data traffic, and in addition prioritize among the dissimilar forms of
video data that must be conversed.
5.4 IMAGE COMPRESSION
As per Athanasios Leontaris (July 2004), Image compression is attained by using the similarities
or redundancies that survives in a typical video signal. For instance, successive frames in a video
sequence show temporal redundancy as they usually have the similar objects, possibly undergoing
some movement among frames. There is spatial redundancy within a single frame as the amplitudes of
nearby pixels are frequently interrelated. Likewise, the Red, Green, and Blue color components of
specified pixel are frequently interrelated.

77
To reduce the irrelevancy in the video signal is one more goal of video compression that is to
only code video features that are perceptually significant and not to misuse important bits of
information that is not perceptually significant or unrelated. Recognizing and reducing the redundancy
in a video signal is comparatively straightforward, though recognizing what is perceptually related and
what is not very complicated and hence irrelevancy is hard to use.
To start, image compression is regarded, such as the JPEG standard, which is planned to use the
spatial and color redundancy that survives in a single still image. Neighboring pixels in an image are
frequently highly related, and natural images frequently have most of their energies pondered in the
low frequencies.
As per Rahul Jain et al (2007), JPEG uses these attributes by portioning an image into 8x8 pixel
blocks and computing the 2-D Discrete Cosine Transform (DCT) for each block. The inspiration for
splitting an image into small blocks is that the pixels inside a small block are normally more related to
each other than the pixels inside a larger block. The DCT compacts most of the signal energy in the
block into only a small fraction of the DCT coefficients, where this small fraction of the coefficients
are enough to rebuild a precise version of the image.
Using many methods known as zigzag scanning, each 8x8 block of DCT coefficients is
afterward quantized and processed run length coding, and Huffman coding to create a compressed bit
stream. A color space conversion is first used in the case of a color image, to change to RGB image
into a luminance/chrominance color space where the dissimilar human visual perception for the
luminance (intensity) and chrominance features of the image can be better used.
A video sequence contains a sequence of video frames or images. Each frame may be implied as
a separate image, for instance by separately using JPEG like coding to each frame. On the other hand,
as neighboring video frames are usually much related much higher compression can be attained by
78
using the similarity among frames. Now, the most successful approach to use the resemblance among
frames is by coding a specified frame as per Lindt J.H.V (1982) by first forecasting it based on a
formerly coded frame, and next coding the fault in this prediction as per L.Chiariglione (Feb 2004).
Because of motion, successive video frames usually have the similar imagery, though possibly
at diverse spatial locations. Hence, to develop the certainty it is significant to estimate the motion
among the frames and next to form a suitable prediction that balances for the motion. In order to attain
lossless image compression as per H.Pan,W.C.Siu and N.F.Law(2007), the binary wavelet transform
method is applied. Newly the lossless image compression as per Tsung-Han Tsai, Yu-HsuanLee(2009)
is attained by FELICS (Fast Efficient Lossless Image Compression) algorithm.
5.5 COMPRESSION STANDARDS
As per Kewu Peng et.al (2006) and Soren Forchhammer et.al (2005), Video compression
standards offer a number of advantages, primary of which is making sure interoperability, or
communication among encoders and decoders made by dissimilar people or dissimilar companies. In
this manner standard lower the risk for both consumer and manufacturer, and this can direct to quicker
acceptance and common use. Besides, these standards are planned for a large selection of applications
and the resulting economies of scale lead to decrease cost and additional widespread use. Mpeg Video
Standard is specified in Table 5.

79
Table 4. Video Coding Standard
Video Coding Standard Primary Intended Applications Bit Rate
H.261 Video telephony and teleconferencing over ISDN P * 64 Kb/s
MPEG1 Video on digital storage media 1.5 Mb/s
MPEG2 Digital Television 2 – 20 Mb/s
H.263 Video Telephony Kbps and up
MPEG4 Object based coding, synthetic Content, interactivity, video streaming Variable
H.164 Improved Video Compression 10‟s t0 100‟s of Kb/s
5.6 VIDEO DELIVERY VIA STREAMING
As per Jeanne M. et al (2005) and Jiech Mar er al (1969) and Fei Sun et al (2005), the
fundamental plans of video streaming is to divide the video into parts, send out these parts in
succession, and facilitate the receiver to decode and playback the video to be distributed. Video
steaming can abstractly be thought to contain the subsequent steps:
Division the compressed video into packets
Begin delivery of these packets
As per Massey J.L (1963) and Fano R.M (1963) and Wozencraft J.M (1957), start decoding
and playback at the receiver while the video is yet being delivered.

80
Video steaming facilitates concurrent delivery and playback of the video. At any point in time,
video streaming offers a number of advantages together with low delay before viewing begins and low
storage necessities as only a small portion of the video is accumulated at the client. The length of the
delay is specified by the time duration of the pre-roll buffer, and the necessary storage is approximately
specified by the amount of data in the pre-roll buffer.
5.7 DATA TRANSFER THROUGH VARIABLE BANDWIDTHS
According to common network condition, this section starts by discussing the necessitate for
streaming media systems to adaptively control its transmission rate. Different ways in which suitable
transmission rates can be estimated vigorously at the time of streaming, and survey how media coding
has progressed to support such dynamic changes in transmission rates.
5.8 THE NEED FOR RATE CONTROL
Congestion is a general phenomenon in communication networks that happens when the
existing load goes beyond the planned limit, causing degradation in network performance such as
throughput. Constructive throughput can be reduced for a number of reasons. For example, it can be
caused by impacts in multiple access networks, or by raised number of retransmissions in systems
using such technology. Moreover a decrease in constructive throughput, other symptoms of congestion
in packet networks may include packet losses, higher delay and delay jitter.
Control procedures are frequently used to avoid the undesirable symptoms of congestion, to
limit the amount of network load. Such control procedures are known to be rate control, sometimes as
well known as congestion control. It should be noted that dissimilar network technologies may execute
rate control in dissimilar levels, such as hop-to –hop level or network level. However, for inter-

81
networks involving multiple networking technologies, it is general to depend on rate control carried out
by the end-hosts. The rest of this part scrutinizes rate control mechanisms executed by the sources or
sinks of streaming media sessions.
5.9 RATE CONTROL FOR STREAMING MEDIA
For backgrounds like the complex network system where little can be expected about the
network topology and load, finding out an appropriate transmission rate can be hard. Conversely, the
rate control mechanism performed in the Transmission Control Protocol (TCP) has been empirically
confirmed to be enough in most cases. There are definitely a number of significant advantages of
applying TCP. At first, TCP rate control has empirically confirmed steadiness and scalability. Then,
TCP offers guaranteed delivery and effectively removal of the much dreaded packet losses.
5.10 STREAMING MEDIA OVER RATE- CONTROLLED UDP
It is observed that both the retransmission and the rate control mechanisms of TCP hold features
that are not appropriate for streaming media. Present streaming systems, for the Internet depends
instead on the best-effort delivery service in the form of User Datagram Protocol (UDP). Hufffman
W.C et l (2003), this permits more litheness both in terms of error control and rate control as per. For
example, instead of depending on retransmissions alone, other fault control methods can be integrated
or replaced.
5.11 MEETING TRANSMISSION BANDWIDTH CONSTRAINTS
In streaming media system the integration of rate control brought in an additional difficulty. As
transmission rate is uttered by channel conditions, problems may happen if the determined transmission
rate is lower than the media bit rate. Client buffering assists to a certain degree to rise above occasional
short-term drops in transmission rate.

82
5.11.1 Transcoding
As per Athanasios Leontaris (July 2004), a direct method to adapt the media bit rate is
recompression whereby the media is decoded and then re-encoded to the preferred bit rate. Two
disadvantages are there with this approach. Initially, the media resulted from recompression is usually
of lower quality than if the media was coded directly from the original source to the similar bit rate.
Next, media encoding normally needs extensive computation, making the approach prohibitively
costly.
Compressed-domain Trans coding technique worked out the complexity problem. The
fundamental plan is to selectively re-use compression decisions previously made in the compressed
media to decrease computation. As per Jiho park et.al (2007), significant Trans coding operations
comprise bit rate reduction, spatial down sampling, frame rate reduction, and changing completion
formats.
Transmission system is planned with fault control to conflict the effect of losses. There are four
rough classes of approaches for error control as per Macwilliams F.J et al (1977)
Retransmissions
Forward error correction(FEC)
Error concealment
Error-resilient video coding.
As per Trappe W. et al (2002), using a number of these diverse approaches, a video streaming
system is classically planned.

83
5.12 PROGRESSIVE IMAGE TRANSMISSION INTERFACE
Using a number of different approaches the progressive image transmission system is usually
planned. When images are transmitted progressively Progressive image transmission offers an
appropriate user interface. Conversely, most of the existing PIT methods only measured the objective
quality of the reconstructed image. Now an attention model based progressive image transmission
approach employed to develop the subjective quality of the transmission process. As per Athanasios
Skodras (2001), both bottom-up image features and top-down semantic information are employed to
extort the regions of interest (ROI) and as well suggest a novel ROI coding plan based on JPEG 2000
to control the trade-off among the transmission of ROI and background. When people outlook an
image through a low speed connection, for instance, through a telephone line or via wireless networks,
as per Lee C.Y et al (1991) and Husted. P (1999) it will take much time to convey the whole image.
Broadcasting a lossless compressed 800x600 24-bit color image over a 56Kbps connection will
need about 60s. Transmitting large images such as pictures incarcerated by digital cameras is yet
comparatively slow even with raised bandwidth. Experiments have illustrated that if the delay is too
long (>5-10s), user will feel anxious and even surrender. Progressive Image Transmission (PIT)
methods have been suggested to improve this problem by first sending a coarse version of the original
image and afterward refining it increasingly. Users can preview the image in advance using PIT and so
decide whether to terminate the transferring process or wait for the image to be refined. PIT is
particularly helpful for remote control and watching of multiple views.
As per Manju Hedge V et al (1994), the major mission of PIT is to encode the original image
into a code stream. Image can be renovated successfully and competently by part of the code stream in
order that it can be broadcasted in a progressive way. Bits with more significance should emerge earlier

84
in the code stream, so that users will all the time get the most significant information in time and it will
offer the best experience in viewing the transmitted image.
The first objective can be attained simply by PIT techniques. Famous image standards such as
JPEG and JPEG 2000 do sustain ROI coding. JPEG2000 is applied to encode the image with the
extorted Regions of interest (ROI). It has an extremely scalable structure. The encoding process contain
the subsequent stages: Initially, for each component, the pixel data is changed by means of reversible
or irreversible wavelet transformation and an orientation tree sub-band structure is produced.
Currently a proficient architecture for Two Dimensional wavelet transforms based as per Peng
Cao, Xin Guo, Chao Wang and Jie Li (2007) on lifting Scheme is useful. As per Rahul Jain et al.
(2007), the wavelet transform coefficients are then quantized into integer indices. Later, the indices of
each sub-band are separated into small code blocks (32x32 pixels) and bit-plane coding is performed in
each code block independently as per Gennady Feygin et al (1993).
The coded data constructs numerous quality layers. Lastly, with a nominal size for each sub-
band the code blocks are furthermore grouped into precincts. The code coming from each precinct
layer, resolution level and component will be enfolded into a packet and all the packets are arranged to
form the final bit stream in a definite progressive order. In JPEG2000, five progressive orders have
been described. The layer progressive ordering is the most successful among them since it can offer
successive improving image quality. To remove the ROIs, an attention model is applied inside the
image.
At early stages, the MAR approach makes certain that users will get a well enough view of the
ROI part and as well allows the background information to be transmitted in time. The idea of MAR is
understandable and its value is simple to select. It is furthermore very suitable for web publishers to
employ MAR. Images are frequently embedded into a web image with a layout size smaller than its
85
real size. The progressively transmitted image will forever offer the best user experience without
sacrificing the quality or maintaining different image versions by correlating MAR with image layout
size and encoding the source image in the suggested way.
Rather than using mechanisms to make certain dependable transmission of image packets and
develop error resilience, on Progressive Image Transmission is spotlighted. This technique can indeed
develop the image quality at each of the initial stages.
5.13 ATTENTION MODEL BASED ROI EXTRACTION
In this part, initially the definition of our attention model is conversed and next employs it to
remove the regions of interest. This attention model has been effectively applied in image adaptation,
video summarization, and mobile picture browsing. The visual attention model for an image is termed
as a set of attention objects.
{AOi}= {(RECTi,Avi,MPSi)}, 1 ≤ I ≤ N
Where
AOi, the ith attention object within the image
RECTi, position and size of AOi
AVi, attention value of AOi
MPSi, minimal perceptible size of AOi
N, total number of attention objects
In this work, the MPS property is not regarded. It is noted that only concerned in the position,
size and attention value of the objects. Neurological research has demonstrated that human visual
attention is not only aggressed by low level image features however also guide by high level semantic
information. Hence, both bottom-up and top-down methods are applied to model the attention. A set of

86
attention objects will be attained with dissimilar attention values after attention modeling. The regions
of interest will then be extorted from these attention objects.
5.14 ROI EXTRACTION
Initially, arrange all the attention objects by their attention values in a descending order, i.e.
AV1> AV2>…>AVn. Experiments have illustrated that the total area of the ROIs should not be too
large and the number of the ROIs should be small to maintain the encoding/decoding competent.
Therefore, to find the maximal M that satisfies:
a. Area= (U RECT I) <1/4 ImageSize;
b. M<Nmax (3);
Where
Nmax is a predefined threshold. In this experiment Nmax is set as 6. The region of interest R is
then defined as the union of the selected AOs, i.e.
R=U RECT I
The region of interest R may enclose multiple disconnected sub-regions and some of them may
be unevenly shaped since of the overlapping of attention objects. The JPEG2000 encoder can
competently deal with multiple ROIs with random shapes, thus we openly build the ROI mask bitmap
from R and employ the map to encode the final bit-stream.
5.15 PROGRESSIVE IMAGE CODING & JPEG2000 ARCHITECTURE
With the extorted ROIs, JPEG2000 is applied to encode the image. In this part, first a short
explanation of the JPJEG2000 coding standard is specified and next the ROI coding part is conversed.
As per Shu Lin et al (1983), JPEG2000 is a competent coding standard for loss or lossless multi

87
component image coding. It has an extremely scalable structure. The encoding process contains the
subsequent stages: First, for each component, using reversible or irreversible wavelet transformation
the pixel data is changed and an orientation tree sub-band structure is produced.
As per Rahul Jain et al (2007), the wavelet transform coefficients are formerly quantized into
integer indices. Later, the indices of each sub-band are separated into small code blocks 32x32 pixels)
and bit-plane coding is performed in each code block individually. The coded data erects many quality
layers. At last, the code blocks are furthermore grouped into precincts with a nominal size for each sub
band. The code approaching from each precinct layer, resolution level and component will be covered
into a packet and all the packets are arranged to structure the final bit stream in a definite progressive
order. As per Athanasios Skodras(Sep 2001), five progressive orders have been termed in JPEG2000.
The layer progressive ordering is the most successful as it can offer successive improving image
quality among them.
5.16 ROI CODING
In the JPEG2000 standard, a simple algorithm called MAXSHIFT has been implemented. With
random shapes the MAXSHIFT coding method can deal with multiple ROIs competently. On the other
hand, as it has divided the ROIs from the background by employing different bit-planes, when the
image is broadcasted in a layer progressive manner, no background information will be transmitted till
all the ROI parts have been totally renovated. During the transmission this will cause avoidable delay.
Even though some alternative ROI coding methods have been suggested to work out this problem, they
are not executed by the standard JPEG2000 baseline coder. Besides, it is complicated to select their
parameters to attain the top result. Uncomplicated yet coefficient solution is explained which is
compatible with the JPEG200 framework.

88
Initially, the idea of Most Appropriate Resolution (MAR) of an image is launched. The MAR of
an image is associated with its size and presentation context. A large image can contain a MAR lower
than its actual resolution and possibly will even lower if the image is embedded. The value of MAR is
termed as follows: MAR = max (H-max ((log2 (1/k), 0, 0) Where H is the maximal level of the
wavelet transform, and K stands for the preferred zooming ration, it can be decided by the display size
or directly précised by the image author or the web publisher.
Primarily, the ROI data is broadcasted whose resolution level is no higher than MAR-c, next
switch to transmit the background data. When all the packets whose resolution level is no higher than
MAR-c are transmitted, it began to send the left over data progressively. Now the constant c is applied
to control the trade-off. It is found that for most images, c=1 generates the best result. The POC marker
segment described in the JPEG2000 standard is applied to change the progressive order. The encoding
process is demonstrated in figures 9 & 10.
Progressive Order
Resolution
Laye
r
Figure 9. Maxshift with layer Progressive ordering
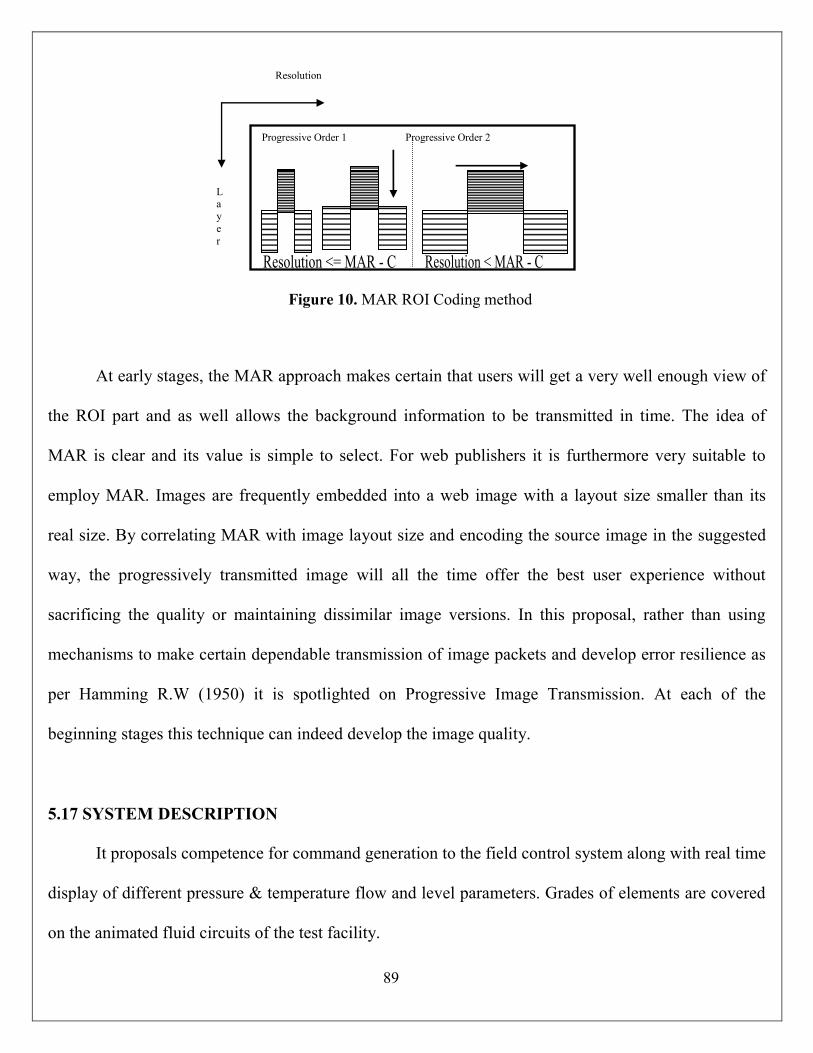
89
At early stages, the MAR approach makes certain that users will get a very well enough view of
the ROI part and as well allows the background information to be transmitted in time. The idea of
MAR is clear and its value is simple to select. For web publishers it is furthermore very suitable to
employ MAR. Images are frequently embedded into a web image with a layout size smaller than its
real size. By correlating MAR with image layout size and encoding the source image in the suggested
way, the progressively transmitted image will all the time offer the best user experience without
sacrificing the quality or maintaining dissimilar image versions. In this proposal, rather than using
mechanisms to make certain dependable transmission of image packets and develop error resilience as
per Hamming R.W (1950) it is spotlighted on Progressive Image Transmission. At each of the
beginning stages this technique can indeed develop the image quality.
5.17 SYSTEM DESCRIPTION
It proposals competence for command generation to the field control system along with real time
display of different pressure & temperature flow and level parameters. Grades of elements are covered
on the animated fluid circuits of the test facility.
Progressive Order 1 Progressive Order 2
La y e r
Resolution
Figure 10. MAR ROI Coding method

90
The program modules developed are:
Program to exhibit real time parameters and value command/status display in mimic
display format. (Using Matlab)
Program to produce command through Mouse operation (Using Matlab)
Data processing of field parameters (Using Matlab)
PLC program module
Into this real-time system, this chapter details each of the steps on control & monitoring system
as planned for completion. In order, these steps are: Image capturing, Image transmission, Image
selection, control & monitoring panel and PLC programs. In this thesis, detailed new methods used are
discussed.
In Figure 11, the block diagram of control and monitoring system with real time field image is
given. Through Matlab the system is realized. The control and monitoring system contains
Programmable Logic Controller (PLC), Operator station and Field Camera is connected to the File
server through Ethernet interface. The pressure, temperature flow and level data obtained by the PLC
are accumulated in the server for on-line display and off line study.
Through Ethernet network, the Operator station is linked to file server. Manual commands are
produced by pressing mouse key in the operator station. Based on the key operation, Operator station
revises manual command database information. This database information is sent to PLC and placed
the output in the digital output card. The system hardware details are made cleared in the subsequent
section.

91
Figure 11. Network diagram

92
Table 5. Comparison of Image Acquisition sensors
Sensor Surface r Possible Advantage
CCD Chip Silicon 1.0 Linear
Vidicon Tube Sb2S3 0.6 Compress dynamic
Range > high contrast scenes
Film Silver halide <1.0 Compress dynamic
Range > high contrast scenes
Film Silver halide >1.0 Expands dynamic
Range > low contrast scenes
5.17.1 Image Acquisition
Image acquisition is the process of sampling the analog image into digital pixels for processing.
At the rate of 30 complete frames per second Video signals are developed. As NTSC video is
connected, served as a field of odd lines followed by a field of even lines, memory is necessary to alter
the image into a single progressive scan frame for processing. As per T.Sikora (1997), there are many
different configurations for transmitting video, these being: color composite, RGB and S-Video.
All the color information and frame synchronization information are multiplexed together in
Color Composite, and transported on a single wire. In RGB, the three color components and
synchronization information are separated and delivered on four separate wires. The luminance,
chrominance, and synchronization signals are passed on detached wires in S-Video. We choose to
employ the composite format for our thesis, which has the enhanced SNR and is normally supported by

93
quality off-the-shelf image acquisition hardware. In table 6, Comparison of Image acquisition sensors
stated.
In star topology, through Ethernet Switch the fileserver, Video capturing unit and operator
station are connected. The data rates among the systems are 100 Mbps. For interconnection, twisted
pair CAT5 standard cable is applied. In figure 11 Ethernet connectivity scheme is specified. With 100
Mbps Ethernet interface the fileserver is Dual processor server class computer. The fileserver offers
service to camera, PLC and operator station for sharing database. By the fileserver system, the live
parameter database live.dat, image parameter data base image.jpg and manual command Mcom.dat
database are handled. These database file are released in shared mode by both operator station and
PLC.
The operator station is computer system using Matlab based software modules. For easy
operation, it has functional key below the CRT monitor.
5.18 Software Decription
For the realization of the thesis there are three software modules proposed. They are
The PLC software module
Operator station software module.
Video capturing unit interface module
Using analog input cards the PLC software module attaining data and sent the data to the
fileserver. Likewise command information obtainable in the shared data base are employed to set the
output in Digital output card.
In the fileserver, Operator station software module is accountable for display the animated
process mimic diagram based on the data received from file live.dat in fileserver and produce the

94
command codes as per operator station mouse key and write key stoke data into file Mcom.dat. Video
capturing unit offers real time field image and are flowed for video switching.
This PLC software module obtains commands data and is decoded for facilitating the output and
is revised in the PLC output card. Based on the control system commands, output is interfaced with
field element and is activated. Sensor is interfaced to the analog input card of PLC for Acquisition of
field sensor signals. Total analog input is scrutinized by the program written in the PLC and data is sent
to server for sharing the parameter values via live.dat for on-line display and Data for offline study.
In Matlab this software module is proposed. Three functions are there carried by this module.
Real field image processing, process Animation display and command generation are the three
functions.
5.18.1 Real Time Field Image Processing
As per Sung Cheol Park et.al (2004), with JPEG method quality of the reconstructed image are
enhanced for critical display at each of the initial stages. This method obtains a vital part of the pixel
information of each block to the receiver in each stage by dividing the input image into smaller blocks.
Based on the transmitted pixel information, the receiver gets better the image from the important part
of pixel information in each block by linear prediction to reconstruct the whole image. Along with the
process display received images are shown. Additional Crop and Flip functions are furthermore offered
to process the image in hold mode for off-line study.
5.18.2 Process Animation Display
Format of amast file. Each record in AMAST file is 160 byte long and is given in table 7

95
Table 6. Amiast File Format
Byte position Description
1st byte Neglected
6 bytes Channel abbreviation
28 bytes Channel Description
6 bytes Unit
(5*15 bytes) 75 bytes a0,a1,a2,a3,a4
(10*2 bytes) 20 bytes gain, offset
(4*4 bytes) 16 bytes calvol, range, expected, tolerance
8 bytes Gaincode
In sharable mode the program understands the live.dat file in server. The sharable file mode read
operation is necessary as the protocol converter revises the similar live.dat file in every 0.5 sec.
Therefore in sharable mode, concurrent access is permitted only. In the control system the data
obtained is the same to binary valve of voltage or current specified to analog input card. Using sensor
Calibration constant, the Analog binary valve obtained from analog input card is changed into
Engineering value. In the server this calibration constant will be set aside in Analog master file. The
program understands the constant and changes all binary voltage value in to engineering value.

96
Table 7 Data file Format
Byte position Number of bytes Description
1st 4 Bytes 4 Bytes Block No.
(10*4 Bytes) 40 Bytes Time
(120*2 Bytes) 240 Bytes Channel values
(2*2 Bytes) 4 Bytes Data segregation
Format of data file. Each record in DATA file contains 28 bytes and is given.
Format of Configuration file. Details of 12b byte size configuration file is given in Table 7
Table 8 Configuration File Format
Number of bytes Description
4 Bytes No of data blocks
4 bytes Size of data blocks
4 bytes Empty
4 bytes Size of DPR
2 bytes Date, year
6 bytes Date, month, year, h:m:s
2 bytes Empty
6 bytes Empty
96 bytes Slot details

97
The next conversions are necessary after opening and reading the required input files for raw
data to get changed into engineering unit values.
Conversion of timestamp into integer format. In data file the timestamp value is in 4 byte
long. Hence every single byte is read individually and lastly it is changed into long value. The change
is as follows
Timestamp=1st Byte*(256*256*256)+2nd *(256*256)+3rd Byte *256+4th Byte*1(7.1)
Determining the Channel value (+ve or –ve).
Each Channel is 2 Byte long. The MSB clings to the sign (+ve or –ve) of the value. This data
format is in 1‟s or 2‟s complementing form. It requires 1‟s or 2‟s complement to be taken for attaining
the correct value. If MSB=0 the data is (-) ve. Hence the value is complemented by means of 1‟s
complement.
Channel value= ((256*1st Byte) +(1*2nd Byte)) (7.2)
If MSB=1 the data is (-) ve. So the value is complemented using 2‟s complement.
Channel value= ((255-1st Byte)*256 + (255-2nd Byte)*1+1) (7.3)
Conversion of AIMAST Constants into required form: The 4th order calibration constants
A0, A1, A2, A3, A4 and gain values are retrieved from AMAST file as binary value and converted into
appropriate form. For the conversion purpose a separate module called modify value is used. The
conversion process is as follows.
A0 = modifyvalue(Val(a0)) (7.4)
A1 = modifyvalue(Val(a1)) (7.5)
A2 = modifyvalue(Val(a2)) (7.6)
A3 = modufyvalue(Val(a3)) (7.7)
A4 = modifyvalue(Val(a4)) (7.8)

98
gain = modifyvalue(val(gain1)) (7.9)
offset = modifyvalue(Val(offset1)) (7.10)
Millivot value of channel.To get the required value of channels, the channel values are to be
converted into millivot form. For this conversion the following equation is used.
O/p = (channel value-offset)/gain/3.2) (7.11)
Fourth order equation Unit conversion.
Using 4th order constants the necessary output values are attained. The subsequent equation is
applied for attaining the necessary output.
Required output=A0+(A1*o/p)+(A2*o/p2) + (A3*o/p3) + (A4*o/p4) (7.12)
In the mimic diagram the changed engineering value is displayed. For displaying the parameter
value the Matlab textbox control is applied.
5.18.3 Command Generation
From the Mimic display, Pushbutton is allocated for issuing manual command. By the call back
key press event code actuation of Function keys is identified. Every 10 ms key press event code is
serviced and alters the MCOM.dat file obtainable in the text format Identification. Under toggle mode
configuration push button keys are employed for offering both ON/OFF command with single key.
Generally, transmitting a video with acceptable quality needs quite a high data rate. The
motivation for this thesis is based on the problem of transmitting the video sequences on a low data rate
channel. The approach selected to complete this is to employ progressive image transmission. In the
related camera controller PC, Camera images accomplished from different locations are continually
stored. Camera controller furthermore gradually broadcasts the images in the network for remote
monitoring by video switching. With mimic diagram of field process, Normal control and monitoring
99
system console is offered. Through detach monitor surveillance of isolated field image is shown.
Addition of isolated surveillance images with critical real time supervisory console through progressive
transmission can be executed with this thesis. This thesis furthermore offering fast delivery of images
with the packet switching capabilities of data communication networks.
As per T.Fukuhara et.al (1997) Modified JPEG Huffman coding is an uncomplicated and
intuitive method to execute the progressive image transmission. On the other hand, in the presented
progressive image transmission methods its reconstructed image quality at each of the initial stages is
not fine. In this document, we propose to introduce JPEG technique as per Feng Liu et al (2005) to
develop the quality of the reconstructed image for critical display at each of the initial stages.
Suggested method broadcasts a vital part of the pixel information of each stage by partitioning the
input image into smaller blocks.

100
CHAPTER -6
RESULTS
AND
DISCUSSION

101
RESULTS AND DISCUSSION
Remote operation field requires quite a good amount of instrumentation support for control with
monitoring purposes. Currently plant size has grown bigger. Owing to this, the Industry requires
control of different Physical parameters. This chapter details the measurement of Moisture, Liquid
Level and Oil Density. Previous remote monitoring engages the installation of dedicated hardware links among field
camera and TV monitor. The operator has to choose the view manually and monitor both operator
station terminal and TV monitor for each control operation. The operator depends on manual switching
unit for visualization of the field site. The operator frequently makes errors in choosing the right
option. Control and monitoring is incorporated along with real time field image processing in order to
have dependable selection of field image. This works out switching problem. Based on field image
compared with the standard image, automatic control signal is generated.
The current image is compared with standard image which is accumulated in the computer by
applying the distance matrix algorithm. When δ has the positive value, control signal is produced and it
is specified to the PLC for more action. Control signal is not produced when δ has a zero value.
Where = Difference,
Yi = Standard Image,
Fi = Field Image.

102
6.1 Determination of Vibration
Vibration of mechanical equipment is usually not fine. It causes too much wear of bearings,
cracking, fasteners to come loose, electric relays to break down and electronic malfunctions via the
fracture of solder joints. It grinds insulation around electrical conductors causing shorts. It is
commonly painful for humans. Vibration is openly associated to machine longevity.
A low vibration level points out that it will last a long time.
The vibration level raises when a machine is leading for a breakdown.
6.2 DETERMINATION OF CRITICAL SPEED
Figure 12. Experimental set up for Determination of Critical Speed
For determination of critical speed, the figure 12 illustrates the experimental set up. This set up
contains a variable speed motor mounted with disc with provision to add known unbalance masses at
predetermined radius. The motor with its base is escalated on a spring is guided to go in vertical
direction only by ball push. The bottom of spring is relaxing on a load cell and the load is calculated.
By a selector switch both the absolute load and amplitude of load can be measured in the load cell. In
this set up, at critical speed the vibration is high which is simply visible through normal eye. Through
digital camera and accumulated inside computer as a standard image this visible vibration can be

103
photographed. Later when the motor is in process and when it tends to overtake critical speed, the
digital camera incessantly forward the images of vibration to the computer which produces the control
signal when the incoming image matches the standard image. The subsequent figures 13 and 14 explain
the standard image and incoming image.
In an industry, as a real time application a conveyor belt is realized in a cement factory linked to
a motor. This is applied to carry the coal from the yard to furnace /pulverizing machine for speeding up
the coal transfer, the motor speed is differed. The unstable load of coal in the belt produces dissimilar
vibrations due to speed variation of motor for speeding up the work. On the other hand at a particular
speed of motor and conveyor belt when the vibration is high the control signal is produced by the
computer by this mechanism.
Figure 13 Standard Image Figure 14 Current Image
6.3 WHIRLING OF SHAFT ROTATION SPEED
If speed rotation is closer to natural frequency of the system then the amplitude of vibration will
be very high in rotating machinery. The event is called Whirling of Shaft. The speed at which whirling
happens is called whirling speed or critical speed. It is to be making certain that the machinery is not

104
running near the critical speed in any machinery. The experimental set up encloses a shaft and central
mass. The shaft is constant on two bearings and distance between bearings can be fine-tuned. By a
changeable speed motor the shaft is driven. The complete arrangement is mounted on a bed. In figure
15, the arrangement is showed.
Figure 15. Experimental Set up for Whirling of Shaft
A shaft coupled from the heavy vehicle lorry engine to the rear wheel is regarded in real time
application. The vibration of the shaft determines the speed of the lorry since at critical speed the
vibration will be high and the shaft will break which have seen at road side much time. The critical
speed is determined for the specified experimental set up as made cleared above to deal the above
through Digital Image Processing. At significant speed the vibration is high and still visible to normal
eye. This can be photographed through Digital camera and accumulated as standard image within the
computer. Later the web camera which is mounted near the shaft can incessantly forward digital image
to the computer. Control signal is produced and is given to the dash board of the driver to decrease the
speed of the drive when the current image matches the standard image. The reproduced results are as
demonstrated in figures 16 and 17

105
Figure 16. Incoming Image
Figure 17. Standard Image

106
6.4 Determination of Turbine / Generator Speed
In power station, Electricity is produced by coupling the turbine with the generator. The turbine
is turned through steam/water in thermal power station /Hydraulic Power station. Heat is produced
through nuclear fusion and water is heated and steam is produced to run the turbine in atomic power
station.
It is known that, N = F *P/120
N – Speed of turbine which is finally linked to generator.
F – Frequency
P – Number of poles in the Generator
It is necessary to uphold constant speed N to maintain the frequency F.
Figure 18. Experimental set up to measure the speed
Current Image 1
Current Image 2 Current Image3
Current Image 4
Std Image

107
Table 9. Value of δ after Image Comparison Algorithm
Sl. No
δ Value using Image Comparison Algorithm
Comparison Among the
Images Result Action to be taken
1 0 Standard Image
& Current Image 1
Generator is running at a constant Speed No Control Signal
2 0.1010 Standard Image & Current image
2
Generator is running at a speed less than
constant Speed
Control Signal is generated and is given to PLC for
further Action
3 0.1012 Standard Image & Current image
3
Generator is not running at a constant
Speed
Control Signal is generated and is given to PLC for
further Action
4 0.09892 Standard Image & Current image
4
Generator is running at a speed less than a
rated speed
Control Signal is generated and is given to PLC for
further Action
5 0.07252 Standard Image & Current image
4
Generator is running at a speed less than a
rated speed
Control Signal is generated and is given to PLC for
further Action
6 0.02162 Standard Image & Current image
4
Generator is running at a speed less than a
rated speed
Control Signal is generated and is given to PLC for
further Action
4 0.01321 Standard Image & Current image
4
Generator is running at a speed less than a
rated speed
Control Signal is generated and is given to PLC for
further Action
7 0.0523 Full Dry &
Partially Dry 4
Generator is running at a speed less than a
rated speed
Control Signal is generated and is given to PLC for further Action PLC for
further Action.
8 0.0343 Full Dry &
Partially Dry 4
Generator is running at a speed less than a
rated speed
Control Signal is generated and is given to PLC for further Action PLC for
further Action.
9 0.0112 Full Dry &
Partially Dry 4
Generator is running at a speed less than a
rated speed
Control Signal is generated and is given to PLC for further Action PLC for
further Action.

108
By more number of experimental values of the δ, the result is further enhanced for accuracy.
The same similar work is done for other tables and included in the results and discussion.
Increase / Decrease of frequency involve the domestic set up. The DIP Technique is proposed
here to uphold constant speed. Inside the computer as standard image, the coupling between the turbine
and Generator is photographed at 5 sec interval for rated constant speed and accumulated. When the
speed of the turbine differs due to less / excess steam / water which finally affect the generator speed, a
web camera which is mounted near the coupling takes nonstop photograph and promote the images to
the computer.
Accordingly, when the current image does not match the standard image control signal is
produced and control action is acquired. Figure 18 illustrate the different current images and Standard
Image correspondingly. These figures are nothing but the images of turbine shaft connection to
generator. Table 9 shows the value of δ after employing the image comparison algorithm and the
related actions to be taken place when it has positive value. The standard image is the image which is
taken at generator is running at normal speed. The current image is the image which is taken at any
time. Finally the control signal is generated only when current and standard images do not match each
other. There is no control action when current and standard images match each other. The same similar
explanation is incorporated for all other figures and tables.
6.5 CONTROL OF DISPLACEMENT
Chemical industries and power stations etc a constant level is preserved in furnaces, boilers etc
in refineries. In particular let us get the case of raw material amalgamation in a chemical industry in a
furnace and processing. Throughout the chemical processing there is chance of sudden expansion of
substances inside the huge container. Furthermore as well there is a chance of gas/bubbles generation

109
and level may immediately go high. This may rupture the container. To evade that level is incessantly
watched inside the container through ultrasonic detectors. The signal is supplied to PLC. The PLC
instantly provides control signal to control valve to unlock and drain out the necessary quantity from
the container and uphold the level.
The control valve action relies upon the LVDT connected to the stem of the control valve. In the
LVDT, the stem movement for opening alters the signal level which is watched by the computer. Later
when the necessary level is arrived at the stem closes and LVDT drives the signal to computer for
information. Now instead of LVDT, control and monitoring is carried by means of digital camera. The
different stem positions are photographed and accumulated within the computer as dissimilar standard
images. The PLC sends signals to shift the stem to an exact position depending upon level in the
container. This is photographed by web camera and forwarded to computer. This current image is
counter parted with the standard image and confirmed. PLC sends the signal to close the stem after the
necessary time. This position once more photographed and forwarded to computer. This current image
is as well counter parted with the standard image and confirmed. The Figure 19, Figure 20 and Figure
21 demonstrate the test environment.
Figure 19. Fully Opened

110
Figure 20. Fully Closed
Figure 21. Partially Closed
6.6 MOISTURE LEVEL
During rainy season, there will be much moisture in the atmosphere in India. This will direct
fungus creation in the food grain storage. Highest rainfall all through the year is found in sirapunchi. In
Kerala, rainy season is for nearly about six months in a year. Hence moisture removal is a main
requirement. Thus this section will surely assist M/S FCI (Food Corporation of India) who stock up
food grains to feed out people during food crisis.

111
Presently the technique of generating analog signal is followed to discover the moisture
substance in the food grains of the storage by including a cylindrical capacitor in the storage. Based
upon the moisture content the capacitor generates dissimilar analog voltage signal. Indeed the dielectric
constant among the plates of the capacitor differs according to the moisture content to manufacture
different permittivity value.
In current digital world we have state of the art technology namely Digital Image Processing
(using software algorithms) which is substituting all the analog techniques. Using analog sensors we
are as well proposing to substitute the old method to calculate the moisture. Dissimilar photographs
(digital camera image) are taken with dissimilar levels of moisture content (Full Dry and Full Wet) of
the food grains. These dissimilar moisture levels in the food grain photographs are accumulated within
the computer and database is generated with the experimental setup values.
Digital images are taken every one hour by means of digital camera (web camera) and
forwarded to the PC in the actual environment in the food storage unit. Using appropriate algorithm
these images are compared with the already accumulated image of moisture level (Full Dry) in the PC.
When a particular incoming image matches with the accumulated image (Full Dry), Control signal is
not produced then no action will be acquired. Control signal is created to dry the food grains through a
blower, when a particular incoming image does not match with accumulated image (Full Dry). The
time of blower to dry the food grains differs according to the moisture level decided by the images.
The test environment is demonstrated in Figure 22. This figure shows wheat which is stored in a food
grain storage warehouse and also it has the moisture due to humidity present in the external
atmosphere.

112
Figure 22 The test environment to measure moisture
Full Dry (Std Image) Full Wet
Partially Dry - 1 Partially Dry - 2
Partially Dry - 3 Partially Dry - 4

113
Table 10. Value of δ after proposed algorithm & its result
S.No δ Value using Image Comparison Algorithm
Comparison Among the Images Action to be taken
1 0 Full Dry & Full Dry No Control Signal
2 0.1104 Full Dry & Full wet Control Signal is generated and is given to PLC for further Action.
3 0.1380 Full Dry & Partially Dry1
Control Signal is generated and is given to PLC for further Action.
4 0.0948 Full Dry & Partially Dry2
Control Signal is generated and is given to PLC for further Action.
5 0.0928 Full Dry & Partially Dry3
Control Signal is generated and is given to PLC for further Action.
6 0.0912 Full Dry & Partially Dry4
Control Signal is generated and is given to PLC for further Action.
7 0.0523 Full Dry & Partially Dry4
Control Signal is generated and is given to PLC for further Action PLC for further
Action.
8 0.0343 Full Dry & Partially Dry4
Control Signal is generated and is given to PLC for further Action PLC for further
Action.
9 0.0112 Full Dry & Partially Dry4
Control Signal is generated and is given to PLC for further Action PLC for further
Action.
Table 10 shows the value of δ after using the image comparison algorithm and the related
actions to be taken place when it has positive value. The standard image is the image which is taken
when food grain is fully dry. The current image is the image which is taken at any time. Finally the
control signal is generated only when current and standard images do not match each other. There is no
control action when current and standard images match each other.

114
6.7 DRIP IRRIGATION
Watering plants/crops is a branch of cultivation/irrigation. Water is taken through path made in
the ground for water to gush towards the plants in the earlier days. This technique of watering plants
requires more water. However drip irrigation is the novel method followed wherever water shortage is
there. Whether water shortage is there or not, drip irrigation is the arrangement of the day in many
countries which overlays way for avoiding water wastage. India also follows this technology where
Israel is the first country to execute this technology.
Water is brought to the root of the plant through tubes and watered at the root in drops in Drip
Irrigation. Water is discontinued once sufficient water is poured in the form of drops at the root of the
plant. Now this is done physically. Off the late the moisture of the soil is calculated at the root of the
plant and as a result watering is done routinely. This additionally decreases water wastage compared to
while being carried out physically.
Based on Digital Image Processing, the technology is employed for automation. A digital
camera (Web Camera) is mounted near the root of a plant to take photograph (Digital Images) of the
soil. Dry soil image and Wet soil image are accumulated within the computer as standard images. At
the operator station, the Digital Camera will incessantly takes photograph of the soil and forward the
images to the computer.
The computer produces a control signal to open the valve for drip irrigation when standard
image for Dry soil matches the incoming image. With drops of water the soil gets wet and the moisture
level rises. When the preferred moisture is accomplished the computer produces a control signal to
close the valve for drip irrigation based on the incoming image from the digital camera. Through an
appropriate algorithm, the comparison of the incoming images with standard image is prepared in the

115
computer. The experimental set up is displayed in Figure 23 and in Figure 24 Test set up is displayed.
These figures are the representation of dry soil before drip irrigation and wet soil after drip irrigation.
Figure.23. Dry Soil
Figure 24. Wet Soil
Table 11 demonstrates the value of δ after using the image comparison algorithm and the related
actions to be taken place when it has positive value. . The standard image is the image which is taken
when soil is fully wet. The current image is the image which is taken at any time. Finally the control

116
signal is generated only when current and standard images do not match each other. There is no control
action when current and standard images match each other.
Table 11 Value of δ after proposed algorithm & its actions.
Sl.
No δ Value using Image
Comparison Algorithm Comparison Among
the Images Action to be taken
1 0 Full Wet Soil & Full Wet Soil No Control Signal
2 0.3580 Full dry Soil & Full Wet Soil
Control Signal is generated and is given to PLC for further Action
3 0.2432 Full dry Soil & Full Wet Soil
Control Signal is generated and is given to PLC for further Action
4 0.1431 Full dry Soil & Full Wet Soil
Control Signal is generated and is given to PLC for further Action
6.8 LEAD PLACEMENT IN PENCIL
We daily look a problem of breaking the pencil lead by our children while mending it in our
home. We yell at the child for that. But the reason is not the child‟s fault. Actually the mistake is with
the manufacturer.
It is totally needed to place the lead inside the pencil precisely in the centre of the wooden
structure. The lead will break when we mend it if it is not in the centre of the wooden structure. It is not
at all possible to check the precise centre position of the lead in the wooden frame by the human
means.
We can inspect the centre position of the lead by using Digital Image Processing (DIP)
technology. At first, we have to store the correct centre position of the lead photograph inside the PC as
standard image. Then, through an applicable algorithm the front view of every pencil is photographed

117
and compared with the standard image. The pencil is passed by the checking supervisor when the
image of the front view of the new pencil matches with the standard image. The experimental setup is
showed in figure 25 and figure 26. These figures are representing incorrect position of the lead pencil
and correct position of lead
Figure 25 Incorrect position of the lead
Figure 26 Correct (Centre) position of the lead
6.9 OIL DENSITY ADULTERATION
There is a corruption of adulterating the good quality items to raise the quantity in usual world.
For instance water is mixed with milk; likewise palm oil is mixed with vanaspathi. In the current days
water mixing with milk is tested with lactometer Palm oil mixing with vanaspathi is tested by adding a
chemical substance. A color change is found if there is a mixing in the vanaspathi. On the other hand
the quantity of mixing could not be identified.
A new way for scrutinizing the quantity of adulteration in the liquids is released by the state of
art technology of Digital Image Processing. The image taken through digital cameras differs for

118
different adulteration levels. Normal eye can never identify small quantity of adulteration. Photographs
are taken through digital cameras of different levels of adulteration they are stored inside the computer
as an experimental setup.
The liquid photograph is taken and is compared with the previously accumulated image inside
the PC and a signal is produced when it matches the image in the normal checkup. This point out the
adulteration quantity even for small amount. The experimental setup is as displayed in Figure 27 and
Figure 28.These figures represent the pure and impure oil.
Figure 27 Impure Oil
Figure 28 Pure Oil

119
6.10 MEASUREMENT OF POLLUTION
Through different researches, this idea of digital image capturing is to be investigated to employ
in different areas. Pollution measurement is another example. In industries smoke is expelled by
automobiles and chimneys. The image can be practiced and substance of carbon in the smoke by taking
a photograph of the smoke. Depending upon the color of the smoke, it can be examined coming out of
industrial chimney at a particular height can be out looked through normal eye. This DIP method, to
take a photograph of the smoke and examine the actual content of carbon, is demonstrated in figure 29.
Figure 29 Carbon content Photograph (Taken from automobile)
In addition, the electrostatic filter (meant for filtering the carbon content in the smoke before
releasing to the atmosphere) can be routinely changed (controlled) through the control signal from the
real time computer based signal from the genuine time computer based on the smoke on the smoke
photograph.
6.11 MEASUREMENT OF PRESSURE
In a CNC controlled lathe the safety door closing and opening of the job handling chuck is
regarded. When the job is filled in the holder (Chuck) the lathe begins its action, while the safety door
is closed. In order to outlook the running job the safety door is a transparent fiber closure for external

120
technicians. If the safety door is not locked the lathe will not work. When the program is instigated the
transparent closure routinely closes and relaxes on a strain gauge. The strain gauge creates an analog
signal which intimates that the safety door is closed. Through a web camera, a photograph is taken in
the test experiment. (For safety door closing) This is the standard image accumulated in the computer.
Before the lathe begins its action, it verifies for the safety door closing. For this reason, a digital
camera image is compared with the standard image. The lathe begins its operation if both images
match. The figures 30 and 31 present the actual test environment of door closure and door opener.
Figure 30 Door closure
Figure 31 Door opening
6.12 Liquid Level Control
By performing experiments in the lab test results are attained. A tank having different liquid
levels are photographed (through digital camera) for high level and low level. These are the STD
images accumulated inside the computer (as shown in figure 32). After that in every two seconds the

121
running level of liquid in the tank (during fill up) are photographed through digital camera and
forwarded to the computer for comparison with the standard image. Control signal is created when
the current level image matches with the STD image. This signal is forwarded to the PLC for PID
control. Figure 32 display the test environment.
Figure 32. Test Set up to measure Liquid Level
Actually merely the idea is elucidated here. This level measurement can be exploited in high
temperature boiler drum water level measurement in thermal power station where ordinary small sensor
node usage is not feasible. In Steel industries the steel level measurement is being made by the similar
procedure described above. Coal powder and oil are mixed to burn and produce heat in coal burning
furnaces in industries (Cement factory, process industry). Now proper level is to be retained.
Low Level Level- I Level- II Level- III
Level- IV Level- V Level- VI High Level

122
6.13 TEST TO VERIFY THE LIQUID LEVEL
Figure 33 Indicates Testing set up to find out the liquid Level
With true measurement, the testing purpose was to verify the liquid level measurement
computed by software. In this testing the liquid level measurement testing was performed with the
subsequent set up. First as per Ti-Ho Wang et.al (Aug 2007), Muljowidodo.K et al (Sep 2009) the
liquid level calibration is made. The principle of calibration is to discover the linear scale of pixel to
liquid level. As shown in figure 33, the camera is placed 100 cm away from the tank. With this system,
the distance of the laser spot to the image centre was 24 pixels. It meant that one pixel symbolizes
24/100 cm, detailed by Lowe D.G (20004), Mates J. (2002) and Rzhanov. Y and Fleyeh. H (2008).
Table 12 gives value of the true liquid level and Measured Liquid Level. The calculated mean
Absolute Error between them is only 0.13573
Camera Centre
Laser beam Laser Pointer
Camera

123
Table 12 True liquid level, Measured Liquid Level and its error
Sl. No
Liquid Level True Liquid Level(cm) Measured Liquid Level (cm) % Error
1 Low Level 2.5 2.4 4
2 Level -I 4.0 4.08 -2
3 Level –II 5.5 5.58 -1.45455
4 Level -III 7.0 6.96 0.571429
5 Level -IV 8.5 8.6 -1.17647
6 Level-V 10.0 10.04 -0.4
7 Level-VI 11.5 11.52 -0.17391
8 High Level 13.0 12.90 0.769231
Mean Absolute Error 0.13573

124
The figure 34 explains the true liquid level versus measured liquid level.
Figure 34 True liquid level versus measured liquid level.
6.14 SUMMARY
The main benefits of utilizing the web camera are as follows:
1. Nonstop recording of commands during control operation.
2. Real time show of field images
3. Offers both auto and manual control command generation for test operation.
4. Offers facility for scaling up additional measurements.
5. In normal sensors frequent calibration is essential once in six months.
6. Reply and precision is more effective in digital Image processing Techniques
7. Hysteresis effect which is normal in analog sensors is not accessible in camera.
8. The actual image of the isolated field is also visible in the computer screen which is super
imposed on the mimic diagram.

125
9. The transmission of analog signal from distant location is always inaccurate.
The novel exciting result by idea of integrating real time field images by eliminating separate
TVs will lead to a Digital Factory. This new architecture releases exciting possibilities in testing fault
diagnosis, real time control, performance analysis and drastic improvement on production ability. Now
the novel exciting result of idea of integrating real time field images by eliminating separate TVs by
means of the high level deterministic real-time capability seem to be very eye-catching for most
demanding isolated control applications. The new architecture and methodology is suggested for real-
time control and monitoring with a rational network open exciting possibilities in testing and
presentation study. Under tremendous conditions Network with PLC endows control dependability to
the system even.
As per Lewis M. (2000), this chapter offers a novel methodology for proposing high speed
image comparison by employing high speed DSP application. Under different working environment
Table 14 demonstrates the image comparison speed. From the image comparison table it is known that
other methods will take more time but our methodology guarantees to offer the decreased time to
compare images. The incredibly plan of the paper is to employ digital camera and to raise the image
comparison speed.
This paper is focused on the efficient control of speed in power station, measurement of
moisture in food storage area and the vibration control. The main objective of the paper is to support
speedy comparison of images. Even though, comparison algorithms are successful at software level,
better results can be achieved by implementing in hardware.

126
Table 13 Image Comparison Time Analysis
Sl.No Platform Image Comparison Speed
1 C 20ms
2 Mat lab 11ms
.
For most demanding remote control applications, the new exciting result of Digital Image
processing based online control and monitoring with the high level deterministic real-time capability
appear to be very noticeable. The new architecture and methodology recommended for real-time
control and monitoring with a rational network open – inspiring possibilities in testing and presentation
study. Network with PLC provides control dependability to the system even under tremendous
conditions. The subsequent table demonstrates the presentation of suggested method with presented
methods with respect to different parameters.
Table 14 Performance of proposed method
Sl No
Parameters Previous Method Present Method Proposed
method
1 Responsive Time 5sec 45ms 11ms
2 Accuracy 80% 85% 94%
3 Calibration Twice a Year Twice a Year Not Required
4 Hysteresis Normal Normal NA
5 Operation Manual Partially Automatedddd Fully Automated
7 Quality Of Signal Transmission Max error Normal Error Minimum Error
8 Mean Absolute Error 7.4% 5.2% 0.14%

127
It is assumed that digital cameras perform a very significant role in process industries from the
table. These experimental set up pay digital signal from digital cameras serves control and monitoring
more effectively. In the process operations the real-time control and monitoring of field elements for
many hours or days may be scrutinized in case of abnormality. Redundancy can be combined to have
enhanced dependability in case of system failure.

128
CHAPTER -7
CONCLUSIONS
&
FUTURE WORK

129
In nature, most industrial process plants are dangerous. For smooth running of the plant remote
monitoring of the plant engages control and monitoring of a lot of control points. Digital image
processing based on line control and monitoring supplies the purpose in a manner different from the
presented ways. For control and monitoring, Digital image signals are employed instead of analog
sensor signals.
In an industry vibration control and monitoring taken through experimental setup supplies for a
real time application; a conveyor belt is understood in a cement factory linked to a motor. This is
employed to carry the coal from the yard to furnace/pulverizing machine. The motor speed is differed
for speeding up the coal transfer. The unstable load of coal in the belt makes different vibrations due to
speed variation of motor.
For speeding up the work it is frequently an affinity to increase the speed of the motor. On the
other hand at a particular speed of motor and conveyor belt when the vibration is high the control
signal is produced by the computer by comparing the standard digital image of high vibration
previously accumulated inside the computer with the incoming image when it matches.
In rotating machinery, if speed of rotation is closer to natural frequency of the system then the
amplitude of vibration will be inflated. The event is so-called Whirling of Shaft. The speed at which
whirling takes place is named whirling speed or critical speed.
A shaft linked from the heavy vehicle lorry engine to the rear wheel is considered in real time
application. The vibration of the shaft chooses the speed of the lorry as at critical speed the vibration
will be high and the shaft will break which have seen at road side much time. The vibration is high and
even visible to normal eye at critical speed. Through Digital camera this can be photographed and
control and monitoring is effectively made.

130
To support the frequency F, it is required to sustain constant speed N in a generator.
Increase/Decrease of frequency effect the domestic set up. The DIP Technique is suggested here to
maintain continuous speed. The coupling among the turbine and Generator is photographed and speed
control and monitoring is successfully performed without any analog speedometer though only with
digital camera.
In refineries, chemical industries and power stations etc a stable level is continued in furnaces,
boilers etc. In specific, in a furnace and processing let us take the case of raw material mixing in a
chemical industry. During the chemical processing there is chance of unpredicted expansion of
substances inside the huge container. Moreover, also there is a chance of gas/bubbles generation and
level may instantly go high.
This may explode the container. To evade that level is incessantly monitored in the container
through ultrasonic detectors. The signal is supplied to PLC. The PLC instantly gives control signal to
control valve to open and exhaust out the necessary quantity from the container and sustain the level. In
past days, the control valve action relies upon the LVDT connected to the stem of the control valve.
Displacement control and monitoring is effectively performed without LVDTs, however by employing
the digital images of the stem positions of the control valve.
In India, during rainy season there will be much moisture in the atmosphere. This will direct
fungus creation in the food grain storage. In sirapunchi highest rainfall during the year is found. In
Kerala, rainy season is for almost about six months in a year. Hence moisture removal is a main
commitment. And so this section will completely help M/S FCI (Food Corporation of India) who stores
food grains to feed out people during food crisis. In order to produce control signals Digital
photographs of moisture in the food grain are used.
131
Watering plants/crops is a branch of cultivation/irrigation. In the past days water is taken
through path made in the ground for water to gush towards the plants. This method of watering plants
requires more water. However drip irrigation is the novel method followed wherever water shortage is
there. Whether water scarcity is there or not, drip irrigation is the arrangement of the day in many
countries which overlays way for avoiding water wastage. India as well follows this technologyand
Israel is the first country to execute this technology.
Water is brought to the root of the plant through tubes and watered at the root in drops in Drip
Irrigation. Water is stopped once sufficient water is poured in the form of drops at the root of the plant.
Presently this is made physically. Off the late the moisture of the soil is calculated at the root of the
plant and as a result watering is done routinely. This additionally decreases water wastage compared to
while being performed physically. Through DIP this is now effectively made.
Through an appropriate algorithm the comparison of the incoming images with standard image
is made in the computer. Moisture control is effectively performed by means of digital cameras. We
daily look a problem of breaking the pencil lead by our children while mending it in our home. We
yell at the child for that. However the reason is not the child‟s mistake. Actually the mistake is with the
manufacturer.
It is completely required to place the lead in the pencil exactly in the centre of the wooden
structure. The lead will break when we mend it if it is not in the centre of the wooden structure. The
human way of inspecting the correct centre position of the lead in the wooden frame is not at all
possible. We can scrutinize the centre position of the lead by employing Digital Image Processing
(DIP) technology. It is successfully executed through DIP technology.

132
There is a bribery of adulterating the good quality items to raise the quantity in normal world.
For instance water is mixed with milk; likewise palm oil is mixed with vanaspathi. In the current days
water mixing with milk is tested with lactometer Palm oil mixing with vanaspathi is tested by adding a
chemical substance.
Adulteration is verified by applying DIP technology process. The liquid photograph is taken and
is matched with the formerly accumulated image within the PC and a signal is produced when it
matches the image. This highlights the adulteration quantity even for small amount. Adulteration
control and monitoring is successfully executed.
Through different researches this idea of digital image capturing is to be investigated to employ
in different areas. Pollution measurement can be one more example. In industries Smoke is expelled by
automobiles and chimneys. By taking a photograph of the smoke, the image can be practiced and
substance of carbon in the smoke. Smoke can be examined coming out of industrial chimney at a
particular height can be out looked through normal eye depending upon the color of the smoke. This
DIP technique, to take a photograph of the smoke and to examine the actual substance of carbon.
In addition the electrostatic filter (meant for filtering the carbon content in the smoke before
releasing to the atmosphere) can be routinely changed (controlled) through the control signal from the
real time computer based signal from the real time computer based on the smoke on the smoke
photograph. Using digital cameras Pollution control and monitoring is effectively performed.
In a CNC controlled lathe, the safety door closing and opening of the job handling chuck is
regarded. When the job is filled in the holder (Chuck) the lathe begins its action, once the safety door is
sealed. In order to outlook the running job the safety door is a transparent fiber closure for external
technicians. The lathe will not work if the safety door is not closed. When the program is instigated the
transparent closure routinely closes and relaxes on a strain gauge. The strain gauge creates an analog

133
signal which intimates that the safety door is sealed. Through a web camera a photograph is taken in
the test experiment. (For safety door closing) This is the standard image accumulated in the computer.
Before the lathe begins its operation, it makes sure for the safety door closing. A digital camera
image is compared with the standard image for this purpose. The lathe begins its operation if both
images match. Using digital cameras Pressure control and monitoring is effectively performed. A novel
methodology is brought in for designing high speed image comparison by applying high speed DSP
application. Under different working environment Table 16 demonstrates the image comparison speed.
From the image comparison table it is known that other methods will take more time however our
methodology promises to give the decreased time to compare images. The incredibly plan of the
document is to employ digital camera and to increase the image comparison speed. This paper is
spotlighted on the competent control of speed in power station, measurement of moisture in food
storage area and the vibration control. The most important purpose of the paper is to hold up speedy
comparison of images. Although, comparison algorithms are doing well at software level, improved
results can be accomplished by executing in hardware.
The study’s contribution:
The factors like responsive time, accuracy, calibration, hysteresis, automation. Signal
transmission, mean absolute errors are calculated. Based on the research work the following
contributions are made to physical parameters speed, pressure, level, vibration and moisture and oil
density adulteration. The responsive time for control is only 11 ms compared to presented method of 45
ms.
The precision of the physical parameter value is not less than 94% compared to the maximum
accuracy of 85% in the presented method. The mean absolute fault of measured values of physical
parameter is 0.14% compared to presented method with mean absolute error of 5.2%. In process
134
industries, it is known that digital cameras perform a very important role. These experimental set up
employ digital signal from digital cameras which supplies control and monitoring more successfully.
Summarized conclusion is:
1. In this effort Digital cameras are to take photographs of the isolated fields and that Digital
Images / signals are applied to control and monitor different parameters like temperature,
pressure, flow, displacement etc, which were formerly controlled by means of analog signals
from RTDs, Thermo couples, were strain gauges, LVDTs, load cells, etc.
2. For continuous transmission of field images, the Digital camera is connected to the operator
station. Field images are confined and encoded for real time monitoring. Image compression
JPEG standard is considered. Progressive Image Transmission techniques are deploed by
sending a coarse version of the original image and after that refining it slowly to take out
ROI (Region of Interest) with more than ninety-six percent matching with the real value.
3. Through Ethernet interface, Field cameras are connected to file server. The pressure, flow,
level, etc data obtained as Digital images are processed by Distance Matrix algorithm to
produce control signal. The incoming image is compared with standard image accumulated
in the operator station within eleven milliseconds by means of MATLAB program. The
control signal is forwarded to PLC for PID control.

135
7.1 SCOPE OF FUTURE WORK
In this thesis, a novel novelistic technique is introduced. That is Digital images (digital signals)
are employed for control and monitoring, different physical parameters like pressure, flow, level
temperature, displacement, vibration, speed, etc., in a harmful plant. The reason for applying these
digital signals instead of analog signals emanating from different analog sensors like RTD, LVDT,
strain gauge, tachometer, thermocouple, etc., are disscussed in detail in this thesis.
Analog signal transmission is fault prone. And analog sensors like RTD, thermocouple, strain
gauges, LVDT, etc., need regular calibration. In addition analog sensors display characteristic of
hysteresis. That is the measured value will not be the equal among the upward measurement and
downward measurement for the similar numerical value of the signals produced by the analog sensors.
The future possibility can be two fold. The theory deals with signals (images) from digital
cameras for only control and monitoring different physical parameters like flow, level, pressure,
temperature, displacement, vibration, speed, etc.,. The measurement of different values of these
physical parameters is till taken care by the analog sensors like RTD, T/C, strain gauge, tachometer,
LVDT, etc.,. As a result future scope these different analog sensors can be substituted and digital
cameras can only be employed for measurement with control and monitoring of these physical
parameters.
That is different digital images of a particular parameter can be accumulated inside the real time
operating system based data acquisition system. These images can be evaluated with the incoming
images and the values of the physical parameter can be determined. For instance, get the case of level
measurement, control and monitoring. In this theory the standard images of low level and high level of
the tank are accumulated in the operator station. The standard images are compared with the incoming
image when the incoming image from the remote plant arrives at the control room. Control signal is

136
produced when the standard image of low level matches with the incoming image. In a thermal power
plant station this is forwarded to PLC to switch on the Boiler feed pump of the demineralization plant.
Likewise, in case of the incoming image from the digital camera mounted at the isolated plant matches
with the standard image of high level previously accumulated in the computer, control signal is
produced and forwarded to D/A converter to switch off the pumping monitor.
Nevertheless as a first future possibility can be that different images of different levels with
values can be accumulated inside the computer and when the incoming images matches with any
accumulated image inside, the related value of that level can be shown. These images are not for
control action however only for measurement and showing the values only. On the other hand control
action can be produced only for upper level and low level. Likewise, measurement can be prepared for
different physical parameters like pressure, flow, displacement, vibration, speed, temperature etc.
However control signal can be produced and monitored during abnormalities.
This will direct to total elimination of analog sensors from the isolated field for measurement as
well, there by overcoming the detach cable laying for analog sensors from isolated field to control
room and decrease the cable and cable laying expenses and troubleshooting burden. Recalibration work
does not happen and hysteresis characteristic does not appear into picture in any way.
The second future possibility is in taking steps to raise the image comparison speed to
accomplish control and monitoring. Comparison algorithms are doing well at software level which is
applied in this research work. By DSP supporting FGPA of VLSI using Xilinx High speed image
comparison can be accomplished at hardware level. As per Chandrasekaran A.P et.al (1995), Fei Sum
and Tong Zhang (2005) the standard image accumulated within the operating station real time
operating system based computer can be compared within nanoseconds by means of VLSI
implementations with low power consumption, which is the arrangement of the day.

137
3D printing (or additive manufacturing) is a truly revolutionary emerging technology that could
up-end the last two centuries of approaches to design and manufacturing with profound implications in
the geopolitical, economic, social, demographic and security spheres. 3D printing in simple terms is a
technology that allows one to transform a digital file to a physical object. One can print real objects in
three dimensions, depending of course on the capabilities of the printer. The proposed techniques in
this research work can further be explored for “Fused Filament Fabrication”.

138
CHAPTER -8
REFERENCES

139
1. Hartley (1928), „Transmission of Information‟, Bell System Technical Journal, pp. 379-423.
2. Nyquist H. (1928), „Certain topics in telegraph transmission theor‟, Transaction on AIEE, Vol. 47,
pp. 617-644.
3. Kotelinikov (1947), „Theory of potential noise immunity‟, Ph.D. Thesis, Officially adopted by the
MPEI Scientific Council.
4. Shannon C.E. (1948), „A Mathematical theory of communication‟, Bell System Technical Journal,
Vol.27, pp.379-423 and 623-656.
5. Hamming R.W. (1950), „Error- detecting and error-correcting codes‟, Bell System technical
Journal, Vol.29, No. 2, pp.147-160.
6. Elias P. (1955), „Coding for noisy channels‟, IRE Conv. Rec., Vol. $, pp. 37-46.
7. Wozencraft J.M. and Jacob (1957), „Sequential decoding for reliable communications‟, Research
Lab of Electronics, MIT, Tech. Rep. 325.
8. Fano R.M. (1963), „A heuristic discussion of probabilistic decoding‟, IEEE Trans. Inf. Theory, Vol.
IT-9,pp. 64-74.
9. Massey J.L. (1963), „Threshold Decoding‟, Massachusetts: M.LT. Press.
10. Jelink F. (1969), „A fast sequential decoding algorithm using a stack‟, IBM J. Res. Develop., Vol.
13, pp. 65-685.
11. Macwilliams F.J. and Sloane N.J.A. (1977), „The Theory of Error-Correcting Codes‟, Amsterdam:
Elsevier B.V.
12. Clark G.C. and Cain J.B. (1981), „Error Correction Coding for Digital Communications,‟ New
York: Plenum Press.

140
13. Daut D., Modestino J. and Wismer L. (1982), „New Short Constraint Length Convolutional Code
Constructions for Selected Rational Rates, „ IEEE Transactions on Information theory, Vol. 28, No.
5, pp. 794-801.
14. Lindt J.H.V. (1982), Introduction to Coding Theory‟, Berlin and Newyork: Springer-Verlag.
15. Shu Lin and Costello D.J. (1983), „Error Control Coding: Fundamentals and Applications‟, Prentice
Hall.
16. Anderson J.B. and Mohan S. (1984), „Sequential coding algorithm: A survey and cost analysis‟,
IEEE Trans. Commun., Vol. 32, pp. 169-176.
17. Chevion D., Karnin E.D and Wallach E. (1991), „High Efficiency Multiplication Free
Approximation of Arithmetic Coding‟, IEEE International Conference on Data Compression, pp.
43-52.
18. Lee C.y., Catthoor F. and De Man H. (1991), „Breaking the bottleneck of sequential decoding for
high-speed digital Communications‟ ,In Proceedings on International Conferenceon Acoustics,
Speech and Signal Processing, pp. 1213-1216.
19. Chandrakasan A.P., Sheng S. and Brodersen R.W. (1992), „Low power CMOS digital design‟
,IEEE Journak of Solid State Circuits, Vol. 27, No.4 ,pp.$73-483.
20. Berrou C., Glavieux A. Thitimajshima P. (1993), „Near Shannon Limit Error correcting Coding and
Decoding: Turbo-codes‟, In Proc. IEEE International Communication Conference, France, pp.
1064-1070.
21. Gennady Feygin, Patrick Glenn Gulak and Paul Chow (1993), „Minimizing Error and VLSI
Complexity in the Multiplication free Approximation of Arithmetic Coding‟ ,IEEE Conference on
Data Compression Conference (DCC-93), pp. 1118-127.

141
22. Manju Hedge V., Morteza Naraghi-Pour and Xiawei Chen (1994), „Convolutional Coding for Finite
State Channels‟ ,IEEE Transactions on Communications, Vol.42, No. 42, pp.152-159.
23. Bellaouar A. and Elmarsry M. (1995), „Low Power Digital VLSI Design‟, Kluwer Academic
Publishers.
24. Chandrakasan A. and Brodersen R. (1995), „Low Power Digital CMOS Design‟, Kluwer Academic
Publishers.
25. Chandrakasan A. and Brodersen R. (1995), „Minimizing Power Consumption in Digital CMOS
Circuits‟, In Proc. of the IEEE, pp. 498-523.
26. Proakis J. (1995), „Digital Communications‟, Mcgraw-Hill, New York, pp.340-500.
27. Wicker S.B. (1995), „Error Control Systems for Digital Communication and Storage‟, Prentice Hall.
28. Parr.E.A.(1995) Programmable Controllers An Engineer‟s Guide,Newnes an imprint of Butterworth
Heinemann Ltd,Oxford,PP 325
29. Rockwell Automation (1995), Allen Bradley Automation Systems,PP345
30. Wonderware Corporation (1995) In touch –User‟s Guide PP 489
31. S. Okubo, “Reference model methodology – A tool for collaborative creation of video coding
standards”, Proc. IEEE, Vol.83, pp.139-150, Feb.1995.
32. C.H.Chou and C.W. Chen, “A Perceptually Optimized 3-D subbabd codec for video
communication over wireless channals” IEEE Transactions Circuit Systems Video Technology
Vol.6 PP-143-156, Apr 1996.
33. T.Fukuhara, K.Asai “Very low bitrate video coding with blocking partitioning and adaptive
selection of two differential frame memories,” IEEE, Circuit vol 7, pp212-220, Feb 1997.
34. T.Sikora. “The MPEG-4 Video Standard verification models” IEEE, Video tech vol 7, pp 19-31,
Feb 1997.

142
35. H.Schulzrine,A.Rao “ Real Time Streaming Protocol” IETF,RFC 2326,1998
36. Yeap G.K. (1998), „Practical Low Power Digital VLSI Design‟, Massachusetts: Kluwer Academic
Publishers.
37. Husted P. (1999), „Design and Implementation of Digital Timing Recovery and Carrier
Synchronization for High speed Wireless Communications‟, Master Project Report, University of
California at Berkeley, Fall.
38. Lewis M. (2000), „low power asynchronous digital signal processing‟, Ph.D. thesis, The School of
Computer Science, The University of Manchester.
39. Munteanu M.C. (2000), „Low power design of integrated circuits‟, M.Phil. Thesis, Department of
Electronic and Electrical Engineering, The University of Sheffield, Sheffield.
40. AthanasiosSkodras “ The JPEG 2000 still image Compression Standrad ” IEEE Signal Processing
Sep 2001
41. C.S. Kim, R.C.Kim “Robust transmission of video sequence using double vector compensation,”
IEEE, Circuit Vol. 11, PP 1011-1021, Sept 2001.
42. B.Girod,M.Kalman,Y.Jiang, “Advance in Channal Adaptive Video Streaming” IEEE Image
Processing, Vol 1,PP 9 -12, 2002.
43. Trappe W. and Washington L.C. (2002), „Introduction to Cryptography with Coding Theory‟,
Upper Saddle River, NJ: Prentice Hall.
44. Matas J, Chum O, Urban M & Pajdla T, Robust wide baseline stereo from maximally stable
external regions. In Proc. of British Machine Vision Conference, pp.384-396. 2002.
45. Huffman W.C. and Pless V. (2003), „Fundamentals of Error-Correcting Codes‟, Cambridge:
Cambridge University Press.

143
46. Mackay D.J.C (2003), „Information Theory, Inference, an Learning Algorithms‟, Cambridge:
Cambridge University Press.
47. Proakis J.G. and Masoud Salehi (2003), „Communication Systems Engineering‟, Pearson Education
Asia, pp. 1399-1401.
48. Maheswari A., Burleson W. and Tessier R. (2004), „Trading off transient fault tolerance and power
consumption in deep submicron(DSM) VLSI circuits‟ , IEEE Transactions on Very Large Scale
Integration (VLSI) System, Vo.12, No.3, pp.299-311.
49. Branover A., Kol R. and Ginosar R. (2004), „Asynchronous designed by conversion: converting
synchronous circuits into asynchronous ones‟ , Proc. Design, Automation and test in Europe
Conference on Signals, Systems and Computers, Pacific Grove, Calif , USA, Vol.1, pp.66-71.
50. Lowe D.G, Distinctive image features from scale-invariant key points. In International Journal of
Computer Vision, 2004.
51. HaoWang,S.Venketesan “ Adaptive Video Transmission over single wireless Link” The tenth
International Conference on Distriduted Multimedia Systems,PP 116-121, San Francisco 2004
52. L.Chiariglione, “ The development of an Integrated audiovisual coding standard: MPEG ,”
Proc.IEEE Vol.83,PP151-157, Feb 2004
53. Sung Cheol Park. Moon Gi Kang “Spatially adaptive High-Resolution image reconstruction of
image reconstruction of DCt-based compressed images “Proc IEEE Vol 13. Np.4 Apr 2004.
54. AthanasiosLeontaris “Video Compression For lossy packet networks with mode switching and Dual
frame buffer” IEEE Image Processing Vol.13.No.7 July 2004
55. Andrew Secker and David Taubman,“ Highly Scalable video compression with scalable motion ”
IEEE Image Processing Vol.13,No.8,August 2004.

144
56. Yusuo Hu1, Xing Xie, Zonghai Chen, Wei-Ying Ma “Attention Model Based Progressive Image
Transmission” 2004 IEEE.
57. Halang W.A.,StoyenkoA.D (2004) Constructing Predictable Real time Systems,Kluwer Academic
Publishers,PP 254
58. Soren Forchhammer, Xiaolin “Optional context quantization in loss less compression image data
sequences” Proc. IEEE,vol 13, no.4 April 2005.
59. Hyongsuk Kim, Chun-Shin Lin, Jaehong Song, and HeesungChae, “Distance Measurement Using a
Single Camera with a Rotating Mirror” International Journal of Control, Automation, and Systems,
vol. 3, no. 4, pp. 542-551, December 2005.
60. Feng Liu and Chi-Ying Tsui (2005), „A Data Discarding Framework for Reducing the Energy
consumption of Viterbi Decoder in Decoding Broadcasted Wireless Multi-Resolution JPEG2000
Images‟ , 3rd Workshop on Embedded Systems for Real-Time Multimedia, Nos. 22-23, pp.21-26.
61. Jeanne M., Carlach J.C. and Siohan P. (2005), „Joint source-channel decoding of variable-length
codes for convolutional codes and turbo codes‟, IEEE Transaction on Communications, Vol. 53,
No.1, pp. 10-15.
62. Marion Jeanne., Jean-Claude Calarch and Pierre Siohan (2005), „Joint Source-Channel Decoding of
Variable-Length Codes for Convolutional Codes and Turbo Codes‟ ,IEEE Transactions on
Communications, Vol. 3, pp.10-15.
63. Sang-Ho Seo and Sin –Chong Park (2005), „Low Lattency and Power Efficient VD Using Register
Exchanged State-Mapping Algorithm‟ ,IEEE Fifth international Workshop on System-on-Chip for
Real-Time Applications, Nos. 20-24, pp. 380-384.

145
64. Muljowidodo K, Sapto Adi N, Said D Jennie & Agus Budiyono. 2006. Design, Development and
Testing Underwater Vehicle: ITB Experience. In Proceeding of International Conference On
Underwater System Technology: Theory and Applications, Penang Malaysia.
65. Kewu Peng and John C.Kieffer. embedded Image compression IEEE image processing Vol 13,
No.8, 2006.
66. H.Pan,W.C.Siu and N.F.Law, “Lossless image compression using Binary Wavelet Transform” IET
Image Process 2007,Issue 4 PP 353-362
67. Rahul Jain and Preeti Ranjan Panda “An efficient pipelined VLSI architecture for lifting based 2 D
Discrete Wavelet Transform” 1-4244-0921-7?07$25.00@2007 IEEE.
68. PengCao,XinGuo,Chao Wang and JieLi“Efficient Architecture for Two Dimensional Discrete
Wavelet Transform Based on Lifting Scheme” I-4244-1132-7/07/$25.00@2007 IEEE
69. Ti-Ho Wang,Ming-Chihlu,Wei Yen Wang,Cheng Yen Tsai “ Distance Mesurement using single
non metric CCD camera”,Proceedings of 7thconf on Signal Processing Computational Geometry &
Artificial Vision,Atens,Greece,Aug,2007
70. Jiho park, Dong-Chul park contrnt based adaptive spatio-Temporal methods for MPEG Repair
IEEE, image Processing vol.13. No.8, Aug 2007.
71. Fie Sun and Tong Zhang (2007), „Parallel High-Throughput Limited Search Trellis Decoder VLSI
Design‟, IEEE Transactions on Very Large Scale Integration (VLSI) Systems, Vol. 1, No. 9, pp.
1013- 1022.
72. Rzhanov Y, Mamaenko A. & Yoklavich M, UVSD: Software for Detection of Color Underwater
Features.
73. Fleyeh H, Traffic and Road Sign Recognition. In thesis, . Napier University, 2008.

146
74. Tsung-Han Tsai, Yu-Hsuan Lee, Yu-Yu Lee “Design and Analysis of High-Throughput loss less
Image compression Engine using VLSI oriented FELICS Algorithm” IEEE Transactions on Very
Large Scale Integration(VLSI) Systems, 1063-8210/$25.00 © 2009 IEEE.
75. Muljowidodo.K.,Mochammed.A.Rasid,Saptoadi.N.,AgusBudiyono “Vision Based distance
Measurement System Using single Laser Pointer design for underwater Vehicle” Indian Journal of
Marine Sciences,Vol.38(3),Sep 2009,PP 324-331.
76. Ti-Ho Wang a, Ming-Chih Lu a, Chen-Chien Hsu b, Cheng-Chuan Chen a, Jia-Dong Tan, “Liquid-
level measurement using a single digital camera” Measurement 42 (2009) 604–610, Elsevier.
77. G.S. Nhivekar, R.R.Mudholker “Data Logger and Remote Monitoring System for Multiple
Parameter Measurement Applications” June 2011.
78. Thomas Campbell, Christopher Williams, Olga Ivanova, Banning Garrett “Could 3D Printing
Change the World? Technologies, Potential, and Implications of Additive Manufacturing” Oct
2011. DC 20005 (202) 463-7226. Atlantic Council.
79. Godavarthi.SS Prasad, Dr. I. Santi Prabha, M. Venkateswara Rao “Handheld Measuring Device for
Multiple Parameters, In Wood and Ceramic Industries” Sep-Oct 2012 Volume-2, Issue-5, 1416 –
1419.
80. Sudhindra F, Annarao. S.J, Vani R.M, P.V. Hungund “A Low cost short Range Wireless Embedded
System for Multiple Parameter Control” Feb-2014, Volume: 03 Issue: 02, pISSN: 2321-7308.
81. Kyriakos Pierrakakis, Miltiadis Kandias, Charitini D. Gritzali, Dimitris Gritzalis “3D Printing and
its Regulation Dynamics: The World in Front of a Paradigm Shift” e-Business &
Telecommunication Aug.2014.
82. Sudhakar Singh, M.K. Pathak, P. Mor, J.M. Keller “Study on Microcontroller Based System to
Measure and Control Various Physical Parameter” Aug.2014 – Oct.2014, Vol. 4, No. 4; 3537-3548.
83. D. Sankowski, K. Strzecha and S. Jezewski “Image Processing in Physical Parameters
Measurement”.

147
LIST OF PUBLICATIONS INTERNATIONAL JOURNALS
1. K. Rajappan, R.S.D. Wahida Banu, A. Justin Diraviam, “Digital Image Processing based on line
Control and Monitoring”. International Journal of Image Processing and Networking
Techniques (ISSN NO: 0973-7650) Vol-2 No.1 June 2009 – sponsored by AICTE.
2. K. Rajappan, A. Justin Diraviam, “International of Data Acquisition System Through Digital
Image Processing”, Journal of Software Engineering & Technology” (ISSN: 0975-6159) volume
1, Number 2, July – December 2009.
3. K. Rajappan, A. Justin Diraviam “Concept of Integrating Real Time Field Images in Computer
in Process industries by Removing Separate TVs, “ International Journal of Computer
Applications (0975-8887) Volume 44-No. 5, April 2012.
-----------------