digital imaging and remote sensing laboratory annual ... · the uas research laboratory was a major...
TRANSCRIPT
Rochester Institute of Technology Chester F. Carlson Center for Imaging Science Digital Imaging and Remote Sensing Laboratory 54 Lomb Memorial Drive Rochester, NY 14623 http://dirs.cis.rit.edu
Digital Imaging and Remote Sensing
Laboratory Annual Report
Academic Year 2017-2018
Prepared by the DIRS Laboratory


DIRS Annual Report Academic Year 2017-2018
Digital Imaging and Remote Sensing Laboratory · Chester F. Carlson Center for Imaging Science
54 Lomb Memorial Drive · Rochester, NY 14623-5604
3
Welcome and Highlights
This report describes the status and activities for academic year 2017-18 of the Digital Imaging and Remote Sensing (DIRS) Laboratory located within the Chester F. Carlson Center for Imaging Science (CIS). It provides a snapshot of the ongoing work including a laboratory overview, lists of student theses, awards and recognitions, research project summaries and publications by laboratory personnel during the academic year. During the 2017-18 academic year DIRS continued its role as a world-class academic research lab focused on the science and engineering of remote sensing systems, technologies, and applications. New research funding received during this past year totaled over 2 million dollars from fifteen different sponsoring organizations including industry, non-profit organizations and government agencies. In total we received around $3.5 million in research funding during the year. We celebrated the graduation of another class of students receiving their imaging science degrees (BS, MS, PhD) with a concentration in remote sensing. In addition, our faculty, staff, and students continued to be active professionally by publishing and serving their professions. In particular I would like to highlight a few of these activities. New projects initiated in 2017-18 included ones leveraging our unmanned aerial systems (UAS) capability to the precision agriculture area as well as continuing our long history of supporting the Landsat program by extending our thermal calibration research to land surface temperature. This report contains short summaries of many of our ongoing research projects. Two students received particular recognition for their work. PhD student Sanghui Han was selected as the first recipient of the Shea Endowed Scholarship from the United States Geospatial Intelligence Foundation. MS student Margot Accettura received a Best Paper award for her paper and presentation at the SPIE Defense+Commercial Sensing symposium. These and other recognitions are highlighted in this report. Lab personnel continued disseminating their research by publishing in peer-reviewed journals ranging from traditional remote sensing journals such as IEEE Transactions on Geoscience and Remote Sensing to new open access journals such as MDPI Remote Sensing, or even in related scientific journals such as the Journal of Ornithology. A full list of publications including conference proceedings is provided at the end of this report. In December 2017 we marked the end of an era with a retirement celebration for DIRS Distinguished Researcher Michael Richardson. Mike had been with the Lab since 2000 and was instrumental in growing DIRS from a few faculty and staff to the significant enterprise it is today. We thank Mike for his dedicated service and wish him well as he continues with a post-RIT career. Just after the 2017-18 academic year ended we welcomed RIT Imaging Science alum Joseph Sirianni to the Lab. Joe comes to us with over 25 years of experience working in the remote sensing industry. We are excited to have Joe joining our team and look forward to him helping us secure and manage new and ongoing research projects. DIRS continues to be a vibrant active center for education and research in the science and engineering of remote sensing systems. We welcome inquiries from prospective students and collaborators who would like to help us advance the field of Earth remote sensing.
John Kerekes, Ph.D. Laboratory Director

DIRS Annual Report Academic Year 2017-2018
Digital Imaging and Remote Sensing Laboratory · Chester F. Carlson Center for Imaging Science
54 Lomb Memorial Drive · Rochester, NY 14623-5604
4
Contents
1 LABORATORY OVERVIEW ............................................................................................................................ 5 1.1 MISSION, VISION AND VALUES ......................................................................................................................... 5 1.2 ORGANIZATION ............................................................................................................................................... 5 1.3 LABORATORY PERSONNEL ............................................................................................................................... 5 1.4 RESOURCES AND FACILITIES ............................................................................................................................ 7
1.4.1 Unmanned Aerial System (UAS) Research ................................................................................................ 7 1.4.2 Goniometer of RIT (GRIT) Laboratory ...................................................................................................... 9 1.4.3 Optical Calibration Facility at RIT ........................................................................................................... 10 1.4.4 Field Spectrometers and Equipment......................................................................................................... 11 1.4.5 Digital Imaging and Remote Sensing Image Generation (DIRSIG™) ....................................................... 12
2 THESES DEFENDED IN PAST YEAR ........................................................................................................... 13 3 AWARDS AND RECOGNITIONS .................................................................................................................. 13 4 RESEARCH PROJECT SUMMARIES .......................................................................................................... 14
4.1 PHENOMENOLOGY, ANALYSIS, AND MACHINE LEARNING ............................................................................. 14 4.1.1 Fundamental Image Science Research ..................................................................................................... 14 4.1.2 Combined 3D Processing of Electro-Optical Data ................................................................................... 16 4.1.3 On the Use of Terrestrial LiDAR Sensing to Monitor the Resilience of Mangroves to Sea Level Rise .. 17 4.1.4 Remote Sensing for Littoral Zone Characterization and Blue Carbon Storage in Coastal Wetlands ....... 18
4.2 SIMULATION AND MODELING ........................................................................................................................ 19 4.2.1 Global Surveillance Augmentation Using Commercial Satellite Imaging Systems ................................. 19 4.2.2 Phenomenology and Modeling Support for Human View ....................................................................... 20 4.2.3 DIRSIG 5 Development ........................................................................................................................... 21 4.2.4 Spatial Spectral Image Modeling and Simulation (SSIMS) ..................................................................... 22 4.2.5 A Simulation-Based Approach To Assessing Corn Spectral Phenology And Phenomenology Towards
Satellite System Specification .................................................................................................................. 23 4.2.6 Automated Assessment of Error in Stereo Produced Digital Surface Models with Encoder Decoder
Models ...................................................................................................................................................... 24 4.2.7 A Voxel-Based Approach To Assessment Of Waveform LiDAR Radiometry In Forest Canopies ........ 25 4.2.8 Toward a Disease Risk Model for White Mold in Snap Bean Using Imaging Spectroscopy .................. 26
4.3 SATELLITE INSTRUMENT SUPPORT ................................................................................................................. 27 4.3.1 Development & Assessment of Potential Land-Surface Temperature Products for Landsat ................... 27 4.3.2 Landsat Science Team .............................................................................................................................. 28 4.3.3 Calibration and Assessment of Landsat Sensors ....................................................................................... 29 4.3.4 Future Landsat System Studies ................................................................................................................. 29 4.3.5 Support to Multiband Uncooled Radiometer Imager (MURI) .................................................................. 30 4.3.6 Spaceborne Imaging System Modeling and Simulation............................................................................ 31
4.4 UNMANNED AERIAL SYSTEMS ....................................................................................................................... 31 4.4.1 Hyperspectral Analysis of Methane Stressed Vegetation Sponsor: Northeast Gas Association
(NYSEARCH) .......................................................................................................................................... 31 4.4.2 Detection of grapevine water using sUAS imaging ................................................................................. 32
5 PUBLICATIONS ................................................................................................................................................ 33 5.1 JOURNAL PUBLICATIONS ................................................................................................................................ 33 5.2 CONFERENCE PROCEEDINGS .......................................................................................................................... 34

DIRS Annual Report Academic Year 2017-2018
Digital Imaging and Remote Sensing Laboratory · Chester F. Carlson Center for Imaging Science
54 Lomb Memorial Drive · Rochester, NY 14623-5604
5
1 Laboratory Overview The Digital Imaging and Remote Sensing (DIRS) Laboratory is a research group within the Chester F. Carlson Center for Imaging Science (CIS). Our work focuses on the development of hardware and software tools to facilitate the extraction of information from remotely sensed data of the earth and the education of students who will continue this work for research laboratories, government agencies and private industry.
The DIRS group is made up of faculty and research staff working with over 50 students ranging from the Baccalaureate through Doctoral level. Most students are degree candidates in Imaging Science, but students from other departments, such as Engineering and Physics, are often part of the student population supporting our research initiatives. Additionally, high school interns were provided the opportunity to participate in research projects and learn more about imaging science during the summer.
1.1 Mission, Vision and Values Mission Statement: To educate students and conduct research in the science, engineering and application of
physics-based quantitative remote sensing and digital imaging systems (source-to-information) to aid in the solution of real-world problems.
Vision Statement: Be known as the university laboratory of choice for education and research related to the
physics-based phenomenology, modeling, collection, calibration, and analysis of remote sensing and digital imagery.
Values Statement: Our core values include integrity, dedication, respect, and commitment to excellence in our
educational, research and professional activities.
1.2 Organization The DIRS laboratory is managed using a matrix approach where faculty and senior staff serve as principal investigators and manage programs to generate research results, student theses, and meet sponsor requirements. Affiliated faculty are those supported by the department but have elected to affiliate with the DIRS Lab. The research faculty, research staff, and administrative staff are supported by externally funded research projects.
1.3 Laboratory Personnel
Director Dr. John Kerekes, Professor
Affiliated Faculty Dr. Charles Bachmann, Frederick and Anna B. Wiedman Chair, Associate Professor Dr. David Messinger, Professor and Director, Carlson Center Dr. Emmett Ientilucci, Assistant Professor Dr. Carl Salvaggio, Professor Dr. Jan van Aardt, Professor Dr. Anthony Vodacek, Professor
Research Faculty Dr. Michael Gartley, Assistant Research Professor Dr. Robert Kremens, Research Professor Dr. John Schott, Research Professor

DIRS Annual Report Academic Year 2017-2018
Digital Imaging and Remote Sensing Laboratory · Chester F. Carlson Center for Imaging Science
54 Lomb Memorial Drive · Rochester, NY 14623-5604
6
Research Staff Timothy Bauch, Lab Engineer Dr. Scott Brown, Principal Scientist Dr. Aaron Gerace, Senior Scientist Dr. Adam Goodenough, Senior Scientist Tania Kleynhans, Associate Scientist Donald McKeown, Distinguished Researcher Dr. Matthew Montanaro, Senior Scientist Nina Raqueño, Assistant Scientist Dr. Rolando Raqueño, Associate Scientist Michael Richardson, Distinguished Researcher Jared Van Cor, Assistant Scientist Administrative Support Colleen McMahon, Senior Staff Assistant Melanie Warren, Senior Staff Assistant Student Researchers BS (12) Seth Baker Ryan Connal Nathan Dileas Mark Foote Carrie Griffo Kevin Kha Tyler Kuhns Damian Kwiatkowski David Lewis Martin Pietra Nelmy Robles-Serrano Sadie Wolters MS (8) Margot Accettura Nicholas Bitten Daniel Edwards Rinaldo Izzo Michael McClelland Nilay Mokashi Timothy Rupright Nenad Vrucinic PhD (36) Greg Badura Di Bai Zhaoyu Cui Rehman Eon Alex Fafard Ryan Ford Utsav Gewali Sanghui Han Ethan Hughes Ali Rouzbeh Kargar Ron Kemker Michal Kucer Chris Lapszynski Mahshad Mahdavi Baabak Mamaghani Jobin Mathew Keegan McCoy Emily Meyers Jonathan Miller Cara Murphy Tyler Peery Aneesh Rangnekar Ryne Roady Benjamin Roth Michael Grady Saunders Prateek Srivastava Yihang Sun Fan Wang Mingming Wang Yue Wang Cody Webber Gefei Yang Jie Yang Runchen Zhao Mohammed Yousefhussien Chi Zhang

DIRS Annual Report Academic Year 2017-2018
Digital Imaging and Remote Sensing Laboratory · Chester F. Carlson Center for Imaging Science
54 Lomb Memorial Drive · Rochester, NY 14623-5604
7
1.4 Resources and Facilities The DIRS laboratory continues to expand its equipment to support laboratory and field measurements.
1.4.1 Unmanned Aerial System (UAS) Research The UAS Research Laboratory was a major addition to the DIRS group during the 2015-16 academic year. The UAS Research Lab has been instrumental in the development of our remote sensing capabilities through the use of drones. Previously during the 2016-17 academic year, the “MX1” multi- modal imaging payload was developed. The MX1 features simultaneous LiDAR, VNIR Hyperspectral, RGB (color), and LWIR. It was a joint development by DIRS, Headwall Photonics, and personnel from RIT’s College of Applied Science and Technology (CAST). In the 2017-18 academic year the MX1 was upgraded to include a multispectral imager, the Micasense Red Edge with an Integrated Light Sensor (Figure 1.1).
Figure 1.1 RIT’s MX1 with the addition of the (a) Micasense Red Edge and (b) Integrated Light Sensor. The (c) Velodyne
LIDAR and (d) Hyperspectral Nano are also visible in this image.
The MX1 flies on a DJI Matrice 600 hexacopter and has collected over 10 TB of data, in support of research projects, since its first flight in June 2017. Figure 1.2 shows the five modes that can be captured simultaneously with the MX1.
Figure 1.2 Five imaging modalities that can be captured simultaneously with RIT’s MX1.

DIRS Annual Report Academic Year 2017-2018
Digital Imaging and Remote Sensing Laboratory · Chester F. Carlson Center for Imaging Science
54 Lomb Memorial Drive · Rochester, NY 14623-5604
8
During the 2017-18 academic year the UAS Lab with funds from New York State procured a Cooled ShortWave InfraRed (SWIR) system from Headwall Photonics that mounts on our second DJI Matrice 600 hexacopter. This system has been used for multiple research projects and has collected us over 500GB of data since our initial flights in July 2018. An example image from the SWIR line scanner is presented in Figure 1.3.
Figure 1.3 RIT’s Headwall Photonics Short Wave InfraRed (SWIR) system in flight on a DJI Matrice 600 hexacopter. A single
example band (1062nm) from the SWIR linescanner out of the 170 available bands (900-2500nm).
The UAS Lab is currently in the process of creating another payload called the “MX2”. The MX2 will be an upgraded version of the MX1. The MX2 will feature simultaneous collection of LiDAR, VNIR Hyperspectral, Multispectral, 2 LWIR (Cooled & Uncooled), RGB on gimbal, and Ocean Optics Spectrometer. This payload will be flown on the DJI Wind 8 octocopter, also known as the DJI Agras MG-1. We anticipate this payload being ready for research collects starting in the spring of 2019. In the 2017-18 academic year the UAS Lab also modified an enclosed trailer into a fully outfitted mobile lab for all collects. Our trailer now is outfitted with power and Ethernet to allow all day access to charge batteries and use computers in the field. Our trailer has storage for all of our necessary field items and allows us to deploy as needed. Figure 1.4 shows our trailer and the resources we now have inside.
Figure 1.4 The efficiency of UAS field deployments has increased with the addition of DIRS equipment trailer.

DIRS Annual Report Academic Year 2017-2018
Digital Imaging and Remote Sensing Laboratory · Chester F. Carlson Center for Imaging Science
54 Lomb Memorial Drive · Rochester, NY 14623-5604
9
Another addition to our UAS lab in 2017-18 has been the use of Ground Control Points (GCP’s). We procured a set of Propeller Aeropoints in late 2017 for use in all collects to give us a better ability to place our imagery on the earth. These come in a set of 10 and are powered by interior solar panels on each unit for easy deployment and charging. The suite of UAS remote sensing equipment available in the lab includes the following. Platforms:
• (2) DJI Matrice 600 Hexacopter • DJI Wind 8 Octocopter • DJI Matrice 100 Quadcopter • DJI Phantom 3 4K Quadcopter • DJI S1000 Hexacopter
Sensors:
• (2) VNIR Hyperspectral: Headwall Nano Hyperspec 400-1000nm • (2) Multispectral: MicaSense RedEdge 5 bands • (3) LiDAR: Velodyne VLP-16 • (2) LWIR: DRS Tamarisk 640 • RGB: Mako G419 • Cooled LWIR: FLIR A6700SC SLS • SWIR: Headwall SWIR 384
Support Equipment:
• 12’ enclosed field support trailer equipped with generator and processing computers • (3) Headwall Hypercore flight data storage system • (3) Applanix APX15 GPS/IMU boards • Ocean Optics Flame-S-VIS-NIR-ES • Propeller Aeropoints set of 10
Research Projects Supported:
• USDA/Cornell: Transforming White Mold Management in Snap Beans Through Remote Sensing • NRO LASS: Spectral Remote Sensing of Vegetation Stress in Vineyards • Love Beets: Transformation of the New York Table Beet Industry Through Digital Agriculture • National Geographic Society: Improving Estimates of Salt Marsh Resilience and Coastal Blue Carbon • ORNL: Fundamental Image Science Research • NASA: Systems Engineering Support For Next Generation Land Remote Sensing Systems • COS-IMGS-589- “Small Unmanned Aircraft Systems (sUAS) Remote Sensing” • Harris: Infrastructure Monitoring Using Aerial Drone Imaging Systems • Cornell: Spectral Sensing of Corn Crops (Deb Grantham) • Staples Inc: Forest Resource Management
1.4.2 Goniometer of RIT (GRIT) Laboratory
Under leadership by Dr. Chip Bachmann the GRIT Lab hosts state-of-the-art field portable equipment capable of measuring the spectral properties of diverse surfaces. The Goniometer of the Rochester Institute of Technology-Two (GRIT-T) (Figure 1.5) was developed in Dr. Bachmann’s laboratory as part of the Ph.D. dissertation research of Justin Harms (RIT Ph.D., 2016). The instrument was designed to measure the directional dependence of hyperspectral reflectance signatures, the so-called “bi-directional reflectance distribution function (BRDF),” in both field and laboratory settings. Its unique design features two ASD FR4 spectrometers that simultaneously measure spectral response from the surface and
DIRS Annual Report Academic Year 2017-2018
Digital Imaging and Remote Sensing Laboratory · Chester F. Carlson Center for Imaging Science
54 Lomb Memorial Drive · Rochester, NY 14623-5604
10
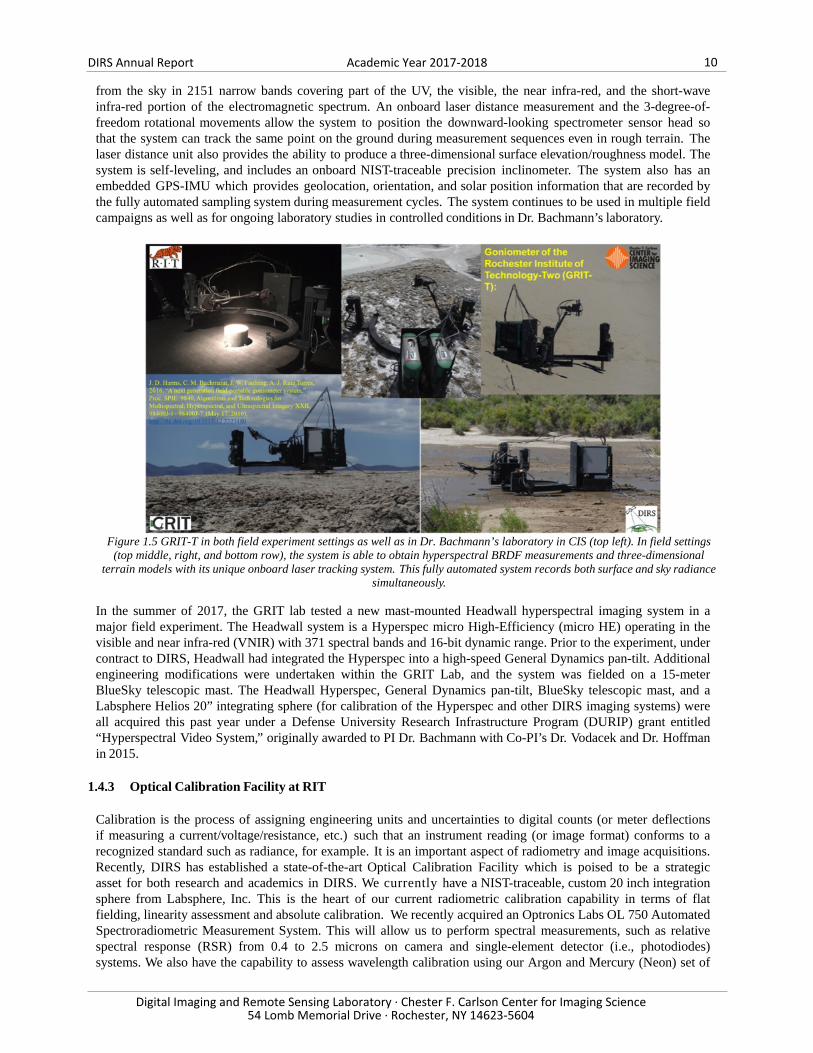
from the sky in 2151 narrow bands covering part of the UV, the visible, the near infra-red, and the short-wave infra-red portion of the electromagnetic spectrum. An onboard laser distance measurement and the 3-degree-of-freedom rotational movements allow the system to position the downward-looking spectrometer sensor head so that the system can track the same point on the ground during measurement sequences even in rough terrain. The laser distance unit also provides the ability to produce a three-dimensional surface elevation/roughness model. The system is self-leveling, and includes an onboard NIST-traceable precision inclinometer. The system also has an embedded GPS-IMU which provides geolocation, orientation, and solar position information that are recorded by the fully automated sampling system during measurement cycles. The system continues to be used in multiple field campaigns as well as for ongoing laboratory studies in controlled conditions in Dr. Bachmann’s laboratory.
Figure 1.5 GRIT-T in both field experiment settings as well as in Dr. Bachmann’s laboratory in CIS (top left). In field settings
(top middle, right, and bottom row), the system is able to obtain hyperspectral BRDF measurements and three-dimensional terrain models with its unique onboard laser tracking system. This fully automated system records both surface and sky radiance
simultaneously.
In the summer of 2017, the GRIT lab tested a new mast-mounted Headwall hyperspectral imaging system in a major field experiment. The Headwall system is a Hyperspec micro High-Efficiency (micro HE) operating in the visible and near infra-red (VNIR) with 371 spectral bands and 16-bit dynamic range. Prior to the experiment, under contract to DIRS, Headwall had integrated the Hyperspec into a high-speed General Dynamics pan-tilt. Additional engineering modifications were undertaken within the GRIT Lab, and the system was fielded on a 15-meter BlueSky telescopic mast. The Headwall Hyperspec, General Dynamics pan-tilt, BlueSky telescopic mast, and a Labsphere Helios 20” integrating sphere (for calibration of the Hyperspec and other DIRS imaging systems) were all acquired this past year under a Defense University Research Infrastructure Program (DURIP) grant entitled “Hyperspectral Video System,” originally awarded to PI Dr. Bachmann with Co-PI’s Dr. Vodacek and Dr. Hoffman in 2015.
1.4.3 Optical Calibration Facility at RIT Calibration is the process of assigning engineering units and uncertainties to digital counts (or meter deflections if measuring a current/voltage/resistance, etc.) such that an instrument reading (or image format) conforms to a recognized standard such as radiance, for example. It is an important aspect of radiometry and image acquisitions. Recently, DIRS has established a state-of-the-art Optical Calibration Facility which is poised to be a strategic asset for both research and academics in DIRS. We currently have a NIST-traceable, custom 20 inch integration sphere from Labsphere, Inc. This is the heart of our current radiometric calibration capability in terms of flat fielding, linearity assessment and absolute calibration. We recently acquired an Optronics Labs OL 750 Automated Spectroradiometric Measurement System. This will allow us to perform spectral measurements, such as relative spectral response (RSR) from 0.4 to 2.5 microns on camera and single-element detector (i.e., photodiodes) systems. We also have the capability to assess wavelength calibration using our Argon and Mercury (Neon) set of

DIRS Annual Report Academic Year 2017-2018
Digital Imaging and Remote Sensing Laboratory · Chester F. Carlson Center for Imaging Science
54 Lomb Memorial Drive · Rochester, NY 14623-5604
11
spectral emission lamps. Future capabilities include the incorporation of a collimator (VIS-LWIR) so as to perform spatial detector/imaging system analysis and calibration along with the development of a course on calibration.
Figure 1.6 Optronics Labs OL-750 Monochromator which resides in the Optical Calibration Facility.
1.4.4 Field Spectrometers and Equipment DIRS continues its commitment of providing spectral and geographic reference data across all of our research activities. At the end of 2017, DIRS invested in a new ASD FieldSpec4 high resolution spectroradiometer. This provides data across the solar range of 350-2500 nm with a spectral resolution of 3 nm in the VNIR and 8 nm in the SWIR region. DIRS has a second spectroradiometer from Spectra Vista Corporation with similar capabilities and spectral range as the ASD FieldSpec4. The SVC HR-1024i has become a true workhorse due to its ease of use and compact design making it ideal for student use and difficult field environments. Both the ASD FieldSpec and SVC HR-1024i have contact probes and leaf clips with built in sources making them useful in the lab and on cloudy days. In 2018 an additional probe for the ASD was acquired to enable close range measurements with a very narrow field of view of 3 mm. With the addition of the probes, two external Sunnex lamps, use of the RIT greenhouse, and travel to warmer field campaigns both of the spectrometers are in high demand year round. DIRS also maintains its capability of characterizing materials beyond 2500nm with two additional instruments. The Surface Optics Corporation’s SOC 400T reflectometer measures infrared radiation from 2-25 microns with direct contact to a material’s surface and the Designs and Prototype’s Hand Portable FT-IR Spectrometer allows us to make non-contact measurements in the 2-16 micron spectral range. These instruments are used in a wide variety of applications ranging from the unusual analysis of crime scenes and ancient manuscripts to the more traditional remote sensing tasks of characterizing vegetation stress, harmful algal blooms, and light sources; generation and verification of DIRSIG materials; and collecting reference data of in-scene targets, backgrounds, and calibration panels. Since precise positioning has become an increasing priority, DIRS has invested in two survey grade GPS, Trimble R10 integrated GNSS systems. This enables reference data to be located within a centimeter and provide geometric control to refine our many UAS image products. For daily UAS operations a set of ten GPS enabled control points (Aeropoints) can be deployed quickly. Figure 1.7 shows a variety of the DIRS equipment in action. Looking ahead to 2019, DIRS will be updating and augmenting our thermal calibration and in-scene verification equipment. This

DIRS Annual Report Academic Year 2017-2018
Digital Imaging and Remote Sensing Laboratory · Chester F. Carlson Center for Imaging Science
54 Lomb Memorial Drive · Rochester, NY 14623-5604
12
will help support NASA/USGS Land Surface Temperature (LST) product validation and calibration of the FLIR thermal camera once integrated into our next UAS platform.
Figure 1.7 Examples of DIRS equipment: (a) measurement of in-scene panels using the SVC 1024i spectroradiometer (b)
laboratory measurement using the SVC leaf clip with built in source (c) an Aeropoint GPS control point deployed in uniform agricultural field (d) Trimble survey grade GPS equipment (e) ASD’s small diameter reflectance probe characterizing pigments (f) roof top vegetation experiment using both the SVC 1024i and ASD FieldSpec4 (g) ASD FieldSpec4 recording downwelling irradiance during a UAS flight (h) characterizing materials for DIRSIG scene construction using the Designs and Prototype’s
FT-IR spectrometer.
1.4.5 Digital Imaging and Remote Sensing Image Generation (DIRSIG™) The initial development of the Digital Imaging and Remote Sensing Image Generation (DIRSIG) model began in the late 1980s as a 3-D simulation environment for predicting images that would be produced by thermal infrared systems. Since that time, the model has been expanded to cover the 0.2 to 20 micron region of the spectrum. The model is designed to generate passive broad-band, multispectral, hyperspectral, low-light, polarized, active laser radar datasets through the integration of a suite of physics-based radiation propagation modules. These modules address tasks ranging from bidirectional reflectance distribution function (BRDF) predictions of a surface, to time and material dependent surface temperature predictions, to the dynamic viewing geometry of scanning imaging instruments hosted on agile ground, airborne and space-based platforms. The model also contains a suite of interfaces that leverage externally developed components (e.g. temperature prediction, atmospheric propagation, etc.) that are modeling workhorses for the multi- and hyperspectral remote sensing community. 2017 saw the first release of DIRSIG5, a major rewrite of the code to make it more computationally efficient and modular to support a diversity of plug-in components for specific phenomenology and sensor characteristics. DIRSIG development in 2018 continued its focus on getting the new DIRSIG5 model ready for release to the general user population. This new version of the DIRSIG software has been in development for the past 2 years. The goal of the new development effort was to create an updated version of the software that can take advantage of the latest numerical radiometry methods and modern computing resources. This includes micro-scale, multi-threaded execution to harness the potential of ubiquitous multi-core CPUs and macro-scale parallelization via the Message Passing Interface (MPI) to allow the software to run on large, multi-computer resources found in high performance compute (HPC) and cloud computing environments. We have also been working on GPU-acceleration techniques to further speed up the software. Continued development of the basic capabilities of the DIRSIG5 code base has brought the software nearly on par with DIRSIG4 for passive, reflective region simulations. Using our continuous integration environment, we started to deliver rigorously tested, weekly software updates to our 90+ user beta tester population. We also seeded the first version of the DIRSIG5 software developer kit (SDK) to a subset of the beta users. The SDK documents the various application programming interfaces (APIs) that allows developers to extend the DIRSIG5 software. It is initially focused on the creation of sensor plugins that can be loaded and executed by DIRSIG5 during a

DIRS Annual Report Academic Year 2017-2018
Digital Imaging and Remote Sensing Laboratory · Chester F. Carlson Center for Imaging Science
54 Lomb Memorial Drive · Rochester, NY 14623-5604
13
simulation. Future versions will document scene related APIs that will allow plugins to manipulate the scene geometry. This past year also saw the completion of the initial MPI-enabled version of DIRSIG5, which has been tested on a few compute clusters. The DIRSIG5 software is expected to be available to the general user population in early 2019.
2 Theses Defended in Past Year
• Ronald Kemker, PhD, “Low-Shot Learning for the Semantic Segmentation of Remote Sensing Imagery,” Advisor: Dr. Christopher Kanan
• Michael McClelland, MS, “An Assessment of Small Unmanned Aerial Systems in Support of Sustainable Forestry management Initiatives,” Advisor: Dr. Jan van Aardt
• Nilay Mokashi, MS, “Empirical Satellite Characterization for Realistic Imagery Generation,” Advisor: Dr.
John Kerekes
3 Awards and Recognitions
• Assistant Professor Emmett Ientilucci was Chair of the second UAS workshop, Systems and Technologies for Remote Sensing Applications Through Unmanned Aerial Systems or STRATUS 2017, held in October 2017 at RIT. This successful workshop had 82 participants from academia, industry, and government researchers and reviewed UAS technology and applications.
• In January 2018 Assistant Professor Emmett Ientilucci was an invited speaker for the Remotely Sensed
Big Data Analysis and Mining (RSBDAM 2018) conference in Kolkata, India at the Indian Statistical Institute. He also gave an invited guest lecture at the National Institute of Technology in Silchar, India on Remote Sensing and Data Analysis Techniques.
• In March, Professor Anthony Vodacek was appointed "COS Leader Faculty for Study Abroad and
International Education." In this position Professor Vodacek works within the College of Science to enhance opportunities for faculty, staff, and students to have meaningful international and global research and education experiences.
• MS student Margot Accettura won the "Autonomous Air and Ground Sensing Systems for Agricultural
Optimization and Phenotyping III" Conference Best Paper Award for her paper "Hyperspectral Detection of Methane Stressed Vegetation" that she presented in April at SPIE Defense and Commercial Sensing symposium, in Orlando, Florida in April 2018.
• Ph.D. student Sanghui Han was awarded the inaugural K. Stuart Shea USGIF Endowed Scholarship at USGIF's GEOINT 2018 Symposium in April 2018.
• In August, Professor Anthony Vodacek was appointed to a three-year term on the "Fulbright Specialist Roster." The Fulbright Specialist program allows US scientists and other professionals to serve as short term experts for competitive projects proposed by the host country.

DIRS Annual Report Academic Year 2017-2018
Digital Imaging and Remote Sensing Laboratory · Chester F. Carlson Center for Imaging Science
54 Lomb Memorial Drive · Rochester, NY 14623-5604
14
4 Research Project Summaries
During this past year DIRS researchers worked on a variety of research projects with funding from numerous sponsors such as:
• Government civilian organizations including the National Aeronautics and Space Administration (NASA), the United States Department of Agriculture (USDA), and the United States Geological Survey (USGS);
• Department of Defense organizations including the Air Force Research Laboratory (AFRL) and the
Office of Naval Research (ONR);
• Department of Energy Laboratories including Lawrence Livermore National Laboratory (LLNL), Sandia National Laboratory (SNL) and Oak Ridge National Laboratory (ORNL);
• Private companies either directly or as a subcontractor on a government funded effort including Arete Associates, Harris, Invertix, Kitware, Kodak Alaris, Staples;
• Private consortia including the Northeast Gas Association (NYSEARCH).
The following research projects are grouped into four broad groups spanning areas of emphasis in our research activities during 2017-18: phenomenology, analysis, and machine learning; simulation and modeling; satellite instrument support; and unmanned aerial systems. In reality, many projects span these categories but this project taxonomy serves as one way to grasp the breadth of research taking place within DIRS.
4.1 Phenomenology, Analysis, and Machine Learning
4.1.1 Fundamental Image Science Research Sponsor: Oak Ridge National Laboratory Principal Investigator: Dr. Emmett Ientilucci Research Team: Dr. Carl Salvaggio, Dr. Jan van Aardt, Don McKeown, Tim Bauch, Nina Raqueño, Yihang Sun (PhD student), Mohammed Yousefhussien (PhD student), Alex Fafard (PhD student), Prasanna Pulakurthi (MS student) Project Description: This project performs fundamental research into the end-to-end performance and evaluation of remote sensing imaging systems and the exploitation of image data from such systems. The overall focus is to perform research on topics such as image quality, detection algorithms, information extraction and understanding of three-dimensional scenes, and unmanned aerial system data analysis and collection. Specifically, we are currently focused on research in the following areas:
1. Semantic understanding of point cloud data (i.e., 3D/LiDAR processing) 2. Novel multi-modal image registration techniques (using CNN) 3. Anomaly, Change and Glint-type detection algorithms 4. Shadow detection algorithms using traditional and NN/CNN techniques 5. UAS data collections, processing, and storage techniques 6. Production of pixel-wise confidence estimates in disparity maps produced through stereoscopic
techniques 7. DIRSIG SAR capabilities and imagery
Project Status: Projects are ongoing across the areas mentioned above. The 3D LiDAR project aims to provide a semantic understanding of aerial data when point cloud information (structural information) is provided. In the past we have used publicly available point-cloud data sets to develop an algorithm capable of semantically labeling individual points. This algorithm was published in the ISPRS Journal of Photogrammetry and Remote Sensing. Recently, we are able to predict the Digital Terrain Model (DTM) by incorporating the local information of a point.

DIRS Annual Report Academic Year 2017-2018
Digital Imaging and Remote Sensing Laboratory · Chester F. Carlson Center for Imaging Science
54 Lomb Memorial Drive · Rochester, NY 14623-5604
15
We have developed a cross-modal registration algorithm that registers imagery from different modalities. We have been evaluating this algorithm based on robustness to noise and different modality data sets. We have been comparing it to other approaches in the literature (i.e., SIFT-Flow and an approach based on non-rigid registration for low-altitude sUAV’s). Results have been very encouraging thus far.
In terms of shadow detection, we have implemented many approaches based on chromaticity along with neural nets and convolutional neural nets (CNN). We have used DIRSIG for training, which has resulted in very successful shadow retrievals from real imagery, as can be seen in Figure 4.1.
Figure 4.1 (left) RGB input image and (right) shadow detection result based on DIRSIG labeled data used for training.
The UAS team has been collecting data with the MX1 throughout the year in addition to cataloging the imagery using RIT’s ArcGIS ESRI Image Server. Data collection has been performed both at RIT and around the Oak Ridge, TN area (i.e., MTSU research farm) including some recent multi-modal, low-light-level lighting scenarios, as seen in Figure 4.2. The Automated Stereo 3D Error Detection project is working towards the generation and leverage of a pixel-wise confidence estimate in imagery depth maps produced through stereoscopic techniques, namely the semi-global matching method. The new model is a version of a dense layer semantic regression based on a Tiramisu network.
Figure 4.2 Mosaic of MicaSense imagery collected at 6pm on September 19th, 2018 at the Henrietta fire tower.
The DIRSIG SAR task has been producing simulations of SAR images over the residential area of Trona, CA (Figure 4.3). We have been delivering sets of co-registered DIRSIG and simulated SAR and PAN images.

DIRS Annual Report Academic Year 2017-2018
Digital Imaging and Remote Sensing Laboratory · Chester F. Carlson Center for Imaging Science
54 Lomb Memorial Drive · Rochester, NY 14623-5604
16
Figure 4.3 (left) Nadir view Panchromatic simulated image and (right) simulated obliquely collected and processed SAR image
over a residential area of the Trona, CA virtual DIRSIG site model.
4.1.2 Combined 3D Processing of Electro-Optical Data
Sponsor: Invertix and the United States Air Force (USAF) Principal Investigator: Dr. Emmett Ientilucci Research Team: Dr. Emmett Ientilucci, Dr. Michael Gartley Project Description: The objective of this effort is to support the National Air and Space Intelligence Center Geospatial Intelligence Squadron (NASIC/GSI) in the areas of reflectance retrieval support and spectral spatial research and development. Specific objectives are to support the Research and Development flight (NASIC/GSIR) to refine the capabilities of the current prototype code for retrieving more accurate reflectance values from spectral data and to perform research into effective and efficient methods for using spectral and spatial information in multispectral data sets for detecting and identifying targets of interest to NASIC analysts. Specifically, this continued research is conducted for Invertix (an Altamira company) in collaboration with Ball Aerospace on the Advanced Technical Exploitation Program II. Project Status: To date, we have been working with Ball to assist in their reflectance retrieval code which takes advantage of 3D information / products from LiDAR imagery. We have collected data and assisted in algorithm development for reflectance retrievals in challenging illumination conditions this includes work in characterizing the hemispherical, spectral influence of objects in shades and non-shaded regions, as seen in Figure 4.4.

DIRS Annual Report Academic Year 2017-2018
Digital Imaging and Remote Sensing Laboratory · Chester F. Carlson Center for Imaging Science
54 Lomb Memorial Drive · Rochester, NY 14623-5604
17
Figure 4.4 (top) GRIT placement in full shadow. First position is close to building while second is far from building and
(bottom) Sky radiance with GRIT in full shadow close (i.e., first position) to building.
4.1.3 On the Use of Terrestrial LiDAR Sensing to Monitor the Resilience of Mangroves to Sea Level Rise Sponsor: United States Forest Service Principal Investigator: Dr. Jan van Aardt Research Team: Dr. Jan van Aardt, Ali Rouzbeh-Kargar (PhD student) Project Description: Mangrove forests provide food, fiber, and fuel that assist the economy of Asia-Pacific countries. These forests are endangered by sea level rise. As a result, the resilience of mangrove forests to sea level rise needs to be evaluated in order to protect and manage them and preserve positive accretion rates, the process of root growth, sedimentation, and peat development, and forest floor elevation relative to sea level. Currently, accretion rates are measured using surface elevation tables (SETs) which are posts placed in mangrove sediments. The forest floor is measured annually respective to the height of the SETs to evaluate the changes in elevation (Cahoon et al. 2002). In this project the ability of Terrestrial LIDAR System (TLS) for measuring elevation changes will be evaluated. In addition to evaluation of elevation changes, structures of the forest, like stems, and canopy complexity will be studied using TLS in order to biophysically characterize complex forest environments. The objectives of this research thus are to i) assess the utility of terrestrial LiDAR scanning (TLS) to accurately map elevation changes in mangrove forest, ii) evaluate forest canopy complexity and structure using TLS in complex forest environments toward biophysical characterization of such forests, and iii) construct a biophysically accurate 3D model of complex forest environment for modeling of radiative transfer in such forests. Project Status: Digital Elevation Models (DEMs) are produced for twenty plots. In each of these locations eight scans were collected and then registered into one scan. DEMs are refined and produced using different ground classification techniques, like modified Cloth Simulation Filtering (CSF), and local gridding method. Also different interpolation methods, like kriging, linear, and Inverse Distance Weighting (IDW), were used and their effects on the resulting DEM was evaluated. Figure 4.5 shows a DEM for one of the plots using CSF and linear interpolation and also the comparison between two different interpolation methods.

DIRS Annual Report Academic Year 2017-2018
Digital Imaging and Remote Sensing Laboratory · Chester F. Carlson Center for Imaging Science
54 Lomb Memorial Drive · Rochester, NY 14623-5604
18
Figure 4.5 Top image shows the digital elevation model produced with linear and CSF algorithm. It can be seen that this DEM has some artifacts on the edges. The bottom image shows the comparison between kriging and linear interpolation. The DEM
produced with kriging does not exhibit many artifacts.
4.1.4 Remote Sensing for Littoral Zone Characterization and Blue Carbon Storage in Coastal Wetlands
Sponsors: US Government; National Geographic Society Principal Investigator: Dr. Charles M. Bachmann Research Team: Gregory Badura (PhD Student), Rehman Eon (PhD Student), Christopher Lapszynski (PhD Student) Project Description: The GRIT Laboratory conducted the second of two field campaigns at the Virginia Coast Reserve Long Term Ecological Research (VCR LTER) site in July 2018, deploying their recently developed hyperspectral mast system and Goniometer of the Rochester Institute of Technology-Two (GRIT-T) hyperspectral goniometer system for calibration and validation. This year, the telescopic mast system and the MX-1 UAS acquired imagery simultaneously over the study sites. GRIT lab again conducted a pair of experiments supported by two different external grants, one focused on littoral zone characterization and another on "Blue Carbon" storage in coastal wetlands. The latter effort related to "Blue Carbon" was supported by a new grant from the National Geographic Society to Dr. Christy Tyler (Environmental Science) and Dr. Bachmann (CIS). This work focused on developing quantitative models for carbon storage from very fine-scale hyperspectral imagery of coastal salt marshes. The joint team from Environmental Science and CIS conducted field measurements in a marsh "chrono-sequence" at the Hog Island study site focusing on long term goals to understand carbon storage as a function of marsh age. The National Geographic Society grant was the direct result of funding provided by the College of Science Dean's Research Initiation Grant (D-RIG) for a pilot study conducted by the team at the same site in 2017.

DIRS Annual Report Academic Year 2017-2018
Digital Imaging and Remote Sensing Laboratory · Chester F. Carlson Center for Imaging Science
54 Lomb Memorial Drive · Rochester, NY 14623-5604
19
Figure 4.6 Virginia Coast Reserve Field Experiment. (Left) Hyperspectral telescopic mast system being deployed by graduate student Rehman Eon and staff researcher Tim Bauch in the foreground while graduate student Chris Lapszynski assembles the
GRIT-T goniometer in the background. (Middle, bottom) Tim Bauch prepares to launch the MX-1 drone. (Middle, top) Simultaneous image acquisition by the telescopic mast system and the MX-1 drone. (Right, top) GRIT-T deployed for ground
truth data collection at the site. (Right, bottom) GRIT-T performing a scan in GRIT Lab.
4.2 Simulation and Modeling
4.2.1 Global Surveillance Augmentation Using Commercial Satellite Imaging Systems Sponsor: Kitware and U.S. Air Force Research Laboratory Principal Investigator: Dr. John Kerekes Research Team: Dr. Andreas Savakis (Co-Principal Investigator), Jared Van Cor, Jobin Mathew (PhD Student), Nilay Mokashi (MS Student), Faiz Rahman (MS Student, Computer Engineering), Bhavan Vasu (MS Student, Computer Engineering) Project Description: This project is aimed at developing an automated software system to ingest commercial satellite imagery and automatically detect the presence of certain objects or changes. RIT has been supporting this project with several tasks. 1) Image Chip Simulation – We have been using DIRSIG to simulate commercial satellite imagery of various objects for use in training deep learning algorithms to perform object detection. Figure 4.7 shows example helicopter image chips in a variety of backgrounds, orientations, and illumination conditions. 2) Satellite Sensor Characterization – We have used imagery of ground targets acquired by commercial satellite systems (DigitalGlobe and Planet) to empirically characterize their spatial response and noise performance. 3) Multispectral Change Detection Algorithm Evaluation – We evaluated a number of existing algorithms for performing change detection using empirical and simulated datasets. 4) Siamese Networks for Change Detection – We investigated the use of Siamese networks to detect changes in image chip pairs. Project Status: During 2018 we completed the second of two Phase II efforts and initiated a follow-on Phase III program with Kitware which will further develop and implement the ongoing tasks of image simulation and algorithm development.

DIRS Annual Report Academic Year 2017-2018
Digital Imaging and Remote Sensing Laboratory · Chester F. Carlson Center for Imaging Science
54 Lomb Memorial Drive · Rochester, NY 14623-5604
20
Figure 4.7 Example WorldView-2 RGB helicopter image chips simulated by DIRSIG for use in training object detection
algorithms.
4.2.2 Phenomenology and Modeling Support for Human View Sponsor: Intelligent Automation, Inc. and U.S. Air Force Research Laboratory Principal Investigator: Dr. John Kerekes Research Team: Nina Raqueño, Jared Van Cor Project Description: This project is in support of a Phase II SBIR effort by Intelligent Automation, Inc., to develop a simulation capability for generating visible and infrared (EO/IR) video imagery of human activity for training algorithms to detect such activity in video sequences. RIT’s role has included DIRSIG simulation support and planning for an experimental data collection to acquire empirical imagery for validation of DIRSIG simulation outputs. Figure 4.8 shows example simulated infrared imagery of a Desert Highway scene developed as a demonstration scene for this project. Project Status: This two-year project started in the Fall of 2017. The emphasis of the first year was on DIRSIG support and providing baseline scenes for demonstration purposes. During the second year the focus will be on the experimental data collection and DIRSIG validation efforts.
Figure 4.8 Simulated oblique view of Desert Highway scene in shortwave infrared (left), midwave infrared (middle), and
longwave infrared (right).

DIRS Annual Report Academic Year 2017-2018
Digital Imaging and Remote Sensing Laboratory · Chester F. Carlson Center for Imaging Science
54 Lomb Memorial Drive · Rochester, NY 14623-5604
21
4.2.3 DIRSIG 5 Development Sponsor: U.S. Government Principal Investigator: Dr. Scott Brown Research Team: Dr. Adam Goodenough, Dr. Rolando Raqueño, Jared Van Cor Project Description: Several new developments have been underway this academic year either in direct support of ongoing programs or through internal investments. One effort is incorporating non-uniform optical, diffraction, and stray light effect into DIRSIG. Optical models like, but not limited to, FRED are used to generate PSF and Stray Light susceptibility maps (where the imaging system is most susceptibility to light angularly) across the focal plane, and then DIRSIG uses those plots to sample the environment proportionally. Coupling these optical models to DIRSIG almost entirely completes the entire radiometric-optical portion of the imaging chain for EO simulation and is enabling DIRSIG users to do more rigorous trade studies such as determining how a particular coating will affect a system’s ability to detect a target.
Figure 4.9 (a) FRED Optical Engineering Software used to simulate (b) on axis PSF (c) off axis PSF and (d) stray light
susceptibility maps.
A second development is a new capability to mass produce “Image Chips” using a newly developed DIRSIG plugin referred to as ChipMaker. Traditionally, people developing machine learning algorithms for object detection in satellite imagery have had to employ many people to inspect massive amounts of imagery to find targets of interest, which is very inefficient, time consuming and expensive. DIRSIG users are now able to create any size data set of any target in any collection conditions with any background with perfect pixel to pixel ground truth. The helicopter examples shown in Figure 4.10 were modeled based on an existing dataset. The real image dataset showed helicopters only on helipads and at airports. Once DIRSIG was able to match the statistics and detection results of the real dataset, this dataset was expanded to include helicopters in a desert and in a rural environment - backgrounds that would have likely confused a network trained solely to find helicopters in an airport. Rare targets and targets with only a couple images existing in the real world have been modeled and turned into tens of thousands of image chips, enabling detection of these targets without having to collect real measurements.
Figure 4.10 (a) ChipMaker Airport Helicopter examples (b) (left) target and background chip (right) “with_and_without”
ChipMaker run shows just background (c) (left) target and background chip (right) “hide_others” ChipMaker run allows users to densely populate the scene without worrying about crowded chips.

DIRS Annual Report Academic Year 2017-2018
Digital Imaging and Remote Sensing Laboratory · Chester F. Carlson Center for Imaging Science
54 Lomb Memorial Drive · Rochester, NY 14623-5604
22
The DIRSIG team has developed an aerial target library including 10 helicopters and 4 planes. The helicopters and propeller planes have realistic propeller startup and sustained motion. Two scenes have been populated with the target database and used for chip generation during this period - Tampa International Airport scene and Trona, CA scene (Figure 4.11).
Figure 4.11 Two newly developed DIRSIG scenes (left) 1kx1k Tampa International Airport scene, (right) 3kx3k Trona Scene.
Figure 4.12 illustrates the flexibility of the new DIRSIG 5 radiometry engine, which allows for on-the-fly in-water radiative transfer. The water model accounts for complex distributions of optical properties as well as interactions with dynamic waves and arbitrary materials and geometry in the rest of the scene. The radiometric approach captures the focusing of light onto surfaces beneath waves as well as in the scattering volume of the water itself (the focused light patterns, or caustics, can be seen along the surfaces of the stern diving planes). The accuracy of the radiometric model has been verified against community standards down to tens of meters below the surface.
Figure 4.12 Demonstration of the newly developed water modeling capabilities in DIRSIG 5. The image shown represents a 15
m/s sea state generated by an external model and used as the interface to clear water with an early morning sun.
4.2.4 Spatial Spectral Image Modeling and Simulation (SSIMS) Sponsor: Harris Corporation Principal Investigator: Dr. Emmett Ientilucci Research Team: Dr. Michael Gartley Project Description: The goal of this effort is to provide expertise to the sponsor in the area of remote sensing modeling, simulation, and processing, specifically in the area of scene simulation and 3D-assisted HSI processing. Proof of concept and sensitivity studies were carried out to help guide radiometric modeling. That is, which terms

DIRS Annual Report Academic Year 2017-2018
Digital Imaging and Remote Sensing Laboratory · Chester F. Carlson Center for Imaging Science
54 Lomb Memorial Drive · Rochester, NY 14623-5604
23
and interactions should one include in a forward, sensor-reaching radiance model. Additional research involved the development of DIRSIG compatible synthetic scenes that can be used for the downstream processing of panchromatic and hyperspectral imagery. The synthetic scenes incorporate specific signatures and are built around specific scenarios and applications. Rendered scenes are transitioned to sponsor personnel for further analysis related to 3D-assisted HSI processing including sensitivity studies and radiometric modeling. Project Status: The modeling and simulation work for this project focused on three specific tasks. The first task is was to expand the spectral diversity of the existing Trona, CA scene for improved representation of real data for project algorithm development. The second task is to manually align the scene geometry to the ground texture map, manually remove above ground objects from the ground texture map and add new texture maps to rooftops and building sides for improved simulations of Panchromatic images used for 3D point cloud generation algorithms. The third task is to generate Panchromatic and Hyperspectral image simulations (including system noise and MTF models in post-processing) for sponsor algorithm and user tool development using specific conops requested by the sponsor. Sensitivity studies based on synthetic data, real data, and single pixel calculations were performed based on commonly used detection schemes noted throughout the literature. An example sensitivity study can be seen in Figure 4.13 where we are analyzing the sensitivity 3D parameters have on the forward model being used in the research.
Figure 4.13 (upper left) Graphical descriptions of the parameters K (amount of shadow), F (amount of sky observed), and theta (tilt angle of the surface). (right side) Plots showing the observed radiance change as a function of parameters K and F. (lower left) Plot illustrating the increase (in units of degrees or radians) in separation between an unmodified radiance pixel and one
that has different values of skyview (i.e., F), for a pixel in in shadow (i.e., K=0).
4.2.5 A Simulation-Based Approach To Assessing Corn Spectral Phenology And Phenomenology Towards Satellite System Specification
Sponsor: National Aeronautics and Space Administration (NASA) Principal Investigator: Dr. Jan van Aardt Research Team: Grady Saunders (PhD student), Dr. Michael Gartley

DIRS Annual Report Academic Year 2017-2018
Digital Imaging and Remote Sensing Laboratory · Chester F. Carlson Center for Imaging Science
54 Lomb Memorial Drive · Rochester, NY 14623-5604
24
Project Description: We aim to establish a parametric model of the structure and spectral reflectance of maize canopy, in the interest of developing satellite system specifications through light transport simulation with DIRSIG. This model should consider age, weather conditions, and agricultural treatments to accurately capture in-field physiological variation of maize plants, and should be deliverable as a DIRSIG software plug-in. Project Status: To date, we have developed a preliminary parameterization of maize canopy geometry that considers physical measures, such as the lengths and surface areas of the leaves, as a function of physiological age. We also introduce a leaf curl parameter, which is useful for modeling the unfurling of new leaves as well as the effects of water stress. It is important to note that physiological age is given in plastochrons, that is, the relative amount of time between successive leaf initiation events when temperature is held constant. In the future, we aim to determine physiological age from true age, weather conditions, and agricultural treatments. To this end, there have been two data-collection trips by the RIT drone team to image a USDA site in Beltsville, Maryland, which features a variety of maize treatments in adjacent plots. Throughout the growing the season, the USDA has regularly collected ground measurements at this site as well. Ultimately, we intend to use these data to inform and subsequently assess the accuracy of our model.
4.2.6 Automated Assessment of Error in Stereo Produced Digital Surface Models with Encoder Decoder Models
Sponsor: Oak Ridge National Laboratory (ORNL) Principal Investigators: Dr. Emmett Ientilucci (sponsor PI), Dr. Jan van Aardt (PhD Student Advisor) Research Team: Alex Fafard (PhD student) Project Description: Stereo-based methods of producing 3D data are cost effective and largely scalable, making them highly desirable for use in large region topography mapping and remote sensing. Unlike LiDAR or many other active 3D sensing methods, these techniques do not have a robust error model which is able to adequately describe data uncertainty. In addition to the many degrees of freedom in point depth uncertainty, the stereo technique itself that is used impacts the uncertainty of the output. These two factors make direct analytical solutions unsuitable and expensive, it would be vastly more desirable to produce a technique that can robustly estimate error from any input method without extensive data analysis. It has been observed that with prior training human analysts are able to readily detect and gauge relative error in a digital surface map. Error is generally correlated with local and global topological structure and texture in scene data, as well as latent dimensional variables of the data itself. Through the development of an encoder-decoder deep convolutional architecture, we are attempting to assess the ability of a CNN to learn and predict error. The objectives of this work include i) development of a robust and meaningful standardization for machine learning with elevation data, ii) assessment of the predictive power of a deep learning approach to stereo error regression, and iii) exploration of a well posed model architecture for learning stereo error using a genetic algorithm paradigm. We hypothesize that by posing the task as a system analysis problem (i.e., providing input ortho-photos as well as output digital surface map), a forward model to predict error in unseen scenes may be produced. Project Status: Preliminary results have shown promising results in predicting error (Figure 4.15). We believe the differences in estimates to be a product of model architecture, and we are seeking an ideal model through a genetic strategy. We will assess the accuracy of our model through the use of several data-sets including Shuttle Mission Radar Tomography data, the IARPA 2016 multi view stereo dataset, the national 3D Elevation Project as well as other internal data from Oak Ridge National Laboratory.
Figure 4.14 An example of a grown corn stalk.

DIRS Annual Report Academic Year 2017-2018
Digital Imaging and Remote Sensing Laboratory · Chester F. Carlson Center for Imaging Science
54 Lomb Memorial Drive · Rochester, NY 14623-5604
25
Figure 4.15 Shown is an input scene on the top left, with a corresponding error map (calculated against a corresponding LiDAR
collect). We are able to predict structurally correlated error with our model overlooking some fine structure in the scene (all units in meters).
4.2.7 A Voxel-Based Approach To Assessment Of Waveform LiDAR Radiometry In Forest Canopies Sponsor: US Government Principal Investigator: Dr. Jan van Aardt Research Team: Benjamin Roth (PhD student) Project Description: LiDAR remote sensing and subsequent data processing has shown successful quantification of forest ecosystem health. LiDAR is able to capture the inherent physical three dimensionality of forest environments, while airborne LiDAR is able to accomplish this for large-area assessments. Forest structure parameters that are key indicators to forest health have been measured with airborne LiDAR, yet consistency of these measurements continues to be a problem. However, a major challenge with many current LiDAR systems is the ability to characterize a scene consistently across different scans or instruments. Waveform LiDAR, however, digitizes the entire shape of the backscattered pulses allowing for decomposition into backscatter cross-section measurements. The backscatter cross section contains information on the scattering area, reflectance, and scattering solid angle. A correction for attenuation within the canopy can be applied making assumptions of isotropic scattering. This correction also leads to canopy transmission and absorption along the waveform. Given certain constraints, with multiple view angles of the same scattering surface, the absolute reflectance, transmission, and absorption of scattering surfaces may be determined. Such processing we hope will lead to more accurate forest health metrics. The specific objectives of this new project are to i) develop a technique to estimate relative/absolute reflectance, absorption, transmission on a per voxel basis, ii) develop algorithms to produce metrics (gap probability, LAI, Crown Indices) on a per voxel basis, iii) develop vegetation/woody material ratio on a per voxel basis, iv) develop algorithms to extract sub-canopy structural information, and v) assess uncertainty in these metrics (based on how well forest was sampled).

DIRS Annual Report Academic Year 2017-2018
Digital Imaging and Remote Sensing Laboratory · Chester F. Carlson Center for Imaging Science
54 Lomb Memorial Drive · Rochester, NY 14623-5604
26
Figure 4.16 This image set shows a virtual tree (left), characterized in terms of proper structure and spectral parameters, which is then sampled via a waveform LiDAR instrument in DIRSIG to yield a variety of simulated waveforms (right) that can be used
to assess waveform attenuation, reflectance and transmission (volume scattering), etc.
4.2.8 Toward a Disease Risk Model for White Mold in Snap Bean Using Imaging Spectroscopy Sponsor: United States Department of Agriculture (USDA) Principal Investigator: Dr. Jan van Aardt Research Team: Ethan Hughes (PhD student) Project Description: Sclerotinia sclerotiorum, also known as white mold, causes reductions in the number of pods from fungal growth by infecting the snap bean flowers. Suboptimal timing in the implementation of fungicides is a primary reason for white mold infection, because the disease can infect snap bean crops in less than four days after flowering. Early bloom detection therefore is essential to preventing snap beans from becoming diseased. Due to the fact that many of the snap bean blooms are under the leaf canopy of the snap bean plant, spectral canopy-level detection of blooming onset is paramount. The overall objectives of this research therefore are to i) identify spectral signatures for the onset of flowering to optimally time the application of fungicide, ii) investigate spectral characteristics of white mold onset in snap beans, and iii) to link the location of white mold with spectral and structural metrics like ratio indices (RI), normalized difference indices (NDI), and leaf area index (LAI) to create a spatially-explicit probabilistic risk model for the appearance of white mold in a snap bean field.
The MX1 unmanned aerial system (UAS), boasting a high spatial resolution color (RGB) camera, a Headwall Photonics Nano imaging spectrometer (272 bands; 400-1000 nm), and a Velodyne VLP-16 light detection and ranging (LiDAR) system, was used to collect snap bean spectra during flowering onset at the New York State Agricultural Experiment Station, Geneva, NY, USA. This research station is operated by Cornell University. Snap bean plants were planted at three different periods in the growing season, which allowed for different flowering stages to be captured in single UAS flights. 22 flights on 10 different days, and 22 flights on 8 different days were flown throughout the 2017 and 2018 season, respectively. The flights were flown with ground sampling distances (GSD) that ranged between 1.25-4.5 cm.
After reducing the dimensionality of the reflectance imagery from 272 wavelengths to the top three features (726, 724, and 719 nm) via single feature logistic regression, the top three features were used to train and test a support vector machine (SVM). Once the model was fit, probability maps were created on test imagery for whether the pixels were flowering (high probability equals a flowering pixel). Figure 4.17 shows that for flowering pixels (early flowering) there is a high detected probability for flowering, the middle not-flowering is starting to exhibit signs of flowering (flowered 4 days later), and the late not-flowering has a very low detected probability of flowering.

DIRS Annual Report Academic Year 2017-2018
Digital Imaging and Remote Sensing Laboratory · Chester F. Carlson Center for Imaging Science
54 Lomb Memorial Drive · Rochester, NY 14623-5604
27
Figure 4.17 Example output of snap bean flowering detection, which is critical to assessment of disease risk (flowering plants are more susceptible to white mold infection). (Left, top-to-bottom) Early, middle, and late planting field trials; (right; top-to-
bottom) The associated flowering probability for different planting dates. As one would expect, the flowering probability should decrease for less mature plants (bottom), indicating that the algorithm is effective at detecting flowering stage.
4.3 Satellite Instrument Support
4.3.1 Development & Assessment of Potential Land-Surface Temperature Products for Landsat Sponsor: United States Geological Survey (USGS) Principal Investigator: Dr. Aaron Gerace Research Team: Dr. Aaron Gerace, Tania Kleynhans, Ray Dittimeier (USGS) Project Description: This project is motivated by the desire from the Landsat community for an analysis-ready Land-Surface Temperature (LST) product for past, present, and future Landsat thermal data. A methodology that is suitable for deriving surface temperature for Landsat’s historical single-band instruments has been developed and is currently being refined. Additionally, an investigation is being conducted into the use of split-window, an algorithm designed for deriving LST with dual-band thermal instruments, to be used for current and next-generation Landsat thermal sensors. The anticipated outcome of this project is the development of appropriate methodologies to enable a consistent and accurate Landsat archive of surface-temperature data. Project Status: To date, prototypes of the single-channel and split-window methodologies have been developed, delivered to USGS, and incorporated into their processing chain. Ongoing work seeks to assess the fidelity of the algorithms and perform an assessment of both methodologies against ground measurements. Referring to Figure 4.18 preliminary efforts indicate that although there are known issues to be resolved, both algorithms perform adequately when compared to ground-based measurements.

DIRS Annual Report Academic Year 2017-2018
Digital Imaging and Remote Sensing Laboratory · Chester F. Carlson Center for Imaging Science
54 Lomb Memorial Drive · Rochester, NY 14623-5604
28
Figure 4.18 Preliminary single-channel and split-window methodologies for deriving LST.
4.3.2 Landsat Science Team Sponsor: United States Geological Survey (USGS) Principal Investigator: Dr. John Schott Research Team: Dr. Anthony Vodacek (Advisor), Nina Raqueño, Ryan Ford (PhD student) Project Description: This project is focused on improving Landsat satellites’ ability to better retrieve water quality parameters. This work is mainly focused on the current Landsat mission, Landsat 8, and future Landsat missions, whose requirements and specifications have yet to be determined. The two main areas of ongoing research are determining a set of requirements that would improve future Landsat’s ability for monitoring water quality and using Landsat 8 imagery as well as modeled Look-Up-Tables (LUTs) to retrieve concentrations of pigments relating to toxic cyanobacteria blooms. This project has also been expanded to implementing the same pigment retrieval process on drone-based sensors and determining ideal spectral coverage for a drone sensor. Project Status: In the past year the results of the future Landsat improvement study have been updated with more accurate noise modeling and are currently being prepared for a journal submission. Increased focus has also been applied to determine how processing of imagery (e.g. atmospheric compensation) and information within the LUT affect retrieval of pigments from Landsat 8 imagery. Similarly, the LUT process has been applied to drone imagery collected from both a hyperspectral and multispectral system (results for chlorophyll retrieval are shown below). Simulated retrievals have been ongoing to determine the best combination of 6 bands for a drone-based VIS-NIR sensing system.
Figure 4.19 Retrieval of chlorophyll using a singular modeled LUT. Imagery was captured over cyanobacteria blooms in Honeoye Lake 1 year apart with the 2016 collect using a multispectral system and the 2017 collect using a hyperspectral system.

DIRS Annual Report Academic Year 2017-2018
Digital Imaging and Remote Sensing Laboratory · Chester F. Carlson Center for Imaging Science
54 Lomb Memorial Drive · Rochester, NY 14623-5604
29
4.3.3 Calibration and Assessment of Landsat Sensors Sponsor: United States Geological Survey (USGS) Principal Investigator: Dr. Emmett Ientilucci Research Team: Nina Raqueño, Yue Wang (PhD student) Project Description: A portion of this project involves the design of a process to correct for stray thermal energy incident on Landsat 8’s Thermal IR Sensor (TIRS) that uses out of field sensor data. Specifically, the technique involves the use of GOES imagery (and/or Meteosat imagery) to help characterize the source and origin of the unwanted thermal energy. The goal of the project is to design and test the feasibility and significance of an alternative procedure (relative to the currently implement correction method) that can adjust for stray thermal energy on the focal plane using external data. To date, the MODIS Sea/Land Surface Temperature (SST/LST) product has been implemented where the product utilizes SST data from MODIS Aqua/Terra instruments, The North American Regional Reanalysis (NARR) data, and MODTRAN, to provide ground-truth for TIRS stray light calibration. The SST tools will convert the temperature data in Kelvin to TIRS TOA radiance in the LWIR bands. A toolbox to calculate the GOES view angle via an ellipsoid approach has been developed. Using the GOES view angle data, NARR data and MODTRAN to get GOES-TIRS TOA radiance linear regression. With the SST products and GOES-TIRS correction tools, many more cases have been processed and compared to the current TIRS-TIRS corrected imagery, called Collection-1 (also developed by researchers at RIT). New data is being used to optimize the TIRS-GOES training dataset via a correlation analysis. Project Status: To date, a practical approach to the stray light correction, using multi-sensor measurements, has been developed, as seen by the flowchart in Figure 4.20. This work was published in a recent issue of Remote Sensing. That paper illustrates a GOES to TIRS conversion (GTTC) algorithm with the North American Regional Reanalysis (NARR) data to support the GOES-on-TIRS method. Results shows this GOES-TIRS correction method performs similarly to the TIRS Collection-1 product. Additionally, a simplified methodology is proposed to improve the GOES data processing which can operationalize the GOES-on-TIRS algorithm. Results also show that, using the proposed algorithm with these special cases, the maximum difference between the Collection-1 product and the GOES-on-TIRS correction results in a temperature difference from 0.5 to 0.7 percent.
Figure 4.20 The Quick-GTTC algorithm work-flow. Once the GOES data is prepared, band math can be implemented directly.
4.3.4 Future Landsat System Studies
Sponsor: National Aeronautics and Space Administration Principal Investigator: Dr. John Kerekes Research Team: Nicholas Bitten, (MS Student), Zhaoyu Cui (PhD Student), Keegan McCoy (PhD Student), Emily Myers (PhD Student), Scott Brown, Rolando Raqueño, Jared Van Cor Project Description: As NASA prepares to define the next generation of Landsat earth observing systems, this project has been exploring requirements for these future systems. Topics studied include:
• Impacts of wide-swath imaging including the potential for spectral shifts in channel bandpasses; • Improved vegetation parameter retrievals from additional red-edge spectral bands; • Methods for characterization and specification of stray light requirements in reflective spectral bands; • Requirements for temporal sampling and satellite re-visit rates in agricultural applications.

DIRS Annual Report Academic Year 2017-2018
Digital Imaging and Remote Sensing Laboratory · Chester F. Carlson Center for Imaging Science
54 Lomb Memorial Drive · Rochester, NY 14623-5604
30
• Sensitivity of spectral band artifacts in longwave infrared band filters to surface temperature retrieval accuracy.
Figure 4.21 shows an example visualization of a typical Cassegrain telescope system with straylight artifacts present. Project Status: These ongoing system-level studies will continue through the 2018-19 academic year with results to be published shortly thereafter.
Figure 4.21 Example visualization of stray light from a Cassegrain telescope with typical scattering surfaces.
4.3.5 Support to Multiband Uncooled Radiometer Imager (MURI) Sponsor: DRS Technologies and National Aeronautics and Space Administration Principal Investigator: Dr. John Kerekes Research Team: Cody Webber (PhD Student), Nina Raqueño, Rolando Raqueño Project Description: This project is supporting the development of an airborne multiband infrared imaging instrument using an uncooled microbolometer array under funding from NASA’s Instrument Incubator Program (IIP). During AY 2017-18 efforts were focused on studying the ability of the multiband instrument to detect enhanced levels of methane gas near the surface. This effort was pursued through the study of existing airborne longwave infrared imaging spectrometer data as well as through radiative transfer modeling using MODTRAN6. Figure 4.22 shows example results of the modeling study. Project Status: This project is entering the third three years with plans for additional modeling and a validation data collection experiment to compare the airborne instruments data with that of existing satellite sensors.
Figure 4.22 Modeling study results showing at-sensor brightness temperature differences for methane plume near the surface
observed using a single longwave spectral band centered on the 7.65 micron methane absorption feature as a function of methane concentration and temperature difference from ambient.

DIRS Annual Report Academic Year 2017-2018
Digital Imaging and Remote Sensing Laboratory · Chester F. Carlson Center for Imaging Science
54 Lomb Memorial Drive · Rochester, NY 14623-5604
31
4.3.6 Spaceborne Imaging System Modeling and Simulation Sponsor: Lawrence Livermore National Laboratory Principal Investigator: Dr. John Kerekes Research Team: Sanghui Han (PhD Student) Project Description: This project is investigating approaches to application performance driven design of spectral imaging systems. After validating a simulation and modeling approach to study the tradeoff in NIIRS performance with focal length for a panchromatic imaging system, efforts moved to investigate spectral band selection techniques for multispectral imaging systems. In particular, a scenario of subpixel detection of lifeboats in an open ocean was selected for study (Figure 4.23). Efforts focused on developing an optimal spectral band selection technique using only the target signature. Project Status: Entering the third year of this three-year project, we are currently validating the band selection technique with both empirical and simulated imagery with a goal of extending the methodology to study tradeoffs and optimally design other sensor characteristics such as spatial and radiometric resolutions.
Figure 4.23 Example lifeboat scene rendered at high resolution with randomly placed small lifeboats for subpixel detection
studies and a large lifeboat (lower left) for use as a full pixel reference.
4.4 Unmanned Aerial Systems In addition to the following projects, many of the other projects described in this report use our UAS equipment as it is becoming an increasingly important part of our research activities.
4.4.1 Hyperspectral Analysis of Methane Stressed Vegetation Sponsor: Northeast Gas Association (NYSEARCH)
Principal Investigator: Dr. Carl Salvaggio Research Team: Margot Accettura (MS Student) Project Description: This project looks at the hyperspectral reflectance characteristics of vegetation stressed by low-level subterranean methane leakage from buried pipelines. The purpose is to ascertain whether high-spatial resolution spectral imagery can be used to geolocate small methane leaks in imagery collected from small unmanned aerial systems (sUAS) which could lead to rapid detection of methane leaks and benefit a variety of industries including utility inspectors, grounds maintenance crews, and construction personnel. This project involves an experiment conducted to manually stress vegetation by introducing methane at a low flow rate beneath the ground. The experiment was conducted in an outdoor area where methane percolated up to the surface of the ground. As well, a second experiment is beginning that will observe the difference between hyperspectral characteristics of methane-stressed vegetation and water-stressed vegetation.

DIRS Annual Report Academic Year 2017-2018
Digital Imaging and Remote Sensing Laboratory · Chester F. Carlson Center for Imaging Science
54 Lomb Memorial Drive · Rochester, NY 14623-5604
32
The outdoor stressed region was observed daily over the course of a one-month period with a ground spectrometer to determine the onset and time line of damage to the vegetation. High resolution spectral imagery was also collected each day to observe the spatial characteristics of the damage. The same collections will occur at the second experiment so that the data collected is consistent. This stressed vegetation data will be compared to a collected background of healthy vegetation. Traditional and machine learning classifiers are used as a way to detect differences between healthy and stressed vegetation and determine if vegetation stressed by methane can be easily detected and which spectral bands are most effective for spotting this particular stressor.
Figure 4.24 Simulated pipeline experiment. The methane will run from the tank to a mass
flow controller that controls the flow of the gas and then run into the copper pipe seen here. The pipe is placed five inches from the surface and has five holes punctured directly
underneath the middle of the vegetation.
4.4.2 Detection of grapevine water using sUAS imaging Sponsor: US Government Principal Investigator: Dr. Jan van Aardt Research Team: Dr. Jan van Aardt, Ronnie Izzo (MS student) Project Description: Dr. Jan van Aardt and Dr. Alan Lakso (Professor Emeritus at Cornell University) have been working with MS student Ronnie Izzo in exploring sUAS hyperspectral imagery as a tool to model water status in vineyards. Ronnie is working in close collaboration with our in-house UAS lab to capture high-resolution hyperspectral data in the VNIR and SWIR spectral regimes over grapevines at Fox Run Vineyards near Seneca Lake. The quality of grapes in the production of wine is highly influenced by vine water status, where optimal water deficits improve berry composition for higher quality product. Rapid advancement in small unmanned aerial system (sUAS) technology has empowered the potential application of real-time, high-spatial resolution hyperspectral imagery for optimal irrigation scheduling in vineyards. This study seeks to further sUAS hyperspectral imagery as a tool to model water status in a commercial vineyard in the Finger Lakes wine region of Upstate New York. As shown in the figure below high-spatial resolution (2.5 cm ground sample distance) hyperspectral data were collected in the visible/near-infrared (VNIR; 400-1000nm) and short-wave infrared (SWIR; 1000-2500 nm) regimes on three flight days. A Scholander pressure chamber (see Figure 4.26) was used to directly measure the midday stem water potential (ψstem) within imaged vines at the time of flight. High spatial resolution pixels enable the targeting of pure (sunlit) vine canopy with vertically trained shoots and significant shadowing. We first evaluated the correlation between established spectral indices and measured field water status. This was followed by an exhaustive search across all spectral band combinations in the VNIR and SWIR regimes, to identify additional stable spectral indicators capable of differentiating narrow-range water potential with greater than 0.8 C-statistic (high correlations were found with the red edge slope and NIR). Logistic regression was employed to select spectral indicators, while multiple linear regression was deployed as a predictive tool.
Figure 4.25 shows the two DJI Matrice-600 sUAS, used in this study, one with VNIR (400-1000nm) and the other with SWIR
(1000-2500nm) spectrometers on board. Our goal is to assess their ability, in general, to assess vineyard water status, but ideally, to identify metrics in the cheaper, more operational Si-range (< 1000nm);

DIRS Annual Report Academic Year 2017-2018
Digital Imaging and Remote Sensing Laboratory · Chester F. Carlson Center for Imaging Science
54 Lomb Memorial Drive · Rochester, NY 14623-5604
33
Figure 4.26 Field pressure chamber, used to assess vineyard stem water potential, which in turn is used as field truth data to
develop sUAS-based models.
5 Publications
The following publications include DIRS personnel as authors and appeared during the 2017-18 academic year (mid- August 2017 to mid-August 2018).
5.1 Journal Publications
1. Kant Jha, U., P. Bajorski, E. Fokoue, J. van Aardt, G. Anderson, “Dimensionality Reduction of High-Dimensional Highly Correlated Multivariate Grapevine Dataset,” Open Journal of Statistics, 7(4), pp. 702-717 (August 2017).
2. McCorkel, J., C. Bachmann, C. Coburn, A. Gerace, L. Leigh, J. Czapla-Myers, D. Helder, B. Cook, “An
Overview of the 2015 Algodones Sand Dunes Field Campaign to Support Sensor Inter-calibration,” SPIE Journal of Applied Remote Sensing, 12(1), pp. 012003-1-012003-11 (September 2017).
3. Bachmann, C., R. Eon, B. Ambeau, J. Harms, G. Badura, C. Griffo, “Modeling and Intercomparison of Field
and Laboratory Hyperspectral Goniometer Measurements with G-LiHT Imagery of the Algodones Dunes,” SPIE Journal of Applied Remote Sensing, 12(1), pp. 012005-1-012005-20 (September 2017).
4. Han, S., J. Kerekes, “Overview of Passive Optical Multispectral and Hyperspectral Image Simulation Techniques,” IEEE Journal of Selected Topics in Applied Earth Observations and Remote Sensing, 10(11), pp. 4794-4804 (November 2017).
5. Rengarajan, R., J. Schott, “Modeling and Simulation of Deciduous Forest Canopy and Anisotropic
Reflectance Properties Using the Digital Image and Remote Sensing Image Generation (DIRSIG) Tool”, IEEE Journal of Selected Topics in Applied Earth Observations and Remote Sensing, 10(11), pp. 4805-4817 (November, 2017).

DIRS Annual Report Academic Year 2017-2018
Digital Imaging and Remote Sensing Laboratory · Chester F. Carlson Center for Imaging Science
54 Lomb Memorial Drive · Rochester, NY 14623-5604
34
6. Harms, J., C. Bachmann, B. Ambeau, J. Faulring, A. Ruiz Torres, G. Badura, E. Myers, “A Fully-automated Laboratory and Field-portable Goniometer used for Performing Accurate and Precise Multi-angular Reflectance Measurements,” SPIE Journal of Applied Remote Sensing, 11(4), pp. 046014-1046014-1-046014-15 (November 2017).
7. Axel, C., J. van Aardt, “Building Damage Assessment Using Airborne Lidar,” SPIE Journal of Applied
Remote Sensing, 11(4), pp. 1-17 (December 2017).
8. Sebastien-Gonzalez, E., J. van Aardt, K. Sacca, J. Barbosa, D. Kelbe, P. Hart, “Testing the Acoustic Adaptation Hypothesis with Native and Introduced Birds in Hawaiian Forests,” Journal of Ornithology, 159, pp. 827-838 (February 2018).
9. Wang, F., J. Kerekes, Z. Xu, Y. Wang, “Residential Roof Condition Assessment System Using Deep
Learning, SPIE Journal of Applied Remote Sensing, 12(1), pp. 1-20 (March 2018).
10. Wang, Y., E. Ientilucci, “A Practical Approach to Landsat 8 TIRS Stray Light Correction Using Multi-Sensor Measurements,” Remote Sensing, 10(4) pp. 1-13 (April 2018).
11. Yao, W., J. van Aardt, M. van Leeuwen, D. Kelbe, P. Romanczyk, “A Simulation-Based Approach to Assess
Subpixel Vegetation Structural Variation Impacts on Global Imaging Spectroscopy,” IEEE Transaction on Geoscience and Remote Sensing, 56(7) pp. 4149-4164 (July 2018).
12. Tesfamichael, S., J. van Aardt, W. Roberts, F. Ahmed, “Retrieval of Narrow-range LAI at Multiple LiDAR
Point Densities: Application on Eucalyptus Grandis Plantation, International Journal of Applied Earth Observations and Geoinformation, 70, pp. 93-104 (August 2018).
5.2 Conference Proceedings
1. Zhang, C., T. Nguyen, S. Sah, R. Ptucha, A. Loui, C. Salvaggio, “Batch-normalized Recurrent Highway
Networks,” Proceedings of 2017 IEEE International Conference on Image Processing, pp. 640-644 (September 2017).
2. van Aardt, J., A. Fafard, D. Kelbe, C. Giardina, P. Selmants, C. Litton, G. Asner, “ A Terrestrial LiDAR Assessment of Climate cCange Impacts on Forest Structure, Proceedings of Silvilaser 2017, Blacksburg, Virginia, United States (October 2017)
3. Mahdavi, M., C. Kanan, C. Salvaggio, “Roof Damage Assessment Using Deep Learning,” Proceedings of the
46th Annual Applied Imagery Pattern Recognition Workshop, pp. 6403-6408 (October 2017)
4. Zhang, C., T. Nguyen, S. Sah, R. Ptucha, A. Loui, C. Salvaggio, “Semantic Sentence Embeddings for Paraphrasing and Text Summarization,” Proceedings of 2017 IEEE Global Conference on Signal and Information Processing, pp. 705-709 (November 2017).
5. Goldsmith, S., R. Brett, P. Minnig, C. Bachmann, D. Osgood, C. Tyler, “Decadal Changes in Salt Marsh
Production and Carbon Storage: A Test of the Space-for-time Substitution Approach,” Coastal and Estuarine Research Federation, Biennial International Conference, Blue Carbon, Providence, Rhode Island, United States (November 2017)
6. Eon, R., S. Goldsmith, G. Badura, C. Lapszynski, R. Brett, P. Minnig, D. Osgood, C. Tyler, C. Bachmann,,
“Improving Estimates of Salt Marsh Carbon Storage Using Fine-scale Hyperspectral and LiDAR Remote Sensing,” Coastal and Estuarine Research Federation, Biennial International Conference, Remote Sensing in Coastal Environments, Providence, Rhode Island, United States (November 2017)

DIRS Annual Report Academic Year 2017-2018
Digital Imaging and Remote Sensing Laboratory · Chester F. Carlson Center for Imaging Science
54 Lomb Memorial Drive · Rochester, NY 14623-5604
35
7. Carpenter, K., A. Vodacek, S. Farnand, “Smartphone Calibration for Crowd-Sourced Determination of the Presence of Cyanobacteria in Water Samples,” International Symposium Electronic Imaging 2018, Image Quality and System Performance XV, pp. 405-1-405-7, Burlingame, California, United States (January 2018).
8. Yang, S., E. Ientilucci, S. Voisin, “Improvement of the Harris Corner Detector using an Entropy-Block-Based
Strategy”, Proceedings SPIE Vol. 10644, Algorithms and Technologies for Multispectral, Hyperspectral, and Ultraspectral Imagery XXIV, pp. 1-9, Orlando, FL, (April 2018).
9. McClelland, M., S. Hale, J. van Aardt, “A Comparison of Manned and Unmanned Aerial Lidar Systems in the
Context of Sustainable Forest Management,” Proceedings SPIE Vol. 10664, Autonomous Air and Ground Sensing Systems for Agricultural Optimization and Phenotyping III, pp. 1-9, Orlando, FL (April 2018).
10. Mamaghani, B., G. Sasaki, R. Connal, K. Kha, J. Knappen, R. Hartzell, E. Marcellus, T. Bauch, MN. Raqueño, C. Salvaggio, “An Initial Exploration of Vicarious and In-scene Calibration Techniques for Small Unmanned Aircraft Systems,” Proceedings SPIE Vol. 10664, Autonomous Air and Ground Sensing Systems for Agricultural Optimization and Phenotyping III, pp. 1-19, Orlando, FL (April 2018).
11. Jnawali, K., J. Kerekes, N. Rao, “Comparative Study of Spectral Matched Filter, Constrained Energy
Minimization, and Adaptive Coherence Estimator for Subpixel Target Detection Based on Hyperspectral Imaging,” Proceedings SPIE Vol. 10644, Algorithms and Technologies for Multispectral, Hyperspectral, and Ultraspectral Imagery XXIV, pp. 1-7, Orlando, FL (April 2018).
12. Accettura, M., T. Bauch, N. Raqueño, J. Mallia, C. Salvaggio, “Hyperspectral Detection of Methane Stressed
Vegetation,” Proceedings SPIE Vol. 10664, Autonomous Air and Ground Sensing Systems for Agricultural Optimization and Phenotyping III, pp. 1-12, Orlando, FL (April 2018).
13. Mathew, J., J. Kerekes, “Multi-spectral Change Detection Methods: Evaluation on Simulated and Real-world
Satellite Imagery, Proceedings SPIE Vol. 10644, Algorithms and Technologies for Multispectral, Hyperspectral, and Ultraspectral Imagery XXIV, pp. 1-7, Orlando, FL (April 2018).
14. Han, S., J. Kerekes, S. Higbee, L. Siegel, “Simulation Techniques for Image Utility Analysis,” Proceedings
SPIE Vol. 10644, Algorithms and Technologies for Multispectral, Hyperspectral, and Ultraspectral Imagery XXIV, pp. 1-8, Orlando, FL (April 2018).
15. Gefei Y., M. Gartley, "A Wide Dense Architecture Neural Network for Material Classification based on
Spectral BTF," Proceedings SPIE Vol. 10644, Algorithms and Technologies for Multispectral, Hyperspectral, and Ultraspectral Imagery XXIV, pp. 1-10, Orlando, FL (April 2018).
16. Hughes, E., S. Pethybridge, J. Kikkert, C. Salvaggio, J. van Aardt, “Snap Bean Flowering Detection from
UAS Imaging Spectroscopy,” 14th International Conference on Precision Agriculture, pp. 1-6, Montreal, Quebec, Canada (June 2018).
17. Ientilucci, E., “Processing a New Hyperspectral Data Set for Target Detection and Atmospheric Compensation
Algorithm Assessment: The RIT 2017 Data Set,” Proceedings of the 2018 IEEE International Geoscience and Remote Sensing Symposium (IGARSS), pp. 4249-4252, Valencia, Spain, (July 2018).
18. Yang, G., U. Gewali, E. Ientilucci, M. Gartley, and S. Monteiro, “Dual-Channel DenseNET for Hyperspectral
Image Classification,” Proceedings of the 2018 IEEE International Geoscience and Remote Sensing Symposium (IGARSS), pp. 2595-2598, Valencia, Spain, (July 2018).
19. Kerekes, J., C. Webber, R. Raqueño, “Methane Detection in the Longwave Infrared,” Proceedings of the 2018
IEEE International Geoscience and Remote Sensing Symposium (IGARSS), pp. 1719-1721, Valencia, Spain, (July 2018).

DIRS Annual Report Academic Year 2017-2018
Digital Imaging and Remote Sensing Laboratory · Chester F. Carlson Center for Imaging Science
54 Lomb Memorial Drive · Rochester, NY 14623-5604
36
20. van Aardt, J., E. Hughes, S. Pethybridge, J. Kikkert, C. Salvaggio, “Transforming Disease Management Through the Use of Unmanned Aerial Systems,” International Congress of Plant Pathology (ICPP) 2018: Plant Health in A Global Economy, Boston, Massachusetts, United States (August 2018).