digital libraries: ranked evaluation
TRANSCRIPT

Digital Libraries: Ranked Evaluation
RAFFAELLA BERNARDI
UNIVERSITA DEGLI STUDI DI TRENTO
P.ZZA VENEZIA, ROOM: 2.05, E-MAIL: [email protected]
Contents First Last Prev Next J

Contents1 Why Ranking . . . . . . . . . . . . . . . . . . . . . . . . . . . . . . . . . . . . . . . . . . . . . . . . . 4
1.1 Empirical investigation of the effect of ranking . . . . . . . . . . . . . . 51.2 Importance of ranking: Summary . . . . . . . . . . . . . . . . . . . . . . . . . 11
2 Predicted and true probability of relevance . . . . . . . . . . . . . . . . . . . . . . . . 123 Evaluation . . . . . . . . . . . . . . . . . . . . . . . . . . . . . . . . . . . . . . . . . . . . . . . . . . . 13
3.1 Relevance: query vs. information need . . . . . . . . . . . . . . . . . . . . . 143.2 Relevance: query vs. information need . . . . . . . . . . . . . . . . . . . . . 153.3 Reminder: Precision and Recall . . . . . . . . . . . . . . . . . . . . . . . . . . . 16
4 Ranked evaluation . . . . . . . . . . . . . . . . . . . . . . . . . . . . . . . . . . . . . . . . . . . . . 174.1 Precision/Recall: at position . . . . . . . . . . . . . . . . . . . . . . . . . . . . . . 184.2 Interpolated Precision . . . . . . . . . . . . . . . . . . . . . . . . . . . . . . . . . . . 194.3 Precision-recall curve . . . . . . . . . . . . . . . . . . . . . . . . . . . . . . . . . . . 204.4 From P-R curve to measure . . . . . . . . . . . . . . . . . . . . . . . . . . . . . . 214.5 11-point interpolated precision . . . . . . . . . . . . . . . . . . . . . . . . . . . . 234.6 11-point interpolated precision: Graph . . . . . . . . . . . . . . . . . . . . . 244.7 11-point interpolated average precision . . . . . . . . . . . . . . . . . . . . . 254.8 Average over quries . . . . . . . . . . . . . . . . . . . . . . . . . . . . . . . . . . . . . 26
Contents First Last Prev Next J

4.9 Mean Average Precision . . . . . . . . . . . . . . . . . . . . . . . . . . . . . . . . . 274.10 MAP: Example . . . . . . . . . . . . . . . . . . . . . . . . . . . . . . . . . . . . . . . . 284.11 Precision and Recall at position k . . . . . . . . . . . . . . . . . . . . . . . . . 294.12 R-Precision . . . . . . . . . . . . . . . . . . . . . . . . . . . . . . . . . . . . . . . . . . . . 304.13 Variance of measures like precision/recall . . . . . . . . . . . . . . . . . . 314.14 Evaluation Measures: Summing up . . . . . . . . . . . . . . . . . . . . . . . . 32
5 Evaluation benchmarks . . . . . . . . . . . . . . . . . . . . . . . . . . . . . . . . . . . . . . . . . 335.1 Standard relevance benchmark: Cranfield . . . . . . . . . . . . . . . . . . . 345.2 Standard relevance benchmark: TREC . . . . . . . . . . . . . . . . . . . . . 355.3 Standard relevance benchmarks: Others . . . . . . . . . . . . . . . . . . . . 365.4 Validity of relevance assessments . . . . . . . . . . . . . . . . . . . . . . . . . 375.5 Kappa measure . . . . . . . . . . . . . . . . . . . . . . . . . . . . . . . . . . . . . . . . . 385.6 Calculating the kappa statistic . . . . . . . . . . . . . . . . . . . . . . . . . . . . 395.7 Interjudge agreement at TREC . . . . . . . . . . . . . . . . . . . . . . . . . . . . 405.8 Impact of interjudge disagreement . . . . . . . . . . . . . . . . . . . . . . . . . 415.9 A/B testing . . . . . . . . . . . . . . . . . . . . . . . . . . . . . . . . . . . . . . . . . . . . 425.10 Critique of pure relevance . . . . . . . . . . . . . . . . . . . . . . . . . . . . . . . . 43
6 Result summaries . . . . . . . . . . . . . . . . . . . . . . . . . . . . . . . . . . . . . . . . . . . . . 447 General comment . . . . . . . . . . . . . . . . . . . . . . . . . . . . . . . . . . . . . . . . . . . . . 45
Contents First Last Prev Next J

1. Why Ranking• Problems with no ranked retrieval:
– Users want to look at a few results – not thousands.
– It’s very hard to write queries that produce a few results.
– Even for expert searchers
– → Ranking is important because it effectively reduces a large set of results to avery small one.
• Even if users get more data, they only look at a few results. In the vast majority ofcases they only examine 1, 2, or 3 results.
Contents First Last Prev Next J

1.1. Empirical investigation of the effect of ranking
How can we measure how important ranking is?
Observe what searchers do when they are searching in a controlled setting
• Videotape them
• Ask them to “think aloud”
• Interview them
• Eye-track them
• Time them
• Record and count their clicks
The following slides are from Dan Russell’s JCDL talk – Dan Russell is the “Uber TechLead for Search Quality & User Happiness” at Google.
Contents First Last Prev Next J

Contents First Last Prev Next J

Contents First Last Prev Next J

Contents First Last Prev Next J

Contents First Last Prev Next J

Contents First Last Prev Next J

1.2. Importance of ranking: Summary
• Viewing abstracts: Users are a lot more likely to read the abstracts of the top-rankedpages (1, 2, 3, 4) than the abstracts of the lower ranked pages (7, 8, 9, 10).
• Clicking: Distribution is even more skewed for clicking.
• In 1 out of 2 cases, users click on the top-ranked page.
• Even if the top-ranked page is not relevant, 30% of users will click on it.
• → Getting the ranking right is very important.
• → Getting the top-ranked page right is most important.
Contents First Last Prev Next J

2. Predicted and true probability of relevance
Hence cosine similarity normalization has been fine tuned.
Contents First Last Prev Next J

3. Evaluation• User happiness is equated with the relevance of search results to the query.
• But how do you measure relevance?
• Standard methodology in information retrieval consists of three elements.
– A benchmark document collection
– A benchmark suite of queries
– An assessment of the relevance of each query-document pair
Contents First Last Prev Next J

3.1. Relevance: query vs. information need
• Relevance to what?
• First take: relevance to the query
• “Relevance to the query” is very problematic.
• Information need i: “I am looking for information on whether drinking red wine ismore effective at reducing your risk of heart attacks than white wine.”
• This is an information need, not a query.
• Query q: [red wine white wine heart attack]
• Consider document d′: At heart of his speech was an attack on the wine industrylobby for downplaying the role of red and white wine in drunk driving.
• d′ is an excellent match for query q . . .
• d′ is not relevant to the information need i.
Contents First Last Prev Next J

3.2. Relevance: query vs. information need
• User happiness can only be measured by relevance to an information need, not byrelevance to queries.
• Our terminology is sloppy in these slides: we talk about query-document relevancejudgments even though we mean information-need-document relevance judgments.
Contents First Last Prev Next J

3.3. Reminder: Precision and Recall
Relevant NonrelevantRetrieved true positives (TP) false positives (FP)Not retrieved false negatives (FN) true negatives (TN)
P = T P/(T P+FP)R = T P/(T P+FN)
• You can increase recall by returning more docs. docs retrieved.
• A system that returns all docs has 100% recall!
• The converse is also true (usually): It’s easy to get high precision for very low recall.
Contents First Last Prev Next J

4. Ranked evaluation• Precision/recall/F are measures for unranked sets.
• We can easily turn set measures into measures of ranked lists.
• Just compute the set measure for each “prefix”: the top 1, top 2, top 3, top 4 etcresults
• Doing this for precision and recall gives you a precision-recall curve.
Contents First Last Prev Next J

4.1. Precision/Recall: at position
P = TP/(TP + FP) R = TP/(TP + FN)P = TP/retrieved R = TP/relevant
Contents First Last Prev Next J

4.2. Interpolated Precision
Note: if the (k + 1)th document is not relevant, then recall is the same as for the topk documents, but precision has dropped; if it is relevant, then both precision and recallincrease, and the curve jags up and to the right.
It’s good to remove these jiggles. The standard way to do so is with interpolated precision(Pinterp)
Pinterp(r) = maxr′>r P(r′)
the interpolated precision at a certain recall level r is defined as the highest precisionfound for any recall level r′ > r.
Contents First Last Prev Next J

4.3. Precision-recall curve
0.0
0.2
0.4
0.6
0.8
1.0
0.0 0.2 0.4 0.6 0.
Recall
Precision
• Each point corresponds to a result for the top k ranked hits (k = 1,2,3,4, . . .).
• Interpolation (in red): Take maximum of all future points
• Rationale for interpolation: The user is willing to look at more stuff if both precisionand recall get better.
Contents First Last Prev Next J
4.4. From P-R curve to measure
Examining the entire P-R curve is very informative, but having a single measure is moredesirable.
The traditional way to obtain this is the eleven-point interpolated average precision:
The interpolated precision is measured at 11 recall levels of 0.0, 0.1., 0.2 . . . 1.0. (0, 10,20 . . . 100 percent)
For each recall level, we then calculate the arithmetic mean of the interpolated precisionat that recall level for each information need in the test collection.
Contents First Last Prev Next J

Contents First Last Prev Next J

4.5. 11-point interpolated precision
P = TP/retrieved, R = TP/relevant relevant = 9
Contents First Last Prev Next J

4.6. 11-point interpolated precision: Graph
Contents First Last Prev Next J
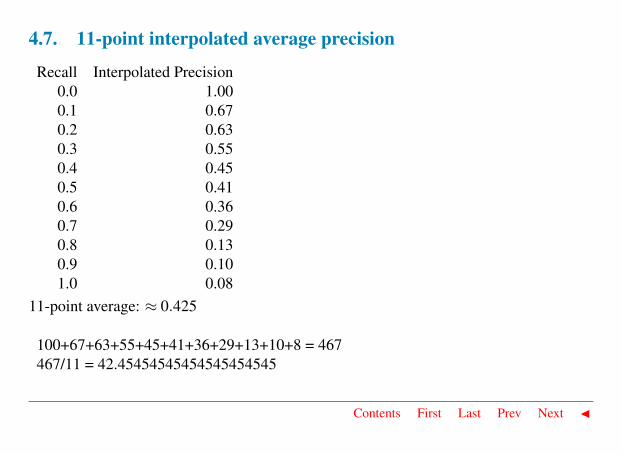
4.7. 11-point interpolated average precision
Recall Interpolated Precision0.0 1.000.1 0.670.2 0.630.3 0.550.4 0.450.5 0.410.6 0.360.7 0.290.8 0.130.9 0.101.0 0.08
11-point average: ≈ 0.425
100+67+63+55+45+41+36+29+13+10+8 = 467467/11 = 42.45454545454545454545
Contents First Last Prev Next J

4.8. Average over quries
Single query performance is not necessarily representative of the system’s performance:
• Compute interpolated precision at recall levels 0.0, 0.1, 0.2, . . .
• Do this for each of the queries in the evaluation benchmark
• Average over queries
• This measure measures performance at all recall levels.
• The curve below is typical of performance levels at TREC (50 queries).
0
0.2
0.4
0.6
0.8
1
0 0.2 0.4 0.6 0.8 1
Recall
Precision
Contents First Last Prev Next J

4.9. Mean Average Precision
For one information need, it is the average of the precision value obtained for the top kdocuments each time a relevant document is retrieved.
• No used of fixed recall levels. No interpolation.
• When no relevant doc is retrieved, the precision value is taken to be 0.
The MAP value for a test collection is then the arithmetic mean of MAP values for indi-vidual information needs. Each query counts equally.
MAP scores vary widely across information needs.
This means that a set of test information needs must be large and diverse enough to berepresentative of system effectiveness across different queries.
Contents First Last Prev Next J

4.10. MAP: Example
Contents First Last Prev Next J

4.11. Precision and Recall at position k
Some time what matters is how many good results there are on the first page or first threepages.
This brings to other measures based on fixed low level of retrieved results (10 or 30documents.).
Precision@k Precision on the top k retrieved documents. It’s appropriate for Web searchengines: Most user scan only the first few (e.g. 10) hyperlinks that are presented.
Recall@k Recall on the top k retrieved documents. Appropriate for archival retrieval sys-tems: what fraction of total number of relevant documents did a user find after scanningthe first (e.g. 100) documents?
Advantage: there is no need to estimate the size of the set of relevant documents. Disad-vantage: it is the least stable measure.
Contents First Last Prev Next J

4.12. R-Precision
Alternative. It requires having a set of known relevant document (Rel), (though perhapsincomplete).
It computes the precision on the top Rel retrieved documents.
It’s better to average this measure over queries.
R-Precision is highly correlated with MAP.
Contents First Last Prev Next J

4.13. Variance of measures like precision/recall
• For a test collection, it is usual that a system does badly on some information needs(e.g., P = 0.2 at R = 0.1) and really well on others (e.g., P = 0.95 at R = 0.1).
• Indeed, it is usually the case that the variance of the same system across queries ismuch greater than the variance of different systems on the same query.
• That is, there are easy information needs and hard ones.
Contents First Last Prev Next J
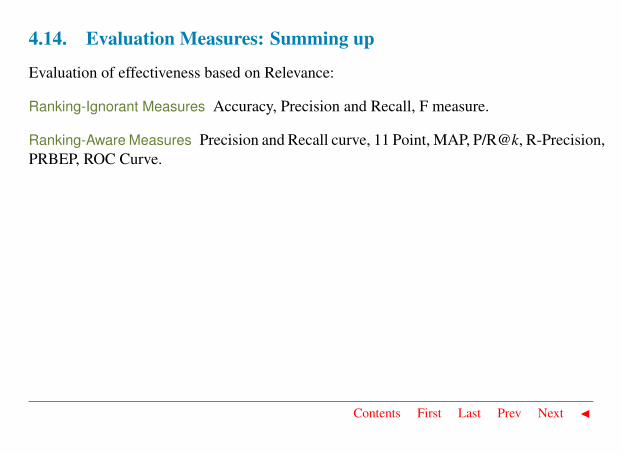
4.14. Evaluation Measures: Summing up
Evaluation of effectiveness based on Relevance:
Ranking-Ignorant Measures Accuracy, Precision and Recall, F measure.
Ranking-Aware Measures Precision and Recall curve, 11 Point, MAP, P/R@k, R-Precision,PRBEP, ROC Curve.
Contents First Last Prev Next J

5. Evaluation benchmarks• A collection of documents
– Documents must be representative of the documents we expect to see in reality.
• A collection of information needs
– . . . which we will often incorrectly refer to as queries
– Information needs must be representative of the information needs we expect tosee in reality.
• Human relevance assessments
– We need to hire/pay “judges” or assessors to do this.
– Expensive, time-consuming
– Judges must be representative of the users we expect to see in reality.
Contents First Last Prev Next J

5.1. Standard relevance benchmark: Cranfield
• Pioneering: first testbed allowing precise quantitative measures of information re-trieval effectiveness
• Late 1950s, UK
• 1398 abstracts of aerodynamics journal articles, a set of 225 queries, exhaustiverelevance judgments of all query-document-pairs
• Too small, too untypical for serious IR evaluation today
Contents First Last Prev Next J

5.2. Standard relevance benchmark: TREC
• TREC = Text Retrieval Conference (TREC)
• Organized by the U.S. National Institute of Standards and Technology (NIST)
• TREC is actually a set of several different relevance benchmarks.
• Best known: TREC Ad Hoc, used for first 8 TREC evaluations between 1992 and1999
• 1.89 million documents, mainly newswire articles, 450 information needs
• No exhaustive relevance judgments – too expensive
• Rather, NIST assessors’ relevance judgments are available only for the documentsthat were among the top k returned for some system which was entered in the TRECevaluation for which the information need was developed.
Contents First Last Prev Next J

5.3. Standard relevance benchmarks: Others
• GOV2
– Another TREC/NIST collection– 25 million web pages– Used to be largest collection that is easily available– But still 3 orders of magnitude smaller than what Google/Yahoo/MSN index
• NTCIR
– East Asian language and cross-language information retrieval
• Cross Language Evaluation Forum (CLEF)
– This evaluation series has concentrated on European languages and cross-languageinformation retrieval.
• CLEF-TEL.
• Trento: http://www.celct.it/ (E. Pianta)
Contents First Last Prev Next J

5.4. Validity of relevance assessments
• Relevance assessments are only usable if they are consistent.
• If they are not consistent, then there is no “truth” and experiments are not repeatable.
• How can we measure this consistency or agreement among judges?
• → Kappa measure
Contents First Last Prev Next J
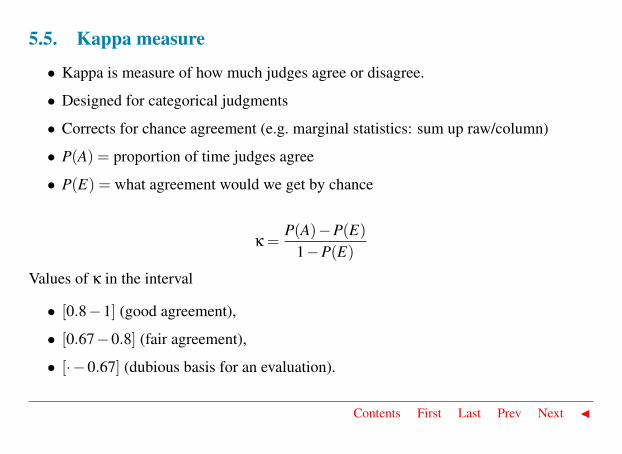
5.5. Kappa measure
• Kappa is measure of how much judges agree or disagree.
• Designed for categorical judgments
• Corrects for chance agreement (e.g. marginal statistics: sum up raw/column)
• P(A) = proportion of time judges agree
• P(E) = what agreement would we get by chance
κ =P(A)−P(E)
1−P(E)
Values of κ in the interval
• [0.8−1] (good agreement),
• [0.67−0.8] (fair agreement),
• [·−0.67] (dubious basis for an evaluation).
Contents First Last Prev Next J

5.6. Calculating the kappa statistic
Judge 2 RelevanceYes No Total
Judge 1 Yes 300 20 320Relevance No 10 70 80
Total 310 90 400
Observed proportion of the times the judges agreedP(A) = (300+70)/400 = 370/400 = 0.925
Pooled marginals P(nonrelevant) = (80+90)/(400+400) = 170/800 = 0.2125
P(relevant) = (320+310)/(400+400) = 630/800 = 0.7878
Probability that the two judges agreed by chanceP(E) = P(nonrelevant)2 +P(relevant)2 = 0.21252 +0.78782 = 0.665
Kappa statistic κ = (P(A)−P(E))/(1−P(E)) = (0.925−0.665)/(1−0.665) = 0.776(still in acceptable range)
Contents First Last Prev Next J

5.7. Interjudge agreement at TREC
information number of disagreementsneed docs judged
51 211 662 400 15767 400 6895 400 110
127 400 106
Contents First Last Prev Next J
5.8. Impact of interjudge disagreement
• Judges disagree a lot. Does that mean that the results of information retrievalexperiments are meaningless?
• No.
• Large impact on absolute performance numbers
• Virtually no impact on ranking of systems
• Supposes we want to know if algorithm A is better than algorithm B
• An information retrieval experiment will give us a reliable answer to this questioneven if there is a lot of disagreement between judges.
Contents First Last Prev Next J
5.9. A/B testing
• Purpose: Test a single innovation
• Prerequisite: You have a large search engine up and running.
• Have most users use old system
• Divert a small proportion of traffic (e.g., 1%) to the new system that includes theinnovation
• Evaluate with an “automatic” measure like clickthrough on first result
• Now we can directly see if the innovation does improve user happiness.
• Probably the evaluation methodology that large search engines trust most
Contents First Last Prev Next J

5.10. Critique of pure relevance
• We’ve defined relevance for an isolated query-document pair.
• Alternative definition: marginal relevance
• The marginal relevance of a document at position k in the result list is theadditional information it contributes over and above the information that wascontained in documents d1 . . .dk−1.
• But even if a document is highly relevant its information can be completelyredundant with other documents that have already been considered (e.g.duplicates!).
Contents First Last Prev Next J

6. Result summariesHow do we present results to the user?
• Most often: as a list – aka “10 blue links”
• How should each document in the list be described?
• This description is crucial. The user often can identify good hits (= relevant hits)based on the description.
• No need to “click” on all documents sequentially
Doc description in result list Most commonly: doc title, url, some metadata . . . and asummary. How do we “compute” the summary (not considered in this course.)
Contents First Last Prev Next J

7. General comment• Systems usually have various weights (parameters) that can be adjusted to tune
system performance.
• It is wrong to report results on a test collection that were obtained by tuning theseparameters to maximize performance on that collection.
• Such tuning overstates the expected performance of the system, because theweights will be set to maximize the performance on one particular set of queriesrather than for a random sample of queries.
• The correct procedure is to have one or more development test collection, and totune the parameters on the development test collection.
• The tester then runs the system with those weights on the test collection and reportsthe results on that collection as an unbiased estimate of performance.
Contents First Last Prev Next J