digital radiography systems (drs) - endoexperience exerpts...digital radiography system (drs).19 the...
TRANSCRIPT
120 Endodontics 6 - Visiography Systems 121
ORIGINS AND TECHNOLOGICAL EVOLUTION
In 1984 Dr. Francis Mouyen from Toulouse (France), patenting the concept of an intra-oral radiographic sensor featuring instant image capture, gave birth to Digital Radiography System (DRS).19
The first radiographic image capturing device was an image sensor based on a large silicon matrix integra-ted circuit. This was based on the principle of a char-ged coupled device (CCD). This sensor was assem-bled with a scintillator, a device made up of a surfa-ce of phosphor atoms, which, triggered by incident X-rays, emit a luminous radiation.This image is transferred through optical fibers from the scintillator itself to the CCD sensitive elements. The first system was not computer-linked. It allowed to see images only on a video screen, but it could not save them on a computer (Trophy 1988).20 The first computer-linked system was the Visualix by Gendex (1992) This, in its turn, is linked directly, through a connector, to the computer. Here it goes through an
electronic card which transforms the electronic si-gnal coming from the sensor into a digital one, which can be memorized, containing the image. These data, which make up the captured image, can be conver-ted by the software into one of the various standard graphic formats (.TIF, .JPEG, .PCX, .BMP, .PIC, etc.) differing from one another mainly for the features of information compression.17,18
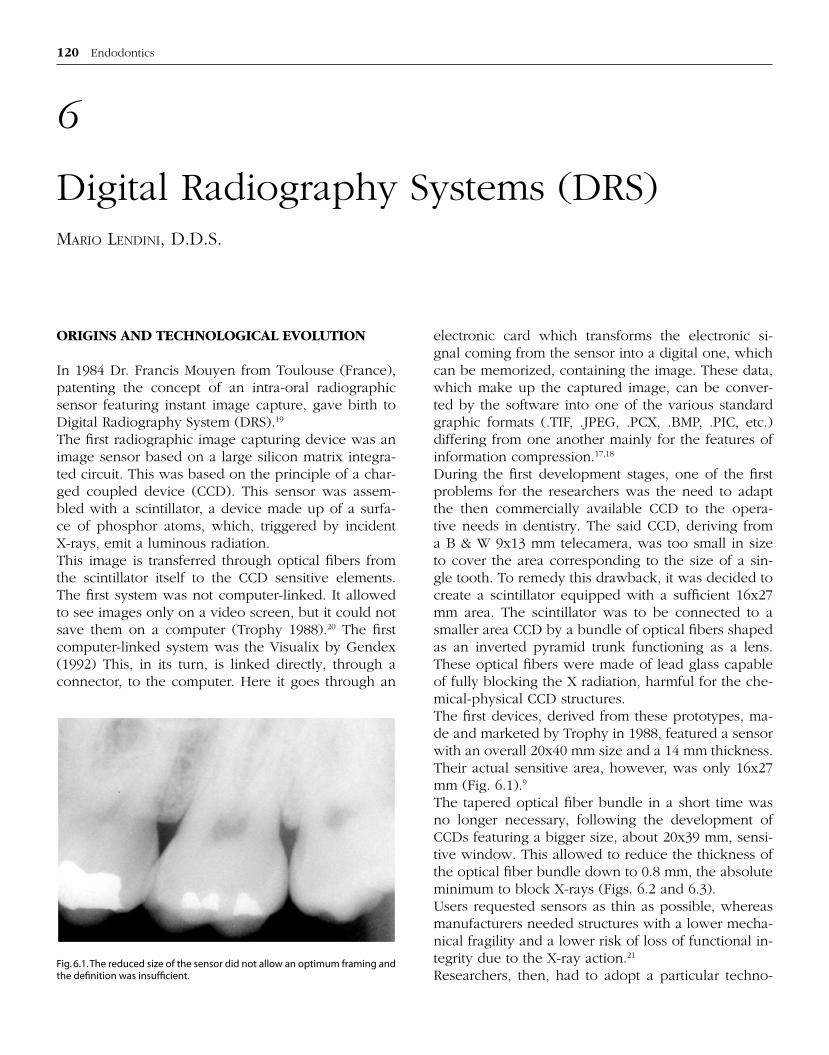
During the first development stages, one of the first problems for the researchers was the need to adapt the then commercially available CCD to the opera-tive needs in dentistry. The said CCD, deriving from a B & W 9x13 mm telecamera, was too small in size to cover the area corresponding to the size of a sin-gle tooth. To remedy this drawback, it was decided to create a scintillator equipped with a sufficient 16x27 mm area. The scintillator was to be connected to a smaller area CCD by a bundle of optical fibers shaped as an inverted pyramid trunk functioning as a lens. These optical fibers were made of lead glass capable of fully blocking the X radiation, harmful for the che-mical-physical CCD structures.The first devices, derived from these prototypes, ma-de and marketed by Trophy in 1988, featured a sensor with an overall 20x40 mm size and a 14 mm thickness. Their actual sensitive area, however, was only 16x27 mm (Fig. 6.1).9
The tapered optical fiber bundle in a short time was no longer necessary, following the development of CCDs featuring a bigger size, about 20x39 mm, sensi-tive window. This allowed to reduce the thickness of the optical fiber bundle down to 0.8 mm, the absolute minimum to block X-rays (Figs. 6.2 and 6.3).Users requested sensors as thin as possible, whereas manufacturers needed structures with a lower mecha-nical fragility and a lower risk of loss of functional in-tegrity due to the X-ray action.21
Researchers, then, had to adopt a particular techno-
6
Digital Radiography Systems (DRS)MARIO LENDINI, D.D.S.
Fig. 6.1. The reduced size of the sensor did not allow an optimum framing and the definition was insufficient.

120 Endodontics 6 - Visiography Systems 121
logy aiming at hardening the CCD structure (harde-ned device) which allowed to eliminate the fiberglass layer. The present day CCD technological develop-ment provides sensors with an actual capture area of over 36x25 mm and thickness up to 5 mm. Moreover, the width of the outline edge has been further redu-ced (Figs. 6.4 and 6.5).The first systems envisaged an electrical coupling with the X-ray generator, so as to be able to synchronize the image capture with the emission of rays.21
Most present day devices, on the contrary, work in a totally asynchronous way: the sensor is actually capa-ble of synchronizing automatically as soon as it picks up the presence of radiation.23
Microscopic silicon cells make up the structu-re of the CCD sensitive matrix. At present CMOS
[Complementary MOS (Metal Oxide Semiconductor chip)] sensor feature 40µ pixel whereas CCD sensor feature 20µ pixels.33 The Visualix HDI CCD by Gendex features 20µ pixels and it can work both in high and in standard resolution. In the later case pixels are cou-pled. Each of these cells corresponds, in practice, to a photosensitive element (pixel), the basic component of an electronic image. At first it was thought to use smal-ler size silicon cells, less than 20μ each, which, combi-ned in groups of four, made up the area corresponding to a pixel. Technical difficulties and no actual com-pliance in terms of obtainable quality moved the choi-ce towards the present size of cells.1,2
This technical solution gives a theoretical output up to a maximum of 25 pairs of lines per millimeter in terms of space resolution when referring to 20µ pixels. At
Fig. 6.2. Structure of a CCD sensor. Fig. 6.3. The optical fiber protects the CCD from non-absorbed X-rays, it redu-ces light dispersion and, therefore, it increases spatial resolution.
Fig. 6.4. Structure of a CCD. Fig. 6.5. Last generation sensors (in the picture, those produced by Schick Technologies) feature an excellent ratio between overall size and sensitive surface.

122 Endodontics 6 - Visiography Systems 123
present, through high definition sensors, one can get 25 nominal pairs of lines per millimeter, which beco-me 18 or 20 real ones. The most widespread sensors on the market give a definition of 18 nominal pairs of lines per millimeter which become 13 real ones.All the available sensors have been designed speci-fically for intra-oral use, envisaging the fitting into a sealed capsule which at the same time gives both protection against mechanical stress and the possibi-lity of disinfection through immersion into a liquid. Throwaway protections are available in order to avoid cross contamination (Fig. 6.6).This brief outline has simply illustrated the features of the oldest and wide-ranging family of DRS, the one with CCD sensors.Another family of DRS, with excitable phosphor sen-sors, the earliest example of which is the Digora sy-stem (Soredex) has been available for a few years (since 1994).The philosophy of these systems is sharply different from the one of the previously illustrated devices. The sensor has no direct link with the computer, but it is read by a device with a laser beam and photocaptu-ring feature (linear scanner) which transfers the image to the computer itself (Fig. 6.7).28
The sensor, which actually presents the look, size, thickness and flexibility of a traditional X-ray plate (Fig. 6.8), features a semi-rigid polyester support with a scintillator fitted on it; in practice a thin layer of a
Fig. 6.8. The appearance and consistence of the active phosphorous sensor are similar to those of a traditional radiographic film.
Fig. 6.7. The Denoptix system laser reader (Gendex) featuring a drum on which the sensor-films are posi-tioned. The same sensor-films can be seen in the fo-reground in their different sizes.
B
A
Fig. 6.6. Throwaway protections for CCD type sensors (above) and for memory phosphor type sensors (belove).
material made up of excitable phosphor atoms (acti-vated barium fluorohalide crystals) which, hit by X-rays, go through an excited state creating a latent ima-ge. The layer of this material must be as thin as possi-

122 Endodontics 6 - Visiography Systems 123
tion phase is usually preceded by a pre-reading phase which supplies the information through which the sy-stem sets the reading final level.After the reading, the latent images contained in the sensors can be fully cancelled through the exposure to an intense source of light, for example an exami-nation table. The sensor, unless damaged by scratches or folds, can be re-used hundreds of times. The same sensor is inserted into special throwaway bags who-se function is to protect the side sensitive to light from unintentional exposures which could either alter or cancel data before reading.18,28
Sensors from this group are available in a number of sizes (22x35, 24x40, 31x41, 27x54, 57x76 mm) (Fig. 6.7). This technical solution at present gives an output of 12 pairs of lines/millimeter in terms of space reso-lution with a feature for high and low resolution (300 and 600 dpi = dots per inch).
FEATURES OF THE DRS IMAGE
After this short and deliberately simple view of the sensors available at present we can now examine the features of the images obtainable through the DRS analyzing them both in absolute terms and, whe-re possible, in relation to conventional radiographic
Fig. 6.9. The incident X rays on the surface of the sensor demarcate the latent image.
Fig. 6.10. Memorising phosphorous function as normal reinforcing screens, but a part of X-ray energy is stored in the phosporous crystals. Stimulated by the laser light the crystals discharge light in function of the memorised energy.
ble to avoid light diffusion phenomena which would reduce the image quality. For the same reason, the compound granulometry too must be extremely fine. The principle is similar to the one of photographic emulsions in which less definition corresponds to a gross grain.Granulometric fineness of the sensitive compound and thickness of the layer of material (as fine as possi-ble) being the same, the latest technical evolution uses blue phosphor (Denoptix – Gendex) instead of white phosphor. Blue phosphor is more luminous and ena-bles the laser reader to read the latent image better, affecting, then, in the last analysis, the technical featu-res of the image itself. The main advantage, however, is for blue phosphor to be more sensitive to radiation allowing then, a reduction of X-rays.5
It has been observed that X-rays incident on these sensors cause the excitation of the phosphor atoms which can be stimulated and which delineate the la-tent image (Fig. 6.9).The sensor must then be inserted into the reader, which performs a complete scanning of the whole surface of the sensor. The reading is performed by a very thin laser red beam which releases the latent energy by stimulating the phosphor atoms to emit either a white or a blue luminosity, depending on the quality of the sensitive material (Fig. 6.10).The amount of released energy is measured at eve-ry pixel. At this stage an analog-digital converter co-mes into play and converts the electrical signal resul-ting in a digital signal. The converter sends the digi-tal signal to the computer through a connection cable and an interface electronic card. The actual acquisi-

124 Endodontics 6 - Visiography Systems 125
images.6 Usually the image acquired by the DRS sen-sor is digitalized (Tab. I, II, III and IV) under the form of 8-bit data. An 8-bit image has 256 levels of lumino-sity from 0 (black) to 255 (white). The contrast reso-
lution is measured as differences of level of gray, or pixel values, on a scale of grays of logarithm or semi-logarithm default.8
Table I
Requirements of a good sensor
– High sensitivity to X-rays– High resolution capacity– Maximum depth of color (a high number of levels
of gray)– Compatibility with existing radiological systems– Acceptable costs– Duration of sensor
Table III
Digitalization of an analog signal
Image luminosity and its sampling
Digital transformation of luminosityThe sampled value is calculatedon the mean point of intervals.
Table II
Digitalization progress
– Consists of sampling a signal which varies conti-nuously at constant intervals
– One will obtain a series of whole numbers which approximate the starting function and allow its re-construction
– This process, then, represents the transformation of an analog function into a more or less long se-quence of discrete values.
Table IV
Digitalization
– In the digitalization process not only is the sam-pling frequency important, but also the amplitude of the digitalized signal.
– This value represents the level of gray which is as-signed to the point under examination.
– We can think of digital images as of a set of ele-ments memorized in a numerical form, so as to maintain the biunique correspondence between the image and the element which represents it.
Reading and processing of DRS images
The factors which may affect the ease of reading of both a traditional and a digital radiographic image could be defined as intrinsic and extrinsic to the cha-racteristics of the image itself. Among extrinsic factors we have to consider the pro-perties of the means we use for viewing the image.In the case of a traditional image the X-ray exami-nation table must feature a white, homogeneous and sufficiently powerful light.

124 Endodontics 6 - Visiography Systems 125
Table V
Digitalization process
– In the image digitalization process a biunique cor-respondence between the original image and its digitalized form is maintained.
– Xi = X/p
x , where p
x stands for the size of the
pixel.– Each element of the matrix contains the “depth” of
the point as a level of gray.
It is important, however, to equip the viewer with a black screen with windows of the same size as the used radiographic plates. In this way the X-rays will have an adequate back-lighting, enabling us to fo-cus our attention exclusively on the details of inte-rest; while our ability to pick them increases thanks to the absence of luminous “pollution”, a lesser eye fatigue and, of course, optical magnification systems (Fig. 6.11).Whereas in the case of a digital image the technical features of the monitor are very important. Particular attention must, then, be paid to resolution, definition, chromatic output, but also, not a minor detail, to ima-ge stability; a flickering screen or continuous and sud-den changes of luminosity and contrast will fatigue our visual ability and distract our attention from the particulars of interest.The intrinsic factors of the image which affect the ea-se of reading are mostly its size; also the image defi-nition is very important of course. This, however, is a parameter which, having its own absolute specific im-portance, will be analyzed at a later stage.
Understandably it may be more difficult and deman-ding to read the details of a 3x4 cm or 2x3 cm image – widely used sizes in endodontic radiology -, by com-parison with an image displayed on a 15- maybe 17-in video-screen, naturally with comparable quality cri-teria (Fig. 6.12).Other features are more properly connected with the possibilities of processing the digital image (Tab. V). Contrast and luminosity of traditional radiographs are strictly linked with carrying out the investigation (emission time of X-rays and their quality and quan-tity) and the transition of developing and fixing (con-centration, effectiveness and temperatures of liquids, absence of luminous pollution, adequate washing and drying procedures).
Fig. 6.11. Screened X-ray examination table and optical magnification sy-stems.
Fig. 6.12. DRS images on a monitor.

126 Endodontics 6 - Visiography Systems 127
Digital radiographic images are, on the contrary, cha-racterized by the possibility of modifying luminosity and contrast in a continuative way, with no limits of range and in a fully reversible way, even though they maintain unaltered their basic properties (resolution and definition).31
This option, managed through a graphic processing program (one of the software components of DRS) al-lows an easy and fast manipulation of the image, op-timizing its final output.7
There are, in addition, some more functions offered by the graphic processing programs. These functions allow:– image enlargement, enhancing in this way impor-
tant details;– to see the image as a negative through a complete
inversion of chromatic components;– to modify the histogram of the levels of gray to im-
prove the dynamics of the image;– to apply a three-dimensional filter to the image to
obtain a “bas relief” effect (Fig. 6.13).
present and to take length measurements with a pre-cision up to 1/10 mm.14
This is also possible on curved stretches by approxi-mation with a line of measurement subdivided in mo-re segments angled among themselves even with de-gree fractions. It is obvious that the more detailed and close to reality the computer reading scales are, the more effective the interpretation may be (Fig. 6.15).
Fig. 6.13. Image processing with 3-D effect application.
Fig. 6.14. The software of the image graphic management can process it with different “effects”.
Fig. 6.15. Length and angle measurements may be useful for a preventive ap-praisal of the level of difficulty of the planned endodontic treatment.
These and other functions are meant to offer the professional more reading scales so as to identify each time the most effective one in terms of global comprehension of the image (Fig. 6.14).24,25
Other interesting options are the ones which allow the computer - basing itself on pre-set reading scales - to carry out a rough analysis of the bone density of the sectors investigated by the radiovideographic image, interpolating the quality of the tones of gray there

126 Endodontics 6 - Visiography Systems 127
Quality of DRS images
The quality of the digital radiographs images is in step with the features of the different components of the system: hardware, acquisition sensors and software.13
Hardware
In this case the following are particularly important: not only the monitor, but also the computer features, then the quality of the graphic card (which physical-ly allows the computer to acquire and process any type of image), the type of processor (the computer “brains”), the size of the memory on the fixed disk (“the store”) and the so called RAM memory (which allows the computer to keep programs and images “alive” and active). All these components, affecting not only the image quality, but also the speed and the efficiency of the processing, are so strictly correlated that the inadequacy of a single one of these may de-termine a remarkable worsening of the quality of the end product.32
Acquisition Sensors
The two main groups of DRS acquisition sensors and their respective features have already been described. Needless to say that this component of the system has a decisive influence on the definition quality of the acquired image.3 It is, however, also necessary to em-phasize that sensors, in particular silicon cell ones, ha-ve seen a very rapid evolution, both on terms of phy-sical size and on terms of quantity and quality of the acquisition points, total surface being the same. It is likely that this rapid technical progress is far from en-ding and that there may be important improvements in methodology also in the short term.I would like, anyway, to quote some important pa-rameters which directly affect the definition of the fi-nal image.1) The resolution of an “imaging” system is defined
by its ability to “resolve” different density structu-res placed one next to the other.
It is usually measured through a “grid test” which consists of a series of lead bars alternate with spa-ces subdivided into groups of decreasing amplitu-de. In each group, the full and the empty ones are equally spaced.
The whole set of a bar and a space is defined as a
“pair of lines” (Fig. 6.16). The quality of a sensor is then linked with the highest number of “pairs of li-nes” which allow an adequate resolution of the in-vestigated object (Fig. 6.17).
This feature is linked not so much to the normal vi-sion of an image – (also the human eye has a ma-ximum resolution limit on terms of number of pairs per millimeter, about 16, and then a higher resolu-tion in theory would not be necessary), but, abo-
Fig. 6.16. The set of a bar and a space is defined as a “pair of lines”.
Fig. 6.17. Examples of a subsampling. If the acquisition system does not featu-re sufficient resolution, the resulting image will not be sufficiently defined.

128 Endodontics 6 - Visiography Systems 129
ve all, to the possibility of magnifying smaller and smaller details keeping high the quality itself of the magnified image.11
2) The signal-to-noise ratio (SNR = signal-to-noise ra-tio) (Fig. 6.18) quantifies the performance of the system relating the technical qualities of the sen-sors (both DRS and traditional) - in keeping with their characteristic “background noise” - to quality and quantity of X-rays necessary to obtain a good image.
For simplification’s sake, one can say that the greater the disturbance (background noise) of the sensor or devices to it correlated (for instance: la-ser readers or electronic cards), the greater will have to be the quantity of X-rays necessary to ou-tdo them and obtain a good image (Fig. 6.19).
A system which may boast a high SNR will then be able to supply images with a better definition, X-ray dosages being the same.
3) The frequency interval of data collection (or dy-namic range) is the parameter which quantifies the ability to collect faithfully small details without the “luminous tail” effects, that is the quantity and quality of the images obtainable through the sy-stem.
Also in this case a better technical setting corre-sponds to a high value. In particular the ability to acquire images both with a low and a high radiant energy level of an equal quality standard, with the reduction of over- and underexposure risks of the images themselves, corresponds to a wide spectrum of dynamic range.
Software
The programs which run the transition of information from the sensor to the computer memory and which, then, in the last analysis, control first the production and, then, the management, processing and filing of the image, should hardly affect the determination of definition, meant as amount of dots for a given sur-face.2,26
Software should be, then, particularly in the “produc-tion” stage of the image, only and exclusively as a means, an intermediary between the sensor percei-ving the object, as it is drawn by the X-rays, and hard-ware which then physically shows it. Actually software – particularly in DRS with silicon cell sensors – still plays an important role at this sta-ge.One can imagine the sensitive surface of a silicon cell sensor subdivided by a sort of grid into a number of
Fig. 6.18. Image quality is measured not so much by noise but by the ratio between the useful signal and the noise itself. SNR = SIGNAL TO NOISE RATIO
B
A
Fig. 6.19. Images with a good contrast can be interpreted with greater confi-dence.

128 Endodontics 6 - Visiography Systems 129
about 40x40 micron small squares, each of which is the sensor’s basic acquisition unit.A physical distance, even if a very small one, exists between each of these dots and the one close to it. This ensures that the information making up the inve-stigated object and falling exactly into this space may not be acquired and then may get lost.In addition a certain number of the sensor’s basic units may not function correctly, both due to manu-facturing faults (here manufacturers must take action for the accuracy of their quality control) and wear and tear as well as fatigue.At this stage of the process software comes into play and reads each pair of neighboring dots, gives them a value, corresponding to a scale of “grays”, and fills the empty space with a few dots with an intermediate va-lue between the two. In short, what we could see at the end of the process is an image which is artificial in a small part: this fact shows as an insufficient defi-nition of the image itself.The above-mentioned process was particularly inci-dental with the first generation DRS.The technical evolution of the sensors has allowed to reduce the distance between each pair of dots more and more and to have an accurate check on the cri-tical phases of production. The last generation DRS – equipped with silicon cell sensors – supply images with a technical definition close to the one of traditio-nal radiographic images. The DRS images, however, present final reading features which can nearly over-lap.13
A different consideration must be made for DRS which use excitable phosphor sensors: in this case the ba-sic acquisition units feature a molecular size as in tra-
ditional radiographic plates (Fig. 6.9). The latent ima-ge, which develops after the exposure to X-rays, has potentially the same definition which can be found in traditional radiography. The discriminant which acts in this system is in step with the reading ability of the photo-acquisition device which, through digi-talization, must transfer the information contained in the sensor. Also in this case software could come in-to play making up for possible failings. The techno-logical evolution of the systems based on this type of sensors allows today to obtain DRS images which are both strictly faithful to reality and with a definition which can practically overlap the one given by tradi-tional X-rays (Fig. 6.20).
EXECUTION AND PROCESSING TIME
The speed of execution is, together with the necessary low radiant load, the real great advantage of DRS, in particular for the ones which use CCD sensors. These sensors, in actual fact, require really few seconds for the radiographic image to appear on the video-screen between the moment of exposure and the time the radiographic image actually appears on the video-screen.25,31
The excitable phosphor sensors, on the contrary, re-quire – in addition to the time necessary to free them from their protective covers and insert them in the rea-der – a lapse of time from one to two minutes (de-pending on the reading definition required) befo-re the image appears on the video-screen. One must consider, however, that with one of these systems (Denoptix – Gendex) the reading time will not vary, if from one to eight sensors are inserted at the sa-me time into the magazine. In the same lapse of time (about two minutes), then, up to eight radiographic images can be available.The processing time of the image already visualized on a monitor is similar for any type of DRS. The varia-bility is functional with the efficiency and the ease of operation of the image management programs which are integrated with the various DRS, with particular regard, however, to the operator’s needs. It is clear that more time will be required if one has to modify many parameters (luminosity, contrast, magnification) or obtain more information (measurements, densito-metric analyses, chromatic toning or three-dimensio-nal visions). The actual speed of the system, however, and the operator’s practice allow, anyway, a remarka-ble absolute reduction of the waiting time.Fig. 6.20. Details are well outlined.

130 Endodontics 6 - Visiography Systems 131
SUPPLIED DOSAGE
To compare the radiation dosage necessary to obtain a high quality image from (both a CCD or an excitable phosphor) DRS and from an X-ray film, may be consi-dered a disputable approach as it compares quantities which are physically inconsistent. In actual fact, while a certain X-ray dosage causes a specific blackening of the film, that is (given a correct chemical process) an opti-cal effect, the same dosage causes an electrical signal in an electronic sensor, with a level which can be ampli-fied and altered in the next stages of electronic proces-sing, before obtaining a visible image.The radiation dosage required by DRS is, anyway, surely lower than the one necessary in traditional radiology, even taking into account that the radiation dosage must not be reduced too much in order to have a good signal-to-noise ratio (that is a good image quality).30
In general one can state that the required exposure is at least six times lower compared with a D-type film and three times lower compared with an E-type film. One can expect the same correlation to exist between the absorbed dosages (in gray) (Tab. VI).Regardless of the type of image acquisition device
Table VI
Exposure times in seconds recommended for the Oralix DC (Gendex)intra-oral device with a constant 60 and 70 kV potential
DRS SystemsAgfa Dentus
M4 FilmsKodak Ektaspeed
E-type FilmsKodak Ultraspeed
D-type FilmsVery Slow speeds
60 kV 70 kV 60 kV 70 kV 60 kV 70 kV 60 kV 70 kV 60 kV 70 kV
Incisors 0.100 0.050 0.160 0.080 0.250 0.125 0.400 0.200 0.630 0.320
Canines 0.100 0.063 0.160 0.100 0.250 0.160 0.400 0.250 0.630 0.400
Premolars 0.125 0.080 0.200 0.125 0.320 0.200 0.500 0.320 0.800 0.500
Lower molar 0.160 0.100 0.250 0.160 0.400 0.250 0.630 0.400 1.000 0.630
Upper molars 0.200 0.125 0.320 0.200 0.500 0.320 0.800 0.500 1.250 0.800
Bite Wing 0.160 0.100 0.250 0.160 0.400 0.250 0.630 0.400 1.000 0.630
Occlusal 0.250 0.160 0.400 0.250 0.630 0.400 1.000 0.630 1.600 1.000
Fig. 6.21. Detail of a head with a rectangular collimator
used, one must remember that a further reduction of the supplied dosage will be obtainable, if one uses – for a radiogenous head – a rectangular collimator equipped with a limiting device in proximity of the fo-cal spot (Fig. 6.21). In this way one obtains an effecti-ve suppression of the diffused and extrafocal radiation and, in the last analysis, a better image quality.

130 Endodontics 6 - Visiography Systems 131
ADAPTATION AND REPETITIVENESS
3x4 cm and 2x3 cm X-ray plates can satisfy most re-quirements in endodontic radiology. One can usual-ly center perfectly the tooth or the group of teeth and the neighboring tissues of the object to be investiga-ted, so as to obtain intraoperative or diagnostic exa-minations meeting the operator’s requirements (Fig. 6.22). The size of the sensitive plate corresponds with a one-two millimeter gap to the sizes of the external protective cover. The first CCD sensors featured a de-finitely larger overall size, - even seven, eight milli-meters – compared with the one of the sensitive area. This size was, anyway, much reduced by comparison with the sensitive area of traditional X-ray plates. For this reason it was not always possible to obtain suffi-cient data with a single projection, particularly in the case of polyradicular or larger teeth. It was often ne-cessary, anyway, to define the area of greater inte-rest with care and to sacrifice the vision of neighbo-ring areas. In addition one must consider that sensors were fairly thick and cumbersome and, often, it was not easy to position them in the area of interest so as to obtain a correctly framed projection without distor-tions. At first centering devices were not even availa-ble, whereas the first ones were cumbersome, not mu-ch functional and difficult to use. In addition, then, to the problem of a difficult initial centering there was also the one of an impossible correct repetition, after some time, of the same frame, an almost – I would say – mandatory requirement in Endodontics.These important failings have been given the right consideration by research centers, so that today the most advanced DRS feature CCD sensors of different
sizes, suitable to various clinical situations, with a limi-ted overall size, thickness in particular, with a sensiti-ve area which is only slightly smaller compared with the sensor’s total area.4 In addition to this the cen-tering devices for CCD sensors have evolved – also thanks to the co-operation by specific manufacturers – so that today it is much easier to perform correct and repeatable radiological examinations (Fig. 6.23).10,12
These problems are not obviously found with DRS featuring excitable phosphor sensors, which, with nearly the same size and thickness as traditional ra-diographic plates, can use all the standard centering devices (Figs. 6.24 and 6.25).16,27
C
Fig. 3.23. A. (Rinn) Endodontic centering device for Gendex CCD sensors. B. Front view: (Rinn) Endodontic centering device for Gendex CCD sensors, placed in patient’s mouth during endo-dontic treatment. C. Side view.
B
A
Fig. 6.22. The affected tooth and the neighboring tissues are well framed.

132 Endodontics 6 - Visiography Systems 133
FILING
Patients’ X-rays are such an important amount of data – both from the clinical and the forensic medicine point of view – that their filing should be a straightforward, safe and easy-to-check process.22 In reality this does not always happen. It is not infrequent, in actual fact, for X-rays to deteriorate and get lost due to both an incorrectly performed developing and fixing process and unforeseeable accidents. It is necessary to bear in mind, however, that current legislation does not offer univocal interpretations for what regards the forensic validity of digital images. It would be a good rule, at a close periodical interval, to make copies of the filed
images on no longer modifiable supports after the first recording. The hypothesis would be for the presence of an image, exactly identical on numerous chrono-logically progressive registration supports, to be va-lid in practice also on its unaltered originality. All this, however, will not be valid, if the image has been tam-pered with before the initial filing registration: all the next copies, of course, would not equally correspond to reality. This problem, of course, takes on particular importance and it is, then, a subject of study in an at-tempt to reach an adequate solution.One of the suggested solutions (Gendex) consists of filing inside the image file itself a small “file” – no longer modifiable by the user – which registers and
A B
Fig. 6.25. A. Preoperative radiograph. B. Postoperative radiograph. C. Endodontic centering devices for ordinary X-ray plates can be used with memory pho-sphor type sensor, thanks to their identical size. Their overall size is smaller than the endodontic centering devices for CCD sensors.
C
A B
Fig. 6.24. Postoperative and at 12 months check with an “individualized” centering device on a patient with a resin bite

132 Endodontics 6 - Visiography Systems 133
keeps automatically all the changes and modifications performed on the image after its acquisition. This “fi-le” may easily be consulted through a management software utility and it is an actual identity card of the DRS image. DRS filing, that is digital images, is an easy and fast process, as its later consultation, which has ever perfect images available even years later. In order to obtain a good digital file it is then neces-sary to get computers and storage saving hardware in line with or oversized in relation to the specific requi-rements of the adopted DRS. The chosen hardware should also feature facilities for updating, integrating and, if necessary, expanding its memory capacity abo-ve-all as the mass of data will grow progressively.The program which manages the clinical or DRS image filing (Fig. 6.26) must be easy and intuitive to use, featuring easy-to-follow systems for filing and later search. It should be compatible, ready for integration, if required, with the management program of the dental surgery so that clinical, statistical and book-keeping data, traditional X-ray images, clinical or intra-operative images (acquired through a scanner or directly via modem or digital cameras) and radiovisiographs may be linked and grouped in a single clinical card to facilitate the patient’s overall management.A particular of no secondary importance which may and should affect the choice not only of the DRS, but also of a computer management program for the den-tal surgery, is the guarantee of reversibility of data. They must be filed in standard formats so as to of-fer access to any other programs. It is necessary to
beware of anyone who suggests filing formats or sy-stems outside common standards, even if highly effi-cient. Should one change to other systems, one would risk losing data or having to cope with complex, co-stly and often uncertain operations for the extraction and the translation of the data themselves in order to make them compatible.26
The possibility to make all the security copies from the file, believed to be necessary, protects from any chance of loss or deterioration of data. Moreover a copy or a print can easily be made and handed to either the patient or the colleague who has requested the specialist’s consultation (Tab. VII).
Table VII
Why digital radiology
– Reduction of the dose absorbed by patients (75-80%)
– Immediate production of an image during endo-dontic procedures
– Image digital processing– Efficient filing and re-calling of images from data-
base– Elimination of dark chamber– Elimination of plates (purchasing, storage and ma-
nipulation problems)
Fig. 6.26. Radiographic and clinical images may be filed in each patient’s cli-nical card.
Fig. 6.27. Also orthopantomographic examinations may be performed through radiovideographic systems.

134 Endodontics 6 - Visiography Systems 135
LARGE FORMATS
Both DRS featuring excitable phosphor sensors of adequate size (Gendex, Durr, Soredex) and the CCD group systems (Planmeca, Trophy, Gendex, Sirona, Instrumentarium) can already perform orthopantomo-graphic examinations (Fig. 6.27). The chance to ha-ve digital orthopantomographs as well presents the advantage, - in addition to the ones mentioned befo-re for endo-oral radiovisiographs - to enable the den-tist to view immediately an exam, if obtainable as a fi-le, e.g. via the Internet, which is usually performed in
radiographic centers far away from dental surgeries. In this way one may decide on the necessity of fur-ther examinations while a patient is still ready for the radiologist.A development of the management of radiological exams heading this way would enable a patient to be entrusted with a copy of all his radiographic docu-mentation on an adequate data support. This would entail undeniable advantages both for the patients and the health professionals not usually in charge, who could have the patient’s full clinical history ready on hand at any time.29,34

134 Endodontics 6 - Visiography Systems 135
BIBLIOGRAPHY
1. Brown JE. – Advances in dental imaging. Prim Dent Care. 2001 Apr;8(2):59-62.
2. Dobo-Nagy C., Keszthelyi G, Szabo J, Sulyok P, Ledeczky G, Szabo J. – A computerized method for mathematical de-scription of three-dimensional root canal axis. J Endod 2000 Nov;26(11):639-43
3. Farman AG., Farman TT. – Image resolution. . Oral Surg Oral Med Oral Pathol Oral Radiol Endod. 2001 Jun;91(6):619-21.
4. Garber DA. – Increased application of digital radiography for implant therapy. Pract Periodontics Aesthet Dent. 2000 Jan-Feb;12(1):73-4.
5. Gröndal H.G., Hollender L., Osvald O. – Quality and Quantity of Dental X-Ray Examinations, Dentomaxillofac Radiol 1980; 9: 70-2.
6. Gröndal H.G. – Digital Radiology in Dental Diagnosis: a Critical View. Dentomaxillofac Radiol 1992; 21: 198-202.
7. Haak R, Wicht MJ, Noack MJ. Conventional digital and con-trast-enhanced bitewing radiographs in the decision to re-store approximal carious lesions. Caries Res. 2001 May-Jun;35(3):193-9.
8. Hayakwa Y., Farman A.G., Scarfe W.C., Kuroyanagi K., Molteni R. – Beam Quality and Image Contrast with Vixa-2. Jap Soc Oral and Maxillofac Radiol 1995; vol. 11, no. 1: 31-6.
9. Horner K., Shearer A.C., Walker A. Wilson N.H.F. – Radiovisiography: an Initial Evaluation. Br Dent J 1990; 168: 244-8.
10. Hubar JS, Gardiner DM. – Infection control procedures used in conjunction with computed dental radiography. Int J Comput Dent. 2000 Oct;3(4):259-67.
11. Janhom A, van Ginkel FC, van Amerongen JP, van der Stelt PF. – Scanning resolution and the detection of approximal caries. Dentomaxillofac Radiol. 2001 May;30(3):166-71.
12. Kassak H. – Determining the working length for root canal preparations by means of digital radiography. . Int J Comput Dent. 1999 Jan; 2(1): 73-6.
13. Koch S, Wagner IV, Schneider W – Effective and quality-controlled use of digital radiography in dental practice. Int J Comput Dent. 2000 May; 3(2):179-80.
14. Martinez-Lozano MA, Forner-Navarro L., Sanchez-Cortes JL, Llena-Puy C. – Methodological considerations in the determi-nation of working length. Int Endod J. 2001 Jul;34(5):371-6.
15. Miles DA. – Advances in imaging in oral medicine. Alpha Omegan. 2001 Jul-Aug;94(2):24-8.
16. Mol A., van de Stelt P.F. – Application of Digital Image Analysis in Dental Radiography for the Description of Periapical Bone Lesions: a Preliminary Study. (Special Issue in Dentistry) IEEE Trans Biomed Eng 1991; 38: 357-9.
17. Molteni R. – Visualix, a New System for Direct Dental X-Ray Imaging: a Preliminary Report. Dentomaxillofac Radiol 1992; 21: 222-3.
18. Molteni R. – Direct Digital Dental X-Ray Imaging with Visualix-Vixa. Oral Surg Oral Med Oral Pathol 1993; 76: 235-43.
19. Mouyen F., Benz C., Sonnabend E., Lodter J.P. – Presentation and Physical Evaluation of RadioVisioGraphy. Oral Surg Oral Med Oral Pathol 1989; 68: 238-42.
20. Mouyen F. – Evaluation of the New RadioVisioGraphy System Image Quality. Oral Surg Oral Med Oral Pathol 1991; 72: 627-31.
21. Nelvig P., Wing K., Welander U. – Sens-A-Ray: a New System for Direct Digital Intraoral Radiography. . Oral Surg Oral Med Oral Pathol 1992; 74: 819-23.
22. Okamura K, Tanaka T, Yoshiura K, Tokumori K, Yuasa K, Kanda S. – Integration of a picture archiving and communi-cation system with videocapture and computed radiography in a dental hospital. Dentomaxillofac Radiol. 2001 May;30(3):172-8.
23. Otis L, Mupparapu M, Mozaffari E. – Digital radiography: state of the art. Penn Dent J (Phila). 2000 Nov-Dec;67(6):33-4, 42-3.
24. Polan M. – Digital radiography: tips for clinical practice. Dent Today. 2001 May;20(5):106-9.
25. Polan MA. – Computerization can make you a better dentist. Dent Today. 2001 Jul;20(7):120-3.
26. Pornprasertsuk S, Ludlow JB, Webber RL, Tyndall DA, Yamauchi M. – Analysis of fractal dimensions of rat bones from film and digital images. Dentomaxillofac Radiol. 2001 May;30(3):179-83.
27. Ross S, Fasbinder D, Reiss B – Computer applications in den-tal diagnosis. Int J Comput Dent. 1998 Sept; 1(1): 9-17.
28. Shearer AC, Mullane E, Macfarlane TV, Grondahl HG, Horner K. – Three phosphor plate systems and film compared for im-aging root canals. Int Endod J. 2001 Jun;34(4):275-9.
29. Tatsumi M, Yoshiura K, Yuasa K, Tabata O, Nakayama E, Kawazu T, Chikui T, Katoh M, Kanda S. – Clinical evalua-tion of “veraviewpocs” digital panoramic X-ray system. Int J Comput Dent. 2000 Jul;3(3):183-95.
30. Wakoh M., Farman A.G., Scarfe W.C., Kelly M.S., Kuroyanagi K. – Radiation Exposure with the RVG-S and Conventional Intraoral X-Ray Film. Oral Radiol 1994; 10: 30-40.
31. Wakoh M., Kuroyanagi K. – Digital imaging modalities for dental practice. Bull Tokyo Dent Coll. 2001 Feb; 42(1): 1-14.
32. Wenzel A. – Influence of Computerized Information Technologies on Image Quality in Dental Radiographs. Danish Dent J 1991; 12: 5-19.
33. Williams CP. – Digital radiography sensors: CCD, CMOS, and PSP. Pract Proced Aesthet Dent. 2001 Jun-Jul; 13(5): 395-6.
34 Yoshinaga L. – Digital images –pictures & movies. Pract Periodontics Aesthet Dent. 2000 Sept;12(7):705-6.