digital rock physics for coreflooding simulations rock physics for coreflooding simulations mahesh...
TRANSCRIPT

Digital Rock Physics for Coreflooding Simulations
Mahesh Avasare
Masters in Petroleum Engineering, IST Lisbon | Intern, R&D Center, CEPSA
Experimental corefloodings have proved to be important tool for decades of research in oil exploration
and production. Accurate and high quality coreflooding results are integral part for reservoir performance
prediction and effective reservoir management. But achieving such high quality flooding measurements
in the laboratory is by no means an easy task. In the past decade, Digital rock physics (DRP) has received
attention better computational power, advanced scanning techniques and rise of EOR projects with
depletion easy oil.
This work attempts to integrate DRP into a dynamic coreflooding simulation. It explains details of
development steps and also includes few sensitivity analysis studies with the model. The resulting
reference model helps to qualitatively understand uncertainties involved in simulation results with
respect to experimental coreflooding. This work has been developed at R&D Center of CEPSA (Madrid), in
association with E&P division of CEPSA.
Keywords: Digital Rock Physics, Coreflooding Simulations, Coreflooding Uncertainties
1. Introduction
In the era of low oil prices, economic viability of oil fields strongly relies on accurate technical analysis and
predictions. Detailed core analysis is one of the most reliable information about in-situ conditions. After
extracting petrophysical properties with core characterization, corefloodings are performed to evaluate
dynamic fluid responses by cores. This work has formalized a method to understand and tackle
uncertainties associated with coreflooding results.
Generally the cores possess local micro-heterogeneities. Patterns of preferential path of flow are distinctly
visible when cores are split opened after flooding. Such heterogeneities cause deviation from expected
behavior of the flooding. As a result, properties or techniques predicted through corefloodings might be
misleading. To avoid such uncertainties, computational simulation of corefloodings can be performed
along with experimental floodings.
This work explains detailed development steps of coreflooding computational model in association with
Digital Rock Physics. Static model for this simulation is based on computed tomography (CT) scan results;
whereas the dynamic model is developed with a black-oil simulator. With sensitivity analysis of various
parameters, boundary conditions have been tested too.

Stepwise dynamic coreflooding model development has been explained in this paper. History matching
has been performed by altering mainly the local permeability distribution and relative permeability
curves. The reference model developed achieved good results within the boundaries of established
simulation constraints.
Till date, only few industry giants are involved into similar study. The companies can use output of DRP
based simulations as input to numerical reservoir simulators, fracture design programs etc.; which will
improve reserve forecasts, rate of forecasts, well placement and completion designs. With potential to
improve efficiency of oil industry, this technology will surely have a bright future ahead.
2. Corefloodings
After extracting petrophysical properties with core characterization, corefloodings are performed to
evaluate fluid behaviors in the given core or plug. Also the production methodologies are tested on plugs
to predict the response of the reservoir. Due to relatively higher certainty on the results from
coreflooding, it is one of the most important source of petrophysical data for reservoir engineering.
The cores from field can have local geological heterogeneities; originating from in-situ heterogeneity or
improper core extraction and transportation methods. Due to such heterogeneities, experimental tests
show deviation from real results. To minimize such uncertainties, computational simulation of
corefloodings will be helpful tool.
2.1 Uncertainties in Corefloodings
Unrepresentative of in-situ conditions:
o During extraction or transportation, core’s petrophysical properties might be modified
o Evaporation of light components or asphaltenes precipitation will change fluid properties
o Cleaning and aging can alter rock-fluid interactions (like wettability)
Limitations in up-scaling to reservoir level
o High geological-variability inside reservoirs decreases certainty of petrophysical properties
extracted from core to large geological area in the reservoir
o Up-scaling of EOR methodologies is limited with many external parameters like raw material
availability, govt. rules, economic profitability, on field consistency etc.
o Huge difference in modeling scale from core to reservoir possesses technical challenges
Experimental Errors
o Minute errors from lab setup create high impact on results due to small size of plugs

3. Digital Rock Physics
Main objective for use of Digital Rock Physics (DRP) methodology is to understand local micro-
heterogeneities across the core. Without the understanding of local heterogeneities, the averaged
properties calculated from core analysis can increase uncertainty in reservoir calculations.
Digital Rocks are generated by Computerized Tomography (CT) scanning of the core. Internal structure of
the core is recreated with imaged cross-sectional slices. The final model is reconstructed from matrix of
X-ray attenuation coefficients (Hunt, 1988). Normally the plugs are scanned at a resolution of 500 microns
(Kalam, 2012). The attenuations are based on measurement of reduction of X-rays’ intensity, due to
transmission through the object at certain coordinates. As a result, this attenuations can be translated
into local density distribution. Further density model can be translated into porosity-permeability models
with some uncertainty.
3.1 DRP Output: Case Study
This case study has been performed at R&D center of Compañía Española de Petróleos, S.A.U. (CEPSA).
For simulations, ECLIPSE 2014.1 (black oil simulator) and PETREL 2013 (reservoir simulator) were used
with a core from Caracara Sur Field in Colombia.
Caracara Sur field (CCS) is located at the south west of Llanos Foreland basin (Bozorgzadeh, et al., 2015).
The producing formation in the CCS field is the early Oligocene Carbonera-7. The CCS consists of
multilayered compartmentalized fluviodeltaic reservoirs (Cubillos, et al., 2013)
Plug 184 from CCS was chosen as a case study for
this work. Results of the CT Scan for the Plug 184
can be summarized as:
Model Geometry: Orthogonal Grid
Model dimensions: 35.4x35.4x50.6 mm
CT scan resolution: 500x500x625 μm
Total number of grid cells 408k
Active number of grid cells 316k
Z direction lies along the axis of the core
X and Y directions are arbitrary
Note: The model, as shown in Figure 1, is achieved after several processing steps on the raw data.
Figure 1 Processed CT Scan Results (Attenuations)

4. Coreflooding Simulation with DRP: Goal, Methods & Constrains
Due to high simulation time and wide scope of tuning various parameters, a clarified base of simulation
goals, methodology to be followed and constraints to be followed is necessary.
4.1 Simulation Goal
The goal of the work is to generate a set of relative permeability curves representative of field behavior;
which can be further utilized in full scale field models. This can be achieved by history matching global
and local trends of dynamic simulation model with experimental findings.
4.2 Simulation Methods
History matching for oil production profile.
(As the end-effect# generated in experimental coreflooding cannot be reproduced completely in the
ECLIPSE simulations, the exact history match cannot be achieved. But the profile trend and
approximate profile range should be achieved.)
Regenerating of pressure gradient range across the core.
(Pressure gradient trend generated in laboratory does not follow physical phenomenon. So complete
regeneration of this trend is impossible too.)
Apart from the above global history match, history matching is done to regenerate local trends. (Local
trends include oil un-swept zones and zonal water saturation. Oil un-swept zones, as seen after
coreflooding in lab, is generated in dynamic model. Zonal water saturation, as measured with XRD, is
reproduced by dynamic model too.)
4.3 Simulation Constraints
End points of reference relative permeability curve are obtained using multiple laboratory
experiments on numerous plugs from the reservoir. So, end points of the relative permeability curve
should not be altered, unless specified in the model.
Multiple relative permeability curves should be generated by adjusting corresponding Corey
Exponents. As the exponents lie in theoretical range of 1 to 5 (Corey, et al., 1956), all following models
are developed accordingly.
Apart from permeability distribution, other static models have high certainty. So other parameters of
static models should not be modified during the study.
Note: All models developed below follow constrains defined above, unless and until mentioned.
# ’End Effect’ arises from pressure gradient across two phases in the plug; compensated with capillary forces to achieve
equilibrium at production outlet. Therefore it is also known as “Capillary End Effect” (Arne Skauge, 2001). Though it is a very
important phenomenon for corefloodings, due to high complexity, this study does not address the phenomenon.

5. Development of 3D Static Model
A reference model was developed, starting from CT Scan results of the Plug 184 from CCS field, as defined
in 3.1 DRP Output: Case Study. A base static model is developed with following steps:
5.1 Attenuation Model to Density Model
Analytical correlation was
established by E&P division
of CEPSA with average
attenuation of complete
plug and bulk density of the
plug.
Data of 10 plugs for average
attenuation vs average
density showed highly
linear trend (R2 = 0.96). The
Plug 184 showed a close
match to this trend line, as
shown in Figure 2.
Figure 2 Correlation of Avg. Attenuation & Avg. Density (Courtesy: E&P, CEPSA)
The plug model was transformed from attenuation distribution to density distribution with following
equation, as extracted from Figure 2.
𝐴𝑡𝑡𝑒𝑛𝑢𝑎𝑡𝑖𝑜𝑛 (𝑖, 𝑗, 𝑘) = 911.5706 ∗ 𝐷𝑒𝑛𝑠𝑖𝑡𝑦(𝑖, 𝑗, 𝑘) + 315.7657 …(1)
5.2 Density Model to Porosity Model
The plug is assumed to be made of ‘Grain’ particles & ‘Fluid’ particles. Where, Fluid is assumed to be
mixture of oil, water and air. From Routine Core Analysis, average density of the fluid was calculated
[𝜌𝐹𝑙𝑢𝑖𝑑 = 0.84 gm/cc ]. Grain mainly consists of Quartz [𝜌𝑄𝑢𝑎𝑟𝑡𝑧 = 2.65 gm/cc ] and minor quantities of
other sand and asphaltenes. Grains density was calculated with weighted average of the constituents’
density [𝜌𝐺𝑟𝑎𝑖𝑛 = 2.60 gm/cc].
Local porosity was determined with a simple assumption of all pore spaces are occupied by fluids; and
rest of the plug volume is occupied by Grains. The simplified correlation can be equated as:
Porosity [Φ (i, j, k)] = 1 −
ρ(𝑖, 𝑗, 𝑘) − ρFluid
ρGrain − ρFluid
… (2)

Figure 3 Porosity Model Generated & Corresponding Univariate Distribution
Mean porosity of the model generated closely matched with experimental porosity distribution. This
verifies calculations and assumptions made till this point.
5.3 Porosity Model to Permeability Model
As permeability does not follow simple arithmetic or geometric correlations, it can only be modelled with
data-backed correlations with other petrophysical properties. Mercury Injection Test on plugs gives pore
size distribution from graph of injection pressure vs pore volume saturation (Lenormand, 2003).
Following steps was implemented
to build permeability model:
On the basis of pore throat
distribution with mercury
injection test, all the plugs
from Caracara field are
divided into 4 ‘Rock Types’
(RT1, RT2, RT3 and RT4).
RT1 being most permeable (in
range of 5D) to RT4 being the
lowest permeable (in range of
50 mD).
Figure 4 Permeability vs Porosity Correlation with Rock Type Classification
As shown in Figure 4, these rock types showed different polynomial trend lines between permeability
(log-scaled) and porosity. The Plug 184 was classified into RT2 according to pore size distribution. So
the trend line of RT2 was used to generate permeability model from porosity model.

6. Development of 3D Dynamic Model
Static base model developed in PETREL® by combining porosity and permeability models, is further
modified to attain a dynamic base model representative of experimental conditions in ECLIPSE®. Few of
the important steps for the dynamic base model development as follows:
Injection Geometry
Integration
The experimental coreholder has an injection head with symmetric thin grid
spreading injection water equally over the injection face. This geometry is
replicated with an injection well connecting all blocks on injection face.
Simulation
Optimization
Due to geometrically fine grid and limited computational power, the simulation
time became an important parameter to be optimized. A time-step scheme is
developed with least number of simulation errors and practical simulation time.
Assigning Relative
Permeability Curve
Relative permeability curve plays an important role in oill drainage by the plug
during coreflooding. After due scrutanization, relative permeability curve used by
CEPSA for CSS field simulation (Kr_CEPSA), was assigned for base case.
A base dynamic model developed by this stage, was further modified to attain better history match with
experimental coreflooding results. History matching is performed only by tweaking relatively most
uncertain parameters in the model: relative permeability (kr) curve & permeability distribution.
6.1 History Matching with Permeability Distribution Model
Permeability distribution model, as show
in Figure 5, show unimodal distribution. As
observed from experimental coreflooding,
the plug show high local hetrogenity.
To replicate the local hetrogenity, initial
attempts were made to increase standard
deviation of the permeability model. This
was achieved by cokriging the distribution
with another reference distribution of
higher standard deviation.
Figure 5 Permeability Model Distribution Histogram
It was expected that due to lower permeability zones, total oil production will drop. But the oil production
curve showed almost similar trend despite increasing the permeability by 50%. In fact the water saturation
distribution showed almost uniform sweeping. This established the fact that unimodal distribution, even
with high standard deviation cannot replicate the experimental conditions.
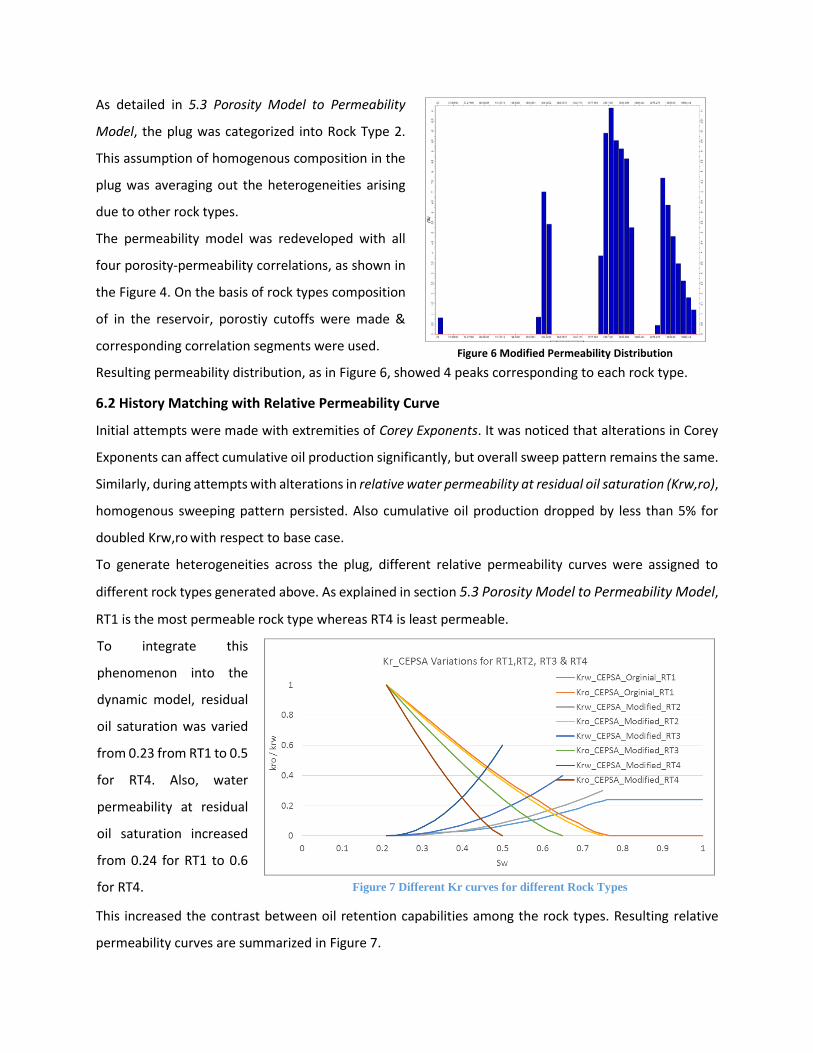
As detailed in 5.3 Porosity Model to Permeability
Model, the plug was categorized into Rock Type 2.
This assumption of homogenous composition in the
plug was averaging out the heterogeneities arising
due to other rock types.
The permeability model was redeveloped with all
four porosity-permeability correlations, as shown in
the Figure 4. On the basis of rock types composition
of in the reservoir, porostiy cutoffs were made &
corresponding correlation segments were used.
Figure 6 Modified Permeability Distribution
Resulting permeability distribution, as in Figure 6, showed 4 peaks corresponding to each rock type.
6.2 History Matching with Relative Permeability Curve
Initial attempts were made with extremities of Corey Exponents. It was noticed that alterations in Corey
Exponents can affect cumulative oil production significantly, but overall sweep pattern remains the same.
Similarly, during attempts with alterations in relative water permeability at residual oil saturation (Krw,ro),
homogenous sweeping pattern persisted. Also cumulative oil production dropped by less than 5% for
doubled Krw,ro with respect to base case.
To generate heterogeneities across the plug, different relative permeability curves were assigned to
different rock types generated above. As explained in section 5.3 Porosity Model to Permeability Model,
RT1 is the most permeable rock type whereas RT4 is least permeable.
To integrate this
phenomenon into the
dynamic model, residual
oil saturation was varied
from 0.23 from RT1 to 0.5
for RT4. Also, water
permeability at residual
oil saturation increased
from 0.24 for RT1 to 0.6
for RT4.
Figure 7 Different Kr curves for different Rock Types
This increased the contrast between oil retention capabilities among the rock types. Resulting relative
permeability curves are summarized in Figure 7.

7. Reference Model and Sensitivity Analysis
A reference model was developed with permeability distribution as shown in Figure 6, and set of relative
permeability curves as shown in Figure 7. All other parameters are also within bounds of experimental
data. So the complete dynamic model is a representative of experimental coreflooding conditions.
The simulation output showed un-swept oil zones. But the cumulative oil production was at higher level
than the experimental findings. One of the important reasons of lower oil production in laboratory
experiment is the strong capillary end effect in the Plug 184. Dynamic saturation profile comparison is
summarized in Figure 8. Lab saturation profile also verifies capillary end effect in the plug.
Figure 8 Zonal Water Saturation Profile Comparison (Reference Model vs Lab Data)
Though the simulation model could not completely match saturation trends observed in the lab, overall
simulation results recreate gist of the laboratory response by the plug.
7.1 Sensitivity Analysis on 3D Dynamic Model
One of the sensitivity analysis was realized by
varying wettability of the core. As RT1 and RT2
constitute to majority of the plug, the
wettability was altered majorly for RT3 and RT4,
as visible in Figure 9.
Due to increased water wet behavoir, oil
recovery dropped by 7% from reference model.
So wettability can alter plug response notably.
Figure 9 Modified Kr Curve for Sensitivity Analysis
Note: Each line or a
dot, represent
corresponding
saturation at given
time (hours), as
represented in right
hand side of the
chart. Though
results from
experiment as well
as lab have more
time steps, only few
time steps are
shown here.

Another sensitivity analysis was performed by altering
injection geometry. In this analysis, small square
injection face was assumed, as shown in Figure 10;
instead of complete face injection as in
Oil production was not altered notably, despite reducing
injection face upto 10 fold. This shows that the plug has
high radial mobility for water near the injection face.
Figure 10 Injection Geometry Sensitivity Analysis
8. Conclusion and Future Suggestions
Initial literature survey about integration of Digital Rock Physics into coreflooding simulations showed
high potential of the technology as a future alternative to laboratory core analysis. Rapid rise of the
technology in the past decade can be attributed to higher computational power, advanced scanning
techniques and rise of EOR projects with depleting easy oil.
Development of the static model showed high complexity attributed to petrophysical property
distribution, especially the permeability distribution. After setting up simulation goals and constraints,
framework for dynamic model development was chalked out. History matching was done in reference of
lab data, by varying permeability distribution and relative permeability curves.
The reference model developed post history matching could not completely reproduce experimental
trends, as some experimental attributes were not integrated into the simulation; like capillary end effect.
Further sensitivity analysis showed extremity effects for parameters like injection area, wettability etc.
Bibliography
Arne Skauge Trond Thorsen, Andre Sylte Rate Selection For
Waterflooding Of Intermediate Wet Cores [Conference] //
International Symposium of the Society of Core Analysis. -
Norway : SCA, 2001. - Vol. 20.
Bozorgzadeh M., Romero Fernandez Pedro e Rodriguez
Rosario Calibrating a Field-Scale Numerical Simulation Study
for the Implementation of a Chemical Enhanced Oil Recovery
Pilot Using Core Flooding [Conference] // SPE Reservoir
Characterisation and Simulation Conference and Exhibition. -
Abu Dhabi, UAE 2015
Corey A.T. e Rathjens C.H. Effect of Stratification on Relative
Permeability [s.l.] : Journal of Petroleum Technology, 1956. -
12 : Vol. 8.
Cubillos H., Stofferis M. e Vanegas G. Strategy and Planning
EOR for Caracara Sur Field, Colombia [Conference] // EAGE
Annual Conference & Exhibition incorporating SPE Europec. -
London, UK : Society of Petroleum Engineers, 2013.
Hunt Patricia K. Computed Tomography as a Core Analysis
Tool: Applications, Instrument Evaluation, and Image
Improvement Techniques [s.l.] : Journal of Petroleum
Technology, 1988. - 88 : Vol. 40.
Kalam Mohammed Zubair Digital Rock Physics for Fast and
Accurate Special Core Analysis in Carbonates // New
Technologies in Oil & Gas Industry. - [s.l.] : InTech, 2012.
Lenormand R. Interpretation of mercury injection curves to
derive pore size distribution [Conference] // Internatio nal
Symposium of the Society of Core Analysts. - Pau, France :
[s.n.], 2003.
Orsi Thomas, Edwards Carl e Anderson Aubrey X-Ray
Computed Tomography; a non-distructive method for
quantitative analysis of sediment cores [Diário]. - [s.l.] :
Journal of Sedimentary Research, 1994