digital services & distribution budget presentation fiscal year 2008 february 2007
TRANSCRIPT

Digital Services & DistributionBudget Presentation
Fiscal Year 2008
February 2007

2
Agenda
1. Executive Summary
2. Digital Distribution
3. Mobile Entertainment
4. Digital Services / Grouper
5. EBIT Reconciliation
3
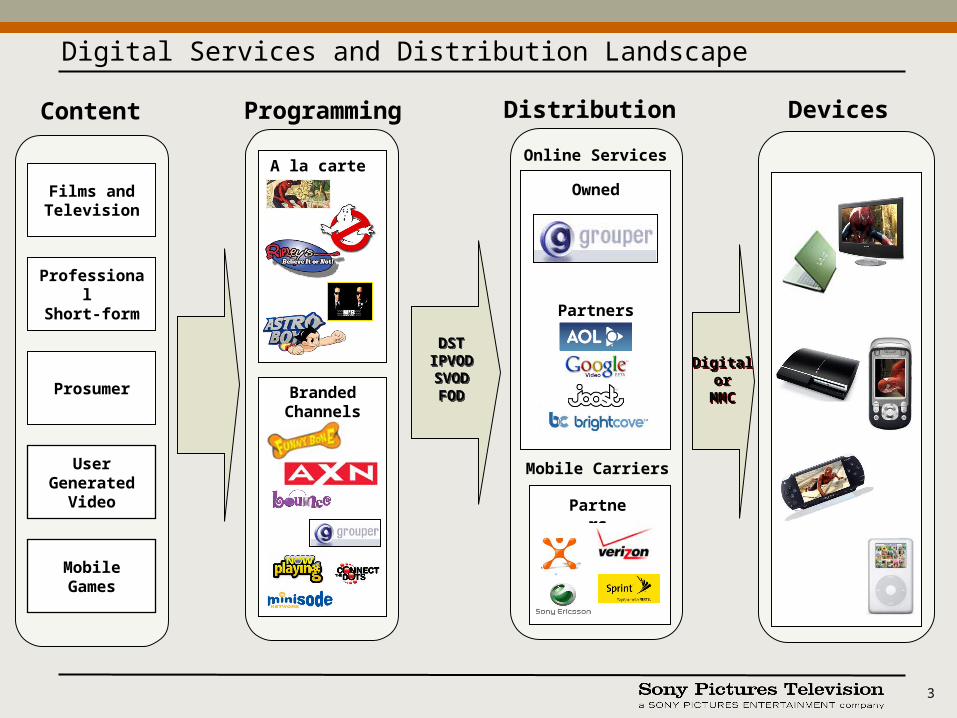
Programming
A la carte
Branded Channels
Content
Films andTelevision
Professional Short-form
Prosumer
User Generated
Video
Distribution
Owned
DSTIPVODSVODFOD
DSTIPVODSVODFOD
MobileGames
Mobile Carriers
Partners
Digitalor
MMC
Digitalor
MMC
Devices
Digital Services and Distribution Landscape
Online Services
Partners

4
• Traditional media players are experimenting with new models for digital distribution
–Networks are launching branded online channels and streaming ad-supported episodes (ABC.com, CBS.com & Innertube, NBC.com & DotComedy, Turner & Super Deluxe)
–Digital sell-through is gaining broad support (iTunes is selling films from Disney and Paramount; television episodes from major networks)
–Fox / NBC / Viacom exploring concept of a dedicated JV for online content distribution
• Historically game-based, mobile is also proving viable for video distribution
–Adoption of 3G handsets continues to grow and is improving viewing experience
–Carriers are seeking video content to attract and retain customers
• A wide range of players is competing for quality UGV content and audience
–Google’s acquisition of YouTube raised the bar for critical mass
–Quality of viral video is increasing as traditional media players enhance their owned services (Fox / MySpace, Viacom / Atom Films)
–Online pure-plays (Heavy, Break) are compensating content creators by acquiring videos
Competition is Increasing as Demand for Digital Content Grows

5
• Key accomplishments in FY07
–Launched multiple new business models for digital distribution–Launched mobile video–Significantly expanded distribution relationships across internet services,
mobile carriers, and hardware partners–Created and launched first branded cross-platform channels –Acquired and integrated Grouper; grew unique users by 40%
• Focus areas for continued growth in FY08
–Add 21 distribution partners in 2008–Grow distribution revenue 140% from $16.5MM in FY07 to $39.7MM in FY08;
contribute $27.8MM to other SPE divisions–Broaden digital content offering, including acquired and produced content–Increase number of branded digital channels and expand distribution–Re-launch “Grouper 3.0” with differentiated content and service offer–Continue to grow Grouper user base and begin monetizing audience
Success in FY07 Established Foundation for Growth in FY08

6
Digital Services & Distribution – Revenue OverviewDigital Services & Distribution – Revenue Overview
$3.0
$18.6
$10.6
$21.2
$16.5
$31.7
$39.7
$0
$10
$20
$30
$40
$50
$60
'07 Budget '07 Forecast '08 MRP '08 Budget
($ in MM)
Grouper Digital Distribution
$50.3 $50.3
$16.5
$24.2
$8.7 $6.7 $10.4 $14.0
($15.0) ($15.1) ($18.4) ($32.0)EBIT
DD – Op Income
($10.0) ($10.0) ($10.1) ($18.2)Grouper - EBIT
($5.0) ($5.1) ($8.3) ($13.8)DD – EBIT

7
Launched in 2007 In Progress for 2008
Digital Imaging
• Memory Card bundles with games and films
• Grouper in firmware
• Memory Stick Entertainment Pack
• Grouper service and SPE promotional channels on IP Bravia
• All US VAIOs shipping with SPE Movies
• Early discussions for digital delivery of films day-and-date with DVD
• Licensing content for digital delivery to the PlayStation 3
• Potential metadata R&D project
• Grouper video and HOME service
• Integrating Grouper for online video sharing
• Grouper screen saver on VAIOs
• Selling mobile products through “Music Box”
• Distributing Sony BMG games
• Project X
DSD Continues to Provide Support for “Sony United”

8
Agenda
1. Executive Summary
2. Digital Distribution
3. Mobile Entertainment
4. Digital Services / Grouper
5. EBIT Reconciliation
9
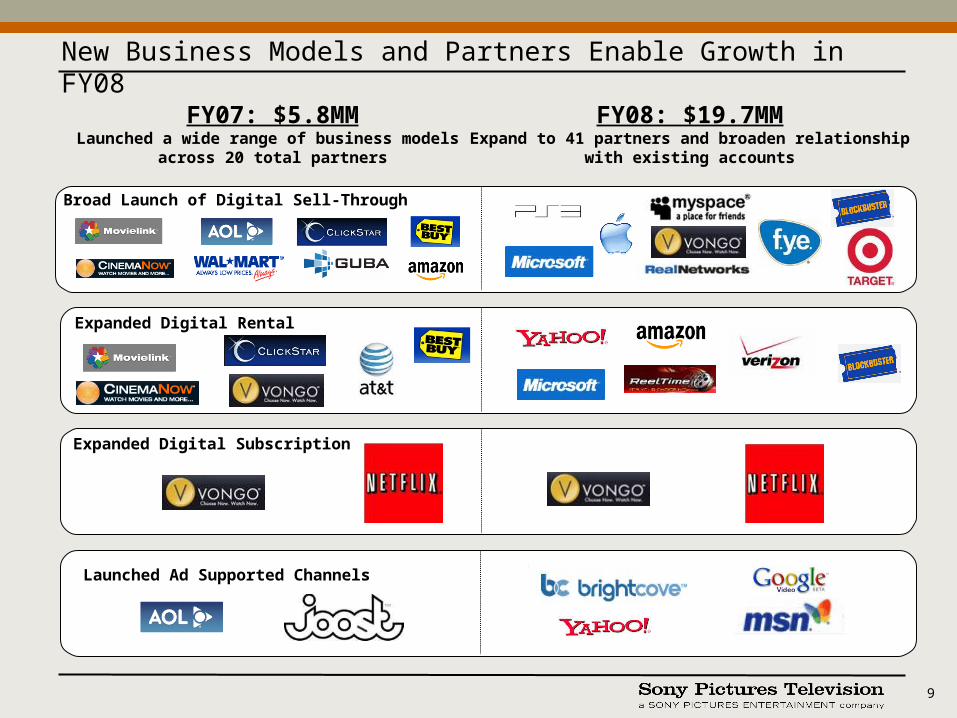
FY07: $5.8MMLaunched a wide range of business models
across 20 total partners
FY08: $19.7MMExpand to 41 partners and broaden relationship
with existing accounts
New Business Models and Partners Enable Growth in FY08
Broad Launch of Digital Sell-Through
Expanded Digital Rental
Expanded Digital Subscription
Launched Ad Supported Channels
10
• Established and launched new business models
– Launched download-to-own business
– Launched cross-platform digital channels
• Expanded distribution relationships
– Secured deals with Amazon, Wal-Mart, Movielink, CinemaNOW, AOL, ClickStar,
GUBA, AT&T, Best Buy, and NetFlix
• Supported cross-Sony digital entertainment initiatives
– Launched first secure digital content program for the PSP
– Provided content bundles for VAIO and Sony Ericsson
• Established end-to-end operational processes with SPHE, SPT, WPF and DigiPol
to operate these emerging digital businesses
Key FY07 Successes
11
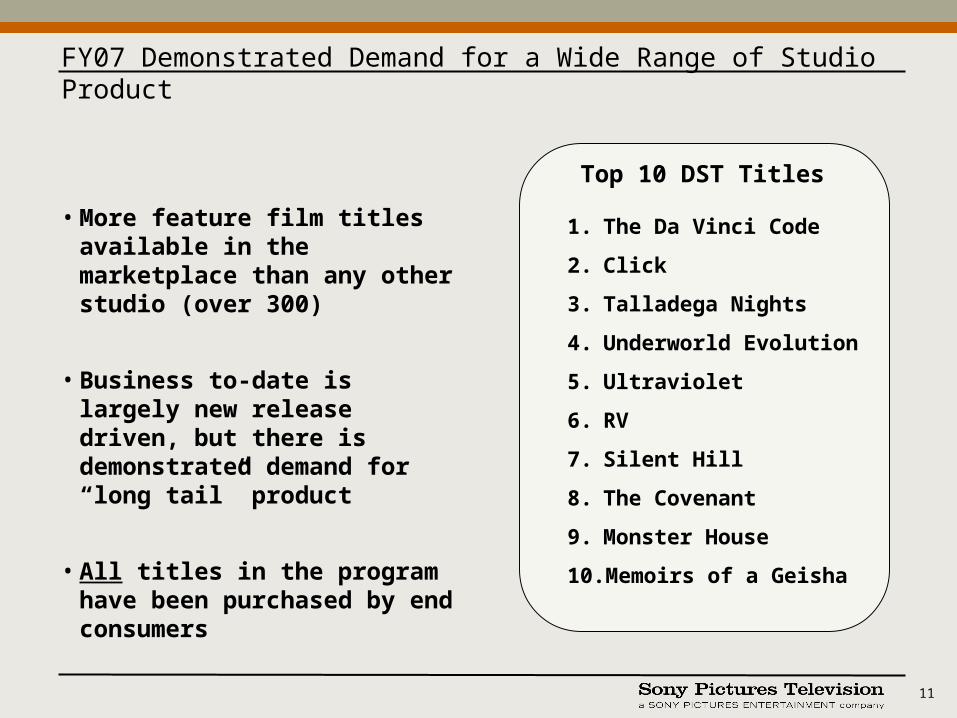
• More feature film titles available in the marketplace than any other studio (over 300)
• Business to-date is largely new release driven, but there is demonstrated demand for “long tail” product
• All titles in the program have been purchased by end consumers
Top 10 DST Titles
1. The Da Vinci Code
2. Click
3. Talladega Nights
4. Underworld Evolution
5. Ultraviolet
6. RV
7. Silent Hill
8. The Covenant
9. Monster House
10. Memoirs of a Geisha
FY07 Demonstrated Demand for a Wide Range of Studio Product

12
• Aggressively build on the existing distribution network– Strike partnerships across the complete spectrum of traditional and on-line players– Expand partners to include: Starz, Apple, Microsoft, Best Buy, Transworld, Target
(significant opportunity for incremental revenue in an Apple deal)
• Expand the overall content offering– Broaden selection of film and TV product– Launch DST of TV product by end of year– Introduce the most compelling short-form/original content
• Continue to lead market in innovating digital product offerings and usage models
• Continue to operate an industry-leading digital organization – Provide end-to-end asset delivery and digital operations – Create innovative marketing and promotional programs
• Grow the business from $5.7MM in FY07 to $18.1MM in FY08
FY08 Digital Sell-Through / IP-VOD Strategy
13
• Continue to expand SPE’s digital channel offering– Comedy (Funny Bone) - Who’s The Boss, NewsRadio– Action (AXN) - SWAT, Charlie’s Angels– Kids (Bounce) - Jackie Chan, Animated MIB, – International Programming (World Channel)– Anime (Animax) - Samurai X– Movies on Demand (Now Playing/Hollywood Hits)– The Minisode Network– Grouper “Off the Hook”
• Introduce additional film and television properties complemented by a blend of original programming and interactive features
• Establish relationships with 3rd party content holders to improve channel offerings– Nelvana for Bounce (e.g., Rescue Heroes, Rolie Polie Olie, Babar)– Ban Dai for Animax (e.g., Gundam)
• Aggressively expand channel distribution to high-traffic destinations across platforms
FY08 Digital Channel Strategy

14
Digital Distribution – Revenue OverviewDigital Distribution – Revenue Overview
$2.5$1.6
$5.0$5.7
$11.5
$18.1
$0
$5
$10
$15
$20
$25
'07 Budget '07 Forecast '08 MRP '08 Budget
($ in MM)
Advertising / Sponsorships Licensing
$14.0
$19.7
$5.8$5.0
$0.1

15
Digital Distribution – Summary P&L
P&L ($000s) '07 Budget '07 Forecast Variance '08 MRP '08 Budget Variance
Total Revenue $5,000 $5,762 $762 $14,000 $19,675 $5,675
Total COGS ($1,790) ($1,071) $719 ($2,100) ($1,950) $150
Gross Profit $3,210 $4,691 $1,481 $11,900 $17,725 $5,825
Total Operating Expenses ($3,875) ($3,296) $579 ($4,615) ($7,930) ($3,315)
Operating Income ($665) $1,395 $2,060 $7,285 $9,795 $2,510
Less: Contribution ($845) ($3,009) ($2,164) ($9,445) ($13,950) ($4,505)
EBIT ($1,510) ($1,614) ($104) ($2,160) ($4,155) ($1,995)
Headcount 11 11 - 14 20 6

16
Agenda
1. Executive Summary
2. Digital Distribution
3. Mobile Entertainment
4. Digital Services / Grouper
5. EBIT Reconciliation

17
PersonalizationPersonalization
Mobile GamesMobile Games
SMSInteractivity
SMSInteractivity
Mobile Video
Mobile Video
MobileApplications
MobileApplications
Full Suite of Mobile Content Products
Comprehensive Marketing and Distribution Footprint
CarriersCarriers
HandsetsHandsets
AggregatorsAggregators
Direct to ConsumerDirect to
Consumer
+
New management team put in place to run daily operations
FY07 was Profitable and Provided Critical Foundation for FY08 Growth

18
0
50,000
100,000
150,000
200,000
April May J une J uly Aug Sept Oct Nov Dec
Uni
ts S
old
• Despite having ½ as many games in the market in FY07, MEG managed to increase total monthly unit sales
• Generated significantly higher unit-sales-per-game through:
– Tighter carrier relationships
– Strategic handset porting and ops management
– Targeted marketing and product rollout
– Better product selection
Games in FY07: New Approach Proving Successful
6,000
8,000
10,000
12,000
14,000
16,000
18,000
April May J une J uly Aug Sept Oct Nov Dec
Uni
ts S
old
Ratchet and Clank
Wheel of Fortune – ‘07
5,000
10,000
15,000
20,000
25,000
30,000
April May J une J uly Aug Sept Oct Nov Dec
Uni
ts S
old
James Bond: Casino Royale
Case I: Re-Launch• Drove new sales of popular
PlayStation title • Porting, placement and
marketing drove re-launch• Sales now exceeding original
title launch – not typical in the games industry
Case II: Re-Fresh• Top-selling mobile brand
grew 12% after distribution of a new version of the game
• More strategic handset porting, mixed with securing better deck placement
Case III: New Game Launch• First new title release in nearly 12
months• Strategically planned around
movie release• Strategic handset porting, secured
deck placement and marketing• Sales exceeding Jeopardy,
previous number 2 title for MEG
Re-launch
Re-fresh
Launch

19
Ratchet & Clank
Q*Bert
Balloon Breaker
Elevator Action
Snoop Dogg Boxing
Casino Royale
Wheel of Fortune 2007
Ghostbusters
Launch New Games(current slate)
Grow Distribution for Catalog(carriers, handset, online)
Snoop Dogg Cruisin’
JEOPARDY! 2007
Fish’n Tunes
Spider-Man 3Spider-Man 3
Spider-Man 3 PuzzleSpider-Man 3 Puzzle
Bond vs. Bond Bond vs. Bond
Ivan Moscovich PuzzleIvan Moscovich Puzzle
Jump That CarJump That Car
God of WarGod of War
JEOPARDY – Rock & RollJEOPARDY – Rock & Roll
OCT
MAY
JUNE
JULY
AUG
SEPT
APR
Untold Legends Untold Legends NOV
Q*Bert “2” Q*Bert “2” DEC
Wheel of Fortune Wheel of Fortune JAN
JEOPARDY! JEOPARDY! FEB
Bond Driving Bond Driving MAR
• Launch 1 new game per month; strategically manage the portfolio/roadmap• Aggressively optimize carrier deck placement• Expand existing Motorola and Sony Ericsson embed programs, and land new OEM deals• Utilize consumer product marketing approach• Strike relationship with leading publisher (e.g., Glu) to secure game pipeline• Grow revenue from $7.0M to $13.2M in FY08
’08 Strategy
Mobile Games in FY08: More Games, Expanded Distribution

20
Sony “Sneak Peeks” Movies “Hollywood Hits” (launching in March)
• Sony Pictures is now distributing full-length
movies over-the-air on mobile carriers’ video
services
• Sprint Movies offers pay-per-view service with
DVD features
• Offer 7 movies at a time
• Average view time ~ 1.5 hours
• Negotiating with other carriers for distribution
• Promotional channel featuring clips
from theatrical, television, PlayStation,
FearNet and mobile games
• Currently at 350k streams / month on
Sprint and Verizon – increased
programming to 20% growth month-
over-month
• The only linear looping movie channel within Sprint’s Basic + tier of video
• Two looping channels with four classic movies on each channel; movies include comedy, action and drama
• One movie on each channel refreshed weekly
• Optimizes library value by utilizing unused inventory on a spot basis
• Sony Pictures pioneered delivering full-length movies to mobile handsets via memory cards
• Successful handset bundle programs launched in the UK, France, Germany, Switzerland, ItalyNetherlands, & S. Africa
Memory Cards
Over-the-Air
Sony Pictures•Exclusives•In Theatres•Coming to Theatres•On DVD •Coming to DVD•Game Previews•FearNet•PlayStation
FY08 Will Build on Launch of Video Services

21
Ad Supported Transactional
Fee-per-sub
…using a range of business models
On-demand
Sell-through Linear streaming
…and consumer experiences
• Concentrate on biggest video distributors (in order)- Sprint, Verizon, Cingular
• Launch quality video services in multiple genres, with a breadth of business models, addressing a variety of consumer experiences
• Aggressively optimize deck placement and marketing tactics• Draft off marketing for IP-video and other mobile products where possible
’08 Strategy
Extend Channel Brands to Mobile
SPT Channels
Premium Video Services Launched into Carriers’ “Basic Tiers” in FY08
Short-form programs
Long-form programs

22
Handsets Aggregators D – to - CCarriers
FY07: Grew relationships, marketing and tech ops capabilities with partners
Carriers: Continue to focus aggressively on top 3 players in the market, push T-Mobile and Alltel for growth, and add additional strategic players (e.g., Virgin)
Handsets: Continue to push on embed deals with Motorola; secure deals with Nokia and Sony Ericsson
Online Aggregators: Increase reach by licensing to a select group of top online retailers
Direct-to-Consumer: Establish direct-to-consumer distribution, leveraging applications and web
’08 Strategy
Large Footprint Secured in FY07 will Serve as Foundation for Future Growth
23
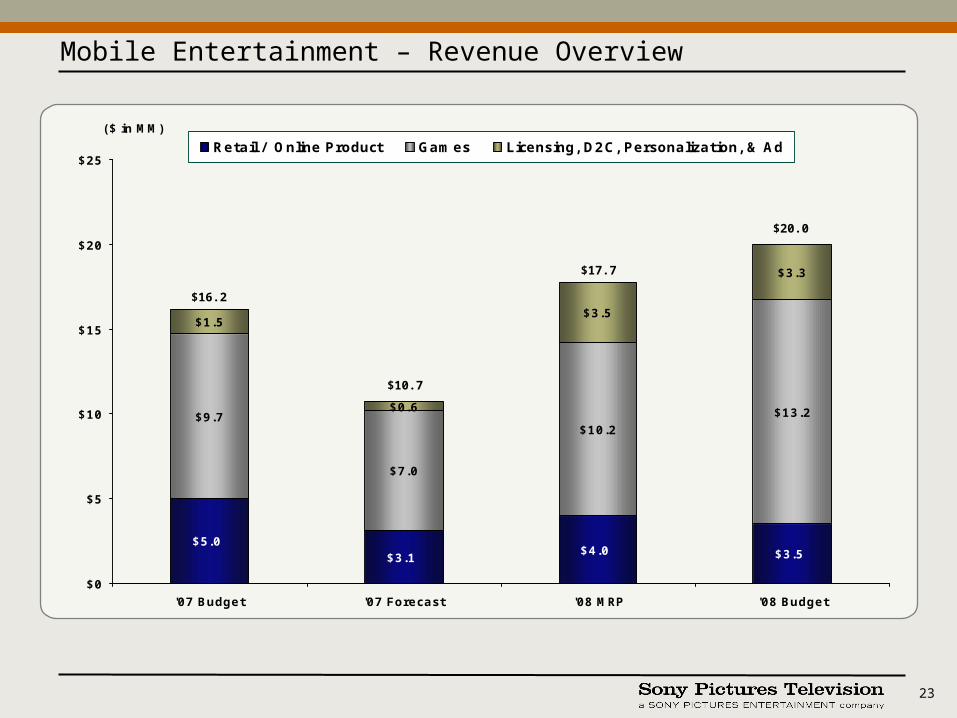
Mobile Entertainment – Revenue Overview
$4.0 $3.5
$9.7
$7.0
$10.2
$13.2
$1.5
$0.6
$3.5
$3.3
$3.1$5.0
$0
$5
$10
$15
$20
$25
'07 Budget '07 Forecast '08 MRP '08 Budget
($ in MM)
Retail / Online Product Games Licensing, D2C, Personalization, & Ad
$17.7
$20.0
$10.7
$16.2

24
Mobile Entertainment – Summary P&L
P&L ($000s) '07 Budget '07 Forecast Variance '08 MRP '08 Budget Variance
Total Revenue $16,150 $10,728 ($5,422) $17,725 $19,975 $2,250
Total COGS ($2,400) ($1,113) $1,287 ($7,735) ($4,940) $2,795
Gross Profit $13,750 $9,615 ($4,135) $9,990 $15,035 $5,045
Total Operating Expenses ($3,155) ($2,879) $276 ($5,065) ($5,565) ($500)
Operating Income $10,595 $6,736 ($3,859) $4,925 $9,470 $4,545
Less: Contribution ($12,790) ($8,848) $3,942 ($9,290) ($13,800) ($4,510)
EBIT ($2,195) ($2,112) $83 ($4,365) ($4,330) $35
Headcount 13 13 - 17 14 (3)

25
Digital Distribution & Mobile Entertainment – Consolidated P&L
P&L ($000s) '07 Budget '07 Forecast Variance '08 MRP '08 Budget Variance
Total Revenue $21,150 $16,490 ($4,660) $31,725 $39,650 $7,925
Total COGS ($4,190) ($2,184) $2,006 ($9,835) ($6,890) $2,945
Gross Profit $16,960 $14,306 ($2,654) $21,890 $32,760 $10,870
Operating ExpensesG&A ($5,025) ($4,931) $94 ($6,480) ($12,171) ($5,691)Other ($3,255) ($2,655) $600 ($4,975) ($6,625) ($1,650)
Total Operating Expenses ($8,280) ($7,586) $694 ($11,455) ($18,796) ($7,341)
G&A as a % of Revenue * 36% 45% 30% 31%
Operating Income $8,680 $6,720 ($1,960) $10,435 $13,964 $3,529
Less: Contribution ($13,635) ($11,857) $1,778 ($18,735) ($27,750) ($9,015)
EBIT ($4,955) ($5,137) ($182) ($8,300) ($13,786) ($5,486)
HeadcountIP 11 11 - 14 20 6 Mobile 13 13 - 17 14 (3) ExecOps 2 4 2 6 7 1
Total 26 28 2 37 41 4
* 2007 and 2008 MRP are Pro Forma to include the transfer of Executive headcount and legal allocation

26
Headcount Reconciliation
FY08 Additions
• Expanding to support growth in new accounts
• Driving growth in new accounts
• Developing new products; creating marketing and programming assets
2 Sales
4 Product / Asset Creation
4 Account Mgmt.
Digital Distribution and Mobile: Requested Increase in Headcount
Forecast End of FY07
Transfer from within ODE
Transfer from Other SPE Additions
FY 2008 Budgeted
Digital Distribution 11 2 - 7 20 Mobile Entertainment 13 (2) 1 2 14 Executive 4 - 2 1 7
Total 28 - 3 10 41
Revenue per Head $0.6MM 64% Growth $1.0MM
Fiscal Year 2008 Budget

27
Agenda
1. Executive Summary
2. Digital Distribution
3. Mobile Entertainment
4. Digital Services / Grouper
5. EBIT Reconciliation

28
2008 represents an opportunity to address a gap in the marketby blending Hollywood quality with the viral nature of UGV
FY07 Accomplishments FY08 Focus Areas
• Successful integration with Sony Pictures
• Developed content and programming strategy
• Retained and grew initial user base
• Supported “Sony United” by integrating with other divisions
• Launch 3.0 to address market gap
• Capitalize on market opportunity to grow and monetize the service
Recent Progress and FY08 Focus Areas

29
Integrated with SPE
Integrated Across Sony
Expanded User Base
• Grouper in PSP firmware
• Integration with IP-enabled Bravia
• Working on PS3 prototype
• Grew users 40% to 9MM
• Grew daily video streams to 1.6MM
1.92.5
3.0
4.5
5.3
6.0
0
1
2
3
4
5
6
7
8
9
10
October November December
Mo
nth
ly U
niq
ue
Use
rs (
mil
lio
ns)
0
0.2
0.4
0.6
0.8
1
1.2
1.4
1.6
1.8
Dai
ly S
trea
ms
(mil
lio
ns)6.4
7.89.0
• Unique SPE content offering -- ScreenBites
• DVD promotion for Seinfeld Season 7
• Contests for SPE theatrical releases (Pursuit of Happyness launched, Spider-Man 3 in process)
FY07: Integrated Grouper and Expanded User Base

30
• Establish Grouper as a trusted and recognized brand for online video by combining the viral nature of user-generated video with the quality of “Hollywood” content
• Build a large base of high quality short-form video– Attract content creators through a “path to recognition”– Identify and invest in the best videos– Produce original short-form content
• Offer users a compelling content syndication proposition
• Implement a differentiated, channel-based programming strategy
• Improve overall user experience through a superior content guide, high-quality playback, easy publishing to other sites
Vision
Execution
Launching Grouper 3.0 in June 2007
Grouper 3.0

31
“The Red Carpet” (Potential Show on “All Access” Channel)
Attend premieres
and interview
celebrities
Guest Host on
“Red Carpet” Show
All Content Uploaded to Channel
Featured Content (Views, Ratings, Editorial)
Content Featured
in “Best of” Show
• Provide incentives to attract quality content and actively engage audience
– “Path to recognition” for each channel, with online and offline rewards
– Tools for users to create, manage, and promote their own shows
– Financial incentives / compensation for content creators
• Enable creators to broadly distribute their content through syndication and “path to recognition” partners
Example of “Path to Recognition”
Attract Content Leaders to Grouper

32
• Short-form, higher production quality
• Shows developed for specific channels
• Mix of in-house (60%) and commissioned 3rd party shows (40%)
• Quality UGV content with an established online audience
• Grouper will acquire or license for a fixed fee or revenue share on an exclusive basis
• Opportunistic acquisition of content with lower production value but proven audience appeal
• Fixed fee paid for exclusive distribution rights
OriginalProduction
Prosumer General UGVNiche
Collections
AcquiredProduced
Investing $3.9MM to produce 450 short episodes and acquire roughly 5,000 videos
Invest in Differentiated Content

33
Tier Content Focus Sample Channel Concepts
Tier 1Branded channels focused on well-defined genres with depth of content and originally produced shows
Tier 2 Broader content categories with breadth of user-uploaded content and hand-picked featured videos
Tier 3General UGV, with featured content largely based on user ratings and input
• Quick Laugh
• Election 2008
• Instant Karma
• All Access
• Project X
• Sexy • Travel• Citizen Journalist• How-To
• Holiday / Events• Don’t Try at Home• Trends / Lifestyle• Action Sports
• Pets & Animals• Car Culture• Video Games• Family Friendly
• Blog!• Colleges• Spirituality
Launch Grouper 3.0 with 5 to 6 Channels in June10 Channels Live by End of Fiscal Year
Program on a Channel Basis

34
Q4 FY07 Q3 FY08Q2 FY08Q1 FY08
• 2.5 Launch
• Continuous playlists
• Multi-file upload
• Enhanced external player
• New home page
• Advertising
• 1-click to new distribution partners
• Syndicate Grouper to network partners
• Channel home pages with shows
• 3.0 Launch
• Re-branding
• New content strategy implemented
• Path to recognition in place
• Multi-site publishing
• “My Show”
• Enhanced external player with ads and sponsor support
• Family filter
• Updated advertising technology
• Enhancements
• Talent show
• Content creator self promotion tools
• Web-based groups
• Recommendation engine
• Web-based IM integration
• Update advertising technology
• Mobile sharing 1.0
• Sony Ericsson syndication
• Enhancements
• Mobile sharing 2.0
• Hardware integration
– Cameras
– PCs
– Devices
• Client re-launch
• Geo sharing
Improve Overall User Experience: Product Roadmap

35
Attract New Users through Marketing
Extend Reach through 3rd Party Distribution Partners
Social Networks
Online Portals
Hardware / Embed deals
Verticals
Online Marketing
Project X Prizes
Cross-Sony Support
Leverage SPE
$2.5MM investment in Grouper Marketing and Distribution$3.0MM in Prizes for Project X
Extending Audience Reach Through Marketing & Distribution
Path to Recognition
Partners

36
Non-Channel-Based Sponsorship Revenue
Channel-Based Sponsorship RevenueAdvertising Revenue
$4 MM $2.8 MM $3.8 MM
Branded Channels
• Custom Channels dedicated to a single brand (i.e. ‘Mini
Cooper’ channel)
• 20 total in FY08 at average price of $20k - $30k each
Project X
• Competitions within Project X talent categories
• Talent-based sponsorships
Channel Sponsorships
• Advertiser pays fees for persistent branding,
enticements, and sponsored downloads from a channel
Video Interstitials
• Sponsor receives dedicated portion of video interstitial
inventory w/ companion rich media ad at a premium CPM
Video Interstitials
• Run-of-Site video advertising inventory (max ad ratio 1:3
videos)
Banners
• 1 banner per page; 2 impressions per stream
User Initiated Video
•Ad placement against sponsored terms
Remnant
• Domestic and Int’l banner and domestic video interstitial
inventory sold at a discount
Advertising and sponsorships forecast to deliver $10.6MM in FY08 revenue
Revenue Strategy
37
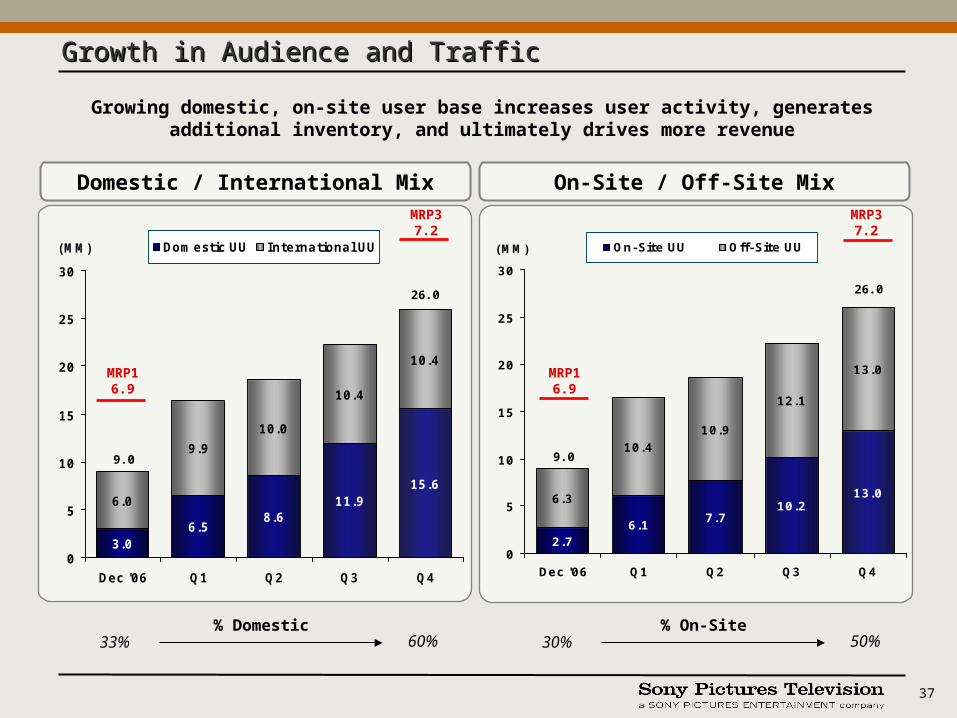
Growth in Audience and TrafficGrowth in Audience and Traffic
Domestic / International Mix On-Site / Off-Site Mix
3.06.5
8.611.9
15.66.0
9.9
10.0
10.4
10.4
0
5
10
15
20
25
30
Dec '06 Q1 Q2 Q3 Q4
(MM) Domestic UU International UU
26.0
9.0
6.17.7
10.213.06.3
10.4
10.9
12.1
13.0
2.70
5
10
15
20
25
30
Dec '06 Q1 Q2 Q3 Q4
(MM) On-Site UU Off-Site UU
26.0
9.0
33% 60%% Domestic
30% 50%% On-Site
Growing domestic, on-site user base increases user activity, generates additional inventory, and ultimately drives more revenue
MRP16.9
MRP37.2
MRP16.9
MRP37.2

38
Ending FY08 Grouper Audience (domestic, on-site) vs. Current Competitor Audience Sizes (1)
(1) Most recent available unique user numbers per Nielsen and Comscore unless otherwise noted, domestic on-site users only(2) Per the company(3) At peak months of April and May(4) Combined 1.8MM Addicting Clips & 1.2MM Atom Films
MM
MySpace 55.3
YouTube 38.0
Break (2) 9.8
Heavy 7.8
Grouper FY08 Budget 7.8
PureVideo (2) 5.5
American Idol (3) 4 - 5
Daily Motion 3.9
eBaum’s World 3.8
Addicting Clips / Atom Films (4) 3.0
iFilm 2.3
Audience Benchmarks

39
• Addressed disruption caused by litigation to ensure continued growth–Disabled Grouper client and downloads as a precaution–Although growth was dampened, grew audience 40% since acquisition
• Delayed launch of advertising to remain competitive and solidify customer base–Key competitors, including YouTube, waiting to roll-out advertising–Launching full advertising initiative in conjunction with Grouper 3.0 service
• Adjusting business model to mitigate impact on revenues–Launching Grouper 3.0 to differentiate service and ensure continued user growth–Increasing proportion of domestic traffic; more easily monetized–Increasing proportion of on-site traffic; drives greater usage and ad inventory–Expanding revenue models to include sponsorships
Factors Impacting FY08 Revenues

40
Grouper – Revenue OverviewGrouper – Revenue Overview
$18.6
$4.0
$2.8
$3.8
$3.0
$0
$2
$4
$6
$8
$10
$12
$14
$16
$18
$20
'07 Budget '07 Forecast '08 MRP '08 Budget
($ in MM)
Advertising Channel-Based Sponsorships Non Channel-Based Sponsorships
$18.6
$10.6
$0.1
$3.0
41
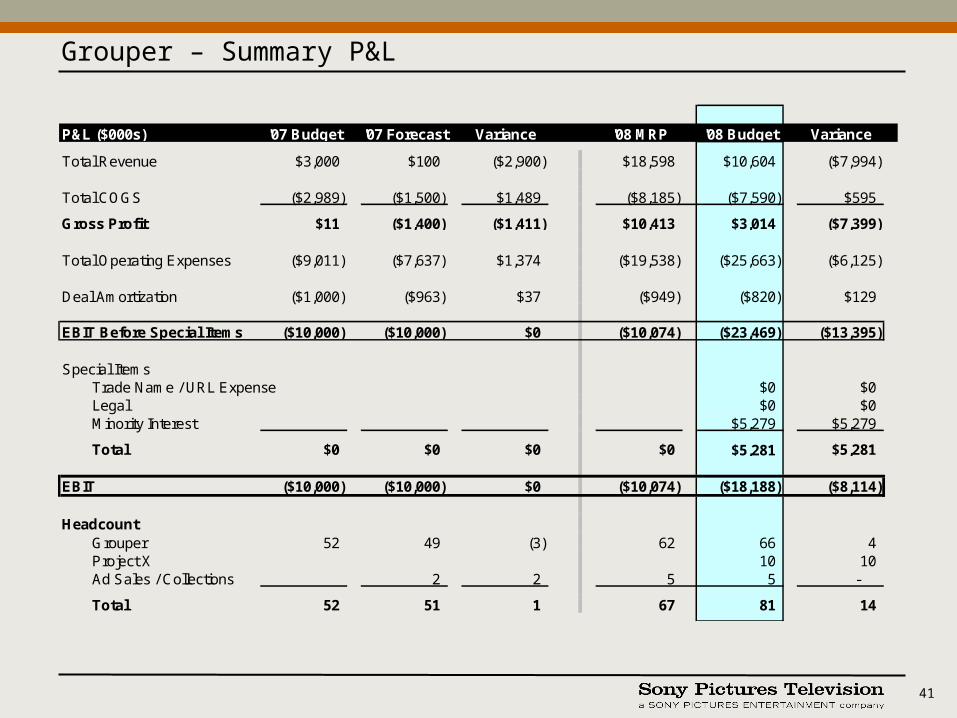
Grouper – Summary P&L
P&L ($000s) '07 Budget '07 Forecast Variance '08 MRP '08 Budget Variance
Total Revenue $3,000 $100 ($2,900) $18,598 $10,604 ($7,994)
Total COGS ($2,989) ($1,500) $1,489 ($8,185) ($7,590) $595
Gross Profit $11 ($1,400) ($1,411) $10,413 $3,014 ($7,399)
Total Operating Expenses ($9,011) ($7,637) $1,374 ($19,538) ($25,663) ($6,125)
Deal Amortization ($1,000) ($963) $37 ($949) ($820) $129
EBIT Before Special Items ($10,000) ($10,000) $0 ($10,074) ($23,469) ($13,395)
Special ItemsTrade Name / URL Expense $0 $0Legal $0 $0Minority Interest $5,279 $5,279
Total $0 $0 $0 $0 $5,281 $5,281
EBIT ($10,000) ($10,000) $0 ($10,074) ($18,188) ($8,114)
HeadcountGrouper 52 49 (3) 62 66 4 Project X 10 10 Ad Sales / Collections 2 2 5 5 -
Total 52 51 1 67 81 14

42
End of FY07
Grouper 49
End of FY08
Grouper 66
Project X 10
Sales / Collections 5
Total 81
MRP/Acq. Model 67
End of FY07
Grouper 49
End of FY08
Grouper 66
Project X 10
Sales / Collections 5
Total 81
MRP/Acq. Model 67
Incremental 14 Headcount vs. MRP /
Acquisition Model
GrouperContent 4
Project XTalent Mgmt 4 Judge Staff 4Editorial 2
Total 14
Incremental 14 Headcount vs. MRP /
Acquisition Model
GrouperContent 4
Project XTalent Mgmt 4 Judge Staff 4Editorial 2
Total 14
Headcount / Org Chart
J. Felser & D. SamuelCo Presidents
A. EyalCTO
T. LianoVP, Programming
J. ShambroonVP, Prod/Marktg
M. SitrinVP, Partnerships
S. GenslerDir, Biz Dev
General Mgmt
Engineering & Development
Content
Products
Customer / Acct Management
Business Development
C. Amen-KroegerVP, Engineering
TBD
Ad Sales
Project X
29
14
11
4
4
10
5
Total HeadcountEnd of FY08
4
81
SPT

43
Agenda
1. Executive Summary
2. Digital Distribution
3. Mobile Entertainment
4. Digital Services / Grouper
5. EBIT Reconciliation

44
Digital Distribution Grouper
EBIT Reconciliation
EBIT Per MRP ($8.3) EBIT Per MRP ($10.1)
Increased Op Income before G&A $8.5 Decreased Revenue ($8.0)Increased Contribution to Other Divisions ($9.0) Decrease in COGS $0.6
Decrease in DSD Retained Profit ($0.5) Increase in G&A ($5.4)Increase in Marketing ($0.8)
Transfer of 3 Heads and Legal Allocation ($3.0) Other $0.2from HE Variance ($13.4)
Increased G&A ($2.0) EBIT before Special Items ($23.5)
Total Variance ($5.5) Minority Interest (22.5%) $5.3
EBIT Per Budget ($13.8) EBIT Per Budget ($18.2)