digital touchpoint measurement - kantar austria tns... · 2018-05-23 · digital touchpoint...
TRANSCRIPT

DIGITAL TOUCHPOINTMEASUREMENT Driving brand growth by integrating behavioural and attitudinal data
Digital touchpoint measurement
Digital marketing under fire Last year, Procter & Gamble (P&G) announced plans to cut its digital media spending by up to $140 million. According to Chief Financial Officer Jon Moeller, this tremendous reduction in digital investment relates to activities that did not reach P&G’s targets.
Moeller said, “Clearly we don’t need to be spending money that is seen by a bot and not a person. Clearly we don’t need to be spending money on ads that are placed in inappropriate places.” (Marketing Week, 2017)
While investments in digital marketing continue, Keith Weed, Chief Marketing Officer (CMO) at Unilever, expresses similar concerns about its effectiveness. Last year, he demanded that tech giants such as Google and Facebook stop ‘marking their own homework’ and let the effectiveness of the media investment be validated by third party agencies. Weed’s view is that “it is ridiculous that a platform provider itself validates the effectiveness of brand campaigns published on their platform.” (Business Insider, 2017).
Over the last few years, the way we think about digital brand management has changed dramatically.
And it will continue to change. Many companies are fundamentally rethinking their investments in digital.
In this paper, we take the current discussion as a starting point to illustrate practical examples of:
1. how to capture digital activities effectively
2. insights from behavioural and attitudinal engagement
3. how to drive digital touchpoint leadership
“ Clearly we don’t need to be spending money that is seen by a bot and not a person. Clearly we don’t need to be spending money on ads that are placed in inappropriate places.”
- Jon Moeller, Procter & Gamble
Digital marketing is under increasing scrutiny, as companies begin to question the return on their investment. They can begin by evaluating digital marketing in context with the rest of their activities, combining behavioural and attitudinal insights to identify not just where to invest, but how to engage people more effectively.
Digital touchpoint measurement
1. Capturing digital activities effectively

Digital touchpoint measurement
Online engagement is today’s standard measure for digital activity effectiveness, although this measure means different things to different people. Some organisations might see engagement as a purchase in their online store. But what happens if you don’t sell anything online?
The US-based Advertising Research Foundation (ARF) defines engagement as “turning on a prospect to a brand idea enhanced by the surrounding context” (Peyton, 2014). Saying it in simple words: a brand experience needs to resonate with people. No more, no less.
Let’s apply the ARF definition to one of the most used performance indicators for digital campaigns: ad impressions.
These provide the information to an ad server if specific digital ad content (e.g. an online banner or video ad) was delivered to a person. It does not provide any indication if the viewer showed interest in the brand idea. A brand may even pay for ad impressions that leave the prospect with negative feelings and thoughts.
When it comes to digital touchpoints, a brand’s engagement is often measured directly as observable behaviour, i.e. by the number of social media comments, clicks or retweets. Or engagement is defined by the number of visits or clicks on a web page. The wide range of such existing performance indicators provided by social and other platforms only add to the confusion when aiming to measure the effectiveness in terms of real brand engagement.
In a 2016 study published in Marketing Week, marketers evaluated this type of engagement measure quite dramatically as “a con trick played on marketers by social media shysters”. A 2017 study by Kantar Millward Brown also concluded that clicks don’t lead to brand impact.
This type of measurement suffers from a very simple problem: it measures the consequence of engagement, but not the engagement itself. This is the conviction of two American scientists, Calder and Malthouse (2015). They consider engagement as the connection between a person and a brand caused by relevant touchpoint experiences.
Defining engagement beyond eyeballs and clicks
A brand may even pay for ad impressions that leave the prospect with negative feelings and thoughts.

Digital touchpoint measurement
In order to determine brand engagement, marketers must analyse how touchpoint experiences connect with people and how they change a person’s attitude towards the brand. This can only be accomplished by enriching and reframing the behavioural online data - with the help of attitudinal engagement, most often via online or mobile surveys.
The illustration (right) shows the type of mobile survey that captures the attitudinal engagement of brands. This survey was used in a study that Kantar TNS ran in the British smartphone market in 2017. In addition to the survey, the respondents agreed to share their online behavioural data. This combination of data sources allowed us to determine the efficiency and effectiveness of digital touchpoints in terms of brand engagement (See case study in the following section).
Left: an example of a mobile questionnaire on touchpoint
performance of smartphone brands
Both behaviours and attitudes matter

Digital touchpoint measurement
2. Case study: insights from behavioural and attitudinal engagement

Digital touchpoint measurement
In collaboration with a global tech provider, Kantar TNS ran a UK study in 2017 that demonstrates the benefit of combining insights from behavioural and attitudinal engagement data.
For the behavioural engagement, a metering software was used to obtain granular digital behavioural data for each of the 324 respondents (61% desktop only, 18% mobile only, 21% both desktop and mobile over a three-month period, from 30 March to 30 June 2017. We captured 4,725 brand-specific contacts across multiple digital touchpoints.
The opt-in metering technology allowed us to collect granular data on mobile and desktop devices across the full spectrum of digital behaviour.
For the attitudinal engagement, 324 respondents completed a touchpoint survey – using Connect, Kantar TNS’s proprietary solution – on the exposure of 15 digital and 18 offline touchpoints, and capturing attitudinal impact towards 13 brands.
Case study: insights from behavioural and attitudinal engagement
Web browsing
Calls, SMS, WIFI & data usage (mobile)
Search activity
Device and battery performance
App usage
Location
Media streaming (audio and video)
Online banner advertising
Above: digital behaviour captured by the opt-in metering technology

Digital touchpoint measurement
The online metering allowed us to collect a solid base size for analysis. As illustrated above, this included online banner ads, retailer websites, online search, brand websites and customer review websites.
For the other five digital touchpoints measured, the incident rate did not exceed more than 1%, which limited the interpretation of the data.
We then compared the claimed behaviour (reported exposure) to the
actual behaviour (metered exposure) to see if the data captured in the survey reflected the actual behaviour. At an aggregated level, the metered behavioural data gave us confidence in our survey results, revealing the Connect survey as a sensitive measure.
We also observed that the claimed exposure in the survey was 3-7% higher than the metered exposure. This can be traced back to the fact that we did not measure all devices for all respondents.
Behavioural and attitudinal data complement each other
Online banner ads(49%)
Retailer websites(33%)
Online search(7%)
Brand websites (4%)
Customer review sites (2%)
Mobile operator websites (1%)
Onlilne video ads (1%)
Blogs, forums, podcasts (1%)
Product comparison sites(1%)
News sites (1%)
Above: incident rate of digital touchpoints after three
months of metering
Digital touchpoint measurement
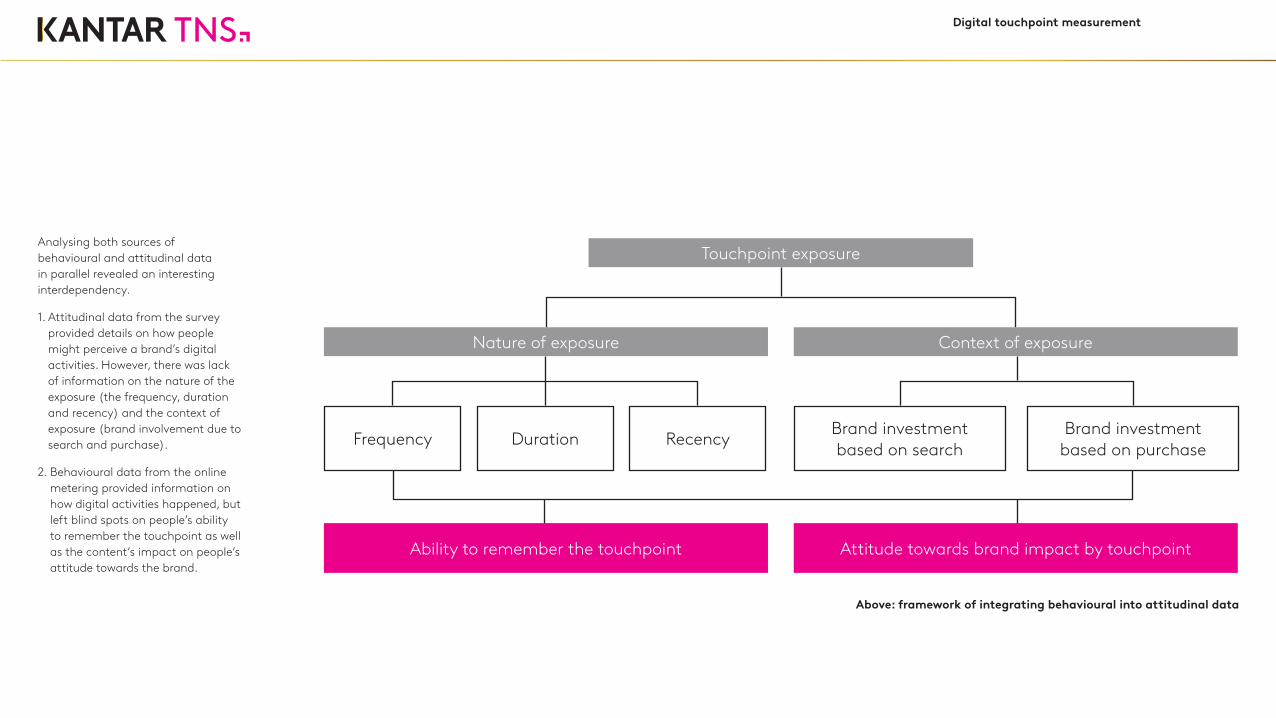
Analysing both sources of behavioural and attitudinal data in parallel revealed an interesting interdependency.
1. Attitudinal data from the survey provided details on how people might perceive a brand’s digital activities. However, there was lack of information on the nature of the exposure (the frequency, duration and recency) and the context of exposure (brand involvement due to search and purchase).
2. Behavioural data from the online metering provided information on how digital activities happened, but left blind spots on people’s ability to remember the touchpoint as well as the content’s impact on people’s attitude towards the brand.
Touchpoint exposure
Frequency Duration Recency Brand investment based on search
Brand investment based on purchase
Nature of exposure Context of exposure
Ability to remember the touchpoint Attitude towards brand impact by touchpoint
Above: framework of integrating behavioural into attitudinal data

Digital touchpoint measurement
Combining both data sources into one single source study provided new insights on many unanswered questions, e.g. how many times should someone be exposed to online banner ads when aiming to increase the attitude towards the brand. Our data indicated that people that were exposed to the online banner ad between 9 and 10 times showed the highest attitudinal impact. Additional investments in these online banner ads to increase exposure should therefore be better relocated to other activities (see illustration on the right).
It might seem obvious that higher touchpoint exposure correlates positively with improved recall and a stronger impact on brand equity. The question is, however, which touchpoints benefit the most from a longer exposure time? Our data revealed that retailer websites show the strongest correlation between longer exposure and memorability, as well as brand impact.
If this is the case, brands would do well to consider longer form content – in particular video - in the eCommerce context. A growing trend here that leverages the power of storytelling through video content is video testimonials: these should integrate video content from influencers – people just like the viewer – who explain something about the product and offer a third-party perspective about and experience of the product. Where video is used in this way, it helps brands to influence the purchasing moment, eliciting the active involvement of the viewer, thereby supporting conversion.
Touchpoint impact based on recency helps us to better understand the limited impact of online banner advertising. Despite 230 metered exposures to online banner advertising, on average only 2.8% of the sample recalled seeing such advertising.
After five weeks, 27% still remembered brand-specific contact with customer review websites, while only 9% remembered online banner advertising. Eight weeks after exposure, only 4% of the impact of online banner ads on brand equity remained, compared with the impact such ads had in the first two weeks after exposure.
Analysing the impact of brand involvement on the perception of online banner ads, we can see that search activity influences digital touchpoint impact. The chance that online banner advertising is perceived and remembered is six times higher if the person also actively searched for the brand. For those who had purchased the brand (compared to those who did not), touchpoint impact on brand perception was three times higher for banner ads. That’s relatively low, knowing the impact for visiting the retailer website was 15 times higher.
Driving the right exposure strategy
Number of ad impressions online banner ads0 1 2 3 4 5 6 7 8 9 10 11 12 13 14 15 16 17 18 19 20 21 22 23 24
4%
5%
3%
2%
1%
Impact on attitude towards the brand

Digital touchpoint measurement
Our research provided clear evidence that the question is no longer if behavioural is better than attitudinal data. The question is rather about how to best bring the two data sources together. We have found that survey and behavioural data can work together to provide a deeper understanding of touchpoint exposure and the impact of this on the brand. The survey offered a broad, landscape view on touchpoint performance. Behavioural and attitudinal data captures a holistic view of people’s perceptions. This is crucial since “we always see things around us in relation to each other. We can’t help it!” (Ariely, 2008). We all know that better is the enemy of good. Your brand’s campaign can be strong in the pre-test, however, when your competitor launches a better campaign at the same time, your brand’s performance will go down in the post-test.
Surveys allow capturing the impact of all types of touchpoints on people’s minds – for you and competitor brands. Without surveys, you will always have blind spots.
On the other hand, behavioural data delivers depth through granularity of single touchpoints, e.g. the duration, frequency and recency of an online advertisement. Figuratively speaking, the benefit of integrating both data sources can be best described by T-shaped management approach. The horizontal bar uses attitudinal data to provide marketers a strategic high-level view on which touchpoints to prioritise for which kind of job. The vertical bar consists of behavioural data and supports marketers with the view on the ground to decide how to best activate digital media, e.g. in terms of frequency, size, or placement of a brand’s activity.
Combining behavioural and attitudinal data
How we activate digital touchpoints?
� How to best activate digital media? � With what frequency, size, placement, order?
� In which combination of digital media?
Which touchpoints impact the consumer’s mind?
� Which role play digital touchpoint in synergy with other touchpoints?
� What do competitors do in terms of touchpoint’s reach and quality?
� How to best reallocate spending across all touchpoints?
Attitudinal data
Above: T-shaped management solution for the integration of behavioural and attitudinal data
Behavioural data

Digital touchpoint measurement
3. Driving digital touchpoint leadership
Digital touchpoint measurement
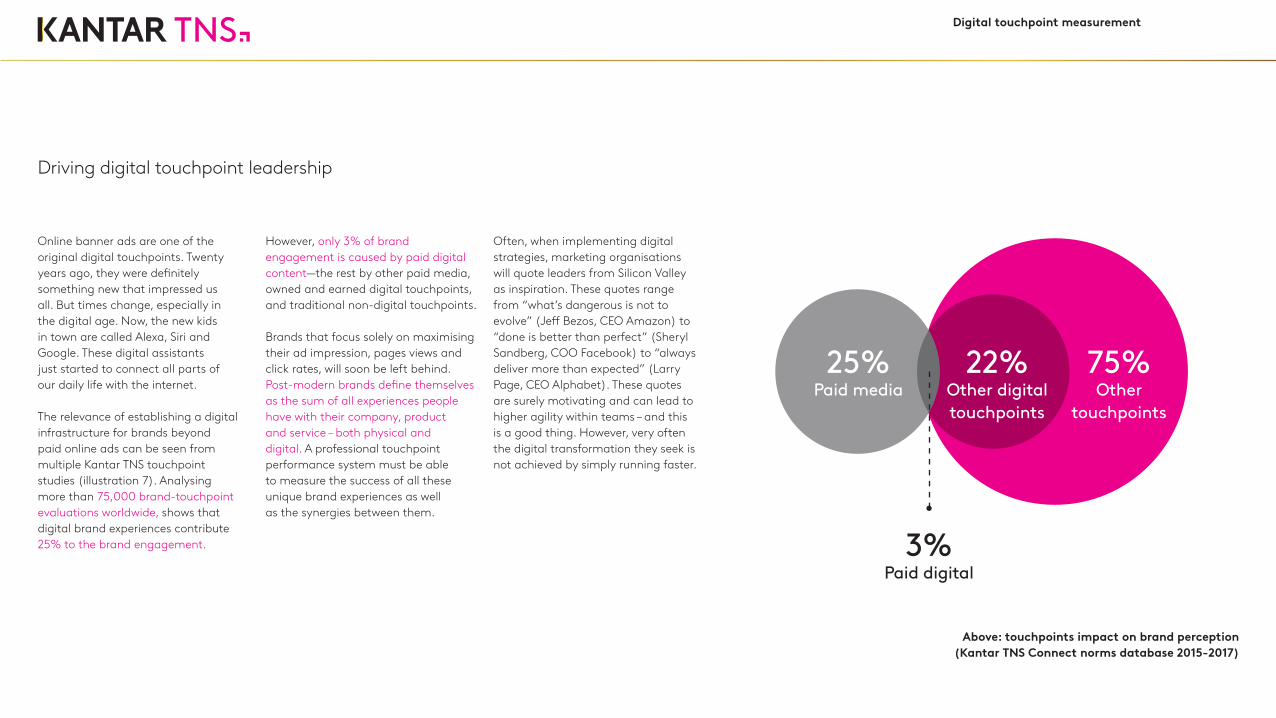
Online banner ads are one of the original digital touchpoints. Twenty years ago, they were definitely something new that impressed us all. But times change, especially in the digital age. Now, the new kids in town are called Alexa, Siri and Google. These digital assistants just started to connect all parts of our daily life with the internet.
The relevance of establishing a digital infrastructure for brands beyond paid online ads can be seen from multiple Kantar TNS touchpoint studies (illustration 7). Analysing more than 75,000 brand-touchpoint evaluations worldwide, shows that digital brand experiences contribute 25% to the brand engagement.
However, only 3% of brand engagement is caused by paid digital content—the rest by other paid media, owned and earned digital touchpoints, and traditional non-digital touchpoints.
Brands that focus solely on maximising their ad impression, pages views and click rates, will soon be left behind. Post-modern brands define themselves as the sum of all experiences people have with their company, product and service – both physical and digital. A professional touchpoint performance system must be able to measure the success of all these unique brand experiences as well as the synergies between them.
Often, when implementing digital strategies, marketing organisations will quote leaders from Silicon Valley as inspiration. These quotes range from “what’s dangerous is not to evolve” (Jeff Bezos, CEO Amazon) to “done is better than perfect” (Sheryl Sandberg, COO Facebook) to “always deliver more than expected” (Larry Page, CEO Alphabet). These quotes are surely motivating and can lead to higher agility within teams – and this is a good thing. However, very often the digital transformation they seek is not achieved by simply running faster.
Driving digital touchpoint leadership
25%Paid media
3%Paid digital
22%Other digital touchpoints
75%Other
touchpoints
Above: touchpoints impact on brand perception (Kantar TNS Connect norms database 2015-2017)

Digital touchpoint measurement
A digital strategy needs to be more nuanced. It is not only about speed. Instead, we recommend to start with defining the right scope of your digital strategy by generating learnings from the following three steps:
Step one: Learn from other industries Across more than 300 Connect studies ran by Kantar TNS in the past few years, we see product categories that are far ahead when it comes to digital touchpoints. In the financial sector, more that 34% of touchpoints are digital, whereas the share is only 22% for consumer goods and 14% for retail. Analysing other industries and countries can help you to establish the direction of your own digital journey—benchmarking the kinds of touchpoints, as well as their effectiveness in driving brand perception and revenue.
Step two: Identify trendsetting countries Having analysed data from across more than 50 countries, we see some countries leading the digital transformation. In Asia, more than 27% of the brand impact comes from digital touchpoints, compared to only 20% in Europe. This is very much in line with the findings from our annual Connected Life study. In Germany, 53% of the media usage is digital, whereas in China the value is already at a level of 74%.
Step three: Understand your target group The usage of specific digital channels is closely related to the age of your target group as we can see in in our global study of digital behaviour, Connected Life. For example, the average age of WhatsApp users is 39 years, for Facebook 38 years, and for Snapchat 27 years. When developing a digital strategy, having a detailed analysis of the media usage is a crucial first step.
If the direction is the wrong one, increasing speed won’t help
Digital touchpoint measurement
Actions for marketers
The examples of P&G and Unilever show the imperative to change the way we think about digital marketing, especially when it comes to the millions of dollars of marketing spend that go into it.
Digital brand experience goes beyond online ads and websites. We are just at the beginning of a completely new era of marketing. The new challenges must be addressed by a comprehensive touchpoint performance system that captures the brand experience holistically — assessing not only what people are exposed to, but the impact of that exposure on brand perception and people’s behaviour.
This allows marketers to identify and cut inefficient investment, re-allocate spending to more impactful touchpoints, and free some budget for exploring new opportunities in the digital world.
More than ever, marketers need to make better use of relevant data to increase the confidence in making the right investment decisions. It is not a question of whether one data source is better than the other. Today, we need to better understand how integrating behavioural and attitudinal data holistically drives better brand engagement, and ultimately growth.

Digital touchpoint measurement
Recommended reads
AdAge (2017): P&G slashes digital ads by $140M over brands safety. Sales rise, online: http://adage.com/article/cmo-strategy/p-g-slashe/309936/
Ariely, D. (2008): Predictably irrational. The hidden forces that shape our decisions.
Business Insider (2017): Why you won’t see Unilever announcing it is pulling its ads from YouTube, online: https://www.businessinsider.com/unilever-cmo-keith-weed-on-google-negotiations-2017-3
Calder, B. J., & Malthouse, E. C. (2015). Media engagement and advertising effectiveness. Kellogg on advertising and media, 1-36.
Marketing Week (2017): Will other brands follow P&G’s lead and cut digital ad spend?, online: https://www.marketingweek.com/ 2017/08/04/brands-digital-pitfalls/
Marketing Week (2016): Is ‘brand engagement’ a meaningless metric?, online: https://www.marketingweek.com/2016/08/10/cover-what-does-engagement-really-mean-to-marketers/
Kantar Millward Brown (2017): Create Digital Ads That Drive Brand Growth http://www.millwardbrown.com/global-navigation/news/news-events/webinars/2017/create-digital-ads-that-drive-brand-growth
Kantar TNS Connected Life (2017): http://connectedlife.tnsglobal.com/
Peyton L. (2014): Media Psychology: What IS engagement?, online: http://lisapeyton.com/media-psychology-what-is-engagement/

Digital touchpoint measurement
Dr. Niels Neudecker VP, Head of Global Connect Centre North America, New York
Ansie Lombaard Global Innovation Director, Behavioural Data, South Africa, Cape Town
About Kantar TNS
Kantar TNS is one of the world’s largest research agencies with experts in over 90 countries.
With expertise in innovation, brand and communication, shopper activation and customer experience, we help our clients identify, optimise and activate the moments that matter to drive growth for their business.
We are part of Kantar, one of the world’s leading data, insight and consultancy companies.
Find out more at www.tnsglobal.com
Connect with us
Kris Hull SVP, Agile Solutions, North America, Cincinnati
