digitalization of electricity utilities
TRANSCRIPT
BPDB Perspective
Digitalization of Electricity Utilities:
Engr. Jorifa Khatun
Bangladesh Power Development BoardACEF June 16, 2021

PGCB 1996
BPDBP.O. 59 1972
DESCO 1997
EGCB 2004
APSCL 1996
WZPDCL2002
DPDC 2008
Residual DESA
NWPGCL2006
NESCO 2016
An Enterprise of BPDB
UAELBCPCL
2014SNPCL
2016BCRECL
2014
Joint Venture
B-R PowerGen, 2010
BIFPCL2012
BBPCL2018
SubsidiariesSubsidiaries
2
Deregulation of Bangladesh Power Sector
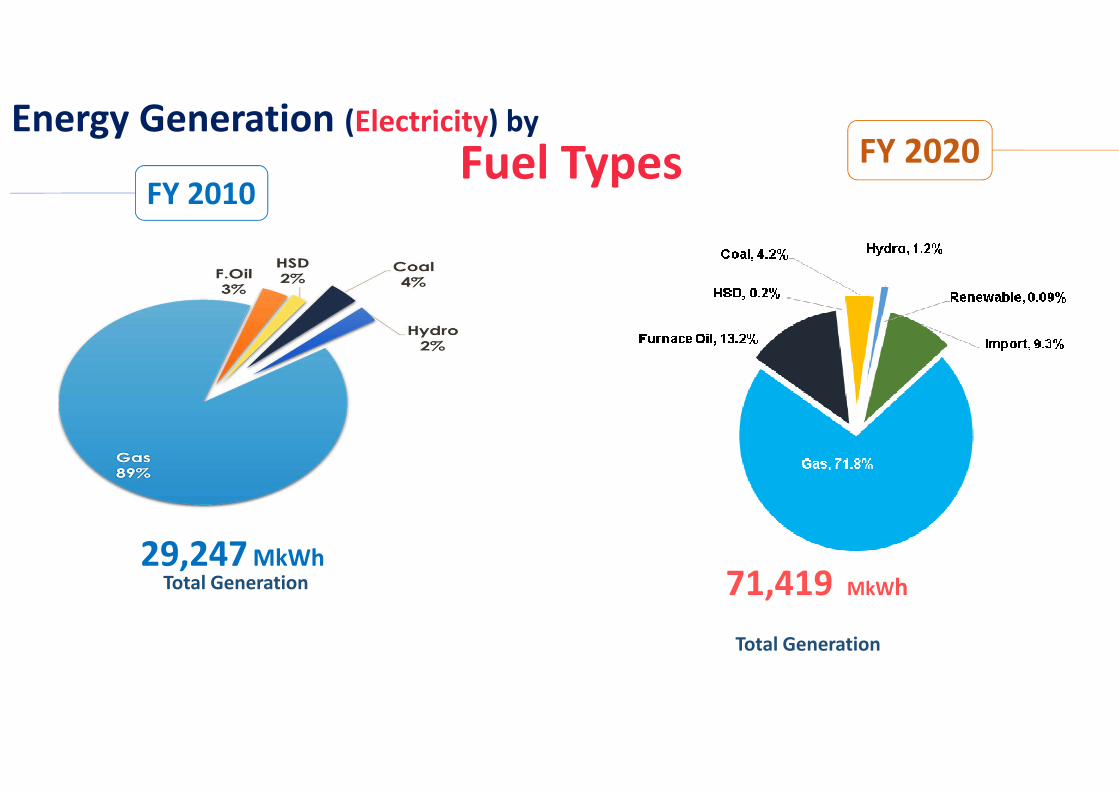
71,419 MkWh
FY 2020FY 2010
29,247 MkWh
Energy Generation (Electricity) by
Fuel Types
Total Generation
Total Generation

DESCO, 10.87%
REB, 39.15%
DPDC, 20.24%
BPDB, 23.73%
WZPDCL, 6.00%
24,596 MkWh63,364 MkWh
AverageConsumption
Growth 9%
4
Electricity Consumption
BPDB, 10308,
16%DPDC,
8487, 13%
DESCO, 5080, 8%
REB, 32802,
52%
WZPDCL, 3168, 5%
NESCO, 3519, 6%
FY 2019-20
FY 2009-10

Source: Revisiting PSMP 20165
Typical Load Curve: Bangladesh2020 2041

0%
10%
20%
30%
40%
50%
60%
70%
80%
90%
100%
20
09
20
10
20
11
20
12
20
13
20
14
20
15
20
16
20
17
20
18
20
19
20
20
20
21
20
22
20
23
20
24
20
25
20
26
20
27
20
28
20
29
20
30
20
31
20
32
20
33
20
34
20
35
20
36
20
37
20
38
20
39
20
40
20
41
Residential Industry Commercial Irrigation Others
Electricity Consumption Demand In Bangladesh
6

Electricity Consumption Demand Thailand and India
Industrial 50% now decreasing 48% , Residential consumption increasing 24% & Commercial 24 %
GW
h
7
THAILAND
Industrial 41.48%, Domestic 24 %, Commercial 8.5 %, Agricultural 18 %
India
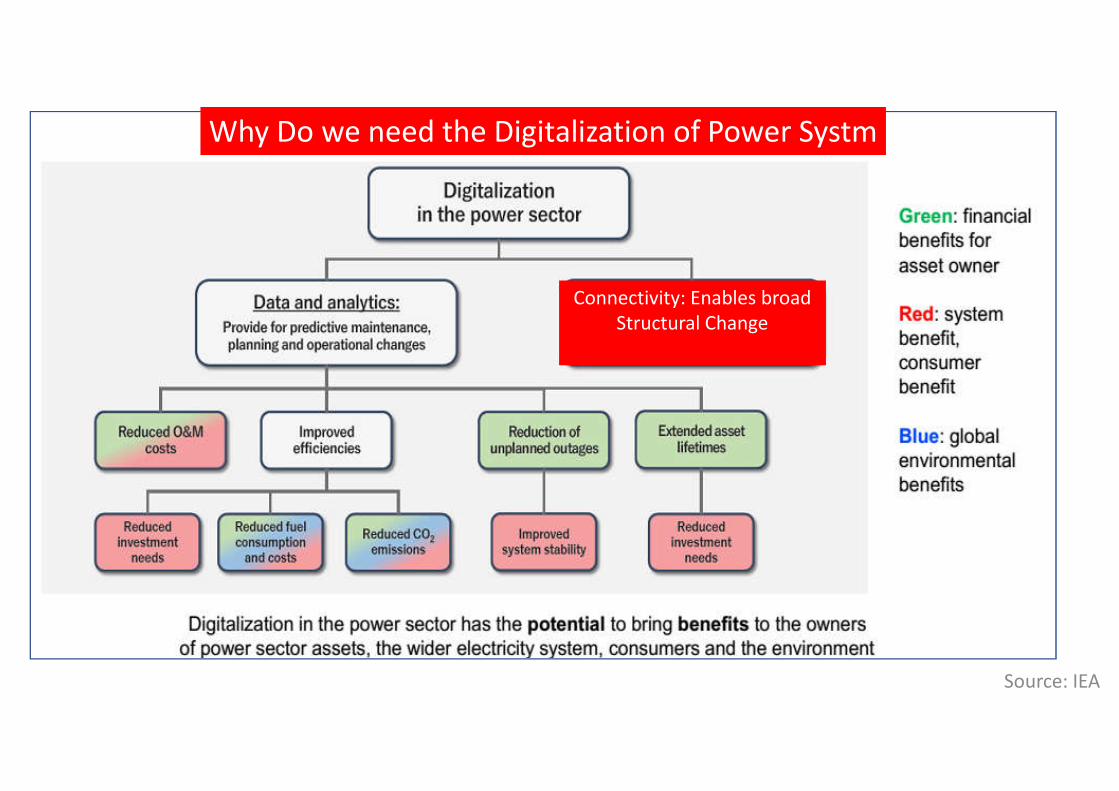
Source: IEA
Why Do we need the Digitalization of Power Systm
Why Do Connectivity: Enables broad
Structural Change

9
Digital Transformation: Generation and
Distribution System

Advance Power Plant Technology
• High efficiency (40 % SC, > 60 % CC)
• Fast start-up capability, high operational flexibility
• Low lifecycle costs
• High reliability and availability
• Reduced emissions per kWh
• High efficiency and low emission also in part-load operation
Advantages of 500 & 800 MW Gas based CCGT
Advanced Power Plant Technology
• Coal Based Sub critical to Ultra -Supercritical

Renewable based Power Generation
11
Existing Capacity : 130 MW
Solar based : Pipeline Project Capacity : 2500 MW
Hydro Power Import Nepal: 500 MW By 2027
Wind Based: Under Process

12
Thanchi village, Thanchi sub-district, Bandarban district.
Effective head 329mDischarge 176 m3/sProbable Capacity 500 MW (Efficiency 88%)L/H: 5.4Effective Reservoir Volume m3: 45,00,000
Potential Area: PSPP in Hill Tract
Remakri village, Thanchi sub-district, Bandarban district.
Effective head 361mDischarge 161 m3/sProbable Capacity 500 MW (Efficiency 88%)L/H: 4.0Effective Reservoir Volume m3: 84,00,000

Digital Transformation: Distribution Sector
Distribution System
GIS substation
SCADA system
Under-ground cabling system
Smart metering

On-line Bill Collection
-through SMS, Banking
On-line Application
• Consumer new connection & Complaint management
• Recruitments
E-Tendering System
Computerized Billing and
Customer Accounting System
Automated Meter
Reading System (AMR)
Prepaid Meter system
To Ensure Proper use of Energy
ERP
Human Resource Management
Fixed Asset Module,
Finance Module and
Procurement Module
SCADA System in Distribution Network
GIS (66,255 consumer data surveyed and entered into the system )1,84,012 poles of 11KV and 33KV line surveyed ,
Distribution Analysis Software ( ETAP already installed In Server)
Under Ground Cabling:
E-Filing management System online Project Review Call Center
• for Customer Feedback/ Complaints
Video Conferences/Meeting
Digitalization: Consumer Satisfaction

BPDB installed 1.3 million prepaid meters out of its 3.3 Million customers
o 1.0 Million, Under Process , ADB Finance
o 30 Thousand Three Phase, 0.9 Million and 70 Thousand Single Phase meo ter of 25 Sales and distributor division of Four Distribution Zones
Existing Consumer | Prepaid meter Connected 4.0 million out of 40 Million in Power Sector
Digital Transformation: Distribution System

2010 2011 2012 2013 2014 2015 2016 2017 2018 2019 2020
Loss In % 15.73 14.73 14.61 14.36 14.13 13.55 13.10 12.19 11.87 11.96 11.23
0.00
2.00
4.00
6.00
8.00
10.00
12.00
14.00
16.00
18.00
Lo
ss
In %
Year
Comparison of T & D loss (FY 2010-20)
Best Practice:T&D Loss Reduced Significantly
13.613.113.112.2 12 11.9
11.210.710.9
9.99.18.99
BPDB’s Distribution System Loss
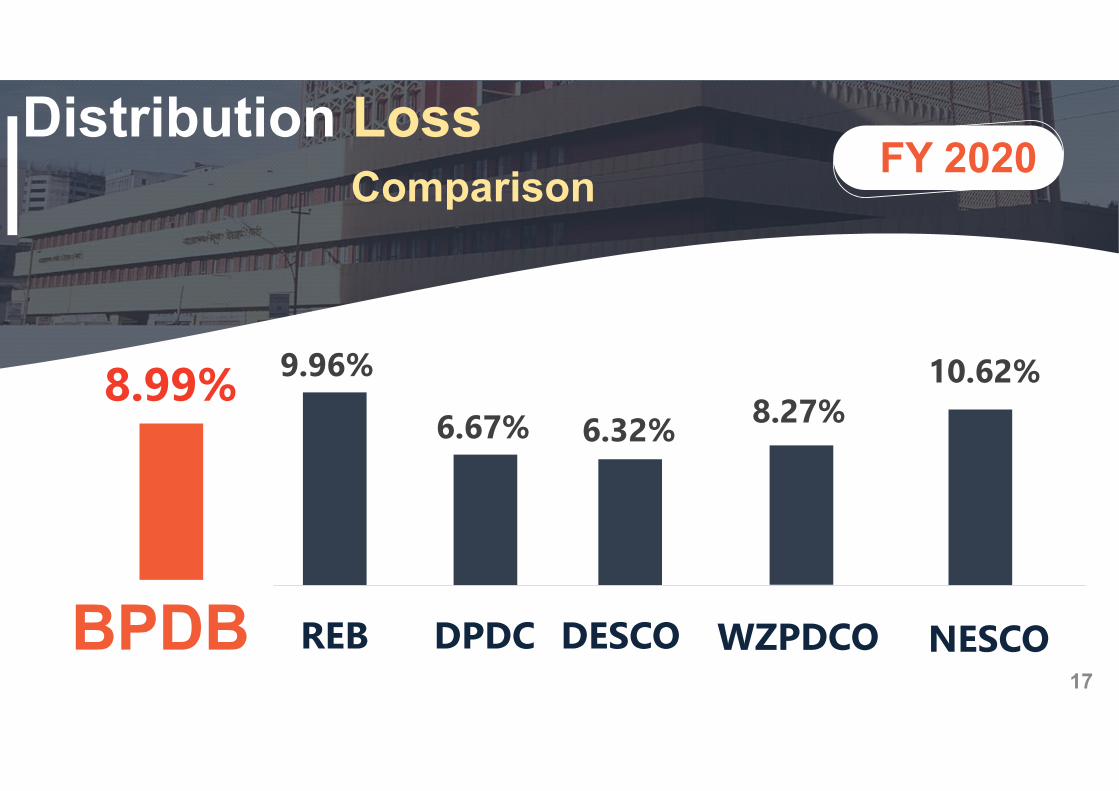
Comparison
Distribution LossFY 2020
17
8.99%9.96%
6.67% 6.32%
10.62%
BPDB REB DPDC DESCO WZPDCOBPDB NESCO
8.27%

18
85
90
92
93
909
6 99
10
0
10
0
97
14,755 13,99913,440
14,284 16,503
0
2,000
4,000
6,000
8,000
10,000
12,000
14,000
16,000
18,000
75
80
85
90
95
100
105
2014-15 *2016-17 2017-18 2018-19 2019-20
C.I Ratio (%) C.B Ratio (%) Accounts receivable (Million taka)
Best Practice: Revenue, Collection & Bill ratio :

Investment Opportunities
19
Industrial Consumer
Electric Vehicle GIS System
SCADA System
Under Ground Distribution SystemRE Development
Grid based Solar and Wind Power
project, PSPP in Hill Tract area
Capacity Building
Energy Efficiency & Conservation Measures
Pre payment Metering, 440 V and 230 V consumer
Ensure the optimal resource mix and power flow path
Automated Meter Reading : 11 KV and 33 KV consumer
Thank
YouBangladesh Power Development Board