diin papr ri - iza institute of labor...
TRANSCRIPT

DISCUSSION PAPER SERIES
IZA DP No. 10743
Massimo AnelliKevin ShihKevin Williams
Foreign Peer Effects and STEM Major Choice
APRIL 2017

Any opinions expressed in this paper are those of the author(s) and not those of IZA. Research published in this series may include views on policy, but IZA takes no institutional policy positions. The IZA research network is committed to the IZA Guiding Principles of Research Integrity.The IZA Institute of Labor Economics is an independent economic research institute that conducts research in labor economics and offers evidence-based policy advice on labor market issues. Supported by the Deutsche Post Foundation, IZA runs the world’s largest network of economists, whose research aims to provide answers to the global labor market challenges of our time. Our key objective is to build bridges between academic research, policymakers and society.IZA Discussion Papers often represent preliminary work and are circulated to encourage discussion. Citation of such a paper should account for its provisional character. A revised version may be available directly from the author.
Schaumburg-Lippe-Straße 5–953113 Bonn, Germany
Phone: +49-228-3894-0Email: [email protected] www.iza.org
IZA – Institute of Labor Economics
DISCUSSION PAPER SERIES
IZA DP No. 10743
Foreign Peer Effects and STEM Major Choice
APRIL 2017
Massimo AnelliBocconi University, IZA and CESifo
Kevin ShihRensselaer Polytechnic Institute
Kevin WilliamsUniversity of Utah
ABSTRACT
APRIL 2017IZA DP No. 10743
Foreign Peer Effects and STEM Major Choice*
Since the 1980s the United States has faced growing disinterest and high attrition from
STEM majors. Over the same period, foreign-born enrollment in U.S. higher education has
increased steadily. This paper examines whether foreign-born peers affect the likelihood
American college students graduate with a STEM major. Using administrative student
records from a large public university in California, we exploit idiosyncratic variation in
the share of foreign peers across introductory math courses taught by the same professor
over time. Results indicate that a 1 standard deviation increase in foreign peers reduces
the likelihood native-born students graduate with STEM majors by 3 percentage points –
equivalent to 3.7 native students displaced for 9 additional foreign students in an average
course. STEM displacement is offset by an increased likelihood of choosing Social Science
majors. However, the earnings prospects of displaced students are minimally affected
as they appear to be choosing Social Science majors with equally high earning power.
We demonstrate that comparative advantage and linguistic dissonance may operate as
underlying mechanisms.
JEL Classification: I21, I23, I28, J21, J24
Keywords: immigration, peer effects, higher education, college major, STEM
Corresponding author:Massimo Anelli Department of Policy Analysis and Public Management Bocconi University Via Roentgen 1 20136, Milano Italy
E-mail: [email protected]
* We thank Michal Kurlaender for her generosity. We have benefited from discussions with Scott Carrell, Giovanni Peri, Hilary Hoynes, Andrea Ichino, David Figlio, Pietro Biroli, Stephen Ross, Delia Furtado and seminar participants at University of Connecticut, Williams College, Brigham Young University, Rensselaer Polytechnic Institute, UC Davis, European University Institute, Stockholm University - SOFI, Norwegian School of Economics, CESifo - Area Conference on Employment and Social Protection, Milan Labor Lunch Seminar - Annual Workshop, the Debenedetti workshop, and the 2017 AEFP conference. This views expressed herein are those of the authors alone.

1 Introduction
Waning interest in Science, Technology, Engineering and Mathematics (STEM) fields has re-mained a significant issue in the United States. In 1985, nearly 1-in-3 bachelor’s degrees awardedwere to students who majored in STEM. By 2010 that figure shrank to less than 1-in-4 (Figure1). In global assessments, American primary and secondary students lag far behind students ofother nations in math and science.1 During college, statistics indicate that nearly 50% of studentsentering as STEM majors end up switching to non-STEM majors or dropping out (Chen, 2013).While legislators have designed policies to boost the attainment and growth of STEM skills, ourunderstanding of the factors which impact major choices remain limited.
Alongside the secular decline in the share of degrees awarded in STEM, the U.S. also sustainedlarge inflows of foreign-born students into its colleges and universities. Figure 1 shows the shareof foreign-born students in postsecondary institutions grew from 7.5% in 1980 to 13% by 2010.Since 1965, family reunification has served as a pillar of U.S. immigration policy (Duleep andRegets, 2014), allowing the entry of immigrant children, many of whom would eventually pursuecollege degrees. Very recent years have seen surges in foreign-born “international students”, whoare admitted solely for higher education and are legally required to return home immediately uponcompletion of their education. This paper proposes a new, previously unexplored factor drivingSTEM attrition - we examine whether foreign-born peers displace native students from STEMmajors.
Dwindling STEM educational attainment, particularly during college, engenders negative eco-nomic consequences at both the individual and aggregate levels. Relatively higher average earningsassociated with a STEM degree has been a long persistent feature of the U.S. skilled labor market.However, recent evidence has magnified the importance of major choice. First, the difference inearnings across high and low paying majors has been shown to be as large as the college/non-college wage gap (Altonji, Blom and Meghir, 2012).2 Second, earnings inequality across majorshas been growing over time (Altonji, Kahn and Speer, 2014). Finally, using quasi-experimentaldata on students in Norway, where graduating high school students apply to college by submittinga ranking of college-major pairs, Kirkeboen, Leuven and Mogstad (2016) find that the returns tohigh paying majors are even greater than the returns to attending a selective institution. Therefore,factors that impact individual choices over field of study not only may have profound influence on
1See PISA (2015), for example.2Altonji, Blom and Meghir (2012) show that even after conditioning on basic demographics and potential experi-
ence, the log wage gap between Mathematics/Computer Science majors relative to General Education majors (0.638log points for males, 0.722 log points for females) is even larger than the college vs. high school wage gap (0.577 logpoints).
2
individual future earnings, but may also explain observed patterns in earnings inequality amongskilled workers.
At the aggregate level, a shrinking supply of STEM skills may hinder economic growth. In-dividuals with expertise in science and engineering have been the main engine of technologicalprogress and innovation (Griliches, 1992; Jones, 1995). Innovation and technological advance, inturn, are key drivers of economic growth. Recent evidence has linked growth in the supply ofskilled scientists and engineers with greater innovation (Kerr and Lincoln, 2010) and labor marketproductivity (Peri, Shih and Sparber, 2015). Over the long run, changes in the types of skills pro-duced in higher education will impact the supply of skills available in the labor market, which mayultimately affect innovation and growth.
These concerns have stimulated inquiry towards identifying factors affecting STEM majorchoice. At the individual level, poor preparation (Stinebrickner and Stinebrickner, 2011) or un-derestimation of the true returns to STEM majors (Wiswall and Zafar, 2015) have been associatedwith disinterest in STEM. Within higher education, studies have identified a lack of role modelsand improper matching of students to universities as perpetuators of gender and racial differencesin STEM attainment (e.g. Carrell, Page and West, 2010; Arcidiacono, Aucejo and Hotz, 2016).Related to immigration, recent studies attribute reductions in STEM majors to inflows of foreignSTEM workers (Orrenius and Zavodny, 2015; Ransom and Winters, 2016). While research onmajor choice continues, existing studies remain far from conclusive in elucidating the factors gen-erating disinterest and attrition from STEM majors.
Even though foreign students comprise over 13% of all undergraduates in the U.S., the aca-demic literature on the impacts of foreign peers has solely focused on primary and secondaryeducation, often in other countries. While informative, the few existing studies produce conflict-ing findings. Using variation in PISA test scores from students across 27 countries, Brunello andRocco (2013) find that increases in immigrant students in secondary schooling are associated withsmall reductions in the test scores of native-born students. Focusing on Israel after the fall of theSoviet Union, Gould, Lavy and Daniele Paserman (2009) relate the fraction of immigrants in the5th grade to high school test scores. Their results indicate that exposure to immigrant peers in the5th grade is associated with lower test scores during high school. Ballatore, Fort and Ichino (2015)examine Italian primary schools and find sizable negative impacts of immigrant students on nativestudents’ performance in language and math at age 7, that also persist over time.
In contrast, several papers produce quite different findings on the impact of foreign peers. Ohi-nata and Van Ours (2013, 2016) study whether immigrant peers affect the test scores of nativeDutch children. Using variation across classes within schools, they do not find evidence of nega-tive impacts on reading, math, or science test scores. Similarly, Geay, McNally and Telhaj (2013)
3

analyze immigrant peers in England, and do not find evidence of negative impacts on native stu-dents’ reading, writing, or math tests scores in primary school. Conger (2015) uses administrativedata on public high school students in Florida and finds no effect of school immigrant shares onimmigrant and native-born students academic performance. Finally, Diette and Oyelere (2012,2014) examine immigrant peers in North Carolina public schools. Interestingly, their results indi-cate positive impacts at the middle to lower end of the ability distribution, and negative impactstowards the top.3
Several ideas motivate the link between foreign peers and STEM major choice. First, uncon-ditionally, foreign students exhibit a higher predilection for STEM fields than natives.4 Therefore,natives in STEM fields are likely to be exposed to more foreign peers than in non-STEM fields.Second, by virtue of their weak English proficiency, foreign students are likely to possess a com-parative advantage in STEM majors. In response, native students may believe that they possessa comparative disadvantage in STEM fields and switch to non-STEM fields, similar to observedoccupational switches made by natives due to immigrant competition in the workplace (Peri andSparber, 2009, 2011). Third, recent studies have found that disruptions in the classroom environ-ment can have lasting negative impacts (Carrell and Hoekstra, 2010; Carrell, Hoekstra and Kuka,2016). Foreign peers may similarly alter the classroom environment due to their low English pro-ficiency (Borjas, 2000). Instructors may slow the pace of instruction or divert attention away fromnatives and towards foreign students. Differently, if foreign students are less communicative, thismay reduce the scope for positive externalities that arise from peer-to-peer or peer-to-instructorinteractions.
This paper aims to estimate the impact of foreign peers on native STEM major choice. To do so,we utilize administrative student-level data from a large, selective public university in California,which covers the academic years 2000-01 through 2011-12. The data contains the roster of everycourse along with background characteristics and outcomes for each student. Our empirical designrelates foreign peer exposure of U.S.-born first-term freshmen in introductory math courses toeventual graduation with a STEM/non-STEM degree.
We consider introductory math courses as an appropriate setting to look for foreign peer im-pacts on eventual STEM degree attainment. Such courses (see Table 1), which are primarilycalculus-based, have long been considered a gateway class for STEM majors (Steen, 1988). Addi-
3There have been a small number of inquiries into postsecondary education, however studies remain focusedsolely on international students. Furthermore, the key question of interest in this literature has been over whetherinternational students crowd natives out of or into higher education (Hoxby, 1998; Borjas, 2004; Shih, 2016a). We arenot aware of any studies that have examined impacts on intensive-margin outcomes in college.
4Recent statistics show that nearly 40% of foreign bachelor’s recipients major in STEM, whilethe comparable figure for natives is only 31%. See NSF Science and Engineering Indicators 2012:https://www.nsf.gov/statistics/seind12/c2/c2s2.htm
4

tionally, satisfying at least one of these introductory math courses is required for all STEM majors,and even several non-STEM majors. Thus, any individual considering majoring in STEM musttake an introductory math course to keep the possibility of majoring in STEM as a viable option.Additionally, taking one of these courses also satisfies a university-wide quantitative course re-quirement. Therefore, in our data, 70% of all students take one of these classes at some pointduring their studies.5
We limit our main analysis to native freshmen in their first term of enrollment to reduce thepotential for selection bias and limit the potential for foreign peer exposure in prior college courses.First-term freshmen students register during the summer before their first fall term, making itdifficult for them to gain knowledge of the composition of particular classes as they fill up. Foreach course taught by a specific professor in a given term (“class”), we measure the compositionjust prior to the first day of instruction to ensure the rosters do not reflect withdrawal or additionsto the class after students have had a chance to observe their peers .
Our identifying variation exploits changes in the foreign share within courses taught by thesame instructor/professor over time.6 Our motivation follows from the ideal experiment, whichwould hold fixed the instructor and course, in addition to all other factors, and only vary the shareof foreign peers. The data exhibits substantial variation in the foreign share within course-professorpairs. Endogenous selection within course-professor pairs could manifest in students waiting totake an introductory math course with a particular professor when the class peer composition ispreferable. However, new students are unlikely to reliably predict when a particular professor willteach a particular course in the future. Professors themselves are often not informed of futureteaching assignments until late in the term prior.
We test for selection into these courses by regressing the foreign class share on individualbackground characteristics, including race, gender, and ability measures. These checks show noconsistent evidence of selection and support the notion that the variation in the foreign share withincourses taught by the same instructor is as good as random. Additionally, because introductorymath classes have high enrollment caps that never bind, our estimates are not confounded bymechanical crowd-out, whereby the entry of foreign students prevents some native students fromregistering for the class. Further, our estimates remain robust when controlling for bias arisingfrom contemporaneous shocks, such as increases in class size associated with more foreign peers.
We find evidence that foreign peers lower the likelihood of graduating with a STEM major.
5The remaining 30% that do not ever take one of these classes are very likely to be “never-takers”, who knowearly-on that they have no desire to major in STEM. They satisfy the quantitative course requirement through anotherclass (e.g. Statistics).
6Similar identifying strategies that rely on idiosyncratic variation include Carrell and Hoekstra (2010), Hoxby(2000) and Anelli and Peri (2016)
5

A 1 standard deviation increase in the foreign share in the introductory math class reduces theprobability of graduating in STEM by roughly 3 percentage points, or 6% of the mean. This impliesthat for an average-sized class, an additional 9 foreign students displaces 3.7 native freshmenfrom graduating with STEM majors. This finding is stable across various levels of controls androbustness checks. A placebo test assures foreign peer effects come from exposure in introductorymath courses, and not in other classes.
Natives displaced from STEM ultimately graduate with Social Science majors. We find littleevidence of students switching to Arts & Humanities majors, or dropping out. To better charac-terize the nature of switches away from STEM majors, we link measures of expected earnings toeach individual’s major at graduation. Analyses which use major-specific expected earnings as theoutcome indicate that native students are not displaced into lower paying majors–they appear to bechoosing Social Science majors that have equal earning power relative to the STEM majors theyleave. Thus, although foreign peers displace natives from STEM, they do not appear to affect theirearnings prospects.
Additional analyses do not indicate any impacts on immediate, short-term outcomes such asthe likelihood of withdrawing from the course, or introductory math grades. Dynamic analysisreveals that much of the formal transfer from STEM to Social Sciences majors takes place duringthe 2nd and 3rd years of college.
Further, the major choices of foreign students do not appear to be impacted by higher exposureto foreign peers. Results suggest that foreign students pursue STEM degrees at the same rate,irrespective of foreign peer composition. Thus, the displacement we observe for native studentsis not offset by an increased likelihood of foreign students persisting in STEM. This suggests thatan increase in the presence of foreign born students in the classroom might reduce the aggregatenumber of STEM graduates.
We explore several potential mechanisms to explain our findings. First, foreign students mayalter natives beliefs over their comparative advantage. We measure comparative advantage of eachindividual in STEM and non-STEM majors by comparing their baseline ability in STEM relativeto non-STEM, against the average STEM to non-STEM ability of peers in their cohort. To proxyfor STEM and non-STEM ability, we utilize individual SAT math and verbal scores, which havebeen shown to be good predictors of STEM and non-STEM major choice (Turner and Bowen,1999). Analysis along the dimension of comparative advantage indicates the native students mostaffected are those with very low comparative advantage in STEM majors. Natives with middle tohigh values of comparative advantage in STEM do not appear to be affected. These results areconsistent with the notion that natives respond according to comparative advantage.
Second, we find evidence that the low English proficiency of foreign peers may generate lin-
6

guistic dissonance that negatively affects the learning environment. When classes have a largeshare of students who cannot effectively communicate in English, this may reduce the scope forpositive externalities that arise from peer-to-peer or peer-to-instructor interactions. Furthermore,instructors may have to slow instruction to accommodate non-fluent students. We examine whetherlinguistic dissonance may be an underlying mechanism by assigning each foreign peer a measureof the linguistic distance of the predominant language spoken in their home country from Englishfrom Chiswick and Miller (2005). Results indicate that exposure to foreign peers whose nativetongues are very distant from English has a larger impact on displacement. Foreign peers whosenative tongues are more similar to English, however, still have a negative and statistically signifi-cant impact on the likelihood of majoring in STEM.
Finally, the granularity of our data reveals two very different types of foreign students. In-formation on student visas allow us to separately identify international students from immigrantstudents, which include permanent residents, foreign-born U.S. citizens, and undocumented in-dividuals. Descriptive statistics indicate that although their composition in terms of countries oforigin is similar, international students are very highly selected, exhibiting background ability mea-sures that are even higher than native students. Exploring heterogeneous impacts between thesetwo types of foreign peers informs current issues surrounding rising international student enroll-ment. We find that international students actually increase the probability of STEM completion.Immigrant students are the group driving the overall negative impacts on native STEM completion.
We proceed by describing the institutional setting and our data in the next section. Section3 details our empirical framework and provides tests of selection on observables. Results androbustness checks are presented in section 4. Section 5 describes and tests various mechanismsunderlying our main findings. Section 6 concludes.
2 Data
2.1 Institutional Setting
This paper uses administrative student records from a public, land-grant university in California.This university has current enrollment over 30,000, roughly 80% of whom are undergraduates. Theinstitution can be characterized as a selective, Research I university that ranks consistently amongthe top 20 public universities in the U.S. Average SAT scores of incoming students are higher thanthe national average, usually by at least one standard deviation.
This university, like many postsecondary institutions, offers a wide variety of fields of studyculminating in over 100 different undergraduate majors. Each year roughly 7,000 students earn
7
bachelors degrees, with half of the top 20 most popular majors in STEM, such as Biology, Chem-istry and Mechanical Engineering. Students are required to declare a major by the time they havecompleted an amount of units roughly equal to two full-time years of course work. While studentshave flexibility in switching majors, institutional rules impose some costs–students must obtainapproval from an advisor in the major they wish to leave and from an advisor in the major theywish to join.
We focus on introductory math courses, which we define as the set of math courses that arelisted as satisfying a university-wide quantitative course requirement and also satisfy mathemat-ics prerequisites required for STEM majors (see Table 1). All students, regardless of major, mustsatisfy a quantitative course requirement. While the list of eligible courses mainly comprises ofcalculus based math courses, it also includes some statistics and other math-intensive courses.All STEM majors, and some non-STEM majors, require the completion of at least one introduc-tory math course. Many departments advise students to take introductory math in their first term.Hence, these courses do not have college-level course prerequisites, that would prevent first-termfreshmen from enrolling. Taken together, these factors help generate large enrollment in introduc-tory math courses. Approximately 70% of all students in our data take an introductory math courseat some point during their undergraduate studies.
As can be seen in Table 1, the set of courses focuses on the fundamentals of calculus, althoughthere are a few exceptions of more advanced courses on the list (e.g. Differential Equations, Vec-tor Analysis). A majority of the native-born freshmen in our sample take one of the more basiccourses (Precalculus, Calculus I, Calculus for Scientists, and Adv Calculus: Intro) as their firstmath course. These courses are large, with average enrollment around 230 students. Importantly,they are structured with a very high enrollment cap which never binds. In our sample, introductorymath courses never exceed 40% of the cap. Thus, students cannot be mechanically crowded-out ofclasses when more foreign students enroll.
The academic calendar follows a trimester schedule, with instruction occurring over three terms(fall, winter, and spring). Students enroll in courses with specific instructors, and accumulate cred-its upon successful completion at the end of each term. Within each entering cohort, approximately50-60% of students graduate within 12 terms (4 years), 70-80% in 15 terms (5 years), and 80-85%in 18 terms (6 years).
The registration process for first-term freshmen is distinct from the process for all other stu-dents.7 The university organizes several optional orientations for new students in the summer prior
7Non-freshmen students register for courses online in the prior term (or in summer for the fall term). Registrationdates and times are allotted to students as follows. Students are divided into 4 bins according to accumulated creditsnormal for freshmen, sophomores, juniors, and seniors. Registration occurs according to bin rank–students in thesenior bin register first, followed by the junior bin, followed by the sophomore bin, and finally the freshmen bin.
8

to their first term. During each orientation, advisers assist first-term freshmen in planning theircourse of study and registering for classes. Students attending earlier orientations, therefore, reg-ister before students attending later orientations. Students that do not attend orientation ultimatelyregister online, but receive information through the mail intended to assist in course planning andregistration. The non-binding high cap, however, means that students registering earlier do nothave a better chance at enrolling in a given introductory math course taught by a particular instruc-tor than those who register later.
2.2 Sample Construction
The administrative data contain all course registration activity for each student, which we use toconstruct rosters for each introductory math class, identified by the course, instructor, meetingtime and term offered. We reconstruct the rosters just prior to the first day of instruction forthe term. As such, they reflect the course composition before students have met the professor,examined the syllabus, or been physically present in the class with other students. Continuedregistration activity beyond the first day of instruction also identifies whether students add or dropthe course. Registration records are then matched with student background characteristics (e.g.gender, ethnicity/race, nativity, high school GPA, etc.) and outcomes (e.g. course grade, graduationin STEM major, etc.). Finally, instructor/professor identifiers are linked to the courses in each termfrom online catalogs.
We measure each individual’s major at graduation, which provides a more definitive measureof both choice and skill acquisition. To students who graduate we assign one of three completionoutcomes – graduation with a STEM degree, Social Science degree, or Arts & Humanities degree.Because upwards of 80% of students complete the degree within 6 years (18 terms), we measuregraduation outcomes within 6 years. We refer to those that do not complete within 6 years asdropouts, however a small number may take 7+ years to graduate. Because the data on studentoutcomes ends in 2012, the fall 2006 entering cohort is the last one for which we can observe 6 yeargraduation outcomes. As such we limit the analysis to new freshmen enrolled in an introductorymath course in fall 2000 through fall 2006. In total our sample consists of 16,830 first-term nativefreshmen.
Students are identified as foreign or native according to their country of origin. Foreign peerexposure is measured within classes. The class is a natural unit where peer interactions mightoccur as students attend lectures in the same physical location at the same time, receive the same
Within each bin, however, students are randomly assigned a registration date and time. Thus, while a junior willalmost certainly register before a sophomore, there is no guarantee ex-ante that one sophomore will register beforeanother sophomore.
9

instruction, are given the same assignments, take the same exams, and are evaluated jointly by theprofessor.8 We adopt a standard peer measure by calculating for each native student the fractionof peers in their introductory math course that are foreign. Foreign students need not be first-termfreshman to be counted in our peer measure.
Table 2 shows summary statistics of student background characteristics. Column 1 and 2describe all native and foreign students enrolled during the period under analysis (2000-2006).Column 3 describes native first-term freshmen in introductory math courses, which represent theprimary group we are interested in. Column 4 displays statistics for foreign-born peers in theintroductory math courses of native first-term freshmen.
While 56% of all native students are female, only half of first-term native freshmen that enrollin introductory math courses are female. The same under-representation in the introductory mathsample relative to their presence in the overall population is evident for native White and minority(Black and Latino) students. In contrast, native Asians appear to possess a strong predilection fortaking introductory math courses early on. While Asians comprise only 37% of all natives, theyrepresent roughly half of all native first-term freshmen enrolled in introductory math courses.
A very similar pattern is observed for foreign students. A large distinction is that the vastmajority of all foreign-born students are Asian. Nearly 80% of foreign students in the introduc-tory math sample are Asian. The next most populous race groups among foreign-born are Whitestudents, followed by Latino students. The predominance of Asian students likely reflect the largeimmigration patterns from Asian countries to California, combined with higher rates of educationalattainment for Asians overall.
Measures of background ability are provided in rows 7-11. High school GPA is measured ona scale from 0 to 4, SAT math and verbal scores range from 200-800, and the combined SATscore ranges from 0-1600. Also included is a composite score calculated by the admissions officethat is a weighted sum of various background ability and traits, which include some measuresavailable in our data and others that are not available. The academic composite index ranges from0-14,000. When comparing native freshman in introductory math courses to the general nativestudent population, it is clear that those taking math in their first term are more highly selectedon all ability traits. Thus, STEM majors appear to initially attract students of higher preparednesswho are willing to take the gateway math course right away.
Native and foreign students do not appear to be substantially different in terms of ability in thegeneral student population. One exception is that foreign students exhibit lower SAT verbal scores,
8In rare instances when a single professor teaches multiple sections of the same course in a given term, the studentsin different sections are treated as distinct peer groups. In the data, a professor teaches two sections of the same coursein the same term 6 times out of 181 different course-professor offerings.
10

reflecting the fact that many learn English as a second language and are less likely to be as fluentas natives. This difference in English ability is magnified when comparing native freshmen andtheir foreign peers in introductory math courses– foreign students SAT verbal scores are almost afull standard deviation below that of native freshmen. The fact that foreign students in introductorymath courses exhibit lower SAT verbal scores than the overall foreign student population indicatesthat introductory math courses likely draw interest from those with a comparative advantage inquantitative analysis. Though differences in SAT verbal are the most salient, native freshmenoutperform foreign students on all measurable ability traits.
A particular advantage of our data is that it contains information on visa status and countries oforigin, allowing us to explore heterogeneity among the foreign student population. We distinguishbetween international students on temporary visas and other foreign born students (“immigrants”),which include legal permanent residents, those with U.S. citizenship, and undocumented students.9
This allows us to inform recent debates surrounding surges in international student enrollment,whereby significant controversy has led some college campuses to propose caps on the numberof international students admitted. Furthermore, assessing difference between international andimmigrant students is particularly important for federal immigration policy, as there are currentlyno caps on student visa issuance.
Columns 5 and 6 of Table 2, reveal sizable heterogeneity between international students andimmigrant peers in introductory math courses. First, international students only account for 11%of foreign peers, with immigrants comprising the majority. Second, the lower ability of foreignpeers relative to native freshmen is driven by immigrant students. In contrast, international stu-dents appear at least as well prepared as native freshmen, and possess an absolute advantage inquantitative ability, as their SAT math scores exceed those of native freshmen by almost 0.5 ofa standard deviation. While the majority of foreign students are immigrants, these distinctionsare suggestive of potential differing impacts of immigrants and international student peers in theclassroom. While later analysis explores these differences, we acknowledge the small number ofinternational students in our sample is limiting.
Table 3 summarizes the key outcomes of interest for students in introductory math courses. Thetop panel provides completion outcomes. Approximately 82% of entering native freshmen grad-uate within 6 years, whereas 18% dropout or take greater than 6 years.10 While natives graduatewith an average GPA of 3.05, foreign students perform slightly lower. Students that graduate take
9Unfortunately, our data do not allow us to distinguish further between foreign-born permanent residents, citizens,and undocumented students. However, it is unlikely that the foreign peers we study contain many undocumentedimmigrants as much research has shown that undocumented persons disproportionately come from South and LatinAmerica, with very few from Asia.
10For ease of exposition, we refer to these students throughout as “dropouts”.
11

slightly more than 16 terms, or 5.33 years to complete their degree.STEM is the most popular major at graduation for natives taking introductory math as first-
term freshmen, with 48% of students going on to complete a STEM degree in 6 years. Almostone-third of native freshmen taking introductory math in their first term end up graduating with aSocial Science degree. Completion outcomes are similar for foreign born peers, although foreignstudents complete STEM degrees at a lower rate than natives. This suggests that if displacement ofnatives from STEM occurs, foreign students may not complete STEM degrees at equivalent ratesto make up for the decline in native STEM majors.
Differences in graduation outcomes across groups can partially be explained by observing tran-sitions between majors, measured by comparing a student’s first declared major with their majorat graduation. For example, if the first declared major is STEM, and they graduate with a SocialScience major, they are considered to have made a STEM to Social Science transition. If they donot graduate within 6 years, they are considered to have dropped out. As our focus is on switchesout of or into STEM, we only show these transitions. Statistics on transitions appear in the bottompanel of Table 3. Among students who declare STEM as their first major, only 43% end up com-pleting a degree in STEM, indicating large attrition. Attrition appears slightly larger for foreignstudents. Regardless of nativity, most students who leave STEM majors end up switching towardsSocial Science and dropping out. A very small fraction of students switch to Arts & Humanitiesmajors. Additionally, a very small fraction of individuals ever make a transition from a non-STEMmajor to a STEM major, potentially indicating high costs of delaying pursuit of STEM degrees.
3 Idiosyncratic Variation
Our empirical approach addresses traditional concerns arising from the estimation of peer effectswith minimal assumptions. In particular, three key issues need to be addressed: selection, commonshocks and reflection (Manski, 1993; Sacerdote, 2011). Selection into or out of classes based onthe peer composition could generate significant bias. Unobserved common shocks within a classwould make it difficult to correctly identify the impact of foreign peers. The reflection problemconfounds estimates in instances when it becomes difficult to distinguish the impact of peers onthe individual, from the impact of the individual on peers. Our methodology addresses each ofthese issues.
Several features ensure our results are not driven by endogenous selection. As stated earlier,we examine the outcomes of natives who take introductory math courses as first-term freshmen.New freshmen, by definition, do not have actual prior educational experiences at the university.Hence, when registering for courses during the summer prior to arriving on campus, they are
12

unlikely to possess sufficient knowledge about the likely composition of peers required to engagein endogenous selection. Additionally, we measure the peer composition of students registeredfor each course, just prior to the first day of instruction. Thus, we measure foreign peers beforestudents ever physically attend a class.
This approach does not completely guard against selection. For example, highly motivatedstudents may be able to obtain partial or full information on the peer composition of classes beforethe first day of instruction. To further mitigate selection, we utilize variation in the foreign studentcomposition within courses taught by the same professor over time. This provides credibly exoge-nous variation in the foreign share, as selection would have to occur within course-professor pairsacross terms. This is highly unlikely as instructor assignments to courses are decided only in themiddle of the prior term, so that at the start of each term, instructors themselves are not aware ofwhat their teaching assignments will be in the future. Furthermore, a student’s ability to predictpeer composition in future courses taught by a particular instructor is quite limited.
It is useful to visually depict the type of variation we utilize. Figure 2 displays histogramsillustrating the overall variation in the foreign share across the introductory math classes. While theforeign share ranges between 8-15%, some classes have less than 5%, and a few have greater than20%. Figure 3 shows the identifying variation we isolate for the analysis. Each point represents theforeign composition within a particular introductory math course taught by a particular professor.The lines linking the points allows tracking of course-professor pair over time. To allow for visualclarity, we provide a random sample of 10 professor-course pairs.
There is sizable variation over time within course-professor pairs. While some professors teachin most fall terms, some only teach sporadically. The figure also helps exemplify the experimentwe have in mind. The dashed line displays the foreign share within a specific course-professorpair. This course-professor pair was only offered 4 times in our data – in the fall term of 2003,2005, 2006, and 2008. Our analysis compares the outcomes of the native first-term freshmanwho happened to enroll in course-professor pair A, against the outcomes of the native first-termfreshman who enrolled in course-professor pair B. While the native student in A was exposed to anenvironment containing 6% foreign students, the native student in B enrolled in a class where 16%of her peers were foreign. These two native students took the same course (introductory calculus),with the same professor, but by virtue of entering the university and enrolling in introductory mathin different terms, they were exposed to very different levels of foreign peers. We argue that thedifferences in the class compositions of A and B are driven by random fluctuations, and that thenative freshmen in the two classes are comparable.
We empirically test the validity of our identification by examining whether natives who take thesame course-professor pair, but experience varying levels of foreign peer exposure, are different
13

along observable characteristics. By analyzing whether native student background characteristicscorrelate with the foreign peer composition, we directly evaluate whether selection on observablesis apparent. Although we only focus on the outcomes of native first-term freshmen, the test forselection is more demanding in the sense that we must test for selection across all native studentsin the class. Even if native first-term freshmen do not engage in selection, the selection of othernative students due to foreign peer exposure would complicate the analysis. Endogenous selectionof other native students could alter the composition of other peer characteristics within the class,which would then also affect our observed outcomes.
To check selection on observables, we estimate the following regression model:
Ci = α + δFcpt
Tcpt − 1+ σct + σcp + εicpt (1)
Equation 1 regresses individual background characteristics of native student i (Ci), on the share ofi’s peers that are foreign in the course ( Fcpt
Tcpt−1). To allow the identifying variation to come from
changes in the foreign share within courses c taught by the same professor p across terms t, themodel includes course-by-professor fixed effects σcp and course-by-term indicators σct. Standarderrors are clustered at the professor level. The foreign peer share is standardized, so that thecoefficients reflect the impact of a one standard deviation increase in the foreign share.
The results of these tests are displayed in Table 4. Each column corresponds to a regressionof Fcpt
Tcpt−1on a different individual background characteristic (Ci).11 The coefficient estimate in
column 7, for example, indicates that a one standard deviation increase in the foreign share is asso-ciated with an increase in a native student’s SAT math score of 1.76 points (only 0.02 of a standarddeviation in the same score). Given the mean SAT math score is 618 and a standard deviationis 75 points, this estimate is thus economically insignificant. None of the estimates are statisti-cally distinguishable from zero at any meaningful level of confidence, nor are they economicallysignificant. Thus, the results do not provide any consistent evidence of selection on the basis ofobservable background characteristics. To further limit the scope of potential selection bias in ouranalyses of outcomes, we will include these individual background characteristics as controls tocheck whether their inclusion alters the estimated effects.12
11The sample of 25,912 include both the 16,830 native first-term freshmen, and other native students (e.g. sopho-mores, juniors, and seniors) enrolled in the introductory math courses.
12We also check whether foreign students are selecting on observables based on the foreign peer composition inappendix Table A1. In Table A1, the same ten specifications as Table 4 are estimated, but instead focusing on the 3,840foreign students taking an introductory math course. Out of ten coefficients, only SAT Verbal is significantly differentfrom zero. A one standard deviation increase in foreign peers in a class is associated with a 14 point lower SAT Verbalscore. Despite the statistical significance, the magnitude is relatively small (one-tenth of a standard deviation), suchthat we do not believe this small amount of selection is evident to students or making a meaningful difference in the
14

While selection appears unlikely, students taking the same class may be exposed to commonshocks that can affect outcomes. If these vary with the foreign class share, our methodologyrisks confounding such shocks with the impact of foreign peers. For example, Ballatore, Fort andIchino (2015) finds that while inflows of foreign students in Italian primary schools raised thepeer composition within classes, they also increased class size. Because class size is an importantdeterminant of educational outcomes, failing to account for the relationship between foreign peercomposition and class size leads to invalid estimates.
Similar concerns are apparent with in our context. In particular, descriptive statistics in Table2 showed key differences in baseline characteristics between native freshmen and their foreignstudent peers. In particular, foreign students appear less prepared in terms of background abilitymeasures, and different in terms of racial composition. Thus, for example, increases in foreignpeers will mechanically lower the average SAT verbal of peers within the class. Since studies haveshown that peer ability or race can affect individual outcomes, the impact of foreign peers willbe commingled with potential impacts of peer ability or race. To account for potential changesin other classroom characteristics induced by foreign peers, our analysis will include controls forpeer background ability, race, and gender.
Lastly, reflection occurs when the peer characteristics being analyzed can potentially be influ-enced. For example, studies measuring the impact of high ability peers are at risk of problems dueto reflection if peer ability is measured as the average of peers’ test scores. Measuring peer abil-ity in this way makes it difficult to separate the impact of peers on individual test scores, and theimpact of the individual on peers’ test scores. Examining foreign peers has the advantage of beingimmune to reflection concerns. This is because nativity is an immutable characteristic. Nativeindividuals cannot affect the birth place of their foreign born peers.13
classroom environment.13Additionally, because native and foreign students are mutually exclusive groups, our analysis does not suffer
from more recent concerns of mechanical negative bias (e.g. Guryan, Kroft and Notowidigdo, 2009; Fafchamps andCaeyers, 2016).
15

3.1 Empirical Specification
To estimate the impact of foreign peer exposure on the graduation majors of natives, we estimatea linear probability model14 which captures the elements described earlier,
Yicpt = α + βFcpt
Tcpt − 1+ σct + σcp + γ1Xcpt + γ2Xi + εicpt (2)
Equation 2 regresses individual outcome (Yi) on the share of individual i’s peers that are foreign( Fcpt
Tcpt−1). We control for course-by-term indicators (σct) and course-by-professor fixed effects (σcp).
The empirical design therefore forces the identifying variation to come from changes in the foreignshare within courses c taught by the same professor p over time t. An example of a violation of thisstrategy would be if high ability natives waited to take a course with a professor when the foreignshare was low. The evidence provided earlier suggested this behavior to be unlikely.
The empirical design will also include course level controls, Xcpt, to account for potentiallyendogenous common course level shocks. Our baseline specification controls for peer ability,which include average peer SAT Math, SAT verbal, and high school GPA, and average peer raceand gender composition. As discussed earlier, these peer composition controls help account forany confounding shocks that are concomitant with changes in the foreign share. In more saturatedspecifications, we control for class size, and also individual characteristics (Xi), which include therace, gender, and ability variables described in Table 2.
Finally, εicpt is a mean-zero error term. We cluster standard errors at the professor level. Wealso standardize the foreign share so that the primary coefficient of interest β can be interpreted asthe impact of a 1 standard deviation increase in the foreign class share on the outcome, in units ofY .
4 Results
Table 5 shows the effects of foreign peers in introductory math courses on the eventual completedmajors of native first-term freshmen, from Equation 2.15 The outcome variable is a dummy vari-able equal to 1 if the student graduated with a STEM major within 6 years from the first term of
14We performed robustness checks using logit and probit to evaluate the assumption of the linearity of the con-ditional expectation function. Results from logit and probit estimation, reported in the appendix tables A2 and A3,reveal that marginal effects are very similar in size to estimates from OLS, and consistent across the distribution of theforeign share. However, several papers (e.g. Greene, 2004) have shown that using logit or probit estimation with fixedeffects can lead to biased and inconsistent results. Hence, we present our analysis using a linear probability model.
15Among the various control variables used, we only report coefficients for peer ability measures due to spaceconstraints. Results of the coefficients on other control variables are available upon request from the authors.
16

enrollment, and 0 otherwise. Column 1 includes the baseline peer ability, peer race and gendercomposition controls. Column 2 further includes a control for course size. Column 3 adds in in-dividual characteristics as controls. All models include course-by-term and course-by-professorfixed effects.
The coefficients estimates in the first row indicate that foreign peers are negatively associatedwith the likelihood of completing a STEM major. Looking across the columns, the finding isessentially unchanged. A 1 standard deviation rise in the foreign class share lowers the probabilityof graduating with a STEM major by 3 percentage points, on average. All estimates are statisticallysignificant at the 5% level. The coefficient estimates are roughly 6% of the mean STEM graduationrate of 48%. By way of comparison, the difference in STEM graduation rates between White andBlack students (White-Black STEM gap) is around 6 percentage points, while the STEM gapbetween males and females is 14 percentage points.16 Thus, our effects are equal in size to 1/2 ofthe White-Black STEM gap and 1/5th of the STEM gap across genders.
The average course size of introductory math classes is approximately 230 students. If thiscourse had the average foreign share (approximately 13%) and the average share of native first-term freshmen (approximately 56%), it would comprise of roughly 30 foreign students and 129native freshmen. Assuming native freshman students would graduate in STEM at the mean rate of48%, then we would expect 62 of these native freshmen to go on to complete STEM degree. A onestandard deviation increase in foreign peers, roughly 9 additional foreign students, would yield anexpected displacement of 3.7 native student from STEM.17
The coefficients on peer controls show that the probability of graduating with a STEM major ispositively correlated with peer SAT math and negatively correlated with peer SAT verbal and HighSchool GPA. This is consistent with empirical evidence showing that verbal test scores consistentlyappear with a negative sign in regression models of labor market outcomes that include mathtest scores (e.g. Sanders, 2015). As pointed out by Altonji, Arcidiacono and Maurel (2016), anexplanation for this pattern is that conditional on SAT math, higher SAT verbal is associated withpreferences for majors that pay less, but provide better non-monetary characteristics (e.g. moretime flexibility) - typically the non-STEM majors. A similar reasoning may also be valid for peerhigh school GPA, with those peer students having a higher GPA conditional on SAT math scorepreferring non-STEM majors.
16Data from the National Science Foundation show that the share of bachelors’ degrees earned by White stu-dents that were in STEM fields was roughly 17% in 2011. The same share for Black students was 11%. The maleSTEM graduation rate in 2011 was 25% compared with only 11% for females. See the https://www.nsf.gov/statistics/seind14/index.cfm/chapter-2/c2s2.htm#s2.
17Multiplying 0.06 times 62 (the number of natives expected to graduate in STEM) yields approximately 3.7 nativesdisplaced from STEM.
17

Column 4 provides a further test to ensure our foreign peer impacts are identified from exposurein introductory math courses. We include the foreign peer composition across all other classestaken by native first-term freshmen, excluding the introductory math class, as a control. The resultsare virtually unchanged. This indicates that the transmission of foreign peer impacts on STEMmajor choice occurs within introductory math classes, as opposed to in other courses.
Given that native freshmen appear to be displaced from STEM, we assess whether foreignstudents are also displaced to understand if foreign peers are impacting total number of STEMmajors. Table A4 replicates Table 5, but examines the outcomes of foreign students. Results inall specifications are insignificant, suggesting that foreign students do not respond to increasedexposure to foreign peers. Thus, the displacement we observe for native students is not offset byan increased likelihood of foreign students persisting in STEM.18 As a result, we should expect thetotal number of STEM graduates to decline with the share of foreign-born students in the class.
In Table 6, we examine what outcomes displaced natives are pushed towards.19 We utilizeour preferred specification from column 3 of Table 5, which includes all peer composition andindividual level controls, which is reprinted in column 1. Columns 2 and 3 examine the likelihoodof completing a Social Science degree and Arts & Humanities degree, respectively. Column 4examines the likelihood of dropping out, where the outcome is an indicator equal to one if thestudent failed to graduate within 6 years.
The estimates show that the decline in graduating with a STEM major is offset by similarincreases in graduating with a Social Science major. A one standard deviation increase in foreignpeers is associated with a 2.2 percentage point increase in the likelihood of graduating with a SocialScience major. The coefficients on graduating in Arts & Humanities and dropout are positive, butmuch smaller in magnitude. None of the coefficients, however, are statistically significant.
In columns 5-8 of Table 6 we estimate the implications of this displacement from STEM onearning potential. The aggregation of outcomes into four groups (STEM, Social Science, Arts &Humanities, Dropout) masks heterogeneity within STEM and non-STEM majors, and potentiallyimportant margins of adjustment. For example, a native may be displaced from a high earningSTEM major to a very low earning Social Science major or vice versa. Given that the students inthe sample comprise over 100+ different majors, separate analysis for each STEM or non-STEMmajor is not feasible. Instead, we utilize the expected earnings associated with each major, whichprovides a sufficient statistic for much of the relevant qualities and characteristics of majors.
18Due to no apparent “own” effect of foreign share on the likelihood of foreign students persisting in STEM in anyof our specifications, we focus analysis and additional specifications on native students. Additional specifications forthe foreign-born population are available upon request.
19In appendix Table A5 we show robustness checks for controlling for the foreign peer share in non-math coursestaken by the native first-term freshmen.
18

For each native student, we link their major at graduation to measures of the average expectedearnings for that major. These measures are provided by the Hamilton Project (Hershbein andKearney, 2014) and estimated using American Community Surveys data. Data include estimatesfor initial earnings, earnings at 6, 11-15, and 26-30 years after graduation. Dropouts are assignedthe average earnings of students with some college who did not complete a degree. We then regressthese earnings measures for natives on their foreign peer exposure in introductory math courses.
The results on earnings are negative in sign, but statistically indistinguishable from zero. Fur-thermore, they appear economically significant. For example, the estimate in column 5 indicatesthat a one standard deviation increase in the share of foreign peers is associated with a decrease ininitial earnings of $95 against a mean of $23,230–less than 0.5%. 20 The estimates on longer-runexpected earnings are larger, but remain roughly equal to 1% of the mean. Our findings suggestthat displaced students are leaving relatively low earning STEM majors, choosing relatively highearning non-STEM majors, or a combination of the two.
Next, we examine when student’s movement away from STEM majors occurs. For each na-tive student, we observe their reported majors term-by-term. We group these majors into fourcategories: STEM, Social Science, Arts & Humanities, or Undeclared. For each term, we createdummies indicating whether a native student declared a major in one of these categories. We thenestimate equation 2, replacing the dependent variable with term by term major dummies.21 Thecoefficients are then displayed in Figure 4. The vertical axis measures the coefficient estimate (i.e.the impact of a one standard deviation increase in foreign peers), and the horizontal axis measuresthe term of enrollment, where 1 represents the first term, 2 represents the second term, and so on.Since our main results are for completion within 6 years, we perform this analysis for 6 years (18terms).
The figure shows native students begin to choose STEM majors with lower probability in their6th-11th terms. The decline in STEM major choice is offset by increases in the likelihood ofdeclaring Social Science majors. While native students are exposed to foreign peers in their term1 math class, the likelihood of choosing Social Science majors does not increase until the 6th term(end of the 2nd year). This lag may in part be due to bureaucratic costs associated with changingmajors. This delayed switching may also be indicative of the cumulative nature of changing majors.While high foreign exposure is a contributing factor for deciding to avoid STEM majors, it might
20Alternatively, this magnitude represents 1.3% of the average earnings gap of STEM vs non-STEM majors (around$7000 annually at labor market entrance).
21To avoid compositional changes due to graduation or drop out, we use the following procedure. Each student’smajors are observed until the term they graduate or dropout. If a student graduates or drops out prior to the 18th term,we assign their final major to all terms after their last term until the 18th term. Thus, the estimated coefficients will beidentified only on individuals who either choose a non-STEM major, or switch away from a STEM major.
19

not be a relevant factor for deciding which alternative major to pursue. It could take several termsto search for the desired Social Science major and formally register in that major.
Table 7 examines more immediate, short-term outcomes to see if they shed light on why STEMdisplacement might be occurring. We first examine whether share of foreign peers impact thelikelihood native first-term freshmen withdraw from the course after the first day of instruction.Positive effects would indicate that students select out of math very soon after meeting their peers.Column 1, however, indicates there is no effect of foreign peers on the likelihood of withdrawingfrom the course.22
Column 2 shows no impact of foreign peers on introductory math grades received by nativefirst-term freshman, conditional on remaining in the class. Grades have been standardized to havemean of zero and standard deviation equal to one within courses. In Column 3 we consider impactson end of first-term GPA. The point estimate on GPA is positive and marginally significant, butrelatively small in magnitude.
One potential explanation for these two results is native students marginally shifting effort awayfrom introductory math and towards their other classes. On average, foreign students are negativelyselected in math courses (see Table 2). Under curved grading, a higher share of foreign peers mightallow a native student to achieve the same grade with less effort. After receiving a signal of theirgrade (e.g. a first midterm), students may then substitute effort towards other courses. However,there might be a number of possible mechanisms, and our data do not allow us to examine them,so this explanation is speculative.
Columns 4-6 explore near term progression in STEM, and avoidance of foreign students.Columns 4 and 5 evaluate whether foreign peers in introductory math affect the likelihood na-tive freshmen take another math course or STEM course, respectively, in the following term. Theresults do not indicate any near term impacts on STEM progress.23 Column 6 examines whetherthe share of foreign peers in introductory math is related to the share of foreign peers among allclassmates in the following term. If native students attempt to avoid foreign students, this mightexplain their movement away from STEM fields. The findings, however, do not indicate any avoid-ance behavior.
Overall our findings indicate that foreign peers displace natives from STEM. As a result, na-tives appear to switch to Social Science. However, native students appear to be choosing SocialScience majors that possess equally high earning power relative to the STEM majors they aban-don. Analysis of immediate outcomes do not reveal any detectable contemporaneous impacts that
22In specifications not shown, we also separately examined immediate withdraws (one week or less into a course)and late withdraws (likely after receiving graded work) and found no significant effects.
23This is consistent with the dynamic results of Figure 4, which shows the formal declaration of non-STEM majorsdoes not begin to appear until the end of the 2nd year.
20

might lead to discouragement from STEM fields. Additionally, the increased likelihood of choos-ing Social Science majors does not occur immediately following the introductory math course, butinstead takes several semesters to materialize. Given these findings, we now explore the potentialunderlying mechanisms at work.
5 Exploring Mechanisms
Why do foreign students lead to lower STEM completion among natives? We consider hetero-geneity in the estimated effects and explore possible mechanisms underlying the results. Changesin native outcomes may be in line with responses along the basis of comparative advantage. Sim-ilarly, the lower English language ability of foreign students may alter the learning environment.Such mechanisms are not mutually exclusive and may operate contemporaneously. We explainthese hypotheses in greater detail, and perform empirical analyses to test the prevalence of thesemechanisms.
5.1 Comparative Advantage
The movement of native students away from STEM fields may be a response to changing com-parative advantage. Literature on the labor market impacts of immigration have found evidence ofnative adjustments based on comparative advantage. For example, immigration that reduces nativecomparative advantage in manual and quantitative tasks leads natives to move towards occupationsrequiring more communication-intensive skills (Peri and Sparber, 2009, 2011). Within the contextof higher education natives who originally thought of pursuing STEM fields might update theirchoice when exposed to many foreign students with comparative advantage in STEM.
The summary statistics suggest that foreign peers may indeed possess a comparative advantagein STEM fields. Their relative SAT Math to Verbal score is higher than that of native freshmen.Given that SAT Math and Verbal scores have been shown to be decent predictors of STEM andnon-STEM major choice (Turner and Bowen, 1999), we believe relative scores are a good proxyfor comparative ability in STEM and non-STEM fields. This feature is unlikely to be institutionspecific – foreign-born college educated individuals in the labor market are highly over-representedin STEM fields and STEM majors (Gambino and Gryn, 2011; Peri, Shih and Sparber, 2015).
If comparative advantage is an underlying mechanism, one would expect to see strong re-sponses among native students who are marginal. Native students who originally possess verystrong comparative advantages in STEM fields are unlikely to change their choice of major givenexposure to many foreign peers. In contrast, those natives who possess middle-to-low compara-tive advantage in STEM fields are the ones who should be changing to non-STEM majors. Thus,
21

analyzing differential impacts on natives based on comparative advantage in STEM fields shouldserve as a test of this mechanism.
We empirically assess this idea using a local linear regression. We define a measure of compar-ative advantage in STEM for each native student using their SAT Math and Verbal scores relativeto the average SAT Math and Verbal scores of all the peers in their cohort, and regress STEM grad-uation on the share of foreign peers at each percentile.24 Figure 5 plots coefficients from our mainspecification, and shows that students with low comparative advantage in STEM (low percentiles)experience strong displacement from STEM. The bottom third of students have an average coef-ficient of -0.07, while for the top third it is -0.02. Consistent with comparative advantage drivingspecialization, the students most at risk are those with the highest relative ability in non-STEMfields.
We also consider whether students respond to absolute advantage. To measure absolute ad-vantage, we estimate the ex-ante likelihood that a student will end up a STEM major. We regressSTEM graduation on all background characteristics (gender, race, SAT, etc.) and year fixed ef-fects. We then use the regression coefficients to predict each student’s likelihood of graduatingwith a STEM major. Our measure is relatively simple, but represents the type of prediction policy-makers or education administrators may use when trying to determine what factors lead to STEMpersistence.
The bottom panel of Figure 5 presents local linear regression estimates based on absolute ad-vantage. There is little difference in the effect for natives with high and low absolute STEM ability.All point estimates are contained within the confidence interval for all others. Using this measure,we cannot reject that students are equally displaced from STEM.
5.2 Linguistic Dissonance
Though our data comes from a single university, national studies have similarly concluded thatforeign-born college students overall appear to be negatively selected. In particular, foreign stu-dents lack English proficiency, come from low income backgrounds, require high levels of finan-cial assistance, and are likely to work part-time during college (Erisman and Looney, 2007).25 The
24To construct our measure of comparative advantage, we separately standardize students SAT math and verbalscores at the cohort level to have mean 0 and standard deviation of 1. Then, students are ranked based on the differ-ence in their standardized math and verbal test scores. Local linear regressions of Equation 2 are estimated at everypercentile using a one-standard deviation bandwidth and Epanechnikov kernel weighting. 95% confidence intervalsare constructed from 250 bootstrapped repetitions, sampled at the class (i.e. math lecture) level.
25An extensive report on foreign-born individuals in higher education (Erisman and Looney, 2007) found that 53%delayed entry into college after high school, 33% supported dependents, 66% indicated English was not their primarylanguage, and 62% were in the two lowest income quintiles.
22

lower levels of preparedness in foreign student populations are also evident prior to college, andhave motivated several studies examining the impacts of foreign students in primary education.26
A key feature of foreign students is their lack of English proficiency. A large presence ofnon-fluent speakers may foster linguistic dissonance within the classroom that could generate neg-ative peer effects in several ways. Limited English speakers may lead teachers to slow the paceof instruction (Diette and Oyelere, 2012). Similarly, if foreign students require more assistance,instructors may substitute time away from helping native students towards helping foreign students(Geay, McNally and Telhaj, 2013). Qualitative studies suggest that low English language ability,alongside other factors, may lead foreign students to be more reticent in class (e.g. Rodriguez andCruz, 2009; Stebleton, Huesman Jr and Kuzhabekova, 2010; Stebleton, 2011; Yamamoto and Li,2011). Lack of communication in class would reduce the amount of productive externalities thatarise when students ask each other for clarification, or when they ask the instructor questions.
Testing for linguistic dissonance requires measures of English language fluency. We proxyfor this by assigning a measure of language distance from English to each foreign student. Thisinvolves first identifying the national language of each country. Next, for each national language,we link in measures of linguistic distance from Chiswick and Miller (2005).27 We then assignlinguistic distance scores to foreign students according to their country of origin. Foreign studentsare then divided accordingly to whether their linguistic distance from English is above (“highdistance”) or below (“low distance”) the median score of all foreign students. We measure theshare of foreign peers with linguistic distance scores above the median, and below the median.These two different shares are used as explanatory variables in regressions, in place of the overallforeign share.
The results from this exercise are reported in Table 8 - Panel A. The displacement from STEMis larger for native students that experience increases in peers that come from countries whosespoken language is highly distant from English (“high distance”). A one standard deviation rise inthe share of peers from high distance countries reduces the likelihood of completing STEM majorsby 2.5 percentage points. An equivalent increase in peers from low distance countries only reduces
26Such studies include Gould, Lavy and Daniele Paserman (2009), Diette and Oyelere (2012, 2014), Ohinata andVan Ours (2013, 2016), Geay, McNally and Telhaj (2013), Brunello and Rocco (2013), and Ballatore, Fort and Ichino(2015).
27We utilize linguistic distance scores from Chiswick and Miller (2005). These range on a scale from 1 to 3,where 3 indicates languages close in proximity to English, and 1 indicates languages distant from English. While thedetails of how linguistic distance are described in Chiswick and Miller (2005), the measure is based on the difficultyan English speaker faces in learning the foreign language. We transform these to distance measures from English, byassigning English a value of 4 and subtracting the language proximity scores. Hence, our distance measure rangesfrom 0 to 3, with lower scores representing close proximity to English. Note that a score of 0 means that the primarylanguage of a foreign student’s country of origin is English. This occurs for countries such as Canada, the UnitedKingdom, and Australia.
23

the likelihood of completing STEM majors by 1.7 percentage points. However, despite being 50%larger in magnitude, the effects for high distance foreign peers are not statistically different fromthose for low distance foreign peers at conventional levels. Thus, the evidence provides somesupport for linguistic dissonance, though it is not definitive.
Note, however, that high distance foreign peers are positively and significantly associated withan increased likelihood of dropping out. Differently, low distance foreign peers appear to be push-ing natives towards Social Science. The association of high distance foreign peers with droppingout, and low distance foreign peers with Social Science majors, has implications for the impacts onexpected earnings. High distance foreign peers induce a reduction in expected earnings, explainedby the increase in the likelihood of dropping out. For low distance foreign peers, earnings esti-mates are actually (insignificantly) positive. This underscores that natives exposed to low distanceforeign peers are making relatively efficient major choices when it comes to earnings potential.
5.3 International Students vs. Immigrants
Though traditionally comprising a very small fraction of foreign-born students, recent surges ininternational students on temporary visas have generated substantial controversy. For example,facing backlash from increasing international enrollment, the University of California System re-cently proposed caps on international student admissions.28 Our data allow us to test whether inter-national peers have differential impacts than immigrant peers. Separately examining the impactsof these two types of foreign students is particularly relevant for policy, as the international studentvisa program remains uncapped, and recent years have seen unprecedented inflows of internationalstudents.
To test for differences between immigrants and international students, we split the foreignshare into two components: the share of peers that are immigrants and the share of peers that areinternational students. We then perform regressions of Equation 2, including both the immigrantshare and international student share, instead of the overall foreign share.29 The results, reportedin Table 8 - Panel B, reveal interesting heterogeneity.
Immigrants appear to be driving the displacement of natives from STEM majors. A one stan-dard deviation increase in immigrant peers lowers the probability of graduating with a STEM de-gree by nearly 5 percentage points. The displacement from STEM is entirely offset by graduationin Social Science.
28See http://www.latimes.com/local/lanow/la-me-ln-uc-limit-nonresident-students-20170306-story.html for fur-ther details.
29We also standardize the immigrant share and international student share, so that coefficients are can be interpretedas the impact of a 1 standard deviation increase.
24
The impact of international student peers on STEM completion is actually positive and sig-nificant. A one standard deviation increase in international student peers raises the likelihood ofgraduating in STEM by 1.5 percentage points. Recall from Table 2 that international studentspossess very high background ability relative to immigrant students, and also relative to nativefirst-term freshmen, which is especially salient in SAT Math scores. Thus, there might be pro-ductive externalities from students that particularly excel in math. However, the small number ofinternational students, and the small amount of variation they exhibit in the data prevent us fromexploring these avenues more deeply.
5.4 Other explanations
Overall the evidence provides support for comparative advantage and linguistic dissonance as pos-sible underlying mechanism. We cannot rule out many alternative mechanisms, such as instructoradjustments.30 We conclude our analysis with some interesting findings which may hint at potentialfurther mechanisms for future explorations.
Table 9 explores whether there are heterogeneous responses across different types of nativestudents. Much research on the gender gap in STEM education has uncovered various factors,such as confidence and role-models, as important for the retention of female students (e.g Gneezy,Niederle and Rustichini, 2003; Niederle and Vesterlund, 2007; Carrell, Page and West, 2010).We assess whether foreign peers may more strongly affect native females relative to males. Forexample, linguistic dissonance may more strongly deter females. In this sense, foreign peers mayexacerbate the gender gap in STEM. Columns 1 and 2, however, show that females are not stronglyimpacted by foreign peers. Instead, native males are the group that is negatively impacted.
In columns 3-5, we stratify on native students’ race/ethnicity. Similar to the gender gap inSTEM, the minority gap in STEM has also received much academic attention. Our results showthat foreign peers have strong negative impacts on non-minority groups (White and Asian). Incontrast, there is no detectable negative impact on minorities (Black and Latino). One interestinginsight is that foreign peers appear to have strong impacts on inducing native minorities to remainin school rather than dropping out. This leads to native minorities graduating in majors with higherexpected earnings, both in the short and long run. In contrast, the strong displacement of nativeAsian students from STEM results in movement towards Social Science, but also towards droppingout. This in turn results in significant negative impacts on expected earnings associated with theiroutcomes.
As a final check, Table A6 of the appendix examines the impact of foreign peers on future30For example, information on instructor evaluations would allow us to assess whether native students perceive
changes in instruction quality when the foreign peer share is high. Unfortunately, this data was unavailable.
25

social connections. Another potential mechanism could be that foreign peers alter the effort orengagement in a course, resulting in students being more/less likely to form social ties.31 Wegenerate a proxy measure for an individual’s social connections future terms, however, resultsfrom this exercise show negligible effects.
These interesting findings suggests possible alternative mechanisms at work. For example,it is possible that the presence of very low ability foreign peers provides a confidence boost forminority students. Alternatively, native Asian students may be particularly affected by negativespillovers if they are the group that interacts most often with foreign peers, which is possible giventhat 80% of foreign students are also Asian. The strong impact on males, rather than females,indicates some forces at work that have differential impact across genders. Finally, many of theseheterogeneous results may be explained by differences in preferences for foreign peers. We leavedeeper exploration of the mechanisms of foreign peer effects for future endeavors.
6 Conclusion
Disinterest in STEM throughout the education pipeline has been a great concern in the U.S. forseveral decades. At the same time, globalization has increased the number of foreign-born studentsin higher education institutions. This paper explores whether the rising presence of foreign-bornpeers can explain high native attrition rates from STEM majors in college.
Using administrative records from a large, selective public university, we find that higher ex-posure to foreign peers in the freshman first-term introductory math course reduces the likelihoodof eventually completing a STEM degree. Displaced natives adjust by moving to Social Sciencemajors. Additionally, we do not find strong evidence that foreign peers lead natives to switch toArts and Humanities majors, or drop out of college. In terms of future earnings, the displacementdoes not appear to substantially harm the native students. This suggests that displaced native stu-dents might be moving from relatively low-earning STEM majors to relatively high-earning SocialSciences majors.
Our results are identified from idiosyncratic variation in foreign peers within courses taughtby the same professor over time. Focusing on native first-term freshmen helps assuage selectionconcerns, as they register for classes in the summer prior to formally entering the college. We also
31Specifically, each course has several different registration numbers associated with it. For example, a math coursewith 200 students, has around 10 different “sections” of the math course, which denotes different teaching assistant forthe course. We measure the number of peers from introductory math that are enrolled together with an individual, notonly in the same course, but the same section in the following term. This measure is our proxy for social interaction,since two students in the same introductory math course registering for the same section the following term is lesslikely to have occur by chance than those same two students registering for the same course.
26

measure the class composition from registration records of students enrolled just prior to the firstday of instruction. This ensures the students in our class have not had the opportunity to observetheir peers and then withdraw. Balancing tests demonstrate that there appears to be little selectionalong observable characteristics. Results remain robust to controls for common shocks to classesthat might alter peer ability, peer race/gender, or class size. Finally, we show that findings are dueto exposure in introductory math classes and not other classes taken during the first-term.
To further elucidate these findings, we find evidence in support of two mechanisms that leadforeign peers to discourage natives from STEM. First, although foreign students appear absolutelyworse than natives in baseline STEM and non-STEM ability, they appear to possess a baselinecomparative advantage in STEM fields, measured by relative SAT Math to Verbal scores. As such,natives exposed to many foreign peers early on may update their priors regarding comparativeadvantage. A local linear regression analysis of the effects of foreign peers at each percentile ofthe comparative advantage spectrum shows that natives that initially exhibit very low comparativeSTEM ability are strongly impacted by foreign peers. In contrast, natives that initially display highcomparative advantage in STEM appear much less affected.
Secondly, foreign students possess very low levels of English proficiency. As such, their pres-ence may generate linguistic dissonance within the classroom environment, which in turn may af-fect learning. Fewer productive interactions, or changes in the pace of instruction to accommodatenon-fluent students, may increase disinterest in STEM among native students. Analysis providesqualitative support that foreign students whose native language is very distant from English appearto have stronger impacts than those whose native tongue is close to English.
From a policy perspective, our analysis also shows the importance of distinguishing betweenimmigrant and international students on temporary visas. This is particularly relevant as recentlarge inflows of international students have led some campuses to consider capping the number ofinternational students admitted. We find that immigrants peers appear to be the group responsiblefor the displacement of natives from STEM. In contrast, international student peers appear to havea small crowd-in effect, increasing the likelihood natives graduate in STEM.
Though this study was performed on a single university, our findings carry implications foraggregate welfare. Our results may indicate that a foreign peers induce specialization based oncomparative advantage, without negative consequences for individual earnings potential. Whilethis could be efficiency enhancing. our results also indicated that the total number of STEM grad-uates is likely to fall–the displacement we observe for native students is not offset by an increasedlikelihood of foreign students persisting in STEM. The aggregate welfare implications are furtheramplified if foreign-born students exhibit high return migration rates. Though evidence on re-turn migration rates of foreign-born college students are very limited, recent immigration-related
27

policies may be dissuading foreign students from attending college in the U.S.32 The future U.S.aggregate supply of STEM skills may shrink substantially.
In the face of increasing globalization, understanding the impacts of foreign peers in collegeremain an important undertaking. This paper is the first to explore whether foreign peers affect na-tive major choices. Future research that further explores the mechanisms underlying such impactswould be of great value for education administrators and policymakers alike.
32For example, recent research indicates that restrictive immigration policies can reduce foreign student enrollment(Shih, 2016b). Recent reports indicate a decline in college applications from international students, potentially dueto several recent immigration policies. See, for example, https://www.insidehighered.com/news/2017/03/13/nearly-4-10-universities-report-drops-international-student-applications.
28

References
Altonji, Joseph G, Erica Blom and Costas Meghir. 2012. “Heterogeneity in Human Capital Invest-ments: High School Curriculum, College Major, and Careers.” Annual Review of Economics
4(1):185–223.
Altonji, Joseph G, Lisa B Kahn and Jamin D Speer. 2014. “Trends in Earnings Differentials AcrossCollege Majors and the Changing Task Composition of Jobs.” The American Economic Review
104(5):387–393.
Altonji, Joseph G, Peter Arcidiacono and Arnaud Maurel. 2016. “The Analysis of Field Choice inCollege and Graduate School: Determinants and Wage Effects.” Handbook of the Economics of
Education 5:305–396.
Anelli, Massimo and Giovanni Peri. 2016. “The Effects of High School Peers’ Gender on CollegeMajor, College Performance and Income.” CESifo Working Paper Series: 6014 .
Arcidiacono, Peter, Esteban M Aucejo and V Joseph Hotz. 2016. “University Differences in theGraduation of Minorities in STEM Fields: Evidence from California.” The American Economic
Review 106(3):525–562.
Ballatore, Rosario Maria, Margherita Fort and Andrea Ichino. 2015. “The Tower of Babel in theClassroom: Immigrants and natives in Italian schools.” CEPR Discussion Paper No. DP10341 .
Borjas, George J. 2000. “Foreign-Born Teaching Assistants and the Academic Performance ofUndergraduates.” American Economic Review 90(2):355–359.
Borjas, George J. 2004. Do Foreign Students Crowd Out Native Students from Graduate Programs?Technical report National Bureau of Economic Research.
Brunello, Giorgio and Lorenzo Rocco. 2013. “The Effect of Immigration on the School Perfor-mance of Natives: Cross country evidence using PISA test scores.” Economics of Education
Review 32:234–246.
Carrell, Scott E, Marianne E Page and James E West. 2010. “Sex and Science: How professorgender perpetuates the gender gap.” The Quarterly Journal of Economics 125(3):1101–1144.
Carrell, Scott E, Mark Hoekstra and Elira Kuka. 2016. “The Long-Run Effects of DisruptivePeers.” National Bureau of Economic Research. Working Paper No. w22042 .
29

Carrell, Scott E and Mark L Hoekstra. 2010. “Externalities in the Classroom: How childrenexposed to domestic violence affect everyone’s kids.” American Economic Journal: Applied
Economics 2(1):211–228.
Chen, Xianglei. 2013. “STEM Attrition: College Students’ Paths into and out of STEM Fields.”National Center for Education Statistics, Statistical Analysis Report. NCES 2014-001 .
Chiswick, Barry R and Paul W Miller. 2005. “Linguistic Distance: A quantitative measure ofthe distance between English and other languages.” Journal of Multilingual and Multicultural
Development 26(1):1–11.
Conger, Dylan. 2015. “Foreign-Born Peers and Academic Performance.” Demography 52(2):569–592.
Diette, Timothy M and Ruth Uwaifo Oyelere. 2012. “Do Significant Immigrant Inflows CreateNegative Education Impacts? Lessons from the North Carolina public school system.” Institute
for the Study of Labor (IZA). Working Paper No. 6561 .
Diette, Timothy M and Ruth Uwaifo Oyelere. 2014. “Gender and Race Heterogeneity: The im-pact of students with limited english on native students’ performance.” The American Economic
Review 104(5):412–417.
Duleep, Harriet and Mark Regets. 2014. “Should the U.S. Continue Its Family-Friendly Immigra-tion Policy?” Institute for the Study of Labor (IZA). Working Paper No. 8406 .
Erisman, Wendy and Shannon Looney. 2007. “Opening the Door to the American Dream: In-creasing Higher Education Access and Success for Immigrants.” Institute for Higher Education
Policy .
Fafchamps, Marcel and Bet Caeyers. 2016. “Exclusion Bias in the Estimation of Peer Effects.”National Bureau of Economic Researc. Working Paper No. w22565 .
Gambino, Christine and Thomas Gryn. 2011. “The Foreign Born with Science and EngineeringDegrees: 2010.” US Census Bureau. American Community Survey Briefs. ACSBR/10-06. .
Geay, Charlotte, Sandra McNally and Shqiponja Telhaj. 2013. “Non-native Speakers of En-glish in the Classroom: What are the effects on pupil performance?” The Economic Journal
123(570):F281–F307.
30
Gneezy, Uri, Muriel Niederle and Aldo Rustichini. 2003. “Performance In Competitive Environ-ments: Gender Differences.” The Quarterly Journal of Economics 118(3):1049–1074.
Gould, Eric D, Victor Lavy and M Daniele Paserman. 2009. “Does Immigration Affect the Long-Term Educational Outcomes of Natives? Quasi-Experimental Evidence.” The Economic Journal
119(540):1243–1269.
Greene, William. 2004. “The Behaviour of the Maximum Likelihood Estimator of Limited Depen-dent Variable Models in the Presence of Fixed Effects.” The Econometrics Journal 7(1):98–119.
Griliches, Zvi. 1992. “The Search for R&D Spillovers.” Scandinavian Journal of Economics
94:S29–47.
Guryan, Jonathan, Kory Kroft and Matthew J Notowidigdo. 2009. “Peer Effects in the Work-place: Evidence from random groupings in professional golf tournaments.” American Economic
Journal: Applied Economics 1(4):34–68.
Hershbein, Brad and Melissa Kearney. 2014. Major Decisions: What graduates earn over theirlifetimes. Working paper, The Hamilton Project.
Hoxby, Caroline M. 1998. Do Immigrants Crowd Disadvantaged American Natives Out of HigherEducation? In Help Or Hindrance?: The Economic Implications of Immigration for African
Americans, ed. Daniel S. Hamermesh and Frank D. Bean. New York: Russell Sage Foundationpp. 282–321.
Hoxby, Caroline M. 2000. “Peer Effects in the Classroom: Learning from gender and race varia-tion.”.
Jones, Charles I. 1995. “Time Series Tests of Endogenous Growth Models.” The Quarterly Journal
of Economics 110(2):495–525.
Kerr, William R and William F Lincoln. 2010. “The Supply Side of Innovation: H-1B visa reformsand US ethnic invention.” Journal of Labor Economics 28(3):473–508.
Kirkeboen, Lars J, Edwin Leuven and Magne Mogstad. 2016. “Field of Study, Earnings, andSelf-Selection.” The Quarterly Journal of Economics 131(3):1057–1111.
Manski, Charles F. 1993. “Identification of Endogenous Social Effects: The reflection problem.”The Review of Economic Studies 60(3):531–542.
31

Niederle, Muriel and Lise Vesterlund. 2007. “Do Women Shy Away from Competition? Do MenCompete Too Much?” The Quarterly Journal of Economics pp. 1067–1101.
Ohinata, Asako and Jan C Van Ours. 2013. “How Immigrant Children Affect the AcademicAchievement of Native Dutch Children.” The Economic Journal 123(570):F308–F331.
Ohinata, Asako and Jan C Van Ours. 2016. “Quantile Peer Effects of Immigrant Children atPrimary Schools.” Labour 30(2):135–157.
Orrenius, Pia M and Madeline Zavodny. 2015. “Does Immigration Affect Whether US NativesMajor in Science and Engineering?” Journal of Labor Economics 33(S1):S79–S108.
Peri, Giovanni and Chad Sparber. 2009. “Task Specialization, Immigration, and Wages.” American
Economic Journal: Applied Economics 1(3):135–69.
Peri, Giovanni and Chad Sparber. 2011. “Highly Educated Immigrants and Native OccupationalChoice.” Industrial Relations: A Journal of Economy and Society 50(3):385–411.
Peri, Giovanni, Kevin Shih and Chad Sparber. 2015. “STEM Workers, H-1B Visas, and Produc-tivity in U.S. Cities.” Journal of Labor Economics 33(S1):S225–S255.
PISA. 2015. “PISA 2015: Results in Focus.” https://www.oecd.org/pisa/
pisa-2015-results-in-focus.pdf. [Online; accessed 15-January-2017].
Ransom, Tyler and John V Winters. 2016. Do Foreigners Crowd Natives out of STEM Degreesand Occupations? Evidence from the U.S. Immigration Act of 1990. Technical report Institutefor the Study of Labor (IZA). Working Paper No. 9920.
Rodriguez, Gloria M and Lisceth Cruz. 2009. “The Transition to College of English Learnerand Undocumented Immigrant Students: Resource and Policy Implications.” Teachers College
Record 111(10):2385–2418.
Sacerdote, Bruce. 2011. “Peer Effects in Education: How might they work, how big are they andhow much do we know thus far?” Handbook of the Economics of Education 3(3):249–277.
Sanders, Carl. 2015. Reading Skills and Earnings: Why do doing words good hurt you’re wages?Working paper Washington University in St. Louis.
Shih, Kevin. 2016a. “Do International Students Crowd-Out or Cross-Subsidize Americans inHigher Education?” Working Paper, Rensselaer Polytechnic Institute .
32

Shih, Kevin. 2016b. “Labor Market Openness, H-1B Visa Policy, and the Scale of InternationalStudent Enrollment in the United States.” Economic Inquiry 54(1):121–138.
Stebleton, Michael J. 2011. “Understanding Immigrant College Students: Applying a develop-mental ecology framework to the practice of academic advising.” NACADA: Academic Advising
Journal 31(1).
Stebleton, Michael J, Ronald L Huesman Jr and Aliya Kuzhabekova. 2010. “Do I BelongHere? Exploring immigrant college student responses on the SERU survey sense of belong-ing/satisfaction factor.” Center for Studies in Higher Education .
Steen, Lynn Arthur. 1988. Calculus for a New Century: A Pump, Not a Filter. ERIC.
Stinebrickner, Todd R and Ralph Stinebrickner. 2011. “Math or Science? Using LongitudinalExpectations Data to Examine the Process of Choosing a College Major.” National Bureau of
Economic Research. Working Paper No. 16869 .
Turner, Sarah E and William G Bowen. 1999. “Choice of Major: The changing (unchanging)gender gap.” ILR Review 52(2):289–313.
Wiswall, Matthew and Basit Zafar. 2015. “Determinants of College Major Choice: Identificationusing an information experiment.” The Review of Economic Studies 82(2):791–824.
Yamamoto, Yoko and Jin Li. 2011. Quiet in the Eye of the Beholder: Teacher perceptions of Asianimmigrant children. In The Impact of Immigration on Children’s Development. Vol. 24 KargerPublishers pp. 1–16.
33

Figures & Tables
Figure 1: Trends in STEM Majors and Foreign Enrollment
.2.2
2.2
4.2
6.2
8
% o
f BA
Deg
rees
Aw
arde
d to
ST
EM
Maj
ors
1985 1990 1995 2000 2005 2010
(a) Share of BA Degrees in STEM Fields
0.0
5.1
.15
1980 1985 1990 1995 2000 2005 2010 2015
Immigrant International Total
(b) Foreign Enrollment as Share of Total
Note: Data on bachelor’s degrees awarded by field of study come from the Integrated Postsecondary Education DataSystem (IPEDS). Data on foreign-born enrollment in higher education comes from the 1990, 2000 Censuses, and the2001-2014 ACS. Data represents foreign-born individuals resident in the U.S. and enrolled in undergraduate studies.Because the year 1990 is missing college attendance, we instead calculate the number of students that have at least ahigh school degree, but less than a bachelor’s degree that are enrolled in school. International Student data seriescomes from Institute of International Education, “International Students by Academic Level” (2016) and representsalien foreign born students enrolled in undergraduate studies.
34

Figure 2: Variation in foreign share in introductory math courses
05
1015
Den
sity
0 .1 .2 .3
Foreign Share In Math Course
Note: Each observation in the distribution refers to an introductory math class in the university underanalysis. Introductory math classes are defined by unique course, professor, and term combinations.
35

Figure 3: Foreign Share variation within professor-course pairs over time
A
B
.02
.06
.1.1
4.1
8
Fall 2
000
Fall 2
001
Fall 2
002
Fall 2
003
Fall 2
004
Fall 2
005
Fall 2
006
Fall 2
007
Fall 2
008
Note: Terms are displayed on the horizontal axis and share of foreign born student in the class onthe vertical axis. Each line represent a course taught by the same professor (e.g. Calculus I taughtby a specific professor over multiple Fall terms). The idiosyncratic variation across terms of eachcourse taught by the same professor represents the identifying variation in our paper.
36

Figure 4: Impact of Intro Math Foreign Peers on Major Choices in Future Terms
−.0
4−
.02
0.0
2.0
4
1 2 3 4 5 6 7 8 9 10 11 12 13 14 15 16 17 18
STEM Soc. Sci.Arts & Hum. Undecl.
Note: The horizontal axis measures terms, where 1 indicates an individual’s first term. The verticalaxis measure the impact of a one standard deviation increase in foreign peers on the likelihood ofdeclaring a particular major category at every term. Term 18 indicates 6 years from the first term.
37

Figure 5: Local Linear Regression Results
Comparative Advantage
Absolute Advantage
Note: Results show coefficient estimates from local linear regressions of Equation 2 with STEMgraduation as the outcome. Students in core sample are ranked from 1 to 16,830 based on a measureof comparative advantage (top) and absolute advantage (bottom). Lower percentile represents lowerinclination towards STEM. Each graph plots 99 estimates from local linear regression centered ateach percentile using Epanechnikov kernel weighting. Confidence intervals (dashed lines) derivedfrom 5th and 95th percentile of 250 bootstrapped estimations, resampled at the course level. Seetext for details on calculation of comparative and absolute advantage.
38

Table 1: List of Math Courses
Title Native Avg. Avg.First-Time Class PercentFreshmen Size Foreign
Adv Calculus: Intro 4,965 208 0.152(53.9) (0.036)
Adv Calculus: Multi Variable 922 148 0.174(33.7) (0.041)
Adv Calculus: Differential Equations 299 148 0.152(43.4) (0.041)
Adv Calculus: Vector Analysis 40 135 0.145(48.0) (0.064)
Calculus for Scientists 1,287 232 0.114(41.4) (0.025)
Calculus I 7,031 247 .103(81.7) (0.029)
Calculus II 394 197 0.107(58.3) (0.032)
Calculus III 54 215.7 0.113(58.34) (0.029)
Precalculus 1,838 307 0.096(69.6) (0.023)
Total/Average 16,830 233 0.123(77.1) (0.041)
Note: List of introductory mathematics courses offered by the university under analysis.Advanced courses cover similar material to non-advanced ones, but with greater depth.Sample includes 16,380 freshmen native students enrolling in introductory math coursesin their first term of college attendance. Standard deviations in parentheses
39

Table 2: Background Summary Statistics
(1) (2) (3) (4) (5) (6)Native
AllForeign
AllNative
FreshmenForeignPeers
ImmPeers
IntlPeers
Female 0.56 0.53 0.50 0.48 0.48 0.49(0.50) (0.50) (0.50) (0.50) (0.50) (0.50)
White 0.47 0.16 0.41 0.12 0.12 0.12(0.48) (0.33) (0.48) (0.30) (0.30) (0.29)
Asian 0.37 0.71 0.48 0.78 0.77 0.78(0.46) (0.43) (0.49) (0.40) (0.40) (0.39)
Minority 0.15 0.13 0.10 0.11 0.11 0.10(0.35) (0.32) (0.29) (0.30) (0.30) (0.28)
Black 0.03 0.02 0.02 0.02 0.02 0.01(0.17) (0.13) (0.13) (0.13) (0.13) (0.11)
Latino 0.12 0.11 0.08 0.09 0.09 0.08(0.31) (0.29) (0.27) (0.28) (0.28) (0.26)
High School GPA 3.70 3.70 3.76 3.72 3.71 3.79(0.30) (0.26) (0.33) (0.30) (0.31) (0.27)
SAT Math 599.45 599.62 629.36 617.89 611.64 667.00(74.99) (76.40) (71.90) (87.09) (87.31) (67.66)
SAT Verbal 562.90 510.62 573.83 491.18 486.25 529.88(79.63) (90.42) (84.48) (104.15) (104.19) (95.44)
SAT Composite 1160.18 1105.63 1200.32 1099.42 1088.71 1195.38(136.34) (138.31) (135.62) (162.82) (162.29) (133.69)
Composite Adm. Score 7394.68 7429.27 7510.59 7397.73 7390.23 7456.56(758.58) (715.93) (831.30) (914.90) (884.44) (1125.18)
Obs 45,293 7,165 16,830 3,840 3,406 434
Note: Means for enrolled students from fall 2000-fall 2006. Standard deviations in parentheses. Column 3 refersto our analysis sample of 16,830 native students who attended an intro math course as freshmen in the first year ofcollege enrollment. Composite Admission Score is calculated by the admissions office using a weighted sum ofvarious background ability and traits, which includes some measures available in our data and also other abilitymeasures that are not available.
40

Table 3: Outcome Summary Statistics for Introductory Math Sample
(1) (2)Native
FreshmenForeignPeers
Graduation Outcomes in 6 YrsGraduate 0.82 0.78
(0.38) (0.42)
Dropout 0.18 0.22(0.38) (0.42)
Time to Degree 16.41 16.37(2.48) (3.09)
Graduation GPA 3.05 2.96(0.44) (0.45)
Graduate STEM 0.48 0.44(0.50) (0.50)
Graduate Social Sciences (SS) 0.27 0.27(0.44) (0.44)
Graduate Arts & Humanities (AH) 0.08 0.06(0.26) (0.24)
Major TransitionsSTEM→ STEM 0.43 0.39
(0.49) (0.49)
STEM→ SS 0.14 0.12(0.34) (0.32)
STEM→ AH 0.04 0.04(0.20) (0.19)
STEM→ Dropout 0.14 0.16(0.35) (0.37)
SS→ STEM 0.02 0.02(0.13) (0.13)
AH→ STEM 0.01 0.01(0.10) (0.12)
Obs 16,830 3,840
Note: Column 1 refers to our analysis sample of 16,830 native nativefreshmen enrolling in introductory math courses in their first term of col-lege attendance. Column 2 refers to the foreign peers of native freshmenenrolling in introductory math courses in their first term of college atten-dance. Transitions refer to the fraction of students who had a differentmajor at graduation from their first declared major.
41

Tabl
e4:
Exo
gene
ityof
Fore
ign
Cla
ssSh
are
(1)
(2)
(3)
(4)
(5)
(6)
(7)
(8)
(9)
(10)
Fem
ale
Whi
teA
sian
Min
ority
Bla
ckL
atin
oSA
TSA
TH
igh
Com
posi
teM
ath
Ver
bal
Scho
olA
dmis
sion
GPA
Scor
eFo
reig
nSh
.-0
.01
-0.0
10.
01-0
.01
-0.0
0-0
.00
1.76
-1.0
80.
0121
.11
(0.0
1)(0
.01)
(0.0
1)(0
.01)
(0.0
0)(0
.01)
(1.6
7)(1
.97)
(0.0
1)(1
4.53
)
Mea
n(Y)
.49
.41
.46
.12
.02
.161
8.36
567.
33.
7374
14.3
6St
d(Y)
.5.4
8.4
8.3
2.1
5.2
974
.98
83.8
5.3
282
9.08
σct
xx
xx
xx
xx
xx
σcp
xx
xx
xx
xx
xx
Obs
.25
,912
25,9
1225
,912
25,9
1225
,912
25,9
1225
,912
25,9
1225
,912
25,9
12R
-sq
0.11
0.02
0.02
0.02
0.01
0.01
0.15
0.03
0.02
0.28
Not
e:Sa
mpl
eis
all
nativ
est
uden
tsat
tend
ing
intr
oduc
tory
mat
hco
urse
s.T
heta
ble
disp
lays
estim
ates
from
equa
tion
1an
dsh
ows
the
mea
nan
dst
anda
rdde
viat
ion
ofea
chou
tcom
eva
riab
le.
Reg
ress
ions
incl
ude
cont
rols
for
cour
se-b
y-te
rman
dco
urse
-by-
prof
esso
rfix
edef
fect
s.St
anda
rder
rors
inpa
rent
hese
sar
ecl
uste
red
bypr
ofes
sor.
Sign
ifica
nce
leve
ls:*
0.10
,**
0.05
,***
0.01
.
42
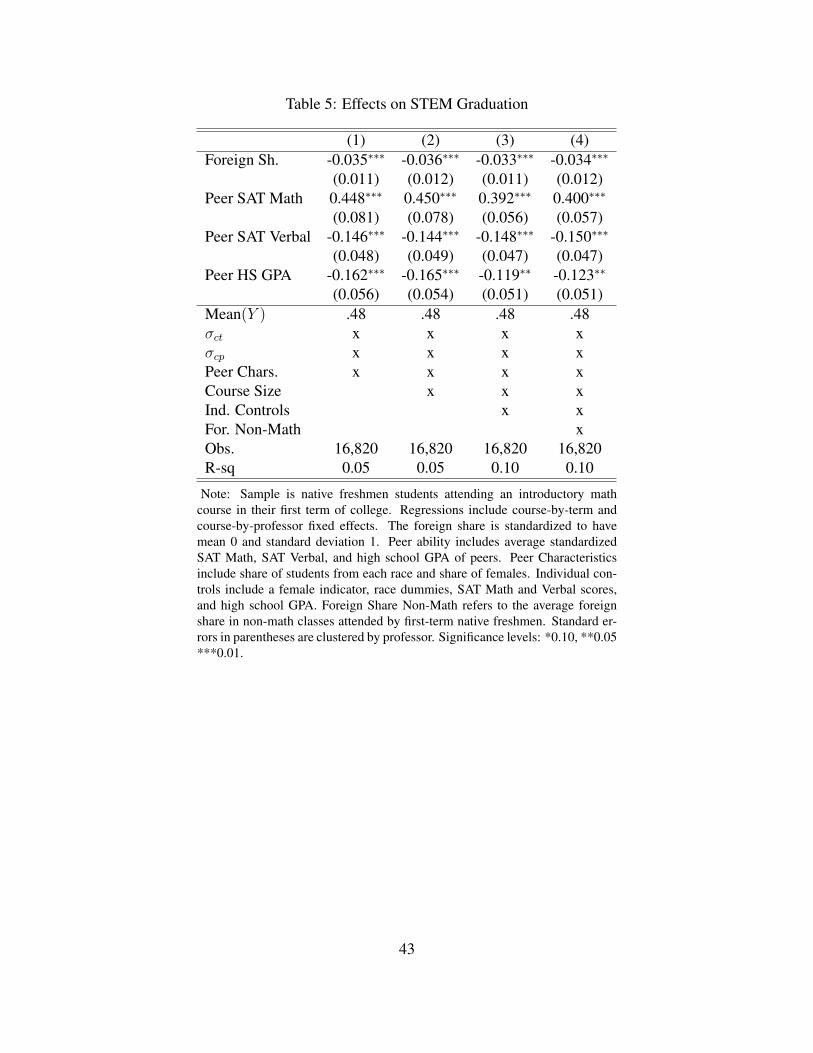
Table 5: Effects on STEM Graduation
(1) (2) (3) (4)Foreign Sh. -0.035∗∗∗ -0.036∗∗∗ -0.033∗∗∗ -0.034∗∗∗
(0.011) (0.012) (0.011) (0.012)Peer SAT Math 0.448∗∗∗ 0.450∗∗∗ 0.392∗∗∗ 0.400∗∗∗
(0.081) (0.078) (0.056) (0.057)Peer SAT Verbal -0.146∗∗∗ -0.144∗∗∗ -0.148∗∗∗ -0.150∗∗∗
(0.048) (0.049) (0.047) (0.047)Peer HS GPA -0.162∗∗∗ -0.165∗∗∗ -0.119∗∗ -0.123∗∗
(0.056) (0.054) (0.051) (0.051)Mean(Y ) .48 .48 .48 .48σct x x x xσcp x x x xPeer Chars. x x x xCourse Size x x xInd. Controls x xFor. Non-Math xObs. 16,820 16,820 16,820 16,820R-sq 0.05 0.05 0.10 0.10
Note: Sample is native freshmen students attending an introductory mathcourse in their first term of college. Regressions include course-by-term andcourse-by-professor fixed effects. The foreign share is standardized to havemean 0 and standard deviation 1. Peer ability includes average standardizedSAT Math, SAT Verbal, and high school GPA of peers. Peer Characteristicsinclude share of students from each race and share of females. Individual con-trols include a female indicator, race dummies, SAT Math and Verbal scores,and high school GPA. Foreign Share Non-Math refers to the average foreignshare in non-math classes attended by first-term native freshmen. Standard er-rors in parentheses are clustered by professor. Significance levels: *0.10, **0.05***0.01.
43

Tabl
e6:
Eff
ects
onG
radu
atio
nO
utco
mes
and
Exp
ecte
dE
arni
ngs
(1)
(2)
(3)
(4)
(5)
(6)
(7)
(8)
Gra
dST
EM
Gra
dSS
Gra
dA
HD
ropo
utE
arn
0E
arn
6E
arn
11-1
5E
arn
26-3
0Fo
reig
nSh
.-0
.033
∗∗∗
0.02
20.
0053
0.00
43-9
4.8
-296
.8-3
66.7
-566
.9(0
.011
)(0
.015
)(0
.006
3)(0
.009
1)(3
25.0
)(5
18.9
)(6
40.3
)(5
21.3
)M
ean(Y)
.48
.27
.08
.18
2323
0.85
3855
2.17
4972
9.47
5276
0.8
σct
xx
xx
xx
xx
σcp
xx
xx
xx
xx
Peer
Abi
lity
xx
xx
xx
xx
Peer
Cha
rs.
xx
xx
xx
xx
Cou
rse
Size
xx
xx
xx
xx
Ind.
Con
trol
sx
xx
xx
xx
xO
bs.
16,8
3016
,830
16,8
3016
,830
16,8
3016
,830
16,8
3016
,830
R-s
q0.
100.
060.
030.
060.
100.
080.
080.
10
Not
e:Sa
mpl
eis
nativ
efr
eshm
enst
uden
tsat
tend
ing
anin
trod
ucto
rym
ath
cour
sein
thei
rfirs
tter
mof
colle
ge.R
egre
ssio
nsin
clud
eco
urse
-by
-ter
man
dco
urse
-by-
prof
esso
rfixe
def
fect
s.Fo
reig
nSh
are
isst
anda
rdiz
edto
have
mea
n0
and
stan
dard
devi
atio
n1.
Peer
abili
tyin
clud
esav
erag
eSA
TM
ath,
SAT
Ver
bal,
and
high
scho
olG
PAof
peer
s.Pe
erC
hara
cter
istic
sin
clud
esh
are
ofst
uden
tsfr
omea
chra
cean
dsh
are
offe
mal
es.
Indi
vidu
alco
ntro
lsin
clud
ea
fem
ale
indi
cato
r,ra
cedu
mm
ies,
SAT
Mat
han
dV
erba
lsco
res,
and
high
scho
olG
PA.E
xpec
ted
earn
ing
inco
lum
ns5-
8ha
vebe
enas
sign
edto
each
stud
entb
ased
onth
eir
grad
uatio
nm
ajor
.E
arni
ngs
estim
ates
com
efr
omca
lcul
atio
nsdo
neby
the
Bro
okin
gs’
Ham
ilton
Proj
ecta
ndre
fer
tom
edia
nea
rnin
gsca
lcul
ated
onU
.S.C
ensu
sB
urea
usA
mer
ican
Com
mun
itySu
rvey
data
atdi
ffer
enty
ears
afte
rcol
lege
grad
uatio
n.St
anda
rder
rors
inpa
rent
hese
sar
ecl
uste
red
bypr
ofes
sor.
Sign
ifica
nce
leve
ls:*
0.10
,**0
.05
***0
.01.
44

Table 7: Short-Run Effects
(1) (2) (3) (4) (5) (6)Withdraw Grade GPA Math T+1 STEM T+1 For Sh. T+1
Foreign Sh. -0.01 -0.01 0.04∗ -0.00 -0.01 -0.03(0.01) (0.02) (0.02) (0.01) (0.01) (0.02)
Mean(Y ) .12 .13 2.78 .87 .93 0σct x x x x x xσcp x x x x x xPeer Ability x x x x x xPeer Chars. x x x x x xCourse Size x x x x x xInd. Controls x x x x x xObs. 16830 14792 16830 16830 16830 16830R-sq 0.061 0.21 0.23 0.080 0.049 0.33
Note: Sample is native freshmen students attending an introductory math course in their first term ofcollege. Regressions include course-by-term and course-by-professor fixed effects. Foreign Share isstandardized to have mean 0 and standard deviation 1. Withdraw measures if a student withdrew fromthe intro-math course after the first day. Grade is the letter grade received (e.g. A, A-, B+, etc.) in theintro math course. GPA refers to the overall GPA at the end of first term. Math T+1 and STEM T+1 referto whether the student took a Math or STEM class in the following term. For Sh. T+1 is the averageforeign share among all peers in courses attended in the following term (standardized to have mean 0and sd 1). Peer ability includes average SAT Math, SAT Verbal, and high school GPA of peers. PeerCharacteristics include share of students from each race and share of females. Individual controls includea female indicator, race dummies, SAT Math and Verbal scores, and high school GPA. Standard errors inparentheses are clustered by professor. Significance levels: *0.10, **0.05 ***0.01.
45
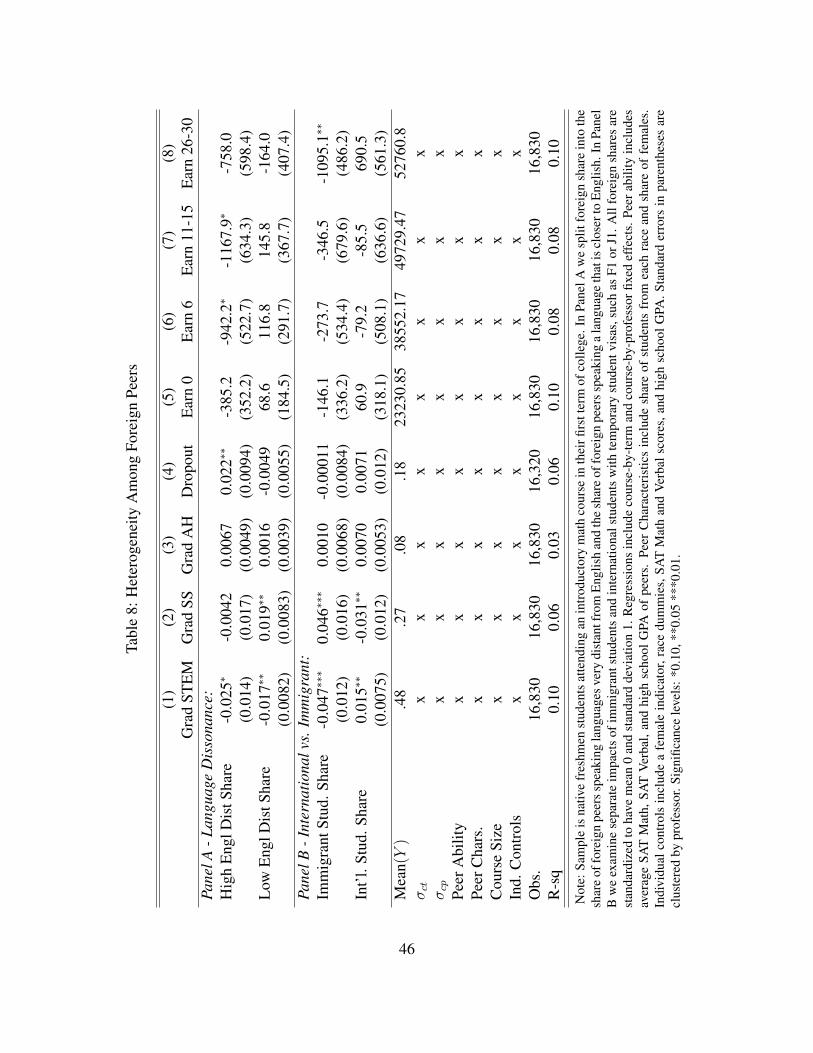
Tabl
e8:
Het
erog
enei
tyA
mon
gFo
reig
nPe
ers
(1)
(2)
(3)
(4)
(5)
(6)
(7)
(8)
Gra
dST
EM
Gra
dSS
Gra
dA
HD
ropo
utE
arn
0E
arn
6E
arn
11-1
5E
arn
26-3
0Pa
nelA
-Lan
guag
eD
isso
nanc
e:H
igh
Eng
lDis
tSha
re-0
.025
∗-0
.004
20.
0067
0.02
2∗∗
-385
.2-9
42.2
∗-1
167.
9∗-7
58.0
(0.0
14)
(0.0
17)
(0.0
049)
(0.0
094)
(352
.2)
(522
.7)
(634
.3)
(598
.4)
Low
Eng
lDis
tSha
re-0
.017
∗∗0.
019∗
∗0.
0016
-0.0
049
68.6
116.
814
5.8
-164
.0(0
.008
2)(0
.008
3)(0
.003
9)(0
.005
5)(1
84.5
)(2
91.7
)(3
67.7
)(4
07.4
)Pa
nelB
-Int
erna
tiona
lvs.
Imm
igra
nt:
Imm
igra
ntSt
ud.S
hare
-0.0
47∗∗
∗0.
046∗
∗∗0.
0010
-0.0
0011
-146
.1-2
73.7
-346
.5-1
095.
1∗∗
(0.0
12)
(0.0
16)
(0.0
068)
(0.0
084)
(336
.2)
(534
.4)
(679
.6)
(486
.2)
Int’l
.Stu
d.Sh
are
0.01
5∗∗
-0.0
31∗∗
0.00
700.
0071
60.9
-79.
2-8
5.5
690.
5(0
.007
5)(0
.012
)(0
.005
3)(0
.012
)(3
18.1
)(5
08.1
)(6
36.6
)(5
61.3
)M
ean(Y)
.48
.27
.08
.18
2323
0.85
3855
2.17
4972
9.47
5276
0.8
σct
xx
xx
xx
xx
σcp
xx
xx
xx
xx
Peer
Abi
lity
xx
xx
xx
xx
Peer
Cha
rs.
xx
xx
xx
xx
Cou
rse
Size
xx
xx
xx
xx
Ind.
Con
trol
sx
xx
xx
xx
xO
bs.
16,8
3016
,830
16,8
3016
,320
16,8
3016
,830
16,8
3016
,830
R-s
q0.
100.
060.
030.
060.
100.
080.
080.
10
Not
e:Sa
mpl
eis
nativ
efr
eshm
enst
uden
tsat
tend
ing
anin
trod
ucto
rym
ath
cour
sein
thei
rfirs
tter
mof
colle
ge.I
nPa
nelA
we
split
fore
ign
shar
ein
toth
esh
are
offo
reig
npe
erss
peak
ing
lang
uage
sver
ydi
stan
tfro
mE
nglis
han
dth
esh
are
offo
reig
npe
erss
peak
ing
ala
ngua
geth
atis
clos
erto
Eng
lish.
InPa
nel
Bw
eex
amin
ese
para
teim
pact
sof
imm
igra
ntst
uden
tsan
din
tern
atio
nals
tude
nts
with
tem
pora
ryst
uden
tvis
as,s
uch
asF1
orJ1
.All
fore
ign
shar
esar
est
anda
rdiz
edto
have
mea
n0
and
stan
dard
devi
atio
n1.
Reg
ress
ions
incl
ude
cour
se-b
y-te
rman
dco
urse
-by-
prof
esso
rfixe
def
fect
s.Pe
erab
ility
incl
udes
aver
age
SAT
Mat
h,SA
TV
erba
l,an
dhi
ghsc
hool
GPA
ofpe
ers.
Peer
Cha
ract
eris
tics
incl
ude
shar
eof
stud
ents
from
each
race
and
shar
eof
fem
ales
.In
divi
dual
cont
rols
incl
ude
afe
mal
ein
dica
tor,
race
dum
mie
s,SA
TM
ath
and
Ver
bals
core
s,an
dhi
ghsc
hool
GPA
.Sta
ndar
der
rors
inpa
rent
hese
sar
ecl
uste
red
bypr
ofes
sor.
Sign
ifica
nce
leve
ls:*
0.10
,**0
.05
***0
.01.
46

Table 9: Foreign Peer Effects on Different Native Groups
(1) (2) (3) (4) (5)Female Male White Asian Minority
Grad STEM 0.00 -0.05∗∗∗ -0.02∗∗ -0.07∗∗∗ 0.01(0.01) (0.02) (0.01) (0.01) (0.02)
Grad SS -0.02 0.06∗∗∗ 0.01 0.04∗∗ 0.03(0.02) (0.02) (0.02) (0.02) (0.02)
Grad AH 0.01 -0.01 0.01 0.00 0.03(0.01) (0.01) (0.02) (0.00) (0.02)
No Grad 0.01 0.00 -0.00 0.03∗∗∗ -0.07∗∗∗
(0.01) (0.02) (0.01) (0.01) (0.02)
Earn 0 58.16 135.00 -86.55 -722.00∗ 2288.17∗∗∗
(311.90) (573.02) (357.62) (405.67) (800.31)
Earn 6 207.00 -303.57 -165.97 -1309.33∗∗ 3338.21∗∗
(445.47) (921.24) (576.86) (555.41) (1270.74)
Earn 11-15 230.14 -364.49 24.24 -1918.34∗∗∗ 4366.76∗∗∗
(544.66) (1156.19) (743.25) (658.16) (1631.64)
Earn 26-30 -14.49 -280.05 -64.98 -1778.08∗∗ 4485.75∗∗
(587.69) (1065.63) (702.95) (745.94) (1935.69)σct x x x x xσcp x x x x xPeer Ability x x x x xPeer Chars. x x x x xCourse Size x x x x xInd. Controls x x x x xObs. 8,355 8,475 6,483 7,667 1,606R-sq 0.09 0.10 0.10 0.10 0.17
Note: Sample is native freshmen students attending an introductory math course in their firstterm of college. Each column presents our analysis on native first-term freshmen, stratifiedby the characteristics indicated in the column headers. Minority refers to Latino and African-American students. Regressions include course-by-term and course-by-professor fixed effects.Foreign Share is standardized to have mean 0 and standard deviation 1. Peer ability includesaverage SAT Math, SAT Verbal, and high school GPA of peers. Peer Characteristics includeshare of students from each race and share of females. Individual controls include a femaleindicator, race dummies, SAT Math and Verbal scores, and high school GPA. Standard errorsin parentheses are clustered by professor. Significance levels: *0.10, **0.05 ***0.01.
47
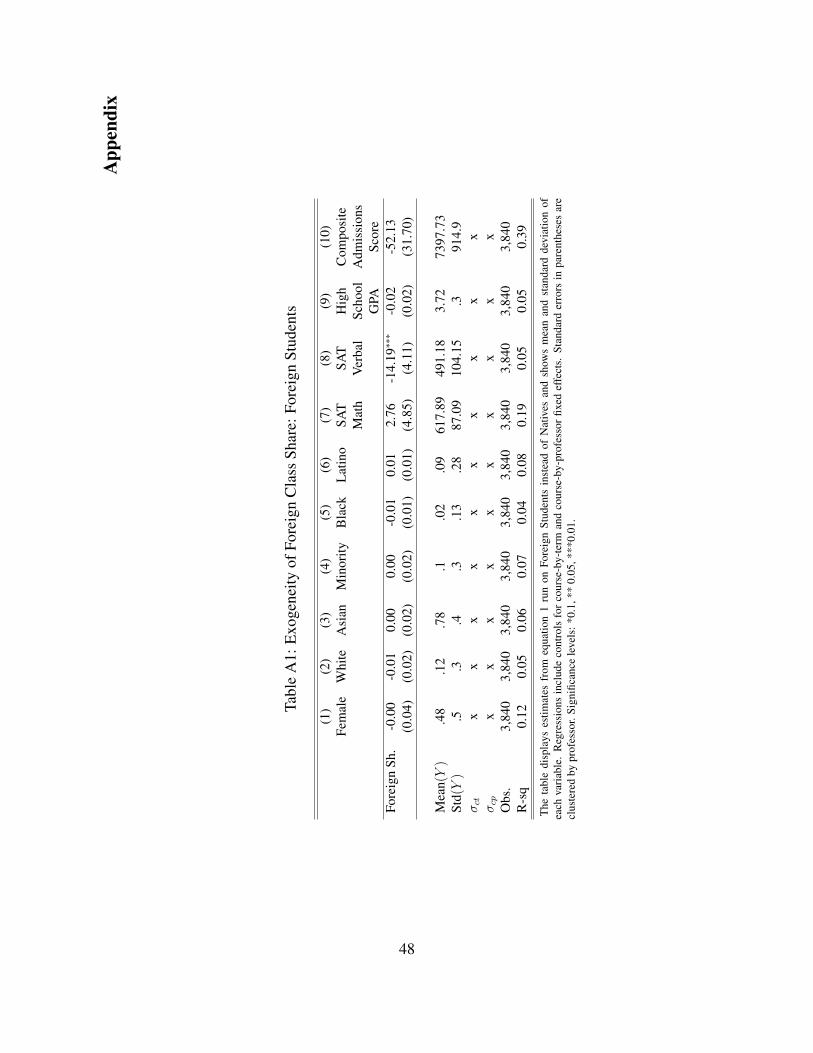
App
endi
x
Tabl
eA
1:E
xoge
neity
ofFo
reig
nC
lass
Shar
e:Fo
reig
nSt
uden
ts
(1)
(2)
(3)
(4)
(5)
(6)
(7)
(8)
(9)
(10)
Fem
ale
Whi
teA
sian
Min
ority
Bla
ckL
atin
oSA
TSA
TH
igh
Com
posi
teM
ath
Ver
bal
Scho
olA
dmis
sion
sG
PASc
ore
Fore
ign
Sh.
-0.0
0-0
.01
0.00
0.00
-0.0
10.
012.
76-1
4.19
∗∗∗
-0.0
2-5
2.13
(0.0
4)(0
.02)
(0.0
2)(0
.02)
(0.0
1)(0
.01)
(4.8
5)(4
.11)
(0.0
2)(3
1.70
)
Mea
n(Y)
.48
.12
.78
.1.0
2.0
961
7.89
491.
183.
7273
97.7
3St
d(Y)
.5.3
.4.3
.13
.28
87.0
910
4.15
.391
4.9
σct
xx
xx
xx
xx
xx
σcp
xx
xx
xx
xx
xx
Obs
.3,
840
3,84
03,
840
3,84
03,
840
3,84
03,
840
3,84
03,
840
3,84
0R
-sq
0.12
0.05
0.06
0.07
0.04
0.08
0.19
0.05
0.05
0.39
The
tabl
edi
spla
yses
timat
esfr
omeq
uatio
n1
run
onFo
reig
nSt
uden
tsin
stea
dof
Nat
ives
and
show
sm
ean
and
stan
dard
devi
atio
nof
each
vari
able
.R
egre
ssio
nsin
clud
eco
ntro
lsfo
rco
urse
-by-
term
and
cour
se-b
y-pr
ofes
sor
fixed
effe
cts.
Stan
dard
erro
rsin
pare
nthe
ses
are
clus
tere
dby
prof
esso
r.Si
gnifi
canc
ele
vels
:*0.
1,**
0.05
,***
0.01
.
48

Table A2: Effects on STEM Graduation - Probit
(1) (2) (3) (4)Foreign Sh.1.5 sd below mean -0.024∗∗∗ -0.025∗∗ -0.025∗∗ -0.027∗∗
(0.007) (0.012) (0.012) (0.012)1 sd below mean -0.024∗∗∗ -0.025∗∗ -0.025∗∗ -0.027∗∗
(0.007) (0.012) (0.012) (0.012)0.5 sd below mean -0.024∗∗∗ -0.025∗∗ -0.025∗∗ -0.027∗∗
(0.007) (0.012) (0.012) (0.013)At mean -0.024∗∗∗ -0.025∗∗ -0.025∗∗ -0.026∗∗
(0.007) (0.012) (0.012) (0.012)0.5 sd above mean -0.024∗∗∗ -0.025∗∗ -0.025∗∗ -0.026∗∗
(0.007) (0.011) (0.011) (0.012)1 sd abovemean -0.024∗∗∗ -0.025∗∗ -0.025∗∗ -0.026∗∗
(0.007) (0.011) (0.011) (0.012)1.5 sd above mean -0.024∗∗∗ -0.025∗∗ -0.025∗∗ -0.026∗∗
(0.007) (0.011) (0.011) (0.012)Mean(Y ) .48 .48 .48 .48σct x x x xσcp x x x xPeer Ability x x x xPeer Chars. x x xCourse Size x xInd. Controls x
Note: Sample is Native freshmen students attending an introductory mathcourse in their first term of college enrollment. Table reports marginal effectsfrom probit estimation. Values reported are marginal effects for values of for-eign share at intervals (in standard deviations) relative to the mean, holding allother covariates at the mean. Standard errors in parentheses are clustered byprofessor. Significance levels: *0.10, **0.05 ***0.01.
49

Table A3: Effects on STEM Graduation - Logit
(1) (2) (3) (4)Foreign Sh.1.5 sd below mean -0.024∗∗∗ -0.026∗∗ -0.026∗∗ -0.027∗∗
(0.007) (0.012) (0.012) (0.012)1 sd below mean -0.024∗∗∗ -0.026∗∗ -0.026∗∗ -0.027∗∗
(0.007) (0.012) (0.012) (0.013)0.5 sd below mean -0.024∗∗∗ -0.026∗∗ -0.026∗∗ -0.027∗∗
(0.007) (0.012) (0.012) (0.013)At mean -0.024∗∗∗ -0.026∗∗ -0.026∗∗ -0.027∗∗
(0.007) (0.012) (0.012) (0.013)0.5 sd above mean -0.024∗∗∗ -0.025∗∗ -0.025∗∗ -0.027∗∗
(0.007) (0.011) (0.011) (0.012)1 sd abovemean -0.024∗∗∗ -0.025∗∗ -0.025∗∗ -0.027∗∗
(0.007) (0.011) (0.011) (0.012)1.5 sd above mean -0.024∗∗∗ -0.025∗∗ -0.025∗∗ -0.027∗∗
(0.007) (0.011) (0.011) (0.012)Mean(Y ) .48 .48 .48 .48σct x x x xσcp x x x xPeer Ability x x x xPeer Chars. x x xCourse Size x xInd. Controls x
Note: Sample is Native freshmen students attending an introductory mathcourse in their first term of college. Table reports marginal effects from logitestimation. Values reported are marginal effects for values of foreign share atintervals (in standard deviations) relative to the mean, holding all other covari-ates at the mean. Standard errors in parentheses are clustered by professor.Significance levels: *0.10, **0.05 ***0.01.
50

Table A4: Effects on STEM Graduation - Foreign Students
(1) (2) (3)Foreign Sh. -0.022 -0.003 0.009
(0.030) (0.032) (0.029)Mean(Y ) .44 .44 .44σct x x xσcp x x xPeer Ability x x xPeer Chars. x x xCourse Size x xInd. Controls xFor. Non-Math xObs. 3,840 3,840 3,840R-sq 0.10 0.10 0.11
Note: Sample is foreign freshmen students attendingan introductory math course in their first term of col-lege. Regressions include course-by-term and course-by-professor fixed effects. The foreign share is standardizedto have mean 0 and standard deviation 1. Peer ability in-cludes average SAT Math, SAT Verbal, and high schoolGPA of peers. Peer characteristics include share of stu-dents from each race and share of females. Individualcontrols include a female indicator, race dummies, SATMath and Verbal scores, and high school GPA. ForeignShare Non-Math refers to the average foreign share innon-math classes attended by first-term native freshmen.Standard errors in parentheses are clustered by professor.Significance levels: *0.10, **0.05 ***0.01.
51

Tabl
eA
5:E
ffec
tson
Gra
duat
ion
Maj
or,R
obus
tnes
sC
ontr
ollin
gfo
rFor
eign
Shar
ein
Non
-Mat
hC
ours
es
(1)
(2)
(3)
(4)
(5)
(6)
(7)
(8)
Gra
dST
EM
Gra
dSS
Gra
dA
HN
oG
rad
Ear
n0
Ear
n6
Ear
n11
-15
Ear
n26
-30
Fore
ign
Sh.
-0.0
328∗
∗∗0.
0223
0.00
531
0.00
403
-98.
56-2
96.9
-368
.9-5
65.4
(0.0
113)
(0.0
151)
(0.0
0620
)(0
.008
85)
(315
.5)
(503
.4)
(621
.7)
(505
.4)
Fore
ign
ShN
on-M
ath
Cou
rses
xx
xx
xx
xx
Mea
n(Y)
.48
.27
.08
.18
2323
0.85
3855
2.17
4972
9.47
5276
0.8
σtc
xx
xx
xx
xx
σcp
xx
xx
xx
xx
Peer
Abi
lity
xx
xx
xx
xx
Peer
Cha
rs.
xx
xx
xx
xx
Cou
rse
Size
xx
xx
xx
xx
Ind.
Con
trol
sx
xx
xx
xx
xO
bs.
16,8
3016
,830
16,8
3016
,830
16,8
3016
,830
16,8
3016
,830
R-s
q0.
1003
0.05
979
0.02
838
0.05
738
0.09
971
0.07
896
0.07
904
0.09
606
Not
e:Sa
mpl
eis
Nat
ive
fres
hmen
stud
ents
atte
ndin
gan
intr
oduc
tory
-mat
hco
urse
inth
eirfi
rstt
erm
ofco
llege
enro
llmen
t.R
egre
ssio
nsin
clud
eco
ntro
lsfo
rcou
rse-
by-t
erm
and
cour
se-b
y-pr
ofes
sor
fixed
effe
cts.
Fore
ign
Shar
eis
stan
dard
ized
toha
vem
ean
0an
dst
anda
rdde
viat
ion
1.Pe
erab
ility
incl
udes
aver
age
SAT
Mat
h,SA
TV
erba
l,an
dhi
ghsc
hool
GPA
ofpe
ers.
Peer
Cha
ract
eris
tics
incl
ude
shar
eof
stud
ents
from
each
race
and
shar
eof
fem
ales
.In
divi
dual
cont
rols
incl
ude
afe
mal
ein
dica
tor,
race
dum
mie
s,SA
TM
ath
and
Ver
bals
core
s,an
dhi
ghsc
hool
GPA
.Sta
ndar
der
rors
inpa
rent
hese
sar
ecl
uste
red
bypr
ofes
sor.
Sign
ifica
nce
leve
ls:
*0.1
,**0
.05
***0
.01.
52
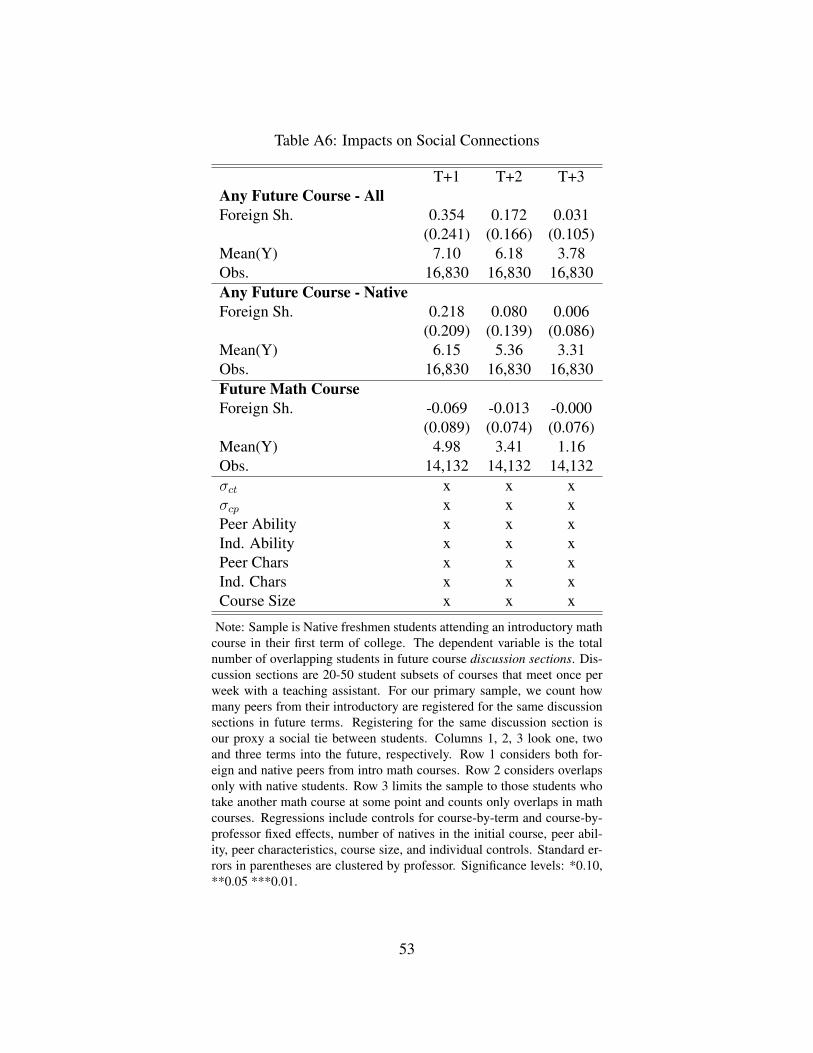
Table A6: Impacts on Social Connections
T+1 T+2 T+3Any Future Course - AllForeign Sh. 0.354 0.172 0.031
(0.241) (0.166) (0.105)Mean(Y) 7.10 6.18 3.78Obs. 16,830 16,830 16,830Any Future Course - NativeForeign Sh. 0.218 0.080 0.006
(0.209) (0.139) (0.086)Mean(Y) 6.15 5.36 3.31Obs. 16,830 16,830 16,830Future Math CourseForeign Sh. -0.069 -0.013 -0.000
(0.089) (0.074) (0.076)Mean(Y) 4.98 3.41 1.16Obs. 14,132 14,132 14,132σct x x xσcp x x xPeer Ability x x xInd. Ability x x xPeer Chars x x xInd. Chars x x xCourse Size x x x
Note: Sample is Native freshmen students attending an introductory mathcourse in their first term of college. The dependent variable is the totalnumber of overlapping students in future course discussion sections. Dis-cussion sections are 20-50 student subsets of courses that meet once perweek with a teaching assistant. For our primary sample, we count howmany peers from their introductory are registered for the same discussionsections in future terms. Registering for the same discussion section isour proxy a social tie between students. Columns 1, 2, 3 look one, twoand three terms into the future, respectively. Row 1 considers both for-eign and native peers from intro math courses. Row 2 considers overlapsonly with native students. Row 3 limits the sample to those students whotake another math course at some point and counts only overlaps in mathcourses. Regressions include controls for course-by-term and course-by-professor fixed effects, number of natives in the initial course, peer abil-ity, peer characteristics, course size, and individual controls. Standard er-rors in parentheses are clustered by professor. Significance levels: *0.10,**0.05 ***0.01.
53