diion paper erie - ftp.iza.orgftp.iza.org/dp11166.pdf · diion paper erie iza dp no. 11166 jeffrey...
TRANSCRIPT

DISCUSSION PAPER SERIES
IZA DP No. 11166
Jeffrey A. GroenSabrina Wulff Pabilonia
Snooze or Lose: High School Start Times and Academic Achievement
NOVEMBER 2017

Any opinions expressed in this paper are those of the author(s) and not those of IZA. Research published in this series may include views on policy, but IZA takes no institutional policy positions. The IZA research network is committed to the IZA Guiding Principles of Research Integrity.The IZA Institute of Labor Economics is an independent economic research institute that conducts research in labor economics and offers evidence-based policy advice on labor market issues. Supported by the Deutsche Post Foundation, IZA runs the world’s largest network of economists, whose research aims to provide answers to the global labor market challenges of our time. Our key objective is to build bridges between academic research, policymakers and society.IZA Discussion Papers often represent preliminary work and are circulated to encourage discussion. Citation of such a paper should account for its provisional character. A revised version may be available directly from the author.
Schaumburg-Lippe-Straße 5–953113 Bonn, Germany
Phone: +49-228-3894-0Email: [email protected] www.iza.org
IZA – Institute of Labor Economics
DISCUSSION PAPER SERIES
IZA DP No. 11166
Snooze or Lose: High School Start Times and Academic Achievement
NOVEMBER 2017
Jeffrey A. GroenU.S. Bureau of Labor Statistics
Sabrina Wulff PabiloniaU.S. Bureau of Labor Statistics and IZA

ABSTRACT
IZA DP No. 11166 NOVEMBER 2017
Snooze or Lose: High School Start Times and Academic Achievement*
Many U.S. high schools start classes before 8:00 A.M., yet research on circadian rhythms
suggests that students’ biological clocks shift to later in the day as they enter adolescence.
Some school districts have moved to later start times for high schools based on the prospect
that this would increase students’ sleep and academic achievement. This paper examines
the effect of high school start times on student learning. We use longitudinal data from
the Child Development Supplement to the Panel Study of Income Dynamics (PSID-CDS)
to conduct the first study of this relationship using a nationally-representative sample of
students. We also use the CDS time diaries to explore the effects of high school start times
on students’ time allocation. Results indicate that female students who attend schools with
later start times get more sleep and score higher on reading tests. Male students do not get
more sleep when their schools start later and their test scores do not change.
JEL Classification: I12, I20, J22
Keywords: academic achievement, school start times, sleep, time allocation
Corresponding author:Sabrina Wulff PabiloniaU.S. Bureau of Labor Statistics2 Massachusetts Ave. NE, Rm. 2180Washington, DC 20212USA
E-mail: [email protected]
* All views expressed in this paper are those of the authors and do not necessarily reflect the views or policies of
the U.S. Bureau of Labor Statistics. We have benefitted from the comments of participants at the PSID Annual Users’
Conference, the Society of Government Economists conference, the Southern Economic Association meetings, the
“Perspectives on Time Use in the U.S.” conference, the U.S. Bureau of Labor Statistics, the Association for Education
Finance and Policy annual conference, the Society of Labor Economists meetings, and the “Using Time Diary Data
in Education Research” conference. We are grateful to Natasha Cabrera, Michael Dalton, Osea Giuntella, Jennifer
Heissel, Peter Hinrichs, Naci Mocan, Phyllis Payne, Anne Polivka, Randall Reback, Joseph Sabia, Jennifer Steele, and
Jay Stewart for helpful discussions and detailed comments. We thank Mary Carskadon and Peter Hinrichs for sharing
their data on school start times. The authors thank the University of Michigan for providing access to the restricted-
use versions of the Child Development Survey of the Panel Study of Income Dynamics (PSID) and the National Center
for Education Statistics (NCES) for providing access to the restricted-use version of the Schools and Staffing Survey.
To comply with NCES disclosure requirements, all observation counts in this paper have been rounded to the nearest
ten. The collection of the PSID data used in this study was partly supported by the National Institutes of Health under
grant number R01 HD069609 and the National Science Foundation under award number 1157698.
2
I. Introduction
Over the past decade, many U.S. school districts have pushed their high school start times
later in response to surveys suggesting that teens are not getting enough sleep and evidence from
sleep scientists suggesting that children’s circadian rhythms shift to later in the day as they enter
adolescence.1 Poor or inadequate sleep is correlated with higher rates of obesity, lower cognitive
performance, and higher rates of depression (Pilcher and Hufcutt 1996; Roenneberg 2013).
Therefore, shifting to later start times has the promise of increasing both sleep and academic
achievement. At the same time, shifting to later start times often occurs with much disruption to
local communities’ schedules and can potentially raise busing costs.2 For example, changing
high school start times would require employers who provide teenagers with after-school jobs
and providers of extracurricular activities to make scheduling adjustments (Shapiro 2015;
Wahlstrom 1999).
The link between school start times and achievement has received much attention in the
popular press, by the health community, and even by Congress. House Concurrent Resolution
176, introduced to Congress in 2007 as the “Zzz’s to A’s Resolution” but not passed, called for
secondary schools nationwide to begin the school day after 9:00 A.M. More recently, the
American Academy of Pediatrics (2014) recommended that “in most districts, middle and high
schools should aim for a starting time of no earlier than 8:30 A.M.” If delaying start times
causes students to get more sleep, students may experience increases in positive health outcomes
1 Some of these changes in school start times have been documented by Start School Later, Inc.
(2015). 2 Many school districts originally set early schedules for high schools to implement less-
expensive multiple-tiered busing schedules. One way for high schools to start later without
affecting younger students’ schedules would be to add buses. An alternative that does not add to
transportation costs would be to switch the bell schedules of high schools with those of either
middle schools or elementary schools.

3
and cognitive performance—and ultimately academic achievement. Early start times, however,
may not be detrimental to learning if students are able to adapt to waking up early or if teachers
are more productive with early schedules. Some recent papers (Carrell, Maghakian, and West
2011; Edwards 2012; Heissel and Norris 2017; Hinrichs 2010; Luong, Lusher, and Yasenov
2017; Wong 2011) have examined whether changing school start times results in a positive effect
on measurable academic outcomes, with mixed results.
The goals of this paper are twofold: 1) to examine whether school start times affect
student learning, and 2) to examine the effects of school start times on students’ time allocation,
especially sleep time, in order to more fully understand the mechanisms through which changing
start time affects student learning. This paper contributes to the extant literature on the effects of
school start times in two ways: 1) we use longitudinal data from a nationally-representative
sample of high school students aged 13-18 (the Child Development Supplement to the Panel
Study of Income Dynamics [PSID-CDS]) whereas prior studies examined the effects of school
start times on student learning at a school, within a state or metropolitan area, or at the high-
school level, and 2) we use time diaries to explore the effects of high school start times on
students’ time allocation, which could help to explain any observed effects on academic
achievement beyond a disturbance in natural sleep cycles. Time diaries are believed to produce
more-accurate estimates of time spent doing activities than surveys asking about usual time spent
on activities (Juster, Ono, and Stafford 2003). Our time-diary estimates suggest that students
actually sleep about an hour more than reported in studies asking about usual sleep on a school
night.
Results indicate that female students who attend schools with later start times get more
sleep and score higher on reading tests, but not on math tests. We find that shifting start time one

4
hour later results in an increase in reading test scores by 0.15 standard deviations. Male students,
however, do not get more sleep with a later start time and we do not observe any effects of
school start times on their test scores. We also find that girls with a later start time are more
likely to be on a sports team, though they spend less time on other schooling activities (such as
SAT prep). Male students with a later start time spend less time on computer games and less time
with their parents, but spend more time on personal care activities.
II. Background and Literature Review
A. Sleep Patterns and Sleep Science
A sleep-laboratory study among adolescents given a 10-hour sleep opportunity suggested
that adolescents need on average 9.2 hours of sleep each night (Carskadon et al. 1980). Recently,
the National Sleep Foundation recommended that teenagers (ages 14-17) sleep between 8 and 10
hours each night (Hirshkowitz et al. 2015). However, a national survey of adolescents found that
adolescents in high school reported sleeping on average only 7.2 hours on the typical school
night (National Sleep Foundation 2006).3 About 45 percent of U.S. public high schools started
the school day before 8:00 A.M. in 2015-2016, and about 86 percent started before 8:30 A.M.
(Taie and Goldring 2017). Advocates of later bell times argue that delaying bell times would
allow students to get more sleep, which would promote cognitive functioning during the school
day and improve academic achievement (e.g., Jacob and Rockoff 2011; National Sleep
Foundation 2013).
3 Estimates from time diaries suggest that adolescents actually sleep slightly longer than
estimates from surveys about usual hours (e.g., Kalenkoski and Pabilonia 2012). The time-diary
estimates from the PSID-CDS and ATUS both fall close to the lower bound of the appropriate
sleep-duration range for adolescents as specified in the National Sleep Foundation’s
recommendations (Hirshkowitz et al. 2015).

5
These claims have a basis in sleep science. Sleep scientists postulate that sleep/wake
behavior in humans is coordinated by two processes: a circadian timing system and a
homeostatic system (Borbely 1982). The circadian system is associated with the hormone
melatonin, is influenced by light and darkness, and tends to make humans tired during the
nighttime hours. The homeostatic system provides sleep pressure that increases the longer a
person is awake and decreases with sleep. There is some evidence that the circadian system of
humans undergoes a phase shift in adolescence (associated with puberty) toward later bedtimes
and later wake-up times (Carskadon, Vieira, and Acebo 1993). A later sleep/wake cycle may also
be promoted by a slower accumulation of homeostatic sleep pressure, allowing adolescents to
stay awake longer (Crowley, Acebo, and Carskadon 2007).
In addition to biological factors, environmental factors appear to contribute to the later
sleep/wake cycle of adolescents. These factors include reduced parental influence on bedtimes,
increased homework, and extracurricular activities such as sports, music, and part-time
employment (Carskadon 1990). In short, the evidence from sleep science argues that early start
times are in conflict with the desired sleep patterns of adolescents. Environmental influences and
changes in biological systems may limit the ability of students to make adequate adjustments to
early start times.
B. Start Times and Academic Achievement
Our paper investigates the relationship between starting times in high school and
academic achievement. A small number of papers have investigated this relationship, and the
evidence is mixed. The earliest research in this area used data from the Minneapolis–St. Paul
metropolitan area, where Minneapolis and several suburban districts shifted to later bell times for
their high schools (starting in 1997-98) but St. Paul and other suburban districts maintained early

6
schedules. Wahlstrom (2002) examined Minneapolis high schools before and after the change
and found that attendance rates increased and grades improved slightly. However, Hinrichs
(2010) found no effect of starting times on achievement in an analysis that involved data from
both schools that changed schedules and those that did not change schedules. Using individual-
level ACT test-score data for students in the region who took the test for several years before and
after the policy change, Hinrichs found that students who attended high schools with later start
times did no better on the ACT than students who attended high schools with earlier start times.
Hinrichs obtained similar results using school-level data on starting times and scores on
statewide standardized tests from Kansas and Virginia.
In contrast, Wong (2011) found positive effects of later school start times on school-level
student performance on state standardized tests using a nationally representative cross-sectional
sample of high schools from the National Center for Education Statistics (NCES) 2007-08
Schools and Staffing Survey (SASS) combined with standardized tests obtained from 27 state
departments of education. He also found that average sunlight before 8 A.M., which is tied to
regulating circadian rhythms, has a positive effect on exam performance. Edwards (2012) also
found positive effects of starting times on standardized tests in math and reading for middle
school students in Wake County, North Carolina. Recently, using administrative data from
Florida and observing students aged 8–15 moving across the Central-Eastern time-zone
boundary, Heissel and Norris (2017) found that moving school start times later relative to the
sunrise increased standardized test scores in both math and reading, though especially math
scores for the older children. Carrell, Maghakian, and West (2011) and Luong, Lusher, and
Yasenov (2017) also provide evidence that suggests a positive effect of later start times, at least
for older teenagers. Carrell, Maghakian, and West (2011) found that freshman college students at

7
the U.S. Air Force Academy who began the school day later in the morning performed better in
all of their courses taken that day compared with students who began the day earlier in the
morning. Luong, Lusher, and Yasenov (2017) found that freshman college students at a large
university in Vietnam saw a very small boost in their class grade from starting later, but only for
morning classes. Both Edwards (2012) and Carrell, Maghakian, and West (2011) found that
effects were stronger for students in the lower end of the achievement distribution.
Related literature addresses whether the time of day that students attend a class affects
their performance. Cortes, Bricker, and Rohlfs (2012) found that high school students in Chicago
Public Schools received lower grades and were more likely to be absent from a class when it met
in first period than when it met later in the day. Dills and Hernandez-Julian (2008) found that
college students at Clemson University received higher grades in a class if it met later in the day.
Hansen et al. (2005) found that high school students performed better on cognitive tests given in
the afternoon than in the morning. However, Pope (2016) found that high school students in Los
Angeles County Schools have higher grades if their math or English class is in the morning than
later in the school day, controlling for school start times.
C. Mechanisms
According to several strands of literature, the primary mechanism connecting high school
start time and academic achievement is sleep. There is general evidence that school attendance is
associated with sleep loss. Students sleep less on weekdays during the school year than during
the summer, and during the school year they sleep less on school nights than on non-school
nights (Crowley, Acebo, and Carskadon 2007; Hansen et al. 2005; Stewart 2014). Moreover,
surveys have found that students of all ages who start school earlier in the day obtained less total
sleep on school nights (Carskadon et al. 1998; Knutson and Lauderdale 2009; Stewart 2014;

8
Wolfson and Carskadon 1998; Wolfson et al. 2007).4 When a large school district delayed its
start time for high school by 60 minutes, average hours of sleep on school nights increased and
“catch-up” sleep on weekend nights decreased (Danner and Phillips 2008). In addition, most
prior research suggests that wake-up times change more than bedtimes in response to changes in
school start times (e.g., Knutson and Lauderdale 2009; Minges and Redeker 2016; Stewart
2014). Epstein, Chillas, and Lavie. (1998) found that early start times increased sleepiness in
fifth graders regardless of the amount of sleep the children got. Thus, disrupting natural sleep
cycles could also negatively affect academic achievement.
In addition to the evidence that later start times are associated with more sleep, studies
have related sleep and achievement. Evidence from laboratory studies indicates that sleep
deprivation impairs cognitive performance (Pilcher and Hufcutt 1996). Many studies document
that students who obtain more sleep perform better in school and on standardized tests, although
these correlations do not establish a causal relationship (Eide and Showalter 2012; Wolfson and
Carskadon 2003). Recently, using a fixed-effects strategy, Sabia, Wang, and Cesur (2017) found
that longer sleep was beneficial for success in the classroom as well as increased the probability
of high school graduation and college attendance. They identified 8.5 hours per night as the ideal
amount of sleep for academic success.
Beyond sleep, there are several other potential mechanisms that may mediate the link
between school starting times and academic achievement. Although students with early start
times may get less sleep on school nights, they may be able to make other lifestyle changes so
that their achievement is not affected. For instance, they could use stimulants to promote
4 The range of estimates in the literature for a 60-minute delay in start time is additional sleep of
20 minutes to 60 minutes.

9
alertness for their morning classes, they could receive extra support from their parents (or tutors)
with their homework, or they could nap in class (which we don’t capture with the time diaries).
Starting times may also affect the amount of time that students spend in part-time work, sports,
and other extracurricular activities. In addition, starting times may affect parental employment or
the amount of time that students spend with their parents if they cannot synchronize their work
and school schedules. The latter is of particular interest because parental supervision can
potentially decrease risky behaviors or increase homework time (Aizer 2004). Even though
adolescents may work better later in the day, teachers may prefer earlier start times; as a result,
teachers may be less productive with later start times.5 Each of these things has its own influence
on academic achievement and labor-market outcomes.6
Given the existing literature on starting times, sleep, and student achievement, it seems
likely that other mechanisms are relevant. Specifically, the partial effect of a later starting time
on achievement that operates through sleep is likely positive because a later start time should
increase sleep and more sleep should improve achievement. If the total effect of a later starting
time on achievement is smaller than the partial effect, other mechanisms would appear to be
responsible. For example, later start times may reduce participation in extracurricular activities,
thereby reducing the achievement gains associated with increased sleep.
5 Wahlstrom (1999) reported that some urban high school teachers were negatively impacted by
later school start times. Teachers reported less down time, increased rush-hour traffic, and less
time spent on second jobs. 6 For example, Light (2001) reviewed the positive benefits of student employment; Lipscomb
(2007) found that participation in sports and other extracurricular activities increased students’
math and science scores; and Stevenson (2010) found that increases in state-level female sports
participation following Title IX resulted in increases in female college-attendance rates.

10
III. Data
A. Data Sets Used
Our data come primarily from the Child Development Supplement to the Panel Study of
Income Dynamics (PSID-CDS). The PSID-CDS began in 1997 (referred to henceforth as CDS-I)
with children aged 0-12 and is nationally representative. Up to two children in a family were
interviewed. These children were then reinterviewed in 2002-03 (CDS-II) and again in 2007-08
(CDS-III). After a child reached the age of 18 and was no longer attending high school, his/her
participation in the CDS ended, but he/she was eligible for a follow-up Transition to Adulthood
(TA) survey or the main PSID.
For our study, the CDS-I provides background information on the child’s race, and the
main PSID interviews provide information on the respondent’s family structure and mother’s
education.7 A unique aspect of the PSID-CDS is the collection of two 24-hour time diaries – one
for a randomly-assigned weekday and another for a randomly-assigned weekend day. Each diary
contains start and stop times of students’ primary and secondary activities occurring from
midnight to midnight on the diary day as well as where each activity took place and who was
with them in the room (or who accompanied them on an activity, if they were not at home). We
control for high school-level and school district-level variables by matching our sample to the
NCES Common Core of Data (CCD) using school identifiers from the restricted-use version of
the Panel Study of Income Dynamics (2014).
We obtain school start and end times from several sources, including current (2014-16)
school websites and older school websites archived in the Internet Archive’s Wayback Machine;
7 We use the main PSID interview in 2003 for CDS-II high school respondents and the main
PSID interview in 2007 for CDS-III high school respondents.

11
Start School Later, Inc. (2015); the 2007 and 2011 restricted-use versions of the NCES Schools
and Staffing Survey (SASS); and data provided by Mary Carskadon and Peter Hinrichs. In most
cases, schools do not change their start times from year to year. Usually when we have two
sources of bell times for a school in the same year, the sources concurred. As shown in Appendix
Table A1, our primary source of bell times is school websites.
Our main independent variable is the school start time. School start time is the time of the
first official school bell and is measured in hours since midnight.8 It is reported in decimal form
and thus indicates hours and a fraction of an hour. In our CDS sample, start times ranged from
7:00 A.M. to 9:15 A.M., with a majority of students (79 percent) starting school between 7:30
A.M. and 8:29 A.M. and an average start time of 7:53 A.M.9 Thus, our data set contains greater
variation and range in school start times than those used in most prior studies, with the exception
of Wong (2011). In our regressions, we control for the length of the school day so that our
estimates are the effects of starting the school day later without changing its length (as in
Hinrichs 2010). The length of the school day is created by taking the difference between the
school end time and start time. The length of the school day ranged from 5.5 to 8.75 hours per
day, with an average day length of 7 hours per day.
8 Some schools have “zero period” classes, which meet before first period. Because these classes
are limited in enrollment and usually considered optional, we measure the school start time based
on the beginning of first period. 9 Specifically, 12.8 percent started before 7:30 A.M., 41.5 percent started between 7:30 A.M. and
7:59 A.M., 37.3 percent started between 8:00 A.M. and 8:29 A.M., and 8.4 percent started at
8:30 A.M. or later. Notably, the distribution of start times in our CDS sample is similar to the
distribution of start times for public high schools in the 2007-08 SASS: 15.9 percent started
before 7:30 A.M., 38.1 percent started between 7:30 A.M. and 7:59 A.M., 35.2 percent started
between 8:00 A.M. and 8:29 A.M., and 10.9 percent started at 8:30 A.M. or later. The average
start time in the SASS is also 7:53 A.M. (For these calculations, we weighted the SASS school-
level data by student enrollment in order to provide a proper comparison to the CDS student-
level data.)

12
B. Sample Construction
We examine a subsample of CDS respondents aged 13-18 who were enrolled in grades 9-
12 in a full-time public high school in either CDS-II (2002-03) or CDS-III (2007-08). Appendix
Table A2 details our sample construction. Our main analysis sample includes 1,200 respondents
– 600 females and 600 males – who attended 790 unique high schools.10 For our time-use
analyses, we further restrict the sample to those who had two time diaries and were not missing
more than 180 minutes on a diary day. This resulted in a time-use sample of 1,110 respondents.
We conduct separate analyses by gender because of the huge differences in schooling
achievement and time use between males and females (Goldin, Katz, and Kuziemko 2006; Jacob
2002; Kalenkoski and Pabilonia 2017).11 There is also some evidence that males and females
have different circadian rhythms, with males having more difficulty coping with sleep
deprivation. A recent paper by Lusher and Yasenov (2017) found that males received a boost in
performance relative to females when school started in the afternoon rather than the morning.
C. Academic Outcomes
Our main dependent variables are two test scores: the broad-reading and applied-problem
standardized test scores on the Woodcock Johnson Revised Tests of Basic Achievement (WJ-R)
that were administered at the time of the high school CDS child interview. The broad-reading
test score is considered a general measure of reading achievement while the applied-problem test
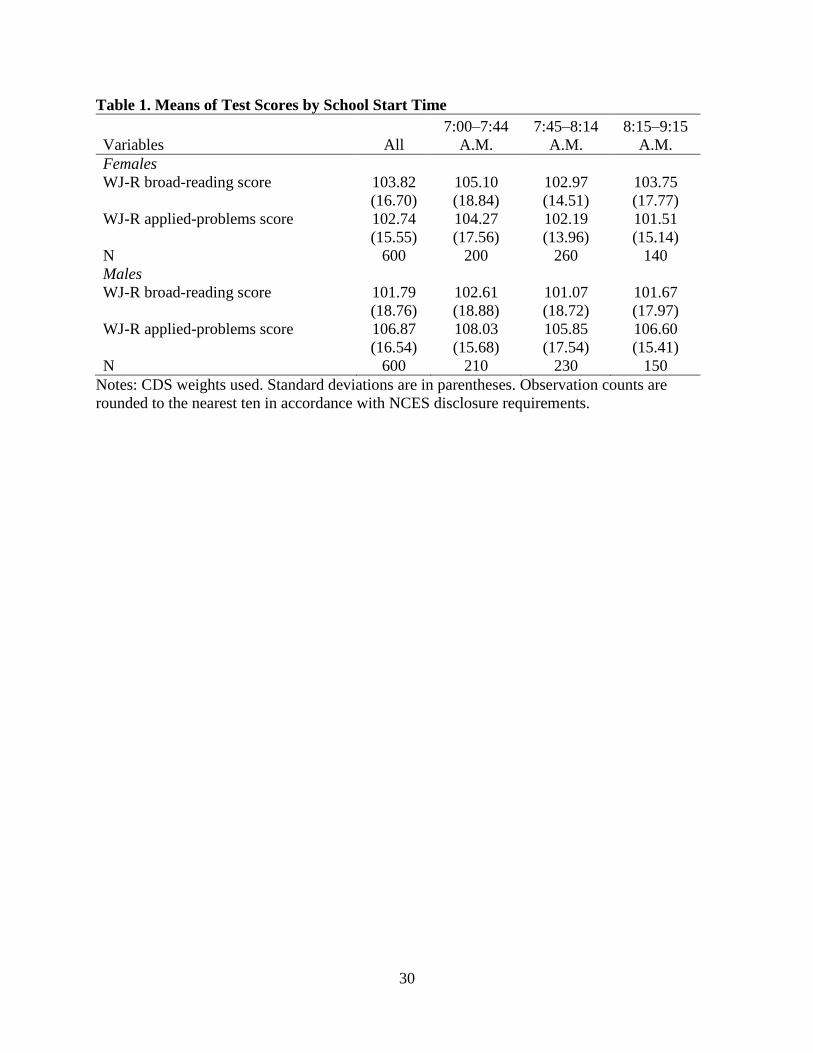
score is considered a general measure of mathematics reasoning achievement. Table 1 includes
overall sample means for the test scores as well as their means in three categories defined by
school start times. Scores are higher for students in the earliest school start-time category (7:00–
10 Observation counts are rounded to the nearest ten in accordance with NCES disclosure
requirements. 11 Pooled results are available upon request for our main results.

13
7:44 A.M.) than in the two later periods (7:45– 8:14 A.M. and 8:15– 9:15 A.M.); however, the
differences are not statistically significant. Male students scored slightly higher than female
students on the WJ-R applied-problems test, a result consistent with the literature on the gender
gap in math test scores (Niederle and Vesterlund 2010). In our econometric analyses below in
Section IV, we examine the relationship between test scores and school start time with a rich set
of controls for individual, family, school, and community characteristics.
D. Intermediate Outcomes
In addition to the academic outcomes, we examine numerous intermediate outcomes,
each of which could be affected by start times. Some of these outcomes are created using the
time diaries, while others are from general survey questions. All measures of time spent on an
activity are reported in hours per day. We calculate school-day measures (Monday through
Thursday), weekday measures, and all-day measures. The latter is calculated by taking a
weighted average of the weekday and weekend-day activity times.12 We argue that measures of
time spent on an activity that are aggregated from time-use diaries are preferable to measures of
“usual” time spent because they are less subject to both aggregation bias and social desirability
bias (Juster, Ono, and Stafford 2003). For example, if a society places a high value on hard work
at the expense of sleep, individuals may overestimate their usual hours worked and
underestimate their usual hours of sleep. We consider the effects of school start time on students’
activities across the day as well as on annual sports participation, daily time spent with parents,
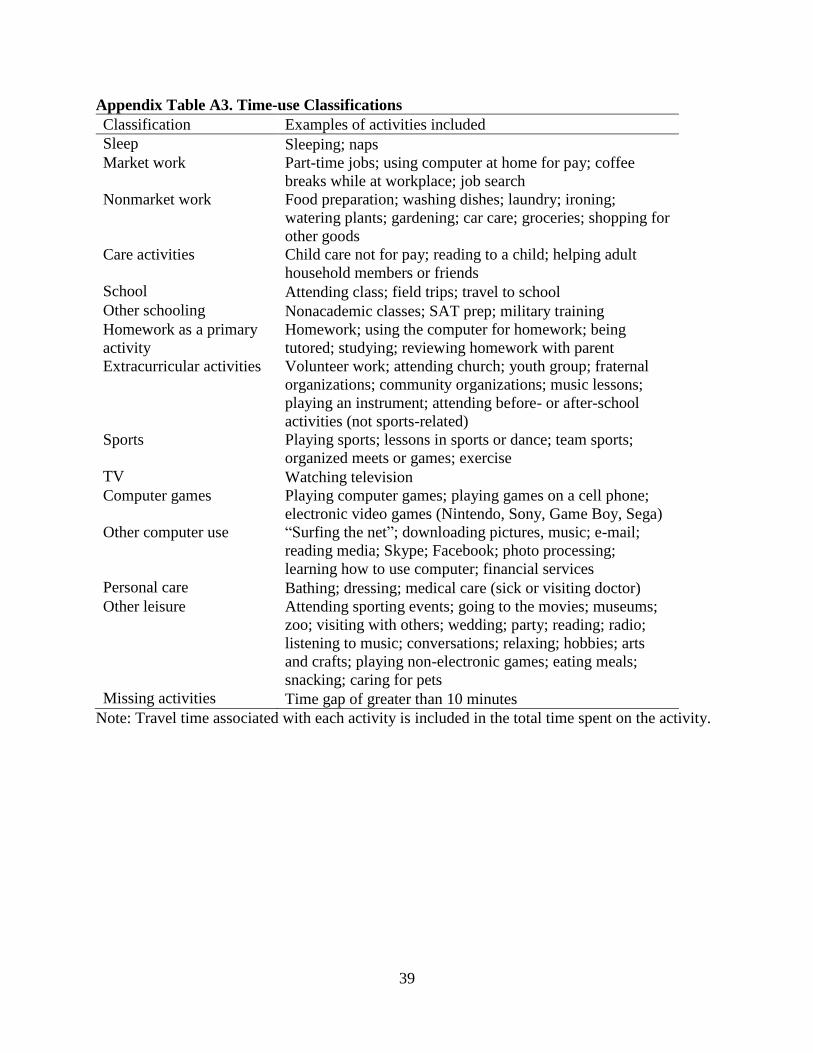
employment, weight, and mood. See Appendix Table A3 for the 15 activity categories that we
use to classify students’ time allocation across the day.
12 Specifically, we calculate all-day hours measures as (5/7)*(weekday hours) + (2/7)*(weekend
day hours).

14
Sleep
We examine four measures of sleep on weekdays – all diary sleep (including naps),
nighttime diary sleep, usual night sleep, and naps – in order to observe whether we see tradeoffs
between sleep and start times as observed by previous researchers. The first two diary-sleep
measures are intended to measure sleep on school days. We initially exclude Fridays because
Friday bedtime corresponds to a weekend schedule. Usual night sleep is obtained from the child-
interview portion of the CDS rather than the time diary. We assume that the usual night sleep
reported by students is for a weeknight, because the questionnaire asked “What time do you
usually go to bed on weeknights?” just prior to asking about a usual night’s sleep. Naps include
any time recorded as napping or resting. Later, we also consider sleep on all days to determine
whether students who go to school earlier are able to “catch-up” on sleep on weekend days.13
As shown in Table 2, there is little difference in the sample means between all diary sleep
and night diary sleep (a difference of 0.21 and 0.34 of an hour for females and males,
respectively).14 In most cases, night sleep includes parts of two sleep episodes: the first episode is
the latter part of the sleep cycle begun the day prior to the diary, and the second episode is the
first part of the sleep cycle begun on the day of the diary. Using the weekday-night sleep-diary
measure, we find that female high school students sleep on average 8.29 hours per night but
13 Research by Kim et al. (2011) suggests that weekend catch-up sleep is negatively related to
performance on tasks. 14 One criticism of the diary measure that should not affect our estimates of the effect of school
start times is that night sleep can include sleeplessness (Eide and Showalter 2012). In Appendix
Table A4, we present separate estimates of diary night sleep and sleeplessness on school nights
from the American Time Use Survey (ATUS) for a sample of high school students aged 15-18.
In the ATUS, we find little reporting on sleeplessness, and teens’ night sleep is actually slightly
longer than that reported in the CDS. Even though the ATUS diary runs from 4 A.M. on one day
to 4 A.M. on the next day, the duration of the last activity (usually sleep) is obtained. Therefore,
the ATUS measures a complete night-sleep episode.

15
report sleeping only 7.35 hours on a “usual” night. Male students sleep slightly more – on
average 8.33 hours per night on their weekday diary day and 7.54 hours on a “usual” night.
These diary-based sleep measures closely match those obtained from ATUS (Appendix Table
A4). Thus, we conclude that “usual” night sleep measures are very biased. We also find that
male students nap (0.34 hours on average) for longer periods on average than do female students
(0.21 hours on average), suggesting more daytime sleepiness, which would be consistent with
males having more difficulty coping with sleep deprivation.
In addition to examining the effect of start times on sleep time, we consider how start
times affect students’ wake-up times and bedtimes. Wake-up time is defined as the end time of
last night-sleep episode occurring before 1:00 P.M. on Monday through Thursday diary days.15
Bedtime is defined as either the start time of the last recorded night-sleep episode (if beginning
after noon on the diary day) or the start time of the first night episode that begins at or after
midnight but before noon (if the former episode does not exist) on Monday through Thursday
diary days.16 On average, female and male students wake up at 6:44 A.M. on school-day
mornings and go to sleep at 10:23 P.M. on school nights. In Table 3, we report the average hours
per day spent on activities on both weekdays (Monday through Friday) and all days. Over all
days, female students sleep 9.05 hours per day on average while male students sleep 9.07 hours
per day on average, suggesting that students do try to catch-up on sleep on the weekend and are
likely suffering from sleep deprivation during the week.
15 Some students report starting several night-sleep episodes in the early-morning hours, with
other short spells of another activity in between periods of sleep. Although Friday diary days
could also be used to examine wake-up times, we do not include them so that our estimated
effects on night sleep, bedtime, and wake-up time are for the same sample. 16 Bedtime is measured in hours. For bedtimes after midnight, we add 24 hours so that they occur
after bedtimes before midnight.

16
Other intermediate outcomes
It is often argued by opponents of later start times that moving the high school day later
would mean that sports teams cannot practice or would have to shorten their practices due to less
daylight after school (National Sleep Foundation 2005a). Opponents also argue that students’
afterschool employment would be negatively affected (National Sleep Foundation 2005b). We
examine two measures of sports participation. One, from the child-interview portion of the CDS,
is whether the student participates in an athletic or sports team at school during that academic
year. The other is the number of hours the student participates in sports on the diary day. On
average, male students are much more likely to participate in a sports team than female students
(39 percent versus 28 percent). We examine two measures of employment. One is whether the
student is currently employed. The second is the number of hours worked on the diary day. Male
and female students have roughly the same employment participation.
Proponents of later start times argue that students would be less tired if they started
school later and thus be more efficient at doing their homework; however, they may also be more
rested and thus able to do more homework, resulting in better grades. Indeed, Edwards (2012)
found that middle school students spent more time doing homework when schools started later.
We examine only homework time that was recorded as a primary activity.17
School start times may also affect the amount of time that students spend with their
parents on weekdays, due to the degree of synchronization between school schedules and
parents’ work schedules. We measure time with parents as the sum of all hours on activities
where the student reported being in the same room with a parent while at home or accompanying
17 Students often report doing homework as a secondary activity (Kalenkoski and Pabilonia
2017; Pabilonia 2015).

17
a parent while away from the home. We measure a student’s being overweight using an indicator
for whether the student’s age and gender-specific BMI percentile was equal to 85 or greater (i.e.,
being considered overweight or obese according to the CDC). Male students are more likely than
female students to be considered overweight (36 percent versus 30 percent). Proponents of later
start times argue that the lack of sleep resulting from early start times contributes to students’
mood problems (Wahlstrom 2002). We measure students’ mood with an indicator for whether
the student was “many times” or “always” sad in the last two weeks. Consistent with other
surveys (e.g., Youth Behavior Risk Survey [Department of Health and Human Services 2008]),
female students are more likely than male students to report being sad (24 percent versus 10
percent).
IV. Econometric Analyses
To examine the effect of start times on student learning and time allocation, we estimate
linear models using Ordinary Least Squares (OLS)18:
Y = b0 + b1S + b2D +b3X+ u (1)
where the dependent variable, Y, is the test score outcome or time use outcome; S denotes school
start time; D denotes the length of the school day; X is the vector of control variables; b0, b1, b2,
and b3 are the coefficients to be estimated; and u~N(0,1). The subscripts indicating observation
and outcome are suppressed. Length of school day (D) is included because we are interested in
the effect of changing the school start time without changing the length of the school day. The
regressions and means are weighted using the CDS child weights. Standard errors are adjusted
for clustering by school.
18 In cases where the outcome variable is an indicator variable, we still estimate a linear
probability model; estimates using a probit model yield similar results, but in some instances
some controls perfectly predicted the outcome and had to be dropped from the specifications.

18
In estimating these equations, we are interested in the causal effect of start time on
achievement and time use. A potential concern with our approach is that students and schools
with different start times may be different in ways related to achievement. Two aspects of our
approach attempt to deal with concerns about omitted variables bias. First, we include a rich set
of controls for individual, family, high school, school-district, county, and state characteristics.19
Second, our individual controls include lagged versions of the test scores that are the dependent
variables in our achievement regressions. Specifically, the lagged test scores are age-adjusted
broad-reading and applied-problems standardized-test scores from the Woodcock-Johnson
Revised Tests of Basic Achievement (WJ-R) that were given during the CDS child interview
occurring about five years prior to the CDS high school observation.20 We include these lagged
test scores to control for prior achievement and ability. Tests taken at that time are more likely to
measure inherent ability than tests taken during high school.
In addition to the lagged test scores, our individual controls include indicators for race
and Hispanic ethnicity, Census region, grade in school, and interview year and month. We also
control for whether the student was ever classified by a school as needing special education for
learning disabilities or language problems. We control for several family characteristics,
including whether the student lives with a single parent, a stepmother, a stepfather or with other
family (the omitted category is ‘lives with two biological parents’), the number of other children
under the age 19 in the family unit, whether the mother has a college degree, whether the father
has a college degree, and whether the student received a free or reduced-price lunch (FRL) at
school.
19 See Appendix Table A5 for means of these control variables by school start time category. 20 Approximately 17 percent of the sample is missing one of these scores. We include an
indicator for missing scores and impute a score for these students using the average score.

19
Although we are primarily interested in the total effects of start time on achievement and
time allocation, we also estimate a specification where we include controls for sunlight. In this
case, b1 is the partial effect of start time that operates through clock time, holding morning
sunlight (or sunrise time) constant.
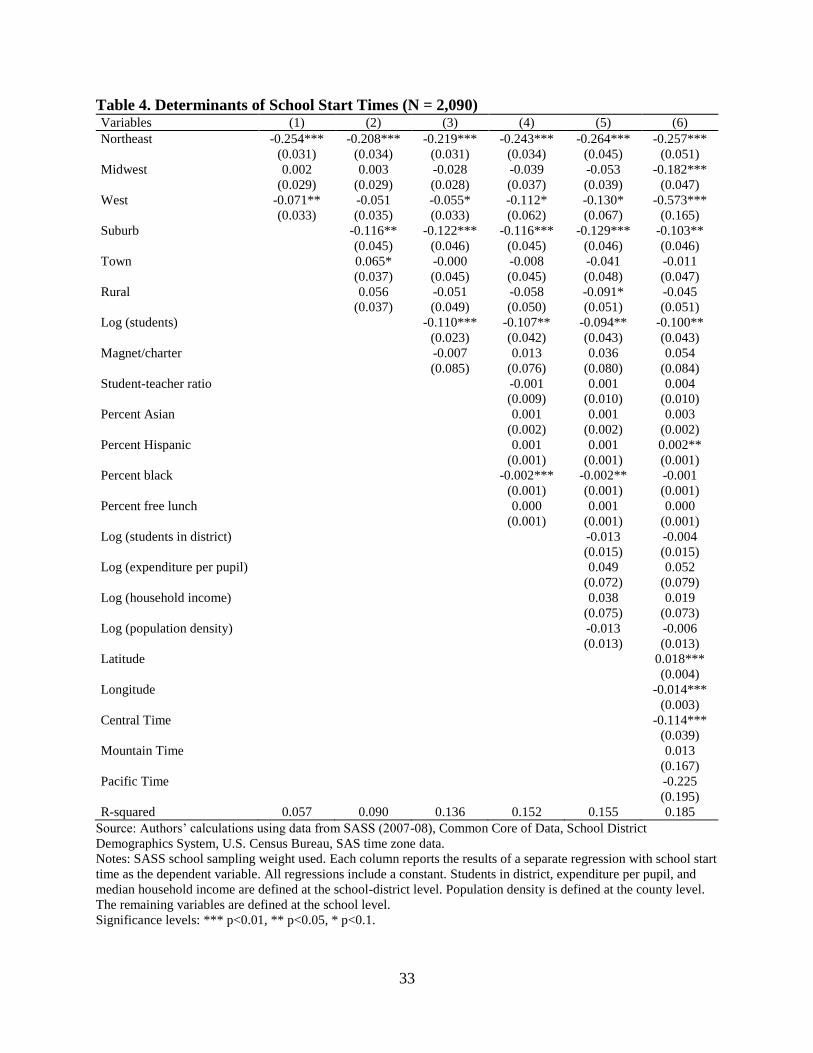
To motivate our choice of school, school-district, and county controls, we estimate a
series of regressions using the high-school-level data in the 2007-08 SASS. Our intent is to
control for school or community factors that might be correlated with both achievement and start
times. The dependent variable in the regressions is school start time (coded in hours since
midnight), and each regression has a different set of controls. The school controls are Census
region, urbanicity, number of students, student-teacher ratio, percent of students by race, percent
eligible for FRL, and an indicator for magnet or charter school. The district variables are the
number of students, expenditure per student, and median household income. The county variable
is the population density.
The results, shown in Table 4, indicate that the most important determinants of start times
are Census region (schools in the Northeast start earlier), urbanicity (suburban schools start
earlier), and school size (larger schools start earlier). The variation by urbanicity and school size
is consistent with the notion that high schools in large suburban districts are more likely to have
earlier start times in order to reduce transportation costs. The final specification includes latitude,
longitude, and time-zone indicators. The estimated effects of latitude and longitude point to the
importance of the amount of sunlight in the morning to school start times. The farther east is a
school (an increase in longitude), the earlier the sun rises and the earlier is the start time. The
farther north is a school (an increase in latitude), the later the sun rises (in fall and winter, when
most of our sample is drawn) and the later is the start time. Thus, school districts appear to take
20
account of morning sunlight when setting starting times. Overall, there are differences in school
start times based upon school characteristics, some of which may all be correlated with
achievement. Our intent is to control for school or community factors that might be correlated
with both achievement and start times.
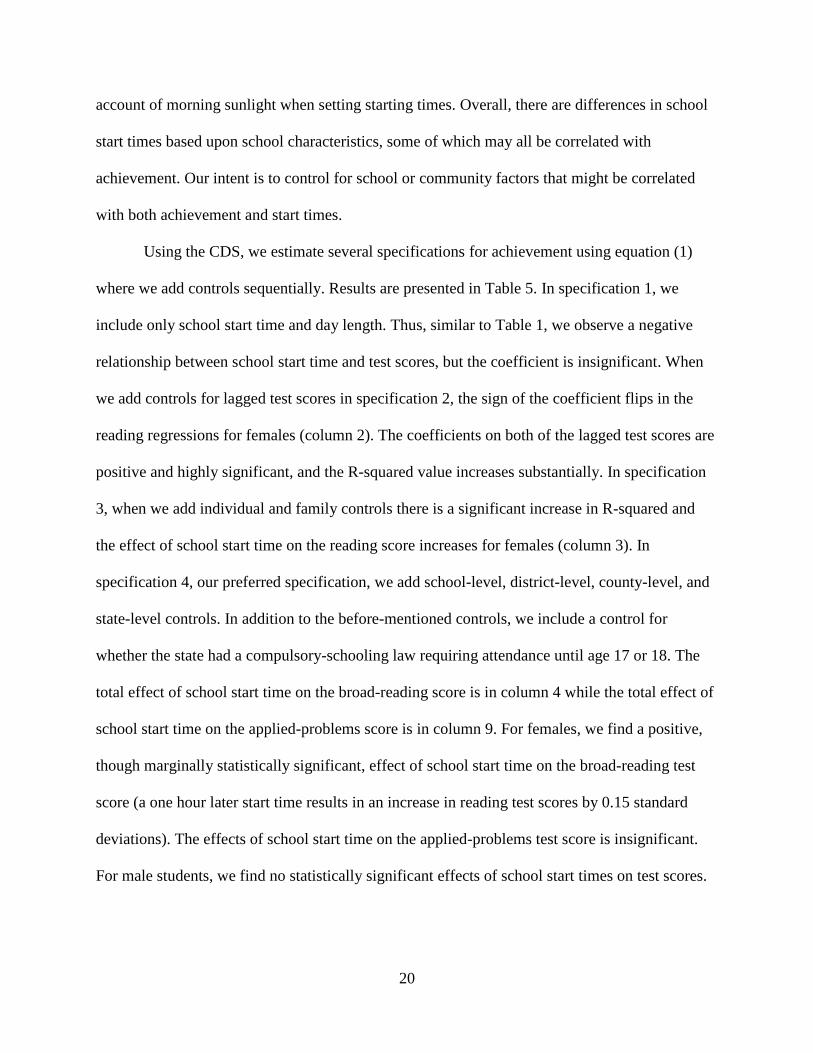
Using the CDS, we estimate several specifications for achievement using equation (1)
where we add controls sequentially. Results are presented in Table 5. In specification 1, we
include only school start time and day length. Thus, similar to Table 1, we observe a negative
relationship between school start time and test scores, but the coefficient is insignificant. When
we add controls for lagged test scores in specification 2, the sign of the coefficient flips in the
reading regressions for females (column 2). The coefficients on both of the lagged test scores are
positive and highly significant, and the R-squared value increases substantially. In specification
3, when we add individual and family controls there is a significant increase in R-squared and
the effect of school start time on the reading score increases for females (column 3). In
specification 4, our preferred specification, we add school-level, district-level, county-level, and
state-level controls. In addition to the before-mentioned controls, we include a control for
whether the state had a compulsory-schooling law requiring attendance until age 17 or 18. The
total effect of school start time on the broad-reading score is in column 4 while the total effect of
school start time on the applied-problems score is in column 9. For females, we find a positive,
though marginally statistically significant, effect of school start time on the broad-reading test
score (a one hour later start time results in an increase in reading test scores by 0.15 standard
deviations). The effects of school start time on the applied-problems test score is insignificant.
For male students, we find no statistically significant effects of school start times on test scores.

21
In specification 5, we add sunlight controls. For females, the partial effect of school start
time on the broad-reading test score is similar in magnitude, but not statistically significant at
conventional levels (a one hour later start time results in an increase in reading test scores by
0.12 standard deviations). Thus, a large portion of the total effect results from a later clock time.
It is not surprising that the coefficient loses significance because now the effect is identified
primarily from local comparisons. For example, two schools in Maryland (in the Eastern time
zone) both have an average sunrise of about 7:00 A.M., but one school starts at 7:30 A.M. while
another starts at 8:00 A.M. Similarly, two schools in Michigan (also in the Eastern time zone)
both have an average sunrise of about 7:30 A.M., but one school starts at 7:45 A.M. while
another starts at 8:15 A.M.
In Table 6, we present the effects of school start times and school day length on both the
timing and duration of sleep on school days (using the Monday through Thursday diaries)
without sunlight controls.21 We find different effects for female and male students. For female
students, we find that in response to a delay in start time of one hour, they sleep 0.599 hours (36
minutes) more per night and 0.634 hours (38 minutes) more on their diary day. In response to a
delay in start time by one hour, male students increase their night sleep by only 0.327 hours (20
minutes, not statistically significant). In addition, for males, the effect of delaying the start time
on total diary sleep on weekdays is negative (again, not statistically significant). If we use the
“usual sleep” measure, the effect of school start time on night sleep for both female and male
21 Estimates for the other control variables are not presented here for the sake of brevity but are
available from the authors upon request. Estimates for the sleep regressions including sunlight
controls are presented in Appendix Table A6. The estimated effects decrease slightly suggesting
that a large portion of the effect results from a later clock time but also that morning sunlight is
positively correlated with start time and total sleep time.

22
students is smaller.22 For male students, we do find a large negative effect of start time on nap
time (-0.464 hours for one hour delayed start time), but the effect is not significant at
conventional levels. This is again in line with research suggesting sleep deprivation has a large
effect on males. Overall, our different findings of the effects of start times on sleep by gender are
consistent with our different findings of the effects of start times on test scores by gender.
For female students, we find that the extra sleep from starting school later is a result of
waking up 0.584 of an hour later in the day, with no effect on bedtime. This is consistent with
prior research by Knutson and Lauderdale (2009) and Wolfson et al. (2007). For male students,
we find that a delay in start time results in a later wake-up time of 0.575 of an hour (35 minutes)
but also a small delay in bedtimes (0.267 of an hour, or 16 minutes), which explains why
delaying the school start time does not have a significant effect on their nighttime diary sleep.23
Broadly speaking, these effects on weekday wake-up times are consistent with the notion that
early school schedules are not in sync with adolescents’ circadian rhythms.
In Table 7, we present the effects of school start times on a full set of time-use activities
and some other intermediate outcomes, including sports participation, time with parents,
employment, and health outcomes. For female students, we find little difference in the estimated
effects of weekday and all-day sleep duration, suggesting that those who must wake early during
the week for an early school start do not “catch-up” on sleep over the weekend. We find that start
time has a small negative effect on other schooling activities, such as SAT prep, which could
potentially translate into lower test scores. Contrary to one of the common arguments put forth
22 For female students, we find that in response to a delay in start time of one hour, they sleep
0.384 hours more per night. For male students, we find that in response to a delay in start time of
one hour, they sleep 0.213 hours more per night, but the effect is not statistically significant. 23 For male students, we also find that their bedtime is earlier with a longer school day.

23
by opponents of later school start times, later start times have a large positive effect on
participation in sports teams for female high school students. This could lead to higher test scores
given the positive link between sports participation and achievement found in the literature
(Lipscomb 2007; Stevenson 2010).
For male students, we again find no effect of start time on sleep (on weekdays and on all
days). We do find that they spend less time playing computer games when school starts later.
They also spend less time with their parents on all days and more time on personal care.
Collectively, these changes in time allocation for male students may have offsetting effects on
test scores. It seems likely though that the lack of a positive relationship between school start
times and academic outcomes for males is due to the lack of a large increase in sleep.
With later start times, students are not any more or less likely to hold a job or spend time
at work, which is counter to the argument made by opponents of later school start times.
Contrary to previous studies, we also do not find any effects of start time on time spent on
homework, student mood, or the probability of being overweight.
V. Conclusion
Using longitudinal data on a nationally-representative sample of students, we find that
when high school starts 60 minutes later, female students sleep 36 minutes more on school nights
on average. This effect comes about entirely through a delay in wake-up time rather than a
change in bedtime. We find some evidence that this increase in sleep translates into improved
academic achievement. For female students, a one hour delay in high school start time results in
an increase in reading test scores by 0.15 standard deviations but no change in math test scores.
This effect on reading test scores is more than three times as large as found by Heissel and Norris
(2017), but our students are older and more likely to have gone through puberty. The effect size

24
is very similar to the effect of reducing class size from 22 students to 15 students in grades K-3,
though the estimated costs of reducing class size exceed the estimated costs of adjusting school
start time (Jacob and Rockoff 2011; Schanzenbach 2006). With regard to other changes in time
allocation as a result of a delay in school start time, we find that girls are much more likely to be
on a sports team, but spend slightly less time on other schooling activities, such as SAT prep.
Male students, however, do not sleep longer when their schools start later nor do we find
any effects of school start times on their test scores. We do find that they spend less time playing
computer games and less time with their parents when school starts later, but spend more time on
personal care activities.
Thus, overall our results suggest that starting school later has beneficial effects on student
achievement, at least for girls. In addition, we do not find evidence that students lose out on
extracurricular activities or employment opportunities when school starts later, contrary to the
claims of opponents of later start times. We also find that regardless of start times students do a
similar amount of homework.

25
References
Aizer, Anna. 2004. “Home Alone: Supervision after School and Child Behavior.” Journal of
Public Economics 88: 1835-1848.
American Academy of Pediatrics. 2014. “School Start Times for Adolescents.” Pediatrics
134(3): 642-649.
Borbely, Alexander A. 1982. “A Two Process Model of Sleep Regulation.” Human
Neurobiology 1(3): 195-204.
Carrell, Scott E., Teny Maghakian, and James E. West. 2011. “A’s from Zzzz’s? The Causal
Effect of School Start Time on Academic Achievement of Adolescents.” American Economic
Journal: Economic Policy 3(3): 62–71.
Carskadon, Mary A., Kim Harvey, Paula Duke, Thomas F. Anders, Iris F. Litt, and William C.
Dement. 1980. “Pubertal Changes in Daytime Sleepiness.” Sleep 2(4): 453-460.
Carskadon, Mary A. 1990. “Patterns of Sleep and Sleepiness in Adolescents.” Pediatrician 17:5-
12.
Carskadon, Mary A., Cecilia Vieira, and Christine Acebo. 1993. “Association between Puberty
and Delayed Phase Preference.” Sleep 16(3): 258-262.
Carskadon, Mary A., Amy R. Wolfson, Christine Acebo, Orna Tzischinsky, and Ronald Seifer.
1998. “Adolescent Sleep Patterns, Circadian Timing, and Sleepiness at a Transition to Early
School Days.” Sleep 21(8): 871-881.
Cortes, Kalena E., Jesse Bricker, and Chris Rohlfs. 2012. “The Role of Specific Subjects in
Education Production Functions: Evidence from Morning Classes in Chicago Public High
Schools.” B.E. Journal of Economic Analysis and Policy, Contributions, 12(1): Article 27.
Crowley, Stephanie J., Christine Acebo, and Mary A. Carskadon. 2007. “Sleep, Circadian
Rhythms, and Delayed Phase in Adolescence.” Sleep Medicine 8(6): 602-612.
Danner, Fred, and Barbara Phillips. 2008. “Adolescent Sleep, School Start Times, and Teen
Motor Vehicle Crashes.” Journal of Clinical Sleep Medicine 4(6): 533-535.
Department of Health and Human Services, Centers for Disease Control and Prevention. 2008.
“Youth Risk Behavior Surveillance – United States, 2007.” Morbidity and Mortality Week
Report. June 6, 2008. Vol. 57, No. SS-4.
Dills, Angela K., and Rey Hernandez-Julian. 2008. “Course Scheduling and Academic
Performance.” Economics of Education Review 27(6): 646-654.

26
Edwards, Finley. 2012. “Early to Rise? The Effect of Daily Start Times on Academic
Performance.” Economics of Education Review 31(6): 970–983.
Eide, Eric R., and Mark H. Showalter. 2012. “Sleep and Student Achievement.” Eastern
Economic Journal 38(4): 512-524.
Epstein, R., Nela Chillag, and Peretz Lavie. 1998. “Starting Times of School: Effects on Daytime
Functioning of Fifth-grade Children in Israel.” Sleep 21(3): 250-256.
Goldin, Claudia, Lawrence F. Katz, and Ilyana Kuziemko. 2006. “The Homecoming of
American College Women: The Reversal of the College Gender Gap.” Journal of Economic
Perspectives 20(4): 133-156.
Hansen, Martha, Imke Janssen, Adam Schiff, Phyllis C. Zee, and Margarita L. Dubocovich.
2005. “The Impact of School Daily Schedule on Adolescent Sleep.” Pediatrics 115(6): 1555-
1561.
Heissel, Jennifer, and Samuel Norris. 2017. “Rise and Shine: The Effect of School Start Times
on Academic Performance from Childhood through Puberty.” Journal of Human Resources.
doi:10.3368/jhr.53.4.0815-7346R1.
Hinrichs, Peter. 2010. “When the Bell Tolls: The Effects of School Starting Times on Academic
Achievement.” Education Finance and Policy 6(4): 486–507.
Hirshkowitz, Max, et al. 2015. “National Sleep Foundation’s Sleep Time Duration
Recommendations: Methodology and Results Summary.” Sleep Health 1(1): 40-43.
Jacob, Brian A. 2002. “Where the Boys Aren’t: Non-cognitive Skills, Returns to School and the
Gender Gap in Higher Education.” Economics of Education Review 21(6): 589-598.
Jacob, Brian A., and Jonah E. Rockoff. 2011. Organizing Schools to Improve Student
Achievement: Start Times, Grade Configurations, and Teacher Assignments. Discussion Paper
2011-08. Brookings Institution: Washington, DC.
Juster, F. Thomas, Hiromi Ono, and Frank P. Stafford. 2003. “An Assessment of Alternative
Measures of Time Use.” Sociological Methodology 33: 19-54.
Light, Audrey. 2001. “In-school Work Experience and the Returns to Schooling.” Journal of
Labor Economics 19(1): 65-93.
Lipscomb, Stephen. 2007. “Secondary School Extracurricular Involvement and Academic
Achievement: A Fixed Effects Approach.” Economics of Education Review 26(4): 463-472.
Luong, Phuc, Lester Lusher, and Vasil Yasenov. 2017. “Sleep and Student Success: The Role of
Regularity vs. Duration.” IZA Discussion Paper No. 11079.

27
Lusher, Lester, and Vasil Yasenov. 2017. “Gender Performance Gaps: Quasi-Experimental
Evidence on the Role of Gender Differences in Sleep Cycles.” Economic Inquiry.
doi:10.1111/ecin.12483
Kalenkoski, Charlene Marie, and Sabrina Wulff Pabilonia. 2012. “Time to Work or Time to
Play: The Effect of Student Employment on Homework, Sleep, and Screen Time.” Labour
Economics 19(2): 211-221.
Kalenkoski, Charlene Marie, and Sabrina Wulff Pabilonia. 2017. “Does High School Homework
Increase Academic Achievement?” Education Economics 25(1): 45-59.
Kim, Seog Ju, Yu Jin Lee, Seong-Jin Cho, In-Hee Cho, Weonjeong Lim, and Wonshin Lim.
2011. “Relationship between Weekend Catch-up Sleep and Poor Performance on Attention
Tasks in Korean Adolescents.” Archives of Pediatric and Adolescent Medicine 165(9): 806-812.
Knutson, Kristen L., and Diane S. Lauderdale. 2009. “Sociodemographic and Behavioral
Predictors of Bed Time and Wake Time among U.S. Adolescents Aged 15–17 Years.” Journal of
Pediatrics 154(3): 426-430.
Minges, Karl E. and Nancy S. Redeker. 2016. “Delayed School Start Times and Adolescent
Sleep: A Systematic Review of the Experimental Evidence.” Sleep Medicine Reviews 28: 86-95.
National Sleep Foundation. 2005a. Changing School Start Times: Fayette County, Kentucky.
National Sleep Foundation. 2005b. Changing School Start Times: Wilton, Connecticut.
National Sleep Foundation. 2006. Sleep in America Poll: Summary of Findings. National Sleep
Foundation: Arlington, VA.
National Sleep Foundation. 2013. Backgrounder: Later School Start Times.
http://www.sleepfoundation.org/article/hot-topics/backgrounder-later-school-start-times
(accessed October 24, 2013).
Niederle, Muriel, and Lise Vesterlund. 2010. “Explaining the Gender Gap in Math Test Scores:
The Role of Competition.” Journal of Economic Perspectives 24(2): 129-144.
Panel Study of Income Dynamics, restricted use data. 2014. Produced and distributed by the
Survey Research Center, Institute for Social Research, University of Michigan, Ann Arbor, MI,
2009-2014.
Pabilonia, Sabrina Wulff. 2015. “Children’s Media Use and Homework Time.” The Economics
of Multitasking, ed. Charlene M. Kalenkoski and Gigi Foster, 91-107. New York, NY: Palgrave
Macmillan.
Pilcher, June J., and Allen I. Huffcutt. 1996. “Effects of Sleep Deprivation on Performance: A
Meta-analysis.” Sleep 19: 318-326.
28
Pope, Nolan G. 2016. “How the Time of Day Affects Productivity: Evidence from School
Schedules.” Review of Economics and Statistics 98(1): 1-11.
Roenneberg, Till. 2013. “Chronobiology: The Human Sleep Project.” Nature 498: 427-428.
Sabia, Joseph J., Kurt Wang, and Resul Cesur. 2017. “Sleepwalking Through School: New
Evidence on Sleep and Academic Achievement.” Contemporary Economic Policy 35(2): 331-
344.
Schanzenbach, Diane Whitmore. (2006). “What Have Researchers Learned from Project
STAR?” Brookings Papers on Education Policy (9): 205-228.
Shapiro, Teny Maghakian. 2015. “The Educational Effects of School Start Times.” IZA World of
Labor 181 (August). doi:10.15185/izawol.181.
Start School Later, Inc. 2015. “Success Stories.” http://www.startschoollater.net/success-
stories.html (accessed June 1, 2015).
Stevenson, Betsey. 2010. “Beyond the Classroom: Using Title IX to Measure the Return to High
School Sports.” Review of Economics and Statistics 92(2): 284-301.
Stewart, Jay. 2014. “Early to Bed and Earlier to Rise: School, Maternal Employment, and
Children’s Sleep.” Review of Economics of the Household 12(1): 29-50.
Taie, Soheyla, and Rebecca Goldring. 2017. Characteristics of Public Elementary and
Secondary Schools in the United States: Results from the 2015–16 National Teacher and
Principal Survey First Look (NCES 2017-071). U.S. Department of Education. Washington, DC:
National Center for Education Statistics.
https://nces.ed.gov/pubsearch/pubsinfo.asp?pubid=2017071 (accessed November 13, 2017).
Wahlstrom, Kyla. 1999. “The Prickly Politics of School Starting Times.” Phi Delta Kappan
80(5): 344-347.
Wahlstrom, Kyla. 2002. “Changing Times: Findings from the First Longitudinal Study of Later
High School Start Times.” NASSP Bulletin 86(633): 3-21.
Wolfson, Amy R., and Mary A. Carskadon. 1998. “Sleep Schedules and Daytime Functioning in
Adolescents.” Child Development 69(4): 875-887.
Wolfson, Amy R., and Mary A. Carskadon. 2003. “Understanding Adolescents’ Sleep Patterns
and School Performance: A Critical Appraisal.” Sleep Medicine Reviews 7(6): 491-506.
Wolfson, Amy R., Noah L. Spaulding, Craig Dandrow, and Elizabeth M. Baroni. 2007. “Middle
School Start Times: The Importance of a Good Night’s Sleep for Young Adolescents.”
Behavioral Sleep Medicine 5(3): 194-209.

29
Wong, Justin. 2011. “Does School Start Too Early for Student Learning?” Chapter 2 in Essays
on the Determinants of Student Choices and Educational Outcomes. Dissertation, Stanford
University. https://stacks.stanford.edu/file/druid:wj919hv9027/Dissertation-augmented.pdf
(accessed October 30, 2013).
30
Table 1. Means of Test Scores by School Start Time
Variables All
7:00–7:44
A.M.
7:45–8:14
A.M.
8:15–9:15
A.M.
Females
WJ-R broad-reading score 103.82 105.10 102.97 103.75
(16.70) (18.84) (14.51) (17.77)
WJ-R applied-problems score 102.74 104.27 102.19 101.51
(15.55) (17.56) (13.96) (15.14)
N 600 200 260 140
Males
WJ-R broad-reading score 101.79 102.61 101.07 101.67
(18.76) (18.88) (18.72) (17.97)
WJ-R applied-problems score 106.87 108.03 105.85 106.60
(16.54) (15.68) (17.54) (15.41)
N 600 210 230 150
Notes: CDS weights used. Standard deviations are in parentheses. Observation counts are
rounded to the nearest ten in accordance with NCES disclosure requirements.

31
Table 2. Means of Other Variables
Variables Females Males
Independent Variables of Interest
School start time (hours since midnight) [clock time] 7.89 [7:53 A.M.] 7.87 [7:52 A.M.]
School day length (hours) 6.99 6.99
N 600 600
Intermediate Outcomes
Sleep on weekday diary (hours, M-TH) 8.50 8.67
Night sleep on weekday diary (hours, M-TH) 8.29 8.33
Usual night sleep (hours, presumed weeknight) 7.35 7.54
Naps (M-TH) 0.21 0.34
Wake-up time (hours since midnight, M-TH) [clock time] 6.74 [6:44 A.M.] 6.74 [6:44 A.M.]
Bedtime (hours since midnight, M-TH) [clock time] 22.38 [10:23 P.M.] 22.38 [10:23 P.M.]
Participate in a sports team that year 0.28 0.39
Currently employed 0.22 0.20
Time spent with parent on weekday (hours/day) 3.98 3.88
Time spent with parent on all days (hours/day) 4.70 4.63
Overweight 0.30 0.36
Sad in last two weeks 0.24 0.10
N 550 550
Notes: CDS child weights used. Means of control variables are in Appendix Table A5.

32
Table 3. Means of Time-use Variables (Hours per Day)
Females Males
Weekdays All days Weekdays All days
Sleep 8.41 9.05 8.58 9.07
Market work 0.49 0.54 0.42 0.53
Nonmarket work 0.59 0.83 0.32 0.50
Care activities 0.20 0.24 0.10 0.15
School 6.18 4.42 6.70 4.79
Other schooling 0.25 0.20 0.18 0.15
Homework as a primary activity 0.99 0.91 0.72 0.64
Extracurricular activities 0.29 0.41 0.32 0.45
Sports 0.55 0.55 0.74 0.80
TV 1.64 1.86 1.79 2.11
Computer games 0.15 0.17 0.86 1.08
Other computer use 0.47 0.54 0.41 0.45
Personal care 1.19 1.19 0.84 0.83
Other leisure 2.51 2.98 1.96 2.38
Missing activities 0.09 0.12 0.07 0.09
N 550 550 550 550
Note: CDS child weights used. Means may not sum to 24 hours due to rounding.
33
Table 4. Determinants of School Start Times (N = 2,090) Variables (1) (2) (3) (4) (5) (6)
Northeast -0.254*** -0.208*** -0.219*** -0.243*** -0.264*** -0.257***
(0.031) (0.034) (0.031) (0.034) (0.045) (0.051)
Midwest 0.002 0.003 -0.028 -0.039 -0.053 -0.182***
(0.029) (0.029) (0.028) (0.037) (0.039) (0.047)
West -0.071** -0.051 -0.055* -0.112* -0.130* -0.573***
(0.033) (0.035) (0.033) (0.062) (0.067) (0.165)
Suburb -0.116** -0.122*** -0.116*** -0.129*** -0.103**
(0.045) (0.046) (0.045) (0.046) (0.046)
Town 0.065* -0.000 -0.008 -0.041 -0.011
(0.037) (0.045) (0.045) (0.048) (0.047)
Rural 0.056 -0.051 -0.058 -0.091* -0.045
(0.037) (0.049) (0.050) (0.051) (0.051)
Log (students) -0.110*** -0.107** -0.094** -0.100**
(0.023) (0.042) (0.043) (0.043)
Magnet/charter -0.007 0.013 0.036 0.054
(0.085) (0.076) (0.080) (0.084)
Student-teacher ratio -0.001 0.001 0.004
(0.009) (0.010) (0.010)
Percent Asian 0.001 0.001 0.003
(0.002) (0.002) (0.002)
Percent Hispanic 0.001 0.001 0.002**
(0.001) (0.001) (0.001)
Percent black -0.002*** -0.002** -0.001
(0.001) (0.001) (0.001)
Percent free lunch 0.000 0.001 0.000
(0.001) (0.001) (0.001)
Log (students in district) -0.013 -0.004
(0.015) (0.015)
Log (expenditure per pupil) 0.049 0.052
(0.072) (0.079)
Log (household income) 0.038 0.019
(0.075) (0.073)
Log (population density) -0.013 -0.006
(0.013) (0.013)
Latitude 0.018***
(0.004)
Longitude -0.014***
(0.003)
Central Time -0.114***
(0.039)
Mountain Time 0.013
(0.167)
Pacific Time -0.225
(0.195)
R-squared 0.057 0.090 0.136 0.152 0.155 0.185
Source: Authors’ calculations using data from SASS (2007-08), Common Core of Data, School District
Demographics System, U.S. Census Bureau, SAS time zone data.
Notes: SASS school sampling weight used. Each column reports the results of a separate regression with school start
time as the dependent variable. All regressions include a constant. Students in district, expenditure per pupil, and
median household income are defined at the school-district level. Population density is defined at the county level.
The remaining variables are defined at the school level.
Significance levels: *** p<0.01, ** p<0.05, * p<0.1.

34
Table 5. Effects of School Start Time on Test Scores
Broad-reading score Applied-problem score
(1) (2) (3) (4) (5) (6) (7) (8) (9) (10)
Panel 1. Females (N = 600)
School start time -1.156 1.410 2.036 2.505* 1.921 -2.143 -0.611 -0.650 -0.947 -0.459
(2.727) (1.633) (1.498) (1.454) (1.424) (2.200) (1.524) (1.480) (1.579) (1.224)
Day length -2.307 0.103 1.146 -0.094 -1.083 -2.031 -0.262 1.878 1.211 -0.727
(1.963) (1.463) (1.329) (1.461) (1.522) (1.974) (1.512) (1.246) (1.382) (1.145)
Lagged broad-reading score 0.656*** 0.513*** 0.502*** 0.508*** 0.122** 0.037 0.033 -0.008
(0.087) (0.079) (0.075) (0.077) (0.060) (0.062) (0.060) (0.045)
Lagged applied-problem score 0.183*** 0.114** 0.113** 0.114** 0.565*** 0.472*** 0.484*** 0.536***
(0.058) (0.057) (0.054) (0.054) (0.065) (0.066) (0.061) (0.047)
Individual and family controls X X X X X X
School, county, and state controls X X X X
Sunlight controls X X
R-squared 0.004 0.488 0.592 0.617 0.624 0.006 0.400 0.519 0.550 0.524
Panel 2. Males (N = 600)
School start time 0.161 -0.058 -0.457 -0.321 -0.607 -0.756 0.093 0.038 0.675 0.008
(2.736) (1.691) (1.841) (1.711) (1.865) (2.137) (1.690) (1.576) (1.586) (1.722)
Day length -3.852 -1.521 -0.836 -0.213 -0.334 -2.225 -1.660 -2.131 -1.866 -1.729
(2.970) (1.853) (2.022) (1.923) (2.088) (2.408) (1.725) (1.674) (1.699) (1.697)
Lagged broad-reading score 0.712*** 0.635*** 0.603*** 0.610*** 0.117** -0.028 -0.044 -0.037
(0.050) (0.055) (0.056) (0.055) (0.053) (0.055) (0.054) (0.052)
Lagged applied-problem score 0.191*** 0.092* 0.095* 0.087* 0.605*** 0.533*** 0.532*** 0.536***
(0.051) (0.053) (0.052) (0.051) (0.058) (0.065) (0.062) (0.063)
Individual and family controls X X X X X X
School, county, and state controls X X X X
Sunlight controls X X
R-squared 0.006 0.539 0.618 0.641 0.646 0.003 0.411 0.538 0.566 0.572
Notes: CDS child weights used. Standard errors clustered by high school are in parentheses. Individual and family controls include the number of children in the
family unit and indicators for WJ-R score missing, race, month of interview, Census region, family structure, mother college degree, mother college degree
missing, father college degree, father college degree missing, free/reduced-price lunch recipient, high school grade level, cohort, and special education. School,
county, and state controls include student-teacher ratio, percent black, percent white, percent Hispanic, percent Asian, percent free-or-reduced-price lunch
eligible, urbanicity (suburban, town, rural), log of median household income in the school district, log of expenditure per pupil in the school district, log of
number of students in the school district, log of population density in the county, state compulsory schooling, magnet/charter school, and missing school-level
variable. Sunlight controls include latitude, longitude, and time zone. All regressions include a constant.
Significance levels: *** p<0.01, ** p<0.05, * p<0.1.

35
Table 6. Effects of School Start Time on Sleep
Variables
All diary
sleep
(M-TH)
Nighttime
diary
sleep
(M-TH)
Usual
night sleep
Naps
(M-TH)
Wake-up
time
(M-TH)
Bedtime
(M-TH)
Panel 1. Females
School start time 0.634*** 0.599*** 0.384** 0.035 0.584*** -0.042
(0.232) (0.230) (0.171) (0.082) (0.187) (0.157)
Day length -0.246 -0.237 0.046 -0.009 -0.365 -0.028
(0.258) (0.254) (0.170) (0.071) (0.253) (0.150)
Number of observations 450 450 550 450 450 450
R-squared 0.192 0.190 0.182 0.087 0.231 0.146
Panel 2. Males
School start time -0.136 0.327 0.213 -0.464 0.575*** 0.267
(0.382) (0.228) (0.169) (0.282) (0.205) (0.192)
Day length 0.553 0.377 0.139 0.176 -0.074 -0.361*
(0.380) (0.231) (0.199) (0.286) (0.198) (0.185)
Number of observations 460 460 550 460 460 460
R-squared 0.244 0.244 0.215 0.242 0.248 0.205
Notes: CDS child weights used. Standard errors clustered by high school are in parentheses. See Table 5 for control variables.
Significance levels: *** p<0.01, ** p<0.05, * p<0.1.

36
Table 7. Effects of School Start Time on Time-use Activities, Weight, and Sadness
Females Males
Weekdays Weekdays
Dependent Variable (M-F) All days (M-F) All days
Sleep 0.722***(0.220) 0.589*** (0.175) 0.161 (0.338) 0.130 (0.250)
Market work 0.153 (0.199) 0.100 (0.192) -0.111 (0.275) -0.050 (0.257)
Nonmarket work 0.074 (0.131) 0.072 (0.133) -0.085 (0.111) -0.060 (0.123)
Care activities 0.072 (0.098) 0.0123 (0.076) -0.040 (0.042) -0.006 (0.042)
School -0.271 (0.382) -0.194 (0.273) 0.367 (0.347) 0.278 (0.247)
Other schooling -0.127 (0.078) -0.130** (0.066) -0.050 (0.061) -0.036 (0.046)
Homework -0.176 (0.166) -0.289 (0.139) 0.070 (0.125) 0.022 (0.107)
Extracurricular activities -0.003 (0.118) 0.062 (0.115) 0.124 (0.129) 0.149 (0.136)
Sports 0.161 (0.153) 0.215 (0.164) 0.184 (0.178) 0.141 (0.154)
TV -0.056 (0.258) -0.001 (0.253) -0.238 (0.301) -0.3011 (0.274)
Computer games -0.056 (0.094) -0.087 (0.077) -0.559*** (0.212) -0.440** (0.203)
Other computer -0.200 (0.137) -0.175 (0.143) -0.180 (0.123) -0.146 (0.115)
Personal care -0.023 (0.092) 0.015 (0.080) 0.123* (0.070) 0.112* (0.064)
Other leisure -0.343 (0.247) -0.361 (0.224) 0.157 (0.229) 0.127 (0.207)
Missing activities 0.074* (0.044) 0.060 (0.039) 0.070 (0.056) 0.090** (0.044)
Time with parents -0.328 (0.388) -0.126 (0.391) -0.543 (0.367) -0.638* (0.358)
Employed - -0.042 (0.063) - 0.089(0.057)
Sports team - 0.205** (0.081) - 0.036 (0.063)
Overweight1 - -0.025 (0.051) - -0.028 (0.071)
Sad in last two weeks - 0.079 (0.050) - 0.000 (0.042)
Number of observations 550 550 550 550
Notes: CDS child weights used. Standard errors clustered by high school are in parentheses. See Table 5 for control variables. 1 The number of observations was 530 for females and 540 for males due to missing information for the overweight variable.
Significance levels: *** p<0.01, ** p<0.05, * p<0.1.

37
Appendix Table A1. Sources of School Start and End Times (N = 1,200)
Source Percent
School or district website (current or archived) 73.52
Schools and Staffing Survey (SASS 2007-08 or 2011-12) 21.39
Wolfson and Carskadon (2001-2002) 2.92
Hinrichs (2000-2007) 1.84
Start School Later, Inc. 0.33
Note: Archived websites accessed via the Internet Archive’s Wayback Machine.

38
Appendix Table A2. Sample Selection
Attend high school in CDS-II or CDS-III and primary caregiver’s child file record 1,650
Drop those missing child-file interview in 2007 (no weights available) 1,590
Drop students in private high schools 1,490
Drop if no NCES high school code in geocoded PSID 1,340
Drop if attended a middle school with configuration including grade 9 1,320
Drop those who did not attend a regular high school 1,260
Drop if not able to determine a school start time 1,220
Drop if missing high school test score 1,210
Drop if missing free and reduced price lunch eligibility status 1,200
Main Analysis Sample: 1,200
Females 600
Males 600
Drop those without a weekday or weekend day diary 1,120
Drop if missing more than 180 minutes on diary day (low-quality diary) 1,110
Time-Use Sample: 1,110
Females 550
Males 550
Note: Observation counts are rounded to the nearest ten in accordance with NCES disclosure
requirements.
39
Appendix Table A3. Time-use Classifications
Classification Examples of activities included
Sleep Sleeping; naps
Market work Part-time jobs; using computer at home for pay; coffee
breaks while at workplace; job search
Nonmarket work Food preparation; washing dishes; laundry; ironing;
watering plants; gardening; car care; groceries; shopping for
other goods
Care activities Child care not for pay; reading to a child; helping adult
household members or friends
School Attending class; field trips; travel to school
Other schooling Nonacademic classes; SAT prep; military training
Homework as a primary
activity
Homework; using the computer for homework; being
tutored; studying; reviewing homework with parent
Extracurricular activities Volunteer work; attending church; youth group; fraternal
organizations; community organizations; music lessons;
playing an instrument; attending before- or after-school
activities (not sports-related)
Sports Playing sports; lessons in sports or dance; team sports;
organized meets or games; exercise
TV Watching television
Computer games Playing computer games; playing games on a cell phone;
electronic video games (Nintendo, Sony, Game Boy, Sega)
Other computer use “Surfing the net”; downloading pictures, music; e-mail;
reading media; Skype; Facebook; photo processing;
learning how to use computer; financial services
Personal care Bathing; dressing; medical care (sick or visiting doctor)
Other leisure Attending sporting events; going to the movies; museums;
zoo; visiting with others; wedding; party; reading; radio;
listening to music; conversations; relaxing; hobbies; arts
and crafts; playing non-electronic games; eating meals;
snacking; caring for pets
Missing activities Time gap of greater than 10 minutes
Note: Travel time associated with each activity is included in the total time spent on the activity.

40
Appendix Table A4. Sleep on School Nights, ATUS and PSID-CDS (Mean Hours per Day)
ATUS (2003-2008) PSID-CDS (2002-03/2007-08)
Variables Female Male Female Male
Sleeplessness 0.03 0.04 - -
Nighttime sleep 8.45 8.40 8.29 8.33
N 1,550 1,560 450 460
Notes: All estimates are weighted. ATUS includes private schools but PSID-CDS does not.
ATUS includes high school students aged 15-18 whereas the PSID-CDS includes high school
students aged 13-18. School nights are Sunday–Thursday in the ATUS (and include all sleep
after 7 P.M.) but Monday–Thursday in the PSID-CDS.

41
Appendix Table A5. Means of Control Variables by School Start Time (Pooled)
Variables 7:00–7:44
A.M.
7:45–8:14
A.M.
8:15–9:15
A.M.
White or other race, non-Hispanic 0.64 0.61 0.65
Black, non-Hispanic 0.15 0.17 0.22*
Hispanic 0.11 0.16 0.09
Lived in East region in HS 0.26 0.13** 0.09**
Lived in Midwest region in HS 0.21 0.27* 0.20
Lived in South region in HS 0.28 0.24 0.61**
Lived in West region in HS 0.24 0.36** 0.10**
Grade 9 0.29 0.29 0.28
Grade 10 0.24 0.27 0.26
Grade 11 0.23 0.22 0.27
Grade 12 0.24 0.22 0.18
Interviewed in 2007-2008 0.51 0.56 0.53
WJ-R applied-problem score (before HS) 109.13 105.81* 106.23
WJ-R broad-reading score (before HS) 112.69 108.61** 109.53*
Missing a WJ-R score (before HS) 0.20 0.20 0.13*
Ever in special education 0.12 0.10 0.12
October interview 0.11 0.10 0.15
November interview 0.20 0.19 0.20
December interview 0.12 0.12 0.12
January interview 0.23 0.26 0.23
February interview 0.20 0.14* 0.11**
March interview 0.04 0.07 0.05
April/May/June interview 0.03 0.03 0.02
Family Variables
Lives with both biological parents 0.63 0.61 0.59
Lives with step mom and biological father 0.01 0.03** 0.01
Lives with step dad and biological mother 0.11 0.07* 0.09
Lives with single parent 0.24 0.27 0.29
Lives in other family arrangement 0.01 0.03 0.03
Number of other children in family unit under
age 19
1.14 1.18 1.14
Mother college degree (non-missing) 0.31 0.25 0.28
Mother education missing 0.03 0.04 0.06
Father college degree (non-missing) 0.37 0.33 0.33
Father education missing 0.23 0.26 0.29
Free or reduced-price lunch recipient 0.26 0.32 0.27
N 420 490 290
Note: CDS child weights used. Means are means of the non-missing variables.
Significance levels: ** p<0.05, * p<0.1. Significantly different from earliest start time category.
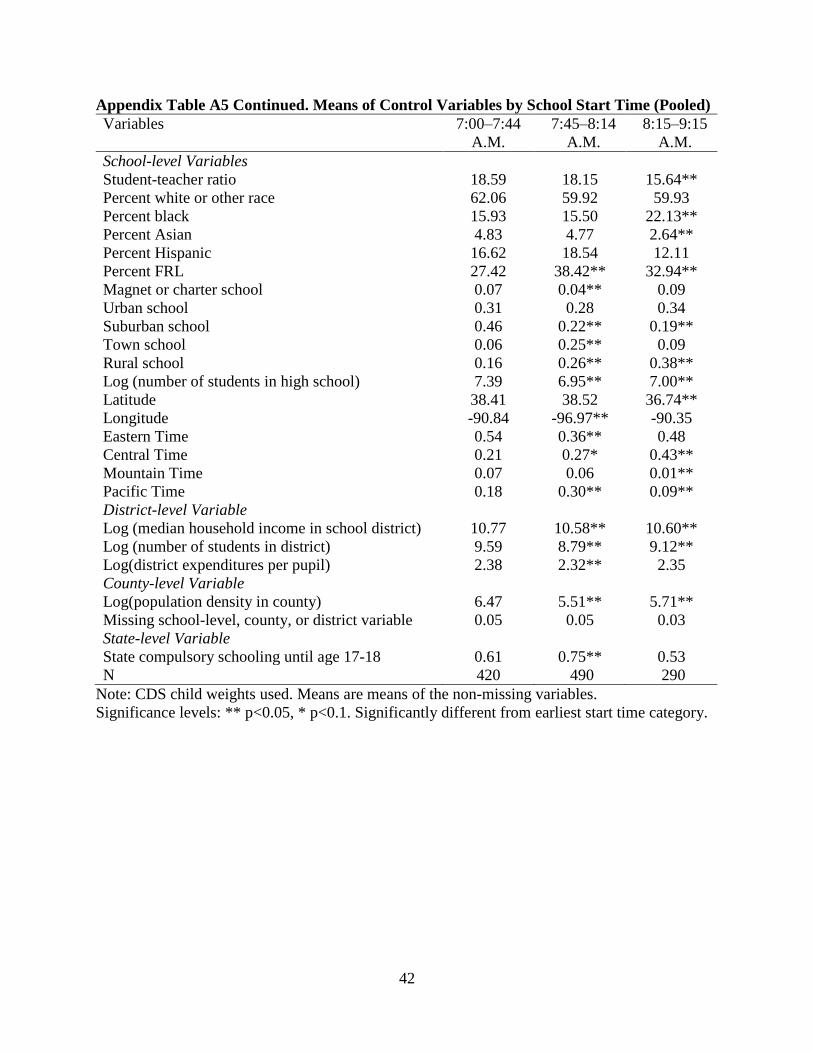
42
Appendix Table A5 Continued. Means of Control Variables by School Start Time (Pooled)
Variables 7:00–7:44
A.M.
7:45–8:14
A.M.
8:15–9:15
A.M.
School-level Variables
Student-teacher ratio 18.59 18.15 15.64**
Percent white or other race 62.06 59.92 59.93
Percent black 15.93 15.50 22.13**
Percent Asian 4.83 4.77 2.64**
Percent Hispanic 16.62 18.54 12.11
Percent FRL 27.42 38.42** 32.94**
Magnet or charter school 0.07 0.04** 0.09
Urban school 0.31 0.28 0.34
Suburban school 0.46 0.22** 0.19**
Town school 0.06 0.25** 0.09
Rural school 0.16 0.26** 0.38**
Log (number of students in high school) 7.39 6.95** 7.00**
Latitude 38.41 38.52 36.74**
Longitude -90.84 -96.97** -90.35
Eastern Time 0.54 0.36** 0.48
Central Time 0.21 0.27* 0.43**
Mountain Time 0.07 0.06 0.01**
Pacific Time 0.18 0.30** 0.09**
District-level Variable
Log (median household income in school district) 10.77 10.58** 10.60**
Log (number of students in district) 9.59 8.79** 9.12**
Log(district expenditures per pupil) 2.38 2.32** 2.35
County-level Variable
Log(population density in county) 6.47 5.51** 5.71**
Missing school-level, county, or district variable 0.05 0.05 0.03
State-level Variable
State compulsory schooling until age 17-18 0.61 0.75** 0.53
N 420 490 290
Note: CDS child weights used. Means are means of the non-missing variables.
Significance levels: ** p<0.05, * p<0.1. Significantly different from earliest start time category.
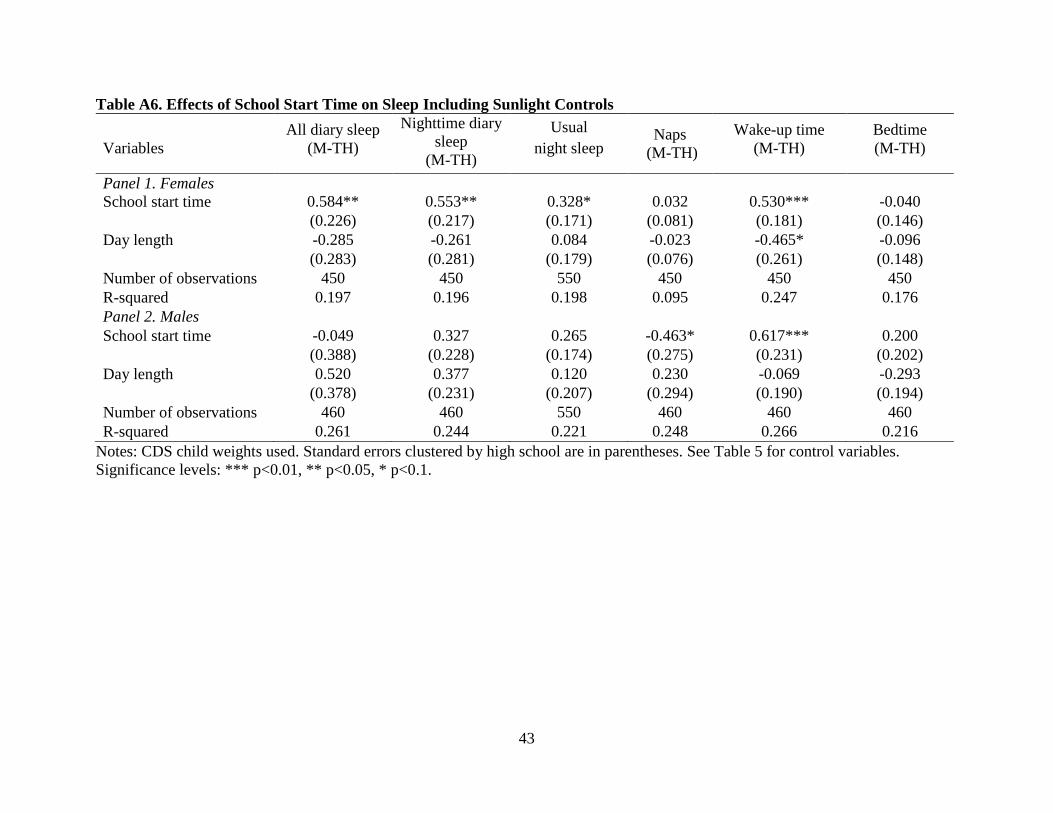
43
Table A6. Effects of School Start Time on Sleep Including Sunlight Controls
Variables
All diary sleep
(M-TH)
Nighttime diary
sleep
(M-TH)
Usual
night sleep Naps
(M-TH)
Wake-up time
(M-TH)
Bedtime
(M-TH)
Panel 1. Females
School start time 0.584** 0.553** 0.328* 0.032 0.530*** -0.040
(0.226) (0.217) (0.171) (0.081) (0.181) (0.146)
Day length -0.285 -0.261 0.084 -0.023 -0.465* -0.096
(0.283) (0.281) (0.179) (0.076) (0.261) (0.148)
Number of observations 450 450 550 450 450 450
R-squared 0.197 0.196 0.198 0.095 0.247 0.176
Panel 2. Males
School start time -0.049 0.327 0.265 -0.463* 0.617*** 0.200
(0.388) (0.228) (0.174) (0.275) (0.231) (0.202)
Day length 0.520 0.377 0.120 0.230 -0.069 -0.293
(0.378) (0.231) (0.207) (0.294) (0.190) (0.194)
Number of observations 460 460 550 460 460 460
R-squared 0.261 0.244 0.221 0.248 0.266 0.216
Notes: CDS child weights used. Standard errors clustered by high school are in parentheses. See Table 5 for control variables.
Significance levels: *** p<0.01, ** p<0.05, * p<0.1.