dimensions and geometric relationships of the human...
TRANSCRIPT

W. MILTON SWANSON and RICHARD E. CLARKPressure
Dimensions and Geometric Relationships of the Human Aortic Value as a Function of
Print ISSN: 0009-7330. Online ISSN: 1524-4571 Copyright © 1974 American Heart Association, Inc. All rights reserved.is published by the American Heart Association, 7272 Greenville Avenue, Dallas, TX 75231Circulation Research
doi: 10.1161/01.RES.35.6.8711974;35:871-882Circ Res.
http://circres.ahajournals.org/content/35/6/871World Wide Web at:
The online version of this article, along with updated information and services, is located on the
http://circres.ahajournals.org//subscriptions/
is online at: Circulation Research Information about subscribing to Subscriptions:
http://www.lww.com/reprints Information about reprints can be found online at: Reprints:
document. Permissions and Rights Question and Answer about this process is available in the
located, click Request Permissions in the middle column of the Web page under Services. Further informationEditorial Office. Once the online version of the published article for which permission is being requested is
can be obtained via RightsLink, a service of the Copyright Clearance Center, not theCirculation Research Requests for permissions to reproduce figures, tables, or portions of articles originally published inPermissions:
at WESTERN MICHIGAN UNIV on February 17, 2014http://circres.ahajournals.org/Downloaded from at WESTERN MICHIGAN UNIV on February 17, 2014http://circres.ahajournals.org/Downloaded from

Dimensions and Geometric Relationships of the HumanAortic Value as a Function of PressureBy W. Milton Swanson and Richard E. Clark
ABSTRACTIn a continuing effort to develop improved prosthetic heart valves, a redefini-
tion of the anatomy of the human aortic valve as a function of stress wasundertaken. Dimensions and geometric relationships of the human aortic valveas a function of intraaortic pressure between 0 and 120 mm Hg were obtainedfrom a series of silicone rubber valve casts. The axial length of the valve regionwas found to vary negligibly with pressure, but significant variations ingeometry and angular dimensions were seen. The leaflet attachment annulusforms an ellipse at the plane of intersection with the cylindrical surfacepassing from the left ventricular tract through the aorta. Deductions fromstress considerations for the measured geometry indicate that the loadedleaflet is a section of a cylindrical surface. The equation for this developedsurface was obtained, and a prosthetic design was determined using averagevalues at 100 mm Hg. The leaflet is developable onto a plane with a cutrequired along part of the junction line between the initially cylindrical partand the plane coapting surfaces. Optimum valve shape mandates a base anglebetween the cylindrical leaflet and the center axis of 70° (a =20-22°, where a isthe leaflet angle).
KEY WORDS aortic valve structureleaflet shape and dimensionsprosthetic valve design
aortic modulusstresses in valve leaflets
• An accurate definition of the geometry ofthe aortic valve is necessary prior to develop-ment and fabrication of a prosthetic valve.As part of a program to determine the geom-etry and structure of the human aorticvalve, silicone rubber molds were cast underpressure. Measurements considered to be im-portant were made and analyzed. Prelimi-nary studies in our laboratory have demon-strated the sensitivity of in-plane stresses tothe geometry of this structure during dias-tole and systole (1). Previous investigationsby Wood et al. (2) and Sauvage et al. (3)utilized pig hearts and a freezing techniqueunder pressure. Recently, Mercer et al. (4)have investigated the geometry of the hu-man aortic leaflet via a molding technique at100 mm Hg of pressure. The present paper isa report on our 2-year investigation of thegeometry and proportionalities of the humanaortic valve from which important designconclusions can be drawn. Accurate knowl-
From the Departments of Mechanical Engineering andCardiothoracic Surgery, Washington University, St.Louis, Missouri 63130.
This work was supported in part by U- S. Public HealthService Grant HL-13803 from the National Heart andLung Institute.
Received January 31, 1974. Accepted for publicationAugust 8, 1974.
Circulation Research, VoL 35, December 197k
edge of valve and sinus region geometry isrequired for flow calculations yielding infor-mation on leaflet motion during opening andclosing (5).
MethodsFresh human hearts were obtained at autopsy,
stored at 4°C, and used within 1-3 days afterdeath. The specimens consisted of two to threediameters of aorta beyond the sinuses of Valsalvaand one-half to one diameter of tissue on the leftventricle side. The aorta was held with threehemostats hung on ring-stand hook arms. Then,40-50 ml of low-viscosity room temperature-vul-canizing silicone rubber (RTV GE-11) was pre-pared. The coronary arteries were at first tied off,but it was later found that coronary leakage couldbest be eliminated by plugging them with siliconerubber beads, 4-5 mm in diameter. Part of thesilicone rubber was injected into the sinus pocketswith a 20-ml syringe and a 6-cm tube extension toallow filling from the bottom up to eliminate airpockets. When the preparation was nearly full, agrooved stopper with a 5-cm length of glass tubein it was slowly pushed into the aorta, filling thetube. The aorta was secured to the stopper withumbilical tape around the groove. The remainingsilicone rubber was poured into a large reservoirsyringe connected to the stopper tube with a shortpiece of flexible tubing, and the reservoir syringewas then suspended on a ring stand. A tubethrough a stopper in the top of the reservoirsyringe was connected through a T-tube to a
871
at WESTERN MICHIGAN UNIV on February 17, 2014http://circres.ahajournals.org/Downloaded from

872 SWANSON, CLARK
standard sphygmomanometer. The pressure wasgradually increased to the desired casting pres-sure and maintained during the cure. A jar ofsaline was placed around the aorta to maintain amoist condition and a temperature of 37°C. Thisslightly warm temperature also accelerated thecure. A period of about 2 hours was required for aminimum stable-dimension cure. The cast wasremoved, and the procedure was repeated at thenext pressure. With this technique, five or sixcasts could be made in 1 day. The deterioratingeffect of the casting procedure on the elasticproperties of the aorta was determined by repeat-ing the preparation of a cast at 20 mm Hg. Thischeck cast was made on three series (series 5 and6 of Table 2 and one other) after the last cast atmaximum pressure had been made. No significantdimensional variations were found. One serieswas also repeated at 50 mm Hg, and no significantvariations were noted. The series 8 casts areshown in Figure 1.
Data on subject aortas are presented in Table 1.The significant dimensions recorded in Tables 2-4were measured with vernier calipers to the near-est 0.1 mm. In some critical cases, several sets ofreadings were taken for one dimension and aver-aged to determine repeatability. The variationsobtained were usually within 0.2 mm or about 1%.Dimensions involving the three separate sinusesand leaflets were average for the three. The non-coronary sinus was usually, but not always, thesmallest.
A profile tracing of the sinus region in a planeperpendicular to the center axis was made andplanimetered to obtain the maximum sinus areafrom _yvhich an equivalent area-averaged diame-ter, d,, was determined. Each cast tracing wasplanimetered ten times to get an accurate meas-
TABLE 1
Valve Origin
Valve series
456T»
Age(years)
293929M4f
Sex
FMFFM
urement. The ten measurements usually did notvary by more than 1%. When the variation waslarger, more readings were taken. The circum-scribing sinus diameter, dsm, was also recorded.
Nomenclaturec = Coapta t ion (Fig. 2).d = Diame te r (mm) (Fig. 2).E = Elas t ic modulus (dynes/cm*).Ed = Elas t ic modulus based on aor t ic diame-
t r a l s t r a i n : E,, = Ap/Ada/da) (dynes /cm2).
f = F r e e edge (cm) (Fig. 2).h = Height from ventricular tract base
plane to top of annulus fibrosis (Fig.2).
I = Length (cm) (Fig. 2).p = Pressure (dynes/cmJ).x, y = Coordinates.a = Leaflet angle (Figs. 2, 9).
= Angles (Fig. 9).<f> = Free edge angle (Fig. 2).a = Stress (dynes/cm2).
FMURE 1
a: Series 8 valve molds, 0 to 100 mm Hg. b: 80-mm Hg mold mated with left ventricle mold.
Circulation Research, VoL 35, December 1971,
at WESTERN MICHIGAN UNIV on February 17, 2014http://circres.ahajournals.org/Downloaded from
AORTIC VALVE DIMENSIONS AND GEOMETRY 873
SUBSCRIPTS
a =c —m =s =V =
Aorta.Center.Maximum.Sinus of Valsalva.Ventricular tract.
SUPERSCRIPTS
* = Dimensionless quantity referred to dv.# = Dimensionless quantity referred to
that quantity at zero pressure.
Results
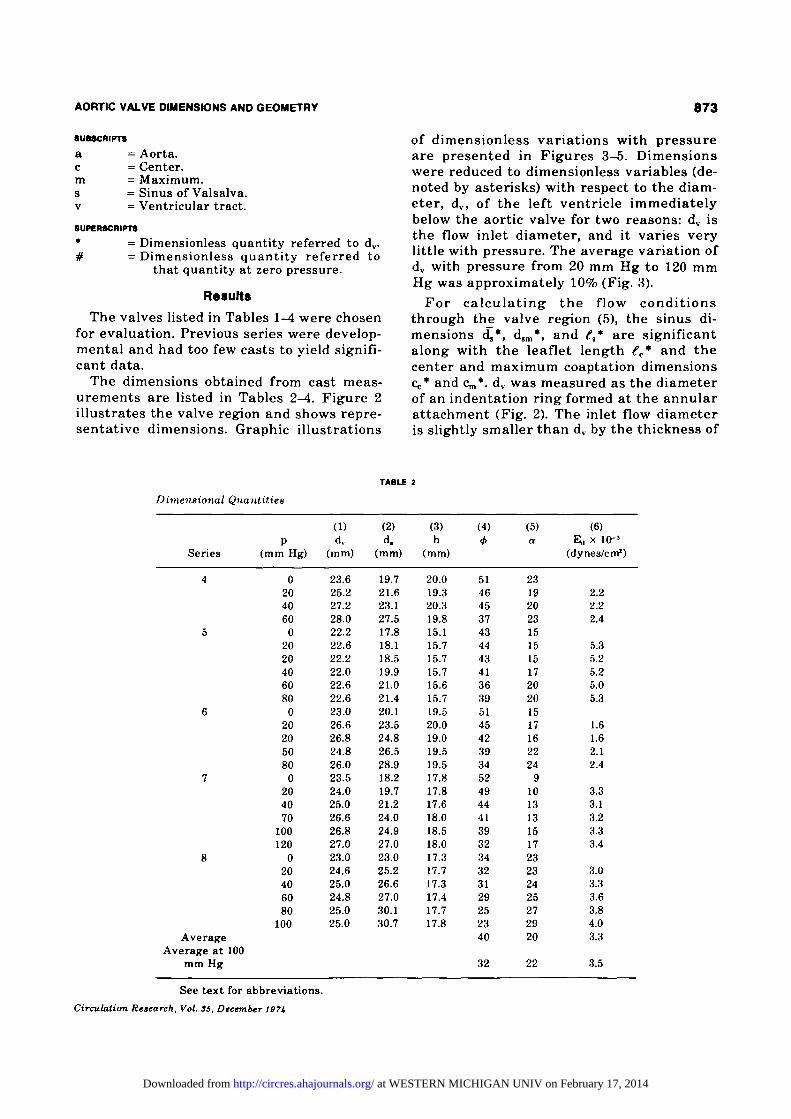
The valves listed in Tables 1-4 were chosenfor evaluation. Previous series were develop-mental and had too few casts to yield signifi-cant data.
The dimensions obtained from cast meas-urements are listed in Tables 2-4. Figure 2illustrates the valve region and shows repre-sentative dimensions. Graphic illustrations
of dimensionless variations with pressureare presented in Figures 3-5. Dimensionswere reduced to dimensionless variables (de-noted by asterisks) with respect to the diam-eter, dv, of the left ventricle immediatelybelow the aortic valve for two reasons: dv isthe flow inlet diameter, and it varies verylittle with pressure. The average variation ofdv with pressure from 20 mm Hg to 120 mmHg was approximately 10% (Fig. 3).
For calculating the flow conditionsthrough the valve region (5), the sinus di-mensions d̂ *, dsm*, and ^s* are significantalong with the leaflet length €c* and thecenter and maximum coaptation dimensionsQ* and Cm*. dv was measured as the diameterof an indentation ring formed at the annularattachment (Fig. 2). The inlet flow diameteris slightly smaller than dv by the thickness of
TABLE 2
Dimensional Quantities
Series
4
5
6
7
8
AverageAverage at 100
mm Hg
P(mm Hg)
0204060
02020406080
020205080
0204070
100120
020406080
100
(1)dv
(mm)
23.625.227.228.022.222.622.222.022.622.623.026.626.824.826.023.524.025.026.626.827.023.024.625.024.825.025.0
(2)d.
(mm)
19.721.623.127.517.818.118.519.921.021.420.123.524.826.528.918.219.721.224.024.927.023.025.226.627.030.130.7
(3)h
(mm)
20.019.320.319.815.115.715.715.715.615.719.520.019.019.519.517.817.817.618.018.518.017.317.717.317.417.717.8
(4)
<t>
51464537434443413639514542393452494441393234323129252340
32
(5)a
231920231515151720201517162224
9101313151723232425272920
22
(6)E,, x 10-3
(dynes/cm1)
2.22.22.4
5.35.25.25.05.3
1.61.62.12.4
3.33.13.23.33.4
3.03.33.63.84.03.3
3.5
See text for abbreviations.Circulation Research, Vol. 35, December I97i
at WESTERN MICHIGAN UNIV on February 17, 2014http://circres.ahajournals.org/Downloaded from

874 SWANSON, CLARK
TABLE!
Dimensionless Quantities Relative to Inlet Diameter
Series
4
5
6
7
8
AverageAverage at100 mm Hg
P(mm Hg)
0204060
02020406080
020205080
0204070
100120
020406080
100
(1)d,*
0.850.860.850.980.810.800.840.900.930.940.880.880.921.071.110.780.820.850.900.931.001.001.021.061.091.201.230.951.07
(2)h*
0.850.780.750.710.680.700.710.710.690.690.850.750.710.780.750.760.740.700.680.700.670.750.720.690.700.710.710.730.71
(3)d,*
1.181.221.241.281.051.051.071.071.111.121.191.301.311.501.561.011.071.071.091.021.121.261.251.311.341.401.431.211.31
(4)
d*=*
1.321.371.381.471.141.131.151.251.261.281.321.431.441.651.731.131.171.181.161.181.231.401.421.491.491.551.581.341.46
(5)
0.670.700.660.670.700.660.660.710.710.700.710.700.670.730.720.680.680.700.690.700.710.750.750.700.730.730.760.700.71
(6)t>*
0.930.850.800.840.760.780.800.800.780.780.970.920.921.021.030.780.760.810.790.790.830.980.930.930.920.950.970.870.88
(7)c,*
0.130.160.120.130.170.180.180.180.170.150.200.170.150.150.150.180.180.180.180.190.190.200.180.160.160.180.170.170.17
(8)c™*
0.220.240.210.210.230.220.230.230.220.220.250.210.200.240.200.260.260.250.240.210.210.260.240.240.230.240.230.230.23
(9)f*
0.670.630.620.620.550.560.580.590.580.580.670.620.620.690.680.640.630.590.600.600.600.600.590.620.630.660.670.620.62
See text for abbreviations.
the leaflet at its base and by the restrictionof the valve at its maximum opening (3)(broken leaflet line in Fig. 2). The dimensionsshown in Figure 2 are for a representativevalve; they were determined from averagesof mold measurements of the illustratedquantities. ^c. is the length measured alongthe leaflet at the center of the sinus regionand is the center coaptation plus the bottomface length.
STRUCTURAL OBSERVATIONS
Dimensions of significance with respect tovalve structure are shown in Figure 2. Theheight, h, from the bottom of the attachmentto the top of the commissure varied onlyslightly with pressure (Fig. 5). The largestdimensional variation with pressure was forthe sinus diameters dj and dm. Column 6 ofTable 2 gives the elastic modulus based onthe aortic root diameter (da) variation (re-
FIQUHE 2
Geovietry and relative dimensions of aortic valve region.See text for abbreviations.
Circulation Research, VoL 35, December I97h
at WESTERN MICHIGAN UNIV on February 17, 2014http://circres.ahajournals.org/Downloaded from

AORTIC VALVE DIMENSIONS AND GEOMETRY 875
TABLE 4
Dimensionless Quantities Relative to Zero Pressure Value
Series
4
5
6
7
8
P(mm Hg)
0204060
02020406080
020205080
0204070
100120
020406080
100
(1)dv*
1.001.071.151.241.001.020.990.991.021.021.001.161.171.081.131.001.021.061.131.141.151.001.071.091.081.091.09
(2)d . '
1.001.091.161.391.001.011.031.111.181.201.001.171.231.321.441.001.081.161.321.371.481.001.091.151.171.311.33
(3)h *
1.000.971.020.991.001.041.041.041.031.041.001.030.971.001.001.001.000.991.011.041.011.001.021.001.011.021.03
(4)d . '
1.001.121.231.301.001.021.021.061.081.101.001.261.281.361.481.001.081.131.221.261.271.001.061.131.151.201.23
(5)d.n '
1.001.131.231.351.001.051.031.081.131.141.001.251.271.341.481.001.061.121.161.191.251.001.081.161.161.201.22
(6)
fr*
1.001.091.121.171.001.041.041.031.071.041.001.131.101.101.141.001.021.041.101.131.141.001.051.021.041.071.08
(7)e, *
1.000.991.011.081.001.041.051.051.041.051.001.101.121.131.201.001.111.161.161.161.231.001.011.031.011.071.07
See text for abbreviations.
ferred to as pressure modulus in ref. 6: Ed =Ap/(da/da). The range 1.6 x 10⁵ < Ert < 5.3 x10⁵ dynes/cm1 in Table 2 is in the range ofpublished data for pig aortas (Ed = 2 x 10s
dynes/cm2 [6]) and for the femoral artery (2 x10⁵ < i^ < 6 x 10⁶ dynes/cm2 [3, 7]). Thisrelatively large range of values for a physio-logical property is not unusual. The modulusdetermined in this manner might includeinaccuracies because of the method of deter-mining the strain Ada/da. The uncertainty forEd varied from about 100% at 20 mm Hg toabout 10% at 80 mm Hg. The maximum localdata variation for Ed values calculated froma smoothed curve of Ap vs. (da* - 1) was 15%.More accurate means determined using spe-cial strain testing apparatus (8) give truemoduli and yield values of the circumferen-tial modulus E for the aorta of about 4 x 10⁶
dynes/cm2 at 10% strain. Values of Ed wereconverted to E by multiplying by d/2t, whichwas about 10 (where t is the wall thickness).The average resulting E of approximately 5x 10s dynes/cm2 was close to published data
Circulation Research, VoL 35, December 1S7J,
SYMBOL SERIES
1.4
oDA••
mY2LmVTTT
0 40 80 120PRESSURE-p (mm Hg)
FIGURES
Relative dimensional variation of inlet diameter, djwithpressure, p.
at WESTERN MICHIGAN UNIV on February 17, 2014http://circres.ahajournals.org/Downloaded from

876 SWANSON, CLARK
5 1.0LLJ
I - IZxLU H-
uos"2
LU
0.8 h
0.6
0.40 40 80 120PRESSURE-p (mm Hg)
FIGURE 4
Dimensionless leaflet center length, tr*, as a function ofpressure, p.
(8) for this type of comparison. This modulusis not constant but increases with increasingload. The marked nonlinear behavior of aor-tic leaflets gives values of E from 2 x 10⁵ to 6x 10⁷ dynes/cm2 (9, 10).
The width of the coaptation at the center,c,., decreased with increasing pressure as aconsequence of a greater increase in diame-ter than in length. The coaptation surfacethen "peeled back" as the diameter of theleaflet supporting structure increased withincreasing pressure. Also, because of thesmall rate of increase of dv with pressure, thesinuses bulged out over this base diameterproducing an increase in the angle of thelower leaflet surface, a, and a decrease in theangle of the free edge, <f>, as indicated inTable 2 (columns 5 and 4, respectively) and inFigures 6 and 7. The free edge length, f,increased only slightly at the expense of adecrease in coaptation width (c,. and 0 , andit increased as a increased and decreased(i.e., da increased more than dv). Thisbehavior was also evident from sectionsthrough one of the sinuses at three differentpressures (Fig. 7a). Sauvage et al. (3) alsoindicated a slight increase in f with pressure;their dimensionless results (3, Figs. 1-14) arequite similar to ours and give f* =0.58 at 100mm Hg for pig hearts compared with f* =0.62for human hearts. They indicated that <£
decreases from 34° to 24° when pressures areincreased from 80 mm Hg to 120 mm Hg with<f> = 28° at 100 mm Hg compared with our valueof 0 =32° at 100 mm Hg. These results are asclose as can be expected considering the dif-ference of species. The most obvious signifi-cant structural or geometric difference is inthe configuration of the sinuses of Valsalva(6, Figs. 1-6). In addition to the difference inspecies, freezing also produces a variationeffect on tissue properties (9).
Uncertainties based on errors from re-peated measurements of basic quantitieswere 5% for f*, <j>, and c*, 4% for a, 3% for <?c*,and 2% for other dimensionless quantities.These values are close to the maximum rela-tive variations of data points from smoothedcurves.
Since the leaflets meet at an angle at thenoduli Aranti and since the pressure loadingis balanced across the coapting surfaces,there can be no stress along the free edge orin the coapting surfaces in the central regionexcept for the compressive stress equal tothe pressure.
LEAFLET STRUCTURE
Striations on the surfaces of the casts ad-jacent to the leaflets indicated a fibrousstructure across the leaflet on the aortic
'0 40 80 120PRESSURE - p (mmHg)
FIGURES
Dimensionless overall vertical height, h*, as a function ofpressure, p.
Circulation Research, Vol. 35, December 197U
at WESTERN MICHIGAN UNIV on February 17, 2014http://circres.ahajournals.org/Downloaded from

AORTIC VALVE DIMENSIONS AND GEOMETRY 877
oz
60
u 40
40 80 120PRESSURE-p (mm Hg)
FIGURE a
Bottom leaflet surface angle, a, variation with pressure, p.
(b)FMURE7
a: Sections through a sinus vertical center plane at SO, 60,and 80 mm Hg. b: Cylindrical sections at SO, 50, and 80mm Hg. Tick marks indicate leaflet attachment points.
surface (Fig. 8). These striations were in aplane perpendicular to the axis of the cylin-drical leaflet surface and extended from oneattachment to the other. Mating casts in theleft ventricle side had a smooth surface adja-cent to the leaflets. The leaflets are essen-tially thin flexible membranes, and they tendto form a cylindrical surface between theirpoints (or lines) of main support. Sectionsthrough the leaflet profiles along the stria-tion lines are shown in Figure 7b.
Since the leaflets end at a free edge in asection through the coaptation zone, therecan be no radial stress component in them.This conclusion is also corroborated by thefact that the radial profiles were essentiallystraight (no significant definable curvaturein the radial direction [Figs. 8 and 9]). Theonly load stress component is then the cir-cumferential stress carried by the circumfer-ential collagen fiber structure.
LEAFLET THICKNESS
Leaflet molds were made on the series 8aortic molds. The fibrous structure in thecylindrical portions and in the coapting sur-faces closely resembled that indicated in Fig-ures 8 and 10. As the molding pressure wasincreased, the coapting leaflet thickness de-creased. Measurements made on series 8casts gave a 30% decrease in average thick-Circulation Research, VoL 35, December 1971,
ness measured at the midpoint of the coapt-ing surfaces from 0.48 mm to 0.32 mm (Fig.11). Variations were large from one leaflet toanother on the same valve at a given pres-sure. At 100 mm Hg, thickness varied from0.22 mm to 0.4 mm.OVERALL STRUCTURE
The valve structure consists of thin flexi-ble sheets (the leaflets) freely suspended be-tween the attachments, forming interleafletseals along the coaptation zone.
Details of an idealized valve structure areshown in Figure 9. Figure 9a is a view look-ing from the left ventricle side. The load-carrying collagen fibers appear in the angledview of the bottom side of the leaf-let as ellipses. The attachment annulus linewhich forms the three-way intersection ofthe leaflets with the sinus and ventriculartract walls projects into a circle (the leftventricular outlet tract diameter) in thisview. A section in the plane of the circulararc through the leaflet is shown in Figure 9c.The leaflet contour b in Figure 9c is one-third of a circle. The adjoining sinus contouris also nearly circular. The leaflet and sinuscurvatures are parallel at their line of at-tachment intersection with the left ventricu-lar outflow tract wall yielding a load-stressbalance, as indicated by the arrows in Figure
at WESTERN MICHIGAN UNIV on February 17, 2014http://circres.ahajournals.org/Downloaded from

878 SWANSON, CLARK
B; ..
1
• •
AORTA
CoorseCollage nous
CircumferentialBundles
Circumferential& Radial —Fine Fibres
— Endothelium
Radial- Collagen and
Elastic Fibres
— Epithelium
VENTRICLE
FIGURE 8
A: Sketch showing circular collagen fiber structure of leaflets. B: Photograph of moldsurface.C: Sketch of cross section of leaflet.
9c. During diastole, there is no pressure load-ing on the left ventricular outflow tract wall;consequently, it can carry no significantstress component to balance a directionalcomponent of the leaflet and sinus wallstresses. In the projection of Figure 9b, theattachment line is straight. The intersectionof this plane surface of the attachment inter-section with the cylindrical contours of theleaflet then necessarily indicates that theattachment line is elliptical. This same con-clusion is obtained considering that the at-tachment line is also the intersection of itsplane with the cylindrical inflow section (dv).The leaflet is then a one-third section of acylinder. Some authors have representedthis contour as being parabolic (4).
From observations that (1) the attachmentline forms a plane and intersects with thenearly cylindrical surface formed by the leftventricular outflow tract and the aorta and(2) the leaflet contour is cylindrical, it isconcluded that the angles /3 and y in Figure
9b must be equal and furthermore, that theleaflet cylinder diameter must equal dv (veri-fied by direct measurement). From Table 2,the average value of the angle a (at 100 mmHg) is 22°; therefore, /3 =y =(90 -a)l2 = 34°.Starting with the profile of Figure 9b asshown in Figure 10a and the one-third circleprojection (Fig. 10b corresponding to Fig. 9a),the one-third circle leaflet contours of Figure10c (corresponding to Fig. 9c) result if y =/3.Figure lOd shows the elliptical projection ofthe attachment line profile. Since the basicgeometry originates from a one-third circlesection, the elliptical contour of Figure lOd isnot a complete ellipse: its ends are not paral-lel and the contour could easily be mistakenfor a parabola. Since the elliptical contour ofFigure lOd is formed with the intersection ofonly one-third of a circle, its length relativeto the major axis of the full elliptical contouris 1/2, and the width relative to the minoraxis is V3/2. The major axis-minor axis ratiois cosecant y = 1.79. The width of the elliptical
Circulation Research, Vol. 35, December 19?i
at WESTERN MICHIGAN UNIV on February 17, 2014http://circres.ahajournals.org/Downloaded from

AORTIC VALVE DIMENSIONS AND GEOMETRY 879
FIGURES
Views of aortic valve, a: View from left ventricle, b: Sideview iv plane of attachment line, c: Section throughcontour b of Figure Ha.
attachment line section is just the one-thirdchord of the dv circle or 0.866 relative to dv.The relative length of the elliptical contouris 1/4 of the major axis length or 0.45. Thecontours of the attachment annulus cometogether at the top in a vertical short com-missure section as indicated in Figure 10a, c,and d. The center coaptation also turns up tothe vertical (Fig. 10a).
The platform projection of the leaflet inFigure lOe is obtained from laying out chordlengths on the projections from 10a as calcu-lated from arc lengths from 10c. The leafletcontour chord length is obtained from thecylindrical leaflet surface contour in Figure10c and is just x=dv0/2 or x*=6/2, where 0 is theangle out from the center along the leaflet arcwhose radius is dv/2. The longitudinal coordi-nate obtained from projection onto the planeperpendicular to the axis of the leaflet is
_ dr(l - cosfl)V 2tany
Substituting 6 = 2x* into this expi-ession for ygivesCirculation Research, Vol. J.5. December 1971,
tany
for the equation of the leaflet contour. Fig-ure lOf is a layout of the vertical coaptingplane surfaces as the projection from Figure10a and b. The bottom curves are parts ofellipses formed by the intersection of thecoaptation planes with the leaflet cylindersection. The two coapting planes from FigurelOf are reconstructed on Figure lOe to becoincident at the commissure attachmentpoint and tangent to the top curve of thecylindrical leaflet section there.
The light internal lines of Figure 10 arerepresentative of the collagen load-carryingfiber bundles. The load in the top point of thecylindrical section (Fig. lOe) is carried by thefibers running down through the coaptationzones (two fiber lines are illustrated). Theparts of the coaptation surfaces above thelines to the point are unstressed (except forthe compressive pressure loading).
The entire geometry is essentially deter-mined by the angle a (since (3 = y). Thecommissure height (0.37) and the centercoaptation height (0.17) do not affect thefinal shape of the cylindrical part of theleaflet or its load-carrying ability and stress.The size of the split necessary to allow adevelopment of the coapting surfaces withthe cylindrical surface with contiguity at theattachment lines shown in Figure lOe is alsodetermined by a. The value 20° < a < 25°minimizes this separation and the size of theslit window where the fold line diverges.
If the leaflet thickness were uniform, thestress would be cr = pd/2t, since it is a thinmembrane (t < < d) with a uniform radius(cylindrical section). The maximum value ofthe pressure, p, is about 100 mm Hg at valveclosure. The maximum membrane stress isthen on the order of 27 x 105 dynes/cm2 for aleaflet thickness of 0.5 mm.
Discussion
The design geometry derived from valvecast measurements is an averaged repre-sentative geometry for the aortic heartvalve. The simple cylindrical geometry of theload-carrying part of the leaflet gives a uni-form stress resultant (load per unit thick-ness) equal to pd/2.
This derived simplified geometry does nottake into account variations from one leaflet
at WESTERN MICHIGAN UNIV on February 17, 2014http://circres.ahajournals.org/Downloaded from

880 SWANSON, CLARK
FIGURE 10
a: Side -profile through attachment plane, b: View from left ventricular side, c: Sectionthrough cylindrical leaflet profile, d: Projected attachment line profile, c: Developedsurface of leaflet, f: Planar layout of coapting surfaces. Dimensions are relative to dr* =1.0.
0 40 80 120PRESSURE-mm Hg
FIGURE 11
Coapting leaflet thickness as a function of pressure.
to another, specifically observed variationsin attachment line geometry between coro-nary and noncoronary leaflets. These varia-tions were not included because of the objec-tive of obtaining a simplified geometry thatcould be fabricated for clinical installationand because the variations were not largeenough to be considered as physiologicallysignificant for prosthetic valve installa-tion.
The leaflet and attachment load stressesare maximum at valve closure. Bendingstresses during the folding wave motion dur-ing valve opening are an order of magnitudesmaller than the static load stresses followingvalve closure (11).
Since the free edge is always unloaded orunstressed, its length should not change sig-nificantly. As the diameter at the top of thecommissure increases with pressure, the free
Cirathtion Raearch, VoL 35, December 197i
at WESTERN MICHIGAN UNIV on February 17, 2014http://circres.ahajournals.org/Downloaded from

AORTIC VALVE DMENStONS AND GEOMETRY 881
edge angle, tf>, should then decrease signifi-cantly if f is to remain about constant. Theseconclusions are verified with reference to thevariations of f and <f> with pressure in Tables2 and 3.
The large apparent redundancy of thecoapting surfaces above load-carrying fiberlines through the point of the cylindricalsection (Fig. 10) serves several purposes.First, this zone actually decreases in area asthe pressure is increased as described earlierin this paper. Second, as the leaflets foldback during systole, their length is such that» h so that the free edge of the openleaflets forms a circle providing a flow sepa-ration surface of maximum leaflet and flowstability against leaflet vibrations and localflow separations. We also speculate that thisgeometry in the opening transition and theopen state is critical in the development ofthe circulatory vortex flows in the sinuses.
It is to be expected that the circumferen-tial leaflet modulus should be relativelyhigh, since the primary leaflet load-carryingstructure is circumferential, coarse, rela-tively stiff collagen fibers as indicated by thestriation patterns on the casts of the aorta(Fig. 8) and by photomicrographs (12). Sincethere is no significant load in the radialdirection, the valve leaflet is less stiff in thatdirection, allowing the greater flexing mo-tion during opening and closing (5). The castsand photomicrographs also show a smooth,fine fiber structure on the ventricular side.
The apparent paradox that the radial mod-ulus is less than the circumferential modulus(9, 10) although the radial length variationwith pressure is small is resolved by thecondition that the radial stress is negligible.The length along the leaflet, €c, measured ina radial plane is then about constant. As thevalve diameter increases, the center coapta-tion, Cc, must decrease to yield a constant €c.In fact Ce does decrease, but not enough toyield a constant fc. The fc increases can thenbe attributed to a very low longitudinal mod-ulus, a consequence of the coarse, stiff, cir-cumferential collagen fibers "rolling" in aless stiff thinner collagen and elastic fibrousmatrix material. The leaflet must be quiteelastic in the radial direction (9) to maintainthe sharp curvature at the coaptation inter-section without producing large stresses.The bending stress at the coaptation inter-
Cimilation Research, VoL 35, December lBTi
section line is further decreased by a verythin structure there. The primary leaflet de-formation during opening and closing isbending in radial (or meridional) planes (5).The structure just described and the corre-sponding modulus behavior then minimizethese bending deformation stresses.
The cylindrical leaflet shape is the sim-plest constant-stress structure for a uni-formly thick, uniformly loaded membrane. Ifa weakness exists in the membrane, it willbulge to a double curved shape. Since thestress is inversely proportional to curvature,a locally decreased stress results. Observa-tions of a number of the leaflets with signifi-cant nonuniformities from one cusp to an-other also showed significant bulges in theleaflets near their roots at the higher pres-sure levels of 80-120 mm Hg.
The small variations of base diameter, dv,and overall effective valve height with pres-sure are advantageous with respect to pros-thetic valve design and installation. The di-ameter into which the valve is sutured andthe height of the vertical attachment tissueto which the stent may be sutured vary onlyslightly with pressure. The stresses producedbecause of the difference in vertical stretchof the sinus-aortic stricture and the morerigid prosthetic valve structure from strainson the order of these variations in dv and hare then small.
The large apparent decrease in leafletthickness with increasing pressure may be aconsequence of the highly folded andcrimped collagen fiber structure as well as atrue compression or water absorption-de-sorption effect. The grossly nonlinear stress-strain behavior (9) may also be attributed toinitial straightening of the crimped andfolded collagen fiber structure. The initiallow modulus range occurs as the fibers arestraightened out; the posttransition modulusexists as the straightened fibers arestressed. This behavior is similar to thatobtained with crimped synthetic fibers orwith rubber as the coiled molecules arestraightened during the pretransition phaseand the posttransition phase occurs for de-formation of the stretched out molecules.
It is also interesting that the projectedpressure load produced by 100 mm Hg overthe area of dv is about 108 dynes (equivalentto a weight load corresponding to about 1
at WESTERN MICHIGAN UNIV on February 17, 2014http://circres.ahajournals.org/Downloaded from

882 SWANSON, CLARK
kg). This downward force is balanced primar-ily by the distributed pressure force on thecurved wall of the aortic arch.
References1. GOULD PL, CATALOGLU A, DHATT G, CHATTOPA-
DHYAY A, CLARK RE: Stress analysis of the hu-man aortic valve. National Symposium on Com-puterized Structural Analysis and Design, G«orgeWashington University, 1972
2. WOOD SJ, ROBEL SB, SAUVAGE LR: Technique forstudy of heart valves. J Thorac Cardiovasc Surg46:369-385, 1963
3. SAUVAGE LR, VIGGERS RF, BERGER K, ROBEL SB,SAWYER PN, WOOD SJ: Prosthetic Replacement ofthe Aortic Valve. Springfield, Illinois, Charles CThomas, 1972
4. MERCER JL, BENEDECTY M, BAHNSON HT: Geometryand construction of the aortic leaflet. J ThoracCardiovasc Surg 65:511-518, 1973
5. SWANSON WM, CLARK RE: Aortic valve leaflet mo-tion during systole. Circ Res 32:42-48, 1973
6. MOZERSKY DJ, SUMNER DS: Transcutaneous meas-
urement of the elastic properties of the humanfemoral artery. Circulation 46:948-955, 1972
7. A R N D T J O , KOBERG: Die Druck-Durchmesser-Bezie-hung der in takten A. Femoralis des wachenMenschen und ihre Beeinflussung durch Nora-drenalin-Infusionen. Pfluegers Arch 318:130-146,1970
8. MINNS RJ, SODIN PD: Role of the fibrous compo-nents and ground substance in the mechanicalproperties of biological tissues: A preliminary in-vestigation. J Biomechanics 6:153-165, 1973
9. CLARK RE: Stress-strain characteristics of fresh andfrozen human aortic and mitral leaflets and chor-dae tendineae. J Thorac Cardiovasc Surg 66:202-208, 1973
10. CLARK RE, BUTTERWORTH GAM: Characterizationof the mechanics of human aortic and mitral valveleaflets. Surg Forum 22:134-135, 1971
11. SWANSON WM, CLARK RE: Motion and stresses inaortic valve leaflet during systole. American Soci-ety of Mechanical Engineers Paper 72-WA/BHF-5,1972
12. CLARK RE, FlNKE EH: Scanning and light micro-scopy of human aortic leaflets in stressed andrelaxed states. Cardiovasc Surg 67:792-804, 1974
Circulation Research, VoL 35, December I97i
at WESTERN MICHIGAN UNIV on February 17, 2014http://circres.ahajournals.org/Downloaded from