dimensions of empowerment; relationship with...
TRANSCRIPT

104
CHAPTER-6
DIMENSIONS OF EMPOWERMENT;
RELATIONSHIP WITH SOCIO-ECONOMIC FACTORS
Empowerment as discussed by Kabeer (2001) is “the expansion in
people's ability to make strategic life choices in a context where this ability was
previously denied to them”. She describes this process in terms of “thinking
outside the system” and challenging the status quo. This chapter intends to
examine the dimensions of empowerment among kerala women IT professionals
working in Technopark. It also attempts to find out the socio economic factors
influencing their empowerment .The level of empowerment enjoyed by the
respondents in their personal, professional, economical, familial/interpersonal and
socio-cultural sphere are subjected to scrutiny. The different aspects of
empowerment such as literacy & education, economic role outside the family, &
earning power, property rights, access to and control over the resources, control
over decision making etc are measured using indicators in potential and
operational level such as:
Personal sphere
• Pursuit of hobbies and interests.
• Exercising choice regarding dressing pattern
• Exercising choice regarding spouse selection
• Autonomy in taking decisions in matters related to marriage, family, job
and household affairs.
• Access and control over domestic resources.
• Satisfactory health status related to nature of work in IT.S

105
Socio-Cultural sphere
• Visits to places of worship
• Participation in family functions
• Outings with family
• Access or ownership of social status symbol
Economic sphere
• Autonomy in decision making regarding economic transactions, savings
and investments.
• Access and control over expenditure, savings and investments.
Familial/Interpersonal sphere
• Freedom from authority and domination of same generational males.
• Absence of restriction from family regarding job related mobility.
Professional sphere
• Technical knowledge.
• Autonomy in work
• Working under pressure and meeting targets on time
• Working flexibly with respect to time and multi tasking
• Stress induced by work practices
• Satisfactory health status related to nature of work in IT industry
• Sexual harassment at work place
The extent to which the empowerment indicators are satisfied with adequate
freedom, independence and competence in the household, community, and
broader arenas is examined in this chapter. A woman’s level of empowerment

106
will vary, sometimes enormously, according to other criteria such as her class or
caste, ethnicity, relative wealth, age, family position etc and any analysis of
women’s power or lack of it must appreciate these other contributory dimensions.
Similarly, the meaning of any empowerment indicator will always depend on
its interrelationships with other variables.
Hence, the study also focuses on the socio economic factors that influence the
empowerment of women IT professionals of Technopark. For the purpose, the
different socio economic factors such as:
• Age of respondents
• Marital status
• Income of the respondents
• Occupational designation
• Type of family
• Religion
are cross analysed with empowerment indicators based on contextual relevance.
6.1 Personal sphere
6.1.1 Pursuit of hobbies and interests.
Table: 6.1.1a
Distribution of respondents based on pursuit of hobbies and interest
Reaction of respondents Frequency Percent Yes 198 66.0 No 99 33.0 Not Revealing 3 1.0 Total 300 100.0

107
The above table reveals that a majority of 66 percent of respondents are pursuing
their hobbies and interests while 33 percent responded that they are not able to
pursue their hobbies and interests. They complained about the time constrains
brought about by the busy work schedule of IT industry. Moreover they were
unable to assign priority to their hobbies and interests while trying to do justice to
the family responsibilities.
As Sharma says, ‘however empowered they are or feel, almost all women IT
professionals still give their families higher priority than their work and- like
nearly all women in India and much of the rest of the world- they do not regard
paid work as any part of women’s normal duties in the way that is for men’
(1986:129). Hence in the midst of the efforts to fulfill family responsibilities, they
are at a loss to do justice to their hobbies and interests.
Table: 6.1.1b
Pursuit of hobbies and interests and relationship with socio economic factors
Socio economic
factor Maximum pursuit of hobbies
and interestsPercentage of
pursuit Age 31 to 35 years 78
Religion Hindu 70.4
Marital status Married 72.3
Type of family Extended families 88
Income Rs 50,000/- to Rs 100000/- 78.5
Occupational
Designation
Senior IT professional technical
level 2
75

108
While analyzing the relationship of the variable with marital status, it was found
that a high majority of 72.3 percent of the married respondents were pursuing
their hobbies and interests while only 59.4 percent of the unmarried respondents
were able to pursue the same. In spite of factors such as household duties and
catering to the needs of family members, pursuit of hobbies and interests should
be necessarily perceived as sign of empowerment.
A religion wise analysis showed that among the 183 Hindu respondents, a
sizeable majority of 70.4 percent was pursuing their hobbies and interests and this
was followed by 60 percent of Christian respondents who were able to pursue the
same. On the contrary, only 50 percent of the Muslim respondents were pursuing
their hobbies and interests which owes to the comparatively conservative,
restrictive and dominant family atmosphere which insists on subordination of
personal interests to family welfare. Exploring the relationship of the variable
with type of family, it was found that a high majority of 88 percent of the
respondents who had extended families were pursuing their hobbies and interests
which was followed by 67 percent of respondents living in joint families. Among
the respondents who lived in nuclear families, only 63 percent was able to pursue
their hobbies and interests which is comparatively the lowest percent. From the
finding it can be inferred that respondents who live in extended and joint families
are getting assistance from other family members in meeting domestic demands
which allows them to pursue their hobbies and interests. The finding also points
to the lack of adequate domestic assistance faced by respondents belonging to
nuclear families.

109
The percentage of pursuit of hobbies and interests among respondents holding
different occupational designations did not show any sharp variation even though
Senior IT professional technical level 2 were the group who had a highest of 75
percent of respondents pursuing their interests. It needs to be noted that they
being seniors belong to higher age group above 30 years, have good job
experience which ranges from 5 to 10 years, have good pay above Rs 50,000/-
and have grown up children who are able to cater to their own needs to a
considerable extent.
A similar result was obtained when the variable was analysed with respect to age
group of the respondents. A high majority of 78 percent of the respondents
belonging to the age group 31-35 years were the lot who pursued their hobbies
and interests to the maximum. Similarly when the relationship of the variable with
income level was analysed it was found that the privilege was enjoyed maximum
by 78.5 percent of respondents who earned an income between Rs 50000/- to Rs
100000/- and this was closely followed by 75.6 percent of respondents who
earned an income above Rs 100000/- per month.
Thus it needs to be inferred that better income, better job competence and
favourable family circumstances are the factors that permit the respondents to
have their favourite life choices.

110
6.1.2 Exercise of choice regarding dressing pattern
Table: 6.1.2a Distribution of respondents regarding choice of dress pattern
Criteria of choice Frequency Percent
Fashion 31 10.3
Convenience 219 73.0
Convention 12 4.0
Fashion and Convenience 25 8.3
Fashion and Convention 4 1.3
Convenience and Convention 4 1.3
All the three reasons 5 1.7
Total 300 100.0 From the above table it can read that a high majority of 73 percent of respondents
give importance to their own convenience while choosing a dress pattern.
Respondents who consider fashion as the criteria for choosing dress pattern come
only up to 10.3 percent. Only 4 percent of the respondents bother about
convention while selecting a dressing style. During depth interviews, the
respondents revealed that they are well aware about the fashion trends as well as
the dress code that is socially preferable. But while dressing up they felt
comfortable only if they found the attire convenient enough to satisfy their
particular social role. Considering convenience as the criteria of choice, points out
the importance assigned by the respondents to personal preference rather than
conforming themselves to social norm or fashion trends. This is of course an
indicator of empowerment and this need to be interpreted that the respondents are
exercising autonomy in decision making regarding dressing pattern.

111
Apart from personal choice regarding dressing pattern, women IT professionals
are also obliged to follow certain dress codes while they are at their office. In the
words of one of the respondents, ‘We have dress code in office- formals from
Monday to Thursday and casuals on Friday. But it varies from branch to branch.
When we are at our working place, we really have to be prim and proper-
anything wrong means your lead or somebody else will say something’. In a
sense the industry norms are inculcating a neat and proper dressing style on their
employees but if taken in another sense, cultural training and dress code can also
be seen as subtle ways in which workers are disciplined to make them ideal for
the software industry (Mukherjee 2008).
Table: 6.1.2b
Choice of dress pattern and relationship with socio economic factors.
Socio economic
factor Choice of convenient dressing
style Percentage of
pursuit
Age 25 to 30 years 74
Religion Hindu 77
Marital status Married 74
Type of family Extended families 77
Income Less than Rs 10,000/- 81
Occupational
Designation
Junior IT professional
Managerial/ Technical Level-1
76.4

112
To analyse the influence of socio- economic factors on choice of dress pattern, the
relationship of religion and criteria regarding choice of dress pattern was
subjected to scrutiny. The findings revealed that a high majority of 77 percent of
Hindu respondents gave importance to convenience while choosing dressing
pattern and this group was followed by 67.6 percent Christians. On comparison, it
was also found that it was Christians who were more fascinated by fashion trends.
An analysis of choice of dress pattern in relation to type of family disclosed that
77 percent of the respondents belonging to extended families were the group
which assigned more importance to convenience in dressing and they were
closely followed by 76 percent of respondents hailing from joint families. A
comparison among the groups also revealed that fashion was more followed by
respondents from nuclear families. Similarly, respondents with urban locality of
residence had more inclination towards fashionable dressing and this can be
explained in terms of more exposure of urban residents towards media,
advertisements and consumerism.
When the role played by marital status was examined, no sharp variations could
be found among married and unmarried respondents as 74 percent of married
respondents and 72 percent of unmarried respondents assigned importance to
convenience in dressing.
Occupational designation was also studied in the context, which revealed that
only slight variations exist in the percentage of respondents holding different
occupational designations with regard to choosing dress pattern based on
convenience. Even then, respondents designated as Junior IT professional

113
Managerial/ Technical Level-1 were the group who gave maximum priority to
convenience (76.4 percent). On comparison, it was also found that the same group
was more interested in fashionable dressing coinciding with their age group
between 20 to 25 years.
Age wise analysis proved that youngsters belonging to the age group 20 to 25
years were comparatively more interested in fashion while respondents belonging
to the age group 25 to 30 years gave maximum stress to convenient dressing.
Income wise analysis discloses that a high majority of 81 percent of respondents
who had income below Rs 10000/- were advocating maximum for convenient
dressing and they were followed by respondents earning income between Rs
10000/- and Rs 25000/-per month. Another striking finding is that 42 percent of
the respondents earning between Rs 50000/- and Rs 10000/- per month were the
group which showed maximum interest in fashion.
Thus from the above findings it can be inferred that regarding dressing pattern, a
high majority of respondents are empowered enough to assign importance to
personal preference irrespective of the pressure induced by fashion and social
norm although factors such as income, age, type of family and locality of
residence act as powerful determinants in deciding the criteria for choosing dress
pattern.

114
6.1.3 Exercise of choice regarding spouse selection
Table: 6.1.3a Distribution of married respondents based on spouse selection.
Mode of marriage
Frequency Registered marriage Traditional-style marriage with relative and friends’ participation
Marriage Details
Frequency
With parental consent
Without parental consent
Love
marriage
14
(9%)
3
(23.5%)
2
(11.7%)
9
(64.7%)
Inter-caste 8(58.8%)
Inter-religious 2(11.7%)
Within same caste & religion
4(29.4%)
Arranged marriage
43 (29%)
2
(6%)
0 41 (94.2%)
Inter-caste 5(11.5%) Inter-religious 1(3%)
Within same caste & religion
37(84.6%)
Love cum arranged marriage
with active parent
support
92 (62%)
12 (12.7%)
0 80 (87.2%)
Inter-caste 13(13.6%)
Inter-religious 7 (8%)
Within same caste & religion
72 (78%)
The above table reveals that among the 149 married respondents, a high majority
of 62 percent had love cum arranged marriage with active parental support. In
some cases, parents supported their choice which seemed to them as genuine
while in some other cases, women got the opportunity to know better, love and
marry the person who was suggested by their parents. Fuller and Narasimhan
(2008) have also found in their study that women IT professionals are confident
of their value as potential partners and hence are sure about their parent’s ability

115
to find them good husbands. Most of them are also confident that they will have a
full say in the selection process so that no unwanted person will be forced upon
them. While 12.7 percent of them had registered marriage with parental consent,
an exceptionally high majority of them (87.2 percent) had traditional style of
marriage with the participation of relatives and friends. Among the respondents
who had love cum arranged marriage, 13.6 percent married out of caste, 8 percent
married out of religion while a high majority of 78 percent married within same
caste and religion. Obviously, marrying within one’s caste and religion has
greater social recognition and support although the person challenges the family
authority in taking decision regarding marriage. Again, among the married
respondents, while 29 percent conformed to arranged marriage, 9 percent
preferred to have love marriage which is a smaller but a significant percentage.
Among them, 64.7 percent had marriage in traditional style in the presence of
friends and relatives who favoured the marriage.
Among the respondents who had love marriage, 29.4 percent married within same
caste and religion while 11.7 percent had inter religious and 58.8 percent had
inter-caste marriage. Executing a love marriage against the social norm indeed
requires greater poise, courage and persistence but implementing a love cum
arranged marriage with active parental and social support should be seen more as
an indicator of personal empowerment. In addition, implementing a love cum
arranged marriage outside one’s caste and religion should be considered as the
most empowered scenario. The study discloses that out of the 92 love cum
arranged marriages held with parental support, 20 were inter-caste and inter-
religious. Here it should be interpreted that this group of respondents have had

116
upper hand in the power struggle as being able to convince and persuade the
social world around them to execute their choice with active social support.
Table: 6.1.3b
Distribution of unmarried respondents based on choice regarding spouse
selection.
Preference Frequency Percent
Love marriage 20 13.2
Arranged marriage 8 5.2
Love cum arranged marriage 123 81.4
Willingness to marry without parental consent
120 79.4
Willingness to marry out of one’s caste and religion without parental consent
58 38.4
The above table discloses that among 151 unmarried respondents, only a small
group (5.2 percent) prefer arranged marriage. This is in contrast to the findings
put forward by Upadhyaya and Vasavi (2008) which states that most women IT
professionals prefer conventional arranged marriages. A high majority of 81.4
percent prefer love cum arranged marriage as they expect their choice to be
approved and supported by family and society which is the ideal and most
desirable condition. Moreover, as mentioned by Upadhyaya and Vasavi (2008)
they are also aware about the family support structures they need to continue their
job in IT industry. Yet a high majority of 79.4 percent was willing to marry
without parental consent upholding their personal choice.

117
Table: 6.1.3c Spouse selection and relationship with socio economic factors.
Socio economic factor
Distribution of married respondents
Distribution of unmarried
respondents
Maximum intercaste/inter-religious marriages
Willingness to marry out of caste and religion without parental consent
Age 20-25 years(72 percent)
20-25years
(79 percent)
Religion Hindu(55.2 percent) Hindu (55 percent)
Type of family Nuclear(55.2 percent)\ Nuclear (70 percent)
Education of respondents
BCA/B.Tech(36.8percent) B.Tech (34.4 percent)
Occupational Designation
Junior IT professional Manegerial/ Technical Level-1(42 percent)
Junior IT professional Manegerial/ Technical Level-1(36 percent)
Income Rs 10,000/-to Rs 25000/-
(55.2 percent)
Rs 10,000/-to Rs 25000/-
(62 percent)
When asked about their willingness to marry out of one’s caste and religion
without parental consent, only 38.4 percent responded positively. Though the
percentage is comparatively low, this group of respondents should be perceived as
most empowered, as they are the lot who are confident enough to defend their
personal preference, as being ready to implement their decision and carry out their
marriage outside caste and religion even without parental consent, invalidating the
social support of their family and relatives. They reflect strong individual
orientation rather than apprehensive social conformation.

118
An analysis of the group of married respondents who have had maximum
inter-caste/inter-religious marriages in relation to the different socio-economic
factors is undertook to examine the various factors that influence their
empowerment. The above table shows that a majority of 72 percent of the
respondents who have married out of their caste and religion belong to the age
group between 20-25 years. Among them, a majority of 52.2 percent are Hindus.
It is also striking to note that no love cum arranged marriages is held among
Muslim respondents which reflect the orthodox mentality of the community. It is
seen that respondents hailing from nuclear families are more into inter-caste and
inter-religious marriages. Absence of influence from grandparents advocating for
adherence towards caste and religious affiliations may be facilitating the
respondents to think outside such social restrictions. When the educational
qualification of the group of respondents was analysed, a majority of 36.8percent
of them either had a degree of B.Tech or BCA. Technical knowledge in the field
of Information Technology indeed makes the respondents academically and
financially confident to implement their personal choice even revoking the
prevalent social norms. A majority of 42 percent had their occupational
designation as Junior IT professional Managerial/ Technical Level-1 which is
very much explicit from their age group and years of experience in the IT Field.
This naturally explains the income of majority of 55.2 percent of the respondents
which falls between Rs 10,000/-to Rs 25000/-.
Similarly, when the choice of unmarried respondents with regard to spouse
selection was analysed, in relation to the different socio economic factors, it was
119
found that majority of the respondents who are willing to marry out of caste and
religion without parental consent are Hindus (55 percent) who belong to the age
group between 20-25 years (79 percent). A majority of 70 percent of them hail
from nuclear families which is conducive for opting inter-caste and inter-religious
marriages. It is the respondents with B.Tech degree who are most willing to marry
out of caste and religion without parental consent and as discussed earlier,
professional competence adds to their confidence in prioritizing their personal
choice. Similar to married respondents, majority of this group of respondents are
designated as Junior IT professional Managerial/ Technical Level-1earning an
income between Rs 10000/- to Rs 25000/-.
Thus, while analysing the decision and willingness of married and unmarried
respondents towards inter-caste and inter-religious marriages in relation to socio-
economic factors, it is strikingly found that both groups of respondents with
similar view points, share common socio- economic status with respect to age,
religion, type of family, educational qualification, income and occupational
designation although variations persist in percentages.
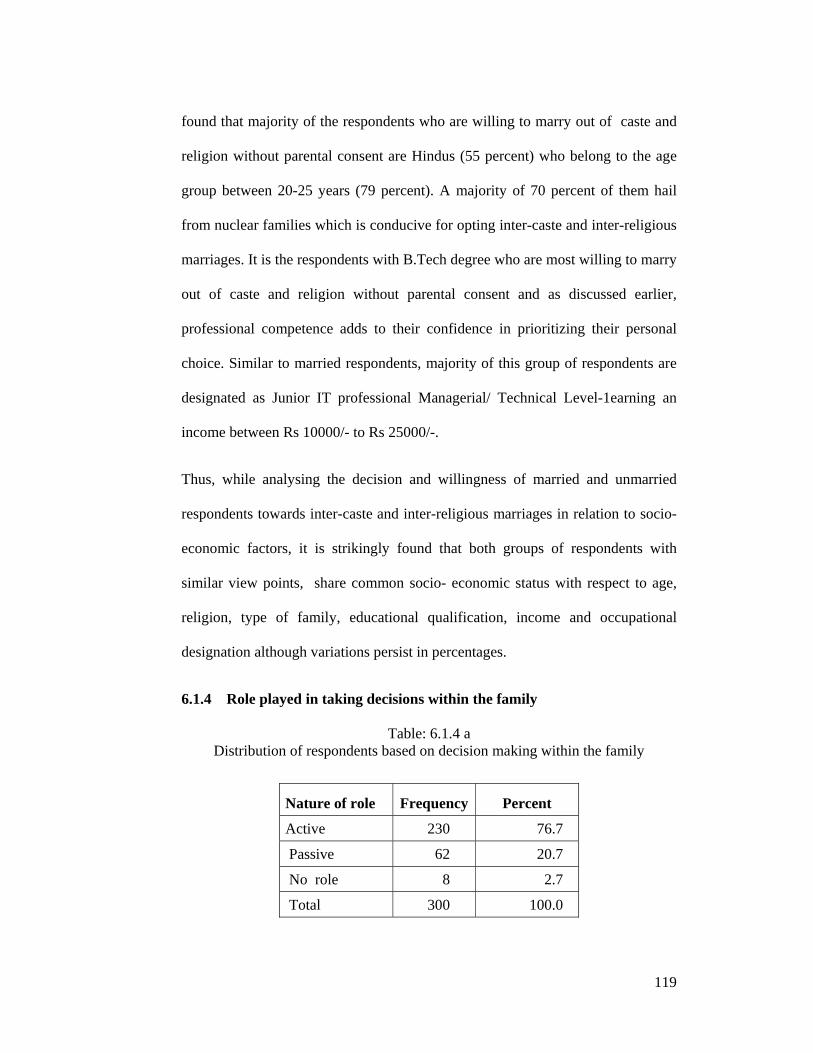
6.1.4 Role played in taking decisions within the family
Table: 6.1.4 a Distribution of respondents based on decision making within the family
Nature of role Frequency Percent
Active 230 76.7
Passive 62 20.7
No role 8 2.7
Total 300 100.0

120
The above table shows that a majority of 76.7 percent of the respondents play
active role in decision making within the family while 20.7 percent play only a
passive role. Among the respondents, a few of them which come up to 2.7 percent
disclosed that they have no role in decision making within the family. The role
played by them in relation to socio-economic factors can be looked upon for a
better analysis.
Table: 6.1.4b
Role in decision making and relationship with socio economic factors.
Socio economic factor Active role in decision making within the family
Percentage of respondents
Age 25 to 30 years 76
Religion Hindu 82.5
Marital status Married 80.4
Type of family Nuclear 77.9
Education of respondents MCA 82
Income Rs 25,000/- to Rs 50,000/- 86.6
Order of Birth Single child 89
When the role played by the respondents in decision making was analysed in
relation to socio-economic factors, it is found that majority of the respondents
who play an active role belong to the age group between 25 to 30 years. When the
marital status was analysed, a high majority of 80.4 percent of the married women
are playing an active role in decision making within the family and they are
closely followed by 73 percent of the unmarried women. Analysis of the order of
birth brought to light that an exceptionally high majority of 89 percent of the
respondents who are actively involved in the decision making are single child to

121
their parents. Being the only child, they are more involved in family matters and
while acting as a decision making helping hand to their parents, it’s natural that
they take an active role within the family. This group is closely followed by 79.6
percent of the respondents who actively take up family responsibilities being the
eldest child. It is also found that children from nuclear families are more active in
the decision making process of the family. Absence of older generation with
patriarchal views in the nuclear family is acting conducive for egalitarian relations
among the family members favouring the respondents to play an active role in the
decisions of household. When the income level of the respondents was analysed
in the context, it was strikingly revealed that with greater income, empowerment
in terms of decision making within the family goes on declining. Most
empowered are the respondents who have masters degree in computer
applications (82percent ) and those who earn a monthly income of Rs 25000/- to
Rs 50000/- (86.6 percent of them are active in decision making) followed by
respondents with monthly income between Rs 10000/- to 25000/-. Among the
respondents who earn between Rs 50000/- to Rs 100000/-, 64.2 percent play
active role where as among the respondents who earn more than Rs100000/-, only
50 percent are actively involved in decision making. Respondents who earn high
are naturally above 30 years with more job experience and they belong to an elder
generation still in the clutches of habitualised patriarchal domination.
Thus it can be inferred that Hindu married women IT professionals between 25 to
30 years, hailing from nuclear family and earning a salary between Rs 25000/- to
Rs 50000/-who happen to be the single child of their parents is the most
empowered group as far as decision making within the household is concerned.

122
6.1.5 Access and control over domestic resources
Table.6.1.5a
Distribution of respondents based on access and control over resources
On analysing the equitable control and access of respondents over domestic
resources such as car, television etc, it was found that a vast majority of 79.7
percent enjoyed access and control over the same. Only a nominal number of
respondents (7.3percent) disclosed that they have no control and access to their
household resources. Among the respondents, 13 percent also responded that they
have access and control only to certain extent. In depth interviews revealed that
though they had control and access over the resources, priority was always
cherished by male authority of the family i.e., by father or husband or elder
brother which reflects non equitable treatment and distribution of resources in the
family upholding patriarchal authority and dominance. Thus from the table it can
be inferred that though there are variations, majority of the respondents are
empowered in terms of equitable control and access over their domestic resources
and have succeeded in overcoming the patriarchal domination. A detailed analysis
in terms of their socio-economic status is carried out to bring light into the subtle
determinants in this regard.
Response Frequency Percent
Yes 239 79.7
No 22 7.3
Only to some extent 39 13
Total 300 100.0

123
Table.6.1.5b
Access and control over resources with respect to socio-economic factors
Socio economic factor
Active role in decision making within the family
Percent
Age 30 to 35 years 90.0
Religion Hindu 82.5
Marital status Married 81.1
Type of family Nuclear 81.1
Income Rs 50,000/- to Rs 10,0000/- 92.8
When access and control exercised by the respondents over the resources was
analysed in relation to socio-economic factors, it was found that among the
respondents who belong to the age group 30 to 35 years, an exceptionally high
majority of 90 percent was having equitable access and control. Income wise
analysis revealed that respondents who were earning an income between Rs
50,000/- to Rs 100000/-were having maximum and control and access over the
resources. This group was closely followed by respondents who earn above Rs 1,
00,000/- per month. This finding brings light to the fact that respondents who earn
high have more control and access over the resources as they play a crucial
economic role in purchasing and maintaining the same. According to this
statement, empowerment in this context seems comparatively a little low among
respondents earning above Rs 1, 00,000/- per month but it needs to be
remembered that they belong to the age group above 35 years and being the
products of elder generation, they are more conforming and habitualised towards
patriarchal authority and domination which denies equity for women.

124
When marital status was subjected for study in this regard, it was found that
married women (81.1 percent) are more empowered than unmarried women (78.2
percent) with respect to equitable control and access over the resources. It was
also found that nuclear family was more conducive for empowerment in this
regard as a majority of 81.1 percent of respondents hailing from the same was
exercising more access and control. Religion wise analysis showed that a vast
majority of 82.5 percent Hindus was exercising their control over the resources
and this group was followed by 65.6 percent Christians and 62.5 percent Muslims.
Thus it needs to be inferred that high income is the most crucial factor influencing
and determining equitable control and access over the resources although the role
played by other factors such as age, religion, marital status and type of family
cannot be undervalued.
Testing of Hypothesis 1: Empowerment of women in IT industry is largely
associated with their socio economic conditions.
Table: 6.1.6
Positive Association of Empowerment indicators in Personal sphere with socio- economic factors
Empowerment indicators Socio-economic factors P value Pursuit of hobbies and interests Age 0.049
Exercise of choice regarding dressing pattern
Income 0.027
Nature of marriage (married respondents)
Age 0.38
Type of family 0.042
Education of respondents 0.000
Decision making within the Family
Education of respondents 0.020

125
The positive association between the above mentioned empowerment indicators
and socio-economic factors is statistically proven by administering the chi square
tests and the p values obtained for the same are less than 0.05. Hence the
hypothesis that the empowerment of women IT professionals is largely associated
with their socio economic conditions is accepted with respect to the personal
sphere.
Empowerment with respect to access and control over domestic resources has no
significant association with any of the socio-economic factors. Thus, the above
said hypothesis is accepted with respect to pursuit of hobbies and interests,
exercise of choice regarding dress pattern, nature of marriage and decision
making within the family while it is rejected with respect to access and control
over domestic resources. The relationships found here are relevant to the
population.
6.2 Socio-Cultural sphere
6.2.1 Visits to places of worship
As discussed under Table-5.3.1, the respondents who daily visit their places of
worship are only 4.3 percent. Respondents who make visits on monthly basis are
55 percent, which is the majority group. Respondents who rarely make visit are
14.6 percent while those who make less visit i.e., on special occasions are 7.3
percent and on festivals are one percent. Those who do not make visits at all are
17.6 percent. Thus from the data it can be inferred that respondents are paying
less importance to religious activities, especially when concerned with visit to
places of worship. Ideology and religion are subtle deeper and invisible forces
that invade all sectors of human interaction. Ideologies, religious beliefs reflected

126
through societal ideas, morals, values and beliefs play a major role to regulate the
behaviour of men and women and fix ideas about expected behaviour
(Padmavathi, 2006). Hence, lack of adherence to religion and associated
ideologies is congenial for breaking the society’s habitualised and reinforced
norms of female subordination.
Table-6.2.1a
Visit to worship places and relation to socio-economic factors
Socio economic factor Monthly visit to places of worship (most frequent)
Percentage of respondents paying
monthly visits
Age 25 to 30 years 62
Religion Christian 79
Marital status Married 54.5
Type of family Extended 55
Income Rs 25,000/- to Rs 50,0000/- 64.4
The above table reveals that respondents belonging to the age group between 25
to 30 years are the most frequent group visiting their places of worship on
monthly basis (62 percent). No sharp variation could be found when marital status
was analysed in this context. Married respondents were the majority group (54.5
percent) closely followed by unmarried respondents (52 percent) as far as
frequent visit to worship places was concerned. Income wise analysis also points
to the same group as a majority of 64.4 percent of the respondents earning
between Rs 25000/- to Rs 50000/- are frequent in their visits on monthly basis.
An analysis of the type of family of the respondents brought light to the fact that
frequent visit to places of worship was more among respondents hailing from
extended families(55 percent) closely followed by respondents hailing from joint

127
families. Presence of older generation in the family indeed facilitates cultural and
religious orientation among the respondents which in turn promotes the frequency
of visits to places of worship. Religion of the respondents, the main criteria was
also subjected to study and it revealed that Christian respondents (79 percent)
were more frequent in their visit to worship places .A compulsory factor present
in the case of visit to churches which is different from temples and mosques
explains this finding. Visit to worship places was nil among Muslim women as
there exist a prohibition among Muslims against female visit to worship places.
High frequency resulting from compulsory visit to worship places cannot be
interpreted as a sign of empowerment as there lays the absence of freedom of
choice. Yet, married women finding time, space and attitude to pay religious
visits in spite of busy schedule should be perceived as empowered in this regard.
6.2.2 Participation in family functions
As discussed under Table 5.3.3, only a feeble majority of 30.7 percent ‘always’
participated in family functions. Respondents who ‘often’ went for the functions
were found to be only 4 percent. These two of groups can be perceived as the
category of respondents who are actually interested and finding time to maintain
family and social ties in family get togethers. Respondents who went only
‘sometimes’ to attend the family functions come up to 30.3 percent while those
who went seldom are 2 percent and those who never went for family functions are
33 percent. This is the majority category of respondents who have less
participation and in turn, weak inter familial and social ties.

128
Table-6.2.2a
Participation in family functions and relation to socio-economic factors
Socio economic factor
Participation in family functions(most frequent)
Percentage of participation
Age 25 to 30 years 62
Religion Christian 79
Marital status Married 37
Type of family Joint 50
Income Less than Rs 10000/- 64.4
When participation of respondents was analysed in relation with socio-economic
factors, it was found that a majority of 50 percent of the respondents who actively
participated in family functions hailed from joint families. Upbringing in a joint
family as well as presence of elder members in family acts as a congenial factor
for strengthening and reinforcing bonds with relatives. No sharp variation could
be found when marital status was analysed as 37 percent of married respondents
were the majority group followed by 35 percent of unmarried respondents. A
good majority of them (62 percent) belonged to the age group between 25 to 30
years. Religion wise analysis showed that majority of the respondents who
actively participate in family functions are Hindus. When income of the
respondents was analysed in this context, it was strikingly found that a majority of
55 percent of the respondents earning a monthly income less than Rs 10,000/-
were actively participating in family functions more than any other category. This
group of respondents work in comparatively small IT companies and are less
stressed with over time or busy work schedule which helps them to comfortably
participate in family and social functions.
129
It should be noted that the category of respondents who genuinely participates in
family functions are less in number when compared to the category of
respondents who have less participation in family functions. Busy work schedule
of IT Professionals as well as loosened inter-familial ties among nuclear families
can be pointed out as the reasons for less participation in family functions. Hence
it should be inferred that majority of the respondents are less empowered as far as
maintenance and reinforcement of inter familial bonds are concerned. Supporting
this finding, Ramesh (2008) has also found in his study that odd work timings and
over exertion leads to disturbances in personal and social life as it creates
problems related to maintaining friendships, keeping in touch with relatives,
accomplishing household duties and finding time for sound family relations.
Employees are not even entitled to religious holidays, as the IT companies work
according to the client’s calendar.
6.2.3 Outings with family
As discussed earlier under table-5.3.2, majority of the respondents (36.3 percent)
go for weekly outing with their family members. This group is followed by
respondents who go for outings on monthly basis. Those who go for outing twice
a week are 12.3 percent while those who have daily outing are 3.7 percent. All the
above discussed categories of respondents are having active social life with their
family members. Those who have no regularity with outing are only 2 percent
while those who do not go for outings are negligible i.e., 1.7 percent. A majority
of 47 percent went for different purposes such as going to hotels, shopping
centres, bookstalls, cinema theatres, visiting friends and relatives etc while 28.3
130
percent went frequently for shopping purpose. From the above data, it can be
inferred that the respondents are highly immersed in a consumerist culture.
Respondents who choose to visit their relatives were comparatively less (18
percent).
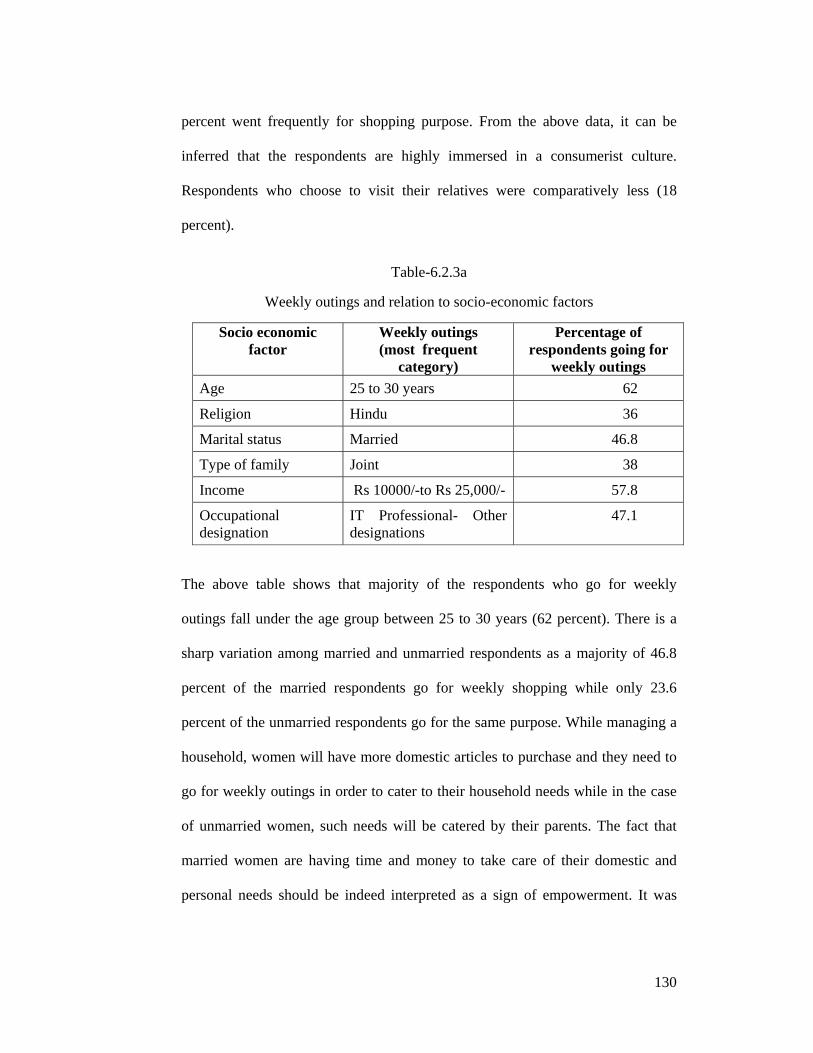
Table-6.2.3a
Weekly outings and relation to socio-economic factors
Socio economic factor
Weekly outings (most frequent
category)
Percentage of respondents going for
weekly outings Age 25 to 30 years 62
Religion Hindu 36
Marital status Married 46.8
Type of family Joint 38
Income Rs 10000/-to Rs 25,000/- 57.8
Occupational designation
IT Professional- Other designations
47.1
The above table shows that majority of the respondents who go for weekly
outings fall under the age group between 25 to 30 years (62 percent). There is a
sharp variation among married and unmarried respondents as a majority of 46.8
percent of the married respondents go for weekly shopping while only 23.6
percent of the unmarried respondents go for the same purpose. While managing a
household, women will have more domestic articles to purchase and they need to
go for weekly outings in order to cater to their household needs while in the case
of unmarried women, such needs will be catered by their parents. The fact that
married women are having time and money to take care of their domestic and
personal needs should be indeed interpreted as a sign of empowerment. It was

131
also seen that weekly outings are more among respondents who hail from joint
families. Presence of more responsible members in the family for sharing the
household duties is conducive for outings as women get more free time to spend
with. Income wise analysis proved that respondents earning between Rs 10,000 to
Rs 25,000 is the majority group going for outings on weekly basis. This sounds
natural as they have adequate money to spend in addition to the fact that they
belong to the age group which is most targeted by the market and media forces to
induce the consumerist culture as well. The study also puts forth the piece of
information that outings are more common among Hindu respondents. It was also
seen that IT professionals holding other designations are more seen with a
shopping spree nature.
Thus it can be inferred that although influenced by the consumerist culture, the
respondents are very often managing their time and money to cater to their
domestic and personal needs through weekly outings which needs to be
interpreted as a sign of empowerment.
6.2.4 Access or ownership of social status symbols
When the social affluence of the respondents with regard to material possessions
and life style was analysed, it was found that the respondents owned, accessed or
used a range of amenities and facilities with their family members which can be
perceived as social status symbols as discussed under Table-5.3.5. A majority of
121 respondents (40.3 percent) owned, used or accessed all such social status
symbols such as luxury cars, air conditioner, mobile phone costing more than
Rs.5000, laptop, microwave oven, branded products and star hotels.

132
As stated by Mukherjee (2008) in her study, the researcher finds that peer
pressure also acts as a factor in the consumption practices of software
professionals and contributes towards setting these ‘knowledge professionals’
apart from the larger society, despite the differences among them. It has created
some kind of complex in the society; for those who are part of the crowd are
okay, and those who are not feel envious -as the professionals of the sector are
pretty affluent. Analysis of their lifestyle and material possessions in relation to
socio-economic factors shall bring light into the factors that act as determinants of
the same.
Table-6.2.4a
Access/ownership of social status symbols and socio-economic factors
Socio economic factor Maximum access/ownership
of social status symbols Percentage of respondents
Age 30 to 35 years 62
Religion Hindu 48
Marital status Married 65
Type of family Nuclear 62
Income Rs 50000/-to Rs 1,00,000/- 55
Occupational designation Senior IT Professional.
Technical Level-1
47.1

133
According to the table, majority of the respondents who have access or ownership
of all the above mentioned possessions are those belonging to the age group
between 30 to 35 years (62 percent). Majority of the respondents are married (65
percent) and hail from nuclear families (62 percent). Absence of elder generation
in the family who may criticize a metropolitan posh life style and consumerist
culture also seems agreeable to the situation. Religion wise analysis showed that it
was the Hindu respondents who had maximum access/ownership of amenities
with high social status. When income level of the respondents was analysed, it
was found that maximum access to high life style and maximum access/
ownership of material possessions was enjoyed by the group which earned a
monthly income between Rs 50,000/- to Rs 1,00,000/- (55 percent). Analysis of
occupational designation, pointing towards Senior IT Professional Technical
Level-1 (47.1 percent) also indicates the same finding as they are the group who
earns between the above mentioned salary range. Leading a generous and
extravagant life style of course demands high income which the IT professionals
acquire after gaining a job experience and service above 5 years. The
occupational designation, income level and age group of the respondents who
have access or ownership of all the above mentioned possessions which can be
termed as social status symbols are attained in the later stage of life and the piece
of evidence gained from the above mentioned data corroborates to the finding.

134
Testing of Hypothesis 1: Empowerment of women in IT industry is largely
associated with their socio economic conditions.
Table-6.2.5
Positive Association of Empowerment indicators in socio-cultural sphere
with socio- economic factors.
Empowerment indicators Socio-economic factors P value
Visit to places of worship Type of Family 0.000
Religion 0.000
Outings with family
Type of family 0.000
Marital status 0.000
Income 0.020
Access or ownership of social status symbols
Type of family 0.003
Marital status 0.000
Age 0.000
Income 0.000
Occupational Designation 0.013
The positive association between the above mentioned empowerment indicators
and socio-economic factors is statistically proven by administering the chi square
tests and the p values obtained for the same are less than 0.05. Hence the
hypothesis that the empowerment of women IT professionals is largely associated
with their socio economic conditions is accepted with respect to the socio-cultural
sphere.

135
Empowerment with respect to participation in family functions has no significant
association with any of the socio-economic factors. Thus, the above said
hypothesis is accepted with respect to visit to places of worship, outings with
family and access or ownership of social status symbols while it is rejected with
respect to participation in family functions. The relationships found here are
relevant to the population.
6.3 Economic Sphere
6.3.1 Autonomy in decision making regarding economic transactions,
savings and investments.
Table-6.3.1a
Distribution of respondents based on decision making in economic transactions.
Response Frequency Percent
Yes 243 81.3
No 56 18.7
Total 300 100
According to the report put forward by International Finance Corporation (2006),
women’s equal access to and control over economic and financial resources is
critical for the achievement of gender equality and empowerment of women and
for equitable and sustainable economic growth and development. Gender equality
in the distribution of economic and financial resources has positive multiplier
effects for a range of key development goals, including poverty reduction and the
welfare of children.

136
When the role played by respondents in their economic transactions was analysed,
it was found that an exceptionally high majority of 81.3 percent of the
respondents were decision makers with respect to spending and saving their
earnings while only 18.7 percent were not exercising their role as decision
makers in the context. An outstandingly high majority of 91.7 percent of
respondents were contributing their income towards family expenses. Among
them, 12.7 percent were deciding on family expenses individually while 83
percent of the unmarried respondents were taking decisions on family expenses
with parents and 66 percent of the married respondents with their husbands.
Taking decisions on family expenses with parents or husband cannot be termed as
an indicator of disempowerment but it should be perceived as the symbol of
egalitarian relations which they share with their family members while playing
active role in decision making within the household.
Table-6.3.1b
Decision making in economic transactions and relation to socio-economic factors
Socio economic factor
Decision makers in economic transactions(majority group)
Percentage of respondents
Age Above 35 years 100
Religion Hindu 83
Marital status Unmarried 86
Type of family Joint 91
Income Rs 50,000/- to Rs 1,00,000/- 64.4
Occupational designation
Senior IT Professional Technical and Managerial-Level 2
100

137
The above table shows that in spending and saving the income, respondents above
35 years are astonishingly empowered as 100 percent of them exercise their role
as decision makers in this regard. Income wise analysis of the respondents
discloses that an exceptionally high majority of 93 percent of the respondents
who earn between Rs 50,000/- to Rs 1,00,000/- are decision makers in spending
and saving the income which they earn. Analysis of the occupational designation
also points to the same group as 100 percent of the senior IT professionals under
Technical and Managerial-Level 2 are exercising their role in economic decision
making within the household.
Strikingly, a high majority of 86 percent of the unmarried respondents act as
decision makers in managing their earnings. It should be understood that with
respect to decision making within the household, women are less dominated by
their fathers than their husbands. Analysis of the type of family has put forward
noticeble information as an exceptionally high majority of 91.1 percent of
respondents hailing from joint families is acting as decision makers in spending
and saving their income. Exercising autonomy in economic decision making
despite the presence of elder members in the family who may hold a patriarchal
outlook should be considered as a strong indicator of empowerment. When
religion of the respondents was examined in this regard, it was found that Hindus
are the majority group (83 percent).
Thus it needs to be inferred that respondents above 35 years, with greater job
experience, holding senior job designations, earning higher income between Rs
50,000/- to Rs 1,00,000/- are the most empowered group as far as economic

138
decision making in the domestic sphere is concerned although married status
stands contrary to such a finding.
6.3.2 Access and control over investments.
According to the report put forward by International finance corporation (2006),
women’s access to all financial services, including savings, insurance, remittance
transfers and credit, is essential to allow them to benefit fully from economic
opportunities. Legal, institutional and socio-cultural barriers often, however, limit
women’s access to these services.
Table- 6.3.2a
Distribution of respondents based on access and control over investments.
Access and control over investments Frequency Percent
To a good extent 208 69.3
To some extent 88 29.3
Not at all 4 1.3
Total 300 100.0
When access and control of the respondents over their investments was analysed,
it was found that a sizeable majority of 69.3 percent were exercising access and
control to a good extent. For 29.3 percent of the respondents, access and control
over the investments was only to some extent while a feeble 1.3 percent of the
respondents exercised no control at all. A sizeable majority of 74.3 percent
responded that they make investments in their name in view of their better future,
mostly in the form of gold, land, vehicle, policies, shares etc. Parents, husband,
139
colleagues, media, concerned professionals etc were the different sources from
which they took advice regarding investment decisions. While unmarried
respondents depended mainly on parents for expert opinion, married respondents
collected information from different sources apart from seeking advice of their
husband. Analysis in relation to socio- economic factors shall prove helpful in
identifying the determinants concerning the same.
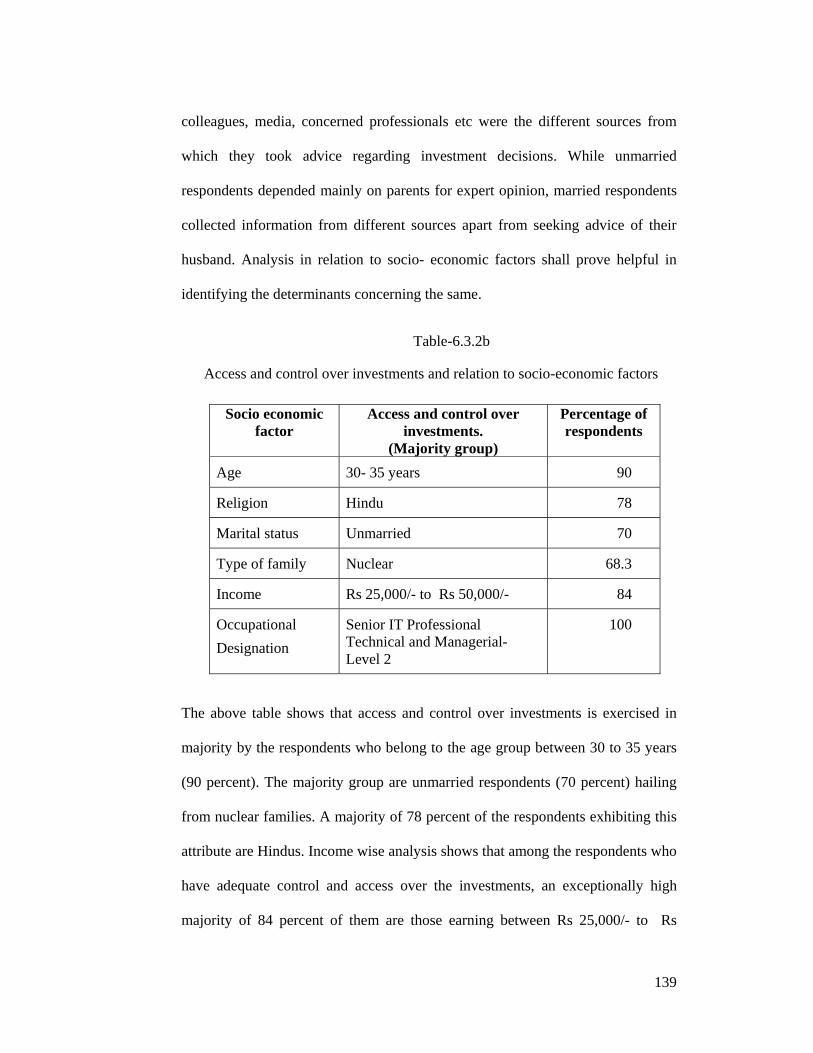
Table-6.3.2b
Access and control over investments and relation to socio-economic factors
Socio economic factor
Access and control over investments.
(Majority group)
Percentage of respondents
Age 30- 35 years 90
Religion Hindu 78
Marital status Unmarried 70
Type of family Nuclear 68.3
Income Rs 25,000/- to Rs 50,000/- 84
Occupational Designation
Senior IT Professional Technical and Managerial-Level 2
100
The above table shows that access and control over investments is exercised in
majority by the respondents who belong to the age group between 30 to 35 years
(90 percent). The majority group are unmarried respondents (70 percent) hailing
from nuclear families. A majority of 78 percent of the respondents exhibiting this
attribute are Hindus. Income wise analysis shows that among the respondents who
have adequate control and access over the investments, an exceptionally high
majority of 84 percent of them are those earning between Rs 25,000/- to Rs

140
50,000/-. Similar to what have been seen in the analysis of occupational
designation with respect to decision making in spending and investment, it is
astonishing to note that 100 percent of the senior IT professionals in Technical
and Managerial-Level 2 are exercising access and control over their investments.
Thus from the study, it can be inferred that with higher age, greater income and
senior occupational designations, women IT professionals have greater
empowerment as far as exercising access and control over their investments is
concerned. In the face of such a finding , married status seems to be an
impediment in this regard.
Testing of Hypothesis 1: Empowerment of women in IT industry is largely
associated with their socio economic conditions.
Table: 6.3.3
Positive association of empowerment indicator in economic sphere
with socio- economic factors.
Empowerment indicator Socio-economic factors P value
Autonomy in decision making regarding economic transactions, savings and investments.
Marital status 0.000
Income 0.000
The positive association between the above mentioned empowerment indicator
and socio-economic factors is statistically proven by administering the chi square
tests and the p values obtained for the same are less than 0.05. Hence the
hypothesis that the empowerment of women IT professionals is largely associated

141
with their socio economic conditions is accepted with respect to the economic
sphere.
Empowerment with respect to access and control over investments has no
significant association with any of the socio-economic factors. Thus, the above
said hypothesis is accepted with respect to autonomy in decision making
regarding economic transactions, savings and investments while it is rejected with
respect to access and control over investments. The relationships found here are
relevant to the population.
6.4 Familial/Interpersonal sphere
6.4.1 Freedom from authority and domination of same generational males.
Table-6.4.1a
Distribution of the respondents based experience of male domination in family
The respondents were asked if they experienced authority and domination of same
generational males in family such as husband over wife, brother over sister etc.
The analysis revealed that a sizeable majority of 68 percent do not experience
such domination from their male family members belonging to the same
generation. Authority and domination exercised by father or grandfather in the
family is a result of the power exercised by the elder head of the family as per the
Response Frequency Percent
Yes 95 31.7
No 204 68.0
Total 300 100.0

142
patrifocal norms. Over the years in their upbringing in a patriarchal family
structure, women will be habitualised towards conforming to such an authority
structure in the family. This authority is also extended to and exercised by other
males in the family who hold positions such as husband, brother etc which
reflects male dominance over women. Hence if a substantial majority of
respondents are able to withstand and overcome the authority and domination of
same generational males in their family, it should indeed be recognized as a
positive sign of empowerment.
Table-6.4.1b
Freedom from male dominance and relation to socio-economic factors
Socio economic factor
Freedom from male dominance (majority group)
Percentage of respondents
Age 20 to 25 years 62
Religion Christian 70
Marital status Unmarried 72
Type of family Nuclear 50
Income Rs 10,000/- to Rs 25000/- 64.4
The above table discloses that respondents belonging to the age group between 20
to 25 years are the majority group enjoying freedom from same generational male
dominance within the family. A sizeable majority of 71.4 percent of them hails
from nuclear families and is also unmarried (72 percent). Here it should be
inferred that respondents hailing from nuclear families are brought up in
egalitarian status with their male siblings. Absence of old generational male
members in nuclear family is also favourable for such an attitude in the family.
Income wise analysis also points to the same group as respondents earning a

143
monthly income between Rs 10,000/- to Rs 25000/- are the majority group (68
percent) enjoying freedom from such dominance. Religion wise analysis show
that Christian respondents are the majority group (70 percent) enjoying freedom
in this regard though closely followed by 69 percent of Hindu respondents.
Thus it needs to be inferred that unmarried status and nuclear families are the
most congenial factors for promoting freedom against dominance from same
generational males in the family. The finding also gives a subtle message about
the domination suffered by married respondents from their husbands.
6.4.2 Absence of interference from family regarding job decisions.
Table- 6.4.2a Distribution of respondents based on interference in job decisions
According to the table, a significant majority of 74 percent of respondents do not
have any interference or control from their family members in decisions regarding
their job such as changing company, salary negotiation, mode of mobility etc.
Only an apparent 26.3 percent of respondents face problems in this regard. As
explained under Table-6.1.4a, it should be noted that despite the absence of
control and interference from family members, majority of the respondents (76.7
percent) also play an active role in decision making within the family.
Response Frequency Percent
Yes 79 26
No 221 74
Total 300 100.0

144
Table-6.4.2b
Absence of family interference in job decisions and socio-economic factors
Socio economic factor
Freedom from family interference in job decisions (majority group)
Percentage of respondents
Age 25 to 30 years 75
Religion Christian 74
Marital status Married 76
Type of family Nuclear 76
Income Rs 25,000/- to Rs 50,000/- 77
The above table conveys that a significant majority of 75percent of respondents
belonging to the age group between 25 to 30 years are enjoying freedom from
family interference regarding their job decisions. When the marital status was
analysed, it was found that majority of 76 percent, are married respondents. With
marriage women are considered as grown up individuals capable of taking
decisions concerning them and hence they have less interference from their family
members. Income wise analysis of the majority group also corroborates with
findings related to age group and marital status as respondents earning a monthly
income between Rs 25,000/- to Rs 50,000/- are the most empowered group with
respect to the context. Among them a sizeable majority of 74 percent are
Christians. When type of family of the majority group was analysed, it was
established that a majority of 76 percent of the respondents who are free from
family interference in job decisions hail from nuclear families.
145
Thus it can be inferred that married women between the age group 25 to 30
years, hailing from nuclear families are the group who are free from family
interference regarding their job decisions.
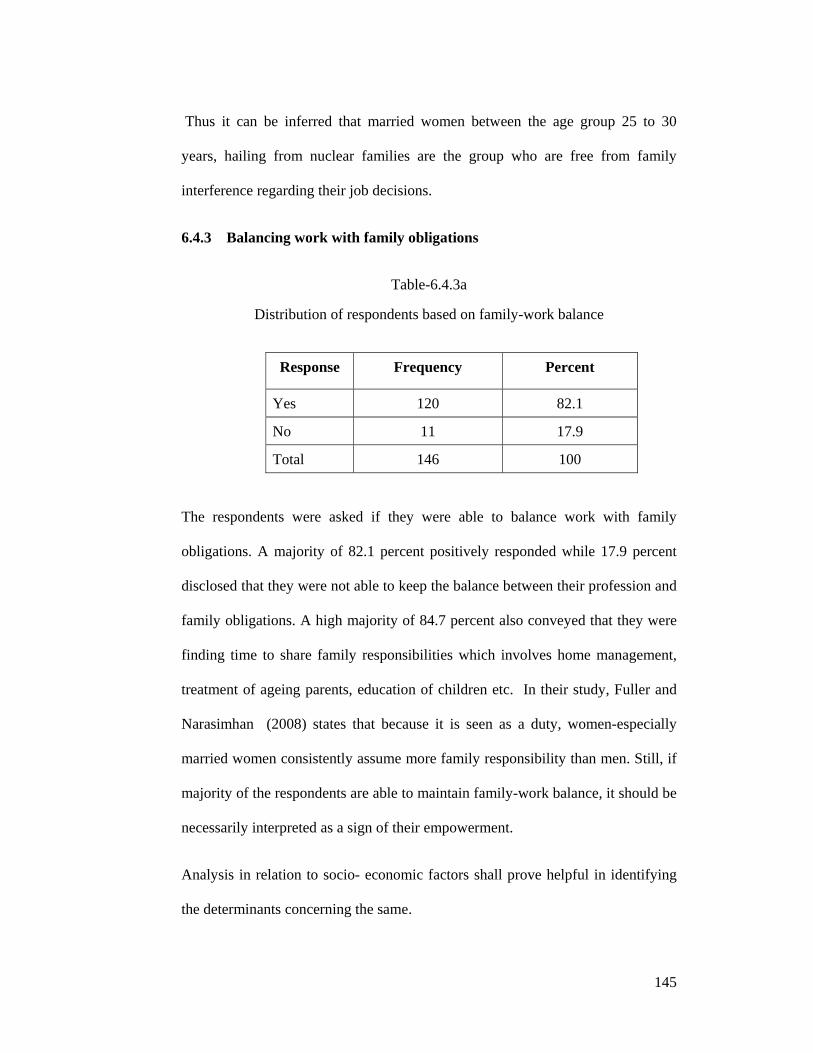
6.4.3 Balancing work with family obligations
Table-6.4.3a
Distribution of respondents based on family-work balance
Response Frequency Percent
Yes 120 82.1
No 11 17.9
Total 146 100 The respondents were asked if they were able to balance work with family
obligations. A majority of 82.1 percent positively responded while 17.9 percent
disclosed that they were not able to keep the balance between their profession and
family obligations. A high majority of 84.7 percent also conveyed that they were
finding time to share family responsibilities which involves home management,
treatment of ageing parents, education of children etc. In their study, Fuller and
Narasimhan (2008) states that because it is seen as a duty, women-especially
married women consistently assume more family responsibility than men. Still, if
majority of the respondents are able to maintain family-work balance, it should be
necessarily interpreted as a sign of their empowerment.
Analysis in relation to socio- economic factors shall prove helpful in identifying
the determinants concerning the same.
146
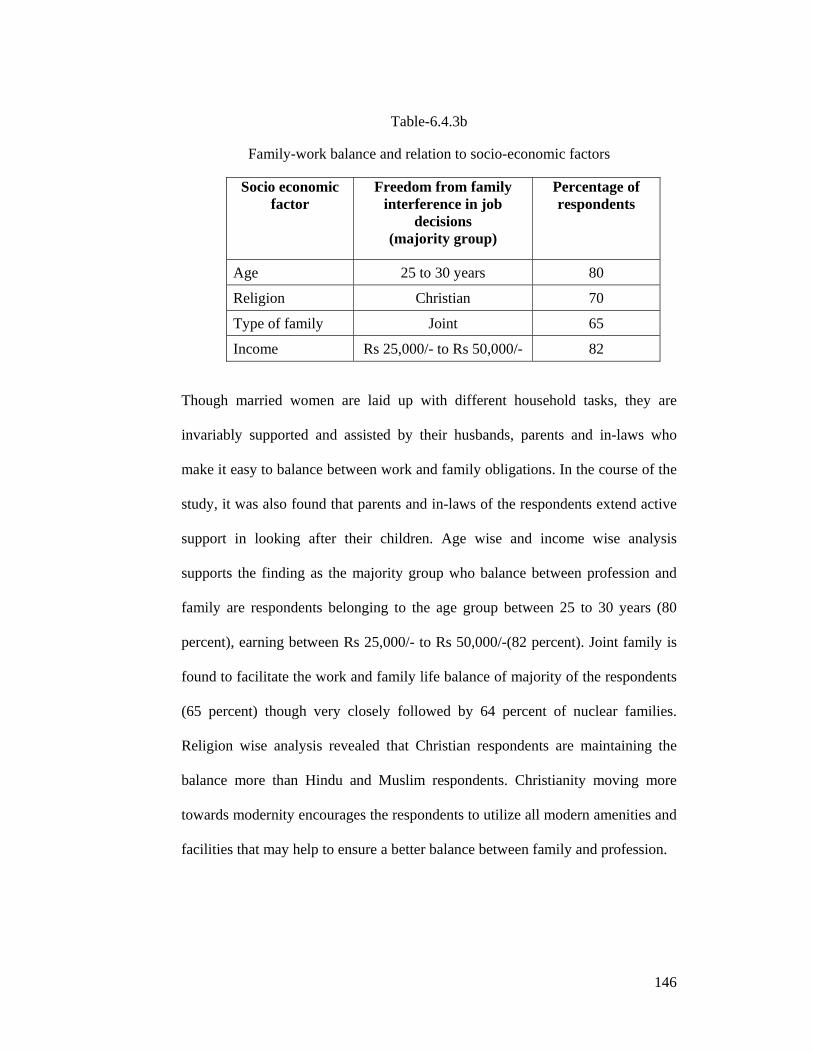
Table-6.4.3b
Family-work balance and relation to socio-economic factors
Socio economic factor
Freedom from family interference in job
decisions (majority group)
Percentage of respondents
Age 25 to 30 years 80
Religion Christian 70
Type of family Joint 65
Income Rs 25,000/- to Rs 50,000/- 82
Though married women are laid up with different household tasks, they are
invariably supported and assisted by their husbands, parents and in-laws who
make it easy to balance between work and family obligations. In the course of the
study, it was also found that parents and in-laws of the respondents extend active
support in looking after their children. Age wise and income wise analysis
supports the finding as the majority group who balance between profession and
family are respondents belonging to the age group between 25 to 30 years (80
percent), earning between Rs 25,000/- to Rs 50,000/-(82 percent). Joint family is
found to facilitate the work and family life balance of majority of the respondents
(65 percent) though very closely followed by 64 percent of nuclear families.
Religion wise analysis revealed that Christian respondents are maintaining the
balance more than Hindu and Muslim respondents. Christianity moving more
towards modernity encourages the respondents to utilize all modern amenities and
facilities that may help to ensure a better balance between family and profession.

147
Thus it can be inferred that Christian married women are more empowered as far
as balance between work and family obligations are concerned.
Testing of Hypothesis 1: Empowerment of women in IT industry is largely
associated with their socio economic conditions.
Table-6.4.4
Positive association of empowerment indicators in familial/inter personal
sphere with socio- economic factors.
Empowerment indicator Socio-economic factors P value
Balancing work with family obligations
Type of family 0.008
Marital status 0.000
Age 0.000
Income 0.000
Designation 0.019
The positive association between the above mentioned empowerment indicator
and socio-economic factors is statistically proven by administering the chi square
tests and the p values obtained for the same are less than 0.05. Hence the
hypothesis that the empowerment of women IT professionals is largely associated
with their socio economic conditions is accepted with respect to the familial/Inter
personal sphere.
Empowerment with respect to freedom from authority and domination of same
generational males and absence of interference from family regarding job
decisions has no significant association with any of the socio-economic factors.
Thus, the above said hypothesis is accepted with respect to balancing work with

148
family obligations while it is rejected with respect to freedom from authority and
domination of same generational males and absence of interference from family
regarding job decisions. The relationships found here are relevant to the
population.
6.5 Professional sphere
Professional competency:
6.5.1 Technical Knowledge.
As discussed under table-5.1.5 with regard to the educational qualification of the
respondents, a comparatively high majority of them (38 percent) are B Tech
holders. Among them, 5 percent of the respondents have the degree of M Tech.
BCA holders are 9.6 percent while MCA holders are 18.3 percent. Thus it should
be interpreted that an accumulated 70.9 percent of them are professionally
empowered in terms of their technical knowledge. Rest of the respondents are
graduates and postgraduates in other disciplines employed as IT Professionals
with necessary technical knowledge in computer application but are
comparatively less empowered with respect to technical knowledge.
6.5.2 Adequate payment
With regard to career, the respondents were asked if they felt that they were
adequately paid by the company. A not so commendable majority of 52 percent
positively responded, while 44.7 percent didn’t have the feel that they were
adequately paid. Respondents who came up to 3.3 percent were reluctant to
149
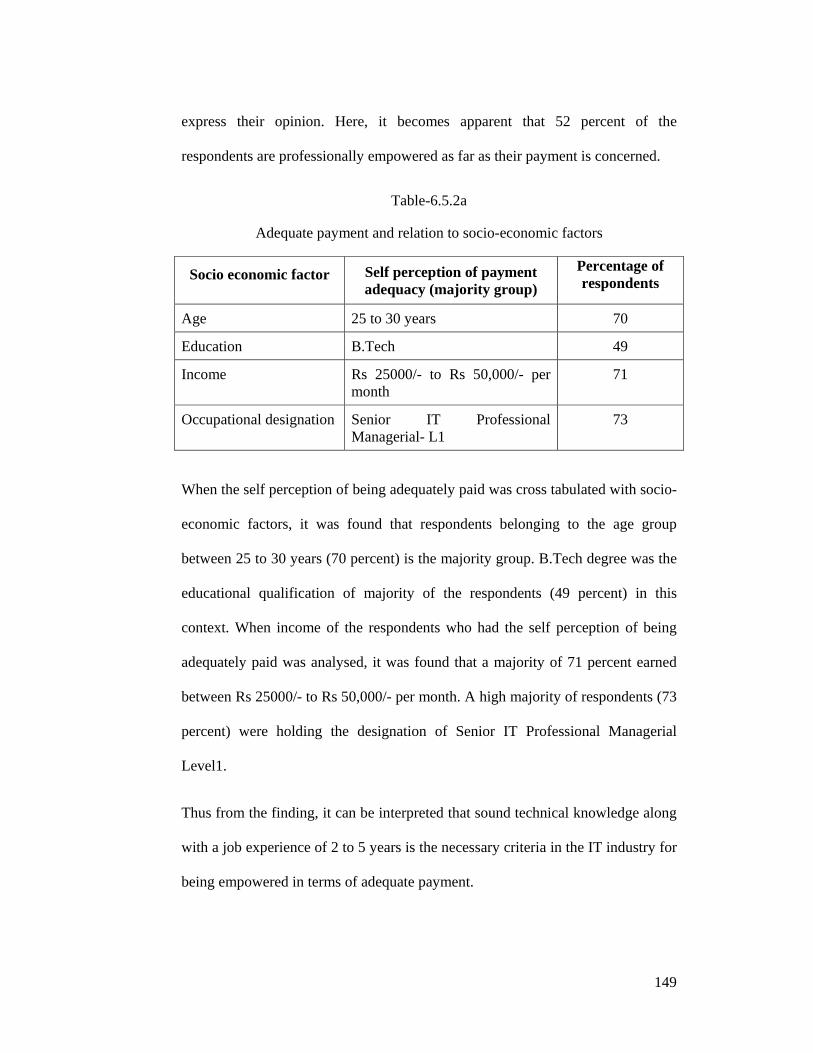
express their opinion. Here, it becomes apparent that 52 percent of the
respondents are professionally empowered as far as their payment is concerned.
Table-6.5.2a
Adequate payment and relation to socio-economic factors
Socio economic factor Self perception of payment adequacy (majority group)
Percentage of respondents
Age 25 to 30 years 70
Education B.Tech 49
Income Rs 25000/- to Rs 50,000/- per month
71
Occupational designation Senior IT Professional Managerial- L1
73
When the self perception of being adequately paid was cross tabulated with socio-
economic factors, it was found that respondents belonging to the age group
between 25 to 30 years (70 percent) is the majority group. B.Tech degree was the
educational qualification of majority of the respondents (49 percent) in this
context. When income of the respondents who had the self perception of being
adequately paid was analysed, it was found that a majority of 71 percent earned
between Rs 25000/- to Rs 50,000/- per month. A high majority of respondents (73
percent) were holding the designation of Senior IT Professional Managerial
Level1.
Thus from the finding, it can be interpreted that sound technical knowledge along
with a job experience of 2 to 5 years is the necessary criteria in the IT industry for
being empowered in terms of adequate payment.

150
6.5.3 Autonomy in work
When they were enquired about the nature of their work pattern, a majority of 53
percent responded that they were having the required autonomy in their work
while 37.7 percent disclosed that they were having autonomy in work only to
some extent. Another 3.3 percent also responded that they were not having
autonomy at all as far as work is concerned. Hence it needs to be interpreted that
53 percent of the respondents are professionally empowered in relation to the
required autonomy in work.
Table-6.5.3a
Autonomy in work and relation to socio-economic factors
Socio economic factor Autonomy in work (majority group)
Percentage of respondents
Age 25 to 30 years 70
Education B.Tech 49
Income Rs 25000/- to Rs 50,000/- per month
64
Occupational designation
Senior IT Professional Managerial L1
73
Analysis of autonomy in work experienced by the majority respondents seem very
similar to the findings brought to light, as a result of the analysis of their self
perception regarding payment adequacy when related with socio economic factors
such as their age, income, educational qualification and occupational designation.
Majority of the respondents who enjoy adequate autonomy in their work, belong

151
to the age group between 25 to 30 years (70 percent) and are qualified with
B.Tech degree (49 percent).
As a result of their job experience ranging from 2 to 5 years, they earn a good
income between Rs 25000/- to Rs 50,000/- per month (64 percent). Majority of
the respondents who have autonomy in their work are senior IT professionals at
Managerial Level-1(73 percent).
Here it needs to be interpreted that when necessary technical knowledge provided
by the professional degree in engineering is combined with accountable job
experience, the respondents are equipped to be empowered professionally with
respect to autonomy in work.
6.5.4 Working under pressure and meeting targets on time
Table-6.5.4a
Distribution of respondents based on work pressure and target achievement
Response Frequency Percent
Always 85 28
Often 108 36
Sometimes 93 31
Seldom 7 1.9
Never 7 2.7
Total 300 100.0
The respondents were asked if they were able to work under pressure and meet
their targets on time. While a majority of 36 percent responded that were often

152
able to work under pressure, respondents who came up to 28 percent were always
able to meet their targets working under pressure. Thus an accumulated 64
percent of the respondents should be considered as empowered in this respect.
Rest of the respondents should be considered as comparatively less professionally
empowered as they are able to work under pressure and meet their targets on time
only sometimes, seldom or even never.
Apart from this, as stated by Ramesh (2008) in his study, the researcher also
found that the team leaders undertake regular ‘target meetings’ in which the team
members are repeatedly reminded about the importance of meeting targets.
Targets are set on individual as well as team basis and are linked to career
prospects and perks such as promotions, increments, gifts, group parties, picnics
and so on. These strategies seem to generate peer pressure as well as individual
incentives to attain higher levels of productivity.
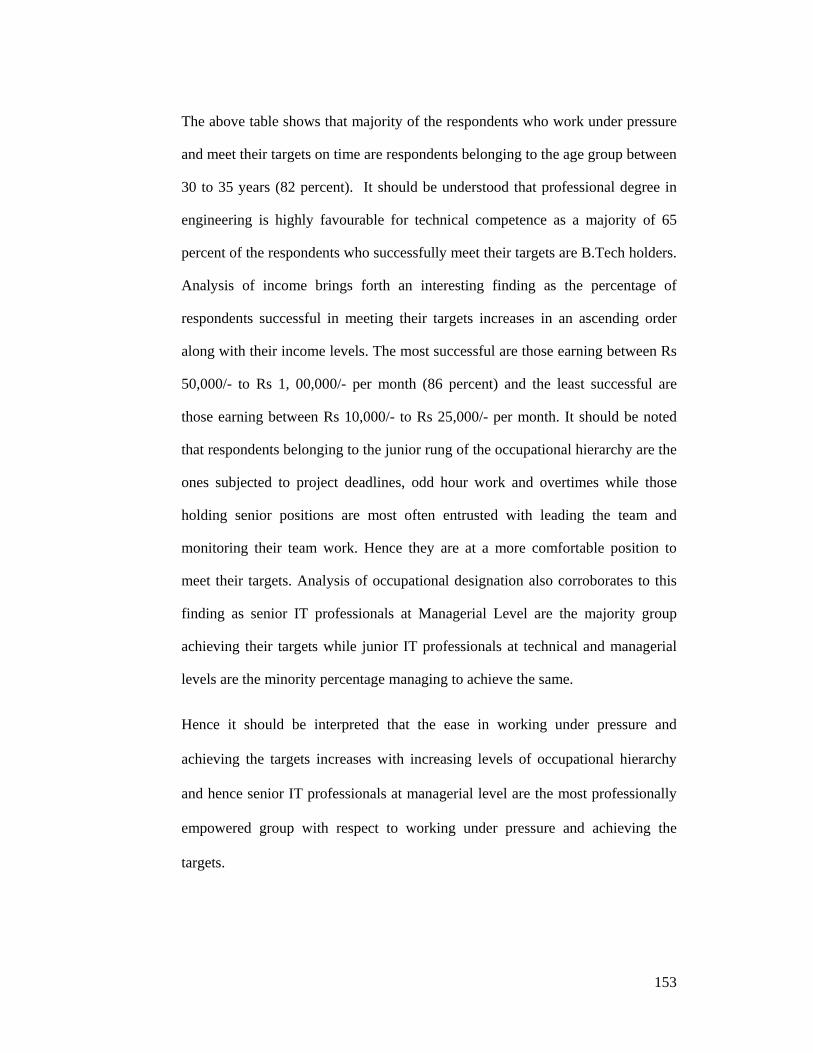
Table-6.5.4b
Work pressure and relation to socio-economic factors
Socio economic factor Working under pressure and meeting targets
(majority group)
Percentage of respondents
Age 30 to 35 years 82
Education B.Tech 65
Income Rs 50,000/- to Rs 1,00,000/- per month
64
Occupational designation Senior IT Professional Managerial L1
73
153
The above table shows that majority of the respondents who work under pressure
and meet their targets on time are respondents belonging to the age group between
30 to 35 years (82 percent). It should be understood that professional degree in
engineering is highly favourable for technical competence as a majority of 65
percent of the respondents who successfully meet their targets are B.Tech holders.
Analysis of income brings forth an interesting finding as the percentage of
respondents successful in meeting their targets increases in an ascending order
along with their income levels. The most successful are those earning between Rs
50,000/- to Rs 1, 00,000/- per month (86 percent) and the least successful are
those earning between Rs 10,000/- to Rs 25,000/- per month. It should be noted
that respondents belonging to the junior rung of the occupational hierarchy are the
ones subjected to project deadlines, odd hour work and overtimes while those
holding senior positions are most often entrusted with leading the team and
monitoring their team work. Hence they are at a more comfortable position to
meet their targets. Analysis of occupational designation also corroborates to this
finding as senior IT professionals at Managerial Level are the majority group
achieving their targets while junior IT professionals at technical and managerial
levels are the minority percentage managing to achieve the same.
Hence it should be interpreted that the ease in working under pressure and
achieving the targets increases with increasing levels of occupational hierarchy
and hence senior IT professionals at managerial level are the most professionally
empowered group with respect to working under pressure and achieving the
targets.

154
6.5.5 Working flexibly with respect to time and multi tasking
Table-6.5.5a Distribution of respondents based on flexibility in work
Respondents who are able to work flexibly always and often should be considered
as professionally competent to work flexibly, with respect to time and multi
tasking. In such a case, an accumulated 57.3 percent should be perceived as
professionally competent. Respondents who have disclosed that working flexibly
is possible only sometimes (36.7 percent) should be perceived as partially
competent. Among the respondents, 6 percent should be considered as not
professionally competent as they work flexibly, seldom or never.
When the possibility of working flexibly with respect to space (at home) was
enquired, many of the married respondents didn’t find it as a good idea. As stated
by Anderson and Shrum (2006), household burden of married women is much
more extensive and since female professional earnings are seen as an asset rather
than a necessity, many women feel conflicted about engaging in professional
labour while physically located in their residence. Analysis of the ability of the
Flexibility experienced Frequency Percent
Always 79 26.3
Often 93 31.0
Sometimes 110 36.7
Seldom 6 2.0
Never 12 4.0
Total 300 100.0

155
respondents to work flexibly in relation to relevant socio-economic factors shall
explain more about their professional competency.
Table-6.5.5b
Flexibility in work and relation to socio-economic factors
Socio economic factor Flexibility in work (majority group)
Percentage of respondents
Age 25 to 30 years 68
Education B.Tech 60.7
Income Rs 25,000/- to Rs 50,000/- per month
69
Occupational designation Senior IT Professional Managerial Level 1
73
When work flexibility of respondents with respect to time and multitasking was
analysed, it was found that 68 percent of the respondents belonging to the age
group between 25 to 30 years with B.Tech degree is the majority group being able
to work flexibly. Income wise analysis shows that respondents earning between
Rs 25,000/- to Rs 50,000/- per month is the group which is able to maintain
flexibility on the basis of time and multi tasking (69 percent). When the
respondents was analysed in the context, with respect to their occupational
designation, it was found that among senior IT professionals at managerial level,
a high majority of 73 percent was working flexibly. It should be noted that
respondents belonging to the junior rung of the occupational hierarchy are the
ones subjected to project deadlines, odd hour work and overtimes while those
holding senior positions are most often entrusted with leading the team, assigning
them with project responsibilities and monitoring their team work. Hence they

156
have flexible work timings and are at a comfortable position to take up
multitasking.
Hence it can be inferred that senior IT professionals at managerial level are the
most empowered group with respect to flexible work timings and multi tasking.
6.5.6 Stress Induced by Work Practices
Table-6.5.6a
Distribution of respondents based on job stress experienced
Response Frequency Percent Always 42 14
Sometimes 165 55.3 Never 90 30.3 Total 300 100.0
Regarding the stress induced by work practices, a majority of 55.3 percent felt
that sometimes, the work practices of the industry are stressful while 14 percent
of them found the work practices as always stressful. To quote the words of a
respondent: ‘The Industry has taught me to be professional, to be productive to
the maximum, but I don’t know how long I can work like this’. Only 30.3 percent
of the respondents remarked that they do not experience work stress, and hence
only they can be termed as professionally empowered as far as work stress is
concerned. Still, what is found by Ramesh ( 2008: 248) from his study, makes
relevance in this context-‘Though aware of the hidden stress and strain with this
system, many of the respondents expressed satisfaction with it because it assured
some increase in salaries, based on their performance’
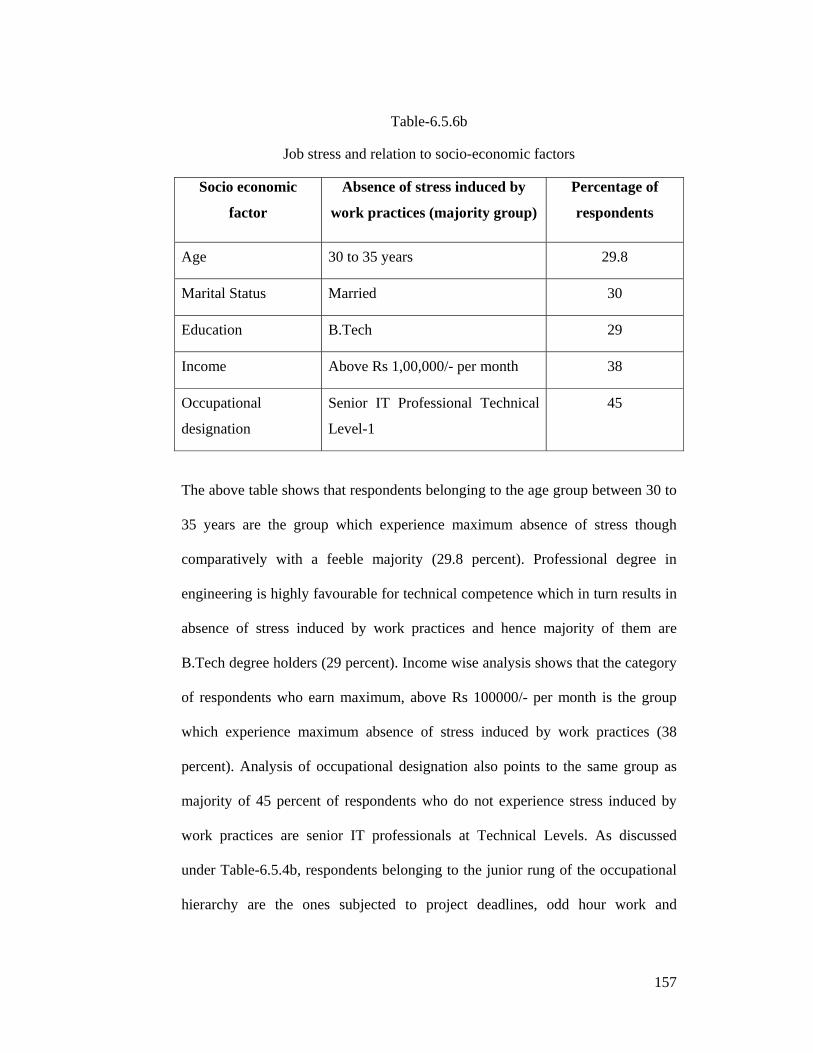
157
Table-6.5.6b
Job stress and relation to socio-economic factors
Socio economic
factor
Absence of stress induced by
work practices (majority group)
Percentage of
respondents
Age 30 to 35 years 29.8
Marital Status Married 30
Education B.Tech 29
Income Above Rs 1,00,000/- per month 38
Occupational
designation
Senior IT Professional Technical
Level-1
45
The above table shows that respondents belonging to the age group between 30 to
35 years are the group which experience maximum absence of stress though
comparatively with a feeble majority (29.8 percent). Professional degree in
engineering is highly favourable for technical competence which in turn results in
absence of stress induced by work practices and hence majority of them are
B.Tech degree holders (29 percent). Income wise analysis shows that the category
of respondents who earn maximum, above Rs 100000/- per month is the group
which experience maximum absence of stress induced by work practices (38
percent). Analysis of occupational designation also points to the same group as
majority of 45 percent of respondents who do not experience stress induced by
work practices are senior IT professionals at Technical Levels. As discussed
under Table-6.5.4b, respondents belonging to the junior rung of the occupational
hierarchy are the ones subjected to project deadlines, odd hour work and

158
overtimes while those holding senior positions are most often entrusted with
leading the team and monitoring their team work. Hence stress induced by work
practices on senior professionals will be less.
Here it needs to be inferred that stress induced by work practices is invariably
associated with technical competence and years of job experience and hence
respondents holding senior positions in job hierarchy are the most professionally
empowered group as far as work stress is concerned.
6.5.7 Satisfactory health status related to nature of work in IT industry
Table.6.5.7a
Distribution of respondents based on health problems induced by work in IT
The above table shows that only 28.6 percent of the respondents are facing health
problems due to the nature of work in IT. Eye problems, ENT problems, gastro
intestinal problems, musculo skeletal problems and life style diseases are the main
health issues faced by them, which are discussed in detail under Table-5.4.4.
Here, it should be interpreted that this group of respondents are not adequately
empowered from the health aspect as these are health problems which arise due to
pathogenic stress induced by work in IT. A similar finding was reported by
Response Frequency Percent
Yes 86 28.6
No 191 63.7
Not revealing 23 7.7
Total 300 100.0
159
Ramesh as the respondents of his study exhibited ‘mental and physical ill health
such as nervousness, chronic fatigue, insomnia, nausea, anxiety, restlessness,
irritability and even depression. Some of them pointed out that working in shifts
even causes psycho neurotic disturbances such as depression. Respondents also
reported frequent occurrence of gastro intestinal problems, with digestive
problems such as constipation, peptic ulcer, indigestion, diarrhoea, excessive gas
formation, abdominal pain and heart burn. They also develop poor eating habits
as well as smoking, excessive drinking of coffee and so on, to cope with
psychological and physical stress (2008:225).
Health hazards brought about by the industry on the respondents are stress
induced, technology induced, induced by the work environment or a combination
of all these factors. Compulsion to work in an atmosphere not congenial for good
health and absence of freedom of choice to avoid job overstress needs to be
interpreted as signs of poor empowerment. A majority of 63.7 percent of the
respondents conveyed that they do not have health problems in this regard which
is a positive sign from the health aspect of empowerment. Among the
respondents, 7.7 percent was not ready to reveal their health condition and this is
surely due to the job insecurity they face from the industry.
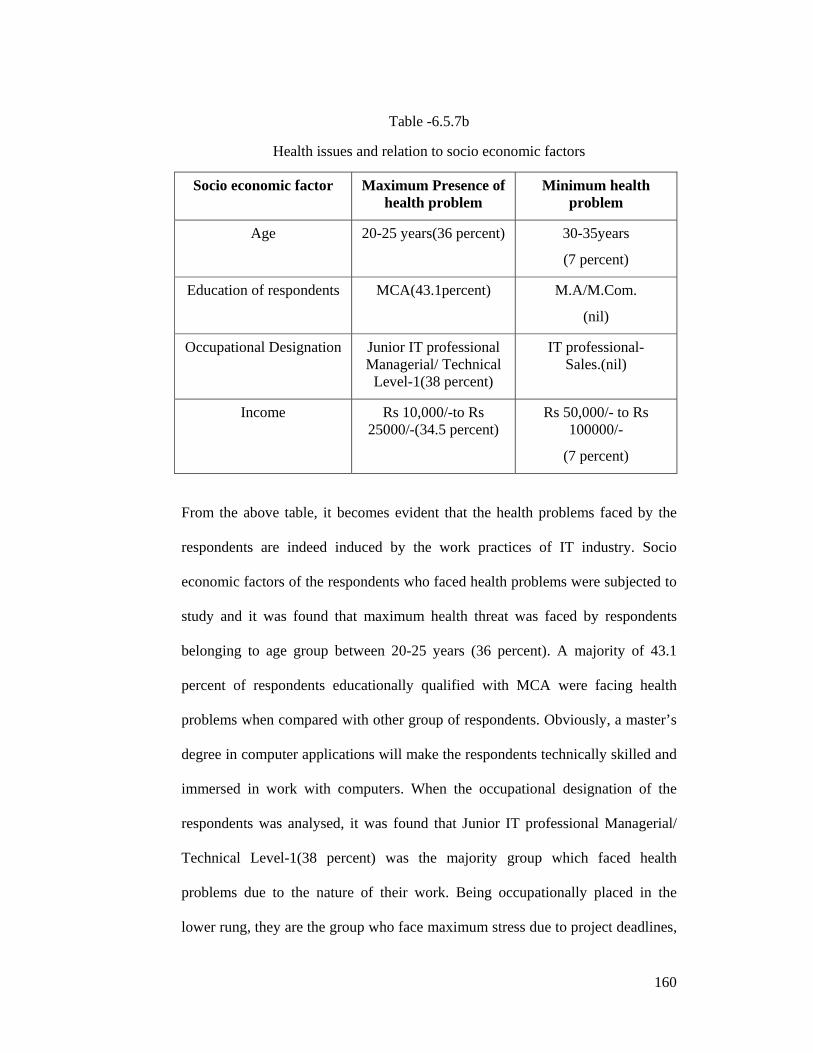
160
Table -6.5.7b
Health issues and relation to socio economic factors
Socio economic factor Maximum Presence of health problem
Minimum health problem
Age 20-25 years(36 percent)
30-35years
(7 percent)
Education of respondents MCA(43.1percent)
M.A/M.Com.
(nil)
Occupational Designation Junior IT professional Managerial/ Technical
Level-1(38 percent)
IT professional-Sales.(nil)
Income Rs 10,000/-to Rs 25000/-(34.5 percent)
Rs 50,000/- to Rs 100000/-
(7 percent)
From the above table, it becomes evident that the health problems faced by the
respondents are indeed induced by the work practices of IT industry. Socio
economic factors of the respondents who faced health problems were subjected to
study and it was found that maximum health threat was faced by respondents
belonging to age group between 20-25 years (36 percent). A majority of 43.1
percent of respondents educationally qualified with MCA were facing health
problems when compared with other group of respondents. Obviously, a master’s
degree in computer applications will make the respondents technically skilled and
immersed in work with computers. When the occupational designation of the
respondents was analysed, it was found that Junior IT professional Managerial/
Technical Level-1(38 percent) was the majority group which faced health
problems due to the nature of their work. Being occupationally placed in the
lower rung, they are the group who face maximum stress due to project deadlines,

161
odd hour work and job overstress. Income wise analysis also points to the same
group as respondents earning monthly income between Rs 10000/- to Rs 25000/-
are the majority group (34.5 percent) suffering from health problems.
In this context it also becomes relevant to identify the group which has least
health issues. Analysis in relation to socio-economic factors revealed that
respondents belonging to age group between 30 to 35 years are facing least threat
from health issues. An income wise analysis also pointed to the same group as
only a nominal 7 percent of the respondents earning a monthly income between
Rs 50,000 to 1,00000/- are having health problems. Obviously, being senior IT
professionals, they have flexible job timings, required autonomy in work and
comparatively less job pressure with respect to target achieving and multi tasking
as they will be vested with the job of assigning work to juniors, appraising their
progress and leading the team. It was also found that IT professionals dealing
with sales and those with educational qualification of MA/M.com are not having
any health problems and this attributes to their comparatively less involvement in
technical jobs.
Thus it can be inferred that Junior IT professional Managerial/ Technical Level-1
earning monthly income between Rs 10000/- to Rs 25000/- are most susceptible
to health problems while professionals who are less technically involved have
least threat to their health.
6.5.8 Tackling sexual harassment at work place
‘Sexual harassment is harassment or unwelcome attention of a sexual nature. It
includes a range of behavior from mild transgressions and annoyances to serious

162
abuses, which can even involve forced sexual activity’ (Boland 2002). Sexual
harassment is considered as a form of illegal discrimination, and is a form of
sexual and psychological abuse. Effects of sexual harassment can vary depending
on the individual, and the severity and duration of the harassment. ‘Often sexual
harassment incidents fall into the category of the “merely annoying”. However,
many situations can, and do, have life altering effects particularly when they
involve severe/chronic abuses, and/or retaliation against a victim who does not
submit to the harassment, or who complains about it openly’(Koss, 1987).
Table-6.5.8.a
Distribution of respondents based on experience of sexual harassment
From the above table it can be understood that a very high majority of 91 percent
of the respondents have not experienced sexual harassment from the professional
arena. But it needs to be noted that among the 300 respondents, 17 of them have
faced sexual harassment while 10 of them are not ready to reveal about the same.
Though the group is a minority, the issue needs to be addressed with utmost
importance and diligence. The respondents who underwent sexual harassment at
the work place were asked about the ways in which they tackled it. Among the 17
respondents, 4 of them warned personally, 15 of them informed the family in spite
Response Frequency Percent
Yes 17 5.7
No 273 91.0
Not Revealing 10 4.3
Total 300 100.0

163
of warning personally while 2 of them legally complained and 1 among them
reported to the higher concerned authorities. It needs to be appreciated that action
was taken by the respondents in one way or the other and that, none of the
respondents have silently suffered the torture. Indeed, this needs to be interpreted
as a strong indicator of their empowerment.
In 1997, the Supreme Court of India recognized sexual harassment at the
workplace as a violation of human rights and outlines a set of guidelines
(Guidelines on Sexual Harassment at the Workplace) for the prevention and
redress of complaints by women of sexual harassment at workplace. Despite
these guidelines, studies demonstrate that sexual harassment in the workplace is
serious and persistent. For example, the study entitled “Sexual harassment in the
Workplace” (2006) sponsored by the Population Council, Government of India
remarks that sexual harassment continues to trouble many working women.
Table-6.5.8b
Experience of sexual harassment and its relation to socio-economic factors
Socio economic factor Majority group with the experience of sexual
harassment
Percentage of respondents
Age 20 to 25 years 7.3
Marital Status Unmarried 5.26
Income Rs 25,000/- to Rs 50,000/- 11.1
Occupational designation Junior IT Professional Managerial/Technical
Level-2
7.9

164
The above table reveals that sexual harassment is experienced maximum by the
respondents falling under the age group between 20 to 25 years (7.3 percent). A
comparative analysis of the marital status shows that unmarried respondents are
more prone to sexual harassment as they come up to 5.26 percent while 4.89
percent of the married respondents experience the same. Obviously, eve teasers
are more comfortable to taunt unmarried women rather than married ones who
have a formal partner in their life to take care of their wellbeing. Analysis of
income and occupational designation also supports the above finding and points
to the same respondent group. Respondents earning a monthly income between
Rs 25,000/- to Rs 50,000/- is the majority group (11.1 percent) experiencing
sexual harassment and they are followed by those earning between Rs 10,000/- to
Rs 25,000/- per month (4.7 percent). Occupational designation of the majority
group is Junior IT professional Technical/ Managerial Level-2. In this context, it
also needs to be noted that a high majority of respondents who are not willing to
reveal their experience are unmarried ones earning between Rs 10,000/- to Rs
25,000/- per month and occupationally designated as Junior IT professional
Technical/ Managerial Level-1. Suspicion arises whether they have experienced
sexual harassment and that whether their lesser job experience and meager
standing in the industry forces them to maintain silence regarding the
same.Another finding that holds attention is that a very high majority of 75
percent of the respondents are ignorant about the formal provisions that exist in
their company to tackle such difficulties. Those who were aware, belonged to the
well established and celebrated companies which themselves make their
employees informed about the same.

165
Testing of Hypothesis 1: Empowerment of women in IT industry is largely
associated with their socio economic conditions.
Table-6.5.9
Positive association of empowerment indicators in professional sphere
with socio- economic factors.
Empowerment indicators Socio-economic factors P value
Adequate payment Education of respondents 0.029
Autonomy in Work
Education of respondents 0.020
Income 0.000
Working flexibly with respect to time and multi
tasking
Occupational Designation 0.037
Stress Induced by Work Practices
Education of respondents 0.000
Income 0.002
Satisfactory health status related to nature of work in
IT industry
Education of respondents
Income
0.000
0.000
Sexual harassment at work place
Age 0.000
Income 0.000
Occupational Designation 0.003
Marital Status 0.000
The positive association between the above mentioned empowerment indicators
and socio-economic factors is statistically proven by administering the chi square
tests and the p values obtained for the same are less than 0.05. Hence the
hypothesis that the empowerment of women IT professionals is largely associated
with their socio economic conditions is accepted with respect to the professional
sphere.

166
Empowerment with respect to working under pressure and meeting targets on
time has no significant association with any of the socio-economic factors. Thus,
the above said hypothesis is accepted with respect to adequate payment,
autonomy in work, working flexibly with respect to time and multi tasking, stress
induced by work practices, satisfactory health status related to nature of work in
IT industry and sexual harassment at work place while it is rejected with respect
to working under pressure and meeting targets on time. The relationships found
here are relevant to the population.
Thus the present chapter provides an overview about the empowerment
dimensions of Kerala women IT professionals employed at Technopark as well as
the positive association of empowerment indicators in different spheres with
socio- economic factors.