dinitrogen fixation in aphotic oxygenated marine … · rahav et al. marine aphotic oxygenic...
TRANSCRIPT
ORIGINAL RESEARCH ARTICLEpublished: 27 August 2013
doi: 10.3389/fmicb.2013.00227
Dinitrogen fixation in aphotic oxygenated marineenvironmentsEyal Rahav1,2, Edo Bar-Zeev1†, Sarah Ohayon1, Hila Elifantz1, Natalia Belkin1, Barak Herut2,Margaret R. Mulholland3 and Ilana Berman-Frank1*
1 Mina and Everard Goodman Faculty of Life Sciences, Bar-Ilan University, Ramat Gan, Israel2 Israel Oceanographic and Limnological Research, National Institute of Oceanography, Haifa, Israel3 Department of Ocean, Earth and Atmospheric Sciences, Old Dominion University, Norfolk, VA, USA
Edited by:
George S. Bullerjahn, Bowling GreenState University, USA
Reviewed by:
Michael R. Twiss, ClarksonUniversity, USARobinson W. Fulweiler, BostonUniversity, USA
*Correspondence:
Ilana Berman-Frank, Mina andEverard Goodman Faculty of LifeSciences, Bar-Ilan University,Ecology Building 201, Ramat Gan52900, Israele-mail: [email protected]†Present address:
Edo Bar-Zeev, Department ofChemical and EnvironmentalEngineering, Yale University,New Haven, CA, USA
We measured N2 fixation rates from oceanic zones that have traditionally been ignoredas sources of biological N2 fixation; the aphotic, fully oxygenated, nitrate (NO−
3 )-rich,waters of the oligotrophic Levantine Basin (LB) and the Gulf of Aqaba (GA). N2 fixationrates measured from pelagic aphotic waters to depths up to 720 m, during the mixedand stratified periods, ranged from 0.01 nmol N L−1 d−1 to 0.38 nmol N L−1 d−1.N2 fixation rates correlated significantly with bacterial productivity and heterotrophicdiazotrophs were identified from aphotic as well as photic depths. Dissolved free aminoacid amendments to whole water from the GA enhanced bacterial productivity by 2–3.5fold and N2 fixation rates by ∼2-fold in samples collected from aphotic depths while inamendments to water from photic depths bacterial productivity increased 2–6 fold whileN2 fixation rates increased by a factor of 2 to 4 illustrating that both BP and heterotrophicN2 fixation were carbon limited. Experimental manipulations of aphotic waters from the LBdemonstrated a significant positive correlation between transparent exopolymeric particle(TEP) concentrations and N2 fixation rates. This suggests that sinking organic materialand high carbon (C): nitrogen (N) micro-environments (such as TEP-based aggregates ormarine snow) could support high heterotrophic N2 fixation rates in oxygenated surfacewaters and in the aphotic zones. Indeed, our calculations show that aphotic N2 fixationaccounted for 37 to 75% of the total daily integrated N2 fixation rates at both locationsin the Mediterranean and Red Seas with rates equal or greater to those measured fromthe photic layers. Moreover, our results indicate that that while N2 fixation may be limitedin the surface waters, aphotic, pelagic N2 fixation may contribute significantly to new Ninputs in other oligotrophic basins, yet it is currently not included in regional or global Nbudgets.
Keywords: dinitrogen fixation, diazotrophs, aphotic layer, oligotrophic, heterotrophic diazotrophs
INTRODUCTIONIn many of the world’s oceans, the availability of dissolved inor-ganic nitrogen (N) controls primary production in surface waters(Falkowski, 1997; Karl et al., 2002). This is because the mostabundant form of N in the oceans, dinitrogen (N2), is bio-logically unavailable to the majority of organisms that residethere. Subgroups of prokaryotic organisms (diazotrophs) fix N2
and convert it to ammonium via the nitrogenase enzyme com-plex. This biological process is an important source of “new”N to oceanic systems that can stimulate production and growthof microbial communities. Current models suggest that new Ninputs from N2 fixation by cyanobacterial diazotrophs in theupper photic layers of the oceans is about 130–140 Tg N y−1
(Gruber, 2008; Eugster and Gruber, 2012).Globally, on geologic timescales, N inputs via N2 fixation
are thought to be balanced by N losses via denitrification(Falkowski, 1997; Deutsch et al., 2007). However, at present,rate measurements suggest that N losses from the ocean viadenitrification (∼245–322 Tg N y−1) far exceed N inputs via N2
fixation and terrestrial sources (Codispoti et al., 2001; Gruber andGalloway, 2008). The balance between N2 fixation and denitri-fication (including annamox) is considered to critically impactthe oceanic inventory of bioavailable nitrogen and thus primaryproductivity (PP) in the oceans (Gruber and Galloway, 2008).
Current models generally restrict oceanic N2 fixation to thesurface, sunlit, photic layer of the oceans where autotrophiccyanobacterial diazotrophs occur (Gruber, 2008). However,recent work suggests that prokaryotic N2 fixers are more widelydistributed geographically than previously thought (Moisanderet al., 2010; Mulholland et al., 2012) and diazotrophs havebeen identified from more diverse pelagic environments includ-ing aphotic pelagic waters in oxygen minimum zones (OMZ)(Hamersley et al., 2011; Jayakumar et al., 2012). While it isknown that diazotrophs inhabit shallow benthic environmentsand microbial mats (Capone, 1983; Bebout et al., 1987; Herbert,1999), sea grass communities (McGlathery, 2008), coral reefs(O’Neil and Capone, 2008), and even hydrothermal vent com-munities (Mehta and Baross, 2006), the small areal extent of
www.frontiersin.org August 2013 | Volume 4 | Article 227 | 1
Rahav et al. Marine aphotic oxygenic dinitrogen fixation
these habitats is thought to limit their contribution to marine N2
fixation (Brooks et al., 1971; Carpenter and Capone, 2008).For many years, investigations of marine N2 fixation also
focused on oligotrophic oceanic regions because the presenceof fixed N was considered inhibiting to active N2 fixation(Mulholland and Capone, 1999; Flores and Herrero, 2005; Wardet al., 2009). Oligotrophic regions harbor a variety of cyanobac-terial diazotrophs including the filamentous cyanobacteriaTrichodesmium spp., diatom-diazotroph associations (DDA’s),and unicellular cyanobacteria such as Croccosphaera and groupA cyanobacteria (UCYN-A) (Bar-Zeev et al., 2008; Carpenter andCapone, 2008; Zehr et al., 2008). However, even Trichodesmium,the most widely studied marine diazotroph, can fix N2 whenambient inorganic N concentrations are on ∼5 μM (Mulhollandet al., 2001), conditions rarely reached in most oceanic photicrealms. N2 fixation of marine diazotrophs has been observed innutrient replete cultures (Mulholland et al., 2001) and systemswith high dissolved inorganic N concentrations (Voss et al., 2004;Rees et al., 2009; Mulholland et al., 2012). Data compilation fromeuphotic, mesopelagic, and benthic studies shows that NO−
3 andNH+
4 concentrations, up to 30 and 200 μM respectively, can resultin N2 fixation rates similar to those found in nitrate depletedsurface waters (reviewed in Knapp, 2012). Moreover, differentsensitivities to DIN concentrations, exposure time, and compen-sation mechanisms all suggest that dissolved N concentrations donot control diazotroph distribution and activities in many marineenvironments (Knapp, 2012).
In addition to photoautotrophic diazotrophs that have beenpreviously considered the dominant N2 fixers in marine sys-tems (Carpenter and Capone, 2008), heterotrophic diazotrophsfrom α, β, γ, δ, and ε-proteobacterial phylogenies, as well asmethanogenic archaea contribute to marine N2 fixation includingbenthic and pelagic realms, mesotrophic and eutrophic environ-ments (Chien and Zinder, 1996; Wu et al., 2003; Zehr et al., 2003;Halm et al., 2012). Heterotrophic diazotrophs have been identi-fied from NO3 -rich deep, aphotic zones of the oceans (Riemannet al., 2010), including OMZ (Jayakumar et al., 2012) and fromnear hydrothermal vents (Mehta et al., 2005). In the subtrop-ical Atlantic, cyanobacterial nifH genes dominated the photiclayer (Langlois et al., 2005); while bacterial nifH genes dominatedthe deep aphotic zones (Riemann et al., 2010). In the ultraolig-otrophic South Pacific Gyre (SPG) sequence analyses of nifHgenes and their expressed transcripts revealed a prevalence of het-erotrophic diazotrohic γ-proteobacteria (Cluster I—Zehr et al.,2003) and the unicellular photoheterotrophic Group A cyanobac-teria (UCYN-A) down to 200 m- the deep chlorophyll maximum(Halm et al., 2012).
While the presence of diazotrophs in oceanic aphotic zones hasbeen demonstrated, to our knowledge, only three published stud-ies have actually measured rates of N2 fixation in aphotic environ-ments; one study was conducted in the Eastern Tropical Pacific(Fernandez et al., 2011), another in the Southern California Bight(Hamersley et al., 2011), and the third in a hydrothermal ventcommunity (Mehta and Baross, 2006). The first two studies werelocated in OMZ or hypoxic areas. In the Southern CaliforniaBight aphotic N2 fixation accounted for up to one-third of thetotal areal rates of N2 fixation (55 μmol N m−2 d−1 out of
150 μmol N m−2 d−1) (Hamersley et al., 2011). While in thenutrient-rich OMZ of the Eastern Tropical South Pacific (ETSP),N2 fixation rates from sub-surface oxygen deficient waters con-tributed about 5 times more N than N2 fixation from the oxicphotic layer (Fernandez et al., 2011). Moreover, N2 fixation co-occurred spatially and temporally with denitrification in the ETSP(Fernandez et al., 2011), refuting the paradigm of spatial and/ortemporal uncoupling between the two processes.
In oligotrophic environments such as the Levantine Basin (LB)(Eastern Mediterranean Sea, EMS) and the Gulf of Aqaba (north-ern Red Sea, GA), primary production in surface waters is limitedat times by nitrogen (N), phosphorus (P), or co-limited by both(Paytan et al., 2009; Krom et al., 2010; Tanaka et al., 2011).Denitrification in subsurface waters is absent because waters arefully oxygenated (Kress and Herut, 2001; Al-Qutob et al., 2002).In the EMS, new nitrogen inputs via N2 fixation in the photic zoneare generally very low, with rates ranging from 0.01 to 0.3 nmolN L−1 d−1. These rates contribute only 1–2% of new produc-tion in the LB (Yogev et al., 2011; Berman-Frank and Rahav,2012; Rahav et al., 2013a). Although occasional small blooms ofTrichodesmium and DDA’s occur in the GA, N2 fixation rates arestill relatively low ranging from ∼0.05 to 2 nmol N L−1 d−1 (Postet al., 2002; Foster et al., 2009). In the photic layer of the EMSand the GA, diazotroph populations include cyanobacteria as wellas many heterotrophic microbes (Man-Aharonovich et al., 2007;Foster et al., 2009; Yogev et al., 2011).
In this study we measured N2 fixation rates in the aphotic, oxy-genated waters of the oligotrophic LB and the GA. Our resultsdemonstrate significant N2 fixation rates equal or greater tothose measured from the photic layers and a prevalence of het-erotrophic diazotrophs. This initial data suggests the aphotic oxy-genated zones can be considerable sources of new N supportingbiological production in oligotrophic waters.
MATERIALS AND METHODSSAMPLING LOCATIONSSeawater samples were collected from two representative pelagicstations that were sampled several times during the mixed andstratified periods; one in the GA in the Red Sea and one in theLB in the Eastern Mediterranean Sea (Table 1 and below). Watersamples were collected using 10 L Niskin bottles mounted on arosette equipped with a CTD (Seabird 19 Plus) and fluorometer(Turner designs, Cyclops7) to measure hydrographic propertiesof the water column, and an in situ PAR sensor (QSP-2300,Biospherical Instruments Inc) allowing distinction between thephotic and aphotic zones.
Gulf of Aqaba (GA)—Water samples from the GA were col-lected aboard the R/V Sam Rothberg at a station located at thenorthern tip of the Red Sea (Station A 29◦ 55′N, 34◦ 28′E) duringthe winter when the water column was well-mixed (March 2010)and twice during the stratified summer period (September 2010and July 2012).
Levantine Basin (LB)—Samples from the LB were collectedduring cruises aboard the R/V Mediterranean Explorer and theR/V Shikmona. A station located west of the Israeli coastline(Station OUT; 32◦ 57′N, 34◦ 45′E) was sampled during peri-ods when the water column was well mixed (December 2010,
Frontiers in Microbiology | Aquatic Microbiology August 2013 | Volume 4 | Article 227 | 2
Rahav et al. Marine aphotic oxygenic dinitrogen fixation
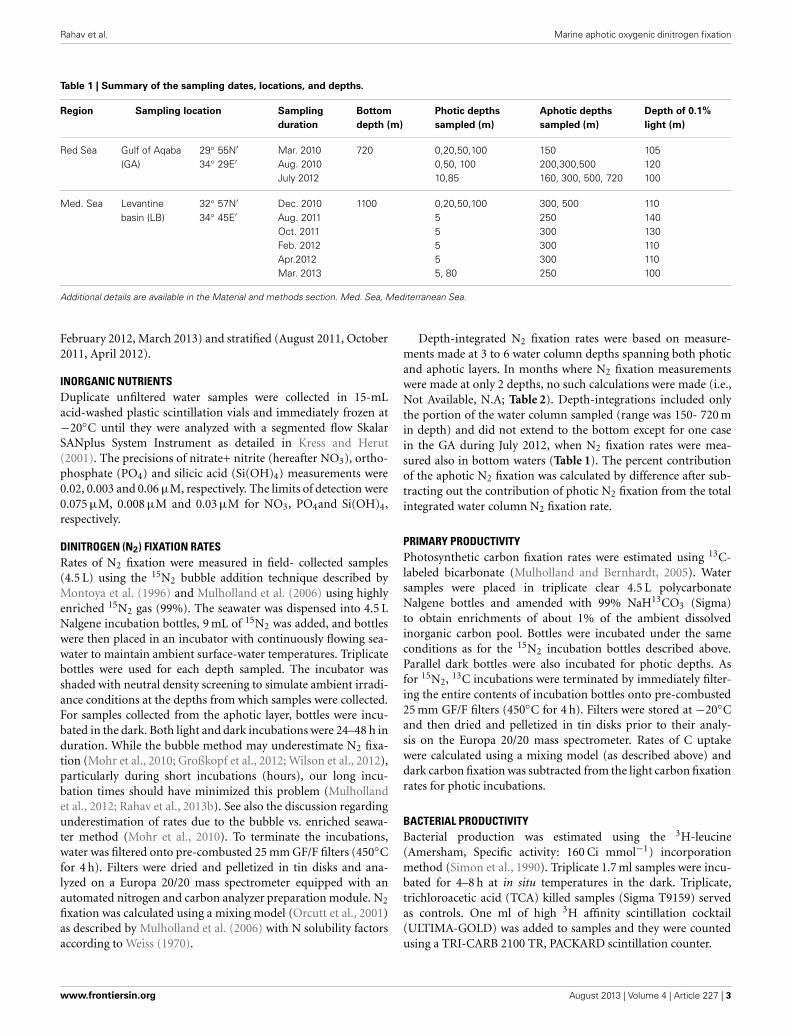
Table 1 | Summary of the sampling dates, locations, and depths.
Region Sampling location Sampling
duration
Bottom
depth (m)
Photic depths
sampled (m)
Aphotic depths
sampled (m)
Depth of 0.1%
light (m)
Red Sea Gulf of Aqaba(GA)
29◦ 55N′
34◦ 29E′Mar. 2010Aug. 2010July 2012
720 0,20,50,1000,50, 10010,85
150200,300,500160, 300, 500, 720
105120100
Med. Sea Levantinebasin (LB)
32◦ 57N′
34◦ 45E′Dec. 2010Aug. 2011Oct. 2011Feb. 2012Apr.2012Mar. 2013
1100 0,20,50,10055555, 80
300, 500250300300300250
110140130110110100
Additional details are available in the Material and methods section. Med. Sea, Mediterranean Sea.
February 2012, March 2013) and stratified (August 2011, October2011, April 2012).
INORGANIC NUTRIENTSDuplicate unfiltered water samples were collected in 15-mLacid-washed plastic scintillation vials and immediately frozen at−20◦C until they were analyzed with a segmented flow SkalarSANplus System Instrument as detailed in Kress and Herut(2001). The precisions of nitrate+ nitrite (hereafter NO3), ortho-phosphate (PO4) and silicic acid (Si(OH)4) measurements were0.02, 0.003 and 0.06 μM, respectively. The limits of detection were0.075 μM, 0.008 μM and 0.03 μM for NO3, PO4and Si(OH)4,respectively.
DINITROGEN (N2) FIXATION RATESRates of N2 fixation were measured in field- collected samples(4.5 L) using the 15N2 bubble addition technique described byMontoya et al. (1996) and Mulholland et al. (2006) using highlyenriched 15N2 gas (99%). The seawater was dispensed into 4.5 LNalgene incubation bottles, 9 mL of 15N2 was added, and bottleswere then placed in an incubator with continuously flowing sea-water to maintain ambient surface-water temperatures. Triplicatebottles were used for each depth sampled. The incubator wasshaded with neutral density screening to simulate ambient irradi-ance conditions at the depths from which samples were collected.For samples collected from the aphotic layer, bottles were incu-bated in the dark. Both light and dark incubations were 24–48 h induration. While the bubble method may underestimate N2 fixa-tion (Mohr et al., 2010; Großkopf et al., 2012; Wilson et al., 2012),particularly during short incubations (hours), our long incu-bation times should have minimized this problem (Mulhollandet al., 2012; Rahav et al., 2013b). See also the discussion regardingunderestimation of rates due to the bubble vs. enriched seawa-ter method (Mohr et al., 2010). To terminate the incubations,water was filtered onto pre-combusted 25 mm GF/F filters (450◦Cfor 4 h). Filters were dried and pelletized in tin disks and ana-lyzed on a Europa 20/20 mass spectrometer equipped with anautomated nitrogen and carbon analyzer preparation module. N2
fixation was calculated using a mixing model (Orcutt et al., 2001)as described by Mulholland et al. (2006) with N solubility factorsaccording to Weiss (1970).
Depth-integrated N2 fixation rates were based on measure-ments made at 3 to 6 water column depths spanning both photicand aphotic layers. In months where N2 fixation measurementswere made at only 2 depths, no such calculations were made (i.e.,Not Available, N.A; Table 2). Depth-integrations included onlythe portion of the water column sampled (range was 150- 720 min depth) and did not extend to the bottom except for one casein the GA during July 2012, when N2 fixation rates were mea-sured also in bottom waters (Table 1). The percent contributionof the aphotic N2 fixation was calculated by difference after sub-tracting out the contribution of photic N2 fixation from the totalintegrated water column N2 fixation rate.
PRIMARY PRODUCTIVITYPhotosynthetic carbon fixation rates were estimated using 13C-labeled bicarbonate (Mulholland and Bernhardt, 2005). Watersamples were placed in triplicate clear 4.5 L polycarbonateNalgene bottles and amended with 99% NaH13CO3 (Sigma)to obtain enrichments of about 1% of the ambient dissolvedinorganic carbon pool. Bottles were incubated under the sameconditions as for the 15N2 incubation bottles described above.Parallel dark bottles were also incubated for photic depths. Asfor 15N2, 13C incubations were terminated by immediately filter-ing the entire contents of incubation bottles onto pre-combusted25 mm GF/F filters (450◦C for 4 h). Filters were stored at −20◦Cand then dried and pelletized in tin disks prior to their analy-sis on the Europa 20/20 mass spectrometer. Rates of C uptakewere calculated using a mixing model (as described above) anddark carbon fixation was subtracted from the light carbon fixationrates for photic incubations.
BACTERIAL PRODUCTIVITYBacterial production was estimated using the 3H-leucine(Amersham, Specific activity: 160 Ci mmol−1) incorporationmethod (Simon et al., 1990). Triplicate 1.7 ml samples were incu-bated for 4–8 h at in situ temperatures in the dark. Triplicate,trichloroacetic acid (TCA) killed samples (Sigma T9159) servedas controls. One ml of high 3H affinity scintillation cocktail(ULTIMA-GOLD) was added to samples and they were countedusing a TRI-CARB 2100 TR, PACKARD scintillation counter.
www.frontiersin.org August 2013 | Volume 4 | Article 227 | 3
Rahav et al. Marine aphotic oxygenic dinitrogen fixation
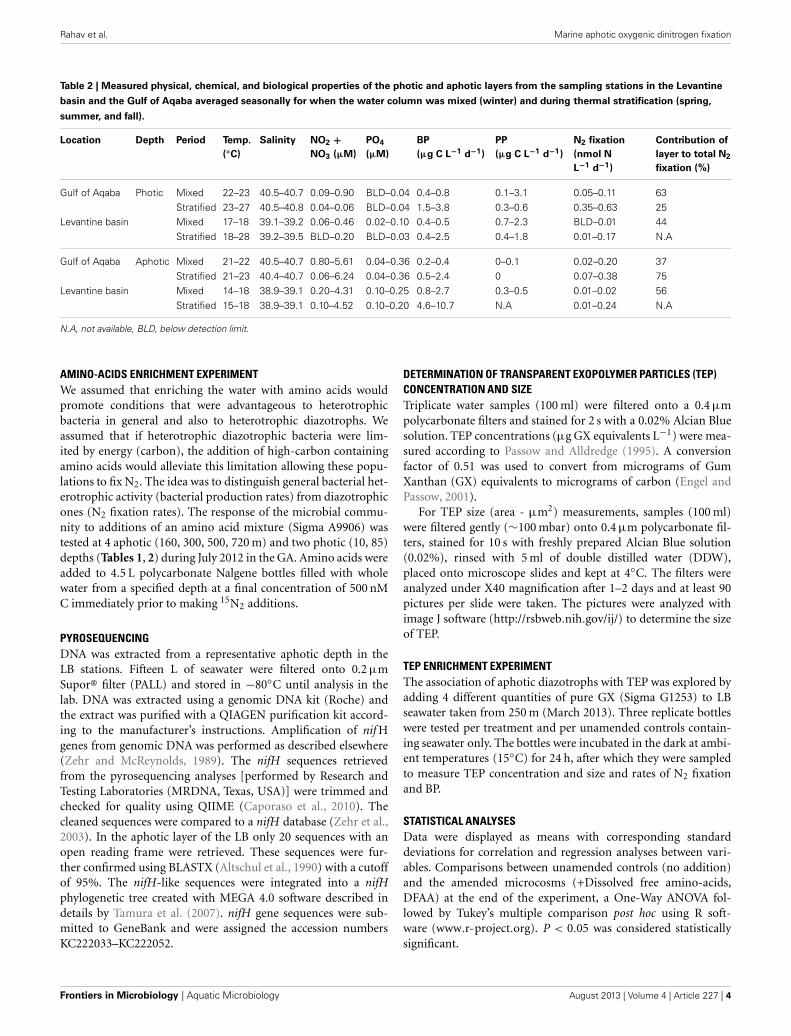
Table 2 | Measured physical, chemical, and biological properties of the photic and aphotic layers from the sampling stations in the Levantine
basin and the Gulf of Aqaba averaged seasonally for when the water column was mixed (winter) and during thermal stratification (spring,
summer, and fall).
Location Depth Period Temp.
(◦C)
Salinity NO2 +NO3 (µM)
PO4
(µM)
BP
(µg C L−1 d−1)
PP
(µg C L−1 d−1)
N2 fixation
(nmol N
L−1 d−1)
Contribution of
layer to total N2
fixation (%)
Gulf of Aqaba Photic Mixed 22–23 40.5–40.7 0.09–0.90 BLD–0.04 0.4–0.8 0.1–3.1 0.05–0.11 63Stratified 23–27 40.5–40.8 0.04–0.06 BLD–0.04 1.5–3.8 0.3–0.6 0.35–0.63 25
Levantine basin Mixed 17–18 39.1–39.2 0.06–0.46 0.02–0.10 0.4–0.5 0.7–2.3 BLD–0.01 44Stratified 18–28 39.2–39.5 BLD–0.20 BLD–0.03 0.4–2.5 0.4–1.8 0.01–0.17 N.A
Gulf of Aqaba Aphotic Mixed 21–22 40.5–40.7 0.80–5.61 0.04–0.36 0.2–0.4 0–0.1 0.02–0.20 37Stratified 21–23 40.4–40.7 0.06–6.24 0.04–0.36 0.5–2.4 0 0.07–0.38 75
Levantine basin Mixed 14–18 38.9–39.1 0.20–4.31 0.10–0.25 0.8–2.7 0.3–0.5 0.01–0.02 56Stratified 15–18 38.9–39.1 0.10–4.52 0.10–0.20 4.6–10.7 N.A 0.01–0.24 N.A
N.A, not available, BLD, below detection limit.
AMINO-ACIDS ENRICHMENT EXPERIMENTWe assumed that enriching the water with amino acids wouldpromote conditions that were advantageous to heterotrophicbacteria in general and also to heterotrophic diazotrophs. Weassumed that if heterotrophic diazotrophic bacteria were lim-ited by energy (carbon), the addition of high-carbon containingamino acids would alleviate this limitation allowing these popu-lations to fix N2. The idea was to distinguish general bacterial het-erotrophic activity (bacterial production rates) from diazotrophicones (N2 fixation rates). The response of the microbial commu-nity to additions of an amino acid mixture (Sigma A9906) wastested at 4 aphotic (160, 300, 500, 720 m) and two photic (10, 85)depths (Tables 1, 2) during July 2012 in the GA. Amino acids wereadded to 4.5 L polycarbonate Nalgene bottles filled with wholewater from a specified depth at a final concentration of 500 nMC immediately prior to making 15N2 additions.
PYROSEQUENCINGDNA was extracted from a representative aphotic depth in theLB stations. Fifteen L of seawater were filtered onto 0.2 μmSupor® filter (PALL) and stored in −80◦C until analysis in thelab. DNA was extracted using a genomic DNA kit (Roche) andthe extract was purified with a QIAGEN purification kit accord-ing to the manufacturer’s instructions. Amplification of nif Hgenes from genomic DNA was performed as described elsewhere(Zehr and McReynolds, 1989). The nifH sequences retrievedfrom the pyrosequencing analyses [performed by Research andTesting Laboratories (MRDNA, Texas, USA)] were trimmed andchecked for quality using QIIME (Caporaso et al., 2010). Thecleaned sequences were compared to a nifH database (Zehr et al.,2003). In the aphotic layer of the LB only 20 sequences with anopen reading frame were retrieved. These sequences were fur-ther confirmed using BLASTX (Altschul et al., 1990) with a cutoffof 95%. The nifH-like sequences were integrated into a nifHphylogenetic tree created with MEGA 4.0 software described indetails by Tamura et al. (2007). nifH gene sequences were sub-mitted to GeneBank and were assigned the accession numbersKC222033–KC222052.
DETERMINATION OF TRANSPARENT EXOPOLYMER PARTICLES (TEP)CONCENTRATION AND SIZETriplicate water samples (100 ml) were filtered onto a 0.4 μmpolycarbonate filters and stained for 2 s with a 0.02% Alcian Bluesolution. TEP concentrations (μg GX equivalents L−1) were mea-sured according to Passow and Alldredge (1995). A conversionfactor of 0.51 was used to convert from micrograms of GumXanthan (GX) equivalents to micrograms of carbon (Engel andPassow, 2001).
For TEP size (area - μm2) measurements, samples (100 ml)were filtered gently (∼100 mbar) onto 0.4 μm polycarbonate fil-ters, stained for 10 s with freshly prepared Alcian Blue solution(0.02%), rinsed with 5 ml of double distilled water (DDW),placed onto microscope slides and kept at 4◦C. The filters wereanalyzed under X40 magnification after 1–2 days and at least 90pictures per slide were taken. The pictures were analyzed withimage J software (http://rsbweb.nih.gov/ij/) to determine the sizeof TEP.
TEP ENRICHMENT EXPERIMENTThe association of aphotic diazotrophs with TEP was explored byadding 4 different quantities of pure GX (Sigma G1253) to LBseawater taken from 250 m (March 2013). Three replicate bottleswere tested per treatment and per unamended controls contain-ing seawater only. The bottles were incubated in the dark at ambi-ent temperatures (15◦C) for 24 h, after which they were sampledto measure TEP concentration and size and rates of N2 fixationand BP.
STATISTICAL ANALYSESData were displayed as means with corresponding standarddeviations for correlation and regression analyses between vari-ables. Comparisons between unamended controls (no addition)and the amended microcosms (+Dissolved free amino-acids,DFAA) at the end of the experiment, a One-Way ANOVA fol-lowed by Tukey’s multiple comparison post hoc using R soft-ware (www.r-project.org). P < 0.05 was considered statisticallysignificant.
Frontiers in Microbiology | Aquatic Microbiology August 2013 | Volume 4 | Article 227 | 4
Rahav et al. Marine aphotic oxygenic dinitrogen fixation
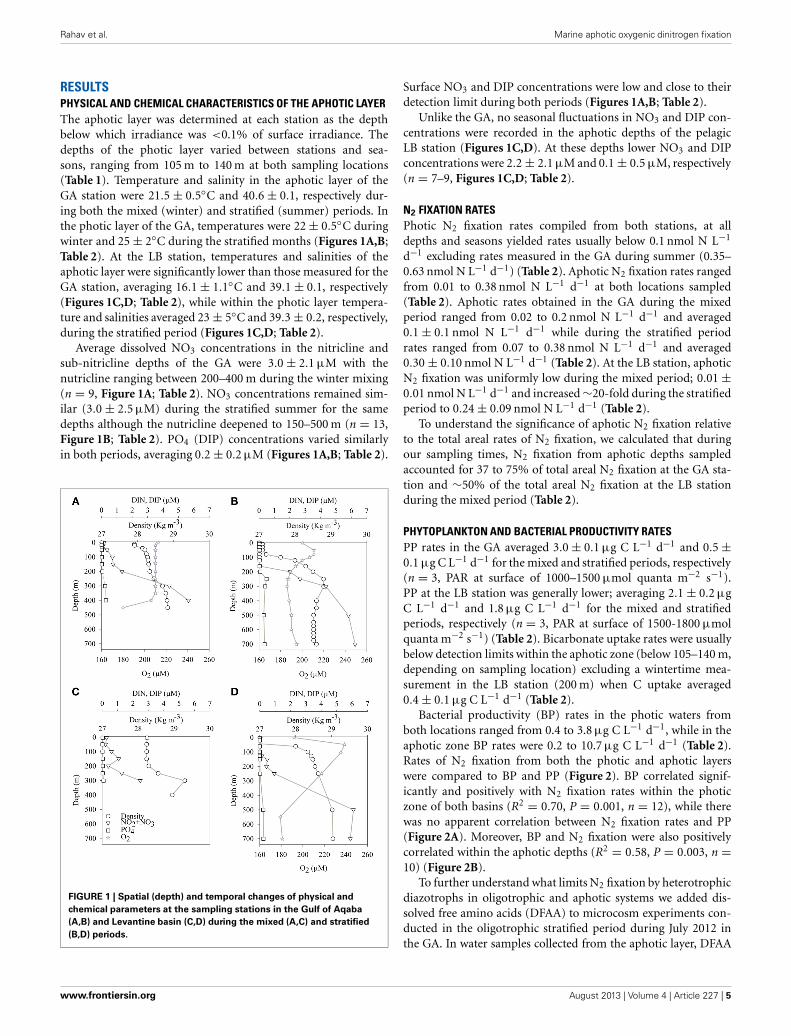
RESULTSPHYSICAL AND CHEMICAL CHARACTERISTICS OF THE APHOTIC LAYERThe aphotic layer was determined at each station as the depthbelow which irradiance was <0.1% of surface irradiance. Thedepths of the photic layer varied between stations and sea-sons, ranging from 105 m to 140 m at both sampling locations(Table 1). Temperature and salinity in the aphotic layer of theGA station were 21.5 ± 0.5◦C and 40.6 ± 0.1, respectively dur-ing both the mixed (winter) and stratified (summer) periods. Inthe photic layer of the GA, temperatures were 22 ± 0.5◦C duringwinter and 25 ± 2◦C during the stratified months (Figures 1A,B;Table 2). At the LB station, temperatures and salinities of theaphotic layer were significantly lower than those measured for theGA station, averaging 16.1 ± 1.1◦C and 39.1 ± 0.1, respectively(Figures 1C,D; Table 2), while within the photic layer tempera-ture and salinities averaged 23 ± 5◦C and 39.3 ± 0.2, respectively,during the stratified period (Figures 1C,D; Table 2).
Average dissolved NO3 concentrations in the nitricline andsub-nitricline depths of the GA were 3.0 ± 2.1 μM with thenutricline ranging between 200–400 m during the winter mixing(n = 9, Figure 1A; Table 2). NO3 concentrations remained sim-ilar (3.0 ± 2.5 μM) during the stratified summer for the samedepths although the nutricline deepened to 150–500 m (n = 13,Figure 1B; Table 2). PO4 (DIP) concentrations varied similarlyin both periods, averaging 0.2 ± 0.2 μM (Figures 1A,B; Table 2).
FIGURE 1 | Spatial (depth) and temporal changes of physical and
chemical parameters at the sampling stations in the Gulf of Aqaba
(A,B) and Levantine basin (C,D) during the mixed (A,C) and stratified
(B,D) periods.
Surface NO3 and DIP concentrations were low and close to theirdetection limit during both periods (Figures 1A,B; Table 2).
Unlike the GA, no seasonal fluctuations in NO3 and DIP con-centrations were recorded in the aphotic depths of the pelagicLB station (Figures 1C,D). At these depths lower NO3 and DIPconcentrations were 2.2 ± 2.1 μM and 0.1 ± 0.5 μM, respectively(n = 7–9, Figures 1C,D; Table 2).
N2 FIXATION RATESPhotic N2 fixation rates compiled from both stations, at alldepths and seasons yielded rates usually below 0.1 nmol N L−1
d−1 excluding rates measured in the GA during summer (0.35–0.63 nmol N L−1 d−1) (Table 2). Aphotic N2 fixation rates rangedfrom 0.01 to 0.38 nmol N L−1 d−1 at both locations sampled(Table 2). Aphotic rates obtained in the GA during the mixedperiod ranged from 0.02 to 0.2 nmol N L−1 d−1 and averaged0.1 ± 0.1 nmol N L−1 d−1 while during the stratified periodrates ranged from 0.07 to 0.38 nmol N L−1 d−1 and averaged0.30 ± 0.10 nmol N L−1 d−1 (Table 2). At the LB station, aphoticN2 fixation was uniformly low during the mixed period; 0.01 ±0.01 nmol N L−1 d−1 and increased ∼20-fold during the stratifiedperiod to 0.24 ± 0.09 nmol N L−1 d−1 (Table 2).
To understand the significance of aphotic N2 fixation relativeto the total areal rates of N2 fixation, we calculated that duringour sampling times, N2 fixation from aphotic depths sampledaccounted for 37 to 75% of total areal N2 fixation at the GA sta-tion and ∼50% of the total areal N2 fixation at the LB stationduring the mixed period (Table 2).
PHYTOPLANKTON AND BACTERIAL PRODUCTIVITY RATESPP rates in the GA averaged 3.0 ± 0.1 μg C L−1 d−1 and 0.5 ±0.1 μg C L−1 d−1 for the mixed and stratified periods, respectively(n = 3, PAR at surface of 1000–1500 μmol quanta m−2 s−1).PP at the LB station was generally lower; averaging 2.1 ± 0.2 μgC L−1 d−1 and 1.8 μg C L−1 d−1 for the mixed and stratifiedperiods, respectively (n = 3, PAR at surface of 1500-1800 μmolquanta m−2 s−1) (Table 2). Bicarbonate uptake rates were usuallybelow detection limits within the aphotic zone (below 105–140 m,depending on sampling location) excluding a wintertime mea-surement in the LB station (200 m) when C uptake averaged0.4 ± 0.1 μg C L−1 d−1 (Table 2).
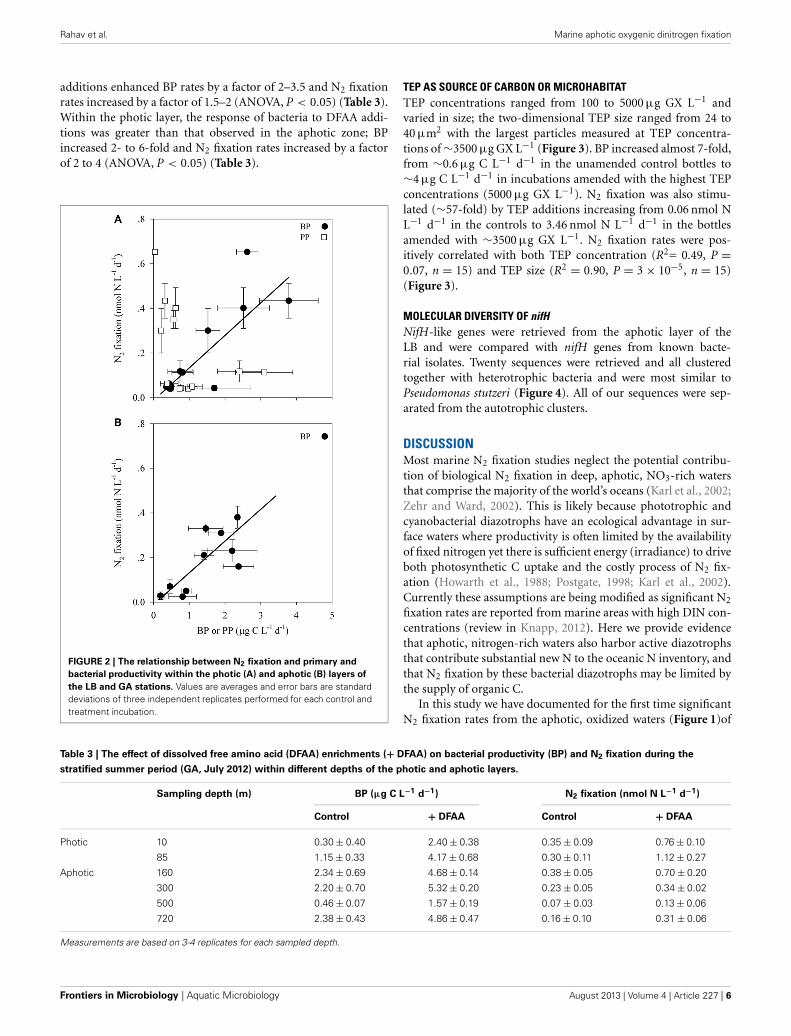
Bacterial productivity (BP) rates in the photic waters fromboth locations ranged from 0.4 to 3.8 μg C L−1 d−1, while in theaphotic zone BP rates were 0.2 to 10.7 μg C L−1 d−1 (Table 2).Rates of N2 fixation from both the photic and aphotic layerswere compared to BP and PP (Figure 2). BP correlated signif-icantly and positively with N2 fixation rates within the photiczone of both basins (R2 = 0.70, P = 0.001, n = 12), while therewas no apparent correlation between N2 fixation rates and PP(Figure 2A). Moreover, BP and N2 fixation were also positivelycorrelated within the aphotic depths (R2 = 0.58, P = 0.003, n =10) (Figure 2B).
To further understand what limits N2 fixation by heterotrophicdiazotrophs in oligotrophic and aphotic systems we added dis-solved free amino acids (DFAA) to microcosm experiments con-ducted in the oligotrophic stratified period during July 2012 inthe GA. In water samples collected from the aphotic layer, DFAA
www.frontiersin.org August 2013 | Volume 4 | Article 227 | 5
Rahav et al. Marine aphotic oxygenic dinitrogen fixation
additions enhanced BP rates by a factor of 2–3.5 and N2 fixationrates increased by a factor of 1.5–2 (ANOVA, P < 0.05) (Table 3).Within the photic layer, the response of bacteria to DFAA addi-tions was greater than that observed in the aphotic zone; BPincreased 2- to 6-fold and N2 fixation rates increased by a factorof 2 to 4 (ANOVA, P < 0.05) (Table 3).
FIGURE 2 | The relationship between N2 fixation and primary and
bacterial productivity within the photic (A) and aphotic (B) layers of
the LB and GA stations. Values are averages and error bars are standarddeviations of three independent replicates performed for each control andtreatment incubation.
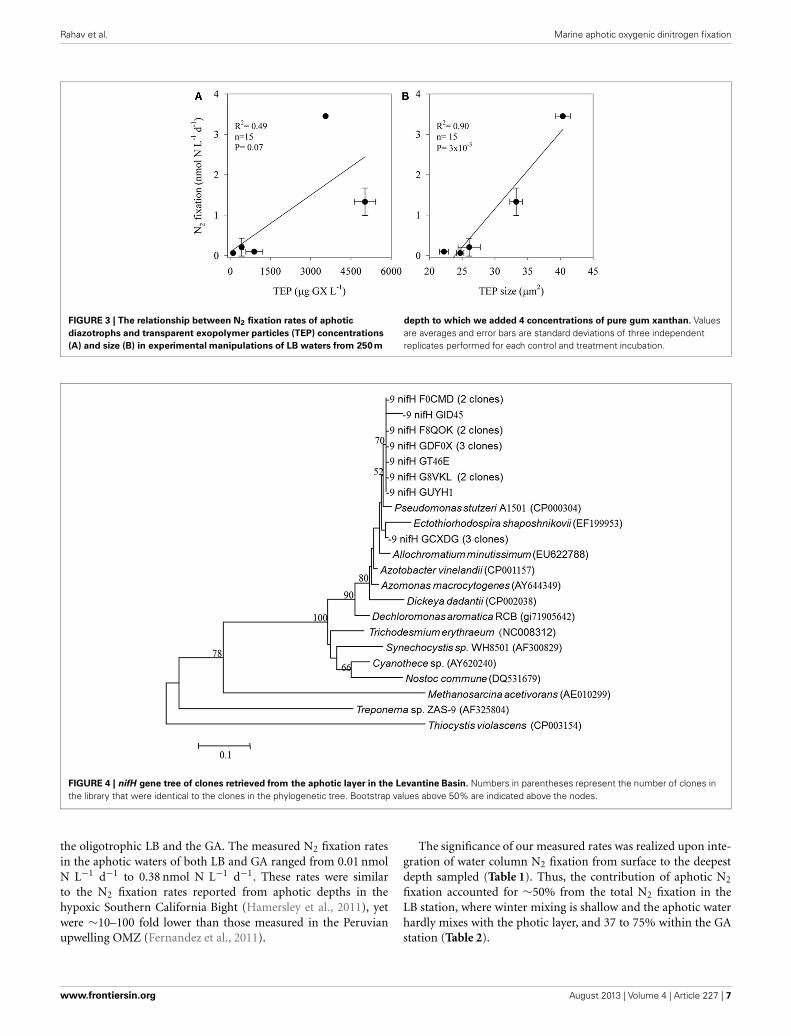
TEP AS SOURCE OF CARBON OR MICROHABITATTEP concentrations ranged from 100 to 5000 μg GX L−1 andvaried in size; the two-dimensional TEP size ranged from 24 to40 μm2 with the largest particles measured at TEP concentra-tions of ∼3500 μg GX L−1 (Figure 3). BP increased almost 7-fold,from ∼0.6 μg C L−1 d−1 in the unamended control bottles to∼4 μg C L−1 d−1 in incubations amended with the highest TEPconcentrations (5000 μg GX L−1). N2 fixation was also stimu-lated (∼57-fold) by TEP additions increasing from 0.06 nmol NL−1 d−1 in the controls to 3.46 nmol N L−1 d−1 in the bottlesamended with ∼3500 μg GX L−1. N2 fixation rates were pos-itively correlated with both TEP concentration (R2= 0.49, P =0.07, n = 15) and TEP size (R2 = 0.90, P = 3 × 10⁻⁵, n = 15)(Figure 3).
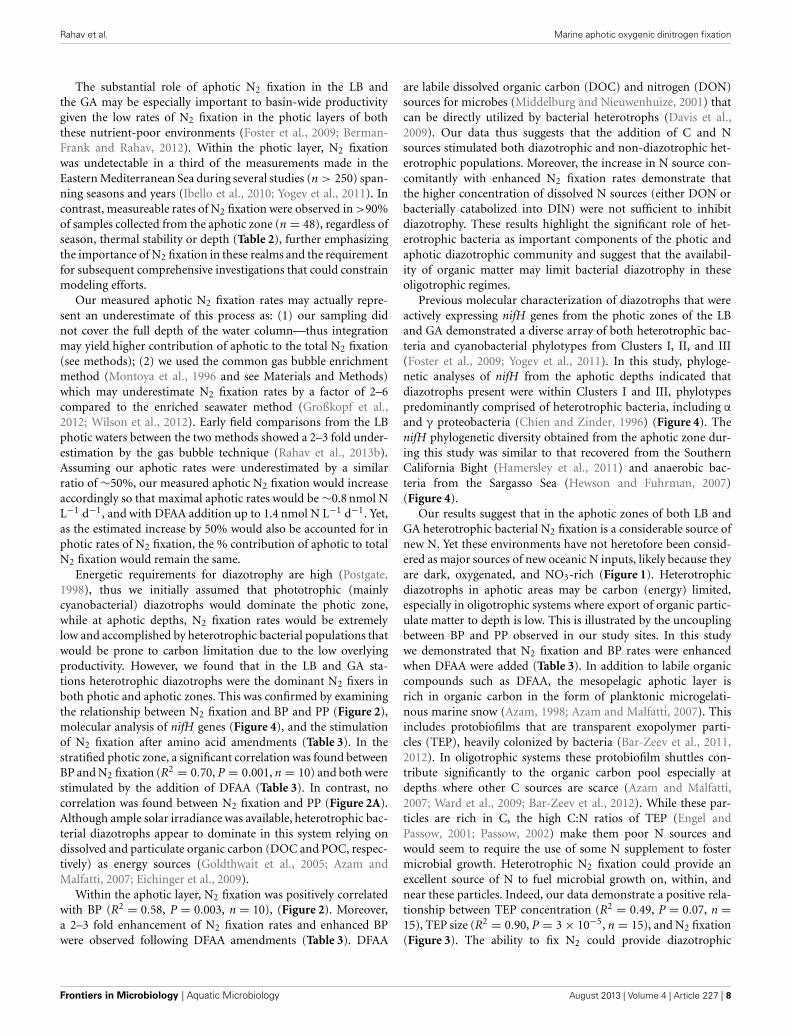
MOLECULAR DIVERSITY OF nifHNifH-like genes were retrieved from the aphotic layer of theLB and were compared with nifH genes from known bacte-rial isolates. Twenty sequences were retrieved and all clusteredtogether with heterotrophic bacteria and were most similar toPseudomonas stutzeri (Figure 4). All of our sequences were sep-arated from the autotrophic clusters.
DISCUSSIONMost marine N2 fixation studies neglect the potential contribu-tion of biological N2 fixation in deep, aphotic, NO3-rich watersthat comprise the majority of the world’s oceans (Karl et al., 2002;Zehr and Ward, 2002). This is likely because phototrophic andcyanobacterial diazotrophs have an ecological advantage in sur-face waters where productivity is often limited by the availabilityof fixed nitrogen yet there is sufficient energy (irradiance) to driveboth photosynthetic C uptake and the costly process of N2 fix-ation (Howarth et al., 1988; Postgate, 1998; Karl et al., 2002).Currently these assumptions are being modified as significant N2
fixation rates are reported from marine areas with high DIN con-centrations (review in Knapp, 2012). Here we provide evidencethat aphotic, nitrogen-rich waters also harbor active diazotrophsthat contribute substantial new N to the oceanic N inventory, andthat N2 fixation by these bacterial diazotrophs may be limited bythe supply of organic C.
In this study we have documented for the first time significantN2 fixation rates from the aphotic, oxidized waters (Figure 1)of
Table 3 | The effect of dissolved free amino acid (DFAA) enrichments (+ DFAA) on bacterial productivity (BP) and N2 fixation during the
stratified summer period (GA, July 2012) within different depths of the photic and aphotic layers.
Sampling depth (m) BP (µg C L−1 d−1) N2 fixation (nmol N L−1 d−1)
Control + DFAA Control + DFAA
Photic 10 0.30 ± 0.40 2.40 ± 0.38 0.35 ± 0.09 0.76 ± 0.10
85 1.15 ± 0.33 4.17 ± 0.68 0.30 ± 0.11 1.12 ± 0.27
Aphotic 160 2.34 ± 0.69 4.68 ± 0.14 0.38 ± 0.05 0.70 ± 0.20
300 2.20 ± 0.70 5.32 ± 0.20 0.23 ± 0.05 0.34 ± 0.02
500 0.46 ± 0.07 1.57 ± 0.19 0.07 ± 0.03 0.13 ± 0.06
720 2.38 ± 0.43 4.86 ± 0.47 0.16 ± 0.10 0.31 ± 0.06
Measurements are based on 3-4 replicates for each sampled depth.
Frontiers in Microbiology | Aquatic Microbiology August 2013 | Volume 4 | Article 227 | 6
Rahav et al. Marine aphotic oxygenic dinitrogen fixation
FIGURE 3 | The relationship between N2 fixation rates of aphotic
diazotrophs and transparent exopolymer particles (TEP) concentrations
(A) and size (B) in experimental manipulations of LB waters from 250 m
depth to which we added 4 concentrations of pure gum xanthan. Valuesare averages and error bars are standard deviations of three independentreplicates performed for each control and treatment incubation.
FIGURE 4 | nifH gene tree of clones retrieved from the aphotic layer in the Levantine Basin. Numbers in parentheses represent the number of clones inthe library that were identical to the clones in the phylogenetic tree. Bootstrap values above 50% are indicated above the nodes.
the oligotrophic LB and the GA. The measured N2 fixation ratesin the aphotic waters of both LB and GA ranged from 0.01 nmolN L−1 d−1 to 0.38 nmol N L−1 d−1. These rates were similarto the N2 fixation rates reported from aphotic depths in thehypoxic Southern California Bight (Hamersley et al., 2011), yetwere ∼10–100 fold lower than those measured in the Peruvianupwelling OMZ (Fernandez et al., 2011).
The significance of our measured rates was realized upon inte-gration of water column N2 fixation from surface to the deepestdepth sampled (Table 1). Thus, the contribution of aphotic N2
fixation accounted for ∼50% from the total N2 fixation in theLB station, where winter mixing is shallow and the aphotic waterhardly mixes with the photic layer, and 37 to 75% within the GAstation (Table 2).
www.frontiersin.org August 2013 | Volume 4 | Article 227 | 7
Rahav et al. Marine aphotic oxygenic dinitrogen fixation
The substantial role of aphotic N2 fixation in the LB andthe GA may be especially important to basin-wide productivitygiven the low rates of N2 fixation in the photic layers of boththese nutrient-poor environments (Foster et al., 2009; Berman-Frank and Rahav, 2012). Within the photic layer, N2 fixationwas undetectable in a third of the measurements made in theEastern Mediterranean Sea during several studies (n > 250) span-ning seasons and years (Ibello et al., 2010; Yogev et al., 2011). Incontrast, measureable rates of N2 fixation were observed in >90%of samples collected from the aphotic zone (n = 48), regardless ofseason, thermal stability or depth (Table 2), further emphasizingthe importance of N2 fixation in these realms and the requirementfor subsequent comprehensive investigations that could constrainmodeling efforts.
Our measured aphotic N2 fixation rates may actually repre-sent an underestimate of this process as: (1) our sampling didnot cover the full depth of the water column—thus integrationmay yield higher contribution of aphotic to the total N2 fixation(see methods); (2) we used the common gas bubble enrichmentmethod (Montoya et al., 1996 and see Materials and Methods)which may underestimate N2 fixation rates by a factor of 2–6compared to the enriched seawater method (Großkopf et al.,2012; Wilson et al., 2012). Early field comparisons from the LBphotic waters between the two methods showed a 2–3 fold under-estimation by the gas bubble technique (Rahav et al., 2013b).Assuming our aphotic rates were underestimated by a similarratio of ∼50%, our measured aphotic N2 fixation would increaseaccordingly so that maximal aphotic rates would be ∼0.8 nmol NL−1 d−1, and with DFAA addition up to 1.4 nmol N L−1 d−1. Yet,as the estimated increase by 50% would also be accounted for inphotic rates of N2 fixation, the % contribution of aphotic to totalN2 fixation would remain the same.
Energetic requirements for diazotrophy are high (Postgate,1998), thus we initially assumed that phototrophic (mainlycyanobacterial) diazotrophs would dominate the photic zone,while at aphotic depths, N2 fixation rates would be extremelylow and accomplished by heterotrophic bacterial populations thatwould be prone to carbon limitation due to the low overlyingproductivity. However, we found that in the LB and GA sta-tions heterotrophic diazotrophs were the dominant N2 fixers inboth photic and aphotic zones. This was confirmed by examiningthe relationship between N2 fixation and BP and PP (Figure 2),molecular analysis of nifH genes (Figure 4), and the stimulationof N2 fixation after amino acid amendments (Table 3). In thestratified photic zone, a significant correlation was found betweenBP and N2 fixation (R2 = 0.70, P = 0.001, n = 10) and both werestimulated by the addition of DFAA (Table 3). In contrast, nocorrelation was found between N2 fixation and PP (Figure 2A).Although ample solar irradiance was available, heterotrophic bac-terial diazotrophs appear to dominate in this system relying ondissolved and particulate organic carbon (DOC and POC, respec-tively) as energy sources (Goldthwait et al., 2005; Azam andMalfatti, 2007; Eichinger et al., 2009).
Within the aphotic layer, N2 fixation was positively correlatedwith BP (R2 = 0.58, P = 0.003, n = 10), (Figure 2). Moreover,a 2–3 fold enhancement of N2 fixation rates and enhanced BPwere observed following DFAA amendments (Table 3). DFAA
are labile dissolved organic carbon (DOC) and nitrogen (DON)sources for microbes (Middelburg and Nieuwenhuize, 2001) thatcan be directly utilized by bacterial heterotrophs (Davis et al.,2009). Our data thus suggests that the addition of C and Nsources stimulated both diazotrophic and non-diazotrophic het-erotrophic populations. Moreover, the increase in N source con-comitantly with enhanced N2 fixation rates demonstrate thatthe higher concentration of dissolved N sources (either DON orbacterially catabolized into DIN) were not sufficient to inhibitdiazotrophy. These results highlight the significant role of het-erotrophic bacteria as important components of the photic andaphotic diazotrophic community and suggest that the availabil-ity of organic matter may limit bacterial diazotrophy in theseoligotrophic regimes.
Previous molecular characterization of diazotrophs that wereactively expressing nifH genes from the photic zones of the LBand GA demonstrated a diverse array of both heterotrophic bac-teria and cyanobacterial phylotypes from Clusters I, II, and III(Foster et al., 2009; Yogev et al., 2011). In this study, phyloge-netic analyses of nifH from the aphotic depths indicated thatdiazotrophs present were within Clusters I and III, phylotypespredominantly comprised of heterotrophic bacteria, including α
and γ proteobacteria (Chien and Zinder, 1996) (Figure 4). ThenifH phylogenetic diversity obtained from the aphotic zone dur-ing this study was similar to that recovered from the SouthernCalifornia Bight (Hamersley et al., 2011) and anaerobic bac-teria from the Sargasso Sea (Hewson and Fuhrman, 2007)(Figure 4).
Our results suggest that in the aphotic zones of both LB andGA heterotrophic bacterial N2 fixation is a considerable source ofnew N. Yet these environments have not heretofore been consid-ered as major sources of new oceanic N inputs, likely because theyare dark, oxygenated, and NO3-rich (Figure 1). Heterotrophicdiazotrophs in aphotic areas may be carbon (energy) limited,especially in oligotrophic systems where export of organic partic-ulate matter to depth is low. This is illustrated by the uncouplingbetween BP and PP observed in our study sites. In this studywe demonstrated that N2 fixation and BP rates were enhancedwhen DFAA were added (Table 3). In addition to labile organiccompounds such as DFAA, the mesopelagic aphotic layer isrich in organic carbon in the form of planktonic microgelati-nous marine snow (Azam, 1998; Azam and Malfatti, 2007). Thisincludes protobiofilms that are transparent exopolymer parti-cles (TEP), heavily colonized by bacteria (Bar-Zeev et al., 2011,2012). In oligotrophic systems these protobiofilm shuttles con-tribute significantly to the organic carbon pool especially atdepths where other C sources are scarce (Azam and Malfatti,2007; Ward et al., 2009; Bar-Zeev et al., 2012). While these par-ticles are rich in C, the high C:N ratios of TEP (Engel andPassow, 2001; Passow, 2002) make them poor N sources andwould seem to require the use of some N supplement to fostermicrobial growth. Heterotrophic N2 fixation could provide anexcellent source of N to fuel microbial growth on, within, andnear these particles. Indeed, our data demonstrate a positive rela-tionship between TEP concentration (R2 = 0.49, P = 0.07, n =15), TEP size (R2 = 0.90, P = 3 × 10⁻⁵, n = 15), and N2 fixation(Figure 3). The ability to fix N2 could provide diazotrophic
Frontiers in Microbiology | Aquatic Microbiology August 2013 | Volume 4 | Article 227 | 8
Rahav et al. Marine aphotic oxygenic dinitrogen fixation
heterotrophs with a competitive advantage over non-diazotrophicheterotrophic bacteria in carbon-rich and nitrogen-poor micro-environments such as these. Moreover, in aggregates such asmarine snow, TEP, and other marine microgels, bacterial col-onization causes high metabolic consumption of oxygen anddecreasing oxygen gradients from the surface to the anaerobiccenter (Paerl and Prufert, 1987). Reduced oxygen concentrationswould theoretically benefit diazotrophic bacteria because nitro-genase is an oxygen-sensitive protein (Postgate, 1998). We spec-ulate these anaerobic, high C, low N microenvironments couldpromote the competitive success and activity of heterotrophicdiazotrophs at depth.
Our novel data thus provides a conservative estimate of anadditional 37 to 75% source of N via aphotic N2 fixation inthe oligotrophic Levantine basin and the GA. Our measure-ments substantiate early indications (Paerl and Prufert, 1987)and recent phylogenetic characterizations (Riemann et al., 2010)
highlighting a pivotal ecological role for diazotrophs in deep, oxy-genated, NO3-rich waters. Because these areas comprise the bulkof the world’s oceans they could represent a hitherto unaccountedfor source of new N that may contribute to global productiv-ity and could reduce the existing discrepancies [along with othernewly described contributions of N2 fixation (reviewed in Knapp,2012)] between sources and losses of N found in global marineN budgets.
ACKNOWLEDGMENTSWe thank the Inter University Institute for Marine Sciencesin Eilat and the Eco-Ocean foundation. We thank Prof. OdedBéjà for bioinformatic help and Adi Levi and Yosef Krauszfor technical work. This research was supported by the IsraelScience Foundation grants (996/08) to Ilana Berman-Frank andBarak Herut and National Science Foundation (USA) grants toMargaret R. Mulholland.
REFERENCESAl-Qutob, M., Hase, C., Tilzer, M. M.,
and Lazar, B. (2002). Phytoplanktondrives nitrite dynamics in theGulf of Aqaba, Red Sea. Mar.Ecol. Prog. Ser. 239, 233–239. doi:10.3354/meps239233
Altschul, S. F., Gish, W., Miller, W.,Myers, E. W., and Lipman, D. J.(1990). Basic local alignment searchtool. J. Mol. Biol. 215, 403–410.
Azam, F. (1998). Microbial controlof oceanic carbon flux: the plotthickens. Science 280, 694–696. doi:10.1126/science.280.5364.694
Azam, F., and Malfatti, F. (2007).Microbial structuring of marineecosystems. Nat. Rev. Microbiol. 5,782–791. doi: 10.1038/nrmicro1747
Bar-Zeev, E., Berman, T., Rahav, E.,Dishon, G., Herut, B., and Berman-Frank, I. (2011). Transparentexopolymer particle (TEP) dynam-ics in the Eastern MediterraneanSea. Mar. Ecol. Prog. Ser. 431,107–118. doi: 10.3354/meps09110
Bar-Zeev, E., Berman-Frank, I.,Girshevitz, O., and Berman,T. (2012). Revised paradigmof aquatic biofilm formationfacilitated by microgel trans-parent exopolymer particles.Proc. Natl. Acad. Sci. U.S.A. 109,9119–9124. doi: 10.1073/pnas.1203708109
Bar-Zeev, E., Yogev, T., Man-Aharonovich, D., Kress, N.,Herut, B., Béjà, O., et al.(2008). Seasonal dynamics ofthe endosymbiotic, nitrogen-fixingcyanobacterium Richelia intracellu-laris in the Eastern MediterraneanSea. ISME J. 2, 911–923. doi:10.1038/ismej.2008.56
Bebout, B. M., Paerl, H. W., Crocker, K.M., and Prufert, L. E. (1987). Diel
interactions of oxygenic photosyn-thesis and N2 fixation (acetylene-reduction) in a marine micro-bial mat community. Appl. Environ.Microbiol. 53, 2353–2362.
Berman-Frank, I., and Rahav, E.(2012). “Nitrogen fixation as asource for new production in theMediterranean Sea: a review,” inLife in the Mediterranean Sea: ALook at Habitat Changes, ed N. E.Stambler (New York, NY: NovaScience Publishers), 199–226.
Brooks, R. H., Brezonik, P. L., Putnam,H. D., and Keirn, M. A. (1971).Nitrogen fixation in an estuar-ine environment: the Waccasassaon Florida Gulf coast. Limnol.Oceanogr. 16, 701–710. doi:10.4319/lo.1971.16.5.0701
Capone, D. G. (1983). N2 fixation inseagrass communities. Mar. Technol.Soc. J. 17, 32–37.
Caporaso, J. G., Kuczynski, J.,Stombaugh, J., Bittinger, K.,Bushman, F. D., Costello, E. K.,et al. (2010). QIIME allows analysisof high-throughput communitysequencing data. Nat. Methods 7,335–336. doi: 10.1038/nmeth.f.303
Carpenter, E. J., and Capone, D. (2008).“Nitrogen fixation in the marineenvironment,” in Nitrogen Fixationin the Marine Environment, edsD. Capone, A. D. Bronk, R. M.Mulholland, and E. J. Carpenter(San Diego, CA: Elsevier AcademicPress), 141–198.
Chien, Y. T., and Zinder, S. H. (1996).Cloning, functional organization,transcript studies, and phylogeneticanalysis of the complete nitrogenasestructural genes (nifHDK2) andassociated genes in the archaeonMethanosarcina barkeri 227.J. Bacteriol. 178, 143–148.
Codispoti, L. A., Brandes, J. A.,Christensen, J. P., Devol, A. H.,Naqvi, S. W. A., Paerl, H. W.,et al. (2001). The oceanic fixednitrogen and nitrous oxide bud-gets: moving targets as we enterthe anthropocene. Sci. Mar. 65,85–105.
Davis, J., Kaiser, K., and Benner,R. (2009). Amino acid andamino sugar yields and com-positions as indicators of dissolvedorganic matter diagenesis. Org.Geochem. 40, 343–352. doi:10.1016/j.orggeochem.2008.12.003
Deutsch, C., Sarmiento, J. L., Sigman,D. M., Gruber, N., and Dunne,J. P. (2007). Spatial coupling ofnitrogen inputs and losses in theocean. Nature 445, 163–167. doi:10.1038/nature05392
Eichinger, M., Kooijman, S. A. L. M.,Sempere, R., Lefevre, D., Gregori,G., Charriere, B., et al. (2009).Consumption and release of dis-solved organic carbon by marinebacteria in a pulsed-substrateenvironment: from experiments tomodeling. Aquat. Microb. Ecol. 56,41–54. doi: 10.3354/ame01312
Engel, A., and Passow, U. (2001).Carbon and nitrogen content oftransparent exopolymer parti-cles (TEP) in relation to theirAlcian Blue adsorption. Mar.Ecol. Prog. Ser. 219, 1–10. doi:10.3354/meps219001
Eugster, O., and Gruber, N. (2012).A probabilistic estimate of globalmarine N-fixation and denitrifica-tion. Global Biogeochem. Cycles 26.doi: 10.1029/2012GB004300
Falkowski, P. G. (1997). Evolutionof the nitrogen cycle and itsinfluence on the biological seques-tration of CO2 in the ocean,
Nature 387, 272–275. doi: 10.1038/387272a0
Fernandez, C., Farías, L., andUlloa, O. (2011). Nitrogen fix-ation in denitrified marinewaters. PLoS ONE 6:e20539.doi:10.1371/journal.pone.0020539
Flores, E., and Herrero, A. (2005).Nitrogen assimilation and nitrogencontrol in cyanobacteria. Biochem.Soc. Trans. 33, 164–167. doi:10.1042/BST0330164
Foster, R. A., Paytan, A., and Zehr,J. P. (2009). Seasonality of N2
fixation and nifH gene diversityin the Gulf of Aqaba (Red Sea).Limnol. Oceanogr. 54, 219–233. doi:10.4319/lo.2009.54.1.0219
Goldthwait, S. A., Carlson, C. A.,Henderson, G. K., and Alldredge,A. L. (2005). Effects of physicalfragmentation on remineral-ization of marine snow. Mar.Ecol. Prog. Ser. 305, 59–65. doi:10.3354/meps305059
Großkopf, T., Mohr, W., Baustian,T., Schunck, H., Gill, D., Kuypers,M. M. M., et al. (2012). Doublingof marine dinitrogen-fixationrates based on direct measure-ments. Nature 488, 361–364. doi:10.1038/nature11338
Gruber, N. (2008). “The marine nitro-gen cycle: overview of distributionsand processes,” in Nitrogen in theMarine Environment, 2nd Edn.,eds D. Capone, D. Bronk, M.Mulholland, and E. Carpenter(Amsterdam: Elsevier), 1–50.
Gruber, N., and Galloway, J. N. (2008).An Earth-system perspective of theglobal nitrogen cycle. Nature 451,293–296. doi: 10.1038/nature06592
Halm, H., Lam, P., Ferdelman, T. G.,Lavik, G., Dittmar, T., Laroche,J., et al. (2012). Heterotrophic
www.frontiersin.org August 2013 | Volume 4 | Article 227 | 9
Rahav et al. Marine aphotic oxygenic dinitrogen fixation
organisms dominate nitrogenfixation in the South PacificGyre. ISME J. 6, 1238–1249. doi:10.1038/ismej.2011.182
Hamersley, M. R., Turk, K. A.,Leinweber, A., Gruber, N., Zehr,J. P., Gunderson, T., et al. (2011).Nitrogen fixation within the watercolumn associated with two hypoxicbasins in the Southern CaliforniaBight. Aquat. Microb. Ecol. 63,193–205. doi: 10.3354/ame01494
Herbert, R. A. (1999). Nitrogencycling in coastal marine ecosys-tems. FEMS Microb. Rev. 23,563–590. doi: 10.1111/j.1574-6976.1999.tb00414.x
Hewson, I., and Fuhrman, J. A. (2007).Covariation of viral parameterswith bacterial assemblage rich-ness and diversity in the watercolumn and sediments. DeepSea Res. I. 54, 811–830. doi:10.1016/j.dsr.2007.02.003
Howarth, R. W., Marino, R.,Lane, J., and Cole, J. J. (1988).Nitrogen-fixation in fresh-water,estuarine, and marine ecosys-tems.1. rates and importance.Limnol. Oceanogr. 33, 669–687. doi:10.4319/lo.1988.33.4_part_2.0669
Ibello, V., Cantoni, C., Cozzi, S., andCivitarese, G. (2010). First basin-wide experimental results on N2fixation in the open MediterraneanSea. Geophys. Res. Lett. 37. doi:10.1029/2009gl041635.
Jayakumar, A., Al-Rshaidat, M. M. D.,Ward, B. B., and Mulholland, M. R.(2012). Diversity, distribution, andexpression of diazotroph nifH genesin oxygen-deficient waters of theArabian Sea. FEMS Microbiol. Ecol.82, 597–606. doi: 10.1111/j.1574-6941.2012.01430.x
Karl, D., Michaels, A., Bergman,B., Capone, D., Carpenter, E.,Letelier, R., et al. (2002). Dinitrogenfixation in the world’s oceans.Biogeochemistry 57, 47–98. doi:10.1023/A:1015798105851
Knapp, A. N. (2012). The sensi-tivity of marine N2 fixation todissolved inorganic nitrogen.Front. Microbiol. 3:374. doi:10.3389/fmicb.2012.00374
Kress, N., and Herut, B. (2001). Spatialand seasonal evolution of dis-solved oxygen and nutrients in theSouthern Levantine Basin (EasternMediterranean Sea): chemicalcharacterization of the water massesand inferences on the N: P ratios.Deep Sea Res. I. 48, 2347–2372.doi: 10.1016/S0967-0637(01)00022-X
Krom, M. D., Emeis, K. C., andVan Cappellen, P. (2010). Whyis the Eastern Mediterranean
phosphorus limited. Prog.Oceanogr. 85, 236–244. doi:10.1016/j.pocean.2010.03.003
Langlois, R. J., Laroche, J., and Raab,P. A. (2005). Diazotrophic diversityand distribution in the tropical andsubtropical Atlantic Ocean. Appl.Environ. Microbiol. 71, 7910–7919.doi: 10.1128/AEM.71.12.7910-7919.2005
Man-Aharonovich, D., Kress, N.,Bar-Zeev, E., Berman-Frank, I., andBeja, O. (2007). Molecular ecol-ogy of nifH genes and transcriptsin the Eastern MediterraneanSea. Environ. Microbiol. 9,2354–2363. doi: 10.1111/j.1462-2920.2007.01353.x
McGlathery, K. J. (2008). “Themarine nitrogen cycle: overviewof distributions and processes,” inNitrogen in the Marine Environment,2nd Edn., eds D. Capone, D.Bronk, M. Mulholland, and E.Carpenter (Amsterdam: Elsevier),1037–1071.
Mehta, M. P., and Baross, J. A. (2006).Nitrogen fixation at 92 degrees Cby a hydrothermal vent archaeon.Science 314, 1783–1786. doi:10.1126/science.1134772
Mehta, M. P., Huber, J. A., and Baross,J. A. (2005). Incidence of noveland potentially archaeal nitroge-nase genes in the deep NortheastPacific Ocean. Environ. Microbiol.7, 1525–1534. doi: 10.1111/j.1462-2920.2005.00836.x
Middelburg, J. J., and Nieuwenhuize,J. (2001). Nitrogen isotope trac-ing of dissolved inorganic nitrogenbehavior in tidal estuaries. Estuar.Coast. Shelf S. 53, 385–391. doi:10.1006/ecss.2001.0805
Mohr, W., Grosskopf, T., Wallace, D.W. R., and Laroche, J. (2010).Methodological underestimation ofoceanic nitrogen fixation rates. PLoSONE 5:e12583. doi: 10.1371/jour-nal.pone.0012583
Moisander, P. H., Beinart, R. A.,Hewson, I., White, A. E., Johnson,K. S., Carlson, C. A., et al.(2010). Unicellular cyanobac-terial distributions broaden theoceanic N2 fixation domain.Science 327, 1512–1514. doi:10.1126/science.1185468
Montoya, J. P., Voss, M., Kahler, P., andCapone, D. G. (1996). A simple,high-precision, high-sensitivitytracer assay for N2 fixation.Appl. Environ. Microbiol. 62,986–993.
Mulholland, M. R., and Bernhardt, P.W. (2005). The effect of growthrate, phosphorus concentration,and temperature on N2 fixation,carbon fixation, and nitrogen
release in continuous cultures ofTrichodesmium IMS101. Limnol.Oceanogr. 50, 839–849. doi:10.4319/lo.2005.50.3.0839
Mulholland, M. R., Bernhardt, P. W.,Blanco-Garcia, J. L., Mannino,A., Hyde, K., Mondragon, E.,et al. (2012). Rates of dinitrogenfixation and the abundance ofdiazotrophs in North Americancoastal waters between CapeHatteras and Georges Bank. Limnol.Oceanogr. 57, 1067–1083. doi:10.4319/lo.2012.57.4.1067
Mulholland, M. R., Bernhardt, P. W.,Heil, C. A., Bronk, D. A., andO’Neil, J. M. (2006). Nitrogenfixation and release of fixednitrogen by Trichodesmium sppin the Gulf of Mexico. Limnol.Oceanogr. 51, 1762–1776. doi:10.4319/lo.2006.51.4.1762
Mulholland, M. R., and Capone,D. G. (1999). Nitrogen fixation,uptake and metabolism in natu-ral and cultured populations ofTrichodesmium spp. Mar. Ecol. Prog.Ser. 188, 33–49. doi: 10.3354/meps188033
Mulholland, M. R., Ohki, K., andCapone, D. G. (2001). Nutrientcontrols on nitrogen uptakeand metabolism by naturalpopulations and cultures ofTrichodesmium (Cyanobacteria).J. Phycol. 37, 1001–1009. doi:10.1046/j.1529-8817.2001.00080.x
O’Neil, J. M., and Capone, D. G.(2008). “Nitrogen Cycling in CoralReef Environments,” in Nitrogenin the Marine Environment, 2ndEdn., eds D. Capone, D. Bronk,M. Mulholland, and E. Carpenter.(Amsterdam: Elsevier), 949–989.
Orcutt, K. M., Lipschultz, F.,Gundersen, K., Arimoto, R.,Michaels, A. F., Knap, A. H.,et al. (2001). A seasonal studyof the significance of N2 fixationby Trichodesmium spp. at theBermuda Atlantic Time-series Study(BATS) site. Deep Sea Res. I. 48,1583–1608.
Paerl, H., and Prufert, L. E. (1987).Oxygen-poor microzones as poten-tial sites of microbial N2 fixationin nitrogen-depleted aerobic marinewaters. Appl. Environ. Microbiol. 53,1078–1087.
Passow, U. (2002). Production of trans-parent exopolymer particles (TEP)by phyto- and bacterioplankton.Mar. Ecol. Prog. Ser. 236, 1–12. doi:10.3354/meps236001
Passow, U., and Alldredge, A. L.(1995). A dye-binding assayfor the spectrophotometricmeasurement of transparentexopolymer particles (TEP).
Limnol. Oceanogr. 40, 1326–1335.doi: 10.4319/lo.1995.40.7.1326
Paytan, A., Mackey, K. R. M., Chen,Y., Lima, I. D., Doney, S. C.,Mahowald, N., et al. (2009). Toxicityof atmospheric aerosols on marinephytoplankton. Proc. Natl. Acad.Sci. U.S.A 106, 4601–4605. doi:10.1073/pnas.0811486106
Post, A. F., Dedej, Z., Gottlieb, R., Li,H., Thomas, D. N., El-Absawi, M.,et al. (2002). Spatial and tempo-ral distribution of Trichodesmiumspp in the stratified Gulf of Aqaba,Red Sea. Mar. Ecol. Prog. Ser. 239,241–250. doi: 10.3354/meps239241
Postgate, J. (1998). “Nitrogen fixa-tion,” in Nitrogen Fixation, 3rd Edn.,ed J. Postgate (London: CambridgeUniversity Press), 124.
Rahav, E., Herut, B., Stambler, N.,Bar-Zeev, E., Mulholland, M. R.,and Berman-Frank, I. (2013a).Uncoupling between dinitrogenfixation and primary productivityin the Eastern Mediterranean Sea.J. Geophys. Res. 118, 1–8. doi:10.1002/jgrg.20023
Rahav, E., Herut, B., Levi, A.,Mulholland, M. R., and Berman-Frank, I. (2013b). Springtimecontribution of dinitrogen fixationto primary production across theMediterranean Sea. Ocean Sci. 9,1–10. doi: 10.5194/os-9-489-2013
Rees, A. P., Gilbert, J. A., and Kelly-Gerreyn, B. A. (2009). Nitrogenfixation in the western EnglishChannel (NE Atlantic Ocean). Mar.Ecol. Prog. Ser. 374, 7–12. doi:10.3354/meps07771
Riemann, L., Farnelid, H., and Steward,G. F. (2010). Nitrogenase genesin non-cyanobacterial plankton:prevalence, diversity and regu-lation in marine waters. Aquat.Microb. Ecol. 61, 225–237. doi:10.3354/ame01431
Simon, M., Alldredge, A. L., andAzam, F. (1990). Bacterial carbondynamics on marine snow. Mar.Ecol. Prog. Ser. 65, 205–211. doi:10.3354/meps065205
Tamura, K., Dudley, J., Nei, M., andKumar, S. (2007). MEGA4: molec-ular evolutionary genetics analy-sis (MEGA) software version 4.0.Mol. Biol. Evol. 24, 1596–1599. doi:10.1093/molbev/msm092
Tanaka, T., Thingstad, T. F., Christaki,U., Colombet, J., Cornet-Barthaux,V., Courties, C., et al. (2011).Lack of P-limitation of phytoplank-ton and heterotrophic prokaryotesin surface waters of three anti-cyclonic eddies in the stratifiedMediterranean Sea. Biogeosciences8, 525–538. doi: 10.5194/bg-8-525-2011
Frontiers in Microbiology | Aquatic Microbiology August 2013 | Volume 4 | Article 227 | 10
Rahav et al. Marine aphotic oxygenic dinitrogen fixation
Voss, M., Croot, P., Lochte, K., Mills,M., and Peeken, I. (2004). Patternsof nitrogen fixation along 10N in thetropical Atlantic. Geophys. Res. Lett.31. doi: 10.1029/2004gl020127
Ward, B. B., Devol, A. H., Rich, J. J.,Chang, B. X., Bulow, S. E., Naik, H.,et al. (2009). Denitrification as thedominant nitrogen loss process inthe Arabian Sea. Nature 461, 78–81.doi: 10.1038/nature08276
Weiss, R. F. (1970). Solubility of nitro-gen, oxygen and argon in water andseawater. Deep-Sea Res. 17, 721–735.
Wilson, S. T., Boettjer, D., Church,M. J., and Karl, D. M. (2012).Comparative assessment of nitro-gen fixation methodologies,conducted in the oligotrophicNorth Pacific Ocean. Appl. Environ.Microbiol. 78, 6516–6523. doi:10.1128/AEM.01146-12
Wu, J. F., Chung, S.-W., Wen, L.-S.,Liu, K.-K., Chen, Y.-L. L., Chen,H.-Y., et al. (2003). Dissolved
inorganic phosphorus, dissolvediron, and Trichodesmium in theoligotrophic South China Sea.Global Biogeochem. Cycles 17:1008.doi: 10.1029/2002GB001924
Yogev, T., Rahav, E., Bar-Zeev, E., Man-Aharonovich, D., Stambler, N.,Kress, N., et al. (2011). Is dinitrogenfixation significant in the LevantineBasin, East MediterraneanSea. Environ. Microbiol. 13,854–871. doi: 10.1111/j.1462-2920.2010.02402.x
Zehr, J. P., Bench, S. R., Carter, B. J.,Hewson, I., Niazi, F., Shi, T., et al.(2008). Globally distributed uncul-tivated oceanic N2-fixing cyanobac-teria lack oxygenic Photosystem,II. Science 322, 1110–1112. doi:10.1126/science.1165340
Zehr, J. P., Jenkins, B. D., Short, S.M., and Steward, G. F. (2003).Nitrogenase gene diversity andmicrobial community structure:a cross-system comparison.
Environ. Microbiol. 5, 539–554. doi:10.1046/j.1462-2920.2003.00451.x
Zehr, J. P., and McReynolds, L. A.(1989). Use of degenerate oligonu-cleotides for amplification ofthe nifH gene from the marinecyanobacterium Trichodesmium-thiebautii. Appl. Environ. Microbiol.55, 2522–2526.
Zehr, J. P., and Ward, B. B. (2002).Nitrogen cycling in the ocean:new perspectives on processesand paradigms. Appl. Environ.Microbiol. 68, 1015–1024. doi:10.1128/AEM.68.3.1015-1024.2002
Conflict of Interest Statement: Theauthors declare that the researchwas conducted in the absence of anycommercial or financial relationshipsthat could be construed as a potentialconflict of interest.
Received: 15 June 2013; accepted: 26 July2013; published online: 27 August 2013.
Citation: Rahav E, Bar-Zeev E, OhayonS, Elifantz H, Belkin N, Herut B,Mulholland MR and Berman-Frank I(2013) Dinitrogen fixation in aphoticoxygenated marine environments. Front.Microbiol. 4:227. doi: 10.3389/fmicb.2013.00227This article was submitted to AquaticMicrobiology, a section of the journalFrontiers in Microbiology.Copyright © 2013 Rahav, Bar-Zeev,Ohayon, Elifantz, Belkin, Herut,Mulholland and Berman-Frank. This isan open-access article distributed underthe terms of the Creative CommonsAttribution License (CC BY). The use,distribution or reproduction in otherforums is permitted, provided the orig-inal author(s) or licensor are creditedand that the original publication inthis journal is cited, in accordance withaccepted academic practice. No use,distribution or reproduction is permit-ted which does not comply with theseterms.
www.frontiersin.org August 2013 | Volume 4 | Article 227 | 11