direct and indirect causes of deforestation · south and southeast asia ... • understanding the...
TRANSCRIPT
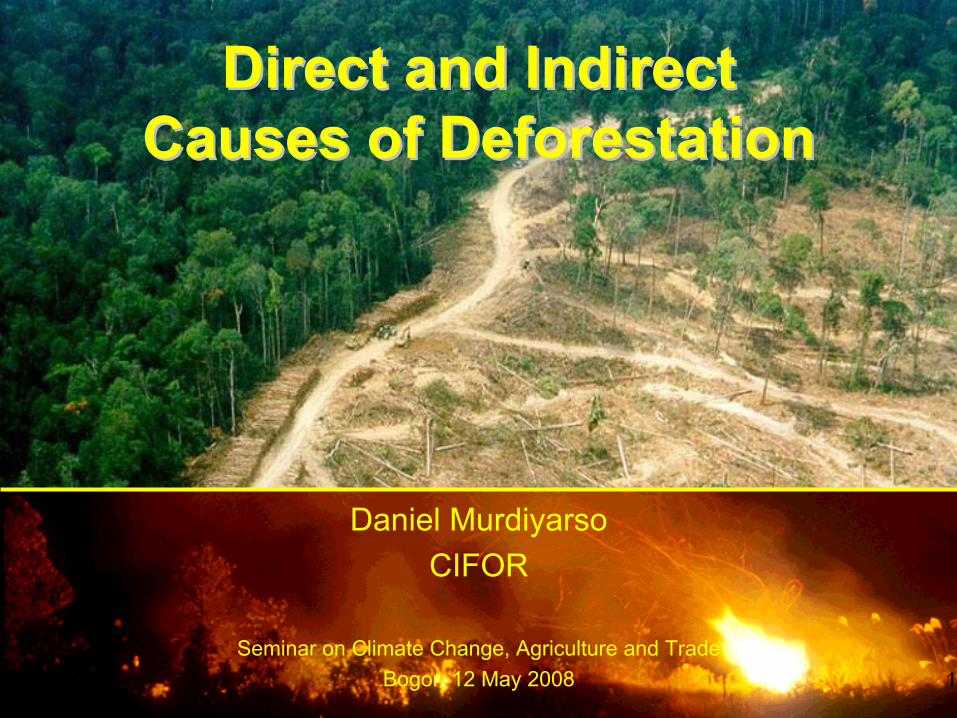
Direct and Indirect Direct and Indirect Causes of DeforestationCauses of Deforestation
Daniel MurdiyarsoCIFOR
Seminar on Climate Change, Agriculture and TradeBogor, 12 May 2008

OutlineOutline
• Introduction• Decreasing forest cover• Causes of deforestation• Challenges for biofuels development• Conclusions
• Introduction• Decreasing forest cover• Causes of deforestation• Challenges for biofuels development• Conclusions

0% 100%
tree cover threshold
Global forest cover is steadily decresing
Courtesy: Matt Hansen, S. Dakota State Univ.

• Total emissions p.a.: 7.2 GtC (27 Gt CO2)Fossil fuels: 5.6 GtC (21 Gt CO2) LUCF: 1.6 GtC (6 Gt CO2)
• Deforestation contributes: 20% • Forest area: 1.3 Bha • Deforestation rate: 11 Mha/y (1%/y)• Deforestation contributes: 0.25%/y to soybeans
6%/y to oil palm
• Total emissions p.a.: 7.2 GtC (27 Gt CO2)Fossil fuels: 5.6 GtC (21 Gt CO2) LUCF: 1.6 GtC (6 Gt CO2)
• Deforestation contributes: 20% • Forest area: 1.3 Bha • Deforestation rate: 11 Mha/y (1%/y)• Deforestation contributes: 0.25%/y to soybeans
6%/y to oil palm
Some numbersSome numbers

C-emissions from LUC in the tropics (million tons)
C-emissions from LUC in the tropics (million tons)
0
200
400
600
800
1000
1200
1400
18501865
18801895
19101925
19401955
19701985
2000
South and Southeast Asia
South and Central America
Sub-Saharan Africa
Source:. Houghton (2004)

Deforestation rates in IndonesiaDeforestation rates in IndonesiaImage and
DateForest cover
Deforestation rate (Mha/yr)
Reference
LANDSAT1997
95,843,088 1.7 Holmes (1999)
LANDSAT1998
95,628,800 1.8 WRI-FWI-GFW (1999)
SPOT vegetation2000
103,793,886 1.2 JRC/EU (2000)

Land-based emissionsLand-based emissions
(1,000)
(500)
0
500
1,000
1,500
2,000
2,500
3,000
United States China Indonesia Brazil Russia
MtCO2e
Agriculture Forestry
Source: PEACE (2007)

Peatland drainage and fires
Subsidence = = Subsidence
Water table
Drainage canal
CO2 emissions
Evapotranspiration
Evaporation
Fire Fire
Fire
Oxidation +Compaction
Oxidation +Compaction
∪<><
<><
<><

When enough is enoughWhen enough is enough
24% of deforestation29% of deforestation
17% of deforestation
24% of deforestation29% of deforestation
17% of deforestation
Source: http://www.panda.org/news_facts/newsroom/index.cfm?uNewsID=125741
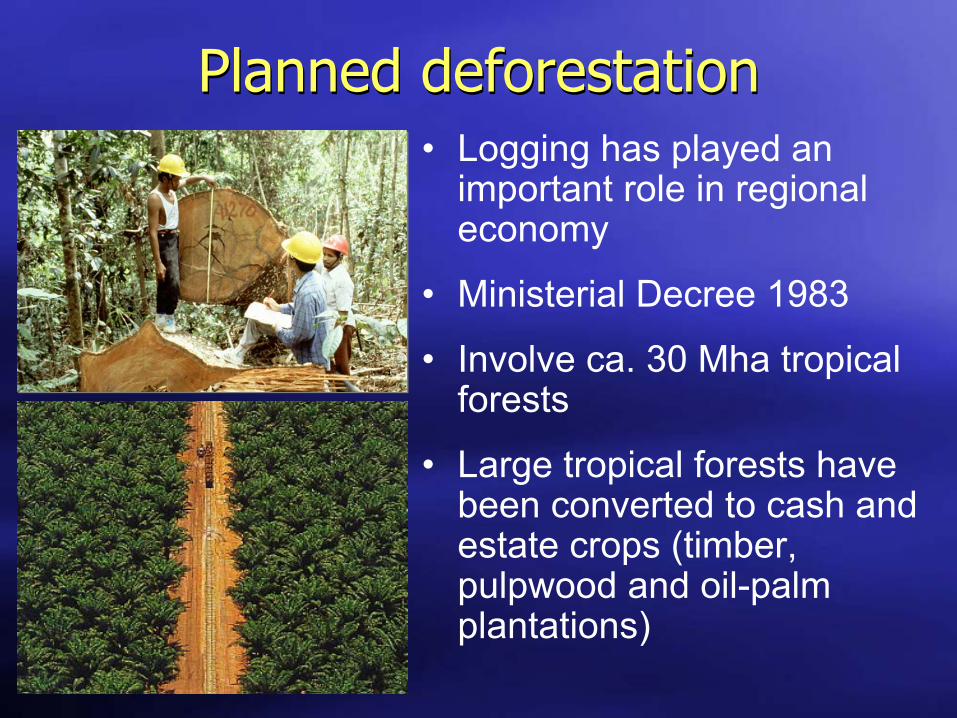
Planned deforestationPlanned deforestation• Logging has played an
important role in regional economy
• Ministerial Decree 1983
• Involve ca. 30 Mha tropical forests
• Large tropical forests have been converted to cash and estate crops (timber, pulpwood and oil-palm plantations)
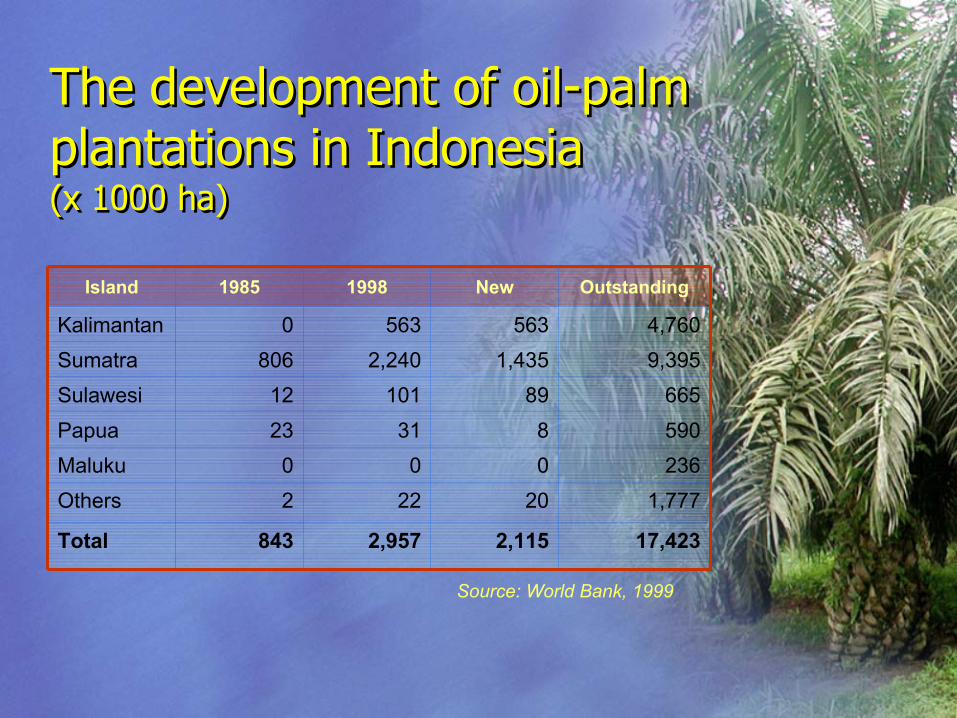
The development of oil-palm plantations in Indonesia(x 1000 ha)
The development of oil-palm plantations in Indonesia(x 1000 ha)
Island 1985 1998 New Outstanding
Kalimantan 0 563 563 4,760Sumatra 806 2,240 1,435 9,395Sulawesi 12 101 89 665Papua 23 31 8 590Maluku 0 0 0 236Others 2 22 20 1,777
Total 843 2,957 2,115 17,423
Source: World Bank, 1999

Biofuels development Biofuels development • Is it really green or climate neutral?• Oil palm plantations often result in forest
conversions (including peatlands) and thus increase emissions
• Can we avoid deforestation while promoting biofuels?
• Is it really green or climate neutral?• Oil palm plantations often result in forest
conversions (including peatlands) and thus increase emissions
• Can we avoid deforestation while promoting biofuels?

Net effect on climate changeNet effect on climate change
(Cf - Cop)Compensation point = --------------------------------------------------------------------
(12/44) * (CO2eq,min-die - (fcal * CO2eq,bio-die-a)) * YLD
Danielsen et al., Forthcoming
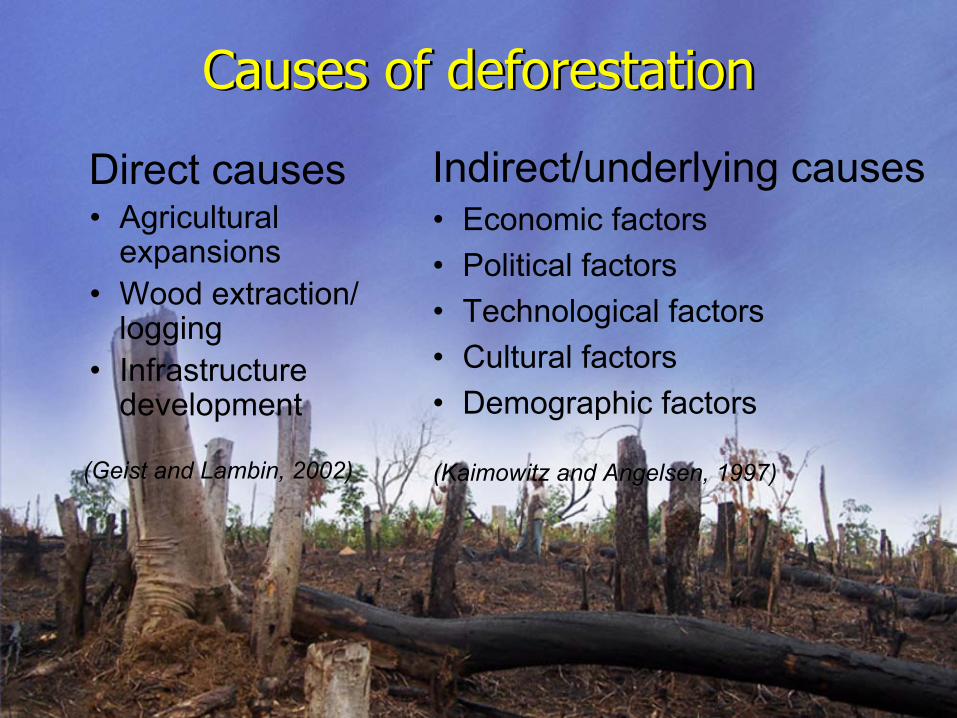
Causes of deforestationCauses of deforestation
Direct causes• Agricultural
expansions• Wood extraction/
logging• Infrastructure
development
(Geist and Lambin, 2002)
Indirect/underlying causes• Economic factors• Political factors • Technological factors• Cultural factors• Demographic factors
(Kaimowitz and Angelsen, 1997)

Unsustainable wood extractionUnsustainable wood extraction• Poor logging practices in
“legal” concessions • Illegal logging• Debris left behind fuels
forest fires
• Poor logging practices in “legal” concessions
• Illegal logging• Debris left behind fuels
forest fires

Infrastructure developmentInfrastructure development
• Road construction• Provides access for timber extraction,
conversion, and settlement
• Road construction• Provides access for timber extraction,
conversion, and settlement

Economic: Market failuresEconomic: Market failures• Commodity prices continue to rise• Carbon, biodiversity, water and other ecosystem
services remain underpriced
• Commodity prices continue to rise• Carbon, biodiversity, water and other ecosystem
services remain underpriced
Source: Roberts (2007)

Political: Governance failuresPolitical: Governance failures• Unclear property rights• Overlapping jurisdictions • Non-transparent decision-making• Weak law enforcement and judicial systems
• Unclear property rights• Overlapping jurisdictions • Non-transparent decision-making• Weak law enforcement and judicial systems
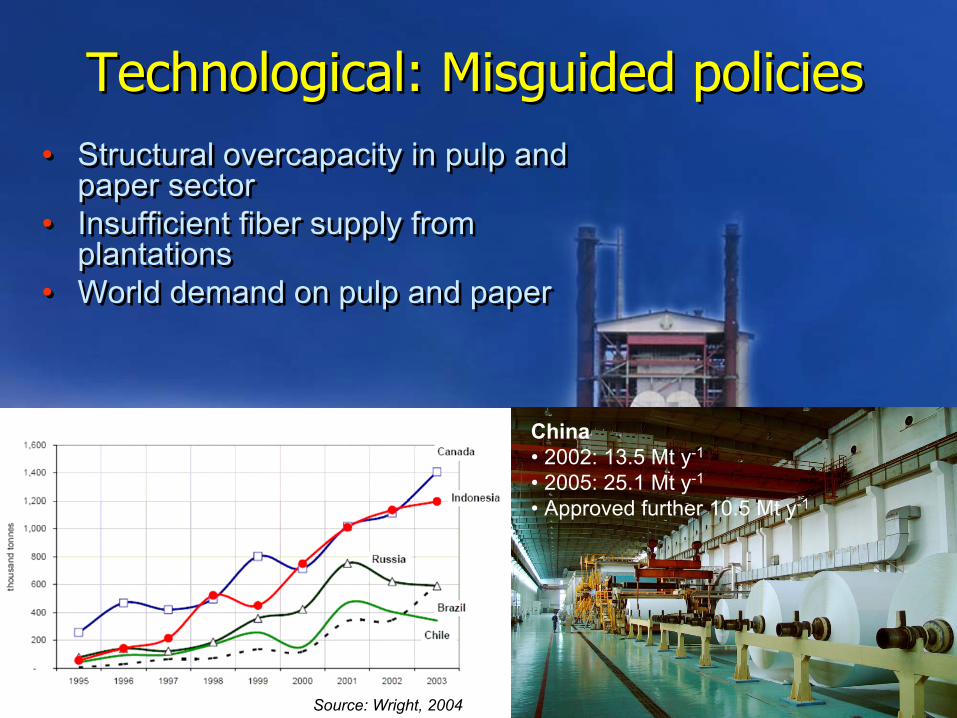
Technological: Misguided policiesTechnological: Misguided policies• Structural overcapacity in pulp and
paper sector• Insufficient fiber supply from
plantations• World demand on pulp and paper
• Structural overcapacity in pulp and paper sector
• Insufficient fiber supply from plantations
• World demand on pulp and paper
Source: Wright, 2004
China• 2002: 13.5 Mt y-1
• 2005: 25.1 Mt y-1
• Approved further 10.5 Mt y-1

Challenges for biofuelsChallenges for biofuels• The EU target for biofuels in the transport
sector is 5.7 percent by 2010 and 10 percent by 2020
• To what extent is biofuels development leading to the loss of forests and associated ES, such as water and bioD?
• Under what circumstances can the transition from fossil fuels to biofuels be consistent with broader SD objectives, incl. poverty reduction?
• How will biofuel crops displace domestic food production and affect food prices?
• Strong policies and standards/ certification procedures are needed
• The EU target for biofuels in the transport sector is 5.7 percent by 2010 and 10 percent by 2020
• To what extent is biofuels development leading to the loss of forests and associated ES, such as water and bioD?
• Under what circumstances can the transition from fossil fuels to biofuels be consistent with broader SD objectives, incl. poverty reduction?
• How will biofuel crops displace domestic food production and affect food prices?
• Strong policies and standards/ certification procedures are needed

Concluding RemarksConcluding Remarks
• There is a clear linkages between deforestation and world’s demands of fiber, food, and fuel
• Understanding the underlying or indirect causes of deforestation is crucial to address REDD and climate change
• Most deforestation is driven from outside forestry sector (e.g. palm-oil and pulp & paper)
• Land-use policies and spatial planning should consider carbon-rich ecosystems (e.g. peatlands)