direct and indirect plasma technologies for nox/sox …€¦ · direct and indirect plasma...
TRANSCRIPT
Part-financed by the European Union (European Regional Development Fund
Direct and Indirect Plasma Technologies for NOx/SOx reduction
E. Stamate
Acknowledgements: W. Chen, A. Fateev, P. K. Michelsen,
L. Jørgensen* and T. Jensen*
Risø National Laboratory for Sustainable Energy
Technical University of Denmark
*Danish Gas Technology Centre, Denmark

Outline and motivation
Introduction
NOx reduction mechanism and gas kinetic model
Experimental setup – power-plant-scale reactor
Correlation of IR and UV measurements with simulations
Effect of water droplets, temperature profile and temperature gradient
Biomass power plants
Conclusions
MOTIVATION
Evaluate and optimize the low temperature
oxidation in real experimental conditions including
complex measurements and cost estimations
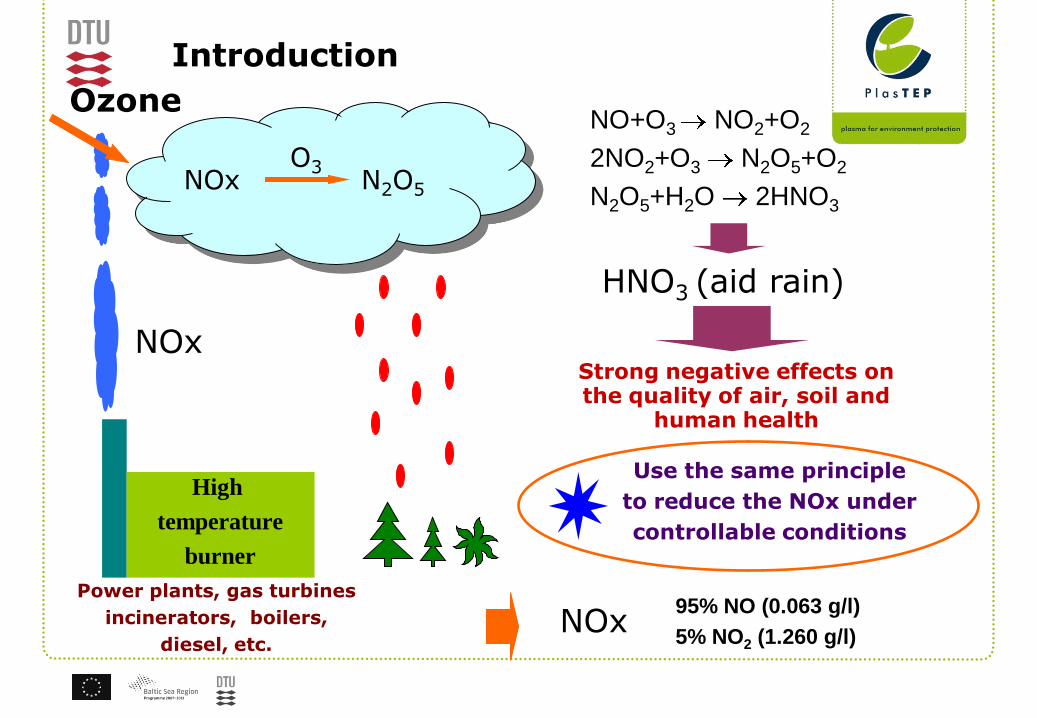
Ozone
High
temperature
burner
NOx
NOx N2O5
O3
NO+O3 NO2+O2
2NO2+O3 N2O5+O2
N2O5+H2O 2HNO3
HNO3 (aid rain)
95% NO (0.063 g/l)
5% NO2 (1.260 g/l)
Introduction
Strong negative effects on the quality of air, soil and
human health
NOxPower plants, gas turbines
incinerators, boilers,
diesel, etc.
Use the same principle
to reduce the NOx under
controllable conditions
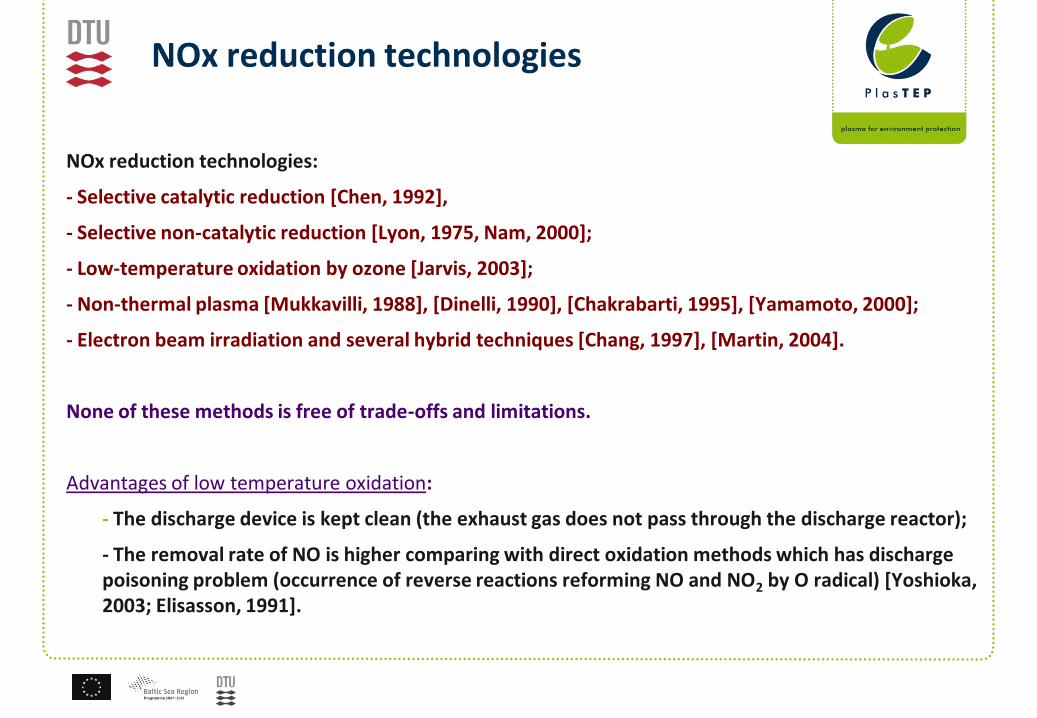
NOx reduction technologies
NOx reduction technologies:
- Selective catalytic reduction [Chen, 1992],
- Selective non-catalytic reduction [Lyon, 1975, Nam, 2000];
- Low-temperature oxidation by ozone [Jarvis, 2003];
- Non-thermal plasma [Mukkavilli, 1988], [Dinelli, 1990], [Chakrabarti, 1995], [Yamamoto, 2000];
- Electron beam irradiation and several hybrid techniques [Chang, 1997], [Martin, 2004].
None of these methods is free of trade-offs and limitations.
Advantages of low temperature oxidation:
- The discharge device is kept clean (the exhaust gas does not pass through the discharge reactor);
- The removal rate of NO is higher comparing with direct oxidation methods which has discharge poisoning problem (occurrence of reverse reactions reforming NO and NO2 by O radical) [Yoshioka, 2003; Elisasson, 1991].

Chemical reaction model
NO2NO
N2O3
Nitrogen network
NO3
N2O5
N2O4
HNO2
HNO3
=
O
O3
NO
HNO2
O
O2
O3
O, O2O3
=, O, O3
Loss channels:
• O3 decays in gas
and at walls
• O(3P) recombination
at walls
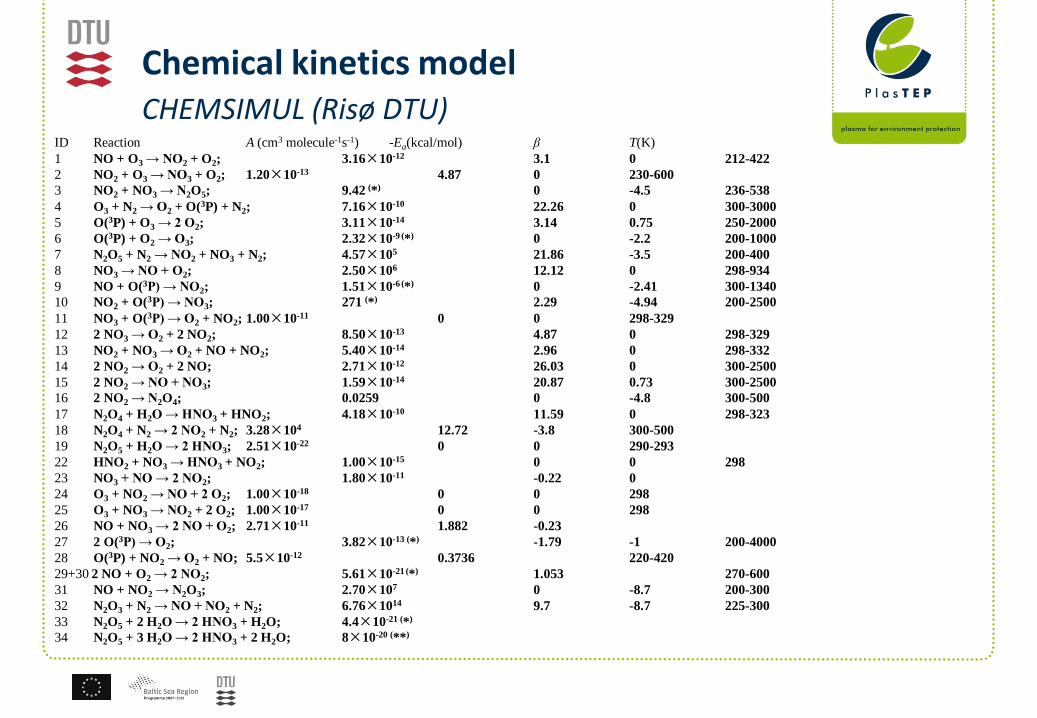
Chemical kinetics model CHEMSIMUL (Risø DTU)
ID Reaction A (cm3 molecule-1s-1) -Ea(kcal/mol) β T(K)
1 NO + O3 → NO2 + O2; 3.16×10⁻¹² 3.1 0 212-422
2 NO2 + O3 → NO3 + O2; 1.20×10⁻¹³ 4.87 0 230-600
3 NO2 + NO3 → N2O5; 9.42 (*) 0 -4.5 236-538
4 O3 + N2 → O2 + O(3P) + N2; 7.16×10⁻¹⁰ 22.26 0 300-3000
5 O(3P) + O3 → 2 O2; 3.11×10⁻¹⁴ 3.14 0.75 250-2000
6 O(3P) + O2 → O3; 2.32×10⁻⁹ (*) 0 -2.2 200-1000
7 N2O5 + N2 → NO2 + NO3 + N2; 4.57×10⁵ 21.86 -3.5 200-400
8 NO3 → NO + O2; 2.50×10⁶ 12.12 0 298-934
9 NO + O(3P) → NO2; 1.51×10⁻⁶ (*) 0 -2.41 300-1340
10 NO2 + O(3P) → NO3; 271 (*) 2.29 -4.94 200-2500
11 NO3 + O(3P) → O2 + NO2; 1.00×10⁻¹¹ 0 0 298-329
12 2 NO3 → O2 + 2 NO2; 8.50×10⁻¹³ 4.87 0 298-329
13 NO2 + NO3 → O2 + NO + NO2; 5.40×10⁻¹⁴ 2.96 0 298-332
14 2 NO2 → O2 + 2 NO; 2.71×10⁻¹² 26.03 0 300-2500
15 2 NO2 → NO + NO3; 1.59×10⁻¹⁴ 20.87 0.73 300-2500
16 2 NO2 → N2O4; 0.0259 0 -4.8 300-500
17 N2O4 + H2O → HNO3 + HNO2; 4.18×10⁻¹⁰ 11.59 0 298-323
18 N2O4 + N2 → 2 NO2 + N2; 3.28×10⁴ 12.72 -3.8 300-500
19 N2O5 + H2O → 2 HNO3; 2.51×10⁻²² 0 0 290-293
22 HNO2 + NO3 → HNO3 + NO2; 1.00×10⁻¹⁵ 0 0 298
23 NO3 + NO → 2 NO2; 1.80×10⁻¹¹ -0.22 0
24 O3 + NO2 → NO + 2 O2; 1.00×10⁻¹⁸ 0 0 298
25 O3 + NO3 → NO2 + 2 O2; 1.00×10⁻¹⁷ 0 0 298
26 NO + NO3 → 2 NO + O2; 2.71×10⁻¹¹ 1.882 -0.23
27 2 O(3P) → O2; 3.82×10⁻¹³ (*) -1.79 -1 200-4000
28 O(3P) + NO2 → O2 + NO; 5.5×10⁻¹² 0.3736 220-420
29+30 2 NO + O2 → 2 NO2; 5.61×10⁻²¹ (*) 1.053 270-600
31 NO + NO2 → N2O3; 2.70×10⁷ 0 -8.7 200-300
32 N2O3 + N2 → NO + NO2 + N2; 6.76×10¹⁴ 9.7 -8.7 225-300
33 N2O5 + 2 H2O → 2 HNO3 + H2O; 4.4×10⁻²¹ (*)
34 N2O5 + 3 H2O → 2 HNO3 + 2 H2O; 8×10-20 (**)
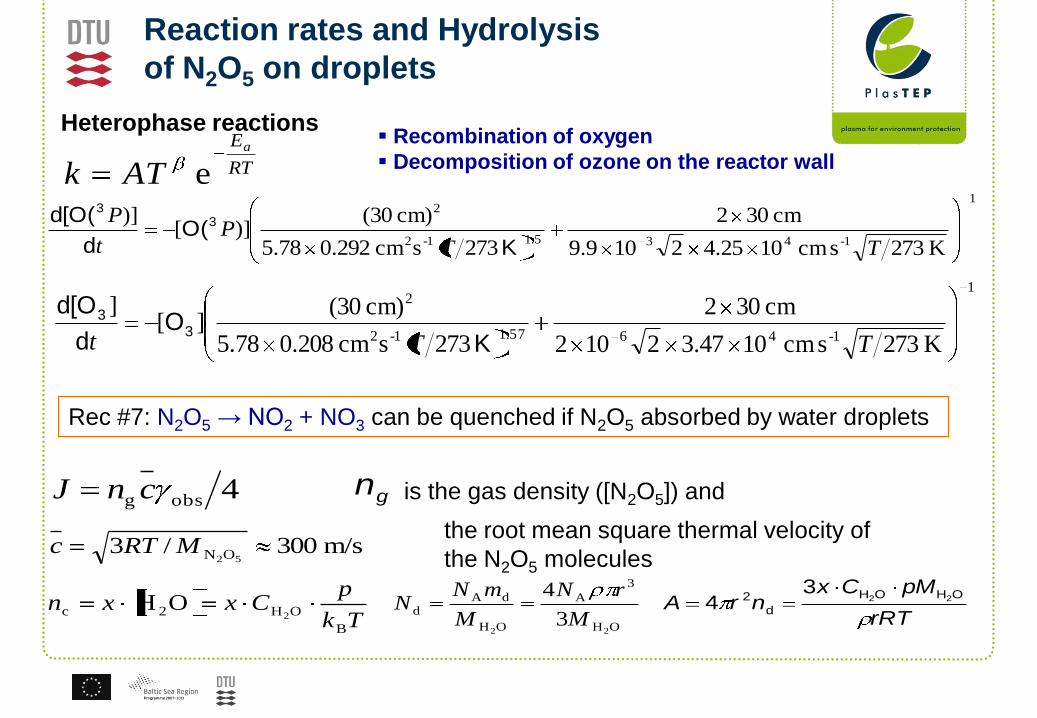
Heterophase reactions
RT
Ea
ATk e
Reaction rates and Hydrolysis
of N2O5 on droplets
Recombination of oxygen
Decomposition of ozone on the reactor wall
1
1-435.11-2
2
K 273s cm 1025.42109.9
cm 302
273scm 292.078.5
cm) 30()][
)]
TTP
t
P
KO(
d
d[O( 33
1
1-4657.11-2
2
K 273s cm 1047.32102
cm 302
273scm 208.078.5
cm) 30(][
]
TTt KO
d
d[O3
3
Rec #7: N2O5 → NO2 + NO3 can be quenched if N2O5 absorbed by water droplets
4obsg cnJ is the gas density ([N2O5]) and gn
m/s 300/352ONMRTc
the root mean square thermal velocity of
the N2O5 molecules
Tk
pCxxn
B
OH2c 2OH
OH
3
A
OH
dAd
223
4
M
rN
M
mNN
rRT
pMCxnrA
OHOH
d
2 223
4
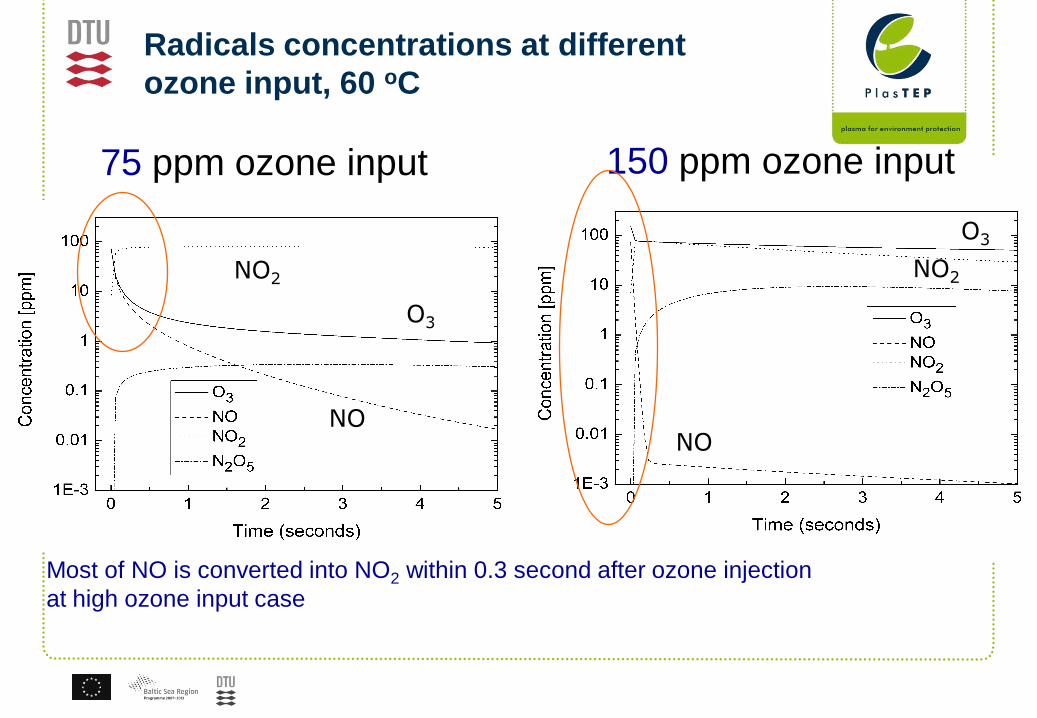
Radicals concentrations at different
ozone input, 60 oC
75 ppm ozone input 150 ppm ozone input
Most of NO is converted into NO2 within 0.3 second after ozone injection
at high ozone input case
NO2
NO
O3
NO
O3
NO2
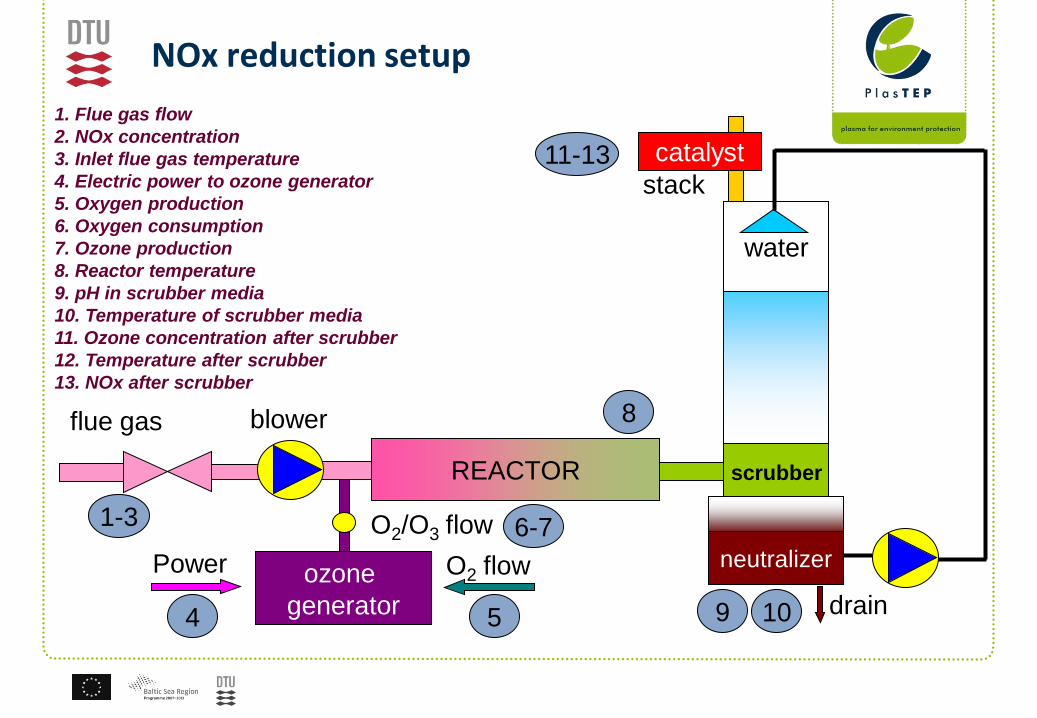
NOx reduction setup
REACTOR scrubber
neutralizer
water
catalyst
flue gas blower
drain
ozone
generator
Power O2 flow
O2/O3 flow1-3
4 5
6-7
8
9 10
11-13stack
1. Flue gas flow
2. NOx concentration
3. Inlet flue gas temperature
4. Electric power to ozone generator
5. Oxygen production
6. Oxygen consumption
7. Ozone production
8. Reactor temperature
9. pH in scrubber media
10. Temperature of scrubber media
11. Ozone concentration after scrubber
12. Temperature after scrubber
13. NOx after scrubber

ReactorNOx
10 cm
35 cm
= 60 cm200 cm
20 cm Lens
UV lamp
SpectrometerCCD camera
120
cm
50
cm
80 cm
80
cm
Detector
Details on experimental set-up
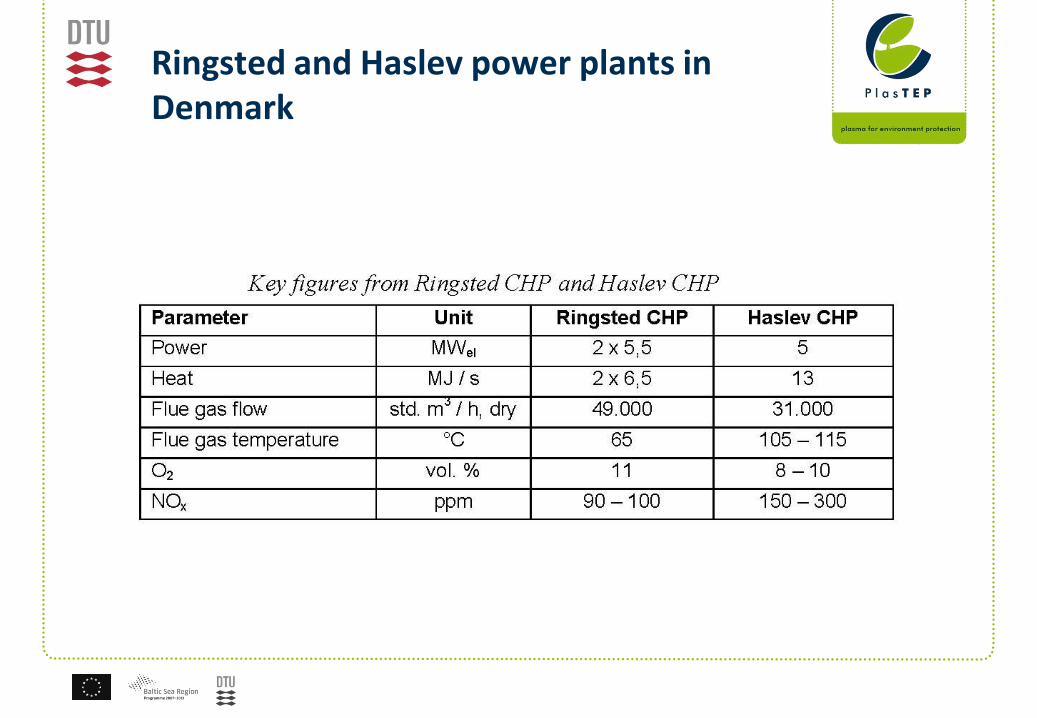
Ringsted and Haslev power plants in Denmark

Two container arrangement
Control
PC
SCB
O3
room
NOx
500 cm
Reactor
Ozone generator
SMO 300 S (WEDECO) :
2.64 kg O3 controllable
from 10% up to 100%
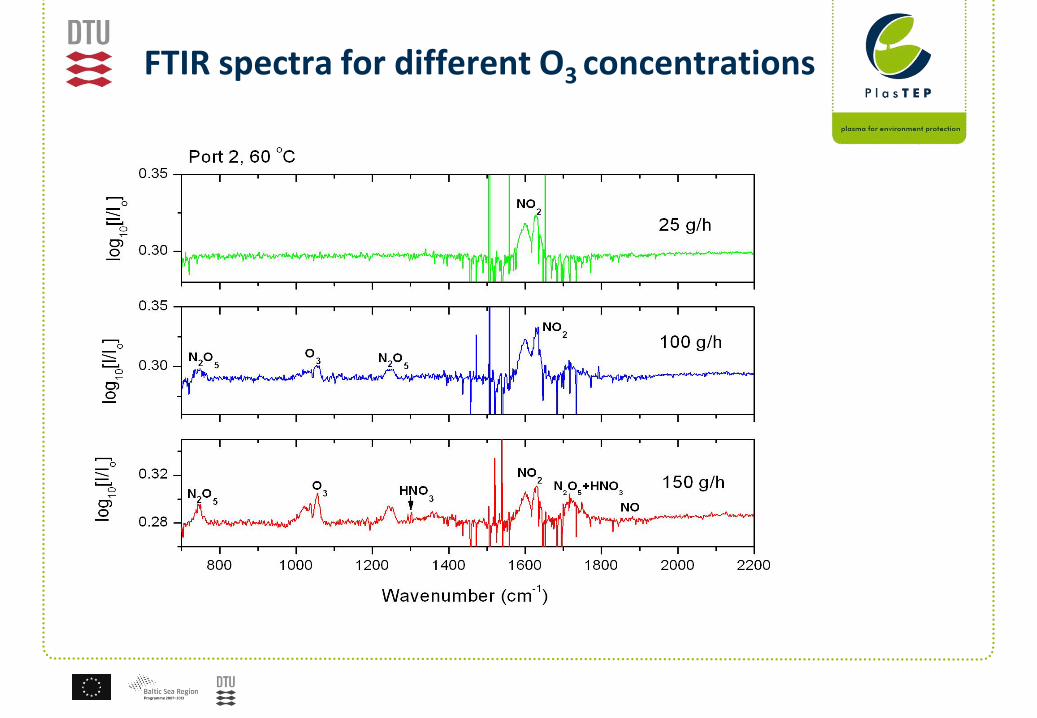
FTIR spectra for different O3 concentrations
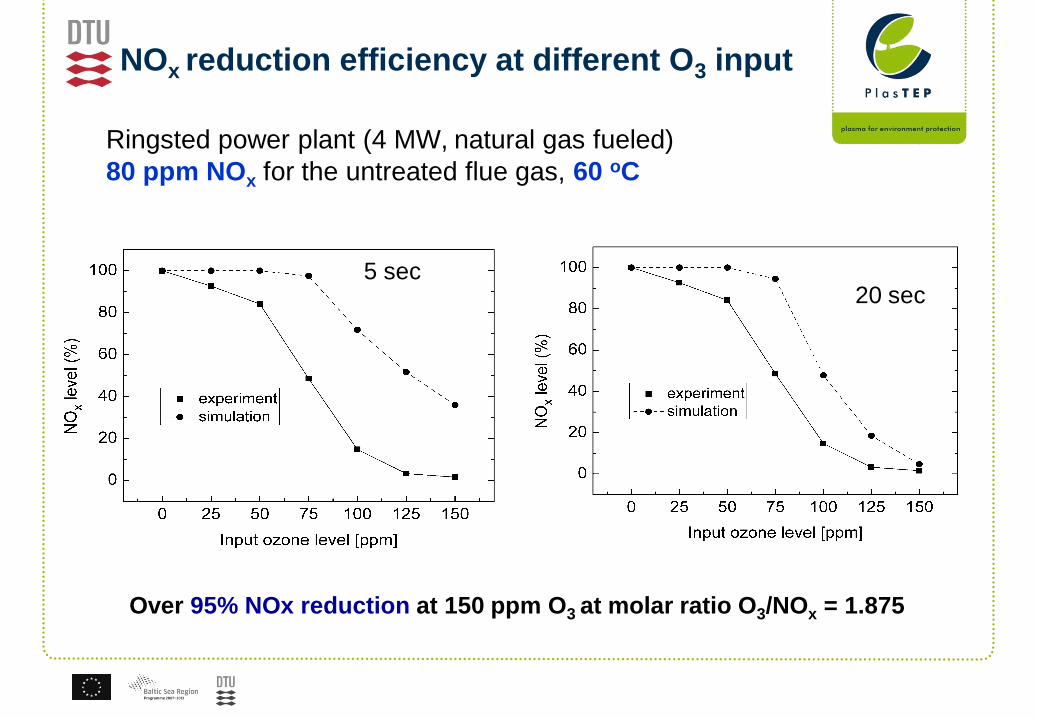
NOx reduction efficiency at different O3 input
Ringsted power plant (4 MW, natural gas fueled)
80 ppm NOx for the untreated flue gas, 60 oC
Over 95% NOx reduction at 150 ppm O3 at molar ratio O3/NOx = 1.875
5 sec20 sec

UV
Remained ozone levels by FTIR and UV
Ozone measurements by both FTIR and UV are consistent with simulation
5 sec
1 sec
FTIR
5 sec
1 sec
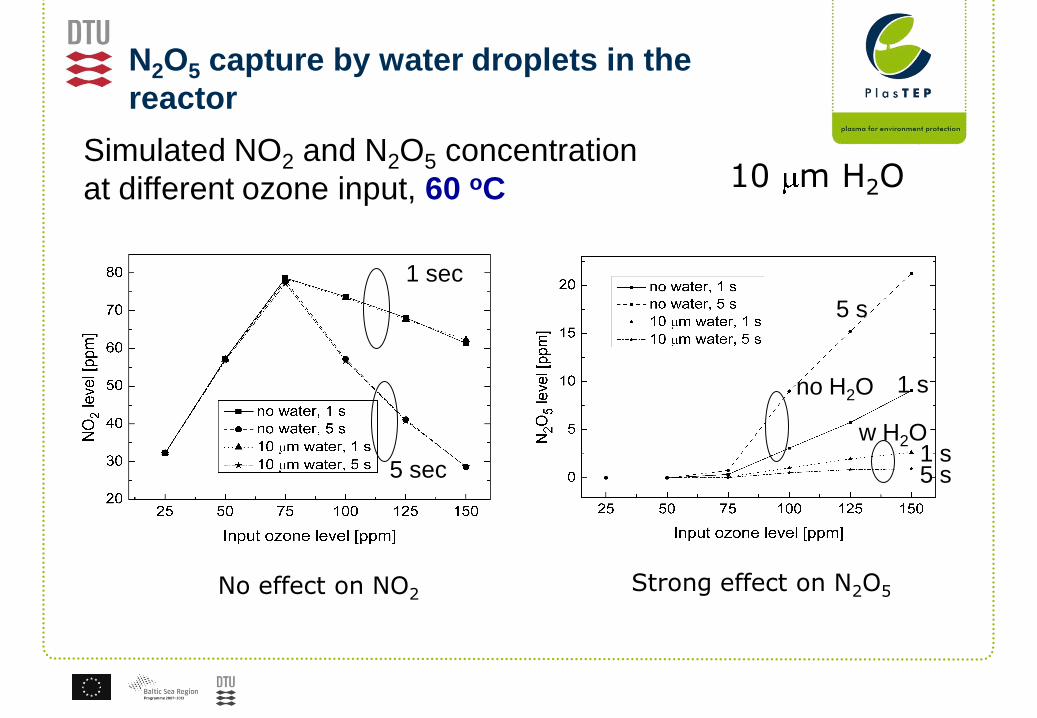
Simulated NO2 and N2O5 concentration
at different ozone input, 60 oC
N2O5 capture by water droplets in the
reactor
1 sec
5 sec
No effect on NO2
w H2O
no H2O 1 s
5 s
1 s5 s
Strong effect on N2O5
10 m H2O

NO2 and N2O5 at different ozone input, 60 oC
100 m water droplets simulation in the reactor shows
best fitting with measurement
100 m H2O
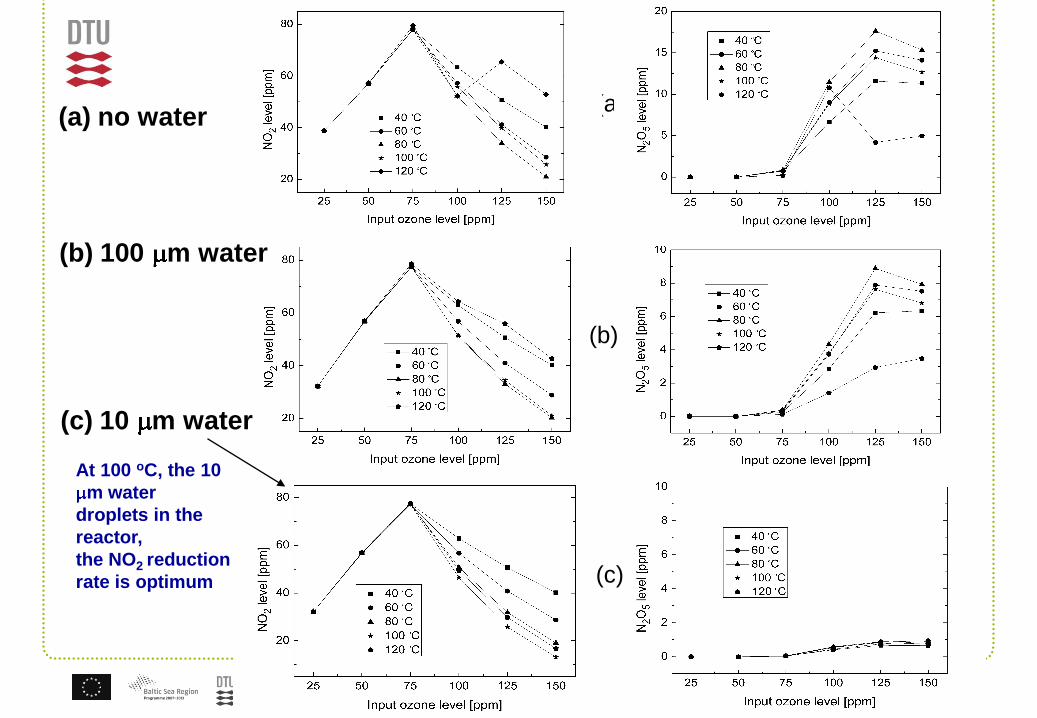
(a) no water
(b) 100 m water
(c) 10 m water
(a)
(b)
(c)
At 100 oC, the 10
m water
droplets in the
reactor,
the NO2 reduction
rate is optimum
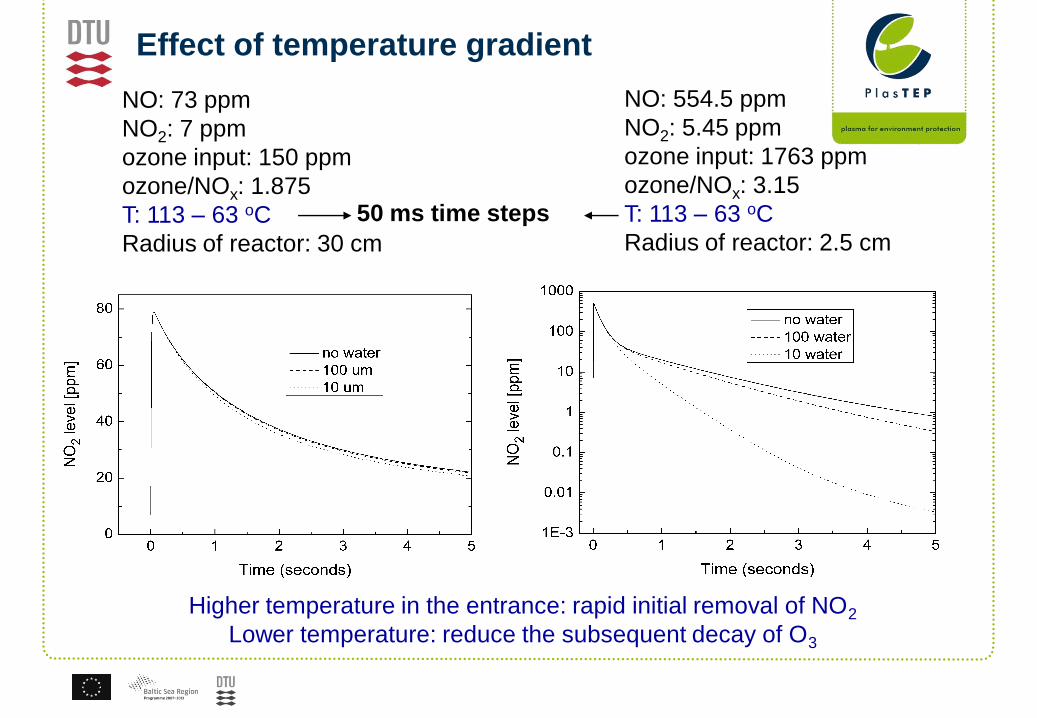
NO: 73 ppm
NO2: 7 ppm
ozone input: 150 ppm
ozone/NOx: 1.875
T: 113 – 63 oC
Radius of reactor: 30 cm
NO: 554.5 ppm
NO2: 5.45 ppm
ozone input: 1763 ppm
ozone/NOx: 3.15
T: 113 – 63 oC
Radius of reactor: 2.5 cm
Effect of temperature gradient
Higher temperature in the entrance: rapid initial removal of NO2
Lower temperature: reduce the subsequent decay of O3
50 ms time steps
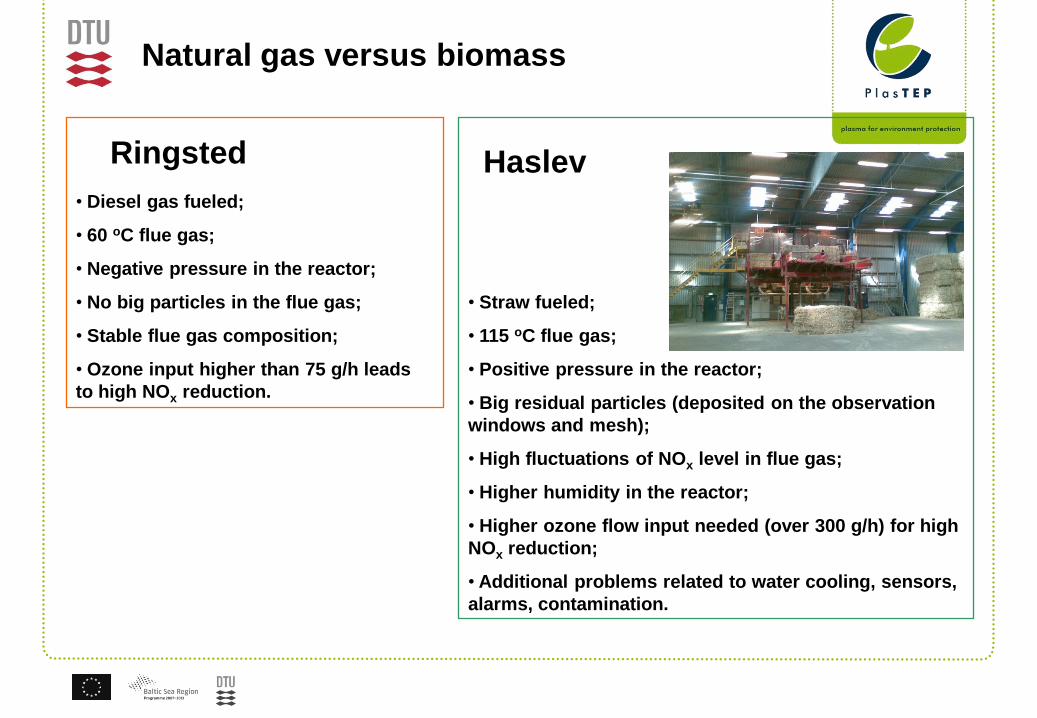
• Diesel gas fueled;
• 60 oC flue gas;
• Negative pressure in the reactor;
• No big particles in the flue gas;
• Stable flue gas composition;
• Ozone input higher than 75 g/h leads
to high NOx reduction.
Ringsted
Natural gas versus biomass
• Straw fueled;
• 115 oC flue gas;
• Positive pressure in the reactor;
• Big residual particles (deposited on the observation
windows and mesh);
• High fluctuations of NOx level in flue gas;
• Higher humidity in the reactor;
• Higher ozone flow input needed (over 300 g/h) for high
NOx reduction;
• Additional problems related to water cooling, sensors,
alarms, contamination.
Haslev
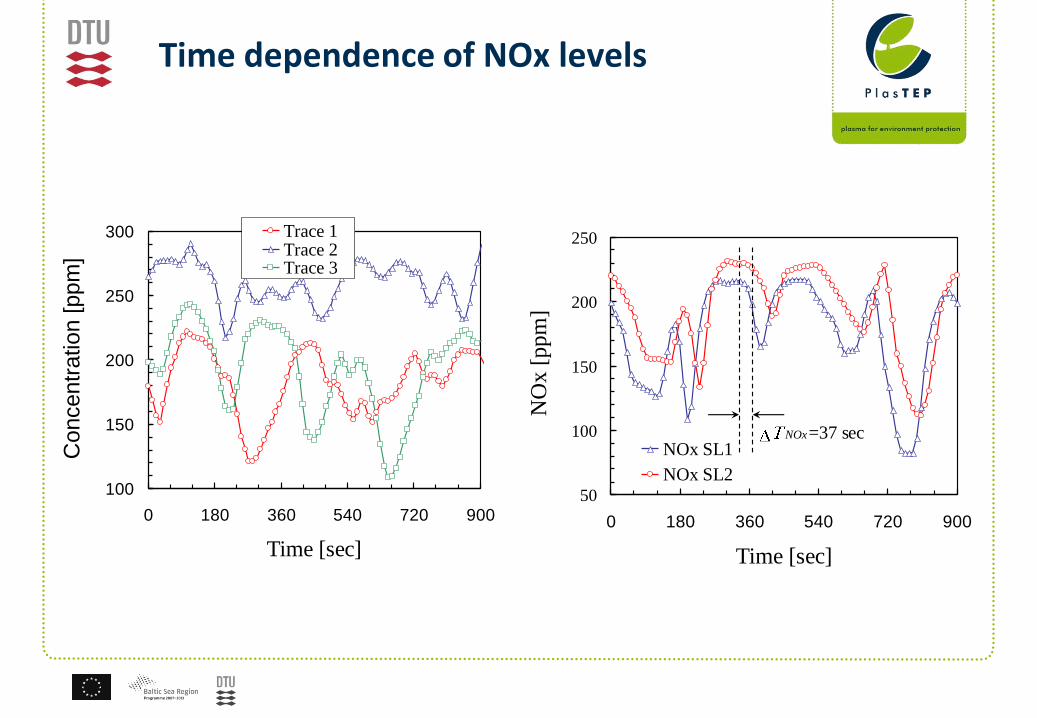
Time dependence of NOx levels
100
150
200
250
300
0 180 360 540 720 900
Time [sec]
Concentr
ation [ppm
]
Trace 1Trace 2Trace 3
50
100
150
200
250
0 180 360 540 720 900
Time [sec]N
Ox
[p
pm
]
NOx SL1
NOx SL2
NOx=37 sec

Time delays in NOx reduction - biomass
TO3
TNOx
T1T2
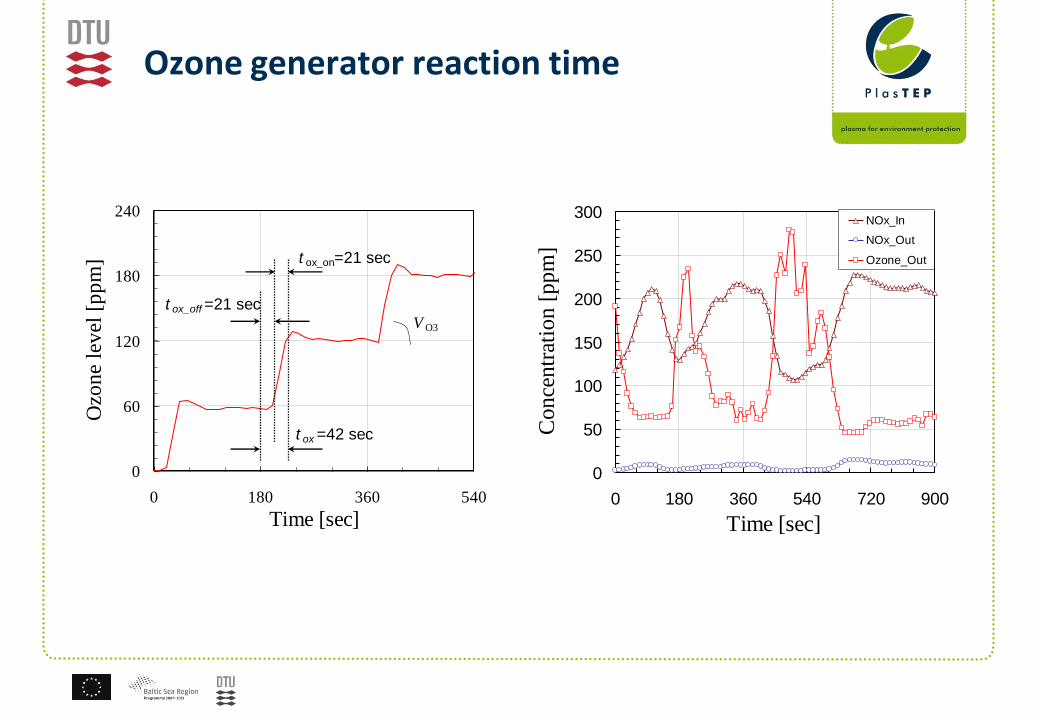
Ozone generator reaction time
0
60
120
180
240
0 180 360 540
Time [sec]
Ozo
ne
lev
el [
pp
m] t ox_on=21 sec
t ox_off =21 sec
t ox =42 sec
V O3
0
50
100
150
200
250
300
0 180 360 540 720 900
Time [sec]C
once
ntr
atio
n [
ppm
]
NOx_In
NOx_Out
Ozone_Out
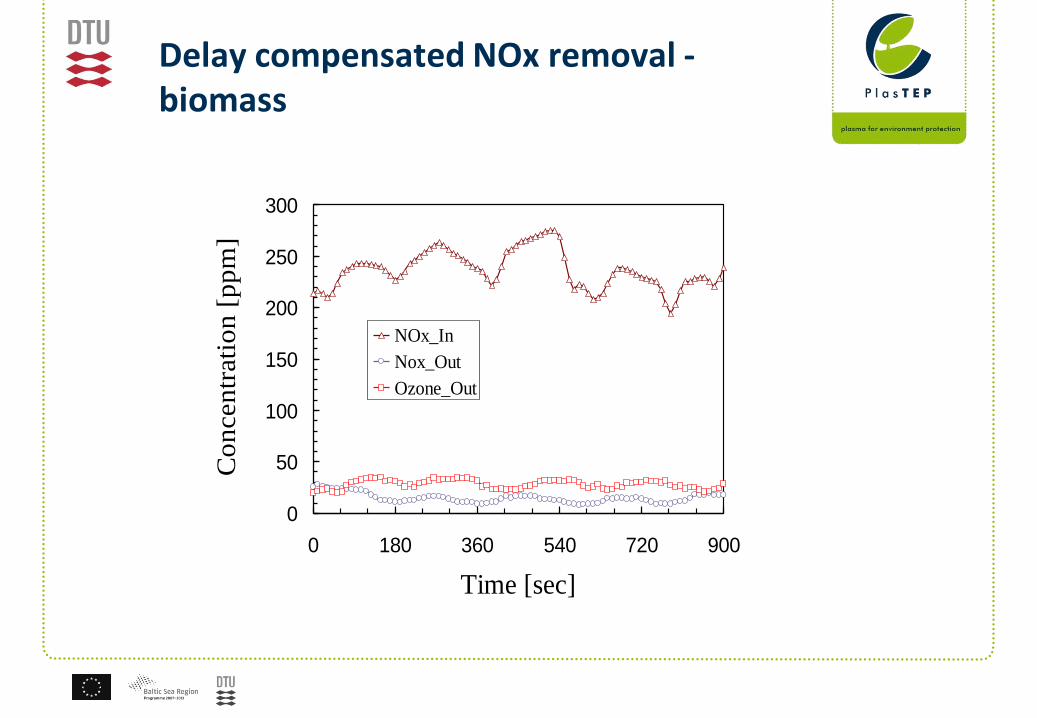
Delay compensated NOx removal -biomass
0
50
100
150
200
250
300
0 180 360 540 720 900
Time [sec]
Co
ncen
trati
on
[p
pm
]
NOx_In
Nox_Out
Ozone_Out

Ozone consumption and cost
Conclusions
- NOx reduction by Ozone can be done with an efficiency higher than 95%
- Water droplets ca improve the removal efficiency but result in N2O5 capture in the reactor
- NOx reduction in biomass power plants needs additional settings to compensate delays in ozone delivery
Disadvantages NOx versus catalytic reduction
- More complicated physical design
- Need for pH regulating chemicals
- Waste water issues
- Space requirements
- Environmental and safety aspects of producing and using ozone

Advantages for ozone injection method
- Positive income from fertilizer or hydrochloric acid production.
- The plasma deNOx process also removes formaldehyde and SO2, so reduces the need for an oxidation catalyst on gas engine plants and reduces SO2 taxes on biomass plants.
- On biomass plants with bag filters, e.g. straw fired plants, the scrubber can utilize the latent heat in the flue gas by cooling the flue gas from e.g. 120 °C to 70 °C and increasing the efficiency of the CHP plant.
- Some CHP or district heating plants operate with a very cold temperature of the return water, around 45 °C, from the district heating system, which permits the deNOx plant to operate as part of a condensation step utilizing even more energy from the flue gas.
- No need for storage and handling of ammonia as needed with the SCR technology.