direct testimony of david a. schlissel on behalf of …
TRANSCRIPT

Public - Protected Materials Redacted
BEFORE THE MISSISSIPPI PUBLIC SERVICE COMMISSION
In RE: Petition of Mississippi Power Company for a Certificate of Public Convenience and Necessity Authorizing the Acquisition, Construction, and Operation of an Electric Generating Plant, Associated Transmission Facilities, Associated Gas Pipeline Facilities, Associated Rights-of-Way, and Related Facilities in Kemper, Lauderdale, Clarke, and Jasper Counties, Mississippi
)))))))
DOCKET NO. 2009-UA-014
DIRECT TESTIMONY OF DAVID A. SCHLISSEL ON BEHALF OF
THE SIERRA CLUB
PUBLIC VERSION PROTECTED MATERIALS REDACTED
DECEMBER 7, 2009

Public - Protected Materials Redacted
List of Exhibits Exhibit … (DAS-1) Current Resume for David A. Schlissel
Exhibit … (DAS-2) Synapse 2008 CO2 Price Forecasts, July 2008.
Exhibit … (DAS-3) Report and Recommendation Concerning the Little Gypsy Unit 3 Repowering Project, submitted by Entergy Louisiana to the Louisiana Public Service Commission, April 1, 2009,
Exhibit … (DAS-4) Coal-Fired Power Plant Construction Costs, October 2008.
Kemper County IGCC MPSC Docket No. 2009-UA-014 Direct Testimony of David A. Schlissel
Public - Protected Materials Redacted
Page 1
1. Introduction 1
Q. What are your name, position and business address? 2
A. My name is David A. Schlissel. I am a Senior Consultant at Synapse Energy 3
Economics, Inc, 22 Pearl Street, Cambridge, MA 02139. 4
Q. Please describe Synapse Energy Economics. 5
A. Synapse Energy Economics ("Synapse") is a research and consulting firm 6
specializing in energy and environmental issues, including electric generation, 7
transmission and distribution system reliability, market power, electricity market 8
prices, stranded costs, efficiency, renewable energy, environmental quality, and 9
nuclear power. 10
Synapse’s clients include state consumer advocates, public utilities commission 11
staff, attorneys general, environmental organizations, federal government, state 12
governments and utilities. A complete description of Synapse is available at our 13
website, www.synapse-energy.com. 14
Q. Please summarize your educational background and recent work experience. 15
A. I graduated from the Massachusetts Institute of Technology in 1968 with a 16
Bachelor of Science Degree in Engineering. In 1969, I received a Master of 17
Science Degree in Engineering from Stanford University. In 1973, I received a 18
Law Degree from Stanford University. In addition, I studied nuclear engineering 19
at the Massachusetts Institute of Technology during the years 1983-1986. 20
Since 1983 I have been retained by governmental bodies, publicly-owned utilities, 21
and private organizations in 28 states to prepare expert testimony and analyses on 22
engineering and economic issues related to electric utilities. My recent clients 23
have included the General Staff of the Arkansas Public Service Commission, the 24
U.S. Department of Justice, the Attorney General of the State of New York, cities 25
and towns in Connecticut, New York and Virginia, state consumer advocates, and 26
national and local environmental organizations. 27

Kemper County IGCC MPSC Docket No. 2009-UA-014 Direct Testimony of David A. Schlissel
Public - Protected Materials Redacted
Page 2
I have testified before state regulatory commissions in Arizona, New Jersey, 1
California, Connecticut, Kansas, Texas, New Mexico, New York, Vermont, North 2
Carolina, South Carolina, Maine, Illinois, Indiana, Ohio, Massachusetts, Missouri, 3
Rhode Island, Wisconsin, Iowa, South Dakota, Georgia, Minnesota, Michigan, 4
Florida and North Dakota and before an Atomic Safety & Licensing Board of the 5
U.S. Nuclear Regulatory Commission. 6
A copy of my current resume is attached as Exhibit DAS-1. 7
Q. On whose behalf are you testifying in this case? 8
A. I am testifying on behalf of the Sierra Club. 9
Q. What is the purpose of your testimony? 10
A. Synapse was retained by the Sierra Club to assist in reviewing Mississippi Power 11
Company’s (“MPCo” or “the Company”) proposed Kemper County IGCC plant. 12
This testimony presents the results of our analyses. 13
Q. Please summarize your conclusions. 14
A. Our conclusions are as follows: 15
1. Despite the Company’s assertions that it has conducted a comprehensive 16
integrated resource planning process, the Company’s procedure for 17
soliciting resources to meet its identified need has been heavily skewed to 18
its preferred outcome, depriving itself, the Commission, other parties, and 19
ultimately ratepayers of a full assessment of options to meet need. 20
2. Over the next five years, Mississippi Power Company should pursue a 21
combination of purchased power contracts for capacity and energy from 22
existing generation sources and comprehensive energy efficiency 23
programs through competitive solicitations. 24
3. There appear to be substantial uncommitted resources available in 25
Mississippi. In 2008, there were 5,862 MW of combined-cycle natural 26

Kemper County IGCC MPSC Docket No. 2009-UA-014 Direct Testimony of David A. Schlissel
Public - Protected Materials Redacted
Page 3
gas-fired capacity in Mississippi. None of the generating units operated 1
above a 50% capacity factor. 2
4. Additional energy efficiency resources appear to be available to assist in 3
meeting Mississippi Power Company’s projected need even if the 4
Company actually retires older gas-and coal-fired units. For example, an 5
analysis by Georgia Tech found that there is the potential for 11.6 percent 6
reductions in total consumption in Mississippi. 7
5. The three sets of CO2 prices that Mississippi Power Company considers in 8
its analyses of the proposed Kemper County IGCC plant and alternatives 9
($10/ton, $20/ton and $30/ton) are within a zone of reasonableness. 10
However, they do not adequately reflect the reasonable risk that CO2 11
prices will be higher than the Company now forecasts. To reflect this risk, 12
it is necessary that Mississippi Power Company’s assessments include 13
scenarios with higher CO2 costs such as the Synapse 2008 High CO2 14
Forecast. 15
6. It is reasonable that the base case scenarios in the Company’s economic 16
assessments of the proposed Kemper County IGCC plant and alternatives 17
should reflect the Company’s planned capture of 65 percent of the CO2 18
that would otherwise be emitted into the atmosphere. However, in order to 19
reflect technological uncertainty regarding CO2 capture and sequestration, 20
Mississippi Power Company should examine scenarios which assume that 21
zero percent of the CO2 from the Kemper County plant is captured as well 22
as scenarios in which 30 percent or 50 percent of the CO2 is captured. 23
7. Mississippi Power Company’s High, Moderate with Volatility and 24
Moderate gas prices forecasts are significantly higher than both the 25
NYMEX Henry Hub futures prices and the March 2009 AEO long term 26
natural gas price forecast for SERC. Only the Company’s Low gas price 27
forecast is comparable to the AEO March 2009 long term gas price 28

Kemper County IGCC MPSC Docket No. 2009-UA-014 Direct Testimony of David A. Schlissel
Public - Protected Materials Redacted
Page 4
forecast for the SERC region although even this Low gas price forecast is 1
still substantially higher than current NYMEX futures. 2
8. There is a significant risk that the actual cost of constructing the proposed 3
Kemper County IGCC plant could be substantially higher than Mississippi 4
Power Company’s current estimate. The Company’s economic 5
assessments should reflect this risk by including scenarios in which the 6
cost of the proposed IGCC plant is 20 percent and 40 percent above the 7
currently estimated cost. 8
Q. Were there other members of the Synapse project team who also assisted in 9
the analyses undertaken by Synapse as part of its evaluation of the proposed 10
emissions reduction project at Columbia Units 1 and 2? 11
A. Yes. Lucy Johnston, Dr. David White and Rachel Wilson from Synapse also were 12
members of our project team. Copies of their resumes are available at 13
www.synapse-energy.com. 14
ALTERNATIVE TO PROPOSED KEMPER COUNTY IGGC PLANT 15
Q. What do you propose that the company do to meet the need identified in 16
Phase I? 17
A. I propose that, over the next five years, the company pursue a combination of 18
purchased power contracts for capacity and energy from existing generation 19
sources and comprehensive energy efficiency programs through competitive 20
solicitations. The Company should issue an RFP for both mid-term (5) and longer 21
term capacity and energy from existing power plants; the Company could also 22
consider actually purchasing ownership interests in existing plants. Such a 23
contractual approach would enable the Company to achieve more favorable 24
arrangements than it could through market purchases. Further, the Southern 25
Company could also bid its excess capacity in response to the same RFP. Despite 26
the Company’s assertions that it has conducted a comprehensive integrated 27
resource planning process, the Company’s procedure for soliciting resources to 28
Kemper County IGCC MPSC Docket No. 2009-UA-014 Direct Testimony of David A. Schlissel
Public - Protected Materials Redacted
Page 5
meet its identified need has been heavily skewed to its preferred outcome, 1
depriving itself, the Commission, other parties, and ultimately ratepayers of a full 2
assessment of options to meet need. A hybrid approach to meeting the need, that 3
relies on existing resources in the wholesale markets and on increased efficiency 4
for customers, will allow the Company maximum flexibility in the next several 5
years and will avoid risks that the Company’s ratepayers would face due to 6
investment in a large, long-lived, capital-intensive baseload power plant prior to 7
the finalization of a federal program restricting carbon emissions. 8
Q. The Company states that uncommitted resources have had two opportunities 9
to fill MPC’s anticipated need. Do you agree? 10
A. No. As described in Company witness Rozier’s Testimony, and as the 11
Commission noted in its Phase I Order, MPC’s solicitations requested solid-fuel 12
supply options, and placed additional requirements on non-solid-fuel resources. 13
Further, within the solicitation itself, the Company stated its preference for a self-14
build option (June 2007 Invitation and 2008 Invitation). In its approach, the 15
Company defined the solicitation so narrowly that self-build solid-fuel generation 16
was clearly favored; the solicitation was not consistent with integrated resource 17
planning. 18
Q. What natural gas supply options are available? 19
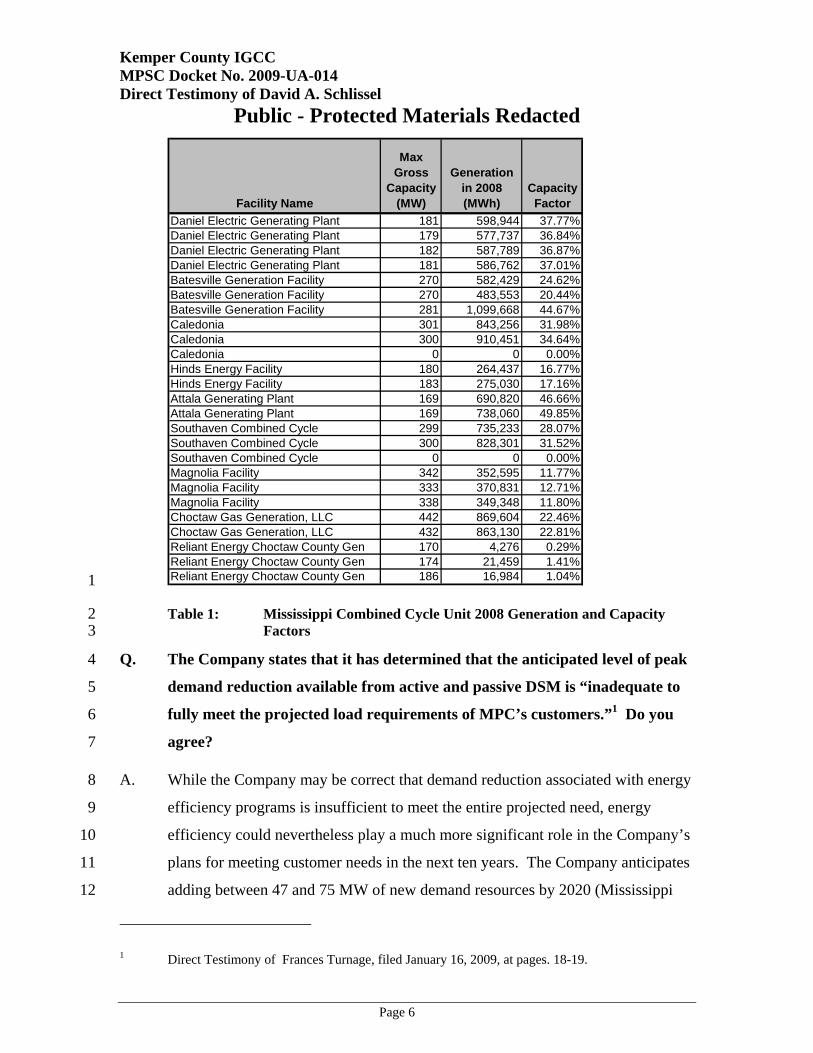
A. There appear to be substantial uncommitted resources available in Mississippi. In 20
2008, there were 5,862 MW of combined-cycle natural gas-fired capacity in 21
Mississippi. None of the generating units operated above a 50% capacity factor. 22
As shown in Table 1 below, which was constructed using data from the EPA 23
Clean Air Markets Division, the average capacity factor was about 25%. 24
Kemper County IGCC MPSC Docket No. 2009-UA-014 Direct Testimony of David A. Schlissel
Public - Protected Materials Redacted
Page 6
Facility Name
Max Gross
Capacity (MW)
Generation in 2008 (MWh)
Capacity Factor
Daniel Electric Generating Plant 181 598,944 37.77%Daniel Electric Generating Plant 179 577,737 36.84%Daniel Electric Generating Plant 182 587,789 36.87%Daniel Electric Generating Plant 181 586,762 37.01%Batesville Generation Facility 270 582,429 24.62%Batesville Generation Facility 270 483,553 20.44%Batesville Generation Facility 281 1,099,668 44.67%Caledonia 301 843,256 31.98%Caledonia 300 910,451 34.64%Caledonia 0 0 0.00%Hinds Energy Facility 180 264,437 16.77%Hinds Energy Facility 183 275,030 17.16%Attala Generating Plant 169 690,820 46.66%Attala Generating Plant 169 738,060 49.85%Southaven Combined Cycle 299 735,233 28.07%Southaven Combined Cycle 300 828,301 31.52%Southaven Combined Cycle 0 0 0.00%Magnolia Facility 342 352,595 11.77%Magnolia Facility 333 370,831 12.71%Magnolia Facility 338 349,348 11.80%Choctaw Gas Generation, LLC 442 869,604 22.46%Choctaw Gas Generation, LLC 432 863,130 22.81%Reliant Energy Choctaw County Gen 170 4,276 0.29%Reliant Energy Choctaw County Gen 174 21,459 1.41%Reliant Energy Choctaw County Gen 186 16,984 1.04% 1
Table 1: Mississippi Combined Cycle Unit 2008 Generation and Capacity 2 Factors 3
Q. The Company states that it has determined that the anticipated level of peak 4
demand reduction available from active and passive DSM is “inadequate to 5
fully meet the projected load requirements of MPC’s customers.”1 Do you 6
agree? 7
A. While the Company may be correct that demand reduction associated with energy 8
efficiency programs is insufficient to meet the entire projected need, energy 9
efficiency could nevertheless play a much more significant role in the Company’s 10
plans for meeting customer needs in the next ten years. The Company anticipates 11
adding between 47 and 75 MW of new demand resources by 2020 (Mississippi 12
1 Direct Testimony of Frances Turnage, filed January 16, 2009, at pages. 18-19.
Kemper County IGCC MPSC Docket No. 2009-UA-014 Direct Testimony of David A. Schlissel
Public - Protected Materials Redacted
Page 7
Power Company Brief, page 16). That is between 1.5% and 2.5% of the 1
Company’s projected load in 2020, or an annual increase of about one quarter of 2
one percent at maximum.2 This level of increase is dwarfed by the achievements 3
of other companies and by the annual goals established by many states. 4
Q. Why do you believe that additional energy efficiency resources are available? 5
A. An analysis by Georgia Tech found that there is substantial energy efficiency 6
resource potential in the South in general, as well as in Mississippi in particular: 7
The South has been one of the last regions of the country to 8 embrace energy efficiency programs and to develop an energy-9 efficiency culture of consumer behavior. For Energy Star 10 appliances with sales data that are tracked by EPA, the South has 11 the lowest rates of market penetration (McNary, 2009). Per capita 12 spending on electric utility energy efficiency programs in the 13 Southeast is just one-fifth the national average. This fact is 14 reflected in the assessments of Elliott et al. (2003) and Elliott and 15 Shipley (2005), which examined the effect of having each state 16 implement policies like those developed in California and the 17 Northeast. In 2003 and 2005, ten southern states were given a “D” 18 grade for current policies and environment (the lowest grade given 19 to any state). Texas was the only state in the South to receive an 20 “A”. For context, of the 48 contiguous states, grades were 21 distributed as: A (12), B (12), C (8), and D (16). 22
The 2008 state efficiency scorecard does not include grades; rather, 23 the authors’ advise that states be evaluated in “bins” which are 24 based on rankings (Eldridge et al, 2008). For consistency, this 25 report assumes that the first bin would be the equivalent of an A 26 and the last the equivalent of a D; grades would be distributed as 27 A(10), B(12), C(9), D(17).6 Of the 16 states in the South, 9 28 received a D – one less than in 2005. However, the score for Texas 29 was downgraded to a “B” and no state in the South received an 30 “A.”3 31
2 Exhibit AUG-SUPP 2, 2010 Load Forecast 3 Chandler and Brown; Meta-Review of Efficiency Potential Studies and Their Implications for the
South; The School of Public Policy at The Georgia Institute of Technology, Working paper #51, August 2009.

Kemper County IGCC MPSC Docket No. 2009-UA-014 Direct Testimony of David A. Schlissel
Public - Protected Materials Redacted
Page 8
Georgia Tech projects potential reductions in total consumption in Mississippi of 1
11.6% by 2020.4 2
While this study alone does not in itself demonstrate specific opportunities in the 3
Company’s service territories, it does call into question whether the Company has 4
tapped available resources and fully explored opportunities. The Company’s 5
failure to even solicit demand-side offers (MPCo response to MPUS 1-9) is not 6
consistent with an integrated resource planning process that places supply side 7
and demand side resources on equivalent footing. Mississippi Power Company’s 8
customers, residential, commercial and industrial alike, deserve a thorough 9
evaluation and pursuit of available energy efficiency and demand reduction 10
resources. 11
Q. What do you propose that the Company do to investigate energy efficiency 12
and demand reduction resources? 13
A I recommend that the Commission require the Company to conduct a thorough 14
evaluation of potential for energy efficiency resources in the Company’s service 15
territory, including a solicitation for energy efficiency resources. The 16
Commission should also consider requiring that the Company use a total resource 17
cost test (“TRC”) rather than the Rate Impact Measurement test (“RIM”) in cost-18
effectiveness determinations. The TRC test evaluates whether the cash savings of 19
a program exceed the cash costs of a program, thus considering benefits to a 20
utility’s system, whereas the RIM test considers specifically the impact on 21
ratepayers who do not participate in a given program. The Guide to Resource 22
Planning with Energy Efficiency, a Report of the National Action Plan for Energy 23
Efficiency (“NAPEE” or “National Action Plan”) states, “The TRC test, which 24
measures the regional net benefits, is the appropriate cost test from a regulatory 25
perspective. All energy efficiency that passes the TRC will reduce the total costs 26
4 Chandler and Brown; State Specific Summaries of the Meta-Review of Efficiency Potential Summaries and Their Implications for the South; The School of Public Policy at The Georgia

Kemper County IGCC MPSC Docket No. 2009-UA-014 Direct Testimony of David A. Schlissel
Public - Protected Materials Redacted
Page 9
of energy in a region.”5 The TRC test is most consistent with the goals of 1
integrated resource planning for a utility. xxxxxxxxxx x xx xxxxxxx xxxxx 2
xxxxxxxx x xxxxx xxxx xxxxx xxx xxxx xxxxxx xxxxxxxxx xxxxx xx xxxxxxx 3
xx xxx xxxxxx xx xx xxxx xxx xxx xxxx xxxxxx xxxx xxx xxx xxxx xxx xxxx 4
xxxxxxxx xxxxxxxxxx xx xxxxxxxxx xxxxxxxxxxxxxxx xxl xxxxxx xxxxxxx 5
Additional demand and energy reductions would be available from a more 6
comprehensive approach to demand side programs. 7
Q. What benefits does your proposal of a hybrid approach tapping available 8
uncommitted resources in the wholesale market, and available energy 9
efficiency and demand reductions resources provide? 10
A. This approach would be robust and resistant in the face of the many uncertainties 11
that will challenge the Company and its ratepayers in the next several years. 12
Investment in a large, long-lived, capital intensive coal-fueled resource exposes 13
the Company’s ratepayers to unnecessary risks of future cost increases, 14
particularly given that the Company has not explored other options through well-15
designed competitive solicitations. Greater investment in energy efficiency would 16
be particularly cost-effective given impending carbon emission restrictions. 17
FUTURE CO2 EMISSIONS COSTS 18
Q. Is the range of CO2 costs that MPCo considers in its resource evaluations 19
reasonable? 20
A. No. The three sets of CO2 prices that MPCo considers in its resource analyses 21
($10/ton, $20/ton and $30/ton) are within a zone of reasonableness. However, 22
they do not adequately reflect the reasonable risk that CO2 prices will be higher 23
Institute of Technology, Working paper #51, Appendix D. August 2009 5 Department of Energy and Environmental Protection Agency. Guide to Resource Planning with
Energy Efficiency: A Resource of the National Action Plan for Energy Efficiency. November 2007, p. 5-3. Available at http://www.epa.gov/cleanenergy/documents/resource_planning.pdf.
Kemper County IGCC MPSC Docket No. 2009-UA-014 Direct Testimony of David A. Schlissel
Public - Protected Materials Redacted
Page 10
than the Company now forecasts. To reflect this risk, it is necessary to include 1
scenarios with higher CO2 costs. 2
Q. Are you familiar with the resource planning work performed by the Boston 3
Pacific Company, the consultant to the Mississippi Public Service 4
Commission in this proceeding? 5
A. Yes. Dr. Roach from Boston Pacific advised the Minnesota Public Utilities 6
Commission in the fall of 2008 in a case in which I was involved. In that 7
assignment, Boston Pacific advised the Minnesota Commission on the appropriate 8
construction costs, emissions costs and fuel costs that should be used in economic 9
analyses of the now-cancelled Big Stone II coal-fired power plant. 10
Q. What range of CO2 emissions prices did Boston Pacific recommend to the 11
Minnesota PUC for use in resource planning? 12
A. Boston Pacific recommended that a range of CO2 prices between $8/ton and 13
$60/ton be used: 14
Clearly, the estimates … show that there is no one “right” number 15 when it comes to greenhouse gas emissions costs. How, then, are 16 utilities supposed to make decisions about resource acquisition? In 17 our opinion, the best practice is to analyze resource choices over a 18 variety of emissions costs, with the goal of selecting resources that 19 deliver low-cost supply under a range of emissions regulations. 20 The low end of the range can be set around $8, beginning in 2012, 21 reflecting a relatively low-cost regime. The high end can be set at 22 $60 a ton, reflecting a bill with tighter emissions caps along with 23 adverse outcomes such as limited development of new nuclear and 24 renewable generation and limited ability to use offsets. Mid-range 25 cases of $20 and $40 per ton should be examined as well. All costs 26 should be escalated with inflation each year after 2012 and should 27 be modeled as a tax. Emissions costs are typically modeled as a tax 28 to all generation, because each bill has differences in allowance 29 distribution among resources and among free allowances and 30
Kemper County IGCC MPSC Docket No. 2009-UA-014 Direct Testimony of David A. Schlissel
Public - Protected Materials Redacted
Page 11
auctions. Moreover, “free” allowances have an opportunity cost 1 equal to the market price.6 2
And: 3
Resource choice must be assessed over a range of CO2 taxes 4 because future emissions costs will depend on a variety of factors 5 from (a) the emissions targets in Federal Legislation to (b) the 6 costs and availability of offsets to (c) the growth of nuclear and 7 renewable sources of generation. We believe the best practice 8 would be to test resource selection at $8, $20, $40 and $60 per ton 9 of CO2 starting in 2012 and escalating at inflation thereafter. The 10 goal of these analyses will be to identify, if possible, a portfolio of 11 resources that deliver low cost supply to ratepayers under a variety 12 of greenhouse gas regimes. At a minimum, such an analysis will 13 reveal the breakpoints; that is, what level of CO2 tax [will] switch 14 the choice from one resource to another.7 15 16
Q. Do you agree with the range of CO2 emissions prices (or taxes) that Boston 17
Pacific recommended to the Minnesota PUC to analyze resource choices? 18
A. Yes. In general, I agreed with the range of CO2 emissions prices recommended by 19
Boston Pacific except I testified that the low end of that range ($8/ton in 2012, 20
escalating at the rate of inflation) was too low and would not reduce greenhouse 21
gas emissions in the amounts and the time that the scientific community agrees is 22
necessary to avoid the most harmful impacts of climate change. 23
Q. What CO2 prices does Synapse recommend be used in resource planning 24
analyses? 25
A. Synapse recommends that the following range of CO2 prices be used in resource 26
planning.8 27
6 Report Responding to the Commission’s Inquiries on Emissions Costs, Construction Costs, and Fuel Costs, Boston Pacific Company, Inc., October 21, 2008, at pages 13 and 14.
7 Id, at pages 15-16. 8 See the Synapse 2008 CO2 Price Forecasts, July 2008, a copy of which is
attached as Exhibit DAS-2.

Kemper County IGCC MPSC Docket No. 2009-UA-014 Direct Testimony of David A. Schlissel
Public - Protected Materials Redacted
Page 12
The 2008 Synapse Low CO2 Price Forecast starts at $10/ton in 2013, in 2007 1
dollars, and increases to approximately $23/ton in 2030. This represents a $15/ton 2
levelized price over the period 2013-2030, in 2007 dollars. 3
The 2008 Synapse High CO2 Price Forecast starts at $30/ton in 2013, in 2007 4
dollars, and rises to approximately $68/ton in 2030. This High Forecast represents 5
a $45/ton levelized price over the period 2013-2030, also in 2007 dollars. 6
Synapse also has prepared a 2008 Mid CO2 Price Forecast that starts close to the 7
low case, at $15/ton in 2013 in 2007 dollars, but then climbs to $53/ton by 2030. 8
The levelized cost of this mid CO2 price forecast is $30/ton in 2007 dollars. 9
Q. How does the range of CO2 emissions prices that Boston Pacific has 10
recommended compare to Synapse’s recommended range of CO2 prices? 11
A. Figure 1, below, compares the levelized costs of the CO2 price scenarios that 12
Boston Pacific recommended to the Minnesota PUC be used for resource 13
planning analyses, the Synapse Low, Mid and High CO2 price forecasts, and the 14
$10,, $20 and $30 per ton scenarios considered by Mississippi Power Company. 15
Kemper County IGCC MPSC Docket No. 2009-UA-014 Direct Testimony of David A. Schlissel
Public - Protected Materials Redacted
Page 13
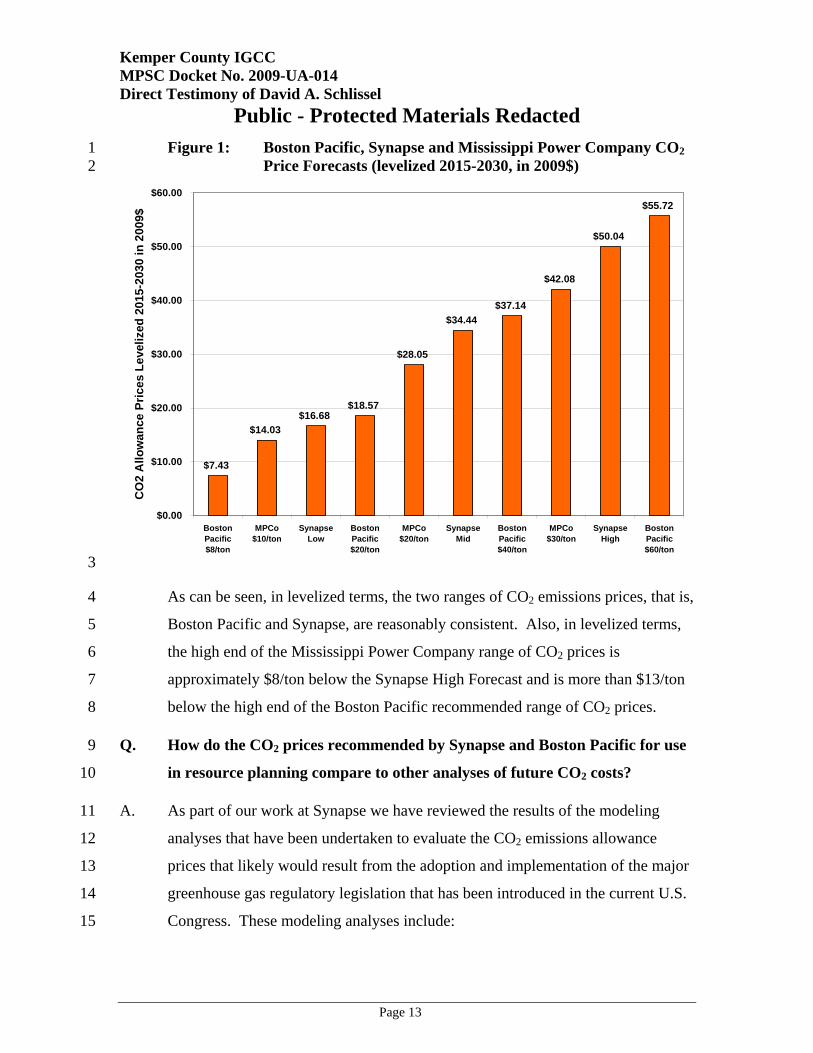
Figure 1: Boston Pacific, Synapse and Mississippi Power Company CO2 1 Price Forecasts (levelized 2015-2030, in 2009$) 2
$7.43
$14.03$16.68
$18.57
$28.05
$34.44$37.14
$42.08
$50.04
$55.72
$0.00
$10.00
$20.00
$30.00
$40.00
$50.00
$60.00
BostonPacific$8/ton
MPCo$10/ton
SynapseLow
BostonPacific$20/ton
MPCo$20/ton
SynapseMid
BostonPacific$40/ton
MPCo$30/ton
SynapseHigh
BostonPacific$60/ton
CO
2 A
llow
ance
Pric
es L
evel
ized
201
5-20
30 in
200
9$
3
As can be seen, in levelized terms, the two ranges of CO2 emissions prices, that is, 4
Boston Pacific and Synapse, are reasonably consistent. Also, in levelized terms, 5
the high end of the Mississippi Power Company range of CO2 prices is 6
approximately $8/ton below the Synapse High Forecast and is more than $13/ton 7
below the high end of the Boston Pacific recommended range of CO2 prices. 8
Q. How do the CO2 prices recommended by Synapse and Boston Pacific for use 9
in resource planning compare to other analyses of future CO2 costs? 10
A. As part of our work at Synapse we have reviewed the results of the modeling 11
analyses that have been undertaken to evaluate the CO2 emissions allowance 12
prices that likely would result from the adoption and implementation of the major 13
greenhouse gas regulatory legislation that has been introduced in the current U.S. 14
Congress. These modeling analyses include: 15

Kemper County IGCC MPSC Docket No. 2009-UA-014 Direct Testimony of David A. Schlissel
Public - Protected Materials Redacted
Page 14
• The Energy Information Administration of the U.S. Department of 1 Energy’s (“EIA”) assessment of the Energy Market and Economic 2 Impacts of S. 280, the Climate Stewardship and Innovation Act of 2007 3 (July 2007).9 4
• The October 2007 Supplement to the EIA’s assessment of the Energy 5 Market and Economic Impacts of S. 280, the Climate Stewardship and 6 Innovation Act of 2007.10 7
• The EIA’s assessment of the Energy Market and Economic Impacts of S. 8 1766, the Low Carbon Economy Act of 2007 (January 2008).11 9
• The EIA’s assessment of the Energy Market and Economic Impacts of S. 10 2191, the Lieberman-Warner Climate Security Act of 2007 (April 2008).12 11
• The EIA’s assessment of the Energy Market and Economic Impacts of 12 H.R. 2454, the American Clean Energy and Security Act of 2009. (August 13 2009).13 14
• The U.S. Environmental Protection Agency’s (“EPA”) Analysis of the 15 Climate Stewardship and Innovation Act of 2007 – S. 280 in 110th 16 Congress (July 2007).14 17
• The EPA’s Analysis of the Low Carbon Economy Act of 2007 – S. 1766 in 18 110th Congress (January 2008).15 19
• The EPA’s Analysis of the Lieberman-Warner Climate Security Act of 20 2008 – S. 2191 in 110th Congress (March 2008).16 21
• The EPA’s Analysis of the American Clean Energy and Security Act of 22 2009, H.R. 2454 in the 111th Congress (June 2009)17 23
• Assessment of U.S. Cap-and-Trade Proposals by the Joint Program at the 24 Massachusetts Institute of Technology (“MIT”) on the Science and Policy 25 of Global Change (April 2007).18 26
9 Available at http://www.eia.doe.gov/oiaf/servicerpt/csia/pdf/sroiaf(2007)04.pdf. 10 Available at http://www.eia.doe.gov/oiaf/servicerpt/biv/pdf/s280_1007.pdf 11 Available at http://www.eia.doe.gov/oiaf/servicerpt/lcea/pdf/sroiaf(2007)06.pdf 12 Available at http://www.eia.doe.gov/oiaf/servicerpt/s2191/pdf/sroiaf(2008)01.pdf. 13 Available at http://www.eia.doe.gov/oiaf/servicerpt/hr2454/index.html. 14 Available at http://www.epa.gov/climatechange/economics/economicanalyses.html. 15 Available at http://www.epa.gov/climatechange/economics/economicanalyses.html. 16 Available at http://www.epa.gov/climatechange/economics/economicanalyses.html. 17 Available at http://www.epa.gov/climatechange/economics/pdfs/HR2454_Analysis.pdf. 18 Available at http://web.mit.edu/globalchange/www/MITJPSPGC_Rpt146.pdf.

Kemper County IGCC MPSC Docket No. 2009-UA-014 Direct Testimony of David A. Schlissel
Public - Protected Materials Redacted
Page 15
• Analysis of the Cap and Trade Features of the Lieberman-Warner Climate 1 Security Act – S. 2191 by the Joint Program at MIT on the Science and 2 Policy of Global Change (April 2008).19 3
• The Lieberman-Warner America’s Climate Security Act: A Preliminary 4 Assessment of Potential Economic Impacts, prepared by the Nicholas 5 Institute for Environmental Policy Solutions, Duke University and RTI 6 International (October 2007)20 7
• U.S. Technology Choices, Costs and Opportunities under the Lieberman-8 Warner Climate Security Act: Assessing Compliance Pathways, prepared 9 by the International Resources Group for the Natural Resources Defense 10 Council (May 2008).21 11
• The Lieberman-Warner Climate Security Act – S. 2191, Modeling Results 12 from the National Energy Modeling System – Preliminary Results, Clean 13 Air Task Force (January 2008).22 14
• Economic Analysis of the Lieberman-Warner Climate Security Act of 2007 15 Using CRA’s MRN-NEEM Model, CRA International, April 2008.23 16
• Analysis of the Lieberman-Warner Climate Security Act (S. 2191) using 17 the National Energy Modeling System (NEMS/ACCF/NAM), a report by 18 the American Council for Capital Formation and the National Association 19 of Manufacturers, NMA, March 2008.24 20
In total, these modeling analyses examined more than 85 different scenarios. 21
These scenarios reflected a wide range of assumptions concerning important 22
inputs such as: the “business-as-usual” emissions forecasts; the reduction targets 23
in each proposal; whether complementary policies such as aggressive investments 24
in energy efficiency and renewable energy are implemented, independent of the 25
emissions allowance market; the policy implementation timeline; program 26
flexibility regarding emissions offsets (perhaps international) and allowance 27
banking; assumptions about technological progress and the cost of alternatives; 28
and the presence or absence of a “safety valve” price. 29
19 Available at http://mit.edu/globalchange/www/MITJPSPGC_Rpt146_AppendixD.pdf. 20 Available at http://www.nicholas.duke.edu/institute/econsummary.pdf. 21 Available at http://docs.nrdc.org/globalwarming/glo_08051401A.pdf. 22 Available at http://lieberman.senate.gov/documents/catflwcsa.pdf. 23 Available at http://www.nma.org/pdf/040808_crai_presentation.pdf. 24 Available at http://www.accf.org/pdf/NAM/fullstudy031208.pdf.

Kemper County IGCC MPSC Docket No. 2009-UA-014 Direct Testimony of David A. Schlissel
Public - Protected Materials Redacted
Page 16
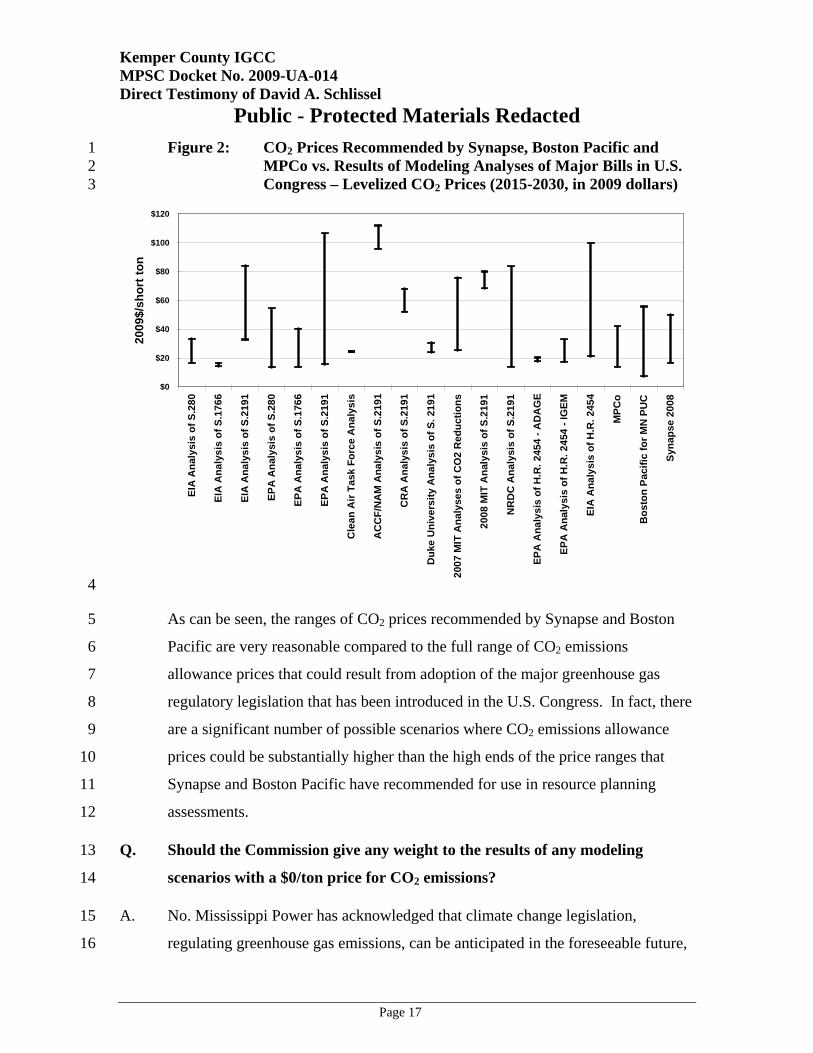
The results of these modeling analyses are presented in Figure 2 below, along 1
with the CO2 prices recommended by Synapse, Boston Pacific and Mississippi 2
Power Company. Figure 2 presents the ranges of levelized CO2 prices developed 3
in each modeling analysis, levelized from 2015-2030, in 2009 dollars. 4
• S.280 refers to the McCain Lieberman bill introduced in 2007 in the 110th 5 U.S. Congress 6
• S.1766 refers to the Bingaman-Specter bill introduced in 2007 in the 110th 7 U.S. Congress 8
• S. 2191 refers to the Lieberman-Warner bill introduced in 2007 in the 9 110th U.S. Congress 10
• HR. 2454 refers to the Waxman-Markey bill introduced in 2009 in the 11 current 111th U.S. Congress 12
The modeling analyses in Figure 2 includes studies prepared by the U.S. EPA, the 13
Energy Information Administration (“EIA”) of the US Department of Energy, the 14
Clean Air Task Force, the American Council for Capital Formation and the 15
National Association of Manufacturers, CRA, International, Duke University, the 16
Massachusetts Institute of Technology (“MIT”) and the Natural Resources 17
Defense Council (“NRDC”). 18
Kemper County IGCC MPSC Docket No. 2009-UA-014 Direct Testimony of David A. Schlissel
Public - Protected Materials Redacted
Page 17
Figure 2: CO2 Prices Recommended by Synapse, Boston Pacific and 1 MPCo vs. Results of Modeling Analyses of Major Bills in U.S. 2 Congress – Levelized CO2 Prices (2015-2030, in 2009 dollars) 3
$0
$20
$40
$60
$80
$100
$120
EIA
Ana
lysi
s of
S.2
80
EIA
Ana
lysi
s of
S.1
766
EIA
Ana
lysi
s of
S.2
191
EPA
Ana
lysi
s of
S.2
80
EPA
Ana
lysi
s of
S.1
766
EPA
Ana
lysi
s of
S.2
191
Cle
an A
ir Ta
sk F
orce
Ana
lysi
s
AC
CF/
NA
M A
naly
sis
of S
.219
1
CR
A A
naly
sis
of S
.219
1
Duk
e U
nive
rsity
Ana
lysi
s of
S. 2
191
2007
MIT
Ana
lyse
s of
CO
2 R
educ
tions
2008
MIT
Ana
lysi
s of
S.2
191
NR
DC
Ana
lysi
s of
S.2
191
EPA
Ana
lysi
s of
H.R
. 245
4 - A
DA
GE
EPA
Ana
lysi
s of
H.R
. 245
4 - I
GEM
EIA
Ana
lysi
s of
H.R
. 245
4
MPC
o
Bos
ton
Paci
fic fo
r MN
PU
C
Syna
pse
2008
2009
$/sh
ort t
on
4
As can be seen, the ranges of CO2 prices recommended by Synapse and Boston 5
Pacific are very reasonable compared to the full range of CO2 emissions 6
allowance prices that could result from adoption of the major greenhouse gas 7
regulatory legislation that has been introduced in the U.S. Congress. In fact, there 8
are a significant number of possible scenarios where CO2 emissions allowance 9
prices could be substantially higher than the high ends of the price ranges that 10
Synapse and Boston Pacific have recommended for use in resource planning 11
assessments. 12
Q. Should the Commission give any weight to the results of any modeling 13
scenarios with a $0/ton price for CO2 emissions? 14
A. No. Mississippi Power has acknowledged that climate change legislation, 15
regulating greenhouse gas emissions, can be anticipated in the foreseeable future, 16

Kemper County IGCC MPSC Docket No. 2009-UA-014 Direct Testimony of David A. Schlissel
Public - Protected Materials Redacted
Page 18
and is indeed “imminent.”25 We agree. Given the trends in the legislation that has 1
been introduced and considered in the U.S. Congress in recent years, it is 2
unreasonable to assume that there will not be any regulation of CO2 emissions 3
(and, hence, no monetized values for CO2 emissions) at any time in the next three 4
or more decades. There may be uncertainty over the specific monetized values for 5
CO2 emissions, but federal regulation of greenhouse gas emissions is a matter of 6
“when” and “how,” not “if.” 7
Q. What are your conclusions concerning the CO2 prices that Mississippi Power 8
Company should use in its economic analyses of the proposed Kemper 9
County IGCC plant and alternatives? 10
A. In addition to the range of CO2 prices that it has proposed to consider, Mississippi 11
Power Company should look at CO2 prices above its $30/ton price trajectory – for 12
example, the Synapse High CO2 price trajectory. Given the uncertainties 13
associated with the design and implementation of a federal regime for the 14
regulation of CO2 emissions, and the results of the modeling of proposed federal 15
climate change legislation, it is not unrealistic to anticipate that CO2 prices could 16
be higher than the Company now proposes to consider. 17
Q. Should Mississippi Power Company model some scenarios in which it is 18
unable to capture 65 percent of the CO2 that would be emitted by the 19
Kemper County IGCC plant? 20
A. Yes. It may be that the Company is unable to achieve its goal of capturing 65 21
percent of the CO2 from the Kemper County IGCC plant on the schedule it 22
projects. While most recent legislative proposals require CCS for new coal-fired 23
power plants so that all new plants would eventually have to capture and 24
sequester emissions on the order of 65%, the proposals provide some “ramp-up” 25
time for CCS technologies. To reflect the technological uncertainty associated 26
25 Direct Testimony of Kimberly D. Flowers, filed January 16, 2009, at page 45 and Mississippi Power Company’s response to Data Request No. MPUS 1-5.
Kemper County IGCC MPSC Docket No. 2009-UA-014 Direct Testimony of David A. Schlissel
Public - Protected Materials Redacted
Page 19
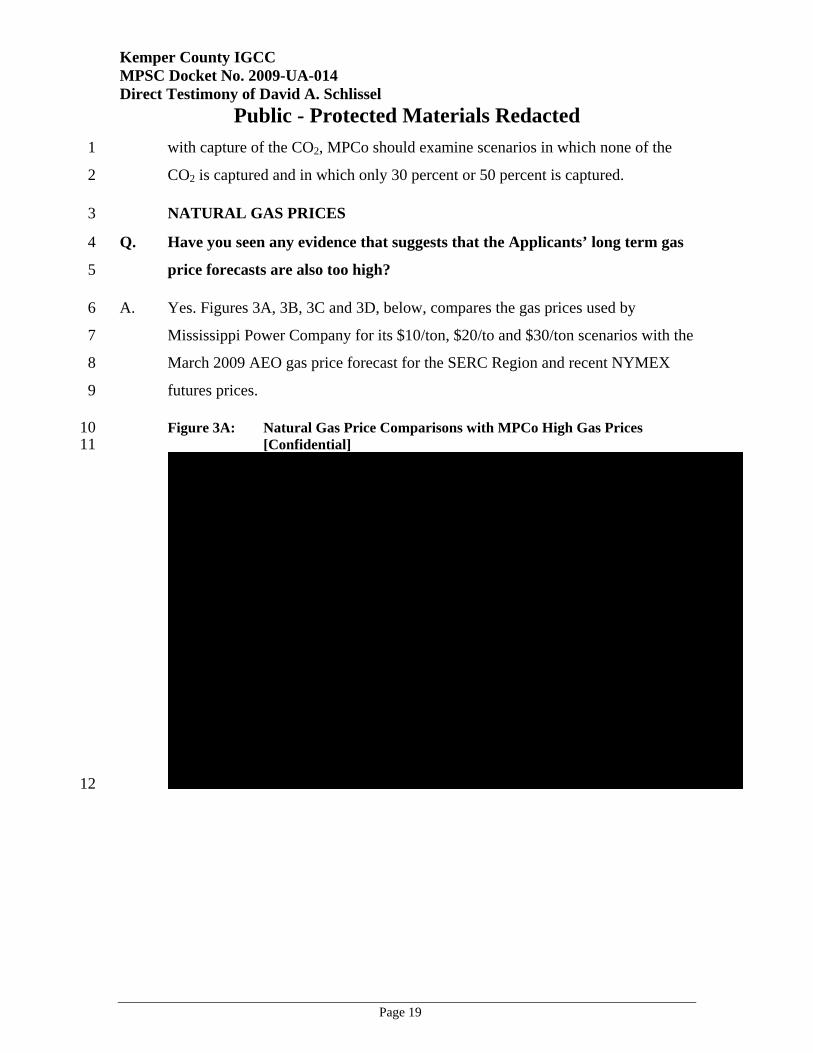
with capture of the CO2, MPCo should examine scenarios in which none of the 1
CO2 is captured and in which only 30 percent or 50 percent is captured. 2
NATURAL GAS PRICES 3
Q. Have you seen any evidence that suggests that the Applicants’ long term gas 4
price forecasts are also too high? 5
A. Yes. Figures 3A, 3B, 3C and 3D, below, compares the gas prices used by 6
Mississippi Power Company for its $10/ton, $20/to and $30/ton scenarios with the 7
March 2009 AEO gas price forecast for the SERC Region and recent NYMEX 8
futures prices. 9
Figure 3A: Natural Gas Price Comparisons with MPCo High Gas Prices 10 [Confidential] 11
12

Kemper County IGCC MPSC Docket No. 2009-UA-014 Direct Testimony of David A. Schlissel
Public - Protected Materials Redacted
Page 20
Figure 3B: Natural Gas Price Comparisons with MPCo Moderate with 1 Volatility Gas Prices [Confidential[ 2
3
Figure 3C: Natural Gas Price Comparisons with MPCo Moderate Gas Prices 4 [Confidential] 5
6

Kemper County IGCC MPSC Docket No. 2009-UA-014 Direct Testimony of David A. Schlissel
Public - Protected Materials Redacted
Page 21
Figure 3D: Natural Gas Price Comparisons with MPCo Low Gas Prices 1 [Confidential] 2
3
As can be seen from Figure 3, the High, the Moderate with Volatility and the 4
Moderate gas prices used by Mississippi Power Company are significantly higher 5
than both the NYMEX Henry Hub futures prices and the March 2009 AEO long 6
term natural gas price forecast for SERC. Only MPCo’s Low gas price forecast is 7
comparable to the AEO March 2009 long term gas price forecast although even 8
the MPCo Low gas price forecast is still substantially higher than the NYMEX 9
futures.26 10
Q. Do you agree with the Commission’s Order directing Mississippi Power 11
Company to test additional scenarios with lower gas prices?27 12
A. Yes. I believe that it would be appropriate for MPCo to consider the two lower 13
gas price forecasts ordered by the Commission given new estimates of domestic 14
26 Some of the differential between the MPCo’s gas price forecasts and the NYMEX futures may be attributable to delivery costs but that should not represent a significant portion of the differences shown in Figures 3A, 3B, 3C and 3D for MPCo’s High, Moderate with Volatility and Moderate gas prices.
Kemper County IGCC MPSC Docket No. 2009-UA-014 Direct Testimony of David A. Schlissel
Public - Protected Materials Redacted
Page 22
U.S. natural gas reserves. These increased natural gas supplies can be expected to 1
exert downward pressure on gas prices as shown by the significantly lower 2
NYMEX futures prices contained in Figures 3A through 3D above. 3
Indeed, Entergy Corporation has described these new supplies of natural gas as a 4
structural change in the natural gas market. This structural change has two 5
important impacts on the resource planning for companies like Mississippi Power. 6
First, as a result of the existing and expected supply glut, current and projected 7
prices of natural gas have been reduced. At the same time, the dramatically larger 8
domestic supplies of natural gas should be able to accommodate any increased 9
demands from any fuel switching due to federal regulation of greenhouse gas 10
emissions without causing significant increases in natural gas prices. 11
The structural change in the natural gas markets already has had a significant 12
impact on utilities’ resource planning. For example, in early April of this year, 13
Entergy Louisiana informed the Louisiana Public Service Commission of its 14
intent to defer (and perhaps cancel) the proposed retirement of an existing gas-15
fired power plant and its replacement by a new coal-fired unit. Entergy explained 16
that it no longer believed that a new coal plant would provide economic benefits 17
for its customers due to its current expectation that future gas prices would be 18
much lower than previously anticipated: 19
Perhaps the largest change that has affected the Project economics 20 is the sharp decline in natural gas prices, both current prices and 21 those forecasted for the longer-term. The prices have declined in 22 large part as a result of a structural change in the natural gas 23 market driven largely by the increased production of domestic gas 24 through unconventional technologies. The decline in the long-term 25 price of natural gas has caused a shift in the economics of the 26 Repowering Project, with the Project currently – and for the first 27
27 Order Finding Need for Generating Capacity and Energy, Docket No. 2009-UA-014, at page 10.

Kemper County IGCC MPSC Docket No. 2009-UA-014 Direct Testimony of David A. Schlissel
Public - Protected Materials Redacted
Page 23
time – projected to have a negative value over a wide range of 1 outcomes as compared to a gas-fired (CCGT) resource.28 2
4. Recent Natural Gas Developments 3
Until very recently, natural gas prices were expected to increase 4 substantially in future years. For the decade prior to 2000, natural 5 gas prices averaged below $3.00/mmBtu (2006$). From 2000 6 through May 2007, prices increased to an average of about 7 $6.00/mmBtu (2006$). This rise in prices reflected increasing 8 natural gas demand, primarily in the power sector, and increasingly 9 tighter supplies. The upward trend in natural gas prices continued 10 into the summer of 2008 when Henry Hub prices reached a high of 11 $131.32/mmBtu (nominal). The decline in natural gas prices since 12 the summer of 2008 reflects, in part, a reduction in demand 13 resulting from the downturn in the U.S. economy. 14
* * * * 15
However, the decline also reflects other factors, which have 16 implications for long-term gas prices. During 2008, there occurred 17 a seismic shift in the North American gas market. “Non-18 conventional gas” – so called because it involves the extraction of 19 gas sources that previously were non-economic or technically 20 difficult to extract – emerged as an economic source of long-term 21 supply. While the existence of non-conventional natural gas 22 deposits within North America was well established prior to this 23 time, the ability to extract supplies economically in large volumes 24 was not. The recent success of non-conventional gas exploration 25 techniques (e.g., fracturing, horizontal drilling) has altered the 26 supply-side fundamentals such that there now exists an 27 expectation of much greater supplies of economically priced 28 natural gas in the long-run…. 29
* * * * 30
Of course, it should be noted that it is not possible to predict 31 natural gas prices with any degree of certainty, and [Entergy 32 Louisiana] cannot know whether gas prices may rise again. Rather, 33 based upon the best available information today, it appears that gas 34 prices will not reach previous levels for a sustained period of time 35
28 Exhibit DAS-3, Report and Recommendation Concerning the Little Gypsy Unit 3 Repowering Project, submitted by Entergy Louisiana to the Louisiana Public Service Commission, April 1, 2009, at pages 6-8.
Kemper County IGCC MPSC Docket No. 2009-UA-014 Direct Testimony of David A. Schlissel
Public - Protected Materials Redacted
Page 24
because of the newly discovered ability to produce gas through 1 non-traditional recovery methods…29 [Emphasis added] 2
Entergy’s conclusion that there has been a seismic shift in the domestic natural 3
gas industry was confirmed in early June 2009 by the release of a report by the 4
American Gas Association and an independent organization of natural gas experts 5
known as the Potential Gas Committee, the authority on gas supplies. This report 6
concluded that the natural gas reserves in the United States are 35 percent higher 7
than previously believed. The new estimates show “an exceptionally strong and 8
optimistic gas supply picture for the nation,” according to a summary of the 9
report.30 10
A Wall Street Journal Market Watch article titled “U.S. Gas Fields From Bust to 11
Boom” similarly reported that huge new gas fields have been found in Louisiana, 12
Texas, Arkansas and Pennsylvania and cited one industry-backed study as 13
estimating that the U.S. now has enough natural gas to satisfy nearly 100 years of 14
current natural gas-demand.31 It further noted that 15
Just three years ago, the conventional wisdom was that U.S. 16 natural-gas production was facing permanent decline. U.S. 17 policymakers were resigned to the idea that the country would 18 have to rely more on foreign imports to supply the fuel that heats 19 half of American homes, generates one-fifth of the nation’s 20 electricity, and is a key component in plastics, chemicals and 21 fertilizer. 22
But new technologies and a drilling boom have helped production 23 rise 11% in the past two years. Now there’s a glut, which has 24 driven prices down to a six-year low and prompted producers to 25 temporarily cut back drilling and search for new demand.32 26
29 Id, at pages 17, 18 and 22. 30 Estimate Places Natural Gas Reserves 35 percent Higher, New York Times, June 9, 2009. 31 Available at http://online.wsj.com/article/SB12410459891270585.html. 32 Id.

Kemper County IGCC MPSC Docket No. 2009-UA-014 Direct Testimony of David A. Schlissel
Public - Protected Materials Redacted
Page 25
Q. The Company’s witnesses in this Docket have repeatedly cited natural gas 1
price volatility as a reason for building the proposed Kemper County IGCC 2
plant. Should this Commission be concerned about natural gas price 3
volatility? 4
A. Yes. All fuel prices will exhibit some degree of price volatility – that is daily, 5
weekly or monthly variations based on fluctuations in the relationships between 6
supplies and demand, and weather. Of course, Commissions should be concerned 7
about such volatility and should require utilities to take reasonable actions to 8
hedge natural gas supplies in order to minimize volatility. 9
It is obvious that MPCo’s focus on natural gas price volatility is intended to taint 10
the options of building a new gas-fired plant or purchasing power from existing 11
gas-fired units. However, there are a number of other key variables, in addition to 12
future natural gas prices, which also are highly uncertain. These include the 13
ultimate cost of the Kemper County plant (including its CO2 capture and 14
sequestration facilities) and future coal prices, as well as the cost of carbon 15
emissions (as discussed above). A utility such as Mississippi Power Company 16
should consider all of these uncertainties in its resource planning and the 17
Commission also should consider them in its deliberations. 18
Q. Are there other alternatives for limiting the dependence of Mississippi Power 19
or the State of Mississippi on natural gas besides building the proposed 20
Kemper County IGCC plant? 21
A. Yes. Energy efficiency (both for electricity and for natural gas) and renewable 22
technologies are reasonable alternatives for limiting dependence on natural gas. 23
Repowering older natural gas-fired units with newer, more efficient combined 24
cycle technology is another option. 25
In addition, many utilities regularly limit their exposure to natural gas price 26
uncertainty and volatility through financial or physical hedging. 27
Kemper County IGCC MPSC Docket No. 2009-UA-014 Direct Testimony of David A. Schlissel
Public - Protected Materials Redacted
Page 26
Q. Is MPCo currently heavily dependent on natural gas for generating 1
electricity? 2
A. No. In fact, the Company actually is heavily dependent on coal-fired generation: 3
in 2006, 71 percent of the MWhs generated by MPCo came from coal; in 2007, 4
69 percent of MWhs generated by the Company came from coal and in 2008, 67 5
percent of the Company’s MWhs were from coal-fired units. 6
Q. Didn’t Company witness Flowers testify that 53 percent of the MPCo’s 7
existing generation uses natural gas as the primary fuel?33 8
A. Yes. However, Ms. Flowers testimony appears to be based on the total MWs of 9
gas-fired capacity on the Company’s system. When discussing fuel mix and fuel 10
diversity, it is more appropriate to examine the MWhs generated by each fuel type 11
than the MWs of generating capacity that each fuel provides. For example, the 53 12
percent of MPCo’s generating capacity represented by gas-fired units provided 13
only 31 percent of the Company’s MWhs in 2007 and only 33 percent of MPCo’s 14
MWhs in 2008. 15
Conversely, as noted in the previous answer, the 47 percent of the Company’s 16
generation that is coal-fired provided 67 percent of MPCo’s MWhs in 2008. 17
Consequently, focusing on MWs instead of MWhs will distort how reliant the 18
Company actually is on the different fuels. 19
33 Direct Testimony of Kimberly D. Flowers, filed January 16, 2009, at pages 17 and 18.

Kemper County IGCC MPSC Docket No. 2009-UA-014 Direct Testimony of David A. Schlissel
Public - Protected Materials Redacted
Page 27
Q. The Company has said that the “adoption of a carbon control legislation 1
would likely cause fuel prices, especially natural gas, to rise due to fuel use 2
shifting from coal to natural gas.”34 Is it reasonable to assume that natural 3
gas prices would increase significantly if the federal government adopts 4
legislation or regulations to regulate and reduce greenhouse gas emissions? 5
A. No. It is possible that natural gas demand could be somewhat higher due to CO2 6
emission regulations and, as a result, natural gas prices could be expected to be 7
somewhat higher than otherwise would be the case. However, the effect is very 8
complicated and will depend on a number of factors, such as how much new 9
natural gas capacity is built as a result of the higher coal-plant operating costs due 10
to the CO2 emission allowance prices, how much additional DSM and renewable 11
alternatives are added to the U.S. system, the levels and prices of any incremental 12
natural gas imported into or developed in the U.S., and changes in the dispatching 13
of the electric system. Indeed, depending on future circumstances there may be 14
some periods in which the prices of natural gas may be lower as a result of CO2 15
regulations. Thus it is very difficult to determine, at this time, the amount by 16
which natural gas prices might increase, if at all, due to the regulation of CO2 17
emissions. 18
In fact, the detailed modeling of proposed greenhouse gas legislation does not 19
unambiguously support the conclusion that the price of natural gas would increase 20
as a result of a federal program for regulating greenhouse gas emissions but 21
reveals a much more complex dynamic. 22
Q. Has Synapse examined the impact that the enactment of CO2 emissions 23
regulations might have on natural gas prices? 24
A. Yes. As part of our work on climate change issues, Synapse has reviewed the 25
publicly available modeling results concerning the impact that adoption and 26
34 Exhibit KDF-1, page 24.
Kemper County IGCC MPSC Docket No. 2009-UA-014 Direct Testimony of David A. Schlissel
Public - Protected Materials Redacted
Page 28
implementation of CO2 regulatory legislation could have on natural gas prices. 1
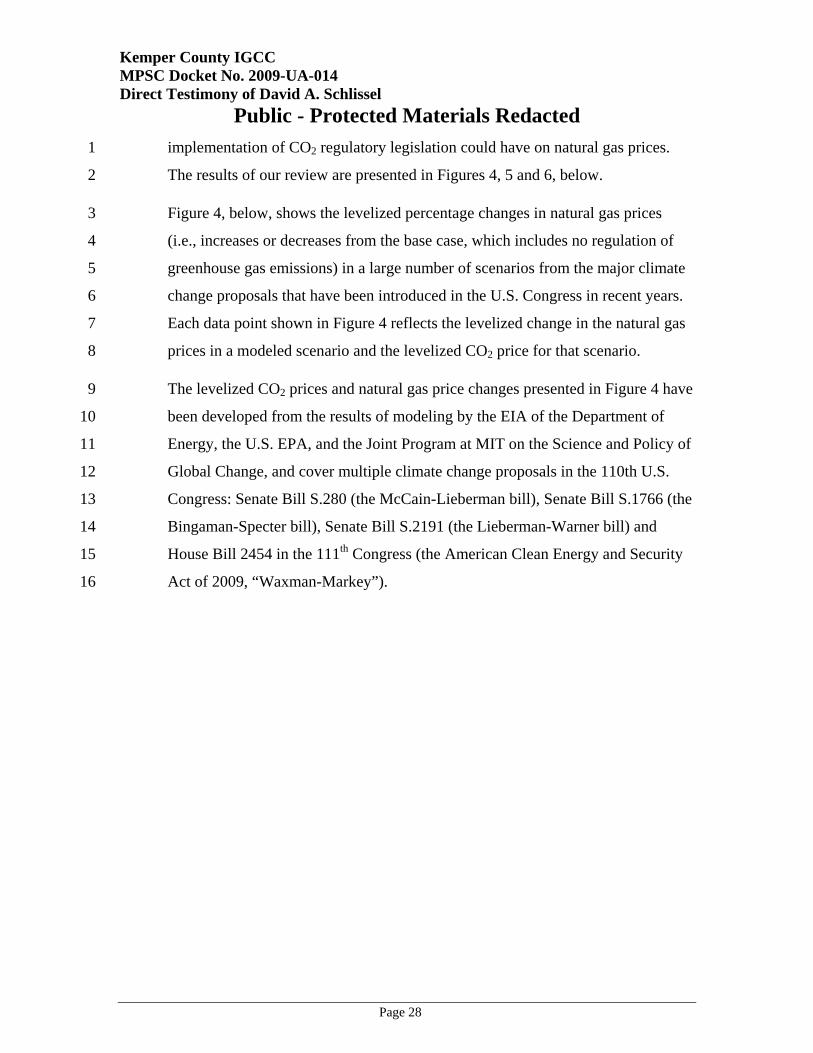
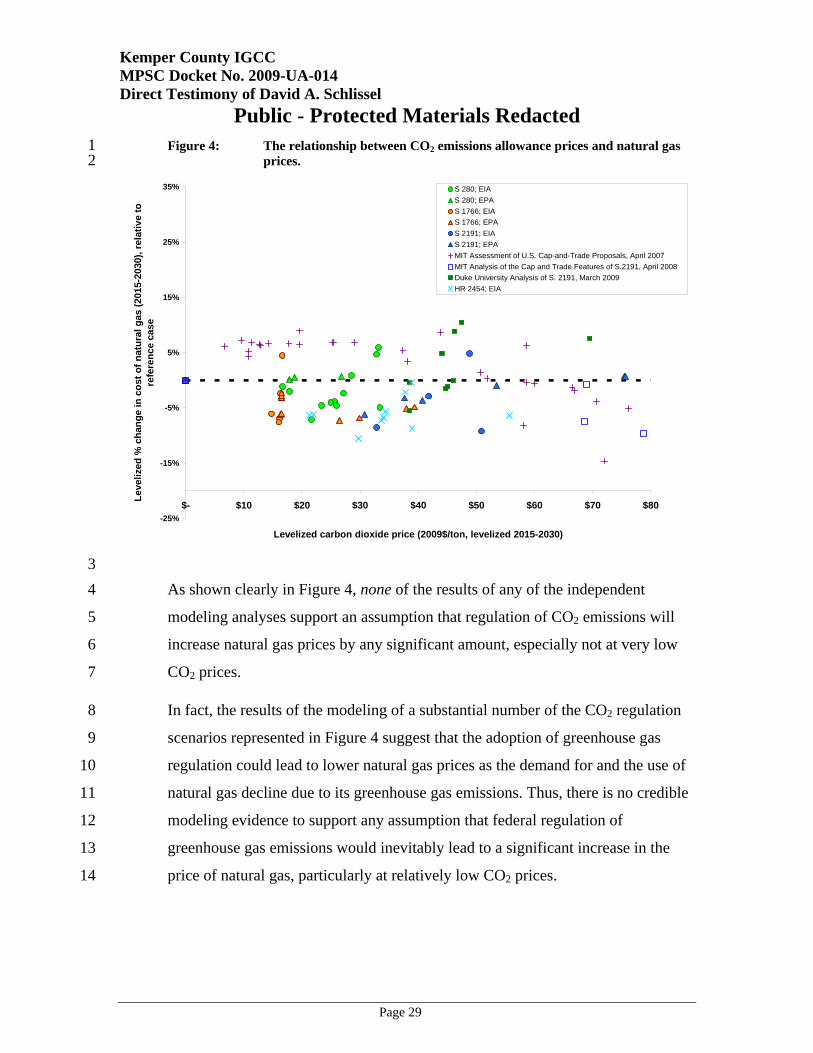
The results of our review are presented in Figures 4, 5 and 6, below. 2
Figure 4, below, shows the levelized percentage changes in natural gas prices 3
(i.e., increases or decreases from the base case, which includes no regulation of 4
greenhouse gas emissions) in a large number of scenarios from the major climate 5
change proposals that have been introduced in the U.S. Congress in recent years. 6
Each data point shown in Figure 4 reflects the levelized change in the natural gas 7
prices in a modeled scenario and the levelized CO2 price for that scenario. 8
The levelized CO2 prices and natural gas price changes presented in Figure 4 have 9
been developed from the results of modeling by the EIA of the Department of 10
Energy, the U.S. EPA, and the Joint Program at MIT on the Science and Policy of 11
Global Change, and cover multiple climate change proposals in the 110th U.S. 12
Congress: Senate Bill S.280 (the McCain-Lieberman bill), Senate Bill S.1766 (the 13
Bingaman-Specter bill), Senate Bill S.2191 (the Lieberman-Warner bill) and 14
House Bill 2454 in the 111th Congress (the American Clean Energy and Security 15
Act of 2009, “Waxman-Markey”). 16
Kemper County IGCC MPSC Docket No. 2009-UA-014 Direct Testimony of David A. Schlissel
Public - Protected Materials Redacted
Page 29
Figure 4: The relationship between CO2 emissions allowance prices and natural gas 1 prices. 2
-25%
-15%
-5%
5%
15%
25%
35%
$- $10 $20 $30 $40 $50 $60 $70 $80
Levelized carbon dioxide price (2009$/ton, levelized 2015-2030)
Leve
lized
% c
hang
e in
cos
t of n
atur
al g
as (2
015-
2030
), re
lativ
e to
re
fere
nce
case
S 280; EIAS 280; EPAS 1766; EIAS 1766; EPAS 2191; EIAS 2191; EPAMIT Assessment of U.S. Cap-and-Trade Proposals, April 2007MIT Analysis of the Cap and Trade Features of S.2191, April 2008Duke University Analysis of S. 2191, March 2009HR 2454; EIA
3 As shown clearly in Figure 4, none of the results of any of the independent 4
modeling analyses support an assumption that regulation of CO2 emissions will 5
increase natural gas prices by any significant amount, especially not at very low 6
CO2 prices. 7
In fact, the results of the modeling of a substantial number of the CO2 regulation 8
scenarios represented in Figure 4 suggest that the adoption of greenhouse gas 9
regulation could lead to lower natural gas prices as the demand for and the use of 10
natural gas decline due to its greenhouse gas emissions. Thus, there is no credible 11
modeling evidence to support any assumption that federal regulation of 12
greenhouse gas emissions would inevitably lead to a significant increase in the 13
price of natural gas, particularly at relatively low CO2 prices. 14

Kemper County IGCC MPSC Docket No. 2009-UA-014 Direct Testimony of David A. Schlissel
Public - Protected Materials Redacted
Page 30
Q. Does Figure 4, above, include the recent modeling of the HR 2454, the 1
Waxman-Markey legislation that has been approved by the U.S. House of 2
Representatives? 3
A. Yes. The results of the recent EIA modeling of the Waxman-Markey bill are 4
included in Figure 4. 5
Q. Have you seen any other evidence that suggests that federal regulation of 6
greenhouse gas emissions will not cause significant increases in natural gas 7
prices? 8
A. Yes. Figure 5, below, presents the annual percentage changes in natural gas 9
prices in each of the scenarios examined by the EIA in its recent modeling of the 10
Waxman-Markey bill from the gas prices in the EIA’s reference case without any 11
regulation of CO2 emissions. This information provides insight in the ranges of 12
natural gas prices that could be expected from adoption of the Waxman-Markey 13
bill. 14

Kemper County IGCC MPSC Docket No. 2009-UA-014 Direct Testimony of David A. Schlissel
Public - Protected Materials Redacted
Page 31
Figure 5: Annual Changes in Natural Gas Prices from Reference Case in EIA 1 Modeling of Proposed Waxman-Markey Legislation 2
-30%
-20%
-10%
0%
10%
20%
30%
2012 2013 2014 2015 2016 2017 2018 2019 2020 2021 2022 2023 2024 2025 2026 2027 2028 2029 2030
Perc
ent C
hang
e
Basic Zero Bank High Offsets High Costs
No Intl Offsets No Intl Offsets/Lmtd Alts Accelerated CAFE Low Discount Rate
Limited Alternatives High Technology High Banking 3
As can be seen from Figure 5, under the Waxman-Markey bill that has been 4
passed by the House of Representatives, in almost all of the scenarios studied by 5
the EIA, natural gas prices would increase somewhat for a few initial years except 6
for a single scenario in which there would only be limited alternatives to using gas 7
in place of coal and in which the use of international offsets would not be 8
allowed. Indeed, in many of the cases studied by the EIA, natural gas prices 9
would be expected to decrease over time as a result of the federal regulation of 10
greenhouse gas emissions. 11

Kemper County IGCC MPSC Docket No. 2009-UA-014 Direct Testimony of David A. Schlissel
Public - Protected Materials Redacted
Page 32
Q. Doesn’t the EIA’s recent modeling of H.R. 2454, the Waxman-Markey bill, 1
show natural gas prices decreasing simply because most of the scenarios 2
studied assume significant additions to the number of nuclear power plants 3
in the U.S? 4
A. No. The EIA also modeled two “Limited Alternatives” scenarios in which the 5
additions of nuclear capacity, dedicated biomass and coal plants with carbon 6
capture and sequestration were constrained. In one of these “Limited 7
Alternatives” scenarios, the use of international offsets also was prohibited. 8
Q. What impact did the proposed Waxman-Markey bill have on natural gas 9
prices in these two Limited Alternatives scenarios? 10
A. The annual changes in natural gas prices in each of the two “Limited 11
Alternatives” scenarios modeled by the EIA, as compared to the base case without 12
any CO2 regulation, are presented in Figure 6 below. This Figure presents the 13
same information that was presented in Figure 5, above, except that all of the 14
other scenarios modeled by the EIA other than the “Limited Alternatives” 15
scenarios have been removed. These other scenarios assumed some large nuclear 16
additions. 17
Kemper County IGCC MPSC Docket No. 2009-UA-014 Direct Testimony of David A. Schlissel
Public - Protected Materials Redacted
Page 33
Figure 6: Changes from Base Case Natural Gas Prices in EIA “Limited 1 Alternatives” Modeling Scenarios 2
-10%
-5%
0%
5%
10%
15%
20%
25%
30%20
12
2013
2014
2015
2016
2017
2018
2019
2020
2021
2022
2023
2024
2025
2026
2027
2028
2029
2030
Perc
ent C
hang
e
Limited Alternatives and No Intl Offsets Limited Alternatives
3
As can be seen from Figure 6, natural gas prices did not increase very much, at 4
all, as compared to the reference case prices in the EIA “Limited Alternatives” 5
scenario that constrained new nuclear, biomass and coal plant with CCS 6
additions.35 In fact, over time natural gas prices were projected to decrease, as 7
compared to the reference case, because of the cost of the fuel’s CO2 emissions. 8
Natural gas prices only increased significantly in the scenario which added a 9
prohibition on the use of international offsets to the “Limited Alternatives” 10
scenario. 11
35 The reference case examined by the EIA did not assume regulation of CO2 emissions.

Kemper County IGCC MPSC Docket No. 2009-UA-014 Direct Testimony of David A. Schlissel
Public - Protected Materials Redacted
Page 34
Q. Would the use of international offsets be prohibited under the Waxman-1
Markey bill? 2
A. No. The Waxman-Markey bill and the Kerry-Boxer legislation under 3
consideration in the U.S. Senate both would allow significant use of international 4
offsets. Therefore, the gas price impacts are more likely to track the lower line in 5
Figure 6. 6
Q. But doesn’t common sense suggest that regulating greenhouse gas emissions 7
will lead to less coal-fired generation and more of a dependence on natural 8
gas – thereby increasing the demand for and price of natural gas? 9
A. Not necessarily, especially over the mid-to-longer term. In fact, there are several 10
reasons why federal regulation of greenhouse gas emissions may not lead to any 11
meaningful increases in the price of natural gas. First, natural gas plants also emit 12
CO2. Thus, there will be incentives as a result of federal regulation of greenhouse 13
gases to shift away from use of natural gas to more carbon neutral options such as 14
energy efficiency and renewable resources. This will act to reduce the demand for 15
natural gas as well as coal-fired generation. 16
It also is generally accepted that strategies for reducing our national greenhouse 17
gas emissions will require implementing complementary policies adding large 18
amounts of new wind and energy efficiency. Thus, legislative proposals for 19
regulation of greenhouse gases, such as the Waxman-Markey bill also included 20
increased investments in these areas. Consequently, carbon legislation, when 21
coupled with increasing amounts of new wind and energy efficiency, actually may 22
lead to decreases in the demand for and, consequently, reduced costs for natural 23
gas over the long term, counter to what the Applicants have assumed. 24
For example, a recent study by the U.S. Department of Energy’s National 25
Renewable Energy Laboratory examined the costs and benefits of achieving 20 26

Kemper County IGCC MPSC Docket No. 2009-UA-014 Direct Testimony of David A. Schlissel
Public - Protected Materials Redacted
Page 35
percent wind energy penetration by 2030.36 One of the benefits that this DOE 1
study found was that wind generation could displace up to 50 percent of the 2
electricity that would be generated from natural gas – this, in turn, could translate 3
into a reduction in national demand for natural gas of 11 percent.37 4
The substantially higher domestic U.S. natural gas supplies that have been 5
identified within the past year, as I discussed earlier, also will reduce the impact 6
that regulation of CO2 emissions could have on natural gas prices. 7
IGCC PLANTCONSTRUCTION COSTS 8
Q. What is the currently estimated construction cost for the proposed Kemper 9
County IGCC plant? 10
A. MPCo’s currently estimated construction cost for the Kemper County plant is 11
$2.106 billion. This reflects approximately $254.6 million in incentives and 12
benefits.38 13
Q. Are any elements of the current Kemper County plant construction cost 14
estimate subject to cost caps? 15
A. No. MPCo has indicated that “Unless fixed by third-party contract when 16
executed, none of the estimates contained in the Company’s filing are subject to 17
contractual ‘cost caps.’”39 18
Q. What is the status of the contracting for the purchase of equipment for the 19
Kemper County plant? 20
A. MPCo has said that it has signed a contract for the steam turbine generator.40 21
The vendors for the remaining equipment are unknown because either the 22
36 20 Percent Wind Energy by 2030, available at http://www.20percentwind.org/20p.aspx?page=Report.
37 Id, at pages 16 and 154. 38 Mississippi Power Company response to Data Request No. Entegra 1-4. 39 Mississippi Power Company response to Data Request No. Entegra 1-5.
Kemper County IGCC MPSC Docket No. 2009-UA-014 Direct Testimony of David A. Schlissel
Public - Protected Materials Redacted
Page 36
equipment has not yet been set out for bid or, for those pieces that have been bid, 1
the Company has not yet selected a vendor.41 2
Q. What is the status of the design for the proposed Kemper County IGCC 3
plant? 4
A. According to MPCo, the detailed design for the Project has not yet begun.42 5
Q. Is it reasonable to expect that the cost to build the proposed Kemper County 6
IGCC plant will increase significantly over time if the project is approved by 7
the Commission and built? 8
A. Yes. Coal power plant construction costs have risen dramatically in recent years 9
as a result of a worldwide competition for design and construction resources, 10
equipment, and commodities like concrete, steel, copper and nickel. Terms like 11
“staggering” and “skyrocketing” have been used to describe these cost increases. 12
Coal-fired power plants that were estimated to cost $1500 per kilowatt in 2002 are 13
now projected to cost in excess of $3500 per kilowatt.43 14
Almost all other proposed coal-fired power plants, of which I am aware, have 15
experienced large cost increases in recent years. For example, the estimated per 16
unit construction cost of Duke Energy Carolina’s Cliffside Project increased by 17
80 percent between the summer of 2006 and June 2007. Similarly, AMP-Ohio just 18
cancelled its proposed Meigs County coal plant after the estimated cost of the 19
plant increased by 37 percent in only 13 months after the previous estimate was 20
issued. 21
40 Mississippi Power Company responses to Data Request No. Entegra 1-14.a. 41 Id. 42 Mississippi Power Company response to Data Request Sierra Club-MPC 1-41. 43 See the Synapse Report, Coal-Fired Power Plant Construction Costs., a copy of which is attached
as Exhibit DAS-4.

Kemper County IGCC MPSC Docket No. 2009-UA-014 Direct Testimony of David A. Schlissel
Public - Protected Materials Redacted
Page 37
Consequently, it is reasonable to expect that the actual cost of building the 1
Kemper County IGCC plant will be significantly higher than Mississippi Power 2
Company currently estimates. 3
Q. Are there any reasons to expect that the technology being proposed for the 4
Kemper County Project might be susceptible to cost increases? 5
A. Yes. As Company witness Flowers has testified, the Kemper County plant will 6
represent the first large-scale application of the TRIG gasification technology.44 I 7
understand that although the process that MPCo plans to use to capture the CO2 8
from the proposed IGCC plant has been used in industry for years, it has not yet 9
been used on the commercial scale at which it would be used at the proposed 10
plant. This creates some additional cost uncertainty. 11
Q. What other IGCC plants are currently under construction in the U.S.? 12
A. I believe that Duke Energy Indiana’s Edwardsport plant is the only IGCC project 13
that is currently under construction in the U.S. A number of other IGCC plants 14
have been proposed but some have been cancelled and the remaining projects 15
have either been formally delayed or are otherwise not moving forward very 16
aggressively. 17
Q. Have you seen any explanations of why some utilities have cancelled or 18
significantly delayed their proposed IGCC plants? 19
A. Yes. For example, Xcel Energy announced in October 2007 that it was 20
indefinitely deferring its plans to build an IGCC plant in Colorado because the 21
development costs were higher than the utility originally expected.45 22
Similarly, Tampa Electric cancelled a proposed IGCC plant in the fall of 2007 due 23
to uncertainty related to CO2 regulations, particularly capture and sequestration 24
issues, and the potential for related project cost increases. According to a press 25
44 Direct Testimony of Kimberly D. Flowers, filed January 16, 2009, at page 40, lines 5-6.
Kemper County IGCC MPSC Docket No. 2009-UA-014 Direct Testimony of David A. Schlissel
Public - Protected Materials Redacted
Page 38
release, “Because of the economic risk of these factors to customers and investors, 1
Tampa Electric believes it should not proceed with an IGCC project at this time,” 2
although it remains steadfast in its support of IGCC as a critical component of 3
future fuel diversity in Florida and the nation. 4
In addition, the Tondu Corp. announced in June 2007 that it was suspending plans 5
to build a planned 600 MW IGCC facility in Texas citing high costs and other 6
concerns related to technology and construction risks.46 7
Q. Are you aware of whether any state regulatory commissions have denied rate 8
recovery for investments in a proposed IGCC plant or have refused to allow 9
a utility to enter into a purchase power agreement for the output from a 10
proposed IGCC plant? 11
A. Yes. In August of 2007, the Minnesota Public Utilities Commission refused to 12
require Xcel Energy to enter into an agreement to purchase power from a 13
proposed IGCC plant on the grounds that the terms and conditions of the 14
proposed contract were not consistent with the public interest because they would 15
result in unreasonably high prices for Xcel and unreasonably high rates for Xcel’s 16
ratepayers.47 17
Then, in April of 2008, the Virginia State Corporation Commission denied 18
Appalachian Power Company’s request to recover costs associated with a 19
proposed IGCC plant from its Virginia ratepayers citing uncertainties of costs, 20
technology, and unknown federal mandates.48 The Commission found that the 21
45 Denver Business Journal, October 30, 2007. 46 http://www.reuters.com/article/companyNewsAndPR/idUSN1526955320070615 47 Order in Docket No. E-6472/M-05-1993, issued on August 30, 2007, at page 17. Available at
https://www.edockets.state.mn.us/EFiling/edockets/searchDocuments.do?method=showPoup&documentId={825E0DB0-0D4B-4261-BF18-84643EAC49BD}&documentTitle=4762105.
48 Final Order in Case No. PUE-2007-00068, April 14, 2008. Available at http://scc.virginia.gov/newsrel/e_apfrate_08.aspx.

Kemper County IGCC MPSC Docket No. 2009-UA-014 Direct Testimony of David A. Schlissel
Public - Protected Materials Redacted
Page 39
Company’s (APCo) cost estimate for project was “not credible” -- it had not been 1
updated since November 2006.49 2
The Commission also concluded that “… APCo has no fixed price contract for 3
any appreciable portion of the total construction costs; there are no meaningful 4
price or performance guarantees or controls for this project at this time. This 5
represents an extraordinary risk that we cannot allow the ratepayers of Virginia in 6
APCo’s service territory to assume.”50 7
It also noted the uncertainties surrounding federal regulation of carbon emissions 8
and carbon capture and sequestration technology and costs and observed that the 9
Company was asking for a “blank check.”51 On this basis, the Commission 10
concluded that “We cannot ask Virginia ratepayers to bear the enormous costs – 11
and potentially huge costs – of these uncertainties in the context of the specific 12
Application before us.”52 13
Q. What has been the construction cost experience of Duke Energy Indiana’s 14
Edwardsport IGCC Project? 15
A. At the time it requested a certificate from the Indiana Utility Regulatory 16
Commission in the spring of 2007, Duke Energy Indiana estimated that its 17
proposed Edwardsport IGCC unit would cost $1.985 billion. However, in April 18
2008, just one year later, Duke announced an 18 percent increase in the estimated 19
cost of its proposed IGCC coal plant. Duke indicated that higher than expected 20
costs had been experienced when the Company actually began final procurement 21
of equipment for the plant. Duke also said that “the increase in the cost estimate is 22
driven by factors outside the Company’s control, including unprecedented global 23
competition for commodities, engineered equipment and materials, and increased 24
49 Id, at pages 4 to 5. 50 Id, at page 5. 51 Id, at page 10. 52 Id, at page 10.
Kemper County IGCC MPSC Docket No. 2009-UA-014 Direct Testimony of David A. Schlissel
Public - Protected Materials Redacted
Page 40
labor costs.”53 Duke also noted in its Petition to the Indiana Utility Regulatory 1
Commission that this projected increase in cost was “consistent with other recent 2
power plant project cost increases across the country.”54 3
Then, just two weeks ago, Duke announced another 6.4 percent increase in the 4
IGCC unit and warned the Indiana Commission that there may be further 5
increases in the project, which is only 44 percent complete: 6
The Edwardsport IGCC Project has made considerable progress in 7 the six months since our previous filing. Construction is 8 proceeding at an expected pace and the total project is 9 approximately 44% complete. Yet, despite Petitioner’s best efforts 10 to rigorously manage the Edwardsport IGCC Project, we have 11 experienced design modifications and scope growth above what 12 was anticipated from the preliminary engineering design, adding 13 capital costs to the Project. We are currently forecasting that the 14 additional capital cost items will use the remaining contingency 15 and escalation amounts in the current $2.35 billion cost estimate 16 and add approximately $150 million, or about 6.4%, to the 17 estimated cost of the Project. The Company is in the process of 18 determining how this increase in capital costs will impact the total 19 Project cost estimate, including the impact associated with 20 additional contingency. Over the next few months, we will be 21 examining items such as craft labor estimates, final engineering, 22 procurement and start-up estimates to better understand the 23 potential cost increases and how much additional contingency will 24 be needed to complete the Project.55 25
53 Verified Petition in Indiana Utility Regulatory Commission Cause No. 43114 IGCC-1, filed on May 1, 2008, at pages 3-4
54 Id, at page 7. 55 Verified Petition and Motion for Subdocket Proceeding, Duke Energy Indiana, Indiana Utility
Regulatory Commission Cause No. 43114 IGCC-4, November 24, 2009, at page 3.

Kemper County IGCC MPSC Docket No. 2009-UA-014 Direct Testimony of David A. Schlissel
Public - Protected Materials Redacted
Page 41
Q. Is it reasonable to expect that the construction cost of the Kemper County 1
IGCC plant will increase by more than the approximate $260 million in 2
financial incentives that Mississippi Power Company says it will be receiving 3
from the investment tax credits, DOE loan guarantees, and other 4
incentives?56 5
A. Yes. Given the cost escalation experienced by other coal plant construction 6
projects, including, especially, the Edwardsport IGCC plant, it is reasonable to 7
expect that the construction cost of the Kemper County plant will increase by 8
substantially more than $260 million, thereby offsetting the benefits provided by 9
the investment tax credits and the other benefits from the federal, state and local 10
governments cited by MPCo. 11
Q. How should MPCo reflect the future of higher construction costs in its 12
economic analyses of the proposed Kemper County IGCC unit? 13
A. The Company’s base case analyses should reflect MPCo’s most recent cost 14
estimate for the Kemper County plant. However, there is a significant risk that the 15
actual cost of constructing the proposed Kemper County IGCC plant could be 16
substantially higher than Mississippi Power Company’s current estimate. The 17
Company’s economic assessments should reflect this risk by including scenarios 18
in which the cost of the proposed IGCC plant is 20 percent and 40 percent above 19
the currently estimated cost. 20
Q. Does this complete your testimony? 21
A. Yes. 22
56 January 2009 Petition for Facilities Certificate for the Kemper County IGCC Project, at page 6.