directions in power electronics for photovoltaics
TRANSCRIPT

1 University of Colorado Boulder
Directions inPower
Electronics for Photovoltaics
Prof. Robert Erickson Prof. Dragan Maksimovic
Colorado Power Electronics Center Department of Electrical, Computer,
and Energy Engineering University of Colorado Boulder
2 University of Colorado Boulder
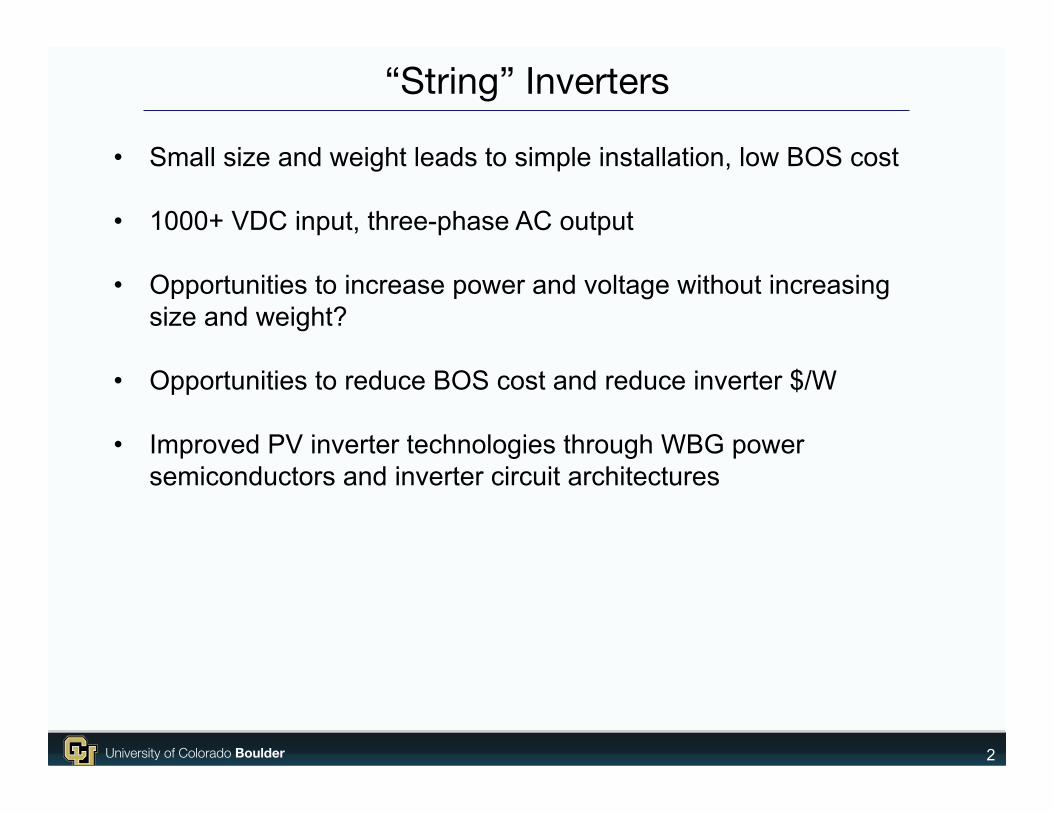
“String” Inverters
• Small size and weight leads to simple installation, low BOS cost • 1000+ VDC input, three-phase AC output
• Opportunities to increase power and voltage without increasing size and weight?
• Opportunities to reduce BOS cost and reduce inverter $/W
• Improved PV inverter technologies through WBG power semiconductors and inverter circuit architectures

3 University of Colorado Boulder
Advancing power converter technology With new wide bandgap power semiconductor device technologies, there are new opportunities for disruptive and transformative advances in power electronics. Areas ripe for focus include: • Converter circuit topologies and architectures • Resonant and soft switching techniques • Control techniques • System architectures and system design • Enabling complex power circuits and their performance improvements via
recent advances in packaging and interconnect technologies New approaches that combine advances in multiple sources are more likely to lead to transformative results Brute-force replacement of Si devices with WBG devices offers limited improvement in converter metrics Key metrics: cost, application-specific loss, size and weight.

4 University of Colorado Boulder
Historical Disruptions in Power Semiconductors
Si BJT to Si MOSFET: 1980’s, 10 V to 1000 V Device 1980 1990
Dominant 20 kHz
Emerging Too expensive DC losses too large
Supplanted by MOSFET Still cheaper than
MOSFET, but inferior system size and cost
Dominant 100 kHz Reductions in magnetics
size and cost Why: 1. Reduced ac loss of MOSFETs allowed 5x increase of frequency 2. Availability of good ferrite materials at 100 kHz, so 5x reduction of
magnetics size and/or loss New applications became feasible, new circuit designs were developed, converter systems were optimized in different ways to take advantage
Si MOSFET
Si BJT
Si MOSFET
Si BJT

5 University of Colorado Boulder
Next Disruption in Power Semiconductors Si IGBT to SiC MOSFET: 600 V to 10 kV(?) Device Now Ten years (?)
Dominant 10 kHz
Emerging Too expensive DC losses too large
Supplanted by SiC MOSFET Still cheaper than SiC, but
inferior system size and cost
Dominant 100 kHz Reductions in magnetics
size and cost Why: 1. Reduced ac loss of MOSFETs allowed 5x increase of frequency 2. Availability of good ferrite materials at 100 kHz, so 5x reduction of
magnetics size and/or loss Feasibility of new applications, development of new circuit designs, optimization of converter systems in new ways to take advantage
Si IGBT
SiC MOSFET

6 University of Colorado Boulder
Power Converter Metrics Cost
• Generally measured in $/W • For research projects, other related metrics may be more appropriate:
• Total semiconductor area, mm2/kW (Don’t just count transistors) • Total magnetics core and copper volumes • Total capacitor energy or apparent power
Loss • Efficiency h or Q = Pout/Ploss
• Peak efficiency is not very meaningful • Weighted loss in realistic scenario: CEC efficiency • Worst-case maximum loss, or Q at rated output power
Size • Volumetric power density, measured in W/in3 or kW/L • Gravimetric power density is measured in kW/kg • Impact of size on BOS cost

7 University of Colorado Boulder
Efficiency improvement: incremental or transformative?
η = PoutPin
Ploss = Pin – Pout = Pout 1η – 1
• Ploss determines size and weight of the inverter enclosure
• Converters generally are loss-limited, and technologies that can produce large output power while incurring small loss result in small size and low cost
achieved without high e�ciency, so that thermal rise is limited to a safe value. It shouldbe noted that there are multiple ways to measure e�ciency. Peak e�ciency is an imprecisemeasure; peak loss and average loss in a given application are better measures that drivethe system thermal performance.
In most power electronics applications, the converter system is typically thermally lim-ited. In other words, for a given thermal management design, the allowed average powerloss is limited. For such systems, the ratio of output power to power loss
Q =Pout
Ploss=
⌘
(1 � ⌘) (1)
presents a more meaningful performance metric than e�ciency ⌘. By analogy with thequality factor of a reactive element, we define Q of a power converter as the ratio of lossto output power. For example, if the system average e�ciency is improved from 96% to98%, the system average e�ciency is improved by just 2%, which appears to be incremen-tal. However, Pout/Ploss is more than doubled. This would allow doubling of the outputpower while maintaining the same cooling system performance, e↵ectively doubling thepower density and halving the cost per unit output power. Of course, other constraints mayalso limit maximum output power; nonetheless, Q directly measures the most commonlimitation on converter power density and performance.
A trend in power electronics applications at all power levels is the need for high e�-ciency at multiple mission-critical operating points. Examples include (a) battery-poweredsystems such as cell phones and laptop computers, where low-power e�ciency is critical toenable power management functions that extend battery charge; (b) solar inverter applica-tions, where CEC weighted e�ciency measures the performance of inverters under realisticscenarios; and (c) electrified vehicle powertrains, where standard EPA drive cycles definerealistic driving conditions and measure performance such as Miles Per Gallon gasolineequivalent (MPGe).
0 20 40 60 80 100
Normalized motor power [%]
0
5
10
15
20
25
30
35
40
Occ
ura
nce
[%
]
UDDSHWFETUS06
Figure 2 Simulation of a typical Ford Focus electric vehicle with NREL ADVISOR simulator
In recent work [1], we have developed detailed models of the power electronics driv-
2
Fig. 1. Typical electric vehicle powertrain architecture
use of a composite converter approach. By contrast, existingsoft-switching, multilevel, or coupled-inductor approaches ei-ther lead to only incremental improvements in e�ciency, orrequire a substantial increase in capacitor size.
The paper is organized as follows: Section II describesthe automotive powertrain application, explains the need toachieve high e�ciency over wide ranges of conversion ratiosand over wide ranges of power, and identifies dominant lossmechanisms in the conventional boost converter. Previousapproaches to boost converter e�ciency improvements aresummarized in Section III. In Section IV, based on the con-cepts of direct and indirect power in dc-dc converters, severalcomposite converter topologies are introduced to explicitlyaddress the dominant loss mechanisms associated with indirectpower conversion. A detailed comparison of the compositeconverters and the state-of-the-art approaches is presented inSection V based on loss models calibrated by experimentalresults. It is shown that one of the boost composite converterscan result in reduction of the total loss over typical drivecycles, by a factor of two to four. Furthermore, the total systemcapacitor power and energy ratings are substantially reduced.Section VI concludes the paper.
II. Electrified automotive power trainFigure 1 shows the basic vehicle powertrain architecture
with the bi-directional boost dc-dc converter. Variations of thisarchitecture can be found in hybrid and electric vehicles. Thedc-dc converter boosts the battery voltage, so that a higher-speed machine can be used, which has smaller size and highere�ciency. For example, in the 2010 Prius, the battery nominalvoltage is approximately 200 V, and the DC-DC converterboosts the dc bus voltage to approximately 650 V [7].
In vehicular powertrain applications, the system is typicallythermally limited. In other words, for a given thermal manage-ment design, the allowed average power loss is limited. Forsuch systems, the ratio of output power to power loss
Q =P
out
P
loss
=⌘
(1 � ⌘) (1)
presents a more meaningful performance metric than e�ciency⌘. By analogy with the quality factor of a reactive element,we define Q of a power converter as the ratio of loss to output
Efficiency [%]90 92 94 96 98 100
Q =
Pout/P
loss
100
101
102
103
Fig. 2. Converter quality factor Q = P
out
/Ploss
metric vs. e�ciency ⌘.
power. Fig. 2 shows the Q = P
out
/Ploss
metric as a function ofpower e�ciency. For example, if the system average e�ciencyis improved from 96% to 98%, the system average e�ciencyis improved by just 2%, which appears to be incremental.However, P
out
/Ploss
is more than doubled. A technology thatcan achieve a doubling of Q could enable doubling of theoutput power in a thermally limited system or could processthe same output power while allowing the system coolinge↵ort to be halved. These are substantial and non-incrementalsystem-level improvements. High e�ciency power electronicsnot only improves the system average e�ciency such as milesper gallon equivalent (MPGe), but also increases the powerdensity and significantly reduces the size and cost of thethermal management system.
In traditional power electronics applications, converter ef-ficiency at full power is often critical. However, in electricpowertrain applications, converter e�ciency at intermediateand low power levels is actually more important. As anexample, Fig. 3a shows the NREL ADVISOR [27] simulationresult for a Ford Focus electric vehicle under di↵erent standardDynamometer Drive Schedules (DDS) specified by the UnitedStates Environmental Protection Agency (EPA) [28]. TheUrban Dynamometer Drive Schedule (UDDS) is a relatively
For a given limited Ploss, increasing Q increases available output power, and hence also the specific cost ($/W)
How significant is a 1% gain in efficiency?

8 University of Colorado Boulder
Trends in Converter Circuit Topologies and Control Complex converter topologies
– Current scaling: multi-phase topologies – Voltage scaling: multi-level topologies – Modularity and multilevel modular converters – Efficient indirect power processing: composite architectures
that employ dissimilar modules These approaches can lead to significant improvements in power density, efficiency, and performance
Enablers for complex converter architectures – Control techniques including autonomous module control and
efficiency maximization via passthrough modes – Packaging and complex interconnects

9 University of Colorado Boulder
Goal: scale current by a factor of 2 in the basic half-bridge (buck or boost) module
c1
c2
c2 c1
vsw io
Vg
I
Vo
io
I
vsw

10 University of Colorado Boulder
Approach 1: just double semiconductor device area
c1
c2
c2 c1
vsw io
Vg
2I
Vo
io 2I
vsw
I
Double input
capacitor
Quadruple filter
inductor

11 University of Colorado Boulder
Approach 2: interleaved 2-phase converter
c1
c2
c1 c2
vsw1
io
Vg
2I
Vo
io 2I
vsw1
I
c3
c4
vsw2
c3 c4
vsw2
• Substantially reduced input and output ripples
• Same semiconductor area used more effectively
• Requires more complex control
• Requires more complex power interconnects

12 University of Colorado Boulder
c1
c2
c2 c1
vsw io
Vg
I
Vo
io
I
vsw
Goal: scale voltage by a factor of 2 in the basic half-bridge (buck or boost) module

13 University of Colorado Boulder
Approach 1: just stack devices in series
c1
c2
c2 c1
vsw io
2Vg
I
2Vo
io
I
vsw 2Vg
Double filter
inductance
• Series stacking of devices is very difficult in practice
• Just replacing devices with 2x higher breakdown voltage is more practical, but requires larger semiconductor area

14 University of Colorado Boulder
Approach 2: multi-level conversion
c1
c2
vsw io
2Vg
I
2Vo
c3
c4
c1 c2
io
vsw
I
c3 c4
Vg
Vg Vg
• The switched-node voltage has 3 possible levels: 2Vg, Vg, and 0
• The switching-node voltage frequency equals 2fs
• Switches exposed to half voltage stress
• Much reduced filter inductance
• More complex interconnects, more complex control
• Numerous modular multi-level topologies have been investigated

15 University of Colorado Boulder
Beyond multi-phase/multi-level modular topologies
• Losses in power converters are associated with indirect power processing
• Traditional converter topologies, such as boost do not process indirect power efficiently: switching devices are exposed to full voltage and current levels
• How can indirect power be processed more efficiently?

16 University of Colorado Boulder
“DC Transformer” (DCX) concept 12 Modular E Operation Review
//
%&/
��/���/����/�.��� ������/��� �/����/��/���/�����/�/���.����� .����� /*���+/,"-(/�� / ����/ �����/ ���/ �� /���/ ��/ �����/ ��/ ����� / %("*+)/ ��/ �/ ���� / �������/ ���/� �� �/ �� /���/ ��������/ ��/ �����/ ��/ ����� / %("*+(/ ������/ �� �����/�� �����/ � /�����/��/����� /%(#(/
/
*+/
/
*+/
����� &� �"&#$&�����&�����&���&��&�������� �&#���$!&#$&��%��� ������&���&����&����&� �������&
��/ �����/ ��/ ����� / %(#)/ �� / ������/ ��/ � ������/ ��� /�.����� / �� �� �/����/ $!'/����/ ���� / ����/ ������/ ��� / �����/ *�� / ��� / �����/ ��/ �� / ����� / ��/ ��� �� �/ ���/
Vin Vout
DCX
Fixed ratio
NDCX
+–Vin
Vout
Fig. 2.2 DC Transformer (DCX) module
The Buck or Boost PWM module illustrated in Fig. 2.3 is a conventional hard-switched DC-DC converter.Pulse-width modulation (PWM) of the semiconductor duty cycle D is employed to control the voltage conver-sion ratio M(D) = Vout/Vin of this module. In the buck configuration, the conversion ratio M(D) is restrictedto the range 0 M(D) 1. The module is capable of bidirectional power flow. The boost configuration isrestricted to 1 M(D), and is identical to the buck module but with the Vin and Vout terminals interchanged.
//
%&/
��/���/����/�.��� ������/��� �/����/��/���/�����/�/���.����� .����� /*���+/,"-(/�� / ����/ �����/ ���/ �� /���/ ��/ �����/ ��/ ����� / %("*+)/ ��/ �/ ���� / �������/ ���/� �� �/ �� /���/ ��������/ ��/ �����/ ��/ ����� / %("*+(/ ������/ �� �����/�� �����/ � /�����/��/����� /%(#(/
/
*+/
/
*+/
����� &� �"&#$&�����&�����&���&��&�������� �&#���$!&#$&��%��� ������&���&����&����&� �������&
��/ �����/ ��/ ����� / %(#)/ �� / ������/ ��/ � ������/ ��� /�.����� / �� �� �/����/ $!'/����/ ���� / ����/ ������/ ��� / �����/ *�� / ��� / �����/ ��/ �� / ����� / ��/ ��� �� �/ ���/
Vin Vout
%XFN�RU�%RRVW
9DULDEOH ratio
0�'�
+–Vin
Vout
Fig. 2.3 Buck or Boost PWM module
A buck or boost module achieves maximum e�ciency in passthrough mode, where the conversion ratio isM(D) = 1. This is achieved by causing the high-side semiconductor switch to remain in the on state: D = 1 forthe buck converter, or D = 0 for the boost converter. There is no switching loss in the passthrough mode, andthe input is connected to the output through the high-side semiconductor device and the inductor. Very highe�ciencies are achieved in passthrough mode. Neighboring operating points, with pulse-width modulationat a duty cycle D near the passthrough value, also achieves high e�ciency but with some switching loss.
66
.)6
6
������������ ��������� ������ ��
����6 ��6���!����6��$��!�6���"������6�� ��6���616*3.46#�6����� 6����616'3,���616(3/36�� �6 ���6 ������46 #���6 �� �6 16 .''6 �46�6 16 *3.6 ���6 ����6 16 )('6 �46 ��6 "�� ���6 � ����6 ��6��� ���! ��6 �"���%6 �� #���6 ��6 �! �! 6 ��6 ��6�� 6 ���6 ���� 6 ���"�� ��36 ��6 ���#�6 ��6���!��6-3(-46#���6 ��6�� ��%6"�� ���6��6������6 ���6)('6�46 ��6�!��6���"�� ��6������6 �6#���6 �6 ����6 ��6 �! �! 6 ��6 �� 6 #� ���6 +''6 �36 ����6 �� �6 26 +''6 �6 06 ����46 ��6 ���� 6���"�� ��6���6��6��! 6��#�46���#�6��6 ��6�����6������6��6���!��6-3(-36�6��! 6��#�6 ��6�!��6��6���� 6���"�� ��46#�6�����%6 !��6���6 ��6��#6����6�#� ����6���6 !��6��6 ��6����6����6�#� ����6��6 �� 6��616(6��6����616(36����6 ��6�! �! 6"�� ���6��6�������6 ���6+''6�46���!���6 �6 ���6 �� ���6 ����� �6#� �6�� 6 ���6 �!��6 ���"�� ��46 ��6 ���� 6 ���"�� ��6 ���%46�����6 ����� ��6 �6 �� ���&�6 ���������%36 -''6 �6 ��"����6 ���6 ��6 !���6 ��6 ���6 ���!���6 ��6���!���6�36
���6��"�� ���6��6���!���6�6��6 �� 6��6#�6#�� 6 �6��! 6��#�6 ��6�� 46#�6���6����� �6 ��6 �!��6 ���"�� ��6 #� �6��6 ����!���%6 ����������6 �6 &���6 �6 ��"�6 �6 ���� �6 !��5���6 ����� ���36�������%46� 6 ��6����6��������6 �6 !��6��6 ��6�� 6���� ��%36�����6���!���6�6�������6 �6�$���� 6 ��6��� 6��� ���6������ ���� ���36
DCX
Boost
Buck
�
����
�
�
����
+ 580 V -
+
200 V -
+ 200 V
-
+ 200 V
-
+ 380 V
-
D = 0: passthrough
D = 1: passthrough
N = 1.9
Fig. 2.4 Optimization of the Modular E architecture for maximum e�ciency at a voltage conversion ratio of 200:580.
1 : NDCX
+
Vin
–
+
Vout
–
Ltank
itank+ vtank – I
The DC Transformer (DCX): an isolated converter block that can change voltage by a fixed ratio, and process indirect power with very high efficiency
4
Modular E system level architecture
The figure below illustrates typical measured waveforms for an operating point near Point 1. At thispoint, the buck converter operates in passthrough mode: its input port is connected to its output port with nohigh-frequency switching and no switching loss. The output bus voltage is the sum of the voltages producedby the DC Transformer (DCX) module and the boost module. The DCX module operates with zero-voltageswitching at 33 kHz, with the waveforms illustrated in (a). The boost converter operates at 15 kHz and a dutycycle of approximately 20%, with the waveforms illustrated in (b). Since the boost duty cycle is low, andbecause of the zero-voltage switching of the DCX devices, the e�ciency is very high. An absence of ringingin the waveforms can also be observed, which is another prerequisite for high e�ciency; this is the resultof zero-voltage switching in the DCX, as well as well-optimized layout and gate driver design in the boostmodule.
(a)
(b)
DCX with boost module operation waveforms: Vin = 209 V, Vout = 636 V, Pout = 5.7 kW. (a) DCX module wave-forms: VDCXout = 376 V, PDCXout = 3.4 kW, fsDCX = 33 kHz. Both primary and secondary side exhibit zero-voltageswitching. (b) Boost module waveforms: Vboostout = 260 V, Pboostout = 2.3 kW, fsboost = 15 kHz.
Example: Dual Active Bridge circuit: a DCX with bidirectional power flow. Efficiency is very high when optimized for fixed voltage ratio
• Low RMS currents • Low switch current stresses • Low input and output ripples • Zero-voltage switching of all
devices

17 University of Colorado Boulder
Beyond multi-phase/multi-level modular topologies
Concept: • Use ultra-efficient DCX modules to process most of indirect power • Combine dissimilar modules to achieve desired conversion
characteristics and regulation capabilities Example: Boost Composite Converter

18 University of Colorado Boulder
Boost Composite Converter Architecture P
indirect
=⌦v
Q1↵ ⌦
i
Q1↵= DV
in
I
in
= �Dv
Q1 i
Q1
E(1)
⌘ac
P
indirect
=Dv
Q2 i
Q2
E= � ⌦v
Q2↵ ⌦
i
Q2↵
(2)
v
Q1 (t
) =⌦v
Q1↵+ v
Q1 (t
) (3)
i
Q1 (t
) =⌦i
Q1↵+ i
Q1 (t
) (4)
M =V
out
V
in
= N
DCX
+ M
boost
(5)
M =V
out
V
in
= M
buck
N
DCX
+ M
boost
1
Dissimilar partial-power converter modules:
• Same total silicon area
• Total film capacitor size reduced by 3x
• Significantly lower loss at high boost ratios
• Significantly reduced partial-power loss
Dominant loss mechanisms are addressed: • Use of pass-through modes to minimize AC losses • Use of ultra-high-efficiency DC Transformer (DCX) module to
convert most of the indirect power
BuckMbuck(D)
BoostMboost(D)
DCX1:NDCX
VIN
VBUS
+
-
1. H. Chen, K. Sabi, H. Kim, T. Harada, R. Erickson, and D. Maksimovic, “A 98.7% Efficient Composite Converter Architecture with Application-Tailored Efficiency Characteristic,” IEEE Transactions on Power Electronics, vol. 31, no. 1, pp. 101-110, Jan. 2016.
2. H. Chen, H. Kim, R. Erickson and D. Maksimovic, “Electrified Automotive Powertrain Architecture Using Composite DC-DC Converters,” IEEE Transactions on Power Electronics, 2016.

19 University of Colorado Boulder
Effect of Converter Topology on Capacitor Size
• Capacitor size and cost generally is proportional to the applied AC rms current
• Capacitor rms current is independent of switching frequency • Capacitor rms current depends on the converter circuit topology and the
operating point • Operation of boost converter at high duty cycle leads to high capacitor
rms current • Multilevel modular converter approaches increase capacitor requirements • Operation of boost or buck modules at near-passthrough points, or operation
of DCX modules, leads to reduced capacitor requirements • It is possible to significantly reduce total system capacitor requirements,
through fundamentally sound improvements to converter topology

20 University of Colorado Boulder
Efficiency comparison (250-to-650 V, 15 kW)
SiC boost
Si IGBT boost
Si MOSFET composite
SiC MOSFET composite

21 University of Colorado Boulder
Summary of converter technologies: EV drivetrain boost example
• Brute-force device replacement in the conventional boost converter yields relatively small improvements in efficiency and converter Q, and no improvements in capacitor size
• Composite architecture + SiC devices = transformative improvement • Composite architecture addresses fundamental loss mechanisms • SiC enables increased switching frequency and much reduced
magnetics size • In the composite architecture, SiC yields very high peak and average
efficiency, much higher converter Q, and very high power density
Converter Si-IGBT Conventional boost
Si-MOSFET Composite boost
SiC-MOSFET Conventional boost
SiC-MOSFET Composite boost
Switching frequency 10 kHz 20 kHz 240 kHz 240 kHz
CAFE efficiency 94.3 % 98.2 % 96.9 % 98.3 %
CAFE Q factor 22.2 55.3 34.7 58.6
Magnetic volume [mL] 343 372 136 82

22 University of Colorado Boulder
Conclusions New WBG semiconductor power devices can enable new opportunities for disruptive and transformative advances in power electronics, but new device technologies must be combined with advances in converter circuits and control. Areas ripe for focus include:
• Converter circuit topologies and architectures • Control techniques • System architectures and system design • Enablement of more complex power circuits via interconnect and packaging
Brute-force replacement of Si devices with WBG devices offers limited improvement in converter metrics Suggested ways to measure cost:
• Total semiconductor area, mm2/kW (Don’t just count transistors!) • Total magnetics core and copper volumes • Total capacitor energy or apparent power • Effect of inverter size and weight on installation cost
Reduction of BOS (installation) cost via improved WBG+topologies: • Maintain low size and weight of string inverters and increase Pout/Ploss • Increased cost of WBG devices could be offset by reduced magnetics cost and
reduced installation cost