directorate f: social statistics and doc. estat/f5/es/204 · eurostat/unit f5 food consumption...
TRANSCRIPT

Luxembourg, December 2011RDR/AMP
----
------------------------------------------------- Directorate F: Social Statistics and Information Society Unit F5: Health and food safety; Crime
Doc. ESTAT/F5/ES/204 Rev.1 (available in EN)
Orig. : EN
FOOD CONSUMPTION INDICATORS: RESULTS USING DATA COLLECTED FROM THE HOUSEHOLD BUDGET SURVEY

Eurostat/Unit F5 Food consumption statistics - Results using data collected from HBS Food safety statistics ESTAT/F5/ES/204 Rev.1
1/57
1. INTRODUCTION....................................................................................................................................... 1
2. BACKGROUND.......................................................................................................................................... 1
3. DATA AVAILABLE................................................................................................................................... 3
4. USING FOOD QUANTITIES FROM HBS.............................................................................................. 3
5. RESULTS..................................................................................................................................................... 4 5.1. MEAN DAILY FOOD QUANTITIES PER PERSON ........................................................................................ 4 5.2. ANALYSIS BY MAIN CONSUMPTION DETERMINANTS.............................................................................. 9
6. CONCLUSION.......................................................................................................................................... 15
ANNEX I: LIST OF FOOD CONSUMPTION INDICATORS TO MONITOR FOOD SAFETY AND HEALTH AND NUTRITION POLICY ........................................................................................................... 17
ANNEX II: METHODOLOGY......................................................................................................................... 19 STEP 1. IDENTIFICATION OF MISSING VALUES................................................................................................ 19 STEP 2. CALCULATION OF AGGREGATED QUANTITIES .................................................................................... 20 STEP 3. CALCULATION OF QUANTITY PURCHASED PER PERSON FOR EACH HOUSEHOLD I (HQPI)................... 21 STEP 4. CALCULATION OF THE AVERAGE QUANTITY PURCHASED PER PERSON ................................................ 22 STEP 5. ANNUALISE, IF NEEDED, THE VALUES OBTAINED IN STEP 4................................................................. 22 STEP 6. ESTIMATE DAILY AVERAGE OF FOOD CONSUMPTION.......................................................................... 22
ANNEX II: ANNUAL MEAN FOOD AVAILABILITY PER PERSON ...................................................... 23
ANNEX III: DAILY MEAN FOOD AVAILABILITY PER PERSON......................................................... 38
ANNEX V: DETAILED FOOTNOTES ........................................................................................................... 53
1. INTRODUCTION
This document presents the summary results of using data on food quantities purchased by households in order to estimate a set of indicators on food consumption. The results are based on data provided by those Member States already collecting food quantities from their national Household Budget Surveys (HBS). Results refer to 2005 HBS waves.
2. BACKGROUND
Based on the general requirement to have statistical data on food consumption in a sustainable and harmonised way the Working Group “Food safety statistics” selected food consumption as a priority theme at the end of 2003 and decided to establish a Task Force on this topic during 2005. The Working Group also recommended analysing already available data sources before launching new surveys.
The Task Force set up in 2005, identified a wide range of needs for food consumption data and consumption determinants (educational level, type of settlement, income level, etc.), and showed that the potential data sources not only fail to meet all requirements but also are not harmonised at EU level. There was also necessity to distinguish the data required to monitor policies from the data essential to conduct scientific studies and as the scope of the work was too wide, it was decided that the statistical offices should be only involved in the collection of data to monitor policies.

Eurostat/Unit F5 Food consumption statistics - Results using data collected from HBS Food safety statistics ESTAT/F5/ES/204 Rev.1
2/57
Therefore, Eurostat addressed its work in 2006 in two directions. On one hand trying to involve its partners in food consumption data collection by launching grants to help the statistical offices to find efficient ways to collect these data. On the other, Eurostat launched a call for tenders to design a limited number of indicators to monitor two of the policy needs: food safety and health and nutrition.
The contractor RIVM1 carried out this work during 2007 and the Task force was re-edited with the objective of assisting Eurostat and the contractor to identify the final list of indicators. It also analysed the usefulness of available data sources for building the indicators. This work led to the identification of several indicators of food consumption to monitor some 'food safety risks due to contaminants' and 'health and nutrition' policies (see Annex I). The analysis of the three data sources (Supply Balance Sheets, DAFNE and EFSA concise database) carried on by RIVM showed that DAFNE2 (based on Household Budget Surveys) and the EFSA concise database (based on dietary surveys) could provide usable data for most of the indicators related to health and nutrition while none of the analysed data sources seemed usable to build indicators related to the selected contaminants.
Following the results of the work carried out in 2007 Eurostat decided to concentrate its efforts on continuing the work done previously by the DAFNE project because Eurostat already receives a lot of variables from the Household Budget Surveys carried on by National Statistical Offices. For this purpose, Eurostat organised a written consultation in February 2008 of members of both 'Living Conditions' and 'Food Safety' Working Groups to evaluate the possibilities and willingness of Member States to send to Eurostat also the data on food quantities in the requested format (micro-data files at household level, or aggregated tables) for those countries where this information was already collected for national purposes within the most recent wave of HBS (2004-2005). For the cases where national authorities needed financial support to carry out this work Eurostat launched a call for proposals during 2008.
Eurostat received data on food quantities purchased by households from 21 countries: 17 in the form of micro-data and 4 of them only as aggregated tables (food purchased by adult equivalent). At the meeting of the Working Group "Food Safety Statistics" held on 24-25 June 2010, Eurostat presented the first preliminary results (see doc. ESTAT/F5/ES/204 “First results using data collected from HBS”). A more complete methodological work was presented later on at the meeting of the Working Group “Statistics on Living Conditions” held on 11-13 May 2011. During the discussions held at that meeting it appeared that the analysis should focus on estimating the average food consumption by person rather than the food consumption by adult equivalent as initially planned.
Eurostat has reviewed all the calculations in order to estimate the food consumption per person. This document and its annexes present the full results of this work.
1 RIVM: Dutch National Institute for Public Health and the Environment 2 DAFNE: Data Food Network, EU project financed by the EU

Eurostat/Unit F5 Food consumption statistics - Results using data collected from HBS Food safety statistics ESTAT/F5/ES/204 Rev.1
3/57
3. DATA AVAILABLE
Eurostat received data on food quantities purchased by households from 21 countries, nine of them with the financial help from Eurostat. Table 1 below summarises the data provided:
Table 1 Data on food quantities collected from 2004/2005 HBS surveys and provided to Eurostat
Grants 2008 Without financial help
Micro-data at individual level RO
Micro-data at household level BE, BG, EL, LV, LT, HU, MT EE, ES, FR, PL, RO, SI, SK, FI, UK, NO
Aggregated tables (average food quantities per
adult equivalent) BE, BG, EL, DE, NL CZ, PT
As indicated on the table above, Belgium, Bulgaria and Greece provided micro-data files at household level as well as aggregated tables and Romania provided both micro-data files at household and individual level.
Denmark, Italy, Luxembourg, Cyprus, Austria, Portugal, Sweden and Iceland were not collecting food quantities at that time. However Cyprus mentioned their intention to collect them in their 2008/2009 survey and Austria and Sweden indicated they would do it in their next surveys (2009/2010).
Italy mentioned that, from previous experiences, including food quantities in the survey had a negative impact on collecting expenditure in monetary terms, which is the main objective of the Household Budget Surveys. Luxembourg experienced similar problems. Italy mentioned their plans to have a separate survey (satellite to the HBS) every 5 years for example, focusing on collecting food consumption and not on food expenditure.
Denmark explored in 2005 the possibility to estimate food quantities purchased by households by deflating food expenditure with the help of consumer prices.
The results included in this report are based on micro-data at household level and as a consequence, they concern only the countries providing such data (countries in second row of table 1).
4. USING FOOD QUANTITIES FROM HBS
Although there is a clear distinction between the "food quantities purchased by households" and the real "food consumption of households", the first-one could be used as a proxy variable for "food consumption", which is the variable of interest. In several countries, data also include food quantities received by the household from gifts as well as food obtained from the household kitchen garden. So, the food quantities collected from household budget surveys could be considered as the "food available" to the persons living in the household.
Eurostat has estimated:

Eurostat/Unit F5 Food consumption statistics - Results using data collected from HBS Food safety statistics ESTAT/F5/ES/204 Rev.1
4/57
• the average daily food quantities purchased per person (food available per person), at the detailed COICOP 5-digit level as well as at the upper aggregated levels (COICOP 4-digits) when they were not provided.
• some of the agreed food consumption indicators to monitor health and nutrition policies.
The indicators were calculated as aggregates of items at the most detailed COICOP level, where data were available and of good quality. From the list of agreed indicators, Eurostat estimated “Fruit consumption” and “Vegetable consumption”. They are highly required and should be of good quality taking into consideration the available level of detail of the data required. Eurostat also calculated the availability per person of "Sugar containing beverages".
The Task Force also identified possible determinants of food consumption like the educational level of the household head, the type of settlement, etc. So, Eurostat has also calculated:
• Average daily food quantities purchased per person, by:
o educational level of the household head o type of settlement o income quartile
The methodology used for the calculations is described in Annex II.
5. RESULTS
“Annual mean food availability per person” and the “Daily means food availability per person” have been calculated for the following 16 countries: Belgium, Bulgaria, Estonia, Greece, Spain, France, Latvia, Lithuania, Hungary, Malta, Poland, Romania, Slovenia, Slovakia, United Kingdom and Norway. Detailed tables are presented respectively in Annex III and Annex IV.
Results for Finland are not included in the report because there was no clear information on the reference period of the collected food quantities. Data for Germany, Czech Republic, Netherlands and Portugal are also not included in this report because they were not provided in the form of micro-data but as aggregated data on quantities purchased by adult equivalent.
Some countries used units of measurement different than those proposed by Eurostat. In some cases, Eurostat used a conversion in order to summarise the results for all countries. For example, most of the countries measure oils (olive oil and other edible vegetable oils) in litres; quantities in kg provided by Norway have been converted by Eurostat into litres using 1 litre = 0.9 kg. At the contrary, most of the countries provided eggs in units, Norway in kg. No conversion from kg to units has been made in this case.
5.1. Mean daily food quantities per person
The results of Daily average of food purchased (food availability) by person are presented in Annex IV. The following charts illustrate the comparison across countries.

Eurostat/Unit F5 Food consumption statistics - Results using data collected from HBS Food safety statistics ESTAT/F5/ES/204 Rev.1
5/57
Mean quantities of food products purchased, by person (g/day)
0.0
50.0
100.0
150.0
200.0
250.0
300.0
350.0
400.0
BG 2005
EE 2005
EL 2004/2005
ES 2004
FR 2005
LV 2005
LT 2005
HU 2005
MT 2008
PL *2005
RO 2005
SI 2004
SK 2006
UK 2005
NO 2003-2005
HQ0111 Bread and cereals HQ0112 Meat HQ0113 Fish HQ0113 Fruit, including fruit juices
* Poland: measurement unit for Bread and cereals not mentioned
Mean quantities of fresh, chilled or frozen meat purchased by person (g/day)
0.0
10.0
20.0
30.0
40.0
50.0
60.0
70.0
80.0
90.0
100.0
BE 2005
BG 2005
EE 2005
EL 2004/2005
ES 2004
FR 2005
LV 2005
LT 2005
HU 2005
MT 2008
PL 2005
RO 2005
SI 2004
SK 2006
UK 2005
NO 2003-2005
HQ01121 Beef and veal HQ01122 Pork HQ01123 Sheep and goats HQ01124 Poultry Mean quantities of meat products and preparations purchased, by person (g/day)
0.0
10.0
20.0
30.0
40.0
50.0
60.0
70.0
80.0
90.0
BE 2005
BG 2005
EE 2005
EL 2004/2005
ES 2004
FR 2005
LV 2005
LT 2005
HU 2005
MT 2008
PL 2005
RO 2005
SI 2004
SK 2006
UK 2005
NO 2003-2005
HQ01125 Dried, salted or smoked meat and edible meat offal HQ01126 Other preserved or processed meat and meat preparations

Eurostat/Unit F5 Food consumption statistics - Results using data collected from HBS Food safety statistics ESTAT/F5/ES/204 Rev.1
6/57
Mean quantities of eggs purchased, by person (units/day)
0.0
0.1
0.2
0.3
0.4
0.5
0.6
0.7
BE2005
BG2005
EE2005
ES2004
FR2005
LV2005
LT2005
HU2005
MT2008
PL2005
RO2005
SI 2004
SK2006
UK2005
Data for Norway are not included on this chart because provided in number of units. Data for Greece is close to 0.
Mean quantities of dairy products purchased, by person
0.0
25.0
50.0
75.0
100.0
125.0
150.0
175.0
200.0
225.0
250.0
BE 2005
BG *2005
EE 2005
EL 2004/2005
ES 2004
FR 2005
LV 2005
LT 2005
HU 2005
MT 2008
PL 2005
RO 2005
SI 2004
SK 2006
UK 2005
NO 2003-2005
HQ01141 Whole milk (ml/day) HQ01142 Low fat milk (ml/day) HQ01144 Yoghurt (g/day) HQ01145 Cheese and curd (g/day)
* Bulgaria: Data for whole milk includes also low fat milk
Mean quantities of fats and oils purchased by person
0.0
10.0
20.0
30.0
40.0
50.0
60.0
70.0
BE 2005
BG 2005
EE 2005
EL 2004/2005
ES 2004
FR 2005
LV 2005
LT 2005
HU 2005
MT 2008
PL 2005
RO 2005
SI 2004
SK 2006
UK 2005
NO 2003-2005
HQ01151 Butter (g/day) HQ01152 Margarine and other vegetable fats (g/day) HQ01153 Olive oil (ml/day) HQ01154 Other veget. edible oils (ml/day)

Eurostat/Unit F5 Food consumption statistics - Results using data collected from HBS Food safety statistics ESTAT/F5/ES/204 Rev.1
7/57
Mean quantities of fruit, vegetables and potatoes purchased, by person (g/day)
0.0
50.0
100.0
150.0
200.0
250.0
300.0
350.0
BG 2005
EE 2005
EL 2004/2005
ES 2004
FR 2005
LV 2005
LT 2005
HU 2005
MT 2008
PL 2005
RO 2005
SI 2004
SK 2006
NO 2003-2005
Fruit (includes fruit juices) Vegetables (includes vegetable juices; excludes potatoes) HQ01177 Potatoes
Mean quantities of sugar products purchased, by person (g/day)
0.0
10.0
20.0
30.0
40.0
50.0
60.0
70.0
BE 2005
BG 2005
EE 2005
EL 2004/2005
ES 2004
FR 2005
LV 2005
LT 2005
HU 2005
MT 2008
PL 2005
RO 2005
SI 2004
SK 2006
UK 2005
NO 2003-2005
HQ01181 Sugar HQ01182 Jams, marmalades HQ01183 Chocolate
Mean quantities of mineral waters, soft drinks and juices purchased, by person (ml/day)
0.0
50.0
100.0
150.0
200.0
250.0
300.0
350.0
400.0
450.0
BE 2005
BG 2005
EE 2005
EL 2004/2005
ES 2004
FR 2005
LV 2005
LT 2005
HU 2005
MT 2008
PL 2005
RO 2005
SI 2004
SK 2006
UK 2005
NO 2003-2005
HQ01221 Mineral or spring w aters HQ01222 Soft drinks HQ01223 Fruit juices HQ01224 Vegetable juices

Eurostat/Unit F5 Food consumption statistics - Results using data collected from HBS Food safety statistics ESTAT/F5/ES/204 Rev.1
8/57
Mean quantities of alcoholic beverages purchased, by person (ml/day)
0.0
25.0
50.0
75.0
100.0
125.0
150.0
BE 2005
BG 2005
EE 2005
EL 2004/2005
ES 2004
FR 2005
LV 2005
LT 2005
HU 2005
MT 2008
PL 2005
RO 2005
SI 2004
SK 2006
UK *2005
NO 2003-2005
HQ0211 Spirits and liqueurs HQ02121 Wine from grapes or other fruit
HQ02122 Wine-based aperitifs, champagne and other sparkling w ines HQ0213 Beer * United Kingdom, beer: 193.4 ml/day

Eurostat/Unit F5 Food consumption statistics - Results using data collected from HBS Food safety statistics ESTAT/F5/ES/204 Rev.1
9/57
5.2. Analysis by main consumption determinants
Eurostat made also an analysis of data by some consumption determinants identified by the Task Force in 2005, in particular the educational level, the degree of urbanisation (rural, urban) and the income level. This was done for 4 countries representative of different geographical areas of the European Union and for which data were sufficiently complete: Spain, Bulgaria, Estonia and Slovakia. The graphs below illustrate the results:
• by educational level of the head of the household
Mean food quantities purchased per person (g/day, ml/day) by educational level of the household head
Spain - 2004
0,0
50,0
100,0
150,0
200,0
250,0
300,0
350,0
400,0
450,0
Primary education Secondary education Higher education
Bread and cereals Meat Fish VegetableFruit Sugar "version short" Sugar "version large"
Mean food quantities purchased per person (g/day, ml/day) by educational level of the household head
Bulgaria - 2005
0,0
100,0
200,0
300,0
400,0
500,0
600,0
None Primary education Secondary education Higher education
Bread and cereals Meat Fish VegetableFruit Sugar "version short" Sugar "version large"
Sugar "version short": soft drinks and fruit juices Sugar "version large": sugar "version short", coffee, tea, chocolate and powdered chocolate, milk (whole milk, low fat milk and preserved milk)
Code_HC08 Label_HC08 None 0 No information Primary education 1 Primary school and first phase of secondary education (ISCED = 1,2) Secondary education 2 Second phase of secondary education (ISCED = 3, 4) Higher education 3 Higher education (ISCED = 5, 6, 7)

Eurostat/Unit F5 Food consumption statistics - Results using data collected from HBS Food safety statistics ESTAT/F5/ES/204 Rev.1
10/57
Mean food quantities purchased per person (g/day, ml/day) by educational level of the household head
Estonia - 2005
0,0
50,0
100,0
150,0
200,0
250,0
300,0
Primary education Secondary education Higher education
Bread and cereals Meat Fish VegetableFruit Sugar "version short" Sugar "version large"
Mean food quantities purchased per person (g/day, ml/day) by educational level of the household head
Slovakia - 2006
0,0
50,0
100,0
150,0
200,0
250,0
300,0
350,0
400,0
450,0
None Primary education Secondary education Higher education
Bread and cereals Meat Fish VegetableFruit Sugar "version short" Sugar "version large"
Sugar "version short": soft drinks and fruit juices Sugar "version large": sugar "version short", coffee, tea, chocolate and powdered chocolate, milk (whole milk, low fat milk and preserved milk)
Code_HC08 Label_HC08 None 0 No information Primary education 1 Primary school and first phase of secondary education (ISCED = 1,2) Secondary education 2 Second phase of secondary education (ISCED = 3, 4) Higher education 3 Higher education (ISCED = 5, 6, 7)

Eurostat/Unit F5 Food consumption statistics - Results using data collected from HBS Food safety statistics ESTAT/F5/ES/204 Rev.1
11/57
• by type of settlement
Mean food quantities purchased per person (g/day, ml/day) by type of settlementSpain - 2004
0,0
50,0
100,0
150,0
200,0
250,0
300,0
350,0
400,0
450,0
Densely populated Intermediate Sparsely populated
Bread and cereals Meat Fish VegetableFruit Sugar "version short" Sugar "version large"
Mean food quantities purchased per person (g/day, ml/day) by type of settlementBulgaria - 2005
0,0
50,0
100,0
150,0
200,0
250,0
300,0
350,0
400,0
450,0
Densely populated Intermediate Sparsely populated
Bread and cereals Meat Fish VegetableFruit Sugar "version short" Sugar "version large"
Sugar "version short": soft drinks and fruit juices Sugar "version large": sugar "version short", coffee, tea, chocolate and powdered chocolate, milk (whole milk, low fat milk and preserved milk)
Code_HA09 Label HA09
Densely populated 1 Densely populated (at least 500 inhabitants/km2) Intermediate 2 Intermediate (between 100 and 499 inhabitants/km2) Sparsely populated 3 Sparsely populated (less than 100 inhabitants/km2)

Eurostat/Unit F5 Food consumption statistics - Results using data collected from HBS Food safety statistics ESTAT/F5/ES/204 Rev.1
12/57
Mean food quantities purchased per person (g/day, ml/day) by type of settlementEstonia - 2005
0,0
50,0
100,0
150,0
200,0
250,0
300,0
350,0
Densely populated Intermediate Sparsely populated
Bread and cereals Meat Fish VegetableFruit Sugar "version short" Sugar "version large"
Mean food quantities purchased per person (g/day, ml/day) by type of settlementSlovakia - 2006
0,0
50,0
100,0
150,0
200,0
250,0
300,0
350,0
Densely populated Intermediate Sparsely populated
Bread and cereals Meat Fish VegetableFruit Sugar "version short" Sugar "version large"
Sugar "version short": soft drinks and fruit juices Sugar "version large": sugar "version short", coffee, tea, chocolate and powdered chocolate, milk (whole milk, low fat milk and preserved milk)
Code_HA09 Label HA09 Densely populated 1 Densely populated (at least 500 inhabitants/km2) Intermediate 2 Intermediate (between 100 and 499 inhabitants/km2) Sparsely populated 3 Sparsely populated (less than 100 inhabitants/km2)
Eurostat/Unit F5 Food consumption statistics - Results using data collected from HBS Food safety statistics ESTAT/F5/ES/204 Rev.1
13/57
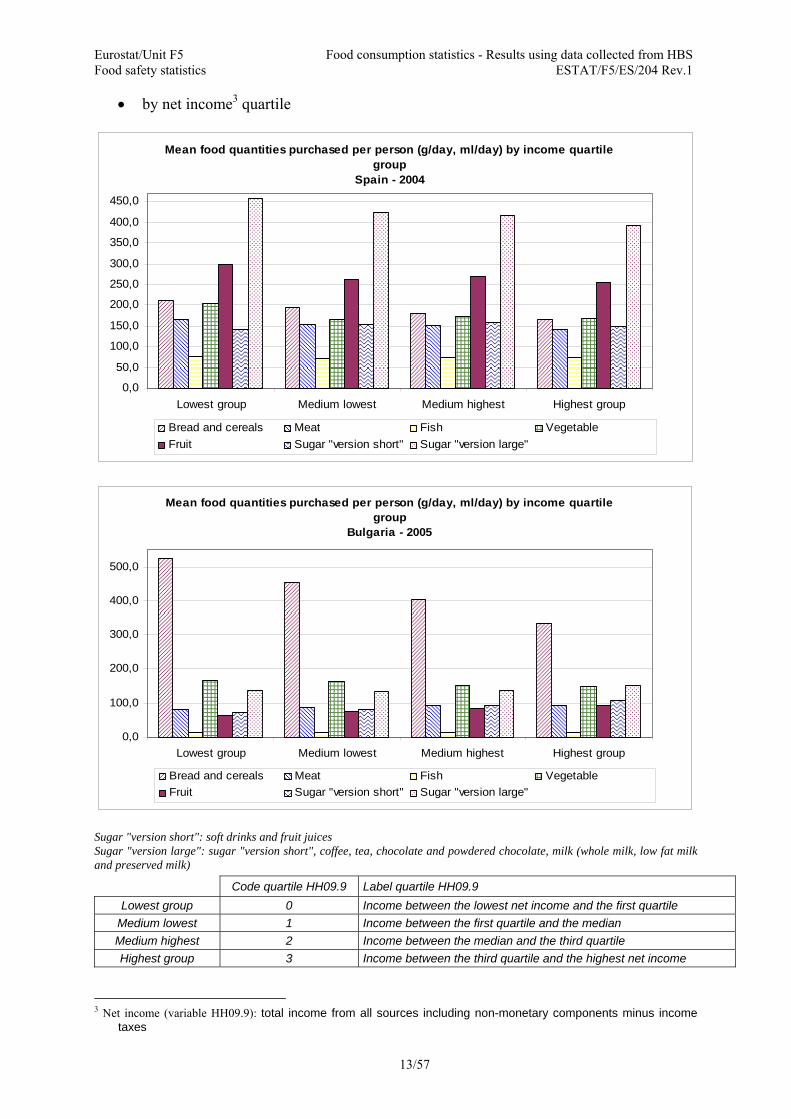
• by net income3 quartile
Mean food quantities purchased per person (g/day, ml/day) by income quartile group
Spain - 2004
0,0
50,0
100,0
150,0
200,0
250,0
300,0
350,0
400,0
450,0
Lowest group Medium lowest Medium highest Highest group
Bread and cereals Meat Fish VegetableFruit Sugar "version short" Sugar "version large"
Mean food quantities purchased per person (g/day, ml/day) by income quartile group
Bulgaria - 2005
0,0
100,0
200,0
300,0
400,0
500,0
Lowest group Medium lowest Medium highest Highest group
Bread and cereals Meat Fish VegetableFruit Sugar "version short" Sugar "version large"
Sugar "version short": soft drinks and fruit juices Sugar "version large": sugar "version short", coffee, tea, chocolate and powdered chocolate, milk (whole milk, low fat milk and preserved milk) Code quartile HH09.9 Label quartile HH09.9
Lowest group 0 Income between the lowest net income and the first quartile Medium lowest 1 Income between the first quartile and the median Medium highest 2 Income between the median and the third quartile Highest group 3 Income between the third quartile and the highest net income
3 Net income (variable HH09.9): total income from all sources including non-monetary components minus income
taxes

Eurostat/Unit F5 Food consumption statistics - Results using data collected from HBS Food safety statistics ESTAT/F5/ES/204 Rev.1
14/57
Mean food quantities purchased per person (g/day, ml/day) by income quartile group
Estonia - 2005
0,0
50,0
100,0
150,0
200,0
250,0
300,0
Lowest group Medium lowest Medium highest Highest group
Bread and cereals Meat Fish VegetableFruit Sugar "version short" Sugar "version large"
Mean food quantities purchased per person (g/day, ml/day) by income quartile group
Slovakia - 2005
0,0
50,0
100,0
150,0
200,0
250,0
300,0
Lowest group Medium lowest Medium highest Highest group
Bread and cereals Meat Fish VegetableFruit Sugar "version short" Sugar "version large"
Sugar "version short": soft drinks and fruit juices Sugar "version large": sugar "version short", coffee, tea, chocolate and powdered chocolate, milk (whole milk, low fat milk and preserved milk)
Code quartile HH09.9 Label quartile HH09.9
Lowest group 0 Income between the lowest net income and the first quartile Medium lowest 1 Income between the first quartile and the median Medium highest 2 Income between the median and the third quartile Highest group 3 Income between the third quartile and the highest net income

Eurostat/Unit F5 Food consumption statistics - Results using data collected from HBS Food safety statistics ESTAT/F5/ES/204 Rev.1
15/57
6. CONCLUSION
This exercise is the continuation of a work done by the DAFNE project which has been recognised as a resource for conducting a wide range of nutritional analyses.
Results show that despite an important dispersion of data across households the relative standard errors of the food availability are rather low for most of the food categories. This is particularly the case for the mean availability of fruit and mean availability of vegetables.
However, the use of food quantities collected from Household Budget Surveys for estimating most of the indicators identified for the monitoring of health and nutrition policy would request a highest level of detail of the food products, and the necessary expertise of nutritionists, to estimate them.
For this reason, and taking into consideration the quality of the results at COICOP 5-digits level Eurostat proposes to continue using these data for calculating indicators on mean daily food availability per person (mean daily food quantities purchased) at COICOP 5 and 4-digit levels as well as for the mean availability of fruit and availability of vegetables. These data could be further used by nutritionists for conducting nutritional analyses.
These results and main conclusions are sent to the national experts of the Household Budget Surveys in the Member States, for their opinion.
During the data elaboration Eurostat has encountered several problems. In case Member States agree on continuing this exercise, Eurostat proposes to take into consideration the following suggestions for improving the data collection in future:
1) Missing values versus "real zero" values:
• It was not always clear if a 0 or a blank is a real 0 or a missing value.
Proposed improvements: Eurostat suggests indicating always a blank for a missing value and 0 for a real 0.
2) Units of measurement:
• Lack of information about the units of measurement causes ambiguity. This was the case for the following list of variables of food quantities due to the variety of products included under each heading:
Code Label
HQ0111 Bread and cereals
HQ01115 Sandwiches
HQ01116 Other cereal products
HQ0115 Oils and fats
HQ0118 Sugar, jam, honey, chocolate and confectionery
HQ01184 Confectionery products
HQ01186 Other sugar products
HQ0119 Food products n.e.c.
HQ01191 Sauces, condiments
HQ01192 Salt, spices and culinary herbs
HQ01193 Baby food, dietary preparations, baker's yeast and other food preparations
HQ01194 Other food products n.e.c.

Eurostat/Unit F5 Food consumption statistics - Results using data collected from HBS Food safety statistics ESTAT/F5/ES/204 Rev.1
16/57
In general, countries reported values in kg but some of them did not indicate the unit of measure.
Proposed improvements: indicate always the unit of measure used for each item. For the list of items above, Eurostat proposes in future to use kg as unit of measurement.
• Some aggregated product categories like "Oils and fats" include products measured with different units.
Proposed improvements: indicate always the conversion factor used to calculate the aggregated quantities.
3) Classification of food items and level of detail:
• Using a different classification than COICOP.
Proposed improvements: it would be desirable that countries send their data according to COICOP classification in order to ensure comparability between the countries and to avoid potential errors of post-harmonisation being made by Eurostat.
• Providing data at different levels of detail
Proposed improvement: Eurostat suggests also providing data related to the COICOP at 4 digits level in order to perform analysis by determinants also at 4-digits level of COICOP.
4) Reference period:
• Lack of information on reference period of the food quantities data collected
Proposed improvements: Member States should clearly indicate the reference period for the food quantities data provided in order to calculate appropriate daily and annual averages per person.
5) Definition of food quantities:
• Some countries provided the food quantities purchased (corresponding to HExxxxxiA, expenditure effected in monetary form).
Proposed improvement: In order to obtain results as close as possible to food consumption, or at least closer to food availability, Eurostat invite all the countries to provide quantities corresponding to HExxxxxiC where:
HExxxxxiA = expenditure effected in monetary form
HExxxxxiB = expenditure effected in non-monetary form
HExxxxxiC = total sum.

Eurostat/Unit F5 Food consumption statistics - Results using data collected from HBS Food safety statistics ESTAT/F5/ES/204 Rev.1
17/57
ANNEX I: LIST OF FOOD CONSUMPTION INDICATORS TO MONITOR FOOD SAFETY AND HEALTH AND NUTRITION POLICY
Health and nutrition policy Nutrients Indicator Population Usefulness of data sources Energy intake
average consumption (g/day) of cereals and potatoes, milk, meats, added fats, eggs, vegetables and fruit and sugar containing beverages
whole population (Food supply Balance Sheets) HBS EFSA concise database (dietary surveys)
Saturated fatty acids
average consumption (g/day) of milk and milk products (high/low fat), cheese, meat and meat products (high/low fat), butter, fats (high/low fat), oils
whole population HBS EFSA concise database (dietary surveys) New survey to investigate more relevant food subgroups
Fish fatty acids
average consumption (g/day) of fish and fatty fish
Whole population (children, adolescents, adults and elderly).
(Food supply Balance Sheets) HBS EFSA concise database (dietary surveys) New survey to distinguish between fatty fish and lean fish
average consumption frequency of fish and fatty fish
New survey to distinguish between fatty fish and lean fish
Dietary fibre average consumption of bread (wholemeal / low fibre), breakfast cereals (wholemeal / low fibre), vegetables, potatoes, fruit
Whole population (children, adolescents, adults and elderly).
HBS EFSA concise database (dietary surveys) (except bread rolls)
Calcium average intake (g/day) of cheese, milk and other milk products
Whole population (children, adolescents, adults and elderly).
HBS EFSA concise database (dietary surveys)
% of users of Ca supplements, % of users of multivitamin/mineral supplements
New survey to gather data on food supplements
Sodium average consumption (g/day) of bread, other processed cereals, processed meat, cheese and other milk products, snacks
Whole population (children, adolescents, adults and elderly).
HBS
Iodine average consumption (g/day) of milk and milk products ?????
Whole population (children, adolescents, adults and elderly).
Food supply Balance Sheets HBS EFSA concise database (dietary surveys)
% of households using iodized salt New survey to collect use of iodized salt
Vegetables consumption
average consumption (g/day) of vegetables, excluding potatoes
Whole population (children, adolescents, adults and elderly).
Food supply Balance Sheets HBS EFSA concise database (dietary surveys)
Fruit consumption
average consumption (g/day) of fruit and fruit juices
Whole population (children, adolescents, adults and elderly).
Food supply Balance Sheets HBS EFSA concise database (dietary surveys)
Variation in vegetable and fruit consumption
number of different fruit and vegetables consumed during a certain period of time
Whole population (children, adolescents, adults and elderly).
New data collection
Sugar containing beverages consumption
average consumption (g/day) of sugar containing beverages (beverages with added sugar, fruit juices; milk, coffee and tea with added sugar)
Children, adolescents, adults
New data collection

Eurostat/Unit F5 Food consumption statistics - Results using data collected from HBS Food safety statistics ESTAT/F5/ES/204 Rev.1
18/57
Food safety policy Contaminants
Indicator Population Usefulness of data sources
Acrylamide high percentile (P95, P97.5) of long-term consumption of potato products fried (French fries), crisps, baked goods (cookies, pies, cakes)
Whole population, specially young children
New data should be collected from individual surveys
Dioxins, PCBs4, PBDE5
high percentile (P95, P97.5) of long-term consumption of meats, (fatty) fish and dairy products
Whole population, specially young children
EFSA concise database (dietary surveys)
Methyl mercury
high percentile (P95, P97.5) of long-term consumption of predator fish, for the subpopulation groups
Pregnant women, breastfeeding women, young children
New data should be collected from individual surveys
Nitrate / nitrite
high percentile (P95, P97.5) of long-term consumption of high nitrate vegetables (spinach, lettuce, endive and beets, potatoes and processed meat
Whole population, specially young children
EFSA concise database (dietary surveys) (only for potatoes) New survey for vegetables high in nitrate (spinach, lettuce, endive and beets)
4 PCBs: Polychlorobiphenyls 5 PBDE: Polybrominated diphenyl ethers

Eurostat/Unit F5 Food consumption statistics - Results using data collected from HBS Food safety statistics ESTAT/F5/ES/204 Rev.1
19/57
ANNEX II: METHODOLOGY
Micro-data files on food quantities have been linked by the household identification number (code HA04) with the micro-data files provided previously with data on household expenditure and many other variables.
The following variables were selected from the expenditure file:
Variable code Variable name HA02 Survey reference year HA04 Household ID number HA08 Region HA09 Population density HA10 Weights HB05 Household size (number of persons per household) HB06.2 Equivalent size (modified OECD scale) HB07.1 Type of household – 1 (age limit for children set in 16 years old) HB07.2 Type of household – 2 (age limit for children set in 18 years old) HC03 Sex of ref. person HC04 Age of ref. person HC08 Level of studies completed by the reference person HC12 Current activity status of reference person HC16 Usual activity status of reference person HC18 Occupation of reference person (ISCO 1988 (COM)) HC23 Socio-economic situation (detailed) of reference person HC24 Socio-economic situation of reference person (aggregated classification) HH09.9 Net income (total income from all sources including non-monetary components
minus income taxes) HE01 - HE02.1.3.1
Expenditure of Food and non-alcoholic beverages
The inclusion of expenditure on food products (variables HExxxxx) allowed checking if reported 0 quantities are real 0 or missing values.
Eurostat estimated the average food purchases per person using the following method:
Step 1. Identification of missing values Quantities reported as 0 were checked in order to verify if they were real 0 or missing values, according the following criterion:
for any HQxxxxxi = 0, check the corresponding HExxxxxi;
if HExxxxxi = 0 then HQxxxxxi = 0;
if HExxxxxi ≠ 0 then HQxxxxxi = missing value
where:
xxxxx: COICOP codes of food products and beverages; i = ID Household = 1, 2, …., n.
For all the countries, except Bulgaria, HQxxxxxi correspond to HExxxxxiC, where:
HExxxxxiA = expenditure effected in monetary form HExxxxxiB = expenditure effected in non-monetary form HExxxxxiC = total sum.

Eurostat/Unit F5 Food consumption statistics - Results using data collected from HBS Food safety statistics ESTAT/F5/ES/204 Rev.1
20/57
For Bulgaria HQxxxxxi correspond to HExxxxxiA
Step 2. Calculation of aggregated quantities In order to estimate the agreed indicators to monitor health and nutrition policy, specific aggregates were calculated summing up the corresponding breakdowns. These are:
Purchased quantities of vegetables and vegetables juices (proxy for Vegetables consumption)
HQ01171 Leaf and stem vegetables (fresh, chilled or frozen) HQ01172 Cabbages (fresh, chilled or frozen) HQ01173 Vegetables cultivated for their fruit (fresh, chilled or frozen) HQ01174 Root crops, non-starchy bulbs and mushrooms (fresh, chilled or frozen) HQ01175 Dried vegetables HQ01176 Other preserved or processed vegetables HQ01178 Other tubers and products of tuber vegetables HQ01224 Vegetable juices
Due to the presence of many missing values for HQ01176 and HQ01178, for some countries the following alternative formula has been used:
HQ0117 (Vegetables) – HQ01177 (Potatoes) + HQ01224 (Vegetable juices)
when data for HQ0117 was available
Purchased quantities of fruit and fruit juices (proxy for Fruit consumption) HQ01161 Citrus fruits (fresh, chilled or frozen) HQ01162 Bananas (fresh, chilled or frozen) HQ01163 Apples (fresh, chilled or frozen) HQ01164 Pears (fresh, chilled or frozen) HQ01165 Stone fruits (fresh, chilled or frozen) HQ01166 Berries (fresh, chilled or frozen) HQ01167 Other fresh, chilled or frozen fruits HQ01168 Dried fruit HQ01169 Preserved fruit and fruit based products HQ01223 Fruit juices
Due to the presence of many missing values in the breakdown, for some countries the following alternative formula has been used:
HQ0116 (Fruit) + HQ01223 (Fruit juices), when data for HQ0116 was available

Eurostat/Unit F5 Food consumption statistics - Results using data collected from HBS Food safety statistics ESTAT/F5/ES/204 Rev.1
21/57
The consumption of sugar containing beverages has been calculated in 2 different ways, a version “large” and a version “short”:
Quantities purchased of sugar containing beverages (version "large") HQ01211 Coffee g HQ01212 Tea g HQ01213 Cocoa and powdered chocolate g HQ01222 Soft drinks g HQ01223 Fruit juices g HQ01141 Whole milk g HQ01142 Low fat milk g HQ01143 Preserved milk g
Quantities purchased of sugar containing beverages (version "short") HQ01222 Soft drinks g HQ01223 Fruit juices g
However, for both cases these indicators are considered rather rough estimates.
In addition, Eurostat calculated the following aggregates for the countries not providing them:
Countries COICOP code Product categories HQ0111 Bread and cereals
HQ0112 Meat BE, BG, LV, LT, MT, SK, UK
HQ0113 Fish
HQ01112 Bread
HQ01116 Other cereal products
HQ01131 Fresh, chilled or frozen fish BE
HQ01133 Dried, smoked or salted fish and seafood
FR HQ0113 Fish
FI HQ0112 Meat All aggregates have been calculated adding the data only for those households where all sub-items have available data (different or equal to zero). Households for which at least one of the sub-items was missing were excluded from the calculation.
Step 3. Calculation of Quantity purchased per person for each Household i (HQPi)
iHBHQiHQPi
05=
where:
HQi = quantity purchased by Household i of each aggregate in Step 2 and each item at the more detailed COICOP level
HB05i = Household i size (number of persons of Household i)

Eurostat/Unit F5 Food consumption statistics - Results using data collected from HBS Food safety statistics ESTAT/F5/ES/204 Rev.1
22/57
Step 4. Calculation of the Average quantity purchased per person
∑∑
∑∑ =
=
=
=
×=×
××
n
in
i
n
in
i
Wi
WiHQPiiHAiHB
iHAiHBHQPi1
1
1
1
1005
1005
where:
iHAiHBWi 1005 ×= (weight of each person of household i)
i = ID Household = 1, 2, …., n
n = total number of Households in the sample
HB05i = Household i size (number of persons of Household i)
HA10i = Weight of Household i
The calculation includes the Standard Deviation, Maximum and Minimum values and Confidence limits at 95% level.
Step 5. Annualise, if needed, the values obtained in step 4. This step is needed for future comparisons with data from other sources like the annual agricultural supply balance sheets.
Step 6. Estimate daily average of food consumption It was calculated by dividing the values in step 4 above by the number of days of the reference period of the data collection.
Data for Romania and Slovakia were provided in quantities by month. Annual estimates have been calculated by Eurostat by multiplying the data by 12; daily estimates calculated dividing annual data by 365.
Data for Malta and the United Kingdom covered two weeks. Annual estimates have been calculated by Eurostat dividing the data by 14 and multiplying by 365; daily estimates calculated dividing the data by 14.

Eurostat/Unit F5 Food consumption statistics - Results using data collected from HBS Food Safety Statistics ESTAT/F5/ES/204 Rev.1
23/57
ANNEX II: ANNUAL MEAN FOOD AVAILABILITY PER PERSON Annual mean food availability per person (food quantities purchased per person) (FQP)
YearSurveyed households, number
Code Label and measurement unit FQP Std Dev N LCL 95% UCL 95% flag FQP Std Dev N LCL 95% UCL 95% flag FQP Std Dev N LCL 95% UCL 95% flag FQP Std Dev N LCL 95% UCL 95% flagkg 88,0 34,0 13 69,5 106,5 10 142,5 71,7 2870 139,9 145,1 10 80,3 55,3 3432 78,4 82,1 86,9 45,0 6502 85,8 88,0?
HQ01111 Rice kg 4,2 4,4 927 3,9 4,5 6,3 4,2 2870 6,2 6,5 3,0 5,9 3432 2,8 3,2 10,0 8,7 3451 9,7 10,3 3HQ01112 Bread kg 39,6 24,1 2068 38,6 40,6 10 115,6 63,9 2870 113,3 118,0 50,8 32,7 3432 49,7 51,9 60,4 31,8 6457 59,6 61,2 3HQ011121 Bread: wholemeal kg 18,7 18,9 2416 17,9 19,4 1 22,8 23,2 1113 21,4 24,2 3HQ011122 Bread: low fibre kg 23,3 19,6 3051 22,6 24,0 1 48,3 31,2 5968 47,5 49,1 3HQ01113 Pasta products kg 10,3 10,8 2463 9,9 10,7 3,5 3,4 2870 3,3 3,6 5,3 7,4 3432 5,1 5,6 13,0 10,2 4546 12,7 13,3 3HQ01114 Pastry-cook products kg 19,6 14,7 3377 19,1 20,1 5,8 4,6 2870 5,6 6,0 4,6 8,1 3432 4,3 4,9 11,3 10,9 1497 10,7 11,9
kg 7,4 7,6 2646 7,1 7,7 1,7 4,0 2870 1,5 1,8? 0,0 0,4 3432 0,0 0,0
kg 12,2 11,5 37 8,5 15,9 10 9,6 15,9 2870 9,1 10,2 16,5 33,1 3432 15,4 17,6 15,4 20,7 3252 14,7 16,1 3?
HQ011161 Other products: wholemeal kg 10,0 12,3 2233 9,5 10,6 1 17,8 22,6 2503 16,9 18,7 3HQ011162 Other products: low fibre kg 2,2 3,5 45 1,2 3,3 1 2,2 2,3 610 2,0 2,3 3HQ0112 Meat (ND) kg 66,3 30,8 38 56,5 76,1 10 29,9 17,2 2870 29,3 30,5 10 60,5 51,0 3432 58,8 62,2 52,3 40,3 6088 51,3 53,3
HQ01121 Fresh, chilled or frozen meat of bovine animals kg 8,0 44,7 1860 6,0 10,1 0,8 3,1 2870 0,7 0,9 0,9 4,1 3432 0,8 1,1 22,4 17,0 4706 21,9 22,9
HQ01122 Fresh, chilled or frozen meat of swine kg 6,6 8,0 1388 6,2 7,0 2,1 3,3 2870 1,9 2,2 12,7 33,7 3432 11,6 13,8 20,0 21,3 2760 19,2 20,8 3
HQ01123 Fresh, chilled or frozen meat of sheep and goat kg 3,8 5,7 559 3,4 4,3 0,7 1,9 2870 0,7 0,8 0,2 2,7 3432 0,1 0,3 33,6 35,3 986 31,4 35,8 3
HQ01124 Fresh, chilled or frozen meat of poultry kg 11,2 13,9 2194 10,7 11,8 5,8 5,6 2870 5,6 6,1 5,8 11,6 3432 5,4 6,2 20,5 14,8 3793 20,1 21,0
HQ01125 Dried, salted or smoked meat and edible meat offal kg 15,9 44,7 3377 14,4 17,4 13,3 8,1 2870 13,0 13,6 30,6 25,3 3432 29,8 31,5 7,9 8,1 3416 7,7 8,2
HQ01126 Other preserved or processed meat and meat preparations kg 17,6 19,5 3108 16,9 18,2 7,2 5,0 2870 7,0 7,4 10,1 12,3 3432 9,7 10,5 7,9 7,6 388 7,1 8,6
HQ01127 Other fresh, chilled or frozen edible meat kg 5,1 5,2 378 4,6 5,6 0,0 0,2 2870 0,0 0,0 0,2 3,0 3432 0,1 0,3 14,2 8,6 103 12,5 15,9
HQ0113 Fish (ND) kg 22,9 15,0 5 9,8 36,0 10 4,1 4,1 2870 3,9 4,2 10 13,1 17,9 3432 12,5 13,7 20,5 17,1 4907 20,1 21,0HQ01131 Fresh, chilled or frozen fish kg 8,4 37,1 403 4,8 12,0 10 3,9 4,0 2870 3,7 4,0 6,9 15,9 3432 6,3 7,4 18,2 13,8 4303 17,8 18,6 3HQ011311 Fresh, chilled or frozen fish: fatty fish kg 4,1 36,4 625 1,2 6,9 1 12,9 9,3 584 12,2 13,7 3HQ011312 Fresh, chilled or frozen fish: other fish kg 5,4 45,3 1634 3,2 7,6 1 14,8 10,7 1783 14,3 15,3 3HQ01132 Fresh, chilled or frozen seafood kg 6,8 23,4 1393 5,5 8,0 0,0 0,1 2870 0,0 0,0 0,1 0,9 3432 0,1 0,1 13,3 12,4 840 12,5 14,1
HQ01133 Dried, smoked or salted fish and seafood kg 3,3 40,5 131 0,0 10,2 10 0,0 0,2 2870 0,0 0,0 2,0 4,2 3432 1,9 2,2 7,8 6,8 571 7,2 8,3
HQ011331 Dried, smoked or salted fatty fish kg 3,0 39,3 625 0,0 6,1 3 1 3,5 4,1 286 3,1 4,0
HQ011332 Dried, smoked or salted not fatty fish and seafood kg 1,2 1,5 431 1,0 1,3 1 11,6 6,0 311 11,0 12,3
HQ01134 Other preserved or processed fish and seafood and fish and seafood preparations kg 3,8 3,9 473 3,4 4,1 3 0,2 0,5 2870 0,2 0,2 4,1 5,6 3432 3,9 4,3 4,5 4,8 1148 4,2 4,8
HQ011341 Other preserved or processed fish and fish preparations: fatty fish kg 2,3 2,8 897 2,1 2,5 3 1 4,2 4,7 892 3,9 4,6 3
HQ011342 Other preserved or processed fish and seafood and fish and seafood preparations kg 2,4 2,7 1648 2,2 2,5 3 1 4,6 4,3 131 3,9 5,4 3
HQ01116 Other products
HQ0111 Bread and cereals (ND)
HQ01115 Sandwiches
3550 2870 3432 65552005 2005 2005 2004/2005BE BG EE EL
Std Dev: Standard Deviation; N: number of observed households; LCL 95%: 95% Lower Confidence Limit; UCL 95%: 95% Upper Confidence Limit; Flags: 1: Not surveyed quantities; 2: Not available; 3: see list of products in Annex V; 4: No summary quantity because different measurement units for the different sub-headings; 9: estimated (see Annex V); 10: estimated by Eurostat (see Annex V)

Eurostat/Unit F5 Food consumption statistics - Results using data collected from HBS Food Safety Statistics ESTAT/F5/ES/204 Rev.1
24/57
Annual mean food availability per person (food quantities purchased per person) (FQP)
YearSurveyed households, number
Code Label and measurement unit FQP Std Dev N LCL 95% UCL 95% flag FQP Std Dev N LCL 95% UCL 95% flag FQP Std Dev N LCL 95% UCL 95% flag FQP Std Dev N LCL 95% UCL 95% flagHQ01141 Whole milk liter 29,7 26,9 1063 28,1 31,3 9 21,9 58,8 3432 19,9 23,8 60,4 43,9 4027 59,1 61,8HQ01142 Low fat milk liter 39,0 33,0 1912 37,5 40,5 42,2 45,4 3432 40,6 43,7 42,1 38,9 1708 40,2 43,9 3
HQ01141&2 Whole and low fat milk liter 16,8 23,3 2870 15,9 17,7 3
kg 3,7 4,7 499 3,3 4,1 0,0 0,5 2870 0,0 0,0 0,5 3,2 3432 0,4 0,6 21,3 22,8 2495 20,4 22,1literkg 11,6 11,9 2477 11,2 12,1 18,4 19,0 2870 17,7 19,1 8,8 15,0 3432 8,3 9,3 12,3 11,7 4295 12,0 12,7
literHQ01145 Cheese and curd kg 4,2 31,9 1127 2,4 6,1 12,3 7,4 2870 12,0 12,5 11,3 10,2 3432 10,9 11,6 17,6 13,3 5604 17,2 17,9HQ011451 Cheese and curd: high fat kg 6,0 5,4 2289 5,8 6,2 1 12,7 10,6 4812 12,4 13,0 3HQ011452 Cheese and curd: low fat kg 6,8 6,9 2899 6,5 7,0 1 8,3 7,2 4032 8,1 8,5 3
kg 11,7 14,5 2774 11,2 12,3 9 0,1 0,5 2870 0,1 0,2 20,0 20,4 3432 19,3 20,6 8,5 13,4 1630 7,9 9,2mixed - kg/liter
unit 82,0 62,2 2362 79,5 84,5 9 74,5 67,2 2870 72,1 77,0 161,1 154,5 3432 155,9 166,3 0,1 0,1 2649 0,1 0,1 3kgkg 1 27,4 24,2 5048 26,7 28,1
mixed - kg/liter
? 12,8 12,8 3432 12,4 13,3HQ01151 Butter kg 3,8 3,4 1923 3,7 4,0 0,4 0,8 2870 0,4 0,4 2,3 3,6 3432 2,2 2,4 3,6 3,5 496 3,3 3,9 3HQ01152 Margarine and other vegetable fats kg 5,5 4,8 2065 5,3 5,7 2,0 1,7 2870 1,9 2,0 3,8 5,5 3432 3,6 4,0 4,9 4,7 2642 4,7 5,1HQ01153 Olive oil liter 4,1 3,0 601 3,9 4,4 0,1 0,4 2870 0,1 0,1 0,1 1,2 3432 0,1 0,2 25,4 20,1 3716 24,8 26,1HQ01154 Edible oils liter 6,7 6,0 851 6,3 7,1 12,9 6,6 2870 12,7 13,1 6,5 9,5 3432 6,1 6,8 18,1 15,3 1445 17,3 18,8HQ01155 Other edible animal fats kg 6,8 5,7 107 5,7 7,9 0,0 0,5 2870 0,0 0,1 0,2 1,8 3432 0,1 0,2HQ0116 Fruit (ND) kg 1 48,3 56,4 3432 46,4 50,2 97,9 83,7 5972 95,8 100,0HQ01161 Citrus fruits (fresh, chilled or frozen) kg 13,4 14,9 2226 12,7 14,0 3,7 4,6 2870 3,5 3,8 7,1 14,8 3432 6,6 7,6 43,7 40,7 4018 42,5 45,0HQ01162 Bananas (fresh, chilled or frozen) kg 7,4 6,3 1755 7,1 7,7 3,5 4,9 2870 3,3 3,7 4,4 9,4 3432 4,1 4,7 17,7 12,5 2964 17,2 18,1HQ01163 Apples (fresh, chilled or frozen) kg 12,3 11,0 2161 11,9 12,8 6,1 8,4 2870 5,8 6,4 21,0 34,2 3432 19,8 22,1 29,5 22,1 3423 28,7 30,2HQ01164 Pears (fresh, chilled or frozen) kg 6,9 6,9 1038 6,5 7,4 0,2 1,1 2870 0,1 0,2 2,5 8,3 3432 2,2 2,8 19,1 15,5 1493 18,3 19,9HQ01165 Stone fruits (fresh, chilled or frozen) kg 8,4 9,5 925 7,8 9,1 3,2 6,8 2870 3,0 3,5 2,4 8,9 3432 2,1 2,7 30,9 29,8 1523 29,4 32,4HQ01166 Berries (fresh, chilled or frozen) kg 6,5 6,6 1452 6,2 6,9 2,3 8,9 2870 1,9 2,6 5,0 14,2 3432 4,6 5,5 19,7 18,5 1159 18,6 20,7HQ01167 Other fresh, chilled or frozen fruits kg 10,6 12,9 1904 10,0 11,2 8,3 11,7 2870 7,9 8,7 4,7 16,6 3432 4,1 5,2 78,4 85,5 1686 74,3 82,5HQ01168 Dried fruit kg 3,0 4,2 1214 2,8 3,2 0,9 1,5 2870 0,9 1,0 1,1 3,0 3432 1,0 1,2 7,1 8,2 1192 6,7 7,6
HQ01169 Preserved fruit and fruit based products kg 4,5 4,5 870 4,2 4,8 0,0 0,0 2870 0,0 0,0 0,1 0,8 3432 0,1 0,1 7,4 7,3 27 4,6 10,1 3
HQ0117 Vegetables (ND) kg 1 144,9 184,1 3432 138,7 151,1 136,1 90,4 6394 133,9 138,3
HQ01171 Leaf and stem vegetables (fresh, chilled or frozen) kg 9,8 9,2 2915 9,4 10,1 1,1 1,8 2870 1,0 1,1 0,9 2,5 3432 0,8 0,9 18,3 17,6 4400 17,8 18,8
HQ01172 Cabbages (fresh, chilled or frozen) kg 6,1 6,0 1845 5,8 6,4 10,3 11,8 2870 9,9 10,7 10,1 19,7 3432 9,5 10,8 21,9 18,1 2032 21,2 22,7
HQ01173 Vegetables cultivated for their fruit (fresh, chilled or frozen) kg 18,3 22,8 3106 17,5 19,1 28,9 24,5 2870 28,0 29,8 17,7 33,7 3432 16,6 18,8 52,1 47,1 5399 50,9 53,4
HQ01174 Root crops, non-starchy bulbs and mushrooms (fresh, chilled or frozen) kg 16,9 14,5 2950 16,4 17,5 8,1 8,3 2870 7,8 8,4 19,7 42,5 3432 18,3 21,2 13,7 12,9 3082 13,2 14,1
HQ01175 Dried vegetables kg 2,4 1,9 188 2,1 2,6 4,9 4,6 2870 4,7 5,1 0,4 2,2 3432 0,3 0,5 19,9 17,4 4365 19,3 20,4
HQ01176 Other preserved or processed vegetables kg 6,2 7,0 2280 5,9 6,5 2,9 3,8 2870 2,7 3,0 13,9 22,5 3432 13,1 14,6 10,5 9,7 3461 10,2 10,9
HQ01177 Potatoes kg 39,3 34,5 2252 37,8 40,7 18,8 16,8 2870 18,2 19,4 80,7 150,1 3432 75,7 85,8 50,0 37,5 5291 49,0 51,0
HQ01178 Other tubers and products of tuber vegetables kg 9,0 8,6 2450 8,6 9,3 0,1 0,5 2870 0,1 0,1 1,4 4,4 3432 1,3 1,6 3,0 4,8 963 2,7 3,3
3550 2870 3432 65552005 2005 2005 2004/2005BE BG EE EL
HQ01147 Eggs
HQ0115 Oils and fats (ND)
HQ01144 Yoghurt
HQ01146 Other milk products
HQ01143 Preserved milk
Std Dev: Standard Deviation; N: number of observed households; LCL 95%: 95% Lower Confidence Limit; UCL 95%: 95% Upper Confidence Limit; Flags: 1: Not surveyed quantities; 2: Not available; 3: see list of products in Annex V; 4: No summary quantity because different measurement units for the different sub-headings; 9: estimated (see Annex V); 10: estimated by Eurostat (see Annex V)

Eurostat/Unit F5 Food consumption statistics - Results using data collected from HBS Food Safety Statistics ESTAT/F5/ES/204 Rev.1
25/57
Annual mean food availability per person (food quantities purchased per person) (FQP)
YearSurveyed households, number
Code Label and measurement unit FQP Std Dev N LCL 95% UCL 95% flag FQP Std Dev N LCL 95% UCL 95% flag FQP Std Dev N LCL 95% UCL 95% flag FQP Std Dev N LCL 95% UCL 95% flagkg 1 4 16,5 14,4 4944 16,1 16,9?
HQ01181 Sugar kg 7,3 6,8 1430 7,0 7,7 14,4 12,6 2870 13,9 14,8 10,6 32,2 3432 9,5 11,7 13,8 10,8 3818 13,5 14,1 3HQ01182 Jams, marmalades kg 4,7 4,0 1945 4,5 4,9 0,8 1,6 2870 0,7 0,8 5,7 12,3 3432 5,3 6,2 7,6 9,8 1417 7,1 8,2 3HQ01183 Chocolate kg 5,0 26,0 2130 3,8 6,1 0,7 0,9 2870 0,7 0,8 0,8 1,8 3432 0,8 0,9 3,8 4,0 1702 3,6 4,0 3
kg 1,2 1,6 2391 1,1 1,3 0,8 1,2 2870 0,7 0,8 1? 3,9 5,3 3432 3,7 4,0
kg 11,6 11,4 1392 11,0 12,2 11,0 10,3 838 10,3 11,7 3liter 1,0 1,8 2870 0,9 1,1 3,4 6,7 3432 3,2 3,6kg 4,19 4,2 1968 4,0 4,4 0,01 0,1 2870 0,0 0,0 1? 0,16 1,1 3432 0,1 0,2
kg 1? 15,2 19,0 3432 14,6 15,8
kg 7,7 8,8 2761 7,3 8,0 9 4 6,0 8,1 3432 5,7 6,3 1liter
?HQ011911 Vinegar liter 1,8 1,6 2870 1,8 1,9HQ011912 Other sauces and condiments kg 1,0 1,4 2870 1,0 1,1
kg 1,9 2,6 1835 1,8 2,1 4,6 4,5 2870 4,4 4,8 2,1 11,1 3432 1,7 2,5 1?
kg 12,2 15,4 1869 11,5 12,9 0,2 1,5 2870 0,1 0,2 2,8 6,5 3432 2,6 3,0 1?
kg 1 0,0 0,2 2870 0,0 0,0 4,3 9,6 3432 4,0 4,7 1unit
?kg 4,1 5,0 3432 3,9 4,2 2,9 2,8 4471 2,8 3,0
liter 1kg 1,1 1,0 2870 1,0 1,1 3,5 4,8 3432 3,3 3,6 2,7 2,6 4296 2,6 2,8 3
liter 5,4 5,9 2433 5,2 5,7 9mixed - kg/liter
kg 0,0 0,1 2870 0,0 0,0 0,4 1,0 3432 0,4 0,5 0,8 1,3 390 0,7 0,9 3liter 2,0 11,0 726 1,2 2,8kg 0,0 0,1 2870 0,0 0,0 0,2 0,8 3432 0,1 0,2 2,2 1,9 369 2,1 2,4 3
liter 2,8 2,1 285 2,5 3,0
HQ0122 Mineral waters, soft drinks, fruit and vegetable juices (ND) liter 1 46,0 57,9 3432 44,0 47,9 73,0 100,3 4924 70,2 75,8
HQ01221 Mineral or spring waters liter 87,4 83,6 2607 84,2 90,6 9 11,8 28,4 2870 10,7 12,8 11,0 32,2 3432 10,0 12,1 88,0 141,4 1516 80,9 95,1 3HQ01222 Soft drinks liter 56,0 55,2 2533 53,9 58,2 9 31,9 31,3 2870 30,8 33,1 13,5 28,8 3432 12,5 14,4 37,2 34,5 3692 36,0 38,3 3HQ01223 Fruit juices liter 25,2 23,7 2175 24,2 26,2 9 1,6 4,4 2870 1,4 1,7 21,0 30,1 3432 19,9 22,0 24,2 22,7 3042 23,4 25,1 3HQ01224 Vegetable juices liter 6,9 10,6 173 5,3 8,5 0,0 0,6 2870 0,0 0,1 0,5 3,8 3432 0,4 0,6 8,8 7,3 176 7,7 9,8 3HQ021 Alcoholic beverages liter 1 20,6 43,6 3432 19,1 22,1 30,7 37,4 3591 29,5 31,9HQ0211 Spirits and liqueurs liter 7,2 10,1 651 6,5 8,0 1,1 2,9 2870 1,0 1,2 3,3 11,8 3432 2,9 3,7 8,9 8,1 1203 8,4 9,3 3HQ0212 Wine (ND) liter 1 3,6 10,9 3432 3,2 3,9 22,8 26,0 2073 21,7 23,9HQ02121 Wine from grapes or other fruit liter 32,0 42,3 1786 30,0 34,0 1,8 5,1 2870 1,6 2,0 3,0 10,1 3432 2,6 3,3 22,8 26,0 2058 21,7 23,9 3HQ02122 Other liter 8,2 9,7 968 7,6 8,8 0,1 0,3 2870 0,1 0,1 0,6 3,0 3432 0,5 0,7 7,2 6,5 33 4,9 9,4 3HQ0213 Beer liter 38,5 46,5 1598 36,2 40,8 12,3 18,0 2870 11,6 12,9 13,7 34,8 3432 12,5 14,9 29,0 35,6 1732 27,3 30,6 3
Vegetables kg 56,3 41,1 2870 54,8 57,8 3 64,6 71,8 3432 62,2 67,0 3 107,0 67,7 157 96,4 117,6 3Fruit kg 29,8 32,1 2870 28,6 30,9 3 69,3 68,1 3432 67,0 71,5 3 119,5 87,6 2846 116,3 122,7 3Sugar (version "large") liter 51,5 39,6 2870 50,0 52,9 3 103,0 79,0 3432 100,4 105,6 3Sugar (version "short") liter 80,0 58,8 1650 77,1 82,8 33,5 31,7 2870 32,4 34,7 34,4 43,0 3432 33,0 35,9 59,9 43,2 2055 58,0 61,8
3550 2870 3432 65552005 2005 2005 2004/2005BE BG EE EL
HQ01213 Cocoa and powdered chocolate
HQ01211 Coffee
HQ01212 Tea
HQ01194 Other food products nec
HQ0121 Coffee, tea and cocoa (ND)
HQ01192 Salt, spices and culinary herbs
HQ01193 Baby food, dietary preparations, baker's yeast and other food preparations
HQ0119 Food products nec (ND)
HQ01191 Sauces, condiments
HQ01185 Edible ices and ice cream
HQ01186 Other sugar products
HQ0118 Sugar, jam, honey, chocolate and confectionery (ND)
HQ01184 Confectionery products
Std Dev: Standard Deviation; N: number of observed households; LCL 95%: 95% Lower Confidence Limit; UCL 95%: 95% Upper Confidence Limit; Flags: 1: Not surveyed quantities; 2: Not available; 3: see list of products in Annex V; 4: No summary quantity because different measurement units for the different sub-headings; 9: estimated (see Annex V); 10: estimated by Eurostat (see Annex V)

Eurostat/Unit F5 Food consumption statistics - Results using data collected from HBS Food Safety Statistics ESTAT/F5/ES/204 Rev.1
26/57
Annual mean food availability per person (food quantities purchased per person) (FQP)
YearSurveyed households, number
Code Label and measurement unit FQP Std Dev N LCL 95% UCL 95% flag FQP Std Dev N LCL 95% UCL 95% flag FQP Std Dev N LCL 95% UCL 95% flag FQP Std Dev N LCL 95% UCL 95% flagkg 67,2 44,3 8844 66,3 68,2 3 83,0 48,5 10169 82,1 83,9 95,1 59,8 3774 93,2 97,0 10 101,7 65,5 7586 100,2 103,2 10?
HQ01111 Rice kg 6,1 12,5 8595 5,8 6,3 4,0 8,2 10118 3,8 4,1 3,5 6,2 3774 3,3 3,7 3,9 6,7 7586 3,8 4,1HQ01112 Bread kg 56,0 39,8 8880 55,2 56,9 52,2 34,5 10160 51,5 52,8 61,1 38,5 3774 59,9 62,4 60,0 37,4 7586 59,1 60,8HQ011121 Bread: wholemeal kg - 1HQ011122 Bread: low fibre kg - 1HQ01113 Pasta products kg 5,4 9,0 8577 5,2 5,6 8,9 12,5 10137 8,6 9,1 5,6 8,8 3774 5,3 5,9 5,0 7,5 7586 4,9 5,2HQ01114 Pastry-cook products kg 1 10,6 13,8 10135 10,4 10,9 5,8 8,9 3774 5,5 6,0 11,4 12,5 7586 11,2 11,7
kg 1 2? 0,0 0,3 3774 0,0 0,0 0,0 0,5 7586 0,0 0,0
kg 1 7,6 13,4 10124 7,3 7,8 3 19,1 25,3 3774 18,3 19,9 21,3 33,2 7586 20,6 22,1?
HQ011161 Other products: wholemeal kg - 1HQ011162 Other products: low fibre kg - 1HQ0112 Meat (ND) kg 55,3 51,0 8854 54,2 56,3 46,2 38,9 10166 45,5 47,0 70,8 50,9 3774 69,2 72,5 10 86,2 61,1 7586 84,8 87,5 10
HQ01121 Fresh, chilled or frozen meat of bovine animals kg 8,8 14,7 8296 8,5 9,1 9,8 13,7 10116 9,6 10,1 3,5 8,7 3774 3,3 3,8 2,4 9,2 7586 2,2 2,6
HQ01122 Fresh, chilled or frozen meat of swine kg 8,8 15,8 8463 8,4 9,1 4,3 8,8 10145 4,1 4,5 21,4 35,9 3774 20,3 22,6 29,1 41,1 7586 28,2 30,0
HQ01123 Fresh, chilled or frozen meat of sheep and goat kg 2,5 9,2 7761 2,3 2,7 1,5 5,8 10161 1,4 1,7 0,2 3,7 3774 0,0 0,3 0,0 1,4 7586 0,0 0,1
HQ01124 Fresh, chilled or frozen meat of poultry kg 14,6 19,0 8687 14,2 15,0 8,1 13,1 10123 7,8 8,3 9,5 14,1 3774 9,0 9,9 13,7 19,8 7586 13,3 14,1
HQ01125 Dried, salted or smoked meat and edible meat offal kg 16,9 22,7 8745 16,5 17,4 15,7 15,7 10158 15,4 16,0 25,3 19,8 3774 24,7 25,9 17,1 19,3 7586 16,7 17,5
HQ01126 Other preserved or processed meat and meat preparations kg 4,7 8,1 8198 4,5 4,9 6,0 10,4 10115 5,8 6,2 6,8 11,0 3774 6,4 7,1 23,3 20,9 7586 22,8 23,8
HQ01127 Other fresh, chilled or frozen edible meat kg 1,5 5,6 7851 1,4 1,6 1,6 5,3 6448 1,4 1,7 4,1 11,0 3774 3,8 4,5 0,6 6,2 7586 0,4 0,7
HQ0113 Fish (ND) kg 26,6 31,4 8753 26,0 27,3 7,0 15,3 4239 6,5 7,4 10 13,5 19,2 3774 12,8 14,1 10 16,7 19,3 7586 16,3 17,1 10HQ01131 Fresh, chilled or frozen fish kg 15,2 22,2 8600 14,7 15,6 4,7 9,1 9351 4,5 4,9 7,0 16,3 3774 6,4 7,5 8,3 14,5 7586 7,9 8,6HQ011311 Fresh, chilled or frozen fish: fatty fish kg 1,5 4,4 10190 1,4 1,6HQ011312 Fresh, chilled or frozen fish: other fish kg 2,8 7,0 10190 2,6 2,9HQ01132 Fresh, chilled or frozen seafood kg 6,0 13,0 8195 5,7 6,3 2,9 9,5 9390 2,7 3,1 9 0,1 1,1 3774 0,1 0,2 0,1 1,1 7586 0,1 0,1
HQ01133 Dried, smoked or salted fish and seafood kg 0,8 3,7 7667 0,7 0,9 0,8 2,1 5802 0,7 0,8 2,9 5,8 3774 2,7 3,1 5,8 8,4 7586 5,6 5,9
HQ011331 Dried, smoked or salted fatty fish kg - 1
HQ011332 Dried, smoked or salted not fatty fish and seafood kg - 1
HQ01134 Other preserved or processed fish and seafood and fish and seafood preparations kg 5,8 10,9 8399 5,6 6,1 4,2 6,9 9782 4,1 4,3 3,4 5,4 3774 3,3 3,6 2,6 4,8 7586 2,5 2,7
HQ011341 Other preserved or processed fish and fish preparations: fatty fish kg - 1
HQ011342 Other preserved or processed fish and seafood and fish and seafood preparations kg - 1
HQ01116 Other products
HQ0111 Bread and cereals (ND)
HQ01115 Sandwiches
8881 10240 3774 75862004 2005 2005 2005ES FR LV LT
Std Dev: Standard Deviation; N: number of observed households; LCL 95%: 95% Lower Confidence Limit; UCL 95%: 95% Upper Confidence Limit; Flags: 1: Not surveyed quantities; 2: Not available; 3: see list of products in Annex V; 4: No summary quantity because different measurement units for the different sub-headings; 9: estimated (see Annex V); 10: estimated by Eurostat (see Annex V)

Eurostat/Unit F5 Food consumption statistics - Results using data collected from HBS Food Safety Statistics ESTAT/F5/ES/204 Rev.1
27/57
Annual mean food availability per person (food quantities purchased per person) (FQP)
YearSurveyed households, number
Code Label and measurement unit FQP Std Dev N LCL 95% UCL 95% flag FQP Std Dev N LCL 95% UCL 95% flag FQP Std Dev N LCL 95% UCL 95% flag FQP Std Dev N LCL 95% UCL 95% flagHQ01141 Whole milk liter 58,1 79,6 8809 56,4 59,7 6,0 21,3 10151 5,5 6,4 47,6 64,8 3774 45,5 49,6 87,5 94,7 7586 85,3 89,6HQ01142 Low fat milk liter 36,3 68,8 8757 34,8 37,7 40,4 52,0 9981 39,4 41,4 11,0 24,2 3774 10,2 11,7 0,7 5,0 7586 0,6 0,8
HQ01141&2 Whole and low fat milk liter
kg 0,4 3,1 8607 0,4 0,5 0,3 2,2 10178 0,3 0,4 0,5 2,4 3774 0,4 0,6 0,2 1,4 7586 0,2 0,3liter
kg 17,6 21,1 8766 17,1 18,0 24,7 26,3 10140 24,2 25,2 5,7 11,0 3774 5,3 6,0 5,0 10,2 7586 4,8 5,3liter
HQ01145 Cheese and curd kg 6,9 8,7 8594 6,8 7,1 12,6 11,7 10145 12,4 12,9 12,6 12,4 3774 12,2 13,0 15,0 17,1 7586 14,6 15,4HQ011451 Cheese and curd: high fat kg - 1HQ011452 Cheese and curd: low fat kg - 1
kg 6,0 18,6 7355 5,6 6,4 10,9 13,8 10133 10,6 11,2 25,3 25,4 3774 24,5 26,1 10,4 10,2 7586 10,1 10,6mixed - kg/liter
unit 115,3 141,6 8874 112,3 118,2 83,8 120,8 10125 81,4 86,1 204,3 184,2 3774 198,5 210,2 219,1 181,4 7586 215,1 223,2kgkg
mixed - kg/liter 19,7 37,6 8680 18,9 20,5
? HQ01151 Butter kg 0,3 1,2 8611 0,3 0,3 3,2 4,6 10011 3,1 3,3 2,5 4,0 3774 2,3 2,6 3,2 4,6 7586 3,1 3,3HQ01152 Margarine and other vegetable fats kg 0,7 2,2 8515 0,7 0,8 1,8 4,2 10158 1,7 1,9 3,4 5,5 3774 3,3 3,6 2,5 4,1 7586 2,4 2,6HQ01153 Olive oil liter 14,3 32,8 8604 13,6 15,0 1,2 4,0 10171 1,1 1,2 0,3 1,9 3774 0,2 0,4 0,1 1,1 7586 0,1 0,2HQ01154 Edible oils liter 4,6 15,1 8585 4,3 5,0 4,3 9,5 10125 4,2 4,5 8,8 10,8 3774 8,5 9,2 10,7 11,9 7586 10,4 10,9HQ01155 Other edible animal fats kg 0,0 0,6 8857 0,0 0,0 0,0 0,0 10118 0,0 0,0 0,6 3,6 3774 0,5 0,7 2,1 7,0 7586 1,9 2,2HQ0116 Fruit (ND) kg 80,8 79,0 8846 79,1 82,4 48,7 54,1 10186 47,7 49,8HQ01161 Citrus fruits (fresh, chilled or frozen) kg 23,9 35,6 8717 23,1 24,6 19,0 25,2 5758 18,4 19,7 8,2 17,1 3774 7,6 8,7 7,0 14,1 7586 6,7 7,3HQ01162 Bananas (fresh, chilled or frozen) kg 9,0 12,3 8616 8,8 9,3 7,0 10,8 7947 6,8 7,2 3,0 7,6 3774 2,8 3,3 2,4 6,8 7586 2,3 2,6HQ01163 Apples (fresh, chilled or frozen) kg 11,3 16,6 8643 10,9 11,6 13,1 21,5 8449 12,6 13,6 19,0 39,7 3774 17,7 20,2 31,0 40,8 7586 30,1 31,9HQ01164 Pears (fresh, chilled or frozen) kg 6,6 11,2 8482 6,4 6,9 4,0 9,5 6988 3,7 4,2 1,7 6,7 3774 1,4 1,9 1,9 8,2 7586 1,7 2,1HQ01165 Stone fruits (fresh, chilled or frozen) kg 9,9 18,7 8316 9,5 10,3 7,0 17,4 9039 6,6 7,4 3,4 13,3 3774 3,0 3,8 3,5 12,3 7586 3,2 3,8HQ01166 Berries (fresh, chilled or frozen) kg 3,8 16,4 8104 3,4 4,1 4,9 12,0 8235 4,7 5,2 8,5 25,6 3774 7,7 9,4 7,9 24,5 7586 7,4 8,5HQ01167 Other fresh, chilled or frozen fruits kg 15,8 33,7 8472 15,1 16,6 7,5 16,4 8654 7,2 7,9 6,6 24,7 3774 5,8 7,4 4,2 16,3 7586 3,9 4,6HQ01168 Dried fruit kg 2,7 9,7 7812 2,5 2,9 2,1 4,4 7900 2,0 2,2 1,3 3,7 3774 1,2 1,4 1,9 4,6 7586 1,8 2,0
HQ01169 Preserved fruit and fruit based products kg 1,2 4,7 7781 1,1 1,3 1,1 4,2 7728 1,0 1,2 0,3 2,1 3774 0,2 0,4 0,3 1,8 7586 0,3 0,3
HQ0117 Vegetables (ND) kg 94,4 107,8 8864 92,1 96,6 72,8 67,4 10160 71,5 74,1
HQ01171 Leaf and stem vegetables (fresh, chilled or frozen) kg 10,2 15,9 8556 9,9 10,6 6,2 10,8 10123 6,0 6,5 2,5 7,1 3774 2,3 2,7 2,3 6,9 7586 2,2 2,5
HQ01172 Cabbages (fresh, chilled or frozen) kg 3,4 9,8 8158 3,2 3,6 2,4 7,4 10146 2,3 2,5 11,0 36,4 3774 9,9 12,2 11,7 21,2 7586 11,2 12,2
HQ01173 Vegetables cultivated for their fruit (fresh, chilled or frozen) kg 22,7 33,7 8716 22,0 23,4 15,4 22,4 10125 15,0 15,8 26,7 44,3 3774 25,3 28,1 27,1 44,2 7586 26,1 28,1
HQ01174 Root crops, non-starchy bulbs and mushrooms (fresh, chilled or frozen) kg 11,8 17,4 8583 11,5 12,2 13,6 20,7 10121 13,2 14,0 24,7 34,5 3774 23,6 25,8 32,4 34,4 7586 31,6 33,2
HQ01175 Dried vegetables kg 4,4 11,1 8223 4,1 4,6 0,6 2,8 10178 0,6 0,7 1,6 4,7 3774 1,4 1,7 0,0 0,2 7586 0,0 0,0
HQ01176 Other preserved or processed vegetables kg 10,2 15,1 8456 9,8 10,5 3 13,5 18,0 10107 13,1 13,8 16,8 23,5 3774 16,1 17,6 21,5 27,9 7586 20,8 22,1
HQ01177 Potatoes kg 33,1 72,4 8757 31,5 34,6 15,6 31,3 10124 15,0 16,2 102,7 177,4 3774 97,1 108,4 107,8 106,8 7586 105,4 110,2
HQ01178 Other tubers and products of tuber vegetables kg 1,7 4,0 7872 1,6 1,8 5,8 10,9 10100 5,6 6,0 0,8 3,1 3774 0,7 0,9 1,1 3,3 7586 1,0 1,2
8881 10240 3774 75862004 2005 2005 2005ES FR LV LT
HQ01147 Eggs
HQ0115 Oils and fats (ND)
HQ01144 Yoghurt
HQ01146 Other milk products
HQ01143 Preserved milk
Std Dev: Standard Deviation; N: number of observed households; LCL 95%: 95% Lower Confidence Limit; UCL 95%: 95% Upper Confidence Limit; Flags: 1: Not surveyed quantities; 2: Not available; 3: see list of products in Annex V; 4: No summary quantity because different measurement units for the different sub-headings; 9: estimated (see Annex V); 10: estimated by Eurostat (see Annex V)

Eurostat/Unit F5 Food consumption statistics - Results using data collected from HBS Food Safety Statistics ESTAT/F5/ES/204 Rev.1
28/57
Annual mean food availability per person (food quantities purchased per person) (FQP)
YearSurveyed households, number
Code Label and measurement unit FQP Std Dev N LCL 95% UCL 95% flag FQP Std Dev N LCL 95% UCL 95% flag FQP Std Dev N LCL 95% UCL 95% flag FQP Std Dev N LCL 95% UCL 95% flagkg? 13,3 21,9 8672 12,8 13,8
HQ01181 Sugar kg 5,9 12,4 8591 5,6 6,2 5,2 10,3 10092 4,9 5,4 19,3 34,1 3774 18,2 20,4 18,5 30,7 7586 17,8 19,2HQ01182 Jams, marmalades kg 1,3 4,0 8397 1,2 1,3 4,5 8,8 10141 4,3 4,7 5,4 13,9 3774 4,9 5,8 11,7 21,2 7586 11,3 12,2HQ01183 Chocolate kg 1,7 4,3 8164 1,6 1,7 3,7 6,0 10128 3,6 3,8 2,2 4,2 3774 2,0 2,3 0,4 1,1 7586 0,4 0,5
kg 2,5 13,5 8276 2,2 2,8 2,4 4,6 10137 2,3 2,5? 1,7 3,6 3774 1,6 1,8 4,0 5,9 7586 3,9 4,1
kg 2,2 7,3 8395 2,1 2,4liter 4,1 11,1 10159 3,9 4,3 3,6 7,7 3774 3,4 3,9 2,4 5,2 7586 2,3 2,5
kg 0,28 1,4 8631 0,3 0,3 1,04 2,8 10154 1,0 1,1 2? 0,08 0,5 7586 0,1 0,1
kg 11,0 15,1 8328 10,7 11,3 3 16,1 22,0 10142 15,7 16,6?
kg 6,1 9,4 8582 5,9 6,3 7,0 11,0 10133 6,7 7,2 9 2 8,9 9,9 7586 8,7 9,1liter
?HQ011911 Vinegar literHQ011912 Other sauces and condiments kg
kg 2,9 7,6 8395 2,7 3,0 1,4 5,0 10155 1,3 1,5 2 0,0 0,0 7586 0,0 0,0?
kg 1,8 6,7 8293 1,7 2,0 3 6,0 15,0 10142 5,7 6,3 9 2 0,0 0,0 7586 0,0 0,0?
kg 0,0 0,0 1 1,9 7,6 10158 1,7 2,0 2 0,0 0,0 7586 0,0 0,0unit
?kg 4,6 12,0 8408 4,3 4,8 4,4 6,2 10131 4,3 4,5 3,6 3,9 7586 3,5 3,7
literkg 2,4 4,5 8342 2,3 2,5 3,4 5,4 10128 3,3 3,5 2,3 2,9 3774 2,2 2,4 2,9 3,5 7586 2,8 3,0
litermixed - kg/liter
kg 0,6 9,8 8356 0,4 0,8 0,3 1,0 10164 0,3 0,3 0,5 0,9 3774 0,5 0,5 0,6 1,0 7586 0,5 0,6liter
kg 1,6 5,3 8387 1,5 1,7 0,8 2,5 10173 0,7 0,8 0,1 0,5 3774 0,1 0,1 0,1 0,6 7586 0,1 0,1liter
HQ0122 Mineral waters, soft drinks, fruit and vegetable juices (ND) liter 109,8 146,0 8855 106,7 112,8 155,1 167,3 10144 151,8 158,4
HQ01221 Mineral or spring waters liter 54,5 117,7 8822 52,0 56,9 103,6 146,7 10087 100,7 106,5 18,0 47,4 3774 16,5 19,5 19,9 42,7 7586 19,0 20,9HQ01222 Soft drinks liter 38,6 58,6 8779 37,4 39,8 23,7 44,5 10136 22,8 24,5 11,7 25,2 3774 10,9 12,5 16,5 31,6 7586 15,8 17,2HQ01223 Fruit juices liter 17,3 30,3 8688 16,6 17,9 28,5 37,4 10123 27,8 29,2 9,4 20,2 3774 8,7 10,0 11,6 21,2 7586 11,2 12,1HQ01224 Vegetable juices liter 0,4 4,1 8791 0,3 0,5 0,2 2,1 10186 0,1 0,2 1,1 5,4 3774 0,9 1,3 1,1 5,2 7586 1,0 1,2HQ021 Alcoholic beverages liter 31,4 71,0 8874 29,9 32,8 40,6 73,2 10112 39,2 42,1HQ0211 Spirits and liqueurs liter 1,2 5,4 8846 1,1 1,3 3,2 9,5 10147 3,0 3,4 2,2 5,9 3774 2,0 2,3 3,0 7,0 7586 2,9 3,2HQ0212 Wine (ND) liter 12,7 54,9 8875 11,5 13,8 26,6 58,5 10101 25,5 27,7 3,6 9,8 7586 3,4 3,8HQ02121 Wine from grapes or other fruit liter 11,7 53,9 8876 10,5 12,8 24,1 56,0 10108 23,0 25,2 2,3 8,5 3774 2,1 2,6 2,3 7,9 7586 2,1 2,4HQ02122 Other liter 1,0 7,8 8856 0,8 1,2 2,4 9,8 10158 2,2 2,6 1,3 4,6 3774 1,1 1,4 1,3 4,7 7586 1,2 1,4HQ0213 Beer liter 17,5 40,0 8875 16,7 18,3 10,8 31,6 10171 10,2 11,4 12,1 30,1 3774 11,1 13,0 16,4 34,2 7586 15,6 17,2
Vegetables kg 63,8 61,1 7165 62,4 65,2 3 57,8 52,9 9770 56,7 58,8 3 85,2 83,0 3774 82,5 87,8 3 97,1 80,0 7586 95,3 98,9 3Fruit kg 98,0 88,7 6802 95,9 100,1 3 19,6 35,0 1371 17,7 21,4 3 61,3 74,6 3774 59,0 63,7 3 71,8 70,4 7586 70,3 73,4 3Sugar (version "large") liter 152,5 129,9 7759 149,6 155,3 3 103,6 90,6 9720 101,8 105,4 3 83,0 71,9 3774 80,7 85,3 3 120,1 102,3 7586 117,8 122,4 3Sugar (version "short") liter 55,4 70,0 8626 54,0 56,9 52,1 64,0 10071 50,9 53,4 21,1 34,0 3774 20,0 22,1 28,1 38,5 7586 27,2 29,0
8881 10240 3774 75862004 2005 2005 2005ES FR LV LT
HQ01213 Cocoa and powdered chocolate
HQ01211 Coffee
HQ01212 Tea
HQ01194 Other food products nec
HQ0121 Coffee, tea and cocoa (ND)
HQ01192 Salt, spices and culinary herbs
HQ01193 Baby food, dietary preparations, baker's yeast and other food preparations
HQ0119 Food products nec (ND)
HQ01191 Sauces, condiments
HQ01185 Edible ices and ice cream
HQ01186 Other sugar products
HQ0118 Sugar, jam, honey, chocolate and confectionery (ND)
HQ01184 Confectionery products
Std Dev: Standard Deviation; N: number of observed households; LCL 95%: 95% Lower Confidence Limit; UCL 95%: 95% Upper Confidence Limit; Flags: 1: Not surveyed quantities; 2: Not available; 3: see list of products in Annex V; 4: No summary quantity because different measurement units for the different sub-headings; 9: estimated (see Annex V); 10: estimated by Eurostat (see Annex V)

Eurostat/Unit F5 Food consumption statistics - Results using data collected from HBS Food Safety Statistics ESTAT/F5/ES/204 Rev.1
29/57
Annual mean food availability per person (food quantities purchased per person) (FQP)
YearSurveyed households, number
Code Label and measurement unit FQP Std Dev N LCL 95% UCL 95% flag FQP Std Dev N LCL 95% UCL 95% flag FQP Std Dev N LCL 95% UCL 95% flagkg 92,4 49,7 9058 91,4 93,4 118,1 63,2 3732 116,1 120,1? 119,1 66,5 34767 118,4 119,8
HQ01111 Rice kg 7,1 6,5 5424 6,9 7,2 4,7 9,9 3732 4,4 5,0 1,5 3,3 34767 1,5 1,6HQ01112 Bread kg 63,6 34,9 9038 62,8 64,3 61,3 38,0 3732 60,1 62,5 81,6 48,6 34767 81,1 82,2HQ011121 Bread: wholemeal kg 51,3 33,2 8805 50,6 52,0HQ011122 Bread: low fibre kg 11,6 11,0 7941 11,3 11,8HQ01113 Pasta products kg 7,5 6,5 7186 7,3 7,6 19,8 19,5 3732 19,2 20,4 4,6 5,5 32025 4,6 4,7HQ01114 Pastry-cook products kg 9,5 10,9 3500 9,1 9,8 8,3 14,6 3732 7,8 8,8 9,4 10,1 30297 9,3 9,6
kg? 21,4 22,2 7529 20,9 21,9 0,0 0,0 33338 0,0 0,0
kg 24,0 25,7 3732 23,1 24,8? 11,0 18,4 29193 10,8 11,2
HQ011161 Other products: wholemeal kgHQ011162 Other products: low fibre kgHQ0112 Meat (ND) kg 58,6 47,2 9022 57,6 59,6 66,5 55,2 3732 64,7 68,2 76,5 55,4 34735 75,9 77,1
HQ01121 Fresh, chilled or frozen meat of bovine animals kg 7,6 7,8 1264 7,1 8,0 13,5 17,6 3732 12,9 14,1 1,7 4,9 34442 1,7 1,8
HQ01122 Fresh, chilled or frozen meat of swine kg 19,9 28,4 7422 19,3 20,6 11,1 18,2 3732 10,5 11,7 15,8 25,2 30830 15,5 16,0
HQ01123 Fresh, chilled or frozen meat of sheep and goat kg 14,8 15,7 109 11,9 17,7 0,7 4,1 3732 0,5 0,8 0,1 1,0 4671 0,1 0,1
HQ01124 Fresh, chilled or frozen meat of poultry kg 21,5 20,0 7838 21,1 21,9 21,3 27,9 3732 20,4 22,2 19,8 20,8 34578 19,6 20,0
HQ01125 Dried, salted or smoked meat and edible meat offal kg 18,9 17,8 8916 18,6 19,3 0,1 1,3 3732 0,1 0,1 29,4 20,8 34599 29,2 29,6
HQ01126 Other preserved or processed meat and meat preparations kg 4,3 5,5 4235 4,2 4,5 16,2 13,9 3732 15,7 16,6 2,3 4,0 34208 2,2 2,3
HQ01127 Other fresh, chilled or frozen edible meat kg 14,0 18,1 141 11,0 17,0 3,7 11,5 3732 3,3 4,0 1,6 4,8 34744 1,5 1,6
HQ0113 Fish (ND) kg 5,1 6,2 3041 4,9 5,3 13,1 19,5 3732 12,4 13,7 5,6 8,9 34404 5,5 5,7HQ01131 Fresh, chilled or frozen fish kg 6,5 6,8 1826 6,2 6,8 4,6 14,6 3732 4,1 5,1 5,5 8,0 18065 5,4 5,6HQ011311 Fresh, chilled or frozen fish: fatty fish kgHQ011312 Fresh, chilled or frozen fish: other fish kgHQ01132 Fresh, chilled or frozen seafood kg 2,4 1,8 33 1,8 3,0 0,6 3,5 3732 0,5 0,7 0,0 0,2 32532 0,0 0,0
HQ01133 Dried, smoked or salted fish and seafood kg 1,8 1,4 34 1,3 2,3 1,2 3,6 3732 1,1 1,3 3,1 3,6 13458 3,0 3,1
HQ011331 Dried, smoked or salted fatty fish kg
HQ011332 Dried, smoked or salted not fatty fish and seafood kg
HQ01134 Other preserved or processed fish and seafood and fish and seafood preparations kg 2,1 2,5 1625 2,0 2,2 6,7 9,4 3732 6,4 7,0 2,5 2,8 13780 2,4 2,5
HQ011341 Other preserved or processed fish and fish preparations: fatty fish kg
HQ011342 Other preserved or processed fish and seafood and fish and seafood preparations kg
HQ0111 Bread and cereals (ND)
HQ01115 Sandwiches
HQ01116 Other products
9058 3732 347672008 20052005
HU MT PL
Std Dev: Standard Deviation; N: number of observed households; LCL 95%: 95% Lower Confidence Limit; UCL 95%: 95% Upper Confidence Limit; Flags: 1: Not surveyed quantities; 2: Not available; 3: see list of products in Annex V; 4: No summary quantity because different measurement units for the different sub-headings; 9: estimated (see Annex V); 10: estimated by Eurostat (see Annex V)
Annual mean food availability per person (food quantities purchased per person) (FQP)

Eurostat/Unit F5 Food consumption statistics - Results using data collected from HBS Food Safety Statistics ESTAT/F5/ES/204 Rev.1
30/57
YearSurveyed households, number
Code Label and measurement unit FQP Std Dev N LCL 95% UCL 95% flag FQP Std Dev N LCL 95% UCL 95% flag FQP Std Dev N LCL 95% UCL 95% flagHQ01141 Whole milk liter 57,0 47,1 7761 56,0 58,1 53,8 57,1 3732 52,0 55,7 6,0 15,3 32687 5,9 6,2HQ01142 Low fat milk liter 40,6 42,0 2317 38,9 42,3 29,4 45,4 3732 27,9 30,8 9,7 20,5 21982 9,4 9,9
HQ01141&2 Whole and low fat milk liter
kg 1,4 1,4 1005 1,3 1,5 5,4 10,7 3732 5,0 5,7 0,6 2,6 27023 0,6 0,6liter
kg 9,4 10,6 5815 9,1 9,7 8,5 15,7 3732 8,0 9,0 4,8 8,3 34660 4,7 4,9liter
HQ01145 Cheese and curd kg 6,1 5,3 8022 6,0 6,3 11,4 12,2 3732 11,0 11,8 12,1 10,3 34608 12,0 12,3HQ011451 Cheese and curd: high fat kg 4,5 4,2 7237 4,4 4,6HQ011452 Cheese and curd: low fat kg 3,0 3,0 5285 2,9 3,1
kg 5,9 5,1 8524 5,8 6,0 4,7 8,1 3732 4,4 5,0 9,4 12,3 32721 9,3 9,6mixed - kg/liter
unit 200,2 156,8 7805 196,7 203,6 108,4 129,1 3732 104,2 112,5 23,6 17,2 34660 23,5 23,8kgkg
mixed - kg/liter
? 18,6 15,6 8740 18,3 18,9 21,4 16,2 34680 21,2 21,6HQ01151 Butter kg 1,9 2,1 3252 1,9 2,0 2,7 4,4 3732 2,5 2,8 4,1 5,5 34746 4,1 4,2HQ01152 Margarine and other vegetable fats kg 4,5 3,6 7006 4,4 4,5 2,6 4,6 3732 2,4 2,7 6,6 7,5 34764 6,5 6,7HQ01153 Olive oil liter 3,3 3,4 297 2,9 3,7 2,0 5,0 3732 1,8 2,1 0,1 0,7 34636 0,1 0,1HQ01154 Edible oils liter 13,0 10,5 6588 12,8 13,3 5,4 10,2 3732 5,1 5,7 2,9 5,0 26330 2,8 2,9HQ01155 Other edible animal fats kg 8,3 12,0 4176 7,9 8,7 0,0 0,6 3732 0,0 0,1 2,4 5,8 32614 2,3 2,4HQ0116 Fruit (ND) kg 47,0 59,6 8531 45,7 48,2 46,9 56,8 34001 46,3 47,5HQ01161 Citrus fruits (fresh, chilled or frozen) kg 11,4 12,8 4498 11,0 11,8 15,5 26,3 3732 14,7 16,4 9,7 13,8 22886 9,5 9,8HQ01162 Bananas (fresh, chilled or frozen) kg 8,5 7,7 4020 8,3 8,7 13,6 19,6 3732 12,9 14,2 2,5 5,6 32695 2,4 2,5HQ01163 Apples (fresh, chilled or frozen) kg 20,8 29,1 6022 20,1 21,6 14,9 21,8 3732 14,2 15,6 13,4 22,4 27460 13,1 13,7HQ01164 Pears (fresh, chilled or frozen) kg 11,9 16,6 1221 11,0 12,9 2,6 7,8 3732 2,4 2,9 1,4 4,3 12909 1,3 1,4HQ01165 Stone fruits (fresh, chilled or frozen) kg 28,5 45,0 2031 26,6 30,5 5,8 14,8 3732 5,4 6,3 2,8 12,6 34047 2,6 2,9HQ01166 Berries (fresh, chilled or frozen) kg 12,7 38,6 2250 11,1 14,3 1,5 5,3 3732 1,3 1,6 7,6 19,7 18146 7,4 7,9HQ01167 Other fresh, chilled or frozen fruits kg 29,6 46,0 2398 27,7 31,4 16,8 35,9 3732 15,7 18,0 2,0 8,7 27225 1,9 2,1HQ01168 Dried fruit kg 2,9 4,6 3854 2,8 3,1 0,7 2,7 3732 0,6 0,8 0,9 2,8 34324 0,9 0,9
HQ01169 Preserved fruit and fruit based products kg 3,4 3,9 243 2,9 3,9 1,6 3,7 3732 1,4 1,7 0,9 3,1 26472 0,9 1,0
HQ0117 Vegetables (ND) kg 95,6 97,0 8925 93,5 97,6 1,6 4,8 3732 1,4 1,8 171,9 204,8 34702 169,7 174,0
HQ01171 Leaf and stem vegetables (fresh, chilled or frozen) kg 14,4 28,5 2088 13,2 15,7 8,1 13,3 3732 7,7 8,6 0,0 0,0 33846 0,0 0,0
HQ01172 Cabbages (fresh, chilled or frozen) kg 11,8 15,7 4906 11,3 12,2 2,9 7,9 3732 2,6 3,1 10,7 20,4 24482 10,5 11,0
HQ01173 Vegetables cultivated for their fruit (fresh, chilled or frozen) kg 25,0 43,6 7789 24,0 26,0 24,2 30,6 3732 23,3 25,2 22,7 42,0 31378 22,3 23,2
HQ01174 Root crops, non-starchy bulbs and mushrooms (fresh, chilled or frozen) kg 21,1 27,8 8151 20,5 21,7 15,2 19,8 3732 14,6 15,8 23,1 31,4 34735 22,8 23,5
HQ01175 Dried vegetables kg 1,9 1,5 29 1,3 2,4 0,5 1,8 3732 0,4 0,6 1,0 2,4 23073 0,9 1,0
HQ01176 Other preserved or processed vegetables kg 9,7 11,1 5938 9,4 10,0 25,0 25,0 3732 24,2 25,8 12,0 14,8 34764 11,9 12,2
HQ01177 Potatoes kg 43,1 54,3 7376 41,8 44,3 32,3 41,7 3732 31,0 33,6 22,6 51,3 34767 22,0 23,1
HQ01178 Other tubers and products of tuber vegetables kg 2,8 3,8 2407 2,7 3,0 0,0 0,4 3732 0,0 0,0 1,0 3,2 34715 1,0 1,0
9058 3732 347672008 20052005
HU MT PL
HQ01147 Eggs
HQ0115 Oils and fats (ND)
HQ01144 Yoghurt
HQ01146 Other milk products
HQ01143 Preserved milk
Std Dev: Standard Deviation; N: number of observed households; LCL 95%: 95% Lower Confidence Limit; UCL 95%: 95% Upper Confidence Limit; Flags: 1: Not surveyed quantities; 2: Not available; 3: see list of products in Annex V; 4: No summary quantity because different measurement units for the different sub-headings; 9: estimated (see Annex V); 10: estimated by Eurostat (see Annex V)

Eurostat/Unit F5 Food consumption statistics - Results using data collected from HBS Food Safety Statistics ESTAT/F5/ES/204 Rev.1
31/57
Annual mean food availability per person (food quantities purchased per person) (FQP)
YearSurveyed households, number
Code Label and measurement unit FQP Std Dev N LCL 95% UCL 95% flag FQP Std Dev N LCL 95% UCL 95% flag FQP Std Dev N LCL 95% UCL 95% flagkg? 18,1 21,5 8719 17,7 18,6 28,4 28,4 34602 28,1 28,7
HQ01181 Sugar kg 18,5 21,4 6987 18,0 19,0 5,2 11,1 3732 4,9 5,6 4,5 11,2 34715 4,4 4,6HQ01182 Jams, marmalades kg 5,3 6,8 3576 5,1 5,6 0,4 1,8 3732 0,4 0,5 2,0 3,6 28500 2,0 2,0HQ01183 Chocolate kg 1,0 3,2 3732 0,9 1,1 1,6 2,5 27300 1,5 1,6
kg 0,2 1,5 3732 0,2 0,3? 1,9 2,5 4283 1,9 2,0 2,6 4,4 34666 2,5 2,6
kgliter 8,1 18,7 3732 7,5 8,7 3,1 6,5 22267 3,1 3,2
kg 6,14 9,7 3732 5,8 6,5 1,86 2,2 6354 1,8 1,9?
kg 0,5 1,1 30265 0,5 0,6? 1,7 3,3 8318 1,7 1,8
kgliter 7,2 11,1 3732 6,9 7,6
? 0,0 0,0 32 0,0 0,0HQ011911 Vinegar literHQ011912 Other sauces and condiments kg
kg 1,1 3,5 5878 1,0 1,2 1,1 3,5 3732 1,0 1,2? 0,6 1,2 25302 0,6 0,7
kg 3,0 7,8 3732 2,8 3,3? 0,0 0,0 30754 0,0 0,0
kgunit 0,1 1,2 3732 0,0 0,1
? 0,0 0,0 14038 0,0 0,0kg 3,4 2,7 8564 3,3 3,4 4,3 4,2 33326 4,2 4,3
literkg 2,9 2,4 7998 2,8 3,0 1,2 2,6 3732 1,1 1,3 2,6 3,4 34655 2,6 2,7
litermixed - kg/liter
kg 0,4 0,5 3921 0,4 0,4 1,4 3,4 3732 1,3 1,5 1,4 1,7 29225 1,4 1,4liter
kg 1,5 1,5 2232 1,5 1,6 0,4 1,7 3732 0,4 0,5 0,3 0,8 31625 0,3 0,3liter
HQ0122 Mineral waters, soft drinks, fruit and vegetable juices (ND) liter 98,0 92,1 8352 96,0 99,9 49,5 77,3 34759 48,7 50,3
HQ01221 Mineral or spring waters liter 74,6 79,0 5275 72,5 76,8 158,5 282,2 3732 149,5 167,6 14,8 38,1 33480 14,4 15,3HQ01222 Soft drinks liter 47,7 54,9 5765 46,2 49,1 100,2 126,9 3732 96,1 104,3 20,6 40,4 28868 20,2 21,1HQ01223 Fruit juices liter 23,2 28,1 5909 22,5 23,9 10,7 24,1 3732 10,0 11,5 5,6 16,2 34654 5,5 5,8HQ01224 Vegetable juices liter 9,1 10,9 277 7,8 10,4 0,1 2,5 3732 0,1 0,2 1,1 4,8 17000 1,1 1,2HQ021 Alcoholic beverages liter 32,8 47,1 5528 31,5 34,0 15,8 29,9 19489 15,4 16,3HQ0211 Spirits and liqueurs liter 4,8 9,4 1450 4,3 5,3 0,5 3,4 3732 0,4 0,7 0,9 7,0 32272 0,9 1,0HQ0212 Wine (ND) liter 17,7 30,4 3054 16,7 18,8 4,9 7,5 6456 4,7 5,1HQ02121 Wine from grapes or other fruit liter 18,9 31,9 2502 17,6 20,1 10,1 26,9 3732 9,2 11,0 2,7 6,3 8425 2,5 2,8HQ02122 Other liter 6,0 6,3 1046 5,6 6,4 0,3 3,3 3732 0,2 0,4 0,3 1,4 31707 0,3 0,3HQ0213 Beer liter 28,6 42,3 4123 27,3 29,9 9,0 34,6 3732 7,9 10,1 10,9 24,2 17286 10,6 11,3
Vegetables kg 87,9 77,0 227 77,9 98,0 3 76,1 66,8 3732 73,9 78,2 3 45,0 47,4 8235 44,0 46,0 3Fruit kg 70,2 66,8 5657 68,4 71,9 3 83,7 79,3 3732 81,2 86,3 3 33,1 37,1 4256 32,0 34,2 3Sugar (version "large") liter 202,5 152,7 3732 197,6 207,4 3 27,8 31,8 8172 27,1 28,5 3Sugar (version "short") liter 68,3 60,6 3945 66,4 70,2 110,9 130,5 3732 106,7 115,1 16,8 28,7 28771 16,5 17,2
3732 3476790582005 2008 2005
MT PLHU
HQ01213 Cocoa and powdered chocolate
HQ01211 Coffee
HQ01212 Tea
HQ01194 Other food products nec
HQ0121 Coffee, tea and cocoa (ND)
HQ01192 Salt, spices and culinary herbs
HQ01193 Baby food, dietary preparations, baker's yeast and other food preparations
HQ0119 Food products nec (ND)
HQ01191 Sauces, condiments
HQ01185 Edible ices and ice cream
HQ01186 Other sugar products
HQ0118 Sugar, jam, honey, chocolate and confectionery (ND)
HQ01184 Confectionery products
Std Dev: Standard Deviation; N: number of observed households; LCL 95%: 95% Lower Confidence Limit; UCL 95%: 95% Upper Confidence Limit; Flags: 1: Not surveyed quantities; 2: Not available; 3: see list of products in Annex V; 4: No summary quantity because different measurement units for the different sub-headings; 9: estimated (see Annex V); 10: estimated by Eurostat (see Annex V)

Eurostat/Unit F5 Food consumption statistics - Results using data collected from HBS Food Safety Statistics ESTAT/F5/ES/204 Rev.1
32/57
Annual mean food availability per person (food quantities purchased per person) (FQP)
YearSurveyed households, number
Code Label and measurement unit FQP Std Dev N LCL 95% UCL 95% flag FQP Std Dev N LCL 95% UCL 95% flag FQP Std Dev N LCL 95% UCL 95% flagkg 148,0 55,8 33066 147,4 148,6 89,9 72,6 3722 87,6 92,3 112,6 58,0 4710 110,9 114,2?
HQ01111 Rice kg 5,3 3,7 33066 5,3 5,4 3,1 7,1 3723 2,9 3,3 7,8 8,2 4710 7,6 8,1HQ01112 Bread kg 113,1 49,5 33066 112,6 113,7 56,1 41,1 3723 54,8 57,4 65,6 32,3 4710 64,7 66,6HQ011121 Bread: wholemeal kg 0,0 3723 0,0 0,0HQ011122 Bread: low fibre kg 0,0 3723 0,0 0,0HQ01113 Pasta products kg 3,5 3,4 33066 3,5 3,5 6,4 9,4 3723 6,1 6,7 6,6 6,7 4710 6,4 6,8HQ01114 Pastry-cook products kg 0,9 3,3 33066 0,8 0,9 0,0 0,0 1576 0,0 0,0 6,6 6,7 4710 6,4 6,8
kg 0,4 1,5 4710 0,3 0,4? 0,0 0,0 33066 0,0 0,0 0,0 0,0 3370 0,0 0,0
kg 25,1 28,0 33066 24,8 25,4 24,3 53,4 3723 22,5 26,0 25,5 27,5 4710 24,8 26,3?
HQ011161 Other products: wholemeal kg 0,0 3723 0,0 0,0HQ011162 Other products: low fibre kg 0,0 3723 0,0 0,0HQ0112 Meat (ND) kg 40,6 24,5 33066 40,3 40,8 52,5 64,5 3723 50,4 54,6 52,9 43,1 4710 51,7 54,1
HQ01121 Fresh, chilled or frozen meat of bovine animals kg 5,5 8,2 22280 5,4 5,7 11,1 23,9 3723 10,4 11,9 2,6 7,1 4710 2,4 2,8
HQ01122 Fresh, chilled or frozen meat of swine kg 12,6 11,5 21569 12,4 12,7 11,3 42,8 3723 9,9 12,6 12,3 25,5 4710 11,6 13,1
HQ01123 Fresh, chilled or frozen meat of sheep and goat kg 1,6 5,8 22783 1,5 1,7 0,2 3,8 3677 0,1 0,3 0,1 1,5 4710 0,0 0,1
HQ01124 Fresh, chilled or frozen meat of poultry kg 14,7 11,6 30625 14,6 14,9 9,7 20,0 3723 9,1 10,3 18,6 18,1 4710 18,1 19,1
HQ01125 Dried, salted or smoked meat and edible meat offal kg 9,7 8,0 32836 9,6 9,8 17,8 17,2 3723 17,2 18,3 15,9 11,9 4710 15,5 16,2
HQ01126 Other preserved or processed meat and meat preparations kg 6,2 7,4 18527 6,1 6,3 2,1 3,9 3723 2,0 2,2 3,2 4,7 4710 3,1 3,4
HQ01127 Other fresh, chilled or frozen edible meat kg 0,2 1,5 33066 0,1 0,2 0,3 2,5 3708 0,2 0,4 0,1 2,3 4710 0,1 0,2
HQ0113 Fish (ND) kg 5,4 6,5 33066 5,3 5,4 3,8 7,4 3723 3,5 4,0 4,9 5,7 4710 4,7 5,1HQ01131 Fresh, chilled or frozen fish kg 5,1 6,4 33066 5,0 5,1 1,9 5,8 3723 1,8 2,1 2,2 4,0 4710 2,1 2,3HQ011311 Fresh, chilled or frozen fish: fatty fish kg 0,0 0,0 3723 0,0 0,0HQ011312 Fresh, chilled or frozen fish: other fish kg 0,0 0,0 3723 0,0 0,0HQ01132 Fresh, chilled or frozen seafood kg 0,1 0,7 33066 0,1 0,1 0,3 1,8 3723 0,2 0,3 0,0 0,3 4710 0,0 0,0
HQ01133 Dried, smoked or salted fish and seafood kg 0,0 0,0 33066 0,0 0,0 0,0 0,2 3616 0,0 0,0 0,2 0,7 4710 0,1 0,2
HQ011331 Dried, smoked or salted fatty fish kg 0,0 0,0 3723 0,0 0,0
HQ011332 Dried, smoked or salted not fatty fish and seafood kg 0,0 0,0 3723 0,0 0,0
HQ01134 Other preserved or processed fish and seafood and fish and seafood preparations kg 0,2 0,8 33066 0,2 0,2 1,5 3,5 3723 1,4 1,6 2,5 3,1 4710 2,4 2,6
HQ011341 Other preserved or processed fish and fish preparations: fatty fish kg 0,0 0,0 3723 0,0 0,0
HQ011342 Other preserved or processed fish and seafood and fish and seafood preparations kg 0,0 0,0 3723 0,0 0,0
HQ0111 Bread and cereals (ND)
HQ01115 Sandwiches
HQ01116 Other products
3725 47103306620062005 2004
SI SKRO
Std Dev: Standard Deviation; N: number of observed households; LCL 95%: 95% Lower Confidence Limit; UCL 95%: 95% Upper Confidence Limit; Flags: 1: Not surveyed quantities; 2: Not available; 3: see list of products in Annex V; 4: No summary quantity because different measurement units for the different sub-headings; 9: estimated (see Annex V); 10: estimated by Eurostat (see Annex V)

Eurostat/Unit F5 Food consumption statistics - Results using data collected from HBS Food Safety Statistics ESTAT/F5/ES/204 Rev.1
33/57
Annual mean food availability per person (food quantities purchased per person) (FQP)
YearSurveyed households, number
Code Label and measurement unit FQP Std Dev N LCL 95% UCL 95% flag FQP Std Dev N LCL 95% UCL 95% flag FQP Std Dev N LCL 95% UCL 95% flagHQ01141 Whole milk liter 54,6 62,0 33066 54,0 55,3 60,6 79,8 3723 58,0 63,1 20,1 38,1 4710 19,0 21,2HQ01142 Low fat milk liter 8,6 25,7 33066 8,3 8,9 14,2 39,6 3723 13,0 15,5 40,1 43,0 4710 38,9 41,3
HQ01141&2 Whole and low fat milk liter
kg 0,1 1,2 33066 0,1 0,1 0,1 1,4 3693 0,1 0,2 0,4 1,6 4710 0,4 0,4liter
kg 2,4 7,0 33066 2,4 2,5 13,1 16,6 3723 12,6 13,7liter 7,8 8,0 4710 7,6 8,0
HQ01145 Cheese and curd kg 13,5 14,1 33066 13,4 13,7 6,0 7,0 3723 5,8 6,3 6,3 5,2 4710 6,1 6,4HQ011451 Cheese and curd: high fat kg 0,0 0,0 3723 0,0 0,0HQ011452 Cheese and curd: low fat kg 0,0 0,0 3723 0,0 0,0
kg 2,1 3,4 33066 2,1 2,1 9,6 11,7 3723 9,2 10,0 8,0 8,8 4710 7,8 8,3mixed - kg/liter
unit 154,5 103,5 33066 153,4 155,6 109,2 165,8 3723 103,8 114,5 140,3 138,7 4710 136,3 144,3kgkg
mixed - kg/liter
? 15,7 7,3 33066 15,7 15,8 16,4 22,7 3723 15,7 17,2HQ01151 Butter kg 0,3 0,8 33066 0,3 0,4 0,8 2,0 3723 0,7 0,8 1,7 2,4 4710 1,6 1,8HQ01152 Margarine and other vegetable fats kg 2,1 2,0 33066 2,1 2,1 2,2 4,1 3723 2,1 2,3 5,0 4,5 4710 4,9 5,1HQ01153 Olive oil liter 0,1 0,5 33066 0,0 0,1 0,7 3,3 3723 0,6 0,8 0,3 1,3 4710 0,2 0,3HQ01154 Edible oils liter 11,4 5,8 33066 11,3 11,4 11,6 20,2 3723 10,9 12,2 10,8 11,0 4710 10,5 11,1HQ01155 Other edible animal fats kg 1,9 3,8 33066 1,8 1,9 1,1 5,4 3720 1,0 1,3 1,1 4,2 4710 1,0 1,3HQ0116 Fruit (ND) kg 35,0 41,2 33066 34,6 35,5 70,7 78,5 3723 68,2 73,2HQ01161 Citrus fruits (fresh, chilled or frozen) kg 4,1 7,2 33066 4,0 4,2 14,9 27,3 3723 14,0 15,7 9,7 13,7 4710 9,3 10,1HQ01162 Bananas (fresh, chilled or frozen) kg 3,6 6,0 33066 3,6 3,7 10,8 17,3 3723 10,2 11,3 4,8 6,6 4710 4,6 5,0HQ01163 Apples (fresh, chilled or frozen) kg 14,1 16,9 33066 13,9 14,3 19,4 39,5 3723 18,2 20,7 10,3 18,5 4710 9,8 10,9HQ01164 Pears (fresh, chilled or frozen) kg 0,9 4,6 33066 0,8 0,9 2,4 6,3 3723 2,2 2,6 0,6 2,9 4710 0,5 0,6HQ01165 Stone fruits (fresh, chilled or frozen) kg 3,0 9,5 33066 2,9 3,1 7,5 19,4 3723 6,9 8,1 2,7 12,0 4710 2,3 3,0HQ01166 Berries (fresh, chilled or frozen) kg 2,0 7,6 33066 1,9 2,1 1,0 7,0 3720 0,8 1,2 1,8 6,0 4710 1,7 2,0HQ01167 Other fresh, chilled or frozen fruits kg 6,4 29,1 33066 6,1 6,7 12,1 33,7 3723 11,1 13,2 6,7 18,6 4710 6,1 7,2HQ01168 Dried fruit kg 1,0 3,7 33066 0,9 1,0 2,4 8,1 3723 2,1 2,6 1,6 3,2 4710 1,5 1,7
HQ01169 Preserved fruit and fruit based products kg 0,0 0,0 33066 0,0 0,0 0,1 0,8 3708 0,1 0,2 0,3 1,9 4710 0,3 0,4
HQ0117 Vegetables (ND) kg 114,6 61,4 33066 114,0 115,3 99,1 208,4 3723 92,5 105,8
HQ01171 Leaf and stem vegetables (fresh, chilled or frozen) kg 2,9 6,4 33066 2,8 3,0 10,4 12,7 3723 10,0 10,9 0,6 2,8 4710 0,5 0,7
HQ01172 Cabbages (fresh, chilled or frozen) kg 7,5 12,0 33066 7,4 7,6 7,5 33,4 3723 6,4 8,5 8,6 26,0 4710 7,9 9,3
HQ01173 Vegetables cultivated for their fruit (fresh, chilled or frozen) kg 19,7 32,1 33066 19,3 20,0 18,3 26,8 3723 17,4 19,1 10,3 22,8 4710 9,6 10,9
HQ01174 Root crops, non-starchy bulbs and mushrooms (fresh, chilled or frozen) kg 18,0 11,7 33066 17,8 18,1 12,8 24,0 3723 12,0 13,6 10,8 16,4 4710 10,3 11,2
HQ01175 Dried vegetables kg 5,2 5,6 33066 5,2 5,3 1,7 5,7 3720 1,5 1,9 1,4 2,9 4710 1,3 1,5
HQ01176 Other preserved or processed vegetables kg 15,2 20,1 33066 15,0 15,4 8,7 15,3 3723 8,2 9,2 4,4 7,2 4710 4,2 4,6
HQ01177 Potatoes kg 46,2 33,1 33066 45,8 46,5 38,0 186,7 3723 32,0 44,0 30,9 81,9 4710 28,6 33,2
HQ01178 Other tubers and products of tuber vegetables kg 0,0 0,4 33066 0,0 0,0 1,8 4,9 3721 1,6 1,9 1,7 3,6 4710 1,6 1,8
3725 47103306620062005 2004
SI SKRO
HQ01147 Eggs
HQ0115 Oils and fats (ND)
HQ01144 Yoghurt
HQ01146 Other milk products
HQ01143 Preserved milk
Std Std Dev: Standard Deviation; N: number of observed households; LCL 95%: 95% Lower Confidence Limit; UCL 95%: 95% Upper Confidence Limit; Flags: 1: Not surveyed quantities; 2: Not available; 3: see list of products in Annex V; 4: No summary quantity because different measurement units for the different sub-headings; 9: estimated (see Annex V); 10: estimated by Eurostat (see Annex V)

Eurostat/Unit F5 Food consumption statistics - Results using data collected from HBS Food Safety Statistics ESTAT/F5/ES/204 Rev.1
34/57
Annual mean food availability per person (food quantities purchased per person) (FQP)
YearSurveyed households, number
Code Label and measurement unit FQP Std Dev N LCL 95% UCL 95% flag FQP Std Dev N LCL 95% UCL 95% flag FQP Std Dev N LCL 95% UCL 95% flagkg? 15,2 10,0 33066 15,1 15,3 23,0 34,9 3536 21,9 24,2
HQ01181 Sugar kg 9,4 5,4 33066 9,3 9,4 12,4 32,0 3723 11,3 13,4 17,2 23,8 4710 16,6 17,9HQ01182 Jams, marmalades kg 3,1 5,8 33066 3,1 3,2 2,5 6,1 3723 2,3 2,7 1,8 4,1 4710 1,7 1,9HQ01183 Chocolate kg 0,5 1,0 33066 0,5 0,5 3,9 5,6 3723 3,7 4,1 2,7 3,1 4710 2,6 2,8
kg 1,2 1,7 4710 1,1 1,2? 0,4 1,1 33066 0,4 0,4 0,0 0,0 1197 0,0 0,0
kg 1,4 3,3 4710 1,3 1,5liter 0,3 1,3 33066 0,3 0,3 3,2 8,1 3723 2,9 3,5
kg 0,88 2,3 4710 0,8 1,0? 1,50 3,1 33066 1,5 1,5 0,00 0,0 2859 0,0 0,0
kg? 0,0 0,0 11375 0,0 0,0 3,0 5,2 1115 2,7 3,3
kg 0,0 0,0 20634 0,0 0,0 0,0 0,0 1499 0,0 0,0 6,3 7,5 4710 6,1 6,6liter
?HQ011911 Vinegar literHQ011912 Other sauces and condiments kg
kg 0,0 0,0 22440 0,0 0,0 0,0 0,0 2003 0,0 0,0 3,9 5,3 4710 3,8 4,1?
kg 0,0 0,0 28884 0,0 0,0 1,8 4,3 1887 1,6 2,0 1,4 2,1 4710 1,4 1,5?
kg 0,0 0,0 20602 0,0 0,0 0,0 0,0 3379 0,0 0,0 0,1 0,6 4710 0,1 0,1unit
?kg 1,8 1,7 33066 1,8 1,8 3,8 5,2 3723 3,6 4,0
literkg 1,5 1,4 33066 1,5 1,5 3,0 4,8 3723 2,9 3,2 1,9 2,1 4710 1,8 1,9
litermixed - kg/liter
kg 0,2 0,7 33066 0,2 0,2 0,3 0,8 3723 0,3 0,4 0,4 0,8 4710 0,4 0,4liter
kg 0,1 0,3 33066 0,1 0,1 0,4 1,8 3723 0,4 0,5 0,7 1,2 4710 0,7 0,7liter
HQ0122 Mineral waters, soft drinks, fruit and vegetable juices (ND) liter 35,2 53,3 33066 34,6 35,7 104,7 118,6 3723 100,8 108,5
HQ01221 Mineral or spring waters liter 16,6 39,3 33066 16,2 17,0 37,6 71,3 3723 35,3 39,9 44,4 61,7 4710 42,6 46,2HQ01222 Soft drinks liter 18,2 31,5 33066 17,8 18,5 31,9 57,4 3723 30,0 33,7 47,8 65,2 4710 45,9 49,7HQ01223 Fruit juices liter 0,4 3,3 33066 0,4 0,5 34,9 57,8 3723 33,0 36,7 13,7 19,9 4710 13,1 14,3HQ01224 Vegetable juices liter 0,0 0,0 33066 0,0 0,0 0,3 3,7 3723 0,2 0,4 1,1 7,2 4710 0,9 1,4HQ021 Alcoholic beverages liter 23,4 39,7 33066 23,0 23,9 31,8 69,7 3513 29,5 34,1HQ0211 Spirits and liqueurs liter 3,1 9,9 33066 2,9 3,2 0,8 3,8 3723 0,7 1,0 2,3 4,4 4710 2,1 2,4HQ0212 Wine (ND) liter 11,4 30,1 33066 11,0 11,7 20,8 68,0 3723 18,6 23,0HQ02121 Wine from grapes or other fruit liter 11,3 30,1 33066 10,9 11,6 7,9 39,0 3320 6,6 9,2 5,1 11,6 4710 4,8 5,4HQ02122 Other liter 0,1 0,9 33066 0,1 0,1 0,1 2,4 3723 0,1 0,2 0,0 0,4 4710 0,0 0,0HQ0213 Beer liter 9,0 17,9 33066 8,8 9,2 22,0 53,7 3723 20,3 23,7 17,7 47,1 4710 16,4 19,1
Vegetables kg 68,5 44,8 33066 68,0 69,0 3 61,5 66,9 3718 59,3 63,6 3 38,9 49,6 4710 37,5 40,3 3Fruit kg 35,4 41,6 33066 35,0 35,9 3 105,2 102,9 3708 101,9 108,6 3 52,3 47,5 4710 50,9 53,6 3Sugar (version "large") liter 83,7 69,0 33066 83,0 84,5 3 145,4 126,5 3693 141,3 149,5 3 125,1 87,7 4710 122,6 127,6 3Sugar (version "short") liter 18,6 31,7 33066 18,2 18,9 66,7 84,4 3723 64,0 69,5 61,5 68,8 4710 59,5 63,5
471033066 37252004 20062005
SKRO SI
HQ01213 Cocoa and powdered chocolate
HQ01211 Coffee
HQ01212 Tea
HQ01194 Other food products nec
HQ0121 Coffee, tea and cocoa (ND)
HQ01192 Salt, spices and culinary herbs
HQ01193 Baby food, dietary preparations, baker's yeast and other food preparations
HQ0119 Food products nec (ND)
HQ01191 Sauces, condiments
HQ01185 Edible ices and ice cream
HQ01186 Other sugar products
HQ0118 Sugar, jam, honey, chocolate and confectionery (ND)
HQ01184 Confectionery products
Std Std Dev: Standard Deviation; N: number of observed households; LCL 95%: 95% Lower Confidence Limit; UCL 95%: 95% Upper Confidence Limit; Flags: 1: Not surveyed quantities; 2: Not available; 3: see list of products in Annex V; 4: No summary quantity because different measurement units for the different sub-headings; 9: estimated (see Annex V); 10: estimated by Eurostat (see Annex V)

Eurostat/Unit F5 Food consumption statistics - Results using data collected from HBS Food Safety Statistics ESTAT/F5/ES/204 Rev.1
35/57
Annual mean food availability per person (food quantities purchased per person) (FQP)
YearSurveyed households, number
Code Label and measurement unit FQP Std Dev N LCL 95% UCL 95% flag FQP Std Dev N LCL 95% UCL 95% flagkg 102.5 55.3 634 98.2 106.8 105.1 107.9 3360 101.4 108.7?
HQ01111 Rice kg 14.7 35.2 1387 12.9 16.6 17.1 24.8 739 15.3 18.9HQ01112 Bread kg 48.1 29.8 6594 47.4 48.9 57.2 57.5 3282 55.2 59.2HQ011121 Bread: wholemeal kgHQ011122 Bread: low fibre kgHQ01113 Pasta products kg 9.4 9.1 2719 9.1 9.7 12.8 16.6 1536 12.0 13.6HQ01114 Pastry-cook products kg 13.4 12.1 5081 13.1 13.8 17.2 20.6 2847 16.5 18.0
kg 0 0.0 0.0?
kg 17.7 22.2 5322 17.1 18.3 3 38.0 67.3 2250 35.2 40.8?
HQ011161 Other products: wholemeal kgHQ011162 Other products: low fibre kgHQ0112 Meat (ND) kg 73.8 6.2 2 65.2 82.5 60.1 88.3 3296 57.1 63.1
HQ01121 Fresh, chilled or frozen meat of bovine animals kg 12.0 11.4 3261 11.6 12.4 5.7 14.9 2590 5.1 6.2
HQ01122 Fresh, chilled or frozen meat of swine kg 10.0 9.5 1720 9.6 10.5 10.8 26.6 2707 9.8 11.8
HQ01123 Fresh, chilled or frozen meat of sheep and goat kg 12.9 16.6 1301 12.0 13.8 9.1 75.8 1542 5.3 12.9
HQ01124 Fresh, chilled or frozen meat of poultry kg 19.0 19.4 3468 18.4 19.7 16.9 23.3 1487 15.7 18.1
HQ01125 Dried, salted or smoked meat and edible meat offal kg 11.4 11.1 4562 11.0 11.7 18.3 23.1 3020 17.4 19.1
HQ01126 Other preserved or processed meat and meat preparations kg 23.5 21.1 5837 22.9 24.0 18.7 22.3 2788 17.9 19.5
HQ01127 Other fresh, chilled or frozen edible meat kg 12.3 25.3 34 3.8 20.8 58.3 136.1 140 35.8 80.8
HQ0113 Fish (ND) kg 29.0 17.2 81 25.3 32.8 23.0 41.1 2811 21.5 24.6HQ01131 Fresh, chilled or frozen fish kg 8.9 12.2 1723 8.3 9.5 15.1 36.0 1665 13.4 16.9HQ011311 Fresh, chilled or frozen fish: fatty fish kgHQ011312 Fresh, chilled or frozen fish: other fish kgHQ01132 Fresh, chilled or frozen seafood kg 5.0 5.6 767 4.6 5.4 18.7 39.0 491 15.3 22.2
HQ01133 Dried, smoked or salted fish and seafood kg 4.4 4.8 777 4.0 4.7 9.4 14.9 607 8.2 10.5
HQ011331 Dried, smoked or salted fatty fish kg
HQ011332 Dried, smoked or salted not fatty fish and seafood kg
HQ01134 Other preserved or processed fish and seafood and fish and seafood preparations kg 8.3 8.9 3477 8.0 8.6 10.1 13.2 2469 9.6 10.6
HQ011341 Other preserved or processed fish and fish preparations: fatty fish kg
HQ011342 Other preserved or processed fish and seafood and fish and seafood preparations kg
UK NO2005 2003-2005
33766747
HQ0111 Bread and cereals (ND)
HQ01115 Sandwiches
HQ01116 Other products
Std Dev: Standard Deviation; N: number of observed households; LCL 95%: 95% Lower Confidence Limit; UCL 95%: 95% Upper Confidence Limit; Flags: 1: Not surveyed quantities; 2: Not available; 3: see list of products in Annex V; 4: No summary quantity because different measurement units for the different sub-headings; 9: estimated (see Annex V); 10: estimated by Eurostat (see Annex V)

Eurostat/Unit F5 Food consumption statistics - Results using data collected from HBS Food Safety Statistics ESTAT/F5/ES/204 Rev.1
36/57
Annual mean food availability per person (food quantities purchased per person) (FQP)
YearSurveyed households, number
Code Label and measurement unit FQP Std Dev N LCL 95% UCL 95% flag FQP Std Dev N LCL 95% UCL 95% flagHQ01141 Whole milk liter 66.6 61.1 2181 64.0 69.2 43.1 80.5 2219 39.7 46.4HQ01142 Low fat milk liter 79.4 62.8 5133 77.7 81.2 87.3 97.2 2846 83.7 90.9
HQ01141&2 Whole and low fat milk liter
kg 7.8 8.6 145 6.4 9.2liter 38.2 42.0 537 34.6 41.7
kg 3.5 3.9 1857 3.3 3.7liter 15.9 14.8 3698 15.4 16.4
HQ01145 Cheese and curd kg 7.9 8.3 4832 7.7 8.2 16.3 16.8 3021 15.7 16.9HQ011451 Cheese and curd: high fat kgHQ011452 Cheese and curd: low fat kg
kg 18.9 22.0 3006 18.1 19.6mixed - kg/liter 12.5 17.2 3869 12.0 13.1 3
unit 133.9 116.4 3926 130.3 137.6kg 11.8 12.4 2447 11.3 12.3kg 15.5 18.2 2819 14.8 16.2 9
mixed - kg/liter
? HQ01151 Butter kg 6.5 5.1 2048 6.3 6.7 7.1 8.6 711 6.4 7.7HQ01152 Margarine and other vegetable fats kg 8.2 6.4 3400 8.0 8.4 12.9 15.2 2548 12.3 13.5HQ01153 Olive oil liter 7.0 6.8 504 6.4 7.6 8.7 11.0 243 7.3 10.1 10HQ01154 Edible oils liter 15.4 17.7 888 14.2 16.5 10.7 15.8 304 8.9 12.5 10HQ01155 Other edible animal fats kg 6.3 8.6 315 5.3 7.3 9.5 12.2 53 6.2 12.7HQ0116 Fruit (ND) kg 70.8 80.0 3179 68.0 73.6HQ01161 Citrus fruits (fresh, chilled or frozen) kg 16.5 18.1 3018 15.8 17.1 23.2 34.5 2027 21.7 24.7HQ01162 Bananas (fresh, chilled or frozen) kg 17.3 14.9 4348 16.8 17.7 19.9 20.3 2212 19.1 20.8HQ01163 Apples (fresh, chilled or frozen) kg 15.5 15.4 3686 15.0 16.0 20.7 25.5 2304 19.7 21.7HQ01164 Pears (fresh, chilled or frozen) kg 10.1 9.0 1527 9.6 10.5 14.0 14.9 900 13.0 14.9HQ01165 Stone fruits (fresh, chilled or frozen) kg 12.4 18.0 1999 11.6 13.2 17.1 28.5 293 13.8 20.3HQ01166 Berries (fresh, chilled or frozen) kg 11.0 11.7 3217 10.6 11.4 33.2 76.9 534 26.7 39.8HQ01167 Other fresh, chilled or frozen fruits kg 12.3 14.5 1798 11.6 12.9 19.4 23.5 1792 18.3 20.5HQ01168 Dried fruit kg 6.8 8.8 2257 6.5 7.2 6.7 7.3 1662 6.3 7.0HQ01169 Preserved fruit and fruit based products kg 9.2 11.2 1343 8.6 9.8 9.8 9.0 513 9.0 10.5HQ0117 Vegetables (ND) kg 96.9 129.4 3297 92.5 101.3
HQ01171 Leaf and stem vegetables (fresh, chilled or frozen) kg 7.9 8.2 4081 7.6 8.1 8.4 8.0 1620 8.0 8.8
HQ01172 Cabbages (fresh, chilled or frozen) kg 12.9 12.8 3575 12.4 13.3 12.3 15.7 2100 11.6 12.9
HQ01173 Vegetables cultivated for their fruit (fresh, chilled or frozen) kg 17.2 18.1 5044 16.7 17.7 18.4 22.2 2877 17.6 19.2
HQ01174 Root crops, non-starchy bulbs and mushrooms (fresh, chilled or frozen) kg 23.0 22.6 5453 22.4 23.6 21.1 24.4 2831 20.2 22.0
HQ01175 Dried vegetables kg 8.6 17.6 281 6.6 10.7 3.9 5.6 481 3.4 4.4
HQ01176 Other preserved or processed vegetables kg 18.4 17.5 5023 17.9 18.9 3 11.8 13.5 1748 11.1 12.4
HQ01177 Potatoes kg 41.0 48.9 4768 39.6 42.4 54.3 115.0 2269 49.6 59.0
HQ01178 Other tubers and products of tuber vegetables kg 15.1 15.4 4463 14.6 15.5 9.6 11.4 2272 9.1 10.0
HQ01143 Preserved milk
HQ01144 Yoghurt
HQ01146 Other milk products
HQ01147 Eggs
HQ0115 Oils and fats (ND)
UK NO2005 2003-20056747 3376
Std Dev: Standard Deviation; N: number of observed households; LCL 95%: 95% Lower Confidence Limit; UCL 95%: 95% Upper Confidence Limit; Flags: 1: Not surveyed quantities; 2: Not available; 3: see list of products in Annex V; 4: No summary quantity because different measurement units for the different sub-headings; 9: estimated (see Annex V); 10: estimated by Eurostat (see Annex V)

Eurostat/Unit F5 Food consumption statistics - Results using data collected from HBS Food Safety Statistics ESTAT/F5/ES/204 Rev.1
37/57
Annual mean food availability per person (food quantities purchased per person) (FQP)
YearSurveyed households, number
Code Label and measurement unit FQP Std Dev N LCL 95% UCL 95% flag FQP Std Dev N LCL 95% UCL 95% flagkg? 36.4 49.7 3238 34.6 38.1
HQ01181 Sugar kg 14.1 12.4 2122 13.5 14.6 22.2 44.9 1388 19.9 24.6HQ01182 Jams, marmalades kg 6.3 5.7 1977 6.0 6.5 11.0 18.9 1781 10.1 11.9HQ01183 Chocolate kg 6.9 8.3 3857 6.7 7.2 8.1 10.6 2604 7.7 8.6
kg 4.3 5.0 2831 4.1 4.5? 7.4 11.0 2581 7.0 7.8
kg 10.6 14.2 1856 10.0 11.3 9liter 24.7 23.6 2091 23.7 25.7
kg 4.25 3.9 538 3.9 4.6 7.81 7.8 919 7.3 8.3?
kg? 11.4 13.8 2911 10.9 11.9
kg 11.1 9.9 4187 10.8 11.4liter
? 9.5 10.9 2294 9.0 9.9HQ011911 Vinegar literHQ011912 Other sauces and condiments kg
kg 8.4 8.3 407 7.6 9.2 0 0.0 0.0?
kg 11.0 14.3 3195 10.5 11.5 3? 5.0 7.9 2333 4.6 5.3
kg 0 0.0 0.0unit
? 6.6 3.8 2 1.3 11.8kg 9.3 12.4 2503 8.9 9.8
literkg 9.1 12.3 2228 8.6 9.6
litermixed - kg/liter 2.7 3.1 1953 2.6 2.8
kg 4.8 4.5 2399 4.6 5.0 1.4 2.8 619 1.2 1.6liter
kg 3.9 4.3 639 3.6 4.2 5.6 4.8 408 5.2 6.1liter
HQ0122 Mineral waters, soft drinks, fruit and vegetable juices (ND) liter 147.8 178.8 3171 141.6 154.0
HQ01221 Mineral or spring waters liter 50.3 73.7 1505 46.6 54.0 37.3 62.7 1052 33.5 41.1HQ01222 Soft drinks liter 69.2 76.3 4528 67.0 71.4 111.2 152.7 2808 105.5 116.8HQ01223 Fruit juices liter 83.9 88.2 4033 81.2 86.6 48.3 56.0 2429 46.1 50.6HQ01224 Vegetable juices liter 17.8 23.0 100 13.3 22.4 26.5 33.2 15 9.7 43.3HQ021 Alcoholic beverages liter 62.1 98.2 2266 58.0 66.1HQ0211 Spirits and liqueurs liter 15.6 15.8 1038 14.7 16.6 13.7 15.8 462 12.2 15.1HQ0212 Wine (ND) liter 39.0 50.2 947 35.8 42.2HQ02121 Wine from grapes or other fruit liter 39.6 54.5 2548 37.4 41.7 39.1 49.4 914 35.9 42.3HQ02122 Other liter 13.8 14.2 223 12.0 15.7 17.2 24.6 65 11.2 23.2HQ0213 Beer liter 70.6 82.8 1618 66.6 74.6 50.0 83.1 1956 46.3 53.7
Vegetables kgFruit kg 123.0 115.5 2353 118.3 127.7 3Sugar (version "large") literSugar (version "short") liter 150.8 117.1 3016 146.6 155.0 168.1 184.2 2109 160.3 176.0
HQ0118 Sugar, jam, honey, chocolate and confectionery (ND)
HQ01184 Confectionery products
HQ01185 Edible ices and ice cream
HQ01186 Other sugar products
HQ0119 Food products nec (ND)
HQ01191 Sauces, condiments
HQ01192 Salt, spices and culinary herbs
HQ01193 Baby food, dietary preparations, baker's yeast and other food preparations
HQ01194 Other food products nec
HQ0121 Coffee, tea and cocoa (ND)
HQ01211 Coffee
HQ01212 Tea
HQ01213 Cocoa and powdered chocolate
UK NO2005 2003-20056747 3376
Std Dev: Standard Deviation; N: number of observed households; LCL 95%: 95% Lower Confidence Limit; UCL 95%: 95% Upper Confidence Limit; Flags: 1: Not surveyed quantities; 2: Not available; 3: see list of products in Annex V; 4: No summary quantity because different measurement units for the different sub-headings; 9: estimated (see Annex V); 10: estimated by Eurostat (see Annex V)

Eurostat/Unit F5 Food consumption statistics - Results using data collected from HBS Food Safety Statistics ESTAT/F5/ES/204 Rev.1
38/57
ANNEX III: DAILY MEAN FOOD AVAILABILITY PER PERSON Daily mean food availability per person (quantities purchased per person) (DFQP)
YearSurveyed households, number
Code Label and measurement unit DFQP Std Dev N LCL 95% UCL 95% flag DFQP Std Dev N LCL 95% UCL 95% flag DFQP Std Dev N LCL 95% UCL 95% flag DFQP Std Dev N LCL 95% UCL 95% flagg/day 241,0 93,2 13 190,4 291,7 10 390,4 196,4 2870 383,2 397,6 10 220,0 151,4 3432 214,9 225,1 238,1 123,4 6502 235,1 241,1?/day
HQ01111 Rice g/day 11,5 12,0 927 10,7 12,3 17,3 11,4 2870 16,8 17,7 8,2 16,1 3432 7,7 8,8 27,5 23,8 3451 26,7 28,3 3HQ01112 Bread g/day 108,5 66,0 2068 105,6 111,3 10 316,8 175,1 2870 310,4 323,2 139,2 89,6 3432 136,2 142,2 165,4 87,2 6457 163,3 167,6 3HQ011121 Bread: wholemeal g/day 51,1 51,8 2416 49,1 53,2 1 62,5 63,5 1113 58,7 66,2 3HQ011122 Bread: low fibre g/day 63,7 53,6 3051 61,8 65,6 1 132,4 85,5 5968 130,2 134,6 3HQ01113 Pasta products g/day 28,2 29,5 2463 27,0 29,4 9,5 9,2 2870 9,2 9,8 14,6 20,2 3432 14,0 15,3 35,7 28,1 4546 34,9 36,5 3HQ01114 Pastry-cook products g/day 53,6 40,2 3377 52,2 55,0 15,9 12,7 2870 15,4 16,3 12,6 22,3 3432 11,8 13,3 31,0 29,8 1497 29,4 32,5
g/day 20,3 20,8 2646 19,6 21,1 4,6 10,9 2870 4,2 5,0?/day 0,1 1,1 3432 0,1 0,1g/day 33,5 31,6 37 23,3 43,7 10 26,4 43,4 2870 24,8 28,0 45,3 90,8 3432 42,3 48,3 42,2 56,7 3252 40,2 44,1 3?/day
HQ011161 Other products: wholemeal g/day 27,5 33,7 2233 26,1 28,9 1 48,8 61,9 2503 46,4 51,2 3HQ011162 Other products: low fibre g/day 6,1 9,6 45 3,3 8,9 1 5,9 6,4 610 5,4 6,4 3HQ0112 Meat (ND) g/day 181,6 84,2 38 154,8 208,4 10 82,0 47,3 2870 80,2 83,7 10 165,9 139,7 3432 161,2 170,5 143,3 110,3 6088 140,6 146,1
HQ01121 Fresh, chilled or frozen meat of bovine animals g/day 22,0 122,4 1860 16,5 27,6 2,3 8,5 2870 2,0 2,6 2,6 11,2 3432 2,2 3,0 61,4 46,5 4706 60,1 62,7
HQ01122 Fresh, chilled or frozen meat of swine g/day 18,1 21,9 1388 16,9 19,2 5,6 9,1 2870 5,3 6,0 34,8 92,2 3432 31,7 37,8 54,9 58,2 2760 52,7 57,0 3
HQ01123 Fresh, chilled or frozen meat of sheep and goat g/day 10,5 15,5 559 9,2 11,8 2,0 5,2 2870 1,8 2,2 0,5 7,3 3432 0,3 0,7 92,1 96,6 986 86,1 98,2 3
HQ01124 Fresh, chilled or frozen meat of poultry g/day 30,8 38,0 2194 29,2 32,4 16,0 15,4 2870 15,5 16,6 15,9 31,7 3432 14,9 17,0 56,2 40,6 3793 55,0 57,5
HQ01125 Dried, salted or smoked meat and edible meat offal g/day 43,5 122,5 3377 39,3 47,6 36,3 22,1 2870 35,5 37,1 83,9 69,3 3432 81,6 86,2 21,8 22,3 3416 21,0 22,5
HQ01126 Other preserved or processed meat and meat preparations g/day 48,1 53,4 3108 46,2 50,0 19,7 13,7 2870 19,2 20,2 27,6 33,7 3432 26,5 28,7 21,5 20,9 388 19,4 23,6
HQ01127 Other fresh, chilled or frozen edible meat g/day 14,0 14,1 378 12,6 15,4 0,0 0,5 2870 0,0 0,1 0,6 8,1 3432 0,3 0,8 38,9 23,6 103 34,4 43,5
HQ0113 Fish (ND) g/day 62,7 41,0 5 26,7 98,6 10 11,2 11,2 2870 10,8 11,6 10 35,8 48,9 3432 34,2 37,4 56,3 46,8 4907 55,0 57,6HQ01131 Fresh, chilled or frozen fish g/day 23,0 101,6 403 13,1 32,9 10 10,6 10,8 2870 10,2 11,0 18,8 43,7 3432 17,3 20,2 50,0 37,7 4303 48,8 51,1 3HQ011311 Fresh, chilled or frozen fish: fatty fish g/day 11,2 99,7 625 3,4 19,0 1 35,5 25,6 584 33,4 37,6 3HQ011312 Fresh, chilled or frozen fish: other fish g/day 14,7 124,2 1634 8,7 20,7 1 40,5 29,3 1783 39,2 41,9 3HQ01132 Fresh, chilled or frozen seafood g/day 18,5 64,2 1393 15,2 21,9 0,0 0,4 2870 0,0 0,0 0,2 2,4 3432 0,1 0,3 36,4 34,1 840 34,1 38,7
HQ01133 Dried, smoked or salted fish and seafood g/day 8,9 111,0 131 28,0 10 0,1 0,5 2870 0,1 0,1 5,6 11,4 3432 5,2 6,0 21,3 18,6 571 19,7 22,8
HQ011331 Dried, smoked or salted fatty fish g/day 8,2 107,6 625 16,6 3 1 9,7 11,1 286 8,4 11,0
HQ011332 Dried, smoked or salted not fatty fish and seafood g/day 3,2 4,0 431 2,8 3,6 1 31,9 16,4 311 30,0 33,7
HQ01134 Other preserved or processed fish and seafood and fish and seafood preparations g/day 10,4 10,6 473 9,4 11,4 3 0,5 1,3 2870 0,5 0,6 11,2 15,3 3432 10,7 11,7 12,3 13,2 1148 11,5 13,1
HQ011341 Other preserved or processed fish and fish preparations: fatty fish g/day 6,3 7,7 897 5,8 6,8 3 1 11,6 12,8 892 10,8 12,5 3
HQ011342 Other preserved or processed fish and seafood and fish and seafood preparations g/day 6,5 7,3 1648 6,2 6,9 3 1 12,7 11,7 131 10,7 14,7 3
BE BG EE EL2005 2005 2005 2004/20053550 2870 3432 6555
HQ0111 Bread and cereals (ND)
HQ01115 Sandwiches
HQ01116 Other products
Std Dev: Standard Deviation; N: number of observed households; LCL 95%: 95% Lower Confidence Limit; UCL 95%: 95% Upper Confidence Limit; Flags: 1: Not surveyed quantities; 2: Not available; 3: see list of products in Annex V; 4: No summary quantity because different measurement units for the different sub-headings; 9: estimated (see Annex V); 10: estimated by Eurostat (see Annex V)

Eurostat/Unit F5 Food consumption statistics - Results using data collected from HBS Food Safety Statistics ESTAT/F5/ES/204 Rev.1
39/57
Daily mean food availability per person (quantities purchased per person) (DFQP)
YearSurveyed households, number
Code Label and measurement unit DFQP Std Dev N LCL 95% UCL 95% flag DFQP Std Dev N LCL 95% UCL 95% flag DFQP Std Dev N LCL 95% UCL 95% flag DFQP Std Dev N LCL 95% UCL 95% flagHQ01141 Whole milk ml/day 81,3 73,7 1063 76,9 85,7 9 59,9 161,0 3432 54,5 65,3 165,5 120,2 4027 161,8 169,3HQ01142 Low fat milk ml/day 106,9 90,4 1912 102,9 111,0 115,5 124,3 3432 111,3 119,6 115,3 106,5 1708 110,2 120,3 3
HQ01141&2 Whole and low fat milk ml/day 46,0 63,8 2870 43,7 48,4 3
g/day 10,1 12,7 499 9,0 11,3 0,1 1,2 2870 0,0 0,1 1,3 8,6 3432 1,0 1,6 58,2 62,3 2495 55,8 60,7ml/dayg/day 31,9 32,6 2477 30,6 33,2 50,4 52,1 2870 48,5 52,3 24,1 41,0 3432 22,8 25,5 33,8 31,9 4295 32,8 34,7
ml/dayHQ01145 Cheese and curd g/day 11,6 87,3 1127 6,5 16,7 33,6 20,2 2870 32,9 34,3 30,9 28,0 3432 30,0 31,8 48,2 36,5 5604 47,2 49,1HQ011451 Cheese and curd: high fat g/day 16,4 14,9 2289 15,8 17,0 1 34,9 29,1 4812 34,1 35,7 3HQ011452 Cheese and curd: low fat g/day 18,5 18,9 2899 17,8 19,2 1 22,7 19,7 4032 22,1 23,3 3
g/day 32,1 39,8 2774 30,6 33,6 9 0,4 1,3 2870 0,3 0,4 54,7 56,0 3432 52,8 56,6 23,4 36,7 1630 21,6 25,1mixed - g/day /
ml/dayunit/day 0,2 0,2 2362 0,2 0,2 9 0,2 0,2 2870 0,2 0,2 0,4 0,4 3432 0,4 0,5 0,0 0,0 2649 0,0 0,0 3
g/dayg/day 1 75,1 66,3 5048 73,3 76,9
mixed - g/day / ml/day?/day 35,1 35,0 3432 34,0 36,3
HQ01151 Butter g/day 10,5 9,4 1923 10,1 11,0 1,1 2,1 2870 1,0 1,2 6,2 9,9 3432 5,9 6,6 9,8 9,7 496 9,0 10,7 3HQ01152 Margarine and other vegetable fats g/day 15,1 13,1 2065 14,5 15,7 5,4 4,5 2870 5,2 5,5 10,4 15,0 3432 9,9 10,9 13,5 12,8 2642 13,0 13,9HQ01153 Olive oil ml/day 11,3 8,2 601 10,6 12,0 0,2 1,0 2870 0,1 0,2 0,4 3,2 3432 0,3 0,5 69,7 55,1 3716 67,9 71,5HQ01154 Edible oils ml/day 18,4 16,5 851 17,3 19,5 35,3 18,2 2870 34,7 36,0 17,7 25,9 3432 16,8 18,6 49,5 41,9 1445 47,3 51,6HQ01155 Other edible animal fats g/day 18,6 15,5 107 15,7 21,5 0,1 1,2 2870 0,1 0,2 0,4 4,9 3432 0,3 0,6HQ0116 Fruit (ND) g/day 1 132,4 154,4 3432 127,2 137,5 268,2 229,2 5972 262,4 274,1HQ01161 Citrus fruits (fresh, chilled or frozen) g/day 36,6 40,8 2226 34,9 38,3 10,1 12,6 2870 9,6 10,5 19,5 40,5 3432 18,1 20,8 119,9 111,6 4018 116,4 123,3HQ01162 Bananas (fresh, chilled or frozen) g/day 20,4 17,4 1755 19,5 21,2 9,5 13,3 2870 9,1 10,0 12,1 25,8 3432 11,2 12,9 48,4 34,4 2964 47,2 49,7HQ01163 Apples (fresh, chilled or frozen) g/day 33,8 30,0 2161 32,6 35,1 16,8 23,0 2870 16,0 17,6 57,5 93,6 3432 54,4 60,6 80,8 60,6 3423 78,7 82,8HQ01164 Pears (fresh, chilled or frozen) g/day 19,0 18,8 1038 17,9 20,2 0,4 3,0 2870 0,3 0,5 6,9 22,7 3432 6,1 7,6 52,3 42,4 1493 50,1 54,4HQ01165 Stone fruits (fresh, chilled or frozen) g/day 23,1 26,0 925 21,5 24,8 8,9 18,6 2870 8,2 9,5 6,6 24,3 3432 5,7 7,4 84,7 81,6 1523 80,6 88,8HQ01166 Berries (fresh, chilled or frozen) g/day 17,9 18,0 1452 17,0 18,9 6,2 24,4 2870 5,3 7,1 13,8 39,0 3432 12,5 15,1 53,8 50,7 1159 50,9 56,8HQ01167 Other fresh, chilled or frozen fruits g/day 29,1 35,2 1904 27,5 30,7 22,7 32,0 2870 21,6 23,9 12,8 45,4 3432 11,3 14,3 214,8 234,1 1686 203,7 226,0HQ01168 Dried fruit g/day 8,2 11,5 1214 7,6 8,9 2,6 4,2 2870 2,4 2,7 2,9 8,3 3432 2,7 3,2 19,6 22,4 1192 18,3 20,8HQ01169 Preserved fruit and fruit based products g/day 12,3 12,5 870 11,5 13,2 0,0 0,0 2870 0,0 0,0 0,3 2,2 3432 0,2 0,4 20,2 19,9 27 12,7 27,7 3HQ0117 Vegetables (ND) g/day 1 397,0 504,3 3432 380,1 413,8 372,8 247,8 6394 366,7 378,9
HQ01171 Leaf and stem vegetables (fresh, chilled or frozen) g/day 26,8 25,1 2915 25,9 27,7 2,9 4,8 2870 2,7 3,1 2,3 6,8 3432 2,1 2,6 50,2 48,3 4400 48,8 51,6
HQ01172 Cabbages (fresh, chilled or frozen) g/day 16,7 16,3 1845 15,9 17,4 28,2 32,3 2870 27,1 29,4 27,8 54,0 3432 26,0 29,6 60,1 49,5 2032 58,0 62,3
HQ01173 Vegetables cultivated for their fruit (fresh, chilled or frozen) g/day 50,2 62,4 3106 48,0 52,4 79,2 67,0 2870 76,7 81,7 48,5 92,3 3432 45,4 51,6 142,8 129,1 5399 139,4 146,3
HQ01174 Root crops, non-starchy bulbs and mushrooms (fresh, chilled or frozen) g/day 46,4 39,7 2950 45,0 47,9 22,1 22,6 2870 21,3 22,9 54,1 116,4 3432 50,2 58,0 37,5 35,3 3082 36,2 38,7
HQ01175 Dried vegetables g/day 6,5 5,2 188 5,7 7,2 13,4 12,5 2870 13,0 13,9 1,1 6,1 3432 0,8 1,3 54,4 47,6 4365 53,0 55,8
HQ01176 Other preserved or processed vegetables g/day 16,9 19,1 2280 16,1 17,7 7,9 10,5 2870 7,5 8,2 38,1 61,6 3432 36,0 40,1 28,9 26,6 3461 28,0 29,7
HQ01177 Potatoes g/day 107,5 94,5 2252 103,6 111,4 51,5 45,9 2870 49,8 53,2 221,2 411,1 3432 207,5 235,0 137,0 102,9 5291 134,2 139,8
HQ01178 Other tubers and products of tuber vegetables g/day 24,5 23,6 2450 23,6 25,5 0,3 1,3 2870 0,2 0,3 3,9 12,2 3432 3,5 4,3 8,3 13,2 963 7,5 9,2
3550 2870 3432 65552005 2005 2005 2004/2005BE BG EE EL
HQ01143 Preserved milk
HQ01144 Yoghurt
HQ01146 Other milk products
HQ01147 Eggs
HQ0115 Oils and fats (ND)
Std Dev: Standard Deviation; N: number of observed households; LCL 95%: 95% Lower Confidence Limit; UCL 95%: 95% Upper Confidence Limit; Flags: 1: Not surveyed quantities; 2: Not available; 3: see list of products in Annex V; 4: No summary quantity because different measurement units for the different sub-headings; 9: estimated (see Annex V); 10: estimated by Eurostat (see Annex V)
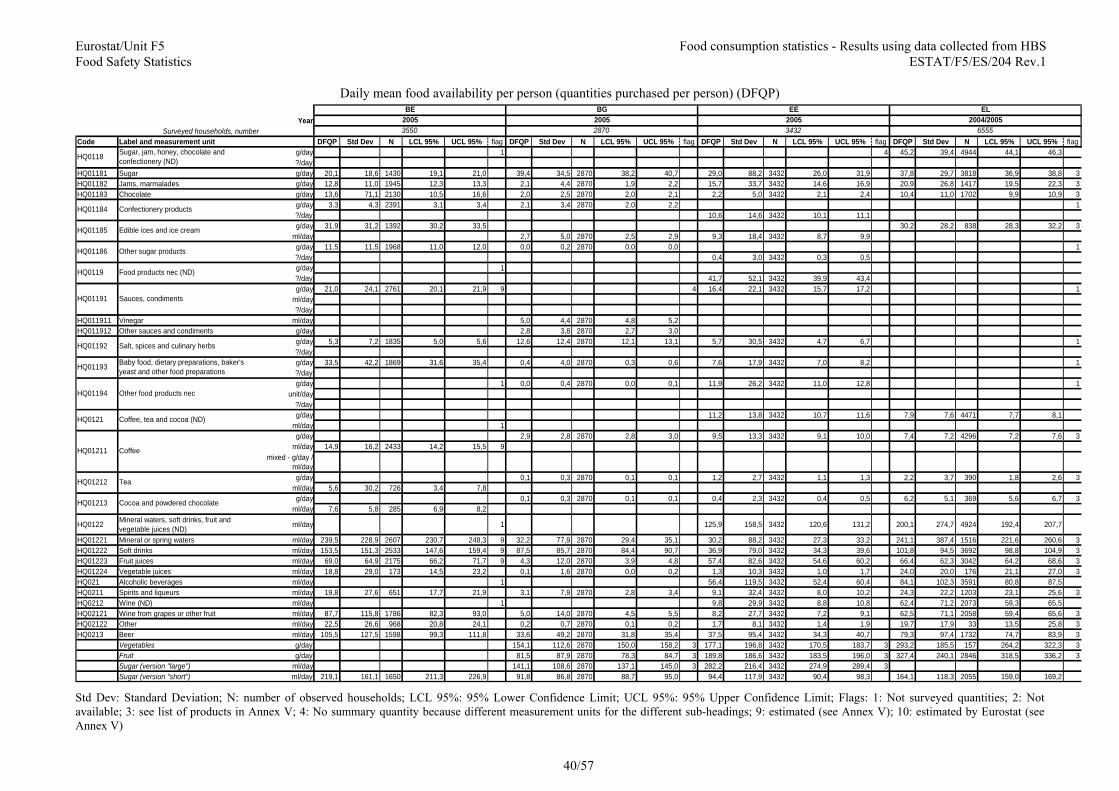
Eurostat/Unit F5 Food consumption statistics - Results using data collected from HBS Food Safety Statistics ESTAT/F5/ES/204 Rev.1
40/57
Daily mean food availability per person (quantities purchased per person) (DFQP) Year
Surveyed households, numberCode Label and measurement unit DFQP Std Dev N LCL 95% UCL 95% flag DFQP Std Dev N LCL 95% UCL 95% flag DFQP Std Dev N LCL 95% UCL 95% flag DFQP Std Dev N LCL 95% UCL 95% flag
g/day 1 4 45,2 39,4 4944 44,1 46,3?/day
HQ01181 Sugar g/day 20,1 18,6 1430 19,1 21,0 39,4 34,5 2870 38,2 40,7 29,0 88,2 3432 26,0 31,9 37,8 29,7 3818 36,9 38,8 3HQ01182 Jams, marmalades g/day 12,8 11,0 1945 12,3 13,3 2,1 4,4 2870 1,9 2,2 15,7 33,7 3432 14,6 16,9 20,9 26,8 1417 19,5 22,3 3HQ01183 Chocolate g/day 13,6 71,1 2130 10,5 16,6 2,0 2,5 2870 2,0 2,1 2,2 5,0 3432 2,1 2,4 10,4 11,0 1702 9,9 10,9 3
g/day 3,3 4,3 2391 3,1 3,4 2,1 3,4 2870 2,0 2,2 1?/day 10,6 14,6 3432 10,1 11,1g/day 31,9 31,2 1392 30,2 33,5 30,2 28,2 838 28,3 32,2 3
ml/day 2,7 5,0 2870 2,5 2,9 9,3 18,4 3432 8,7 9,9g/day 11,5 11,5 1968 11,0 12,0 0,0 0,2 2870 0,0 0,0 1?/day 0,4 3,0 3432 0,3 0,5g/day 1?/day 41,7 52,1 3432 39,9 43,4g/day 21,0 24,1 2761 20,1 21,9 9 4 16,4 22,1 3432 15,7 17,2 1
ml/day?/day
HQ011911 Vinegar ml/day 5,0 4,4 2870 4,8 5,2HQ011912 Other sauces and condiments g/day 2,8 3,8 2870 2,7 3,0
g/day 5,3 7,2 1835 5,0 5,6 12,6 12,4 2870 12,1 13,1 5,7 30,5 3432 4,7 6,7 1?/dayg/day 33,5 42,2 1869 31,6 35,4 0,4 4,0 2870 0,3 0,6 7,6 17,9 3432 7,0 8,2 1?/dayg/day 1 0,0 0,4 2870 0,0 0,1 11,9 26,2 3432 11,0 12,8 1
unit/day?/dayg/day 11,2 13,8 3432 10,7 11,6 7,9 7,6 4471 7,7 8,1
ml/day 1g/day 2,9 2,8 2870 2,8 3,0 9,5 13,3 3432 9,1 10,0 7,4 7,2 4296 7,2 7,6 3
ml/day 14,9 16,2 2433 14,2 15,5 9mixed - g/day /
ml/dayg/day 0,1 0,3 2870 0,1 0,1 1,2 2,7 3432 1,1 1,3 2,2 3,7 390 1,8 2,6 3
ml/day 5,6 30,2 726 3,4 7,8g/day 0,1 0,3 2870 0,1 0,1 0,4 2,3 3432 0,4 0,5 6,2 5,1 369 5,6 6,7 3
ml/day 7,6 5,8 285 6,9 8,2
HQ0122 Mineral waters, soft drinks, fruit and vegetable juices (ND) ml/day 1 125,9 158,5 3432 120,6 131,2 200,1 274,7 4924 192,4 207,7
HQ01221 Mineral or spring waters ml/day 239,5 228,9 2607 230,7 248,3 9 32,2 77,9 2870 29,4 35,1 30,2 88,2 3432 27,3 33,2 241,1 387,4 1516 221,6 260,6 3HQ01222 Soft drinks ml/day 153,5 151,3 2533 147,6 159,4 9 87,5 85,7 2870 84,4 90,7 36,9 79,0 3432 34,3 39,6 101,8 94,5 3692 98,8 104,9 3HQ01223 Fruit juices ml/day 69,0 64,9 2175 66,2 71,7 9 4,3 12,0 2870 3,9 4,8 57,4 82,6 3432 54,6 60,2 66,4 62,3 3042 64,2 68,6 3HQ01224 Vegetable juices ml/day 18,8 29,0 173 14,5 23,2 0,1 1,6 2870 0,0 0,2 1,3 10,3 3432 1,0 1,7 24,0 20,0 176 21,1 27,0 3HQ021 Alcoholic beverages ml/day 1 56,4 119,5 3432 52,4 60,4 84,1 102,3 3591 80,8 87,5HQ0211 Spirits and liqueurs ml/day 19,8 27,6 651 17,7 21,9 3,1 7,9 2870 2,8 3,4 9,1 32,4 3432 8,0 10,2 24,3 22,2 1203 23,1 25,6 3HQ0212 Wine (ND) ml/day 1 9,8 29,9 3432 8,8 10,8 62,4 71,2 2073 59,3 65,5HQ02121 Wine from grapes or other fruit ml/day 87,7 115,8 1786 82,3 93,0 5,0 14,0 2870 4,5 5,5 8,2 27,7 3432 7,2 9,1 62,5 71,1 2058 59,4 65,6 3HQ02122 Other ml/day 22,5 26,6 968 20,8 24,1 0,2 0,7 2870 0,1 0,2 1,7 8,1 3432 1,4 1,9 19,7 17,9 33 13,5 25,8 3HQ0213 Beer ml/day 105,5 127,5 1598 99,3 111,8 33,6 49,2 2870 31,8 35,4 37,5 95,4 3432 34,3 40,7 79,3 97,4 1732 74,7 83,9 3
Vegetables g/day 154,1 112,6 2870 150,0 158,2 3 177,1 196,8 3432 170,5 183,7 3 293,2 185,5 157 264,2 322,3 3Fruit g/day 81,5 87,9 2870 78,3 84,7 3 189,8 186,6 3432 183,5 196,0 3 327,4 240,1 2846 318,5 336,2 3Sugar (version "large") ml/day 141,1 108,6 2870 137,1 145,0 3 282,2 216,4 3432 274,9 289,4 3Sugar (version "short") ml/day 219,1 161,1 1650 211,3 226,9 91,8 86,8 2870 88,7 95,0 94,4 117,9 3432 90,4 98,3 164,1 118,3 2055 159,0 169,2
3550 2870 3432 65552005 2005 2005 2004/2005BE BG EE EL
HQ0118 Sugar, jam, honey, chocolate and confectionery (ND)
HQ01184 Confectionery products
HQ01185 Edible ices and ice cream
HQ01186 Other sugar products
HQ0119 Food products nec (ND)
HQ01191 Sauces, condiments
HQ01192 Salt, spices and culinary herbs
HQ01193 Baby food, dietary preparations, baker's yeast and other food preparations
HQ01194 Other food products nec
HQ0121 Coffee, tea and cocoa (ND)
HQ01213 Cocoa and powdered chocolate
HQ01211 Coffee
HQ01212 Tea
Std Dev: Standard Deviation; N: number of observed households; LCL 95%: 95% Lower Confidence Limit; UCL 95%: 95% Upper Confidence Limit; Flags: 1: Not surveyed quantities; 2: Not available; 3: see list of products in Annex V; 4: No summary quantity because different measurement units for the different sub-headings; 9: estimated (see Annex V); 10: estimated by Eurostat (see Annex V)

Eurostat/Unit F5 Food consumption statistics - Results using data collected from HBS Food Safety Statistics ESTAT/F5/ES/204 Rev.1
41/57
Daily mean food availability per person (quantities purchased per person) (DFQP)
YearSurveyed households, number
Code Label and measurement unit DFQP Std Dev N LCL 95% UCL 95% flag DFQP Std Dev N LCL 95% UCL 95% flag DFQP Std Dev N LCL 95% UCL 95% flag DFQP Std Dev N LCL 95% UCL 95% flagg/day 184,2 121,2 8844 181,7 186,7 3 227,4 133,0 10169 224,8 230,0 260,5 163,7 3774 255,3 265,8 10 278,7 179,4 7586 274,6 282,7 10?/day
HQ01111 Rice g/day 16,6 34,3 8595 15,9 17,3 10,8 22,5 10118 10,4 11,3 9,6 16,9 3774 9,0 10,1 10,8 18,2 7586 10,4 11,2HQ01112 Bread g/day 153,5 109,0 8880 151,2 155,8 142,9 94,6 10160 141,1 144,7 167,5 105,5 3774 164,1 170,9 164,4 102,4 7586 162,1 166,7HQ011121 Bread: wholemeal g/day 1HQ011122 Bread: low fibre g/day 1HQ01113 Pasta products g/day 14,9 24,6 8577 14,4 15,4 24,4 34,2 10137 23,7 25,0 15,3 24,0 3774 14,6 16,1 13,8 20,5 7586 13,3 14,3HQ01114 Pastry-cook products g/day 1 29,1 37,7 10135 28,4 29,9 15,8 24,3 3774 15,0 16,5 31,3 34,3 7586 30,6 32,1
g/day 1 2?/day 0,1 1,0 3774 0,1 0,1 0,1 1,3 7586 0,0 0,1g/day 1 20,7 36,7 10124 20,0 21,4 3 52,3 69,3 3774 50,1 54,6 58,4 91,1 7586 56,3 60,4?/day
HQ011161 Other products: wholemeal g/day 1HQ011162 Other products: low fibre g/day 1HQ0112 Meat (ND) g/day 151,4 139,9 8854 148,5 154,4 126,7 106,6 10166 124,6 128,7 194,1 139,6 3774 189,6 198,5 10 236,0 167,3 7586 232,3 239,8 10
HQ01121 Fresh, chilled or frozen meat of bovine animals g/day 24,1 40,2 8296 23,2 24,9 27,0 37,5 10116 26,2 27,7 9,7 23,9 3774 9,0 10,5 6,5 25,1 7586 5,9 7,0
HQ01122 Fresh, chilled or frozen meat of swine g/day 24,1 43,4 8463 23,1 25,0 11,8 24,2 10145 11,3 12,3 58,7 98,2 3774 55,6 61,9 79,8 112,6 7586 77,2 82,3
HQ01123 Fresh, chilled or frozen meat of sheep and goat g/day 6,9 25,3 7761 6,3 7,5 4,2 15,9 10161 3,9 4,5 0,5 10,1 3774 0,1 0,8 0,1 3,9 7586 0,0 0,2
HQ01124 Fresh, chilled or frozen meat of poultry g/day 40,0 52,0 8687 38,9 41,1 22,1 35,9 10123 21,4 22,8 26,0 38,6 3774 24,8 27,2 37,5 54,3 7586 36,3 38,8
HQ01125 Dried, salted or smoked meat and edible meat offal g/day 46,4 62,1 8745 45,1 47,7 42,9 43,1 10158 42,1 43,8 69,3 54,3 3774 67,6 71,1 46,8 52,9 7586 45,6 48,0
HQ01126 Other preserved or processed meat and meat preparations g/day 12,9 22,2 8198 12,5 13,4 16,3 28,5 10115 15,8 16,9 18,6 30,1 3774 17,6 19,5 63,9 57,2 7586 62,6 65,2
HQ01127 Other fresh, chilled or frozen edible meat g/day 4,1 15,4 7851 3,8 4,5 4,3 14,4 6448 4,0 4,7 11,3 30,2 3774 10,3 12,2 1,5 16,9 7586 1,2 1,9
HQ0113 Fish (ND) g/day 73,0 85,9 8753 71,2 74,8 19,1 41,9 4239 17,8 20,4 10 36,9 52,5 3774 35,2 38,5 10 45,7 52,9 7586 44,6 46,9 10HQ01131 Fresh, chilled or frozen fish g/day 41,5 60,8 8600 40,3 42,8 12,8 24,9 9351 12,3 13,3 19,1 44,7 3774 17,6 20,5 22,6 39,6 7586 21,7 23,5HQ011311 Fresh, chilled or frozen fish: fatty fish g/day 4,2 12,0 10190 4,0 4,4HQ011312 Fresh, chilled or frozen fish: other fish g/day 7,6 19,1 10190 7,2 7,9HQ01132 Fresh, chilled or frozen seafood g/day 16,4 35,6 8195 15,6 17,1 7,9 25,9 9390 7,4 8,4 9 0,3 3,1 3774 0,2 0,4 0,2 3,0 7586 0,2 0,3
HQ01133 Dried, smoked or salted fish and seafood g/day 2,3 10,0 7667 2,0 2,5 2,1 5,8 5802 1,9 2,2 8,0 15,9 3774 7,5 8,5 15,8 23,1 7586 15,3 16,3
HQ011331 Dried, smoked or salted fatty fish g/day 1
HQ011332 Dried, smoked or salted not fatty fish and seafood g/day 1
HQ01134 Other preserved or processed fish and seafood and fish and seafood preparations g/day 16,0 29,9 8399 15,3 16,6 11,5 18,8 9782 11,2 11,9 9,4 14,8 3774 9,0 9,9 7,1 13,1 7586 6,8 7,4
HQ011341 Other preserved or processed fish and fish preparations: fatty fish g/day 1
HQ011342 Other preserved or processed fish and seafood and fish and seafood preparations g/day 1
HQ01116 Other products
HQ0111 Bread and cereals (ND)
HQ01115 Sandwiches
ES FR LV LT2004 2005 2005 20058881 10240 3774 7586
Std Dev: Standard Deviation; N: number of observed households; LCL 95%: 95% Lower Confidence Limit; UCL 95%: 95% Upper Confidence Limit; Flags: 1: Not surveyed quantities; 2: Not available; 3: see list of products in Annex V; 4: No summary quantity because different measurement units for the different sub-headings; 9: estimated (see Annex V); 10: estimated by Eurostat (see Annex V)

Eurostat/Unit F5 Food consumption statistics - Results using data collected from HBS Food Safety Statistics ESTAT/F5/ES/204 Rev.1
42/57
Daily mean food availability per person (quantities purchased per person) (DFQP)
YearSurveyed households, number
Code Label and measurement unit DFQP Std Dev N LCL 95% UCL 95% flag DFQP Std Dev N LCL 95% UCL 95% flag DFQP Std Dev N LCL 95% UCL 95% flag DFQP Std Dev N LCL 95% UCL 95% flagHQ01141 Whole milk ml/day 159,1 218,2 8809 154,5 163,6 16,3 58,4 10151 15,2 17,5 130,4 177,6 3774 124,7 136,0 239,6 259,4 7586 233,8 245,5HQ01142 Low fat milk ml/day 99,4 188,6 8757 95,4 103,3 110,8 142,4 9981 108,0 113,6 30,1 66,2 3774 27,9 32,2 1,9 13,6 7586 1,5 2,2
HQ01141&2 Whole and low fat milk ml/day
g/day 1,2 8,4 8607 1,0 1,4 0,9 6,0 10178 0,8 1,0 1,4 6,6 3774 1,2 1,7 0,7 3,7 7586 0,6 0,7ml/dayg/day 48,1 57,9 8766 46,9 49,4 67,6 72,0 10140 66,2 69,0 15,5 30,2 3774 14,5 16,5 13,8 27,8 7586 13,2 14,5
ml/dayHQ01145 Cheese and curd g/day 19,0 23,9 8594 18,5 19,5 34,7 32,0 10145 34,0 35,3 34,5 34,0 3774 33,4 35,6 41,1 46,9 7586 40,1 42,2HQ011451 Cheese and curd: high fat g/day 1HQ011452 Cheese and curd: low fat g/day 1
g/day 16,5 51,1 7355 15,3 17,7 29,8 37,7 10133 29,1 30,6 69,4 69,7 3774 67,2 71,6 28,4 28,0 7586 27,8 29,0mixed - g/day /
ml/dayunit/day 0,3 0,4 8874 0,3 0,3 0,2 0,3 10125 0,2 0,2 0,6 0,5 3774 0,5 0,6 0,6 0,5 7586 0,6 0,6
g/dayg/day
mixed - g/day / ml/day 54,1 102,9 8680 51,9 56,2
?/dayHQ01151 Butter g/day 0,8 3,3 8611 0,7 0,8 8,8 12,5 10011 8,5 9,0 6,7 10,8 3774 6,4 7,1 8,9 12,7 7586 8,6 9,2HQ01152 Margarine and other vegetable fats g/day 2,0 5,9 8515 1,8 2,1 4,9 11,5 10158 4,6 5,1 9,4 14,9 3774 8,9 9,9 6,9 11,3 7586 6,7 7,2HQ01153 Olive oil ml/day 39,2 89,9 8604 37,3 41,1 3,2 11,0 10171 3,0 3,4 0,8 5,2 3774 0,7 1,0 0,4 3,0 7586 0,3 0,4HQ01154 Edible oils ml/day 12,7 41,5 8585 11,8 13,6 11,9 26,1 10125 11,4 12,4 24,1 29,6 3774 23,2 25,1 29,3 32,6 7586 28,5 30,0HQ01155 Other edible animal fats g/day 0,1 1,6 8857 0,1 0,1 10118 1,7 9,8 3774 1,4 2,0 5,6 19,1 7586 5,2 6,1HQ0116 Fruit (ND) g/day 221,3 216,5 8846 216,8 225,8 133,4 148,2 10186 130,6 136,3HQ01161 Citrus fruits (fresh, chilled or frozen) g/day 65,4 97,4 8717 63,4 67,5 52,2 69,0 5758 50,4 54,0 22,4 46,8 3774 20,9 23,9 19,1 38,6 7586 18,2 20,0HQ01162 Bananas (fresh, chilled or frozen) g/day 24,7 33,7 8616 24,0 25,4 19,2 29,6 7947 18,5 19,8 8,3 20,7 3774 7,7 9,0 6,7 18,6 7586 6,3 7,1HQ01163 Apples (fresh, chilled or frozen) g/day 30,9 45,5 8643 30,0 31,9 35,9 59,0 8449 34,6 37,2 52,0 108,8 3774 48,5 55,4 84,9 111,7 7586 82,4 87,4HQ01164 Pears (fresh, chilled or frozen) g/day 18,1 30,7 8482 17,5 18,8 10,9 26,0 6988 10,2 11,5 4,5 18,4 3774 4,0 5,1 5,3 22,6 7586 4,8 5,8HQ01165 Stone fruits (fresh, chilled or frozen) g/day 27,2 51,2 8316 26,1 28,3 19,2 47,7 9039 18,2 20,1 9,3 36,3 3774 8,1 10,4 9,6 33,8 7586 8,8 10,4HQ01166 Berries (fresh, chilled or frozen) g/day 10,4 45,0 8104 9,4 11,3 13,5 33,0 8235 12,8 14,2 23,4 70,2 3774 21,1 25,6 21,7 67,0 7586 20,2 23,2HQ01167 Other fresh, chilled or frozen fruits g/day 43,4 92,4 8472 41,4 45,3 20,6 44,8 8654 19,7 21,6 18,1 67,8 3774 16,0 20,3 11,6 44,7 7586 10,6 12,6HQ01168 Dried fruit g/day 7,5 26,5 7812 6,9 8,1 5,7 12,2 7900 5,5 6,0 3,6 10,0 3774 3,3 3,9 5,2 12,7 7586 4,9 5,5HQ01169 Preserved fruit and fruit based products g/day 3,3 12,9 7781 3,0 3,6 3,1 11,5 7728 2,8 3,4 0,8 5,7 3774 0,6 1,0 0,8 4,9 7586 0,7 0,9HQ0117 Vegetables (ND) g/day 258,5 295,4 8864 252,4 264,6 199,5 184,7 10160 195,9 203,1
HQ01171 Leaf and stem vegetables (fresh, chilled or frozen) g/day 28,0 43,7 8556 27,1 28,9 17,1 29,7 10123 16,5 17,7 6,8 19,4 3774 6,2 7,4 6,4 18,8 7586 6,0 6,9
HQ01172 Cabbages (fresh, chilled or frozen) g/day 9,2 26,9 8158 8,6 9,8 6,6 20,2 10146 6,2 7,0 30,2 99,7 3774 27,0 33,4 32,0 58,1 7586 30,7 33,3
HQ01173 Vegetables cultivated for their fruit (fresh, chilled or frozen) g/day 62,2 92,2 8716 60,3 64,2 42,2 61,4 10125 41,0 43,4 73,1 121,5 3774 69,2 76,9 74,2 121,0 7586 71,5 77,0
HQ01174 Root crops, non-starchy bulbs and mushrooms (fresh, chilled or frozen) g/day 32,4 47,7 8583 31,4 33,4 37,4 56,7 10121 36,2 38,5 67,7 94,4 3774 64,7 70,7 88,7 94,3 7586 86,6 90,8
HQ01175 Dried vegetables g/day 11,9 30,4 8223 11,3 12,6 1,7 7,6 10178 1,5 1,8 4,3 13,0 3774 3,8 4,7 0,0 0,6 7586 0,0 0,1
HQ01176 Other preserved or processed vegetables g/day 27,8 41,4 8456 27,0 28,7 3 37,0 49,2 10107 36,0 37,9 46,1 64,4 3774 44,1 48,2 58,8 76,5 7586 57,1 60,5
HQ01177 Potatoes g/day 90,6 198,3 8757 86,4 94,7 42,7 85,6 10124 41,1 44,4 281,5 486,1 3774 266,0 297,0 295,2 292,5 7586 288,6 301,8
HQ01178 Other tubers and products of tuber vegetables g/day 4,6 10,9 7872 4,4 4,8 15,9 29,7 10100 15,3 16,5 2,1 8,6 3774 1,9 2,4 3,0 9,0 7586 2,8 3,2
8881 10240 3774 75862004 2005 2005 2005ES FR LV LT
HQ01147 Eggs
HQ0115 Oils and fats (ND)
HQ01144 Yoghurt
HQ01146 Other milk products
HQ01143 Preserved milk
Std Dev: Standard Deviation; N: number of observed households; LCL 95%: 95% Lower Confidence Limit; UCL 95%: 95% Upper Confidence Limit; Flags: 1: Not surveyed quantities; 2: Not available; 3: see list of products in Annex V; 4: No summary quantity because different measurement units for the different sub-headings; 9: estimated (see Annex V); 10: estimated by Eurostat (see Annex V)

Eurostat/Unit F5 Food consumption statistics - Results using data collected from HBS Food Safety Statistics ESTAT/F5/ES/204 Rev.1
43/57
Daily mean food availability per person (quantities purchased per person) (DFQP) Year
Surveyed households, numberCode Label and measurement unit DFQP Std Dev N LCL 95% UCL 95% flag DFQP Std Dev N LCL 95% UCL 95% flag DFQP Std Dev N LCL 95% UCL 95% flag DFQP Std Dev N LCL 95% UCL 95% flag
g/day?/day 36,4 59,9 8672 35,2 37,7
HQ01181 Sugar g/day 16,2 33,9 8591 15,4 16,9 14,1 28,4 10092 13,6 14,7 52,9 93,3 3774 49,9 55,9 50,7 84,0 7586 48,8 52,6HQ01182 Jams, marmalades g/day 3,4 11,0 8397 3,2 3,7 12,4 24,1 10141 11,9 12,8 14,8 38,1 3774 13,5 16,0 32,2 58,2 7586 30,9 33,5HQ01183 Chocolate g/day 4,5 11,8 8164 4,3 4,8 10,2 16,6 10128 9,9 10,5 6,0 11,4 3774 5,6 6,3 1,2 3,1 7586 1,2 1,3
g/day 6,8 36,9 8276 6,0 7,6 6,6 12,6 10137 6,3 6,8?/day 4,6 9,8 3774 4,3 4,9 11,0 16,0 7586 10,6 11,3g/day 6,0 20,1 8395 5,6 6,5
ml/day 11,3 30,3 10159 10,7 11,8 10,0 21,2 3774 9,3 10,6 6,5 14,2 7586 6,2 6,8g/day 0,8 3,8 8631 0,7 0,9 2,8 7,6 10154 2,7 3,0 2?/day 0,2 1,5 7586 0,2 0,2g/day 30,2 41,3 8328 29,3 31,1 3 44,2 60,2 10142 43,1 45,4?/dayg/day 16,8 25,8 8582 16,3 17,4 19,1 30,1 10133 18,5 19,6 9 2 24,4 27,0 7586 23,8 25,0
ml/day?/day
HQ011911 Vinegar ml/dayHQ011912 Other sauces and condiments g/day
g/day 7,9 20,8 8395 7,4 8,3 3,8 13,6 10155 3,5 4,0 2 7586?/dayg/day 5,0 18,4 8293 4,6 5,4 3 16,3 41,0 10142 15,5 17,1 9 2 7586?/dayg/day 1 5,1 20,9 10158 4,7 5,5 2 7586
unit/day?/dayg/day 12,5 32,8 8408 11,8 13,2 12,1 16,9 10131 11,8 12,4 9,8 10,6 7586 9,6 10,1
ml/dayg/day 6,6 12,3 8342 6,3 6,9 9,2 14,8 10128 8,9 9,5 6,3 7,9 3774 6,1 6,6 8,0 9,6 7586 7,8 8,2
ml/daymixed - g/day /
ml/dayg/day 1,6 26,8 8356 1,0 2,1 0,8 2,7 10164 0,7 0,8 1,4 2,5 3774 1,3 1,5 1,6 2,7 7586 1,5 1,6
ml/dayg/day 4,5 14,5 8387 4,2 4,8 2,1 6,9 10173 2,0 2,3 0,2 1,3 3774 0,2 0,3 0,3 1,7 7586 0,2 0,3
ml/day
HQ0122 Mineral waters, soft drinks, fruit and vegetable juices (ND) ml/day 300,7 400,1 8855 292,4 309,1 424,9 458,4 10144 416,0 433,8
HQ01221 Mineral or spring waters ml/day 149,2 322,5 8822 142,5 155,9 283,8 401,8 10087 276,0 291,7 49,3 129,8 3774 45,1 53,4 54,6 117,0 7586 52,0 57,3HQ01222 Soft drinks ml/day 105,7 160,5 8779 102,4 109,1 64,8 121,8 10136 62,4 67,2 32,0 69,1 3774 29,8 34,2 45,1 86,5 7586 43,2 47,1HQ01223 Fruit juices ml/day 47,3 83,1 8688 45,6 49,1 78,1 102,4 10123 76,1 80,1 25,7 55,2 3774 23,9 27,4 31,9 58,2 7586 30,6 33,2HQ01224 Vegetable juices ml/day 1,2 11,2 8791 0,9 1,4 0,4 5,6 10186 0,3 0,5 3,1 14,7 3774 2,6 3,5 3,0 14,2 7586 2,6 3,3HQ021 Alcoholic beverages ml/day 85,9 194,7 8874 81,9 90,0 111,3 200,7 10112 107,4 115,3HQ0211 Spirits and liqueurs ml/day 3,3 14,9 8846 3,0 3,7 8,8 26,1 10147 8,3 9,3 5,9 16,1 3774 5,4 6,4 8,2 19,1 7586 7,8 8,7HQ0212 Wine (ND) ml/day 34,7 150,5 8875 31,5 37,8 72,9 160,3 10101 69,7 76,0 9,8 26,9 7586 9,2 10,4HQ02121 Wine from grapes or other fruit ml/day 31,9 147,6 8876 28,9 35,0 66,1 153,5 10108 63,1 69,1 6,4 23,2 3774 5,6 7,1 6,2 21,6 7586 5,7 6,7HQ02122 Other ml/day 2,7 21,5 8856 2,3 3,2 6,6 26,7 10158 6,1 7,2 3,4 12,6 3774 3,0 3,8 3,7 12,9 7586 3,4 3,9HQ0213 Beer ml/day 48,0 109,6 8875 45,7 50,3 29,6 86,5 10171 27,9 31,3 33,1 82,6 3774 30,4 35,7 44,9 93,8 7586 42,8 47,0
Vegetables g/day 174,9 167,3 7165 171,0 178,8 3 158,3 144,9 9770 155,4 161,2 3 233,3 227,5 3774 226,1 240,6 3 266,2 219,3 7586 261,2 271,1 3Fruit g/day 268,6 243,1 6802 262,8 274,4 3 53,6 95,8 1371 48,5 58,7 3 168,1 204,5 3774 161,5 174,6 3 196,8 192,8 7586 192,5 201,2 3Sugar (version "large") ml/day 417,7 355,8 7759 409,8 425,6 3 283,8 248,1 9720 278,9 288,7 3 227,4 196,9 3774 221,2 233,7 3 329,0 280,2 7586 322,7 335,3 3Sugar (version "short") ml/day 151,9 191,9 8626 147,8 155,9 142,8 175,5 10071 139,4 146,2 57,7 93,1 3774 54,7 60,7 77,0 105,6 7586 74,6 79,4
8881 10240 3774 75862004 2005 2005 2005ES FR LV LT
HQ01213 Cocoa and powdered chocolate
HQ01211 Coffee
HQ01212 Tea
HQ01194 Other food products nec
HQ0121 Coffee, tea and cocoa (ND)
HQ01192 Salt, spices and culinary herbs
HQ01193 Baby food, dietary preparations, baker's yeast and other food preparations
HQ0119 Food products nec (ND)
HQ01191 Sauces, condiments
HQ01185 Edible ices and ice cream
HQ01186 Other sugar products
HQ0118 Sugar, jam, honey, chocolate and confectionery (ND)
HQ01184 Confectionery products
Std Dev: Standard Deviation; N: number of observed households; LCL 95%: 95% Lower Confidence Limit; UCL 95%: 95% Upper Confidence Limit; Flags: 1: Not surveyed quantities; 2: Not available; 3: see list of products in Annex V; 4: No summary quantity because different measurement units for the different sub-headings; 9: estimated (see Annex V); 10: estimated by Eurostat (see Annex V)

Eurostat/Unit F5 Food consumption statistics - Results using data collected from HBS Food Safety Statistics ESTAT/F5/ES/204 Rev.1
44/57
Daily mean food availability per person (quantities purchased per person) (DFQP)
YearSurveyed households, number
Code Label and measurement unit DFQP Std Dev N LCL 95% UCL 95% flag DFQP Std Dev N LCL 95% UCL 95% flag DFQP Std Dev N LCL 95% UCL 95% flagg/day 253,2 136,3 9058 250,4 256,0 323,5 173,2 3732 318,0 329,1?/day 326,2 182,1 34767 324,3 328,1
HQ01111 Rice g/day 19,4 17,8 5424 18,9 19,8 12,9 27,1 3732 12,0 13,7 4,2 9,0 34767 4,1 4,3HQ01112 Bread g/day 174,2 95,6 9038 172,2 176,1 168,0 104,0 3732 164,7 171,3 223,7 133,3 34767 222,3 225,1HQ011121 Bread: wholemeal g/day 140,6 90,9 8805 138,7 142,5HQ011122 Bread: low fibre g/day 31,7 30,2 7941 31,1 32,4HQ01113 Pasta products g/day 20,5 17,7 7186 20,1 20,9 54,3 53,5 3732 52,6 56,0 12,6 14,9 32025 12,5 12,8HQ01114 Pastry-cook products g/day 26,0 30,0 3500 25,0 27,0 22,7 40,1 3732 21,4 24,0 25,9 27,6 30297 25,5 26,2
g/day?/day 58,6 60,9 7529 57,2 60,0 33338g/day 65,6 70,3 3732 63,4 67,9?/day 30,1 50,4 29193 29,5 30,7
HQ011161 Other products: wholemeal g/dayHQ011162 Other products: low fibre g/dayHQ0112 Meat (ND) g/day 160,6 129,3 9022 157,9 163,3 182,1 151,2 3732 177,3 187,0 209,5 151,9 34735 207,9 211,1
HQ01121 Fresh, chilled or frozen meat of bovine animals g/day 20,7 21,3 1264 19,5 21,9 37,0 48,2 3732 35,4 38,5 4,7 13,3 34442 4,6 4,8
HQ01122 Fresh, chilled or frozen meat of swine g/day 54,6 77,8 7422 52,8 56,3 30,5 49,8 3732 28,9 32,1 43,2 69,1 30830 42,4 44,0
HQ01123 Fresh, chilled or frozen meat of sheep and goat g/day 40,5 43,0 109 32,5 48,6 1,8 11,1 3732 1,4 2,1 0,3 2,6 4671 0,2 0,4
HQ01124 Fresh, chilled or frozen meat of poultry g/day 58,9 54,8 7838 57,7 60,1 58,3 76,5 3732 55,8 60,7 54,2 56,9 34578 53,6 54,8
HQ01125 Dried, salted or smoked meat and edible meat offal g/day 51,9 48,8 8916 50,8 52,9 0,3 3,7 3732 0,2 0,4 80,6 57,1 34599 80,0 81,2
HQ01126 Other preserved or processed meat and meat preparations g/day 11,9 15,1 4235 11,4 12,3 44,3 38,0 3732 43,1 45,5 6,2 10,9 34208 6,1 6,3
HQ01127 Other fresh, chilled or frozen edible meat g/day 38,4 49,6 141 30,2 46,5 10,1 31,4 3732 9,1 11,1 4,4 13,0 34744 4,2 4,5
HQ0113 Fish (ND) g/day 14,0 17,1 3041 13,4 14,6 35,8 53,5 3732 34,1 37,5 15,4 24,4 34404 15,2 15,7HQ01131 Fresh, chilled or frozen fish g/day 17,7 18,8 1826 16,9 18,6 12,6 40,0 3732 11,3 13,9 15,0 21,8 18065 14,7 15,3HQ011311 Fresh, chilled or frozen fish: fatty fish g/dayHQ011312 Fresh, chilled or frozen fish: other fish g/dayHQ01132 Fresh, chilled or frozen seafood g/day 6,6 4,9 33 4,9 8,3 1,7 9,7 3732 1,4 2,0 0,0 0,6 32532 0,0 0,0
HQ01133 Dried, smoked or salted fish and seafood g/day 5,0 4,0 34 3,6 6,3 3,3 9,8 3732 3,0 3,6 8,4 9,8 13458 8,2 8,6
HQ011331 Dried, smoked or salted fatty fish g/day
HQ011332 Dried, smoked or salted not fatty fish and seafood g/day
HQ01134 Other preserved or processed fish and seafood and fish and seafood preparations g/day 5,7 7,0 1625 5,4 6,1 18,3 25,7 3732 17,5 19,1 6,7 7,6 13780 6,6 6,9
HQ011341 Other preserved or processed fish and fish preparations: fatty fish g/day
HQ011342 Other preserved or processed fish and seafood and fish and seafood preparations g/day
HQ0111 Bread and cereals (ND)
HQ01115 Sandwiches
HQ01116 Other products
HU MT PL2005 2008 2005
3732 347679058
Std Std Dev: Standard Deviation; N: number of observed households; LCL 95%: 95% Lower Confidence Limit; UCL 95%: 95% Upper Confidence Limit; Flags: 1: Not surveyed quantities; 2: Not available; 3: see list of products in Annex V; 4: No summary quantity because different measurement units for the different sub-headings; 9: estimated (see Annex V); 10: estimated by Eurostat (see Annex V)

Eurostat/Unit F5 Food consumption statistics - Results using data collected from HBS Food Safety Statistics ESTAT/F5/ES/204 Rev.1
45/57
Daily mean food availability per person (quantities purchased per person) (DFQP)
YearSurveyed households, number
Code Label and measurement unit DFQP Std Dev N LCL 95% UCL 95% flag DFQP Std Dev N LCL 95% UCL 95% flag DFQP Std Dev N LCL 95% UCL 95% flagHQ01141 Whole milk ml/day 156,3 129,1 7761 153,4 159,2 147,5 156,4 3732 142,4 152,5 16,6 41,9 32687 16,1 17,0HQ01142 Low fat milk ml/day 111,1 115,2 2317 106,4 115,8 80,5 124,5 3732 76,5 84,5 26,4 56,2 21982 25,7 27,2
HQ01141&2 Whole and low fat milk ml/day
g/day 3,8 3,9 1005 3,5 4,0 14,7 29,4 3732 13,8 15,6 1,7 7,0 27023 1,6 1,7ml/dayg/day 25,8 29,0 5815 25,0 26,5 23,3 43,1 3732 21,9 24,7 13,2 22,7 34660 13,0 13,4
ml/dayHQ01145 Cheese and curd g/day 16,8 14,5 8022 16,5 17,1 31,2 33,3 3732 30,2 32,3 33,3 28,1 34608 33,0 33,6HQ011451 Cheese and curd: high fat g/day 12,4 11,5 7237 12,1 12,7HQ011452 Cheese and curd: low fat g/day 8,2 8,2 5285 8,0 8,4
g/day 16,2 14,1 8524 15,9 16,5 12,9 22,2 3732 12,1 13,6 25,8 33,6 32721 25,5 26,2mixed - g/day /
ml/dayunit/day 0,5 0,4 7805 0,5 0,6 0,3 0,4 3732 0,3 0,3 0,1 0,0 34660 0,1 0,1
g/dayg/day
mixed - g/day / ml/day?/day 51,0 42,9 8740 50,1 51,9 58,6 44,4 34680 58,2 59,1
HQ01151 Butter g/day 5,3 5,8 3252 5,1 5,5 7,3 12,1 3732 6,9 7,7 11,4 15,1 34746 11,2 11,5HQ01152 Margarine and other vegetable fats g/day 12,2 9,8 7006 12,0 12,4 7,0 12,6 3732 6,6 7,4 18,1 20,6 34764 17,8 18,3HQ01153 Olive oil ml/day 9,1 9,2 297 8,1 10,2 5,4 13,7 3732 4,9 5,8 0,2 1,8 34636 0,2 0,3HQ01154 Edible oils ml/day 35,7 28,8 6588 35,0 36,4 14,8 28,0 3732 13,9 15,7 7,8 13,8 26330 7,7 8,0HQ01155 Other edible animal fats g/day 22,7 32,9 4176 21,7 23,7 0,1 1,7 3732 0,0 0,2 6,5 15,9 32614 6,3 6,6HQ0116 Fruit (ND) g/day 128,7 163,3 8531 125,2 132,2 128,5 155,7 34001 126,9 130,2HQ01161 Citrus fruits (fresh, chilled or frozen) g/day 31,2 35,1 4498 30,2 32,2 42,5 72,1 3732 40,2 44,8 26,5 37,8 22886 26,0 27,0HQ01162 Bananas (fresh, chilled or frozen) g/day 23,3 21,2 4020 22,6 23,9 37,2 53,8 3732 35,4 38,9 6,8 15,3 32695 6,6 7,0HQ01163 Apples (fresh, chilled or frozen) g/day 57,0 79,9 6022 55,0 59,0 40,7 59,6 3732 38,8 42,6 36,7 61,3 27460 36,0 37,5HQ01164 Pears (fresh, chilled or frozen) g/day 32,7 45,4 1221 30,1 35,2 7,2 21,4 3732 6,5 7,9 3,7 11,8 12909 3,5 3,9HQ01165 Stone fruits (fresh, chilled or frozen) g/day 78,2 123,3 2031 72,8 83,5 16,0 40,5 3732 14,7 17,3 7,6 34,7 34047 7,2 8,0HQ01166 Berries (fresh, chilled or frozen) g/day 34,8 105,7 2250 30,5 39,2 4,0 14,6 3732 3,6 4,5 20,9 54,0 18146 20,2 21,7HQ01167 Other fresh, chilled or frozen fruits g/day 81,1 126,1 2398 76,0 86,1 46,1 98,5 3732 43,0 49,3 5,6 23,9 27225 5,3 5,9HQ01168 Dried fruit g/day 8,1 12,6 3854 7,7 8,4 2,0 7,4 3732 1,7 2,2 2,5 7,6 34324 2,4 2,6HQ01169 Preserved fruit and fruit based products g/day 9,3 10,8 243 7,9 10,6 4,3 10,0 3732 3,9 4,6 2,5 8,4 26472 2,4 2,6HQ0117 Vegetables (ND) g/day 261,8 265,6 8925 256,3 267,3 4,4 13,3 3732 4,0 4,8 470,8 561,1 34702 464,9 476,8
HQ01171 Leaf and stem vegetables (fresh, chilled or frozen) g/day 39,5 78,1 2088 36,2 42,9 22,3 36,3 3732 21,1 23,5 33846
HQ01172 Cabbages (fresh, chilled or frozen) g/day 32,2 43,1 4906 31,0 33,4 7,9 21,6 3732 7,2 8,6 29,4 55,8 24482 28,7 30,1
HQ01173 Vegetables cultivated for their fruit (fresh, chilled or frozen) g/day 68,5 119,5 7789 65,9 71,2 66,4 83,8 3732 63,7 69,1 62,3 115,2 31378 61,0 63,6
HQ01174 Root crops, non-starchy bulbs and mushrooms (fresh, chilled or frozen) g/day 57,8 76,1 8151 56,2 59,5 41,6 54,2 3732 39,9 43,4 63,4 86,1 34735 62,4 64,3
HQ01175 Dried vegetables g/day 5,1 4,2 29 3,6 6,6 1,4 4,9 3732 1,2 1,5 2,7 6,5 23073 2,6 2,8
HQ01176 Other preserved or processed vegetables g/day 26,6 30,3 5938 25,9 27,4 68,4 68,6 3732 66,2 70,6 32,9 40,7 34764 32,5 33,3
HQ01177 Potatoes g/day 118,0 148,8 7376 114,6 121,4 88,5 114,3 3732 84,8 92,2 61,9 140,6 34767 60,4 63,3
HQ01178 Other tubers and products of tuber vegetables g/day 7,8 10,3 2407 7,4 8,2 0,1 1,0 3732 0,0 0,1 2,7 8,9 34715 2,6 2,8
9058 3732 347672008 20052005
HU MT PL
HQ01147 Eggs
HQ0115 Oils and fats (ND)
HQ01144 Yoghurt
HQ01146 Other milk products
HQ01143 Preserved milk
Std Dev: Standard Deviation; N: number of observed households; LCL 95%: 95% Lower Confidence Limit; UCL 95%: 95% Upper Confidence Limit; Flags: 1: Not surveyed quantities; 2: Not available; 3: see list of products in Annex V; 4: No summary quantity because different measurement units for the different sub-headings; 9: estimated (see Annex V); 10: estimated by Eurostat (see Annex V)

Eurostat/Unit F5 Food consumption statistics - Results using data collected from HBS Food Safety Statistics ESTAT/F5/ES/204 Rev.1
46/57
Daily mean food availability per person (quantities purchased per person) (DFQP) Year
Surveyed households, numberCode Label and measurement unit DFQP Std Dev N LCL 95% UCL 95% flag DFQP Std Dev N LCL 95% UCL 95% flag DFQP Std Dev N LCL 95% UCL 95% flag
g/day?/day 49,6 58,8 8719 48,4 50,9 77,9 77,8 34602 77,1 78,8
HQ01181 Sugar g/day 50,8 58,7 6987 49,4 52,1 14,4 30,3 3732 13,4 15,4 12,3 30,6 34715 12,0 12,6HQ01182 Jams, marmalades g/day 14,6 18,5 3576 14,0 15,2 1,1 4,9 3732 1,0 1,3 5,5 9,9 28500 5,3 5,6HQ01183 Chocolate g/day 2,8 8,7 3732 2,5 3,1 4,3 6,7 27300 4,2 4,4
g/day 0,6 4,1 3732 0,5 0,8?/day 5,3 6,8 4283 5,1 5,5 7,1 12,1 34666 6,9 7,2g/day
ml/day 22,1 51,2 3732 20,4 23,7 8,6 17,9 22267 8,4 8,9g/day 16,8 26,5 3732 16,0 17,7 5,1 5,9 6354 4,9 5,2?/dayg/day 1,5 3,1 30265 1,4 1,5?/day 4,8 9,0 8318 4,6 5,0g/day
ml/day 19,8 30,4 3732 18,8 20,8?/day 32
HQ011911 Vinegar ml/dayHQ011912 Other sauces and condiments g/day
g/day 3,1 9,7 5878 2,8 3,3 3,1 9,6 3732 2,8 3,4?/day 1,8 3,3 25302 1,7 1,8g/day 8,3 21,4 3732 7,6 9,0?/day 30754g/day
unit/day 0,2 3,3 3732 0,0 0,3?/day 14038g/day 9,2 7,5 8564 9,0 9,3 11,7 11,5 33326 11,6 11,9
ml/dayg/day 7,9 6,7 7998 7,8 8,1 3,3 7,0 3732 3,1 3,5 7,2 9,4 34655 7,1 7,3
ml/daymixed - g/day /
ml/dayg/day 1,1 1,5 3921 1,0 1,1 3,9 9,3 3732 3,6 4,2 3,9 4,5 29225 3,8 4,0
ml/dayg/day 4,2 4,2 2232 4,0 4,4 1,2 4,6 3732 1,0 1,3 0,8 2,1 31625 0,7 0,8
ml/day
HQ0122 Mineral waters, soft drinks, fruit and vegetable juices (ND) ml/day 268,4 252,4 8352 263,0 273,8 135,6 211,7 34759 133,4 137,9
HQ01221 Mineral or spring waters ml/day 204,5 216,5 5275 198,7 210,3 434,3 773,1 3732 409,5 459,1 40,7 104,3 33480 39,6 41,8HQ01222 Soft drinks ml/day 130,6 150,4 5765 126,7 134,4 274,5 347,7 3732 263,3 285,7 56,5 110,6 28868 55,3 57,8HQ01223 Fruit juices ml/day 63,6 76,9 5909 61,6 65,6 29,4 66,1 3732 27,3 31,5 15,5 44,5 34654 15,0 15,9HQ01224 Vegetable juices ml/day 24,9 29,9 277 21,4 28,4 0,4 6,8 3732 0,1 0,6 3,1 13,1 17000 2,9 3,3HQ021 Alcoholic beverages ml/day 89,8 128,9 5528 86,4 93,1 43,4 82,0 19489 42,2 44,5HQ0211 Spirits and liqueurs ml/day 13,1 25,8 1450 11,8 14,5 1,5 9,3 3732 1,2 1,8 2,6 19,1 32272 2,4 2,8HQ0212 Wine (ND) ml/day 48,6 83,3 3054 45,7 51,6 13,5 20,5 6456 13,0 14,0HQ02121 Wine from grapes or other fruit ml/day 51,7 87,5 2502 48,3 55,1 27,7 73,8 3732 25,3 30,1 7,3 17,3 8425 7,0 7,7HQ02122 Other ml/day 16,5 17,3 1046 15,4 17,5 0,8 8,9 3732 0,5 1,0 0,7 3,7 31707 0,7 0,8HQ0213 Beer ml/day 78,4 116,0 4123 74,9 82,0 24,5 94,8 3732 21,5 27,6 30,0 66,2 17286 29,0 31,0
Vegetables g/day 240,9 210,9 227 213,5 268,4 3 208,5 182,9 3732 202,6 214,3 3 123,3 130,0 8235 120,5 126,1 3Fruit g/day 192,3 182,9 5657 187,5 197,0 3 229,4 217,3 3732 222,4 236,4 3 90,8 101,6 4256 87,7 93,8 3Sugar (version "large") ml/day 554,9 418,4 3732 541,5 568,3 3 76,1 87,1 8172 74,2 78,0 3Sugar (version "short") ml/day 187,2 166,1 3945 182,0 192,4 303,9 357,6 3732 292,4 315,4 46,1 78,7 28771 45,2 47,0
3732 3476790582005 2008 2005
MT PLHU
HQ01213 Cocoa and powdered chocolate
HQ01211 Coffee
HQ01212 Tea
HQ01194 Other food products nec
HQ0121 Coffee, tea and cocoa (ND)
HQ01192 Salt, spices and culinary herbs
HQ01193 Baby food, dietary preparations, baker's yeast and other food preparations
HQ0119 Food products nec (ND)
HQ01191 Sauces, condiments
HQ01185 Edible ices and ice cream
HQ01186 Other sugar products
HQ0118 Sugar, jam, honey, chocolate and confectionery (ND)
HQ01184 Confectionery products
Std Std Dev: Standard Deviation; N: number of observed households; LCL 95%: 95% Lower Confidence Limit; UCL 95%: 95% Upper Confidence Limit; Flags: 1: Not surveyed quantities; 2: Not available; 3: see list of products in Annex V; 4: No summary quantity because different measurement units for the different sub-headings; 9: estimated (see Annex V); 10: estimated by Eurostat (see Annex V)

Eurostat/Unit F5 Food consumption statistics - Results using data collected from HBS Food Safety Statistics ESTAT/F5/ES/204 Rev.1
47/57
Daily mean food availability per person (quantities purchased per person) (DFQP)
YearSurveyed households, number
Code Label and measurement unit DFQP Std Dev N LCL 95% UCL 95% flag DFQP Std Dev N LCL 95% UCL 95% flag DFQP Std Dev N LCL 95% UCL 95% flagg/day 405,4 153,0 33066 403,8 407,1 246,4 199,0 3722 240,0 252,8 308,4 159,0 4710 303,8 312,9?/day
HQ01111 Rice g/day 14,7 10,1 33066 14,5 14,8 8,5 19,4 3723 7,9 9,2 21,5 22,4 4710 20,8 22,1HQ01112 Bread g/day 310,0 135,6 33066 308,5 311,4 153,6 112,7 3723 150,0 157,2 179,9 88,4 4710 177,3 182,4HQ011121 Bread: wholemeal g/day 3723HQ011122 Bread: low fibre g/day 3723HQ01113 Pasta products g/day 9,6 9,3 33066 9,5 9,7 17,7 25,8 3723 16,8 18,5 18,1 18,4 4710 17,5 18,6HQ01114 Pastry-cook products g/day 2,4 8,9 33066 2,3 2,5 1576 18,0 18,4 4710 17,5 18,5
g/day 1,0 4,0 4710 0,9 1,1?/day 33066 3370g/day 68,8 76,6 33066 67,9 69,6 66,5 146,3 3723 61,8 71,2 70,0 75,2 4710 67,8 72,1?/day
HQ011161 Other products: wholemeal g/day 3723HQ011162 Other products: low fibre g/day 3723HQ0112 Meat (ND) g/day 111,1 67,1 33066 110,4 111,9 143,8 176,6 3723 138,2 149,5 144,9 118,1 4710 141,5 148,3
HQ01121 Fresh, chilled or frozen meat of bovine animals g/day 15,2 22,4 22280 14,9 15,5 30,5 65,4 3723 28,4 32,6 7,1 19,5 4710 6,6 7,7
HQ01122 Fresh, chilled or frozen meat of swine g/day 34,5 31,4 21569 34,1 34,9 30,8 117,3 3723 27,1 34,6 33,8 69,9 4710 31,8 35,8
HQ01123 Fresh, chilled or frozen meat of sheep and goat g/day 4,4 15,9 22783 4,2 4,6 0,6 10,3 3677 0,3 0,9 0,2 4,2 4710 0,1 0,3
HQ01124 Fresh, chilled or frozen meat of poultry g/day 40,3 31,6 30625 40,0 40,7 26,6 54,8 3723 24,8 28,4 51,0 49,7 4710 49,6 52,5
HQ01125 Dried, salted or smoked meat and edible meat offal g/day 26,5 21,8 32836 26,2 26,7 48,7 47,2 3723 47,2 50,2 43,5 32,7 4710 42,6 44,4
HQ01126 Other preserved or processed meat and meat preparations g/day 17,0 20,4 18527 16,7 17,2 5,8 10,6 3723 5,4 6,1 8,9 12,7 4710 8,5 9,2
HQ01127 Other fresh, chilled or frozen edible meat g/day 0,4 4,2 33066 0,4 0,5 0,8 6,9 3708 0,6 1,0 0,3 6,3 4710 0,1 0,5
HQ0113 Fish (ND) g/day 14,7 17,8 33066 14,5 14,9 10,3 20,2 3723 9,7 11,0 13,4 15,5 4710 13,0 13,9HQ01131 Fresh, chilled or frozen fish g/day 13,9 17,5 33066 13,7 14,1 5,3 15,9 3723 4,8 5,8 6,0 10,9 4710 5,6 6,3HQ011311 Fresh, chilled or frozen fish: fatty fish g/day 3723HQ011312 Fresh, chilled or frozen fish: other fish g/day 3723HQ01132 Fresh, chilled or frozen seafood g/day 0,3 2,0 33066 0,2 0,3 0,8 4,8 3723 0,6 1,0 0,1 0,8 4710 0,0 0,1
HQ01133 Dried, smoked or salted fish and seafood g/day 33066 0,0 0,6 3616 0,0 0,1 0,5 1,9 4710 0,4 0,5
HQ011331 Dried, smoked or salted fatty fish g/day 3723
HQ011332 Dried, smoked or salted not fatty fish and seafood g/day 3723
HQ01134 Other preserved or processed fish and seafood and fish and seafood preparations g/day 0,6 2,2 33066 0,6 0,6 4,2 9,6 3723 3,9 4,5 6,9 8,4 4710 6,7 7,2
HQ011341 Other preserved or processed fish and fish preparations: fatty fish g/day 3723
HQ011342 Other preserved or processed fish and seafood and fish and seafood preparations g/day 3723
HQ0111 Bread and cereals (ND)
HQ01115 Sandwiches
HQ01116 Other products
RO SI SK2005 2004 2006
33066 3725 4710
Std Dev: Standard Deviation; N: number of observed households; LCL 95%: 95% Lower Confidence Limit; UCL 95%: 95% Upper Confidence Limit; Flags: 1: Not surveyed quantities; 2: Not available; 3: see list of products in Annex V; 4: No summary quantity because different measurement units for the different sub-headings; 9: estimated (see Annex V); 10: estimated by Eurostat (see Annex V)

Eurostat/Unit F5 Food consumption statistics - Results using data collected from HBS Food Safety Statistics ESTAT/F5/ES/204 Rev.1
48/57
Daily mean food availability per person (quantities purchased per person) (DFQP)
YearSurveyed households, number
Code Label and measurement unit DFQP Std Dev N LCL 95% UCL 95% flag DFQP Std Dev N LCL 95% UCL 95% flag DFQP Std Dev N LCL 95% UCL 95% flagHQ01141 Whole milk ml/day 149,7 169,8 33066 147,8 151,5 165,9 218,5 3723 158,9 172,9 55,1 104,3 4710 52,1 58,1HQ01142 Low fat milk ml/day 23,6 70,4 33066 22,9 24,4 39,0 108,5 3723 35,5 42,5 109,9 117,9 4710 106,5 113,2
HQ01141&2 Whole and low fat milk ml/day
g/day 0,4 3,3 33066 0,3 0,4 0,3 3,9 3693 0,2 0,5 1,1 4,3 4710 1,0 1,2ml/dayg/day 6,7 19,2 33066 6,5 6,9 36,0 45,5 3723 34,5 37,4
ml/day 21,4 21,9 4710 20,8 22,0HQ01145 Cheese and curd g/day 37,0 38,7 33066 36,6 37,4 16,6 19,2 3723 16,0 17,2 17,2 14,3 4710 16,8 17,6HQ011451 Cheese and curd: high fat g/day 3723HQ011452 Cheese and curd: low fat g/day 3723
g/day 5,8 9,4 33066 5,7 5,9 26,3 32,0 3723 25,3 27,4 22,0 24,0 4710 21,3 22,7mixed - g/day /
ml/dayunit/day 0,4 0,3 33066 0,4 0,4 0,3 0,5 3723 0,3 0,3 0,4 0,4 4710 0,4 0,4
g/dayg/day
mixed - g/day / ml/day?/day 43,1 20,0 33066 42,9 43,3 45,0 62,1 3723 43,0 47,0
HQ01151 Butter g/day 0,9 2,2 33066 0,9 1,0 2,1 5,4 3723 1,9 2,3 4,6 6,5 4710 4,5 4,8HQ01152 Margarine and other vegetable fats g/day 5,7 5,5 33066 5,7 5,8 6,0 11,2 3723 5,7 6,4 13,7 12,2 4710 13,4 14,1HQ01153 Olive oil ml/day 0,1 1,3 33066 0,1 0,2 2,0 9,1 3723 1,7 2,3 0,7 3,6 4710 0,6 0,8HQ01154 Edible oils ml/day 31,2 15,8 33066 31,0 31,3 31,7 55,5 3723 30,0 33,5 29,6 30,1 4710 28,7 30,4HQ01155 Other edible animal fats g/day 5,1 10,4 33066 5,0 5,2 3,1 14,7 3720 2,7 3,6 3,1 11,5 4710 2,8 3,4HQ0116 Fruit (ND) g/day 96,0 112,9 33066 94,7 97,2 193,7 214,9 3723 186,8 200,6HQ01161 Citrus fruits (fresh, chilled or frozen) g/day 11,2 19,9 33066 10,9 11,4 40,7 74,8 3723 38,3 43,1 26,6 37,5 4710 25,6 27,7HQ01162 Bananas (fresh, chilled or frozen) g/day 9,9 16,4 33066 9,7 10,1 29,6 47,4 3723 28,0 31,1 13,2 18,1 4710 12,7 13,8HQ01163 Apples (fresh, chilled or frozen) g/day 38,6 46,3 33066 38,1 39,1 53,3 108,2 3723 49,8 56,8 28,3 50,7 4710 26,9 29,8HQ01164 Pears (fresh, chilled or frozen) g/day 2,4 12,7 33066 2,2 2,5 6,6 17,1 3723 6,1 7,2 1,6 7,9 4710 1,3 1,8HQ01165 Stone fruits (fresh, chilled or frozen) g/day 8,1 26,1 33066 7,8 8,4 20,6 53,3 3723 18,9 22,3 7,3 33,0 4710 6,4 8,2HQ01166 Berries (fresh, chilled or frozen) g/day 5,6 20,8 33066 5,3 5,8 2,8 19,1 3720 2,2 3,4 5,0 16,4 4710 4,5 5,5HQ01167 Other fresh, chilled or frozen fruits g/day 17,5 79,9 33066 16,6 18,4 33,3 92,4 3723 30,3 36,2 18,2 51,0 4710 16,8 19,7HQ01168 Dried fruit g/day 2,7 10,2 33066 2,6 2,8 6,5 22,1 3723 5,8 7,2 4,4 8,8 4710 4,1 4,6HQ01169 Preserved fruit and fruit based products g/day 33066 0,4 2,2 3708 0,3 0,5 0,9 5,2 4710 0,8 1,1HQ0117 Vegetables (ND) g/day 314,1 168,2 33066 312,3 315,9 271,6 570,9 3723 253,3 290,0
HQ01171 Leaf and stem vegetables (fresh, chilled or frozen) g/day 7,9 17,6 33066 7,8 8,1 28,6 34,7 3723 27,5 29,7 1,7 7,7 4710 1,4 1,9
HQ01172 Cabbages (fresh, chilled or frozen) g/day 20,5 32,8 33066 20,2 20,9 20,5 91,6 3723 17,5 23,4 23,5 71,1 4710 21,5 25,6
HQ01173 Vegetables cultivated for their fruit (fresh, chilled or frozen) g/day 53,9 87,9 33066 52,9 54,8 50,0 73,3 3723 47,7 52,4 28,2 62,4 4710 26,4 30,0
HQ01174 Root crops, non-starchy bulbs and mushrooms (fresh, chilled or frozen) g/day 49,2 32,0 33066 48,9 49,5 35,1 65,7 3723 33,0 37,2 29,5 45,0 4710 28,2 30,8
HQ01175 Dried vegetables g/day 14,3 15,2 33066 14,1 14,4 4,7 15,5 3720 4,2 5,2 3,8 8,0 4710 3,6 4,1
HQ01176 Other preserved or processed vegetables g/day 41,7 55,1 33066 41,1 42,3 23,9 42,0 3723 22,5 25,2 12,1 19,9 4710 11,5 12,7
HQ01177 Potatoes g/day 126,5 90,6 33066 125,5 127,5 104,0 511,5 3723 87,6 120,4 84,7 224,5 4710 78,3 91,1
HQ01178 Other tubers and products of tuber vegetables g/day 0,1 1,1 33066 0,0 0,1 4,9 13,3 3721 4,4 5,3 4,7 9,8 4710 4,4 4,9
3725 47103306620062005 2004
SI SKRO
HQ01147 Eggs
HQ0115 Oils and fats (ND)
HQ01144 Yoghurt
HQ01146 Other milk products
HQ01143 Preserved milk
Std Dev: Standard Deviation; N: number of observed households; LCL 95%: 95% Lower Confidence Limit; UCL 95%: 95% Upper Confidence Limit; Flags: 1: Not surveyed quantities; 2: Not available; 3: see list of products in Annex V; 4: No summary quantity because different measurement units for the different sub-headings; 9: estimated (see Annex V); 10: estimated by Eurostat (see Annex V)

Eurostat/Unit F5 Food consumption statistics - Results using data collected from HBS Food Safety Statistics ESTAT/F5/ES/204 Rev.1
49/57
Daily mean food availability per person (quantities purchased per person) (DFQP) Year
Surveyed households, numberCode Label and measurement unit DFQP Std Dev N LCL 95% UCL 95% flag DFQP Std Dev N LCL 95% UCL 95% flag DFQP Std Dev N LCL 95% UCL 95% flag
g/day?/day 41,7 27,4 33066 41,4 42,0 63,1 95,5 3536 60,0 66,3
HQ01181 Sugar g/day 25,7 14,8 33066 25,6 25,9 33,9 87,6 3723 31,1 36,7 47,2 65,1 4710 45,4 49,1HQ01182 Jams, marmalades g/day 8,6 15,9 33066 8,4 8,8 6,8 16,6 3723 6,3 7,4 5,0 11,2 4710 4,7 5,3HQ01183 Chocolate g/day 1,3 2,8 33066 1,2 1,3 10,7 15,3 3723 10,2 11,2 7,4 8,4 4710 7,2 7,7
g/day 3,2 4,7 4710 3,0 3,3?/day 1,1 2,9 33066 1,0 1,1 1197g/day 3,8 8,9 4710 3,5 4,0
ml/day 0,9 3,5 33066 0,8 0,9 8,8 22,2 3723 8,1 9,5g/day 2,4 6,4 4710 2,2 2,6?/day 4,1 8,5 33066 4,0 4,2 2859g/day?/day 11375 8,1 14,2 1115 7,3 9,0g/day 20634 1499 17,4 20,5 4710 16,8 18,0
ml/day?/day
HQ011911 Vinegar ml/dayHQ011912 Other sauces and condiments g/day
g/day 22440 2003 10,8 14,5 4710 10,4 11,2?/dayg/day 28884 4,9 11,8 1887 4,4 5,5 3,9 5,8 4710 3,7 4,1?/dayg/day 20602 3379 0,3 1,8 4710 0,2 0,4
unit/day?/dayg/day 4,9 4,7 33066 4,8 4,9 10,4 14,2 3723 10,0 10,9
ml/dayg/day 4,0 3,9 33066 4,0 4,1 8,4 13,0 3723 7,9 8,8 5,1 5,8 4710 5,0 5,3
ml/daymixed - g/day /
ml/dayg/day 0,5 2,0 33066 0,5 0,5 0,9 2,1 3723 0,8 1,0 1,1 2,1 4710 1,1 1,2
ml/dayg/day 0,4 0,9 33066 0,3 0,4 1,2 4,8 3723 1,0 1,3 1,9 3,2 4710 1,8 2,0
ml/day
HQ0122 Mineral waters, soft drinks, fruit and vegetable juices (ND) ml/day 96,3 146,0 33066 94,8 97,9 286,7 324,8 3723 276,3 297,2
HQ01221 Mineral or spring waters ml/day 45,4 107,7 33066 44,3 46,6 103,1 195,3 3723 96,8 109,4 121,7 168,9 4710 116,8 126,5HQ01222 Soft drinks ml/day 49,8 86,2 33066 48,8 50,7 87,4 157,4 3723 82,3 92,4 131,0 178,6 4710 125,9 136,1HQ01223 Fruit juices ml/day 1,1 9,1 33066 1,1 1,2 95,5 158,3 3723 90,4 100,6 37,6 54,6 4710 36,0 39,1HQ01224 Vegetable juices ml/day 33066 0,8 10,2 3723 0,4 1,1 3,1 19,6 4710 2,6 3,7HQ021 Alcoholic beverages ml/day 64,2 108,7 33066 63,0 65,4 87,2 191,0 3513 80,8 93,5HQ0211 Spirits and liqueurs ml/day 8,4 27,0 33066 8,1 8,7 2,3 10,5 3723 2,0 2,7 6,2 12,2 4710 5,8 6,5HQ0212 Wine (ND) ml/day 31,1 82,6 33066 30,2 32,0 57,0 186,3 3723 51,0 63,0HQ02121 Wine from grapes or other fruit ml/day 30,8 82,5 33066 29,9 31,7 21,7 106,8 3320 18,1 25,3 14,0 31,8 4710 13,1 14,9HQ02122 Other ml/day 0,3 2,5 33066 0,2 0,3 0,4 6,7 3723 0,2 0,6 0,1 1,1 4710 0,0 0,1HQ0213 Beer ml/day 24,7 49,2 33066 24,2 25,3 60,2 147,1 3723 55,5 65,0 48,6 129,0 4710 44,9 52,3
Vegetables g/day 187,6 122,8 33066 186,3 188,9 3 168,4 183,4 3718 162,5 174,3 3 106,6 136,0 4710 102,8 110,5 3Fruit g/day 97,1 114,0 33066 95,9 98,3 3 288,3 281,8 3708 279,3 297,4 3 143,2 130,2 4710 139,4 146,9 3Sugar (version "large") ml/day 229,4 189,0 33066 227,4 231,5 3 398,3 346,5 3693 387,2 409,5 3 342,8 240,3 4710 335,9 349,6 3Sugar (version "short") ml/day 50,9 86,7 33066 50,0 51,8 182,9 231,3 3723 175,4 190,3 168,5 188,4 4710 163,1 173,9
471033066 37252004 20062005
SKRO SI
HQ01213 Cocoa and powdered chocolate
HQ01211 Coffee
HQ01212 Tea
HQ01194 Other food products nec
HQ0121 Coffee, tea and cocoa (ND)
HQ01192 Salt, spices and culinary herbs
HQ01193 Baby food, dietary preparations, baker's yeast and other food preparations
HQ0119 Food products nec (ND)
HQ01191 Sauces, condiments
HQ01185 Edible ices and ice cream
HQ01186 Other sugar products
HQ0118 Sugar, jam, honey, chocolate and confectionery (ND)
HQ01184 Confectionery products
Std Dev: Standard Deviation; N: number of observed households; LCL 95%: 95% Lower Confidence Limit; UCL 95%: 95% Upper Confidence Limit; Flags: 1: Not surveyed quantities; 2: Not available; 3: see list of products in Annex V; 4: No summary quantity because different measurement units for the different sub-headings; 9: estimated (see Annex V); 10: estimated by Eurostat (see Annex V)

Eurostat/Unit F5 Food consumption statistics - Results using data collected from HBS Food Safety Statistics ESTAT/F5/ES/204 Rev.1
50/57
Daily mean food availability per person (quantities purchased per person) (DFQP)
YearSurveyed households, number
Code Label and measurement unit DFQP Std Dev N LCL 95% UCL 95% flag DFQP Std Dev N LCL 95% UCL 95% flagg/day 280.9 151.5 634 269.1 292.7 287.9 295.6 3360 277.9 297.9?/day
HQ01111 Rice g/day 40.3 96.5 1387 35.2 45.4 46.8 67.8 739 41.9 51.7HQ01112 Bread g/day 131.9 81.6 6594 129.9 133.8 156.7 157.5 3282 151.4 162.1HQ011121 Bread: wholemeal g/dayHQ011122 Bread: low fibre g/dayHQ01113 Pasta products g/day 25.8 24.8 2719 24.8 26.7 35.1 45.5 1536 32.8 37.4HQ01114 Pastry-cook products g/day 36.8 33.2 5081 35.9 37.7 47.2 56.5 2847 45.1 49.3
g/day?/dayg/day 48.5 60.9 5322 46.8 50.1 3 104.1 184.5 2250 96.4 111.7?/day
HQ011161 Other products: wholemeal g/dayHQ011162 Other products: low fibre g/dayHQ0112 Meat (ND) g/day 202.3 17.1 2 178.6 226.0 164.6 241.9 3296 156.3 172.8
HQ01121 Fresh, chilled or frozen meat of bovine animals g/day 32.9 31.2 3261 31.8 33.9 15.5 40.8 2590 13.9 17.1
HQ01122 Fresh, chilled or frozen meat of swine g/day 27.5 26.1 1720 26.2 28.7 29.6 72.8 2707 26.8 32.3
HQ01123 Fresh, chilled or frozen meat of sheep and goat g/day 35.5 45.4 1301 33.0 37.9 25.0 207.8 1542 14.7 35.4
HQ01124 Fresh, chilled or frozen meat of poultry g/day 52.2 53.1 3468 50.4 53.9 46.3 63.8 1487 43.0 49.5
HQ01125 Dried, salted or smoked meat and edible meat offal g/day 31.1 30.4 4562 30.2 32.0 50.1 63.2 3020 47.8 52.3
HQ01126 Other preserved or processed meat and meat preparations g/day 64.3 57.9 5837 62.8 65.8 51.3 61.0 2788 49.0 53.6
HQ01127 Other fresh, chilled or frozen edible meat g/day 33.7 69.4 34 10.4 57.0 159.7 372.8 140 98.0 221.5
HQ0113 Fish (ND) g/day 79.5 47.1 81 69.3 89.8 63.1 112.6 2811 59.0 67.3HQ01131 Fresh, chilled or frozen fish g/day 24.4 33.4 1723 22.8 26.0 41.5 98.6 1665 36.7 46.2HQ011311 Fresh, chilled or frozen fish: fatty fish g/dayHQ011312 Fresh, chilled or frozen fish: other fish g/dayHQ01132 Fresh, chilled or frozen seafood g/day 13.6 15.3 767 12.5 14.7 51.3 106.9 491 41.9 60.8
HQ01133 Dried, smoked or salted fish and seafood g/day 12.0 13.3 777 11.1 12.9 25.6 40.8 607 22.4 28.9
HQ011331 Dried, smoked or salted fatty fish g/day
HQ011332 Dried, smoked or salted not fatty fish and seafood g/day
HQ01134 Other preserved or processed fish and seafood and fish and seafood preparations g/day 22.7 24.3 3477 21.9 23.5 27.6 36.0 2469 26.2 29.1
HQ011341 Other preserved or processed fish and fish preparations: fatty fish g/day
HQ011342 Other preserved or processed fish and seafood and fish and seafood preparations g/day
337667472005 2003-2005
NOUK
HQ0111 Bread and cereals (ND)
HQ01115 Sandwiches
HQ01116 Other products
Std Dev: Standard Deviation; N: number of observed households; LCL 95%: 95% Lower Confidence Limit; UCL 95%: 95% Upper Confidence Limit; Flags: 1: Not surveyed quantities; 2: Not available; 3: see list of products in Annex V; 4: No summary quantity because different measurement units for the different sub-headings; 9: estimated (see Annex V); 10: estimated by Eurostat (see Annex V)

Eurostat/Unit F5 Food consumption statistics - Results using data collected from HBS Food Safety Statistics ESTAT/F5/ES/204 Rev.1
51/57
Daily mean food availability per person (quantities purchased per person) (DFQP)
YearSurveyed households, number
Code Label and measurement unit DFQP Std Dev N LCL 95% UCL 95% flag DFQP Std Dev N LCL 95% UCL 95% flagHQ01141 Whole milk ml/day 182.5 167.4 2181 175.4 189.5 118.1 220.6 2219 108.9 127.2HQ01142 Low fat milk ml/day 217.6 172.0 5133 212.9 222.4 239.2 266.3 2846 229.4 249.0
HQ01141&2 Whole and low fat milk ml/day
g/day 21.3 23.6 145 17.5 25.2ml/day 104.6 115.2 537 94.8 114.3g/day 9.6 10.8 1857 9.1 10.0
ml/day 43.5 40.5 3698 42.2 44.8HQ01145 Cheese and curd g/day 21.8 22.8 4832 21.1 22.4 44.6 46.1 3021 42.9 46.2HQ011451 Cheese and curd: high fat g/dayHQ011452 Cheese and curd: low fat g/day
g/day 51.7 60.4 3006 49.5 53.8mixed - g/day /
ml/day 34.3 47.0 3869 32.8 35.8 3
unit/day 0.4 0.3 3926 0.4 0.4g/day 32.3 33.8 2447 31.0 33.6g/day 42.5 49.7 2819 40.6 44.3 9
mixed - g/day / ml/day?/day
HQ01151 Butter g/day 17.9 14.0 2048 17.3 18.5 19.3 23.7 711 17.6 21.1HQ01152 Margarine and other vegetable fats g/day 22.6 17.5 3400 22.0 23.1 35.4 41.7 2548 33.7 37.0HQ01153 Olive oil ml/day 19.2 18.7 504 17.5 20.8 23.8 30.1 243 20.0 27.6 10HQ01154 Edible oils ml/day 42.1 48.6 888 38.9 45.3 29.3 43.2 304 24.4 34.1 10HQ01155 Other edible animal fats g/day 17.3 23.6 315 14.7 19.9 25.9 33.6 53 16.9 34.9HQ0116 Fruit (ND) g/day 194.0 219.1 3179 186.4 201.7HQ01161 Citrus fruits (fresh, chilled or frozen) g/day 45.1 49.5 3018 43.3 46.9 63.6 94.6 2027 59.5 67.8HQ01162 Bananas (fresh, chilled or frozen) g/day 47.4 40.9 4348 46.2 48.6 54.6 55.5 2212 52.3 56.9HQ01163 Apples (fresh, chilled or frozen) g/day 42.5 42.1 3686 41.1 43.9 56.7 69.9 2304 53.8 59.6HQ01164 Pears (fresh, chilled or frozen) g/day 27.7 24.6 1527 26.4 28.9 38.3 40.8 900 35.6 40.9HQ01165 Stone fruits (fresh, chilled or frozen) g/day 34.0 49.2 1999 31.9 36.2 46.8 78.1 293 37.8 55.7HQ01166 Berries (fresh, chilled or frozen) g/day 30.1 32.2 3217 29.0 31.2 91.1 210.6 534 73.2 108.9HQ01167 Other fresh, chilled or frozen fruits g/day 33.6 39.6 1798 31.8 35.5 53.2 64.3 1792 50.2 56.2HQ01168 Dried fruit g/day 18.7 24.0 2257 17.7 19.7 18.2 20.0 1662 17.3 19.2HQ01169 Preserved fruit and fruit based products g/day 25.1 30.6 1343 23.5 26.8 26.7 24.6 513 24.6 28.9HQ0117 Vegetables (ND) g/day 265.4 354.4 3297 253.3 277.5
HQ01171 Leaf and stem vegetables (fresh, chilled or frozen) g/day 21.6 22.5 4081 20.9 22.3 23.0 21.8 1620 21.9 24.1
HQ01172 Cabbages (fresh, chilled or frozen) g/day 35.3 35.2 3575 34.1 36.4 33.6 43.1 2100 31.8 35.5
HQ01173 Vegetables cultivated for their fruit (fresh, chilled or frozen) g/day 47.2 49.5 5044 45.9 48.6 50.5 60.9 2877 48.3 52.7
HQ01174 Root crops, non-starchy bulbs and mushrooms (fresh, chilled or frozen) g/day 63.0 61.9 5453 61.3 64.6 57.7 66.8 2831 55.3 60.2
HQ01175 Dried vegetables g/day 23.6 48.2 281 18.0 29.3 10.6 15.4 481 9.2 12.0
HQ01176 Other preserved or processed vegetables g/day 50.3 48.0 5023 49.0 51.7 3 32.3 37.0 1748 30.5 34.0
HQ01177 Potatoes g/day 112.4 134.1 4768 108.6 116.2 148.7 315.0 2269 135.8 161.7
HQ01178 Other tubers and products of tuber vegetables g/day 41.3 42.2 4463 40.1 42.5 26.2 31.1 2272 24.9 27.5
HQ01143 Preserved milk
HQ01144 Yoghurt
HQ01146 Other milk products
HQ01147 Eggs
HQ0115 Oils and fats (ND)
UK NO2005 2003-20056747 3376
Std Dev: Standard Deviation; N: number of observed households; LCL 95%: 95% Lower Confidence Limit; UCL 95%: 95% Upper Confidence Limit; Flags: 1: Not surveyed quantities; 2: Not available; 3: see list of products in Annex V; 4: No summary quantity because different measurement units for the different sub-headings; 9: estimated (see Annex V); 10: estimated by Eurostat (see Annex V)

Eurostat/Unit F5 Food consumption statistics - Results using data collected from HBS Food Safety Statistics ESTAT/F5/ES/204 Rev.1
52/57
Daily mean food availability per person (quantities purchased per person) (DFQP) Year
Surveyed households, numberCode Label and measurement unit DFQP Std Dev N LCL 95% UCL 95% flag DFQP Std Dev N LCL 95% UCL 95% flag
g/day?/day 99.6 136.3 3238 94.9 104.3
HQ01181 Sugar g/day 38.5 34.1 2122 37.0 39.9 60.9 123.1 1388 54.4 67.4HQ01182 Jams, marmalades g/day 17.2 15.6 1977 16.5 17.8 30.2 51.8 1781 27.8 32.6HQ01183 Chocolate g/day 19.0 22.6 3857 18.2 19.7 22.3 29.0 2604 21.2 23.4
g/day 11.8 13.7 2831 11.3 12.4?/day 20.3 30.0 2581 19.1 21.5g/day 29.1 38.8 1856 27.3 30.9 9
ml/day 67.7 64.6 2091 64.9 70.4g/day 11.6 10.7 538 10.7 12.5 21.4 21.4 919 20.0 22.8?/dayg/day?/day 31.3 37.9 2911 29.9 32.7g/day 30.3 27.2 4187 29.5 31.2
ml/day?/day 25.9 29.9 2294 24.7 27.1
HQ011911 Vinegar ml/dayHQ011912 Other sauces and condiments g/day
g/day 23.1 22.7 407 20.9 25.3?/dayg/day 30.2 39.2 3195 28.9 31.6 3?/day 13.6 21.6 2333 12.7 14.5g/day
unit/day?/day 18.0 10.3 2 3.6 32.3g/day 25.6 33.9 2503 24.3 26.9
ml/dayg/day 24.9 33.6 2228 23.5 26.3
ml/daymixed - g/day /
ml/day 7.4 8.6 1953 7.0 7.8
g/day 13.2 12.4 2399 12.7 13.7 3.8 7.6 619 3.2 4.4ml/dayg/day 10.7 11.7 639 9.8 11.6 15.4 13.1 408 14.2 16.7
ml/day
HQ0122 Mineral waters, soft drinks, fruit and vegetable juices (ND) ml/day 405.0 490.0 3171 387.9 422.0
HQ01221 Mineral or spring waters ml/day 137.8 201.9 1505 127.6 148.0 102.3 171.8 1052 91.9 112.7HQ01222 Soft drinks ml/day 189.6 209.1 4528 183.5 195.7 304.7 418.4 2808 289.2 320.1HQ01223 Fruit juices ml/day 229.8 241.5 4033 222.3 237.3 132.4 153.5 2429 126.3 138.5HQ01224 Vegetable juices ml/day 48.9 63.1 100 36.5 61.2 72.5 91.0 15 26.5 118.6HQ021 Alcoholic beverages ml/day 170.1 269.0 2266 159.0 181.2HQ0211 Spirits and liqueurs ml/day 42.9 43.4 1038 40.2 45.5 37.5 43.3 462 33.5 41.4HQ0212 Wine (ND) ml/day 106.8 137.5 947 98.1 115.6HQ02121 Wine from grapes or other fruit ml/day 108.4 149.4 2548 102.6 114.2 107.2 135.3 914 98.4 115.9HQ02122 Other ml/day 37.9 39.0 223 32.8 43.1 47.2 67.4 65 30.8 63.6HQ0213 Beer ml/day 193.4 226.8 1618 182.3 204.4 137.0 227.7 1956 126.9 147.1
Vegetables g/dayFruit g/day 337.0 316.5 2353 324.2 349.8 3Sugar (version "large") ml/daySugar (version "short") ml/day 413.1 320.9 3016 401.6 424.5 460.6 504.8 2109 439.1 482.1
HQ0118 Sugar, jam, honey, chocolate and confectionery (ND)
HQ01184 Confectionery products
HQ01185 Edible ices and ice cream
HQ01186 Other sugar products
HQ0119 Food products nec (ND)
HQ01191 Sauces, condiments
HQ01192 Salt, spices and culinary herbs
HQ01193 Baby food, dietary preparations, baker's yeast and other food preparations
HQ01194 Other food products nec
HQ0121 Coffee, tea and cocoa (ND)
HQ01211 Coffee
HQ01212 Tea
HQ01213 Cocoa and powdered chocolate
UK NO2005 2003-20056747 3376
Std Dev: Standard Deviation; N: number of observed households; LCL 95%: 95% Lower Confidence Limit; UCL 95%: 95% Upper Confidence Limit; Flags: 1: Not surveyed quantities; 2: Not available; 3: see list of products in Annex V; 4: No summary quantity because different measurement units for the different sub-headings; 9: estimated (see Annex V); 10: estimated by Eurostat (see Annex V)

Eurostat/Unit F5 Food consumption statistics - Results using data collected from HBS Food Safety Statistics ESTAT/F5/ES/204 Rev.1
53/57
ANNEX V: DETAILED FOOTNOTES Geo Code Label Flag Notes BE HQ0111 Bread and cereals (ND) 10 Adding up data for available sub-headings BE HQ01112 Bread 10 Adding up data for available sub-headings BE HQ01116 Other products 10 Adding up data for available sub-headings BE HQ0112 Meat (ND) 10 Adding up data for available sub-headings BE HQ0113 Fish (ND) 10 Adding up data for available sub-headings BE HQ01131 Fresh, chilled or frozen fish 10 Adding up data for available sub-headings BE HQ01133 Dried, smoked or salted fish and seafood 10 Adding up data for available sub-headings BE HQ011331 Dried, smoked or salted fatty fish 3 Includes Smoked salmon, Salmon (organic), Sardines (organic) and Tuna fish (organic)
BE HQ011340 Label not provided by Belgium, it doesn't correspond to the sum of HQ01.1.3.4.1 and HQ01.1.3.4.2; any other numerical relation among them not found
3 Relation between HQ01.1.3.4.0 with HQ01.1.3.4.1 and HQ01.1.3.4.2 not provided
BE HQ011341 Other preserved or processed fish and fish preparation: fatty fish 3 Includes Salmon, Sardines and Tuna fish
BE HQ011342 Other preserved or processed fish and fish preparations: fatty fish 3
Includes: Caviar, Sole, Other sea fish, Freshwater fish, Prawns, Mussels, Other shellfishes, crustaceans and molluscs, Caviar, Fish, w.s., Ready made fish salads, Fish-based preparations (rollmop…), Caviar (organic), Fish-based prepared dishes
BE HQ01141 Whole milk 9 Quantities provided in kg and liter. Converted into liter by Eurostat, using 1 kg = 1 liter (equivalence provided by BE)
BE HQ01146 Other milk products 9 Quantities provided in kg and liter. Converted into kg by Eurostat, using 1 kg = 1 liter (equivalence provided by BE)
BE HQ01147 Eggs 9 Quantities provided in unit and kg only for one household. Converted into unit by Eurostat, using 1kg = 8,33 units (equivalence provided by BE)
BE HQ01191 Sauces, condiments 9 Quantities provided in kg and liter. Converted into kg by Eurostat, using 1 kg = 1 liter (equivalence provided by BE)
BE HQ01211 Coffee 9 Quantities provided in kg and liter. Converted into kg by Eurostat, using 1 kg = 1 liter (equivalence provided by BE)
BE HQ01221 Mineral or spring water 9 Quantities provided in kg and liter. Converted into liter by Eurostat, using 1 kg = 1 liter (equivalence provided by BE)
BE HQ01222 Soft drinks 9 Quantities provided in kg and liter. Converted into liter by Eurostat, using 1 kg = 1 liter (equivalence provided by BE)
BE HQ01223 Fruit juices 9 Quantities provided in kg and liter. Converted into liter by Eurostat, using 1 kg = 1 liter (equivalence provided by BE)
BG HQ0111 Bread and cereals (ND) 10 Adding up data for available sub-headings BG HQ0112 Meat (ND) 10 Adding up data for available sub-headings BG HQ0113 Fish (ND) 10 Adding up data for available sub-headings BG HQ01141&2 Whole and low fat milk 3 Data available for whole and low fat milk (01141+01142)
BG HQ01171_HQ01176&HQ01178&HQ01224 Vegetables 3 Adding up items from HQ01171 to HQ01176 plus HQ01178 plus HQ01224. Expressed in kg
including "Vegetable juices" converted into kg by Eurostat using 1 kg = 1liter
BG HQ01161_HQ01169&HQ01224 Fruit 3 Adding up products from HQ01161 to H01169 plus HQ01223. Expressed in kg including "Fruit juices" converted into kg by Eurostat using 1 kg = 1 liter
BG HQ01211_HQ01213&HQ01222&HQ01223&HQ01141_HQ01143 Sugar (version "large") 3 Expressed in liter including "Coffee", "Tea", "Cocoa and powdered chocolate" and "Preserved
milk" converted into liter by Eurostat using 1 kg = 1 liter
EE HQ01171_HQ01176&HQ01178&HQ01224 Vegetables 3 Adding up items from HQ01171 to HQ01176 plus HQ01178 plus HQ01224. Expressed in kg
including "Vegetable juices" converted into kg by Eurostat using 1 kg = 1 liter
EE HQ01161_HQ01169&HQ01224 Fruit 3 Adding up products from HQ01161 to H01169 plus HQ01223. Expressed in kg including "Fruit juices" converted into kg by Eurostat using 1 kg = 1 liter
EE HQ01211_HQ01213&HQ01222&HQ01223&HQ01141_HQ01143 Sugar (version "large") 3 Expressed in liter including "Coffee", "Tea", "Cocoa and powdered chocolate" and "Preserved
milk" converted into liter by Eurostat using 1 kg = 1 liter
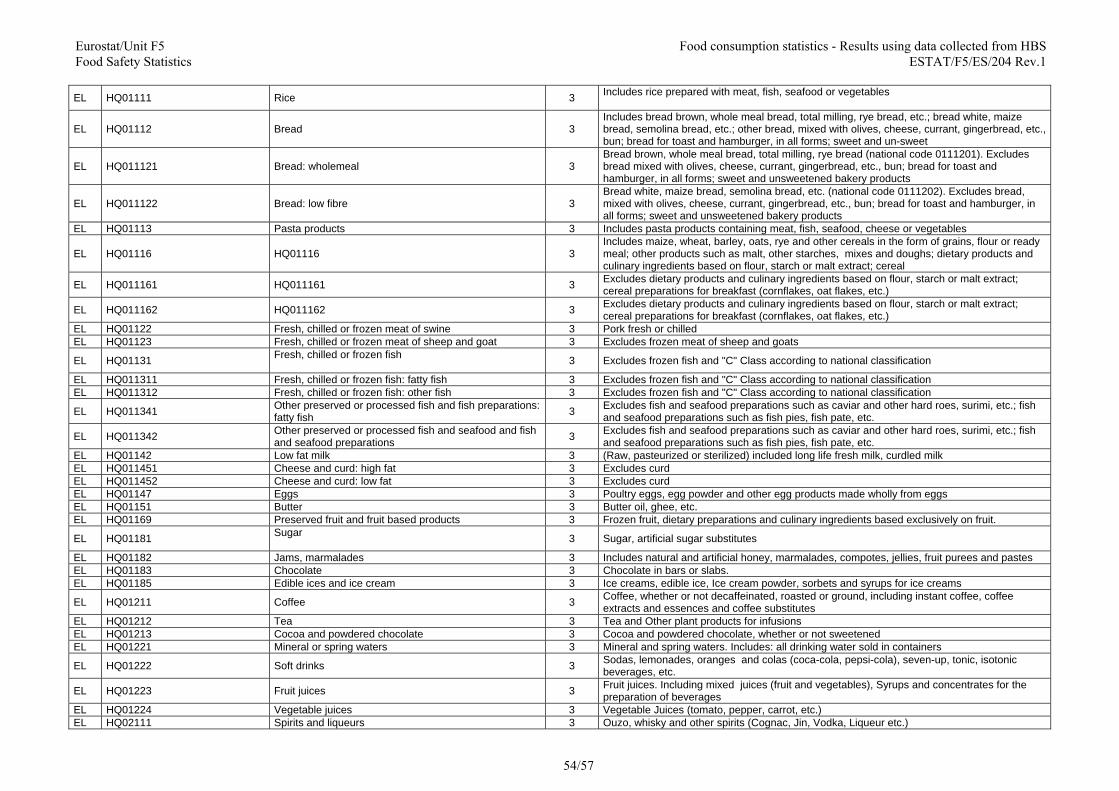
Eurostat/Unit F5 Food consumption statistics - Results using data collected from HBS Food Safety Statistics ESTAT/F5/ES/204 Rev.1
54/57
EL HQ01111 Rice 3 Includes rice prepared with meat, fish, seafood or vegetables
EL HQ01112 Bread 3 Includes bread brown, whole meal bread, total milling, rye bread, etc.; bread white, maize bread, semolina bread, etc.; other bread, mixed with olives, cheese, currant, gingerbread, etc., bun; bread for toast and hamburger, in all forms; sweet and un-sweet
EL HQ011121 Bread: wholemeal 3 Bread brown, whole meal bread, total milling, rye bread (national code 0111201). Excludes bread mixed with olives, cheese, currant, gingerbread, etc., bun; bread for toast and hamburger, in all forms; sweet and unsweetened bakery products
EL HQ011122 Bread: low fibre 3 Bread white, maize bread, semolina bread, etc. (national code 0111202). Excludes bread, mixed with olives, cheese, currant, gingerbread, etc., bun; bread for toast and hamburger, in all forms; sweet and unsweetened bakery products
EL HQ01113 Pasta products 3 Includes pasta products containing meat, fish, seafood, cheese or vegetables
EL HQ01116 HQ01116 3 Includes maize, wheat, barley, oats, rye and other cereals in the form of grains, flour or ready meal; other products such as malt, other starches, mixes and doughs; dietary products and culinary ingredients based on flour, starch or malt extract; cereal
EL HQ011161 HQ011161 3 Excludes dietary products and culinary ingredients based on flour, starch or malt extract; cereal preparations for breakfast (cornflakes, oat flakes, etc.)
EL HQ011162 HQ011162 3 Excludes dietary products and culinary ingredients based on flour, starch or malt extract; cereal preparations for breakfast (cornflakes, oat flakes, etc.)
EL HQ01122 Fresh, chilled or frozen meat of swine 3 Pork fresh or chilled EL HQ01123 Fresh, chilled or frozen meat of sheep and goat 3 Excludes frozen meat of sheep and goats
EL HQ01131 Fresh, chilled or frozen fish 3 Excludes frozen fish and "C" Class according to national classification
EL HQ011311 Fresh, chilled or frozen fish: fatty fish 3 Excludes frozen fish and "C" Class according to national classification EL HQ011312 Fresh, chilled or frozen fish: other fish 3 Excludes frozen fish and "C" Class according to national classification
EL HQ011341 Other preserved or processed fish and fish preparations: fatty fish 3 Excludes fish and seafood preparations such as caviar and other hard roes, surimi, etc.; fish
and seafood preparations such as fish pies, fish pate, etc.
EL HQ011342 Other preserved or processed fish and seafood and fish and seafood preparations 3 Excludes fish and seafood preparations such as caviar and other hard roes, surimi, etc.; fish
and seafood preparations such as fish pies, fish pate, etc. EL HQ01142 Low fat milk 3 (Raw, pasteurized or sterilized) included long life fresh milk, curdled milk EL HQ011451 Cheese and curd: high fat 3 Excludes curd EL HQ011452 Cheese and curd: low fat 3 Excludes curd EL HQ01147 Eggs 3 Poultry eggs, egg powder and other egg products made wholly from eggs EL HQ01151 Butter 3 Butter oil, ghee, etc. EL HQ01169 Preserved fruit and fruit based products 3 Frozen fruit, dietary preparations and culinary ingredients based exclusively on fruit.
EL HQ01181 Sugar 3 Sugar, artificial sugar substitutes
EL HQ01182 Jams, marmalades 3 Includes natural and artificial honey, marmalades, compotes, jellies, fruit purees and pastes EL HQ01183 Chocolate 3 Chocolate in bars or slabs. EL HQ01185 Edible ices and ice cream 3 Ice creams, edible ice, Ice cream powder, sorbets and syrups for ice creams
EL HQ01211 Coffee 3 Coffee, whether or not decaffeinated, roasted or ground, including instant coffee, coffee extracts and essences and coffee substitutes
EL HQ01212 Tea 3 Tea and Other plant products for infusions EL HQ01213 Cocoa and powdered chocolate 3 Cocoa and powdered chocolate, whether or not sweetened EL HQ01221 Mineral or spring waters 3 Mineral and spring waters. Includes: all drinking water sold in containers
EL HQ01222 Soft drinks 3 Sodas, lemonades, oranges and colas (coca-cola, pepsi-cola), seven-up, tonic, isotonic beverages, etc.
EL HQ01223 Fruit juices 3 Fruit juices. Including mixed juices (fruit and vegetables), Syrups and concentrates for the preparation of beverages
EL HQ01224 Vegetable juices 3 Vegetable Juices (tomato, pepper, carrot, etc.) EL HQ02111 Spirits and liqueurs 3 Ouzo, whisky and other spirits (Cognac, Jin, Vodka, Liqueur etc.)

Eurostat/Unit F5 Food consumption statistics - Results using data collected from HBS Food Safety Statistics ESTAT/F5/ES/204 Rev.1
55/57
EL HQ02121 Wine from grapes or other fruit 3 Wine from grape or other fruit, including cider and perry, fortified wine.
EL HQ02122 Other 3 Wine-based aperitifs, champagne and other sparkling wines, sake and the like. Included non-alcoholic wine, etc.
EL HQ0213 Beer 3 All kinds of beer
EL HQ01171(HQ01177 excluded)&HQ01224 Vegetables 3
Adding up HQ01171 ("Vegetables") - excluding "Potatoes"(HQ01177) - and "Vegetable juices" (HQ01224). Expressed in kg including "Vegetable juices" converted into kg by Eurostat using 1 kg = 1 liter
EL HQ0116&HQ01223 Fruit 3 Adding up "Fruit" (HQ0116) and "Fruit juices" (HQ01223). Expressed in kg including "Fruit juices" converted into kg by Eurostat using 1 kg = 1 liter
ES HQ0111 Bread and cereals (ND) 3 Excludes HQ01114, HQ01115 and HQ01116 (not collected) ES HQ01176 Other preserved or processed vegetables 3 Includes also all kind of frozen vegetables, which are not coded under their specific headings
ES HQ0119 Food products n.e.c. (ND) 3 Excludes HQ01194 (not collected)
ES HQ01193 Baby food, dietary preparations, baker's yeast and other food preparations 3 Includes only baker's yeast and other food preparations such as dessert preparations, soups,
etc. No quantities collected for baby food and dietary preparations
ES HQ01171_HQ01176&HQ01178&HQ01224 Vegetables 3 Adding up items from HQ01171 to HQ01176 plus HQ01178 plus HQ01224. Expressed in kg
including "Vegetable juices" converted into kg by Eurostat using 1 kg = 1 liter
ES HQ01161_HQ01169&HQ01224 Fruit 3 Adding up products from HQ01161 to H01169 plus HQ01223. Expressed in kg including "Fruit juices" converted into kg by Eurostat using 1 kg = 1 liter
ES HQ01211_HQ01213&HQ01222&HQ01223&HQ01141_HQ01143 Sugar (version "large") 3 Expressed in liter including "Coffee", "Tea", "Cocoa and powdered chocolate" and "Preserved
milk" converted into kg by Eurostat using 1 kg = 1 liter FR HQ01116 Other products 3 Includes sandwiches FR HQ01.1.3 Fish (ND) 10 Adding up data for available sub-headings FR HQ01132 Fresh, chilled or frozen seafood 9 Oysters were collected in units. Conversion into kg by using 1 oyster = 0.6 kg FR HQ01191 Sauces, condiments 9 Vinegar collected in litres and converted into kg by using 1 litre = 1 kg
FR HQ01193 Baby food, dietary preparations, baker's yeast and other food preparations 9 Data on soups collected in litres. Converted into kg by using 1 litre = 1 kg
FR HQ01171_HQ01176&HQ01178&HQ01224 Vegetables 3 Adding up items from HQ01171 to HQ01176 plus HQ01178 plus HQ01224. Expressed in kg
including "Vegetable juices" converted into kg by Eurostat using 1 kg = 1 liter
FR HQ01161_HQ01169&HQ01224 Fruit 3 Adding up products from HQ01161 to H01169 plus HQ01223. Expressed in kg including "Fruit juices" converted into kg by Eurostat using 1 kg = 1 liter
FR HQ01211_HQ01213&HQ01222&HQ01223&HQ01141_HQ01143 Sugar (version "large") 3 Expressed in liter including "Coffee", "Tea", "Cocoa and powdered chocolate" and "Preserved
milk" converted into liter by Eurostat using 1 kg = 1 liter LV HQ0111 Bread and cereals (ND) 10 Adding up data for available sub-headings LV HQ0112 Meat (ND) 10 Adding up data for available sub-headings LV HQ0113 Fish (ND) 10 Adding up data for available sub-headings
LV HQ01171_HQ01176&HQ01178&HQ01224 Vegetables 3 Adding up items from HQ01171 to HQ01176 plus HQ01178 plus HQ01224. Expressed in kg
including "Vegetable juices" converted into kg by Eurostat using 1 kg = 1 liter
LV HQ01161_HQ01169&HQ01224 Fruit 3 Adding up products from HQ01161 to H01169 plus HQ01223. Expressed in kg including "Fruit juices" converted into kg by Eurostat using 1 kg = 1 liter
LV HQ01211_HQ01213&HQ01222&HQ01223&HQ01141_HQ01143 Sugar (version "large") 3 Expressed in liter including "Coffee", "Tea", "Cocoa and powdered chocolate" and "Preserved
milk" converted into liter by Eurostat using 1 kg = 1 liter LT HQ0111 Bread and cereals (ND) 10 Adding up data for available sub-headings LT HQ0112 Meat (ND) 10 Adding up data for available sub-headings
LT HQ0113 Fish (ND) 10 Adding up data for available sub-headings
LT HQ01171_HQ01176&HQ01178&HQ01224 Vegetables 3 Adding up items from HQ01171 to HQ01176 plus HQ01178 plus HQ01224. Expressed in kg
including "Vegetable juices" converted into kg by Eurostat using 1 kg = 1 liter
LT HQ01161_HQ01169&HQ01224 Fruit 3 Adding up products from HQ01161 to H01169 plus HQ01223. Expressed in kg including "Fruit juices" converted into kg by Eurostat using 1 kg = 1 liter

Eurostat/Unit F5 Food consumption statistics - Results using data collected from HBS Food Safety Statistics ESTAT/F5/ES/204 Rev.1
56/57
LT HQ01211_HQ01213&HQ01222&HQ01223&HQ01141_HQ01143 Sugar (version "large") 3 Expressed in liter including "Coffee", "Tea", "Cocoa and powdered chocolate" and "Preserved
milk" converted into liter by Eurostat using 1 kg = 1 liter
HU HQ01171(HQ01177 excluded) &HQ01224 Vegetables 3
Adding up HQ01171 ("Vegetables") - excluding "Potatoes"(HQ01177) - and "Vegetable juices" (HQ01224). Expressed in kg including "Vegetable juices" converted into kg by Eurostat using 1 kg = 1 liter
HU HQ0116&HQ01223 Fruit 3 Adding up "Fruit" (HQ0116) and "Fruit juices" (HQ01223). Expressed in kg including "Fruit juices" converted into kg by Eurostat using 1 kg = 1 liter
MT HQ01171_HQ01176&HQ01178&HQ01224 Vegetables 3 Adding up items from HQ01171 to HQ01176 plus HQ01178 plus HQ01224. Expressed in kg
including "Vegetable juices" converted into kg by Eurostat using 1 kg = 1liter
MT HQ01161_HQ01169&HQ01224 Fruit 3 Adding up products from HQ01161 to H01169 plus HQ01223. Expressed in kg including "Fruit juices" converted into kg by Eurostat using 1 kg = 1 liter
MT HQ01211_HQ01213&HQ01222&HQ01223&HQ01141_HQ01143 Sugar (version "large") 3 Expressed in liter including "Coffee", "Tea", "Cocoa and powdered chocolate" and "Preserved
milk" converted into liter by Eurostat using 1 kg = 1 liter
PL HQ01171_HQ01176&HQ01178&HQ01224 Vegetables 3 Adding up items from HQ01171 to HQ01176 plus HQ01178 plus HQ01224. Expressed in kg
including "Vegetable juices" converted into kg by Eurostat using 1 kg = 1 liter
PL HQ01161_HQ01169&HQ01224 Fruit 3 Adding up products from HQ01161 to H01169 plus HQ01223. Expressed in kg including "Fruit juices" converted into kg by Eurostat using 1 kg = 1 liter
PL HQ01211_HQ01213&HQ01222&HQ01223&HQ01141_HQ01143 Sugar (version "large") 3 Expressed in liter including "Coffee", "Tea", "Cocoa and powdered chocolate" and "Preserved
milk" converted into liter by Eurostat using 1 kg = 1 liter
RO HQ01171_HQ01176&HQ01178&HQ01224 Vegetables 3 Adding up items from HQ01171 to HQ01176 plus HQ01178 plus HQ01224. Expressed in kg
including "Vegetable juices" converted into kg by Eurostat using 1 kg = 1 liter
RO HQ01161_HQ01169&HQ01224 Fruit 3 Adding up products from HQ01161 to H01169 plus HQ01223. Expressed in kg including "Fruit juices" converted into kg by Eurostat using 1 kg = 1 liter
RO HQ01211_HQ01213&HQ01222&HQ01223&HQ01141_HQ01143 Sugar (version "large") 3 Expressed in liter including "Coffee", "Tea", "Cocoa and powdered chocolate" and "Preserved
milk" converted into liter by Eurostat using 1 kg = 1 liter
SI HQ01171_HQ01176&HQ01178&HQ01224 Vegetables 3 Adding up items from HQ01171 to HQ01176 plus HQ01178 plus HQ01224. Expressed in kg
including "Vegetable juices" converted into kg by Eurostat using 1 kg = 1 liter
SI HQ01161_HQ01169&HQ01224 Fruit 3 Adding up products from HQ01161 to H01169 plus HQ01223. Expressed in kg including "Fruit juices" converted into kg by Eurostat using 1 kg = 1 liter
SI HQ01211_HQ01213&HQ01222&HQ01223&HQ01141_HQ01143 Sugar (version "large") 3 Expressed in liter including "Coffee", "Tea", "Cocoa and powdered chocolate" and "Preserved
milk" converted into liter by Eurostat using 1 kg = 1 liter
SK HQ01171_HQ01176&HQ01178&HQ01224 Vegetables 3 Adding up items from HQ01171 to HQ01176 plus HQ01178 plus HQ01224. Expressed in kg
including "Vegetable juices" converted into kg by Eurostat using 1 kg = 1 liter
SK HQ01161_HQ01169&HQ01224 Fruit 3 Adding up products from HQ01161 to H01169 plus HQ01223. Expressed in kg including "Fruit juices" converted into kg by Eurostat using 1 kg = 1 liter
SK HQ01211_HQ01213&HQ01222&HQ01223&HQ01141_HQ01143 Sugar (version "large") 3 Expressed in liter including "Coffee", "Tea", "Cocoa and powdered chocolate" and "Preserved
milk" converted into liter by Eurostat using 1 kg = 1 liter
FI HQ01114 Pastry-cook products 3 Includes: Pizzas, hamburgers, crepes; Savoury pies, pasties and sandwiches; Cakes and pastries
FI HQ01116 Other products 3 Includes: Other bakery products; Flour, groats, cereals and grain snacks; Other grain products
FI HQ01126 Other preserved or processed meat and meat preparations 3
Includes: Meat preserves; Other preserved meat preparations; Cabbage rolls; Meat cabbage and meat potato casseroles, etc.; Meat balls, ground beef patties; Salads, ready-to-eat and frozen soups of meat; Salads, ready-to-eat and frozen soups of meat; Blood
FI HQ01127 Other fresh, chilled or frozen edible meat 3 Includes: Meat of reindeer; Other meat and game; Other meat and game; Liver and kidneys; Blood, tongue, bone, knuckle, etc.; Minced meat; Mixed meat for Karelian stew; Meat n.e.c.
FI HQ01152 Margarine and other vegetable fats 3 Includes also other edible animals fats FI HQ01154 Edible oils 3 Includes also Olive oil FI HQ01186 Other sugar products 3 Includes Syrup
FI HQ01171_HQ01176&HQ01178&HQ01224 Vegetables 3 Adding up items from HQ01171 to HQ01176 plus HQ01178 plus HQ01224. Expressed in kg
including "Vegetable juices" converted into kg by Eurostat using 1 kg = 1 liter

Eurostat/Unit F5 Food consumption statistics - Results using data collected from HBS Food Safety Statistics ESTAT/F5/ES/204 Rev.1
57/57
FI HQ01161_HQ01169&HQ01224 Fruit 3 Adding up products from HQ01161 to H01169 plus HQ01223. Expressed in kg including "Fruit juices" converted into kg by Eurostat using 1 kg = 1 liter
FI HQ01211_HQ01213&HQ01222&HQ01223&HQ01141_HQ01143 Sugar (version "large") 3 Expressed in liter including "Coffee", "Tea", "Cocoa and powdered chocolate" and "Preserved
milk" converted into liter by Eurostat using 1 kg = 1 liter
UK HQ01116 Other products 3 Coded as HQ01115 although it includes: other cereals, cereal snacks, infant cereal foods, high fibre breakfast cereals, muesli, sweetened breakfast cereals, flour, oatmeal and oat products, other breakfast cereals and all canned milk puddings
UK HQ01146 Other milk products 3 Included non-dairy milk substitutes UK HQ01176 Other preserved or processed vegetables 3 Includes Soya and novel protein foods
UK HQ01193 Baby food, dietary preparations, baker's yeast and other food preparations 3 Includes Stock cubes and meat and yeast extracts
NO HQ0115 Oils and fats (ND) 9 Oil is converted into kg when aggregated, using 1 liter = 0.9 kg NO HQ01153 Olive oil 10 Converted into liter by Eurostat, using 1 liter = 0,9 kg NO HQ01154 Edible oils 10 Converted into liter by Eurostat, using 1 liter = 0,9 kg NO HQ01185 Edible ices and ice cream 9 Edible ices and ice cream is converted into kg when aggregated, using 1 liter = 1.03 kg
NO HQ0116&HQ01223 Fruit 3 Adding up "Fruit" (HQ0116) and "Fruit juices" (HQ01223). Expressed in kg including "Fruit juices" converted into kg by Eurostat using 1 kg = 1 liter