disability data review: a collation and analysis of ... · for better data, to ensure that all...
TRANSCRIPT
Disability Data Review: A collation and analysis of disability data from 40 countries
2
This report is authored by Leonard Cheshire and funded by UK aid. It was produced for the Global Disability Summit held in London, UK in July 2018. We are grateful for the support and guidance of the Disability Inclusion Team at the UK Department for International Development, especially Frances Wood and Joanna McGilvray.
The Leonard Cheshire Team was led by Professor Nora Ellen Groce (Director, Leonard Cheshire Research Centre) and Dr. Ola Abu Alghaib (Director, Global Influencing and Research).
The report was written by Natalie Julie Simeu (PhD Candidate), Emma Bird (Project Co-ordinator), Dr. Dan Mont and with inputs from Harriet Knowles (Programme Development and Funding Specialist), Dr. Mark Carew (Junior Research Fellow) and Kate Turner (Policy Manager – International). Lucy Bentley (Writer and Editor) provided support with editing and finalisation.
We would also like to thank Gavin Salmon (Global Head of International Resourcing and Development) and Gemma Pedder (Digital Manager) for leading on the development of the Disability Data Portal and the digital agency LiquidLight for providing the final digital product.
The report was also guided by the Independent Advisory Group for the project, which included Professor Sophie Mitra (Fordham University), Dr. Mitchel Loeb (Washington Group), Margaret Mbogoni (United Nations Statistics Division), Dr. Islay MacTaggart (London School of Hygiene and Tropical Medicine) and Dr. Morgon Banks (London School of Hygiene and Tropical Medicine).
We would like to thank the above individuals and the agencies that provided us with data for use in this report, including international organisations and the various national statistics offices that we engaged with, such as: • The International Labour Organisation • The Central Statistical Office of Saint Lucia• The World Bank• Statistics South Africa• Pakistan Bureau of Statistics• National Centre for Promotion of Employment for Disabled People India• Zimbabwe Ministry of Health and Child Care
Acknowledgements
3
Disability Data Review
ForewordAn estimated 1 billion people around the world have a disability. We know that all too often, people with disabilities face appalling stigma, discrimination and abuse. We know that people with disabilities are often excluded from opportunities, so do not achieve their potential. We know that our societies miss out.
But in too many cases, we do not know the scale of the challenge, where the gaps are, and where more needs to be done. We do not know where children with disabilities are missing out on the chance to go to school, or where people are unable to access work. For too long, data sources have been too scattered and disaggregation by disability has been overlooked. Where the data does exist, it often remains hidden and unused. While this is happening, people with disabilities will continue to be excluded, and we will be left with a critical development gap.
On 24th July 2018, people with disabilities, governments, donors, the private sector and civil society will come together at the Global Disability Summit, hosted by the UK, the International Disability Alliance and the Government of Kenya.
The Summit is a huge opportunity to deliver lasting change for people with disabilities. Improving disability data will be integral to success, and crucial to ensure that the commitments made in the Sustainable Development Goals are met and that we ‘leave no one behind’.
That is why I am proud that UK aid has supported Leonard Cheshire to create a brand new Disability Data Portal, to bring together data from countries across the world in one place. The portal and this accompanying report provide an important snapshot of the situation for people with disabilities in the critical areas of inclusive education, economic empowerment, technology and innovation, and stigma and discrimination. It shows us what it is possible to learn from the data we already have, and where we need more data to build a clearer picture.
It will be a valuable resource as we work together to lead a global charge for better data, to ensure that all people with disabilities, no matter who they are or where they are, are truly included.
Rt Hon Penny Mordaunt MPSecretary of State for International Development
4
5
Disability Data Review
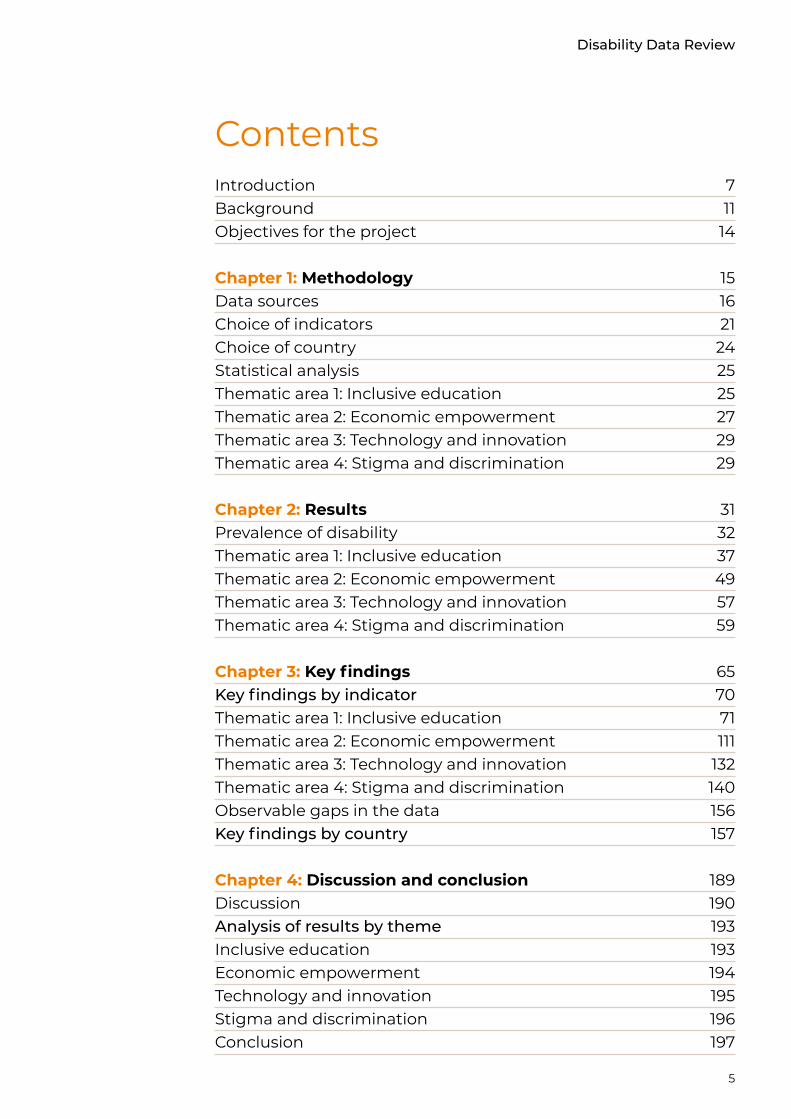
Introduction 7Background 11Objectives for the project 14
Chapter 1: Methodology 15Data sources 16Choice of indicators 21Choice of country 24Statistical analysis 25Thematic area 1: Inclusive education 25Thematic area 2: Economic empowerment 27Thematic area 3: Technology and innovation 29Thematic area 4: Stigma and discrimination 29
Chapter 2: Results 31Prevalence of disability 32Thematic area 1: Inclusive education 37Thematic area 2: Economic empowerment 49Thematic area 3: Technology and innovation 57Thematic area 4: Stigma and discrimination 59
Chapter 3: Key findings 65Key findings by indicator 70Thematic area 1: Inclusive education 71Thematic area 2: Economic empowerment 111Thematic area 3: Technology and innovation 132Thematic area 4: Stigma and discrimination 140Observable gaps in the data 156Key findings by country 157
Chapter 4: Discussion and conclusion 189Discussion 190Analysis of results by theme 193Inclusive education 193Economic empowerment 194Technology and innovation 195Stigma and discrimination 196Conclusion 197
Contents
6
References 201Appendices 205
Annex 221Annex 1: Methodology 222Thematic area 1: Inclusive education 222Thematic area 2: Economic empowerment 227Thematic area 3: Technology and innovation 230Thematic area 4: Stigma and discrimination 231Annex 2: Methodological limitations 233
7
Disability Data Review
The Disability Data Portal provides a snapshot of the data that is globally available on people with disabilities1. With UK aid funding from the UK Government, Leonard Cheshire has developed a framework and collected an initial body of international data. This provides an overview of the current disability data landscape and identifies where there are current gaps in bodies of data, particularly in light of the indicators linked to the Sustainable Development Goals (SDGs)2 and the UN Convention on the Rights of People with Disabilities (UNCRPD).3
Findings from this project will be freely and publicly available to all through the Disability Data Portal Project Website [www.disabilitydataportal.com] which was developed in conjunction with the Global Disability Summit on 24 July 2018. This report provides background on the project itself and discusses at greater length the findings, limitations and potential next steps needed to fill the gaps in global disability data.
According to the World Report on Disability4, some 1 billion people – amounting to 15% of the world’s population – have a disability. An estimated 800 million of these people live in developing countries. People with disabilities are more likely to experience adverse socioeconomic outcomes than people without disabilities, such as less education, poorer health, lower levels of employment, and higher poverty rates (Mitra et al 2013; Yeo and Moore 2003). Both the UNCRPD and the 2030 Agenda for Sustainable Development state that disability cannot be a reason for exclusion from development processes or the realisation of human rights. To achieve disability inclusion, realise human rights and meet the targets outlined in the SDGs, laws need to be inclusive and policy implementation must be underpinned by data.
Yet until recently, systemic collection and analysis of statistics related to people with disabilities was largely overlooked (Altman 2016). Collection of disability related data remains an issue, with varying awareness of and commitment to data collection efforts
1. This project uses the definition of disability as defined by the United Nations Convention on the Rights of People with Disabilities – “People with disabilities include those who have long-term physical, mental, intellectual or sensory impairments which in interaction with various barriers may hinder their full and effective participation in society on an equal basis with others.”
2. www.un.org/sustainabledevelopment/sustainable-development-goals
3. www.un.org/development/desa/disabilities/convention-on-the-rights-of-persons-with-disabilities.html
4. www.who.int/disabilities/world_report/2011/en
Introduction

8
by UN agencies, government and civil society; ongoing debates about methodologies; and limited analysis and uptake of information being used to inform policy, practice and advocacy (Me and Mbogoni 2006; WHO and World Bank 2011).5 This lack of data reflects the low priority that disability has received within the global development community. There is a lack of political will to acknowledge and address the real situation of people with disabilities and the resourcing implications this brings (WHO and World Bank 2011). Consequently, the precise number and composition of people with disabilities in many settings is unknown (for example in terms of age and gender), and as a result there is a lack of knowledge about the barriers that they face and how to address them.
However, over the past 15 years there has been a viable and growing effort at the international, national and provincial or district levels to collect data on people with disabilities (Golden 2016). This growing body of data has been spurred on by factors including data collection provisions in the UNCPRD – (now ratified by over 170 countries) – and inclusion of disability within the SDGs with their call to ‘leave no one behind’. This new momentum has been facilitated by the development of validated tools for measuring disability status, particularly the Washington Group Questions (See Appendix 1 for the Washington Group Short Set of Questions on Disability).6
Unfortunately, much of this growing body of data remains difficult to find, use and compare because it is collected through a range of national censuses, surveys, studies and reviews and is not consistently analysed and published. While the prioritisation of disability disaggregation is a fairly new addition to the international development agenda, a great deal of data on people with disabilities does already exist. For example, a 2015 review by Cappa et al. identified over 700 existing surveys or censuses from 198 countries which asked questions on disability. The review also identified that disability data collection has intensified over the past few decades but the quality and comparability of that data has often been problematic.
However, UN agencies such as the World Health Organisation (WHO), UNICEF, the International Labour Organisation (ILO) and the World Bank are beginning to routinely compile better
5. www.washingtongroup-disability.com
6. www.washingtongroup-disability.com/washington-group-question-sets/short-set-of-disability-questions
9
Disability Data Review
quality disability related data through many of their data collection efforts. USAID’s Demographic and Health Survey (DHS) now also includes an optional disability module based on the Washington Group questions7 and UNICEF’s Multiple Indicator Cluster Surveys (MICS) will include a module based on Washington Group questions for all countries participating in the latest survey round. In addition, a growing number of non-governmental organisations (NGOs) and other civil society organisations now collect disability data as part of their wider development efforts. This is in part encouraged by major donors such as DFID and the Australian Department of Foreign Affairs and Trade (DFAT) stipulating that disability should be included in funded activities (Leonard Cheshire, forthcoming).
This growth in information is promising. However, lack of consistency, differences in methodology, and limited analysis and dissemination of collected disability data often make it difficult for this data to be fully used – whether at national levels to improve inclusion of people with disabilities, for international purposes of cross-country comparisons, or to provide global overviews of progress and gaps.
With the establishment of the Washington Group in 2002, and the increasing visibility of disability data on the agenda of international meetings (such as the 2017 and 2018 World Data Forum, and the 2018 Conference of States Parties), the importance of improving the amount and accuracy of global disability-related data is increasingly being championed on the international development agenda. However, there remains a common misconception in the international development community, national governments and global civil society, that little accurate data on disability currently exists (WHO and World Bank 2011; Yeo and Moore 2003). This assumed lack of data or lack of accurate data continues to be given as the justification for failure to proactively include people with disabilities in development efforts.
The Disability Data Portal Project aims to address this gap. The project has been undertaken by a research team at the Leonard Cheshire Research Centre at University College London, working with a team of experts in global disability data, overseen by an Independent Advisory Board.
7. US AID – https://dhsprogram.com
10
This report was developed to inform dialogue at the 2018 Global Disability Summit. It provides an overview of the project to date, with a review of the objectives, methods and findings for 16 indicators across 40 countries. The purpose of the report is to identify sources of available data and existing data gaps, and understand how the growing body of available disability data can be disaggregated by disability to support monitoring and evaluation efforts for SDG-related goals, targets and indicators.
The Disability Data Portal Project has two outputs:
1. Collated and analysed data will be uploaded as disaggregated statistics with interactive visualisations on an online portal: www.disabilitydataportal.com. This portal will provide a snapshot of what data is available and examples of how to analyse this information in an SDG framework.
2. This report and a summary report, which will also be available online through the portal, sets out our data collation process and provides details of the analysis, limitations and gaps in current disability data collection.
This is the first phase of an ongoing project for Leonard Cheshire. It is important to note that the surveys analysed in this project, featured on the portal and discussed in this report, are not a definitive list of disability data sources. We have largely focused this review on census and population/demographic survey information, and supplemented this microdata with a review of secondary sources. This portal is intended to be open source – a collaborative resource to be used widely by international agencies, governments, civil society and researchers. A longer-term aim of the project is to expand the data portal to include information on all countries, providing an easy to access, accurate source of disability data at national levels, for the purposes of further secondary data analysis.
This project underscores the fact that we can no longer maintain the assumption that “there is no data.” It provides a framework to show the global community how existing information can be accessed and analysed. In conjunction with latest analysis from the Washington Group on Disability Statistics and the UN Statistics Division (UNSD), it promises to help provide a growing body of disability data that can be easily accessed and analysed.
11
Disability Data Review
People with disabilities make up a significant proportion of the world’s population, with estimates that 80% of this population live in developing countries (WHO and World Bank 2011). Many people with disabilities do not experience access to education, employment, healthcare and social protection on an equitable basis to people without disabilities, despite possessing the same human rights as all other people (Mizunoya et al., 2018; Mizunoya & Mitra, 2013; WHO, 2011). For example, a recent survey indicated that between 76% and 85% of people in developing countries with serious mental disorders had received no treatment in the year prior to the study (WHO, 2018). Children with disabilities face multiple forms of discrimination, leading to their exclusion from school (UNICEF, 2012). This means adults with disabilities are far less likely than those without disabilities to have attained even minimal literacy (Groce and Bakshi, 2009). People with disabilities also face disproportionate social isolation, prejudice and stigma (Groce et al 2014) and are far more vulnerable to violence in their everyday lives (Neille and Penn, 2017).
Barriers to the participation of people with disabilities in these domains can be driven by a range of factors including a lack of accessible services, inaccessible physical environments, and inadequate skills and understanding among professionals such as healthcare workers and teachers (Eide at el, 2015). Prejudice and stigma are also cross-cutting barriers that contribute to the lack of equity experienced by people with disabilities, as well as their disproportionate social isolation (Groce et al 2014). Moreover, disability is both a cause and consequence of poverty, and people with disabilities often experience considerably higher rates of socio-economic disadvantage (Braithwaite and Mont, 2009) and lower rates of employment (Manit, Mitra and Sambamoorthi, forthcoming; Mizunoya and Mitra, 2013). Globally there are widespread examples of the extreme economic exploitation of people with disabilities (Ingstad and Eide, 2011).
This means that the barriers to equitable access that people with disabilities face are often exacerbated within low- and middle-income settings. However, despite a greater need, people with disabilities are often excluded from international humanitarian and aid efforts. (Groce and Kett 2014). This is compounded by a lack of accessible, good quality disability data. This means that
Background
12
developing a full understanding of the barriers to equitable access and, consequently, the inclusion of people with disabilities in society, is currently difficult to achieve.
In 2015, the world came together and signed up to the SDGs, an ambitious agenda for global development for the next 15 years. Through ‘Agenda 2030’, governments have committed to supporting ‘accountability to our citizens’ and promised a follow-up and review framework that is ‘open, inclusive, participatory and transparent for all people’. This means that representatives of people with disabilities and Disabled Peoples Organisations (DPOs) should be actively included in both implementation and reporting, gathering the required evidence to reflect the realities of people with disabilities and inform future policy and development reforms.
The SDGs include a commitment to ‘leave no one behind’, and are universal, applicable to all countries, and directly relate to disability. Disability is explicitly included in seven targets under five goals (Appendix 2):
• Goal 4 seeks inclusive and equitable quality education and promotion of life-long learning opportunities for all. It focuses on eliminating gender disparities in education and ensuring equal access to all levels of education and vocational training for the vulnerable, including people with disabilities. In addition, it calls for building and upgrading education facilities that are child, disability and gender sensitive and also provide safe, non-violent, inclusive and effective learning environments for all.
• Goal 8 promotes sustained, inclusive and sustainable economic growth, full and productive employment and decent work for all. The international community aims to achieve full and productive employment and decent work for all women and men, including for people with disabilities, and equal pay for work of equal value.
• Goal 10 strives to reduce inequality within and among countries by empowering and promoting the social, economic and political inclusion of all, including people with disabilities.
• Goal 11 seeks to create accessible cities and water resources, affordable, accessible and sustainable transport systems, providing universal access to safe, inclusive, accessible and green public spaces.
13
Disability Data Review
• Goal 17 underlines the importance of data collection and monitoring of the SDGs, with an emphasis on disability disaggregated data.
To achieve the SDGs, governments and decision-makers must be able to understand, track, and monitor progress of implementation. However, data and evidence about people with disabilities remains insufficient and scattered. Disaggregation by disability is still a notable gap in both national and global development efforts. The causes of this are complex and multifaceted, and include:
1. Often data on disability is not collected. 2. When it is collected, it is sometimes of poor quality. 3. When it is collected, it usually only identifies people
disabilities and does not address barriers in the environment that may limit or preclude participation in the economic and social life of their communities.
4. When inclusive policies and programmes are enacted, it is most often the case that evaluative frameworks are not built into the process.
Compounding this lack of data, some governments and international organisations do not make the data they have publicly available due to concerns around political implications and resourcing. Collection and analysis of data by DPOs is also rare, primarily attributable to a lack of technical capacity to implement disability-inclusive policies and services, and low capacity among DPOs to collect or monitor this data (Mwendwa, et al. 2009; UN Economic and Social Council 2008).
14
This report provides insight on the ability of countries to disaggregate key development indicators by disability status. A total of 16 indicators (see table 1) have been selected for the analysis related to four thematic areas. There are five indicators relating to ‘Inclusion in education’; five indicators focused around ‘Routes to economic empowerment’; two indicators relating to ‘Harnessing technology and innovation’ and four indicators focussed on ‘Tackling stigma and discrimination’.
This report presents results based on information collated from 40 targeted countries. On average there were nine indicators estimated or obtained from published data per country. The total number of indicators available from reviewed sources ranges from one in Myanmar to 14 in Cambodia, Rwanda, Timor-Leste and Uganda (see Appendix 3).
Objectives for the project
15
Disability Data Review
Chapter 1: Methodology
15
16
The methodology for this project was to collate pre-existing sources of population level data that could be disaggregated by disability against selected SDG indicators and other priority development indicators with reasonable data availability.
In order to define the scope of the project, two key considerations for data inclusion were considered. Firstly, datasets were only included if they were from national censuses or from surveys that were representative at a national or sub-national level. Secondly, to ensure that the data used were consistent with the SDGs and the UNCRPD, only sources from 2006 onwards were analysed. However where there were significant gaps we used data from older sources, such as the World Health Survey, 2002-2004.
To maintain a defined scope, a sample of 40 countries was selected to provide an overview of the data available as well as to identify emerging gaps in current databases. As discussed in greater detail below, priority countries for the 2018 Global Disability Summit were part of the selection, with an emphasis on low/middle income countries, except for Albania. To ensure data was of the required quality, data was primarily drawn from validated sources such as Integrated Public Use Microdata Series (IPUMS)8 and Demographic and Health Surveys.
We wanted to ensure that analysis could be carried out in a clear and consistent manner. This will help to demonstrate the value of disability data for comparative purposes at international level, as well as to improve understanding of the situation for people with disabilities at national level.
Data sources
This project is structured around the priorities and focus areas of the Global Disability Summit: tackling stigma and discrimination, inclusive education, routes to economic empowerment and harnessing technology and innovation. The choice of SDG indicators, data sources and country selection was therefore undertaken within this context.
It is worth noting that this study included surveys which use a range of methodologies for enumerating disability, and has not excluded data sources based on the method for collecting
8. IPUMS (Integrated Public Use Microdata Series) is a project by the Minnesota Population Center at the University of Minnesota. IPUMS provides samples from population censuses from around the world and makes them available for public use via their website www.ipums.org/IPUMSInternational.shtml
17
Disability Data Review
disability data. This paper did not limit data selection to those which used ‘best practice’ methodologies. The most recent datasets available for the selected countries were used to highlight the range of datasets available globally, and underscore some of the current key issues in disability disaggregation.
Sources of disability data
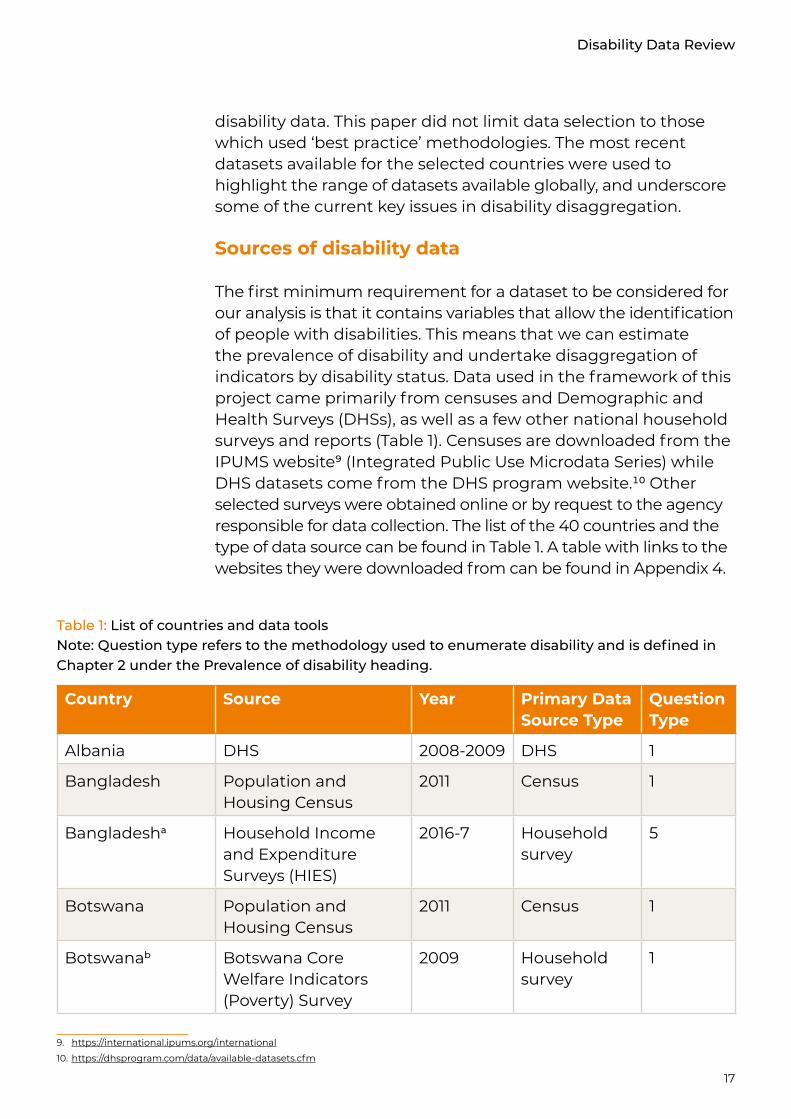
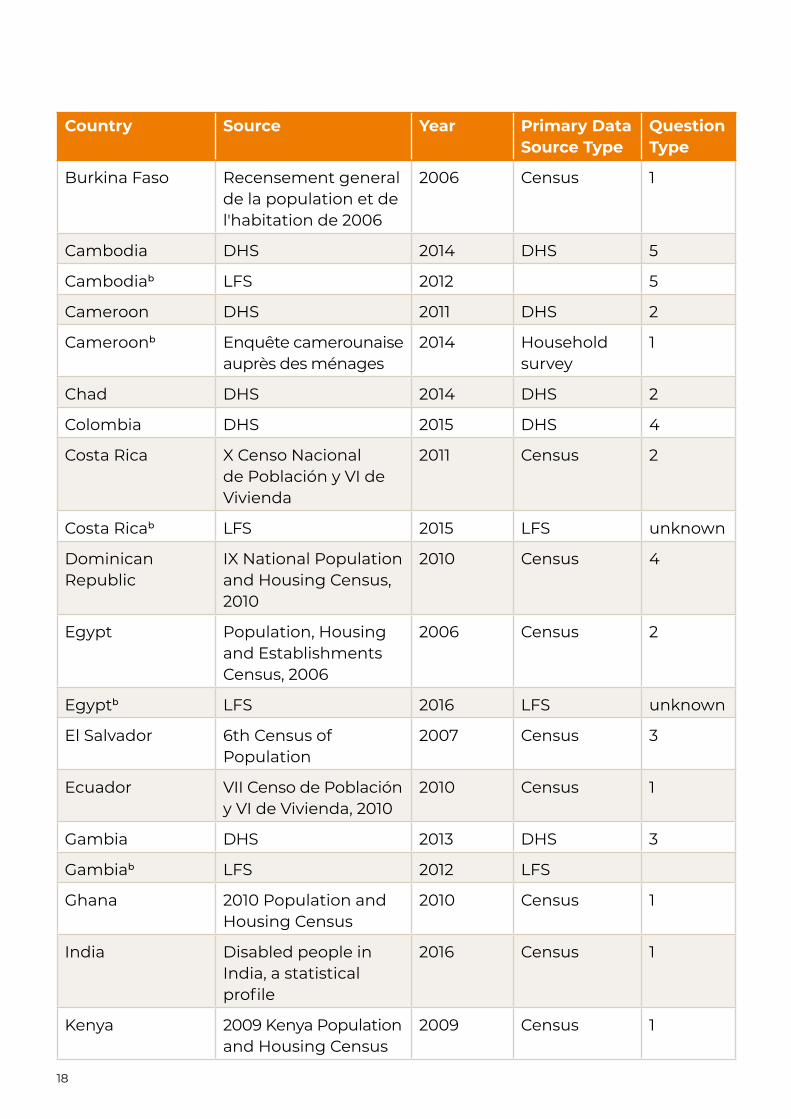
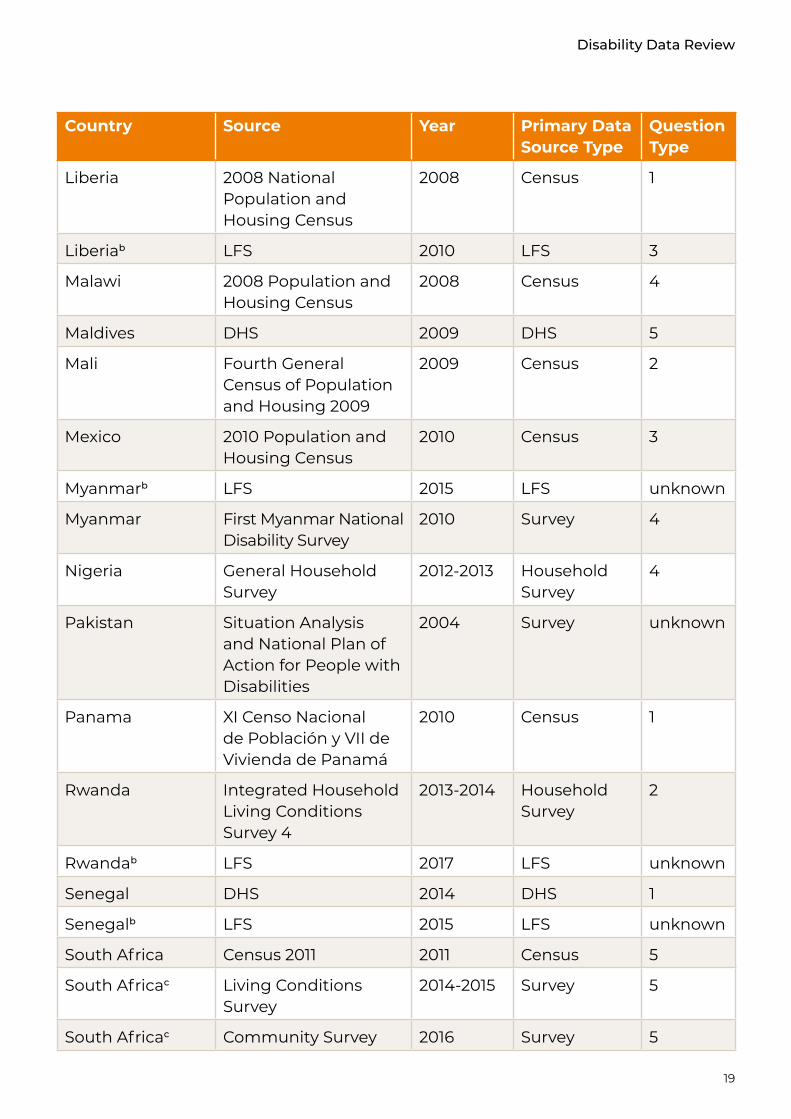
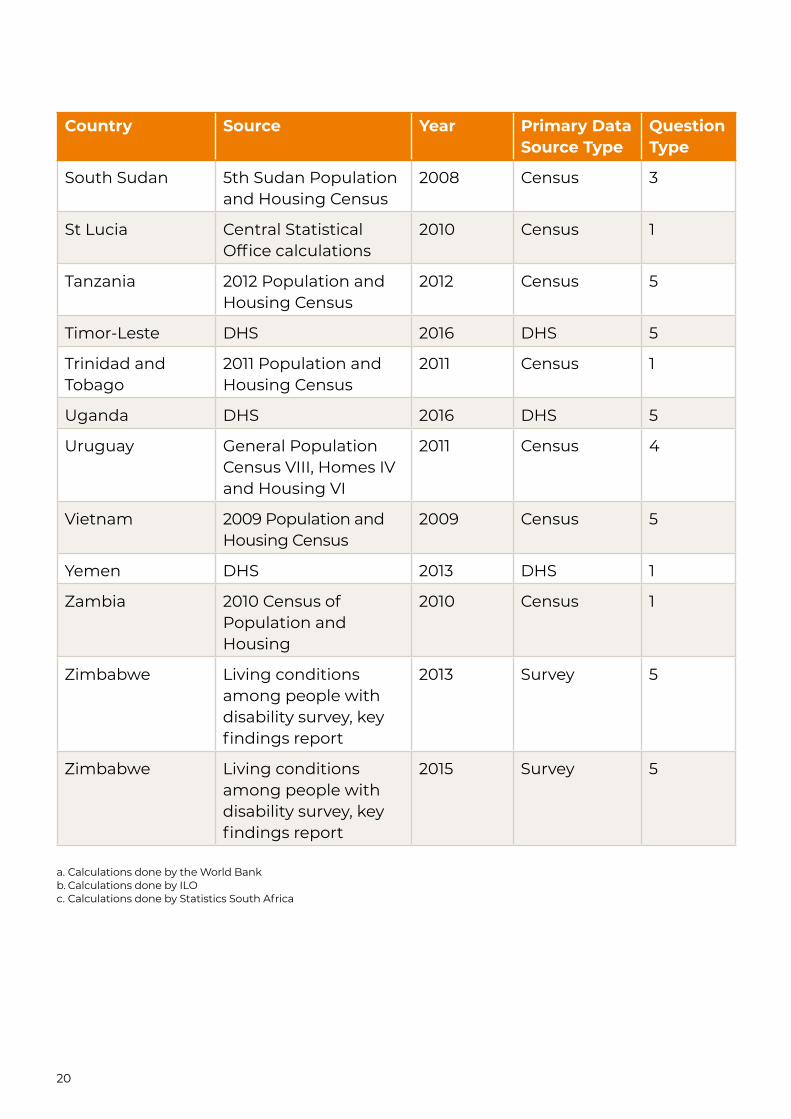
The first minimum requirement for a dataset to be considered for our analysis is that it contains variables that allow the identification of people with disabilities. This means that we can estimate the prevalence of disability and undertake disaggregation of indicators by disability status. Data used in the framework of this project came primarily from censuses and Demographic and Health Surveys (DHSs), as well as a few other national household surveys and reports (Table 1). Censuses are downloaded from the IPUMS website9 (Integrated Public Use Microdata Series) while DHS datasets come from the DHS program website.10 Other selected surveys were obtained online or by request to the agency responsible for data collection. The list of the 40 countries and the type of data source can be found in Table 1. A table with links to the websites they were downloaded from can be found in Appendix 4.
Country Source Year Primary Data Source Type
Question Type
Albania DHS 2008-2009 DHS 1
Bangladesh Population and Housing Census
2011 Census 1
Bangladesha Household Income and Expenditure Surveys (HIES)
2016-7 Household survey
5
Botswana Population and Housing Census
2011 Census 1
Botswanab Botswana Core Welfare Indicators (Poverty) Survey
2009 Household survey
1
Table 1: List of countries and data toolsNote: Question type refers to the methodology used to enumerate disability and is defined in Chapter 2 under the Prevalence of disability heading.
9. https://international.ipums.org/international
10. https://dhsprogram.com/data/available-datasets.cfm
18
Country Source Year Primary Data Source Type
Question Type
Burkina Faso Recensement general de la population et de l'habitation de 2006
2006 Census 1
Cambodia DHS 2014 DHS 5
Cambodiab LFS 2012 5
Cameroon DHS 2011 DHS 2
Cameroonb Enquête camerounaise auprès des ménages
2014 Household survey
1
Chad DHS 2014 DHS 2
Colombia DHS 2015 DHS 4
Costa Rica X Censo Nacional de Población y VI de Vivienda
2011 Census 2
Costa Ricab LFS 2015 LFS unknown
Dominican Republic
IX National Population and Housing Census, 2010
2010 Census 4
Egypt Population, Housing and Establishments Census, 2006
2006 Census 2
Egyptb LFS 2016 LFS unknown
El Salvador 6th Census of Population
2007 Census 3
Ecuador VII Censo de Población y VI de Vivienda, 2010
2010 Census 1
Gambia DHS 2013 DHS 3
Gambiab LFS 2012 LFS
Ghana 2010 Population and Housing Census
2010 Census 1
India Disabled people in India, a statistical profile
2016 Census 1
Kenya 2009 Kenya Population and Housing Census
2009 Census 1
19
Disability Data Review
Country Source Year Primary Data Source Type
Question Type
Liberia 2008 National Population and Housing Census
2008 Census 1
Liberiab LFS 2010 LFS 3
Malawi 2008 Population and Housing Census
2008 Census 4
Maldives DHS 2009 DHS 5
Mali Fourth General Census of Population and Housing 2009
2009 Census 2
Mexico 2010 Population and Housing Census
2010 Census 3
Myanmarb LFS 2015 LFS unknown
Myanmar First Myanmar National Disability Survey
2010 Survey 4
Nigeria General Household Survey
2012-2013 Household Survey
4
Pakistan Situation Analysis and National Plan of Action for People with Disabilities
2004 Survey unknown
Panama XI Censo Nacional de Población y VII de Vivienda de Panamá
2010 Census 1
Rwanda Integrated Household Living Conditions Survey 4
2013-2014 Household Survey
2
Rwandab LFS 2017 LFS unknown
Senegal DHS 2014 DHS 1
Senegalb LFS 2015 LFS unknown
South Africa Census 2011 2011 Census 5
South Africac Living Conditions Survey
2014-2015 Survey 5
South Africac Community Survey 2016 Survey 5
20
Country Source Year Primary Data Source Type
Question Type
South Sudan 5th Sudan Population and Housing Census
2008 Census 3
St Lucia Central Statistical Office calculations
2010 Census 1
Tanzania 2012 Population and Housing Census
2012 Census 5
Timor-Leste DHS 2016 DHS 5
Trinidad and Tobago
2011 Population and Housing Census
2011 Census 1
Uganda DHS 2016 DHS 5
Uruguay General Population Census VIII, Homes IV and Housing VI
2011 Census 4
Vietnam 2009 Population and Housing Census
2009 Census 5
Yemen DHS 2013 DHS 1
Zambia 2010 Census of Population and Housing
2010 Census 1
Zimbabwe Living conditions among people with disability survey, key findings report
2013 Survey 5
Zimbabwe Living conditions among people with disability survey, key findings report
2015 Survey 5
a. Calculations done by the World Bankb. Calculations done by ILOc. Calculations done by Statistics South Africa

21
Disability Data Review
Choice of indicators
The choice of indicators was made through a collaborative and deductive process. A range of indicators put forth for disability disaggregation from a range of international bodies were collated and analysed. Project researchers, working in consultation with DFID and guided by the project’s Independent Advisory Board, began the selection process by reviewing key disability-related indicators that have been identified as particularly relevant by a range of actors.
We began by considering the SDG indicators that are disability sensitive within the SDG Indicator Framework. At the same time, we considered the thematic focus for the upcoming 2018 Global Disability Summit. There are a number of SDG indicators which include disability specifically in their wording for disaggregation (Annex 1). Along with this group we reviewed the International Disability Alliance (IDA) and the International Disability and Development Consortium’s (IDDC) recently issued list11 of 32 SDG indicators which they identify as high priorities for disability disaggregation. Furthermore, at the 2018 Data for Development Festival in Bristol, UK, the Washington Group on Disability Statistics presented a list of indicators for which their National Statistics Office members indicated they could produce disability disaggregated data. Finally, we considered the indicators reported on by Washington Group members in the 2016 Washington Group report “Ability of Countries to Disaggregate SDG Indicators by Disability”.12 Indicators that were relevant to the four themes of the Global Disability Summit were drawn from these lists. This exercise produced a list of 31 possible indicators for inclusion, from which we sought to select between 10-15 indicators with relatively strong availability of disability disaggregated data for this analysis. The list included five non-SDG indicators that are relevant to key SDGs and to the Summit themes. These were anticipated to currently have more data availability than related SDG indicators (Annex 4).
11. www.internationaldisabilityalliance.org/prioritylist-ofindicators
12. www.washingtongroup-disability.com/wp content/uploads/2016/02/report_of_ability_of_countries_to_disaggregate_sdg_indicators_by_disability.pdf
22
This list was then considered against the SDG Tier Classification of data availability.13 Given the differences in data availability and confirmed methodology between indicators in different tier classifications, only those classified as Tier I or II were considered for analysis.
Additionally, DFID expressed their interest in SDG indicator 5.5.1(a). Although this information is not measured through censuses, it had recently been investigated by the UN Economic and Social Commission for Asia and the Pacific (ESCAP) as part of their ‘Assessing the Progress of the Incheon Strategy report’.14 Therefore, we agreed to create data visualisations from this report. However we did not anticipate that this information would be disaggregated for many of the countries chosen for analysis.
In total, 16 indicators reflecting the Global Disability Summit themes were chosen for disability disaggregation and visualisation on the portal, with the analysis focusing particularly on available census data. This has meant that capturing information on discrimination and stigma has been a challenge. A decision was made to utilise SDG indicators 1.3.1, 5.5.2, 16.1.3 and 5.5.1(a) to provide proxy information for this theme.
13. The Tier classifications are as follows:Tier 1: Indicator is conceptually clear, has an internationally established methodology and standards are available, and data are regularly produced by countries for at least 50 per cent of countries and of the population in every region where the indicator is relevant.Tier 2: Indicator is conceptually clear, has an internationally established methodology and standards are available, but data are not regularly produced by countries.Tier 3: No internationally established methodology or standards are yet available for the indicator, but methodology/standards are being (or will be) developed or tested (UNSD, 2018).
14. www.unescap.org/sites/default/files/publications/SDD BDIS report A4 v14-5-E.pdf
23
Disability Data Review
Education Tier I 4.1.x*: School completion rates [primary and secondary]
4.3.1: Participation rate of youth and adults in formal and non-formal education and training in the previous 12 months, by sex
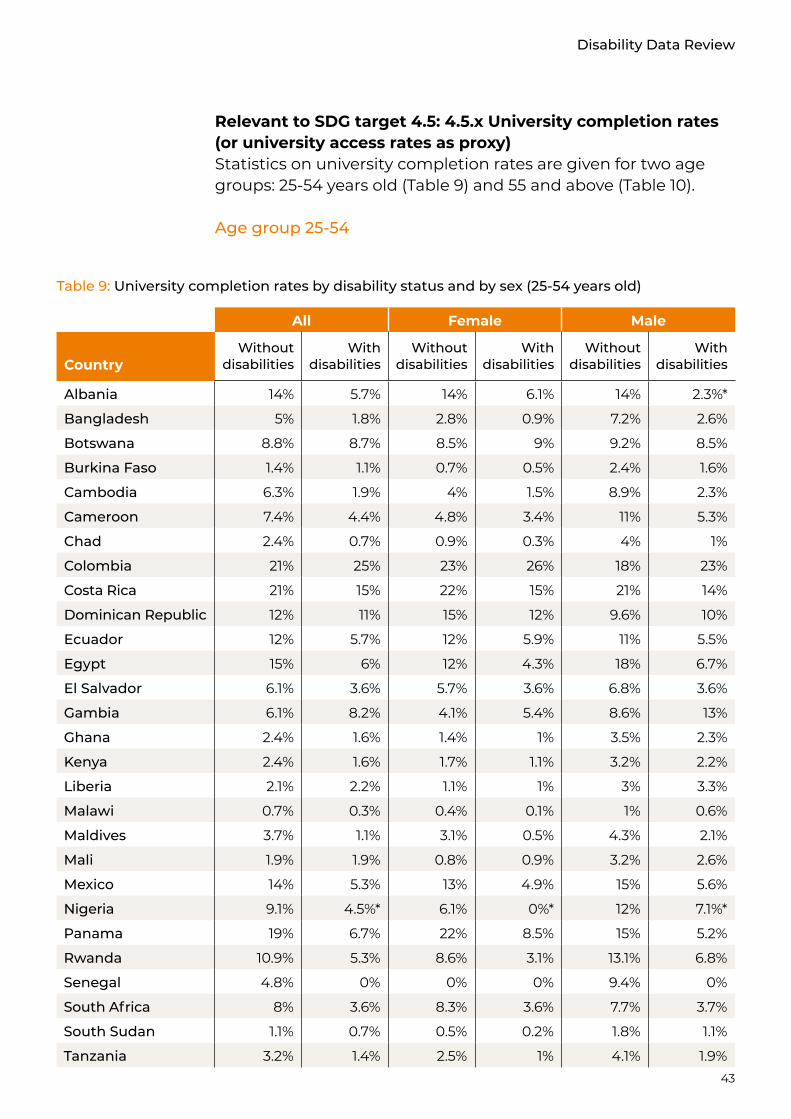
4.5.x*: University completion rates [or university access rates as proxy15]
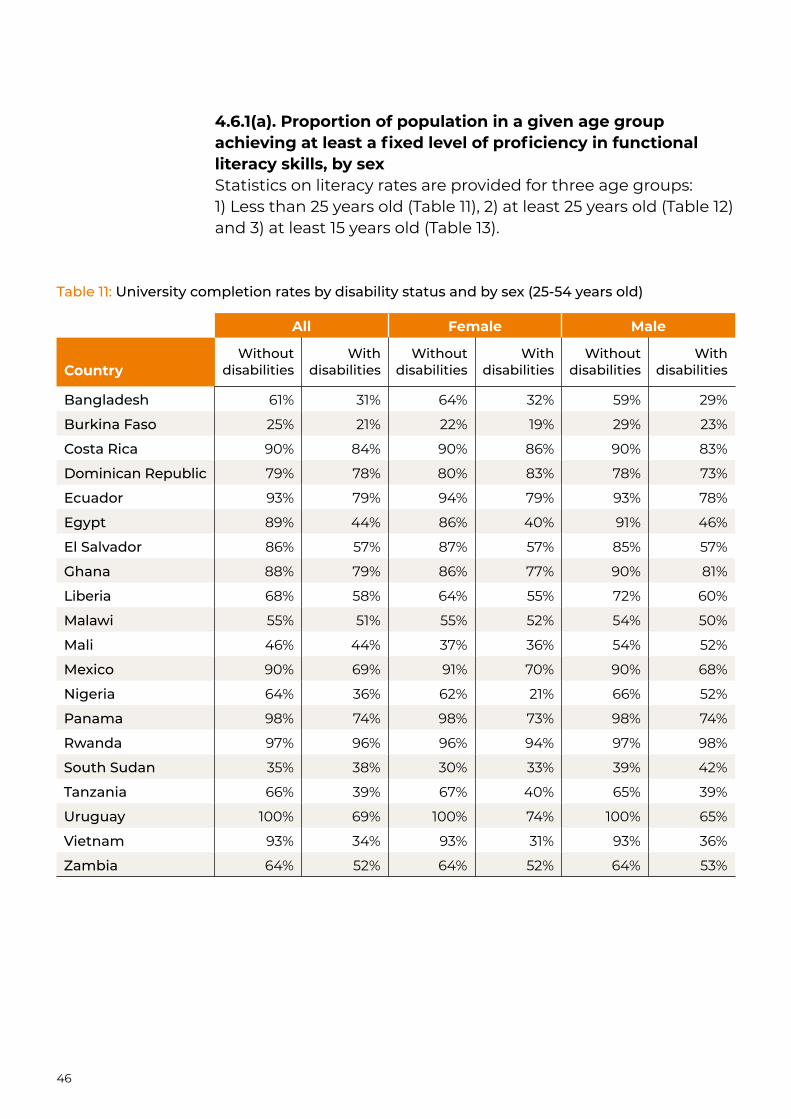
4.6.1(a): Proportion of population in a given age group achieving at least a fixed level of proficiency in functional literacy skills, by sex
Tier II 4.2.2: Participation rate in organized learning (one year before the official primary entry age), by sex
Economic empowerment
Tier I 1.2.1: Proportion of population living below the national poverty line, by sex and age
8.5.2: Unemployment rate, by sex, age and people with disabilities
8.6.1: Proportion of youth (aged 15-24 years) not in education, employment or training
8.3.x*: Proportion of people employed who are in informal sectors
Tier II 8.10.2: Proportion of adults (15 years and older) with an account at a bank or other financial institution or with a mobile-money-service provider
Innovation Tier I 5.b.1: Proportion of individuals who own a mobile telephone, by sex
17.8.1: Proportion of individuals using the internet
Discrimination Tier I 1.3.1: Proportion of population covered by social protection floors/systems
16.1.3: Proportion of population subjected to physical, psychological or sexual violence in the previous 12 months
Tier II 5.5.1(a): Proportion of seats held by women in (a) national parliaments
5.5.2: Proportion of women in managerial positions
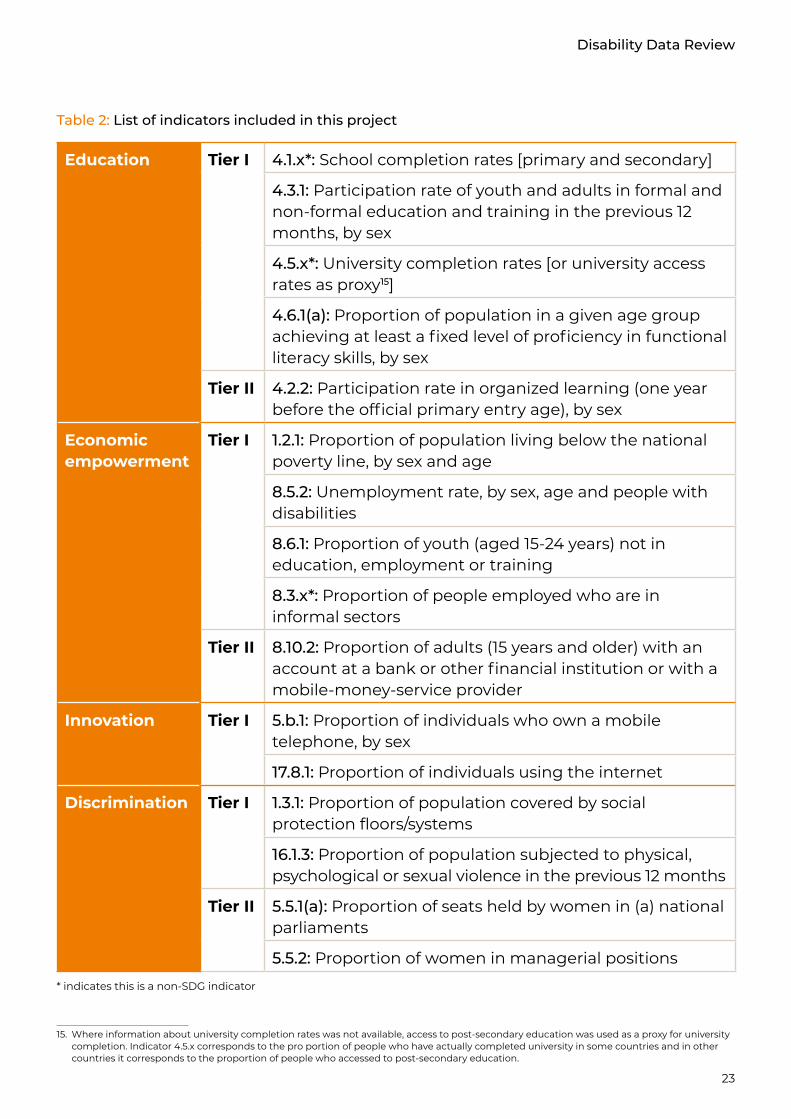
Table 2: List of indicators included in this project
15. Where information about university completion rates was not available, access to post-secondary education was used as a proxy for university completion. Indicator 4.5.x corresponds to the pro portion of people who have actually completed university in some countries and in other countries it corresponds to the proportion of people who accessed to post-secondary education.
* indicates this is a non-SDG indicator

24
It is important to emphasise that this list is intended to demonstrate the range and complexity of disability-related findings that can be generated by using existing data sources. However it is not exhaustive and does not constitute a comprehensive list of indicators which can be disaggregated by disability. A more diverse range of indicators could be disaggregated by disability if different surveys were included in the analysis. For example, Multiple Indicator Cluster Surveys (MICS) will provide more detailed data on child functioning and indicators related to education, particularly in the next round which will consistently include disability questions. Disability-specific surveys may capture more information on indicators around discrimination, violence and stigma.
Choice of country
The process of selecting these countries was made in consultation with DFID and the project’s Independent Advisory Board.
A scoping exercise was undertaken to document instances of surveys which included questions on disability data. Surveys were considered for this project if they asked one or more questions which would allow disaggregation by disability status and constituted a representative sample of a population or sub-population at the country level or at the level of a discrete geographic area, for example a providence, state or district. This exercise focused the search within the DHS database, World Bank Microdata catalogue, the ILO Labour Force Survey data bank, International Household Survey Network, Global Health Data Exchange database and IPUMS.
Basic metadata information was collected and catalogued for each survey and included year collected, producer/custodian, microdata available online, reports published, reports published in English and disability question type. This metadata will be available to download online.
In order to maintain a delineated scope for the project, we decided that a sample of 40 countries with a post-2006 survey would be chosen for analysis. This year was chosen as it coincides with the drafting of UNCRPD, and therefore surveys after this date are more likely to align with a human rights-based approach to disability. As stated earlier, where there were no sources after 2006, earlier sources such as the World Health Survey 2002-04 was used. Table 1 presents the countries which have been included in this analysis.
25
Disability Data Review
Again, it is important to emphasise that although a scoping exercise was undertaken, the list of countries identified and then chosen for analysis does not represent an exhaustive list of all global instances of nationally representative disability data. As is documented above, decisions were made at every step to include or exclude certain countries and data sources from analysis for reasons related to limited time and resources for this study. The scope certainly under-identifies surveys which have not been translated into English. It also underrepresents recent data collection surveys which are less likely to be currently available online. As part of Leonard Cheshire’s ongoing commitment to disability data disaggregation, datasets that were not readily accessible online are being requested for analysis directly from the custodian agency. Data will continue to be collected and disaggregated on the portal over the coming months to build a more comprehensive global review of disability data.
Statistical analysis
Statistical analysis and all calculations were made using STATA16. An in-depth review of the methodology used for this analysis is described in Annex 1. The calculations used follow the SDG recommended methodology unless otherwise stated.
Thematic area 1: Inclusive education
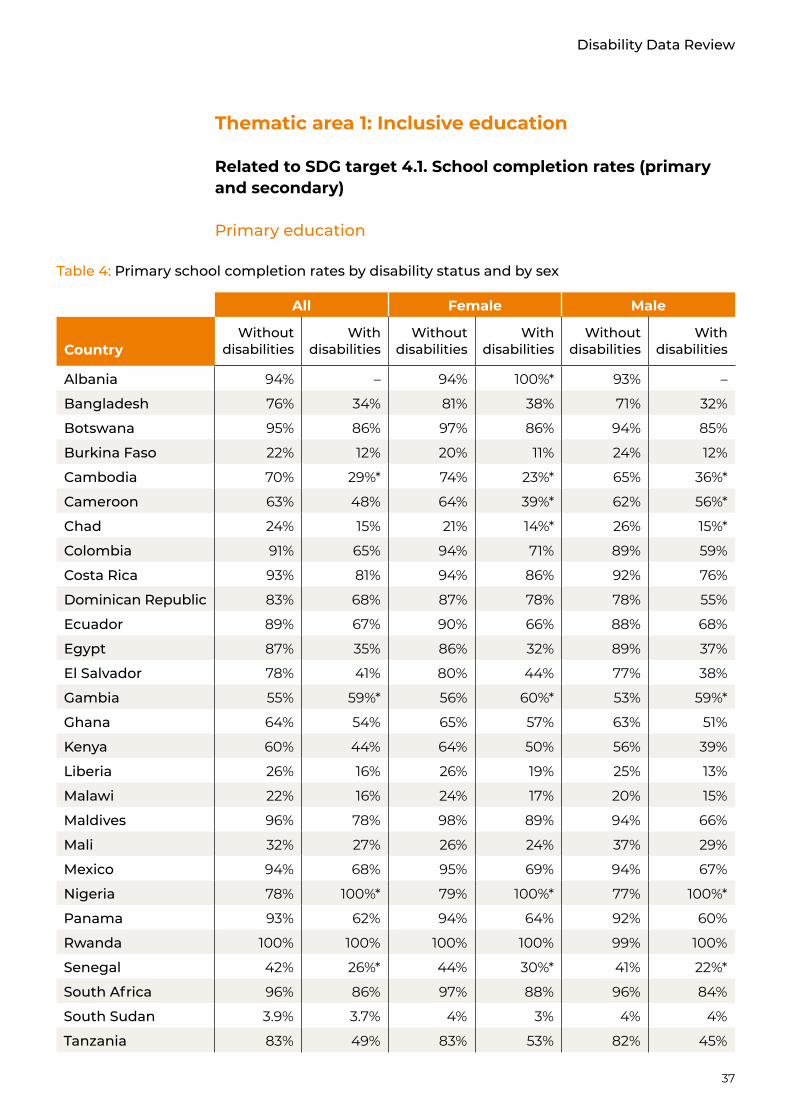
Relevant to SDG target 4.1. School completion rates (primary and secondary)This indicator could be produced for 35 countries. Calculation follows the methodology recommended by UNESCO. The school completion rate is defined by UNESCO17 as the percentage of people aged 3-5 years above the intended age for the last grade of each level of education who have completed that grade.
The available datasets from the 35 countries provided us with the two variables required for the calculation of educational attainment; that is individuals’ age and a variable that allows us to identify whether or not children have completed primary or secondary education.
16. www.stata.com
17. http://uis.unesco.org/node/539583
26
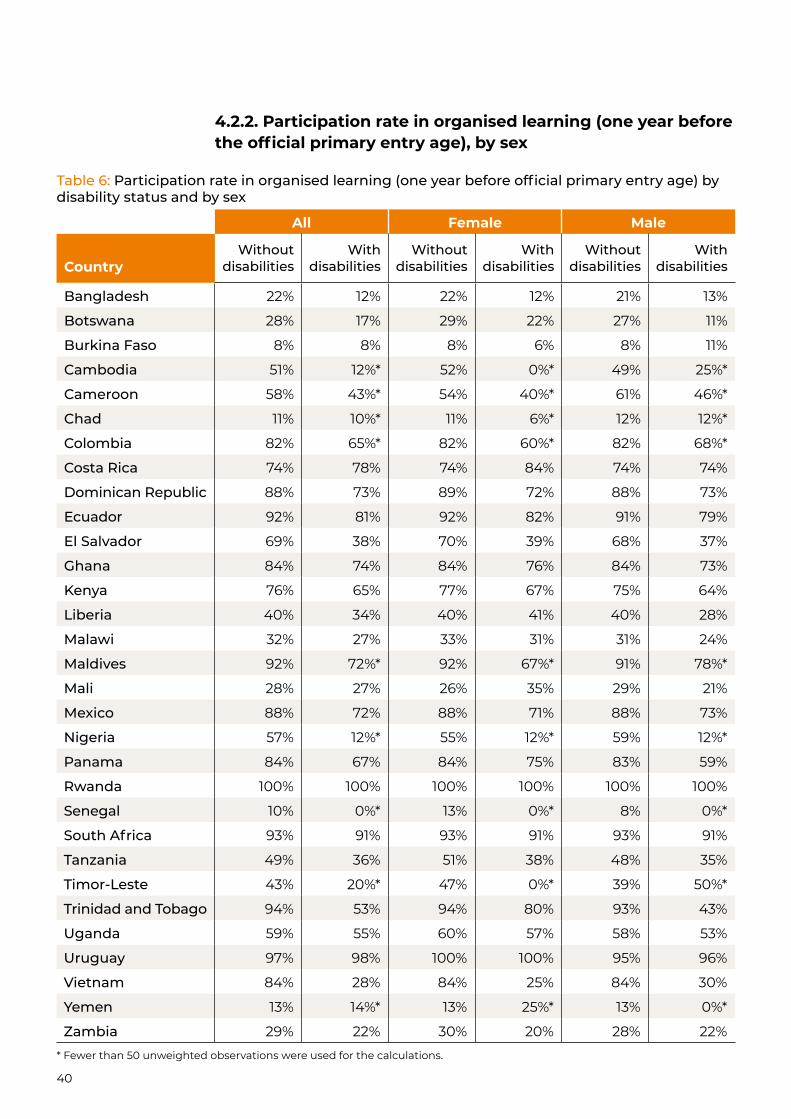
4.2.2. Participation rate in organised learning (one year before the official primary entry age), by sexThis indicator could be produced for 31 countries. It measures the proportion of children one year before the official primary entry age who participate in organised learning. Thus, if the official primary entry age is 6, the participation rate in organised learning will be the percentage of children who are 5 years old attending school, whether pre-primary or primary schools. Information about the official primary entrance age comes from UNESCO website.18
This indicator could not be calculated for Gambia, Egypt or South Sudan because in these countries, information about school attendance is not asked for those under the official primary entrance age. Moreover, the estimation is based on less than 50 unweighted observations in 9 countries (Cambodia, Cameroon, Chad, Colombia, Maldives, Nigeria, Senegal, Timor-Leste, Yemen).
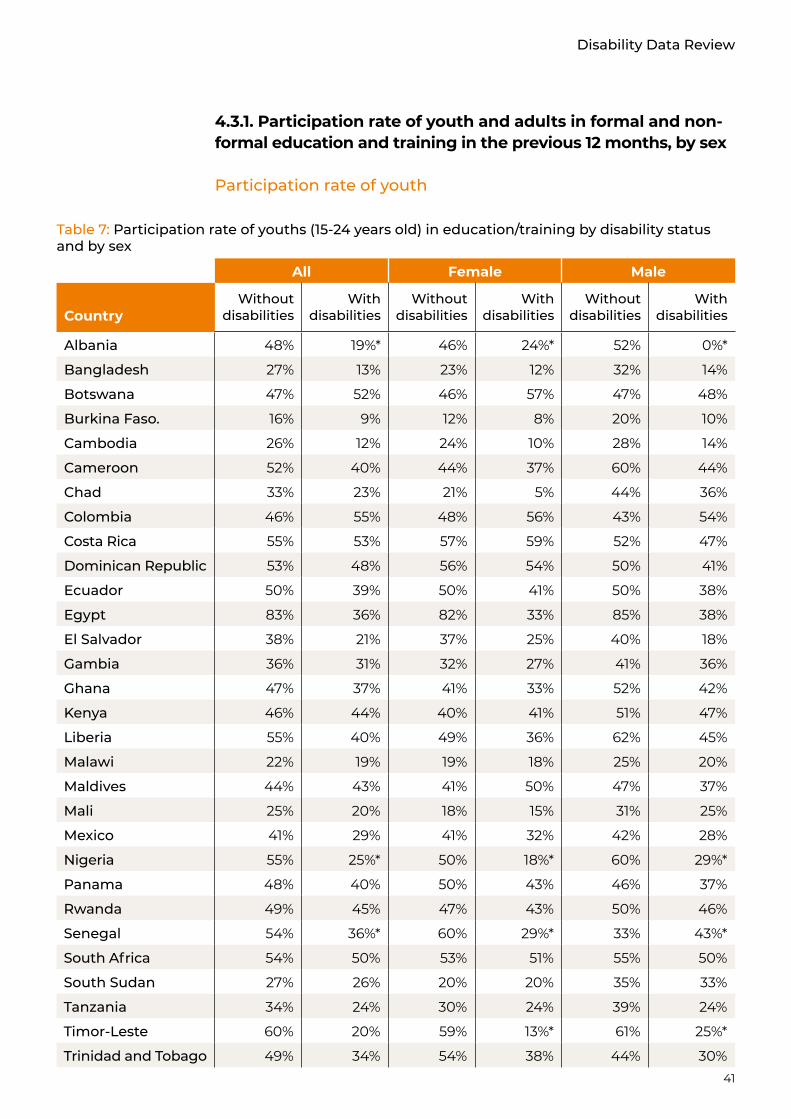
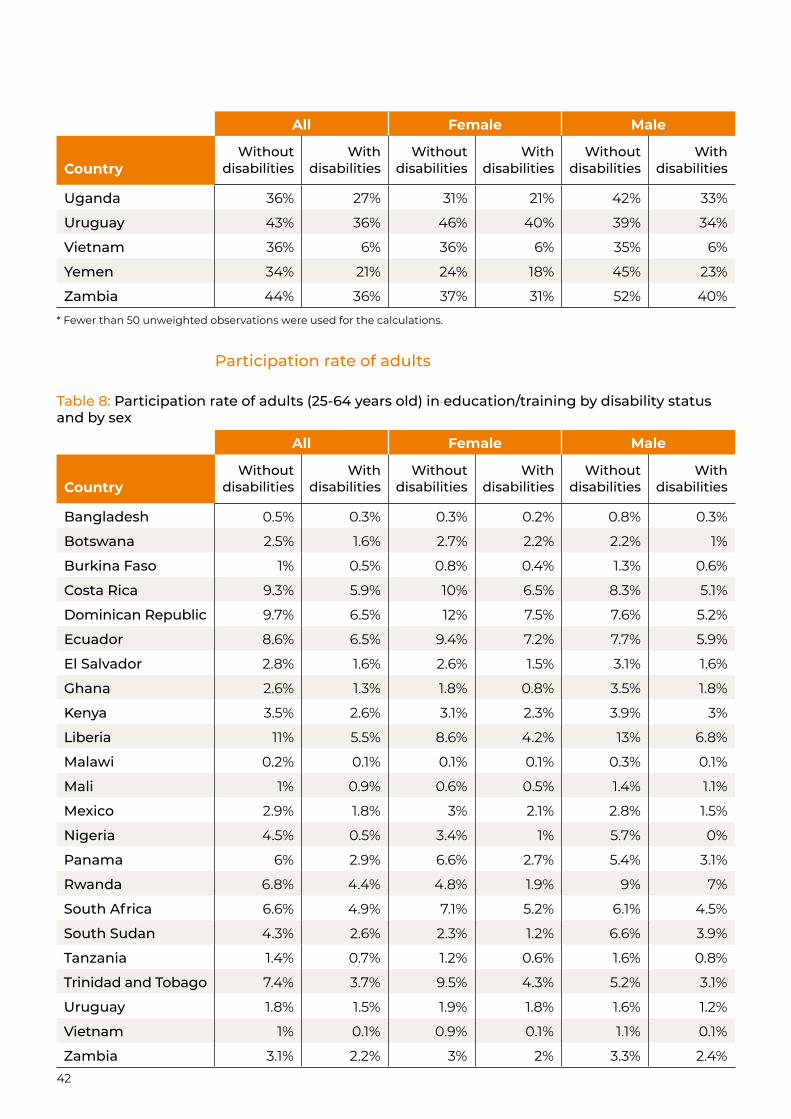
4.3.1. Participation rate of youth and adults in formal and non-formal education and training in the previous 12 months, by sexThis indicator could be produced for 23 countries. It is estimated separately for youth (15-24 years old) and adults (25-64 years old). This variable has 5 categories: 1) Not in the universe, 2) Yes, 3) No, not specified, 4) No, attended in the past, 5) No, never attended. An individual is identified in our analysis as participating in education/training if she/he belongs to the second category (Yes).
Relevant to SDG target 4.5. “4.5.x” University completion rates (or university access rates as proxy)This indicator could be produced for 34 countries (55 years+) and 35 countries (25-54 years). Information about university completion is provided in censuses. In contrast, DHS data could only inform us whether individuals have undertaken some post-secondary education or not. In other words, we cannot identify whether someone has completed university or not. Access to post-secondary education is used as a proxy for university completion rates in some of our calculations.
4.6.1(a). Proportion of population in a given age group achieving at least a fixed level of proficiency in functional literacy skills, by sexThis indicator could be produced for 20 countries (less than 25 years) and 31 countries (at least 15 years). In censuses, the variable LIT identifies literacy as the ability to read and write
18. http://uis.unesco.org/en/home#tabs-0-uis_home_top_menus-3
27
Disability Data Review
in any language. Emphasis is put on both reading and writing skills, so that a person will be considered as illiterate if she/he can read but not write. In DHS, literacy is captured by the variables V155 (female sample) and MV155 (male sample). V155 indicates whether a respondent who attended primary schooling can read a whole or part of a sentence showed. Individuals who attended secondary education or higher education are coded as literate as well as those who could read a whole sentence.
Thematic area 2: Economic empowerment
1.2.1: Proportion of population living below the national poverty line, by sex and ageThis indicator could be obtained for 14 countries. Information about indicator 1.2.1 is drawn from secondary sources and poverty is estimated at the household level by disability status. Households without people are compared to those with at least one person with disabilities. In their studies Mitra et al. (2013)19 and Mitra (2017)20 estimate poverty in developing countries21. The headcount ratio is the measure of poverty. The headcount ratio for a given population is the number of poor people divided by the total population. For Bangladesh, the statistics were calculated by the World Bank on request for this report. Statistics from Rwanda are taken from a report written by the National Institute of Statistics of Rwanda Statistics for Rwanda.22 Here, household consumption is used as a proxy of income and all the households are classified into five quintiles . South Africa data on poverty was calculated by Statistics South Africa24.
8.5.2. Unemployment rate, by sex, age and people with disabilitiesThis indicator could be produced for 35 countries. The unemployment rate is the percentage of people in the labour force who are not employed. To be in the labour force, a person
19. Mitra, S., Posarac, A., & Vick, B. (2013). Disability and poverty in developing countries: a multidimensional study. World Development, 41, 1-18.
20. Mitra, S. (2017). Disability, Health and Human Development. Palgrave Pivot.
21. Mitra et al. (2013) relied on the international poverty line for some countries and on national poverty line for other countries. The data used in the studies included the World Health Survey 2002-04.
22. www.statistics.gov.rw/publication/rwanda-social-protection-and-vup-report-results-eicv-4
23. The Integrated Household Living Conditions Survey 4 (2013-14) presents the distribution of individuals by disability status and by quintile. Results show that 20.3% of people with disabilities live in a household that belongs to the first quintile Q1, 20% of people with disabilities live in a household that belongs to the second quintile Q2, 21.3% of people with disabilities live in a household in the third quintile Q3, 20.7% of people with disabilities live in a household in the fourth quintile Q4, 17.7% of people with disabilities live in a household in the fifth quintile Q5. In the group of people without disabilities these statistics correspond respectively to Q1:19.7%, Q2:19.7%, Q3:19.7%, Q4:19.8%, Q5:21.2%. In the Rwandan survey the analysis of poverty of people with disabilities is only presented by quintile. In this report, the statistics used on poverty correspond to statistics associated to the first quintile.
24. Calculations regarding poverty were undertaken by Statistics South Africa and are based on Living Conditions Survey 2014-2015. The methodology used was available at the time of the report being written.

28
must either be employed or available and looking for work. Only people who are at least 15 years old are considered in our calculations. In Chad and Yemen, unemployment rates can only be estimated for women as the question related to this calculation was only included on the women specific questionnaire.
8.6.1. Proportion of youth (aged 15-24 years) not in education, employment or trainingThis indicator could be produced for 35 countries. In our analysis, this indicator is measured by the proportion of youth who neither attend school (see indicator 4.3.1 above for the definition school attendance) nor work. For countries where the estimate was calculating using census data, both unemployed and inactive people constitute the group of non-workers.
Relevant to SDG target 8.3: “8.3.x” Proportion of people employed who are in informal sectorsIn general, datasets used for our analysis do not allow us to identify whether employed people are working in the informal or formal sector. Out of the 40 data instruments we relied on for our analysis, only the Rwandan dataset provides us with the information that can help to identify whether an individual works in informal sectors. For the remaining countries (29 out of 30), we used the proportion of own-account workers as a proxy for the intended indicator, since self-employed individuals are generally found in the informal sector. In many of the countries with a DHS, the calculations were done only for the female sample. This is because in these DHS, the question related to self-employment was only asked to women.
8.6.1. Proportion of youth (aged 15-24 years) not in education, employment or trainingThis indicator could be produced for 35 countries. In our analysis, this indicator is measured by the proportion of youth who neither attend school (see indicator 4.3.1 above for the definition school attendance) nor work. When we use censuses, both unemployed and inactive people constitute the group of non-workers.
8.10.2. Proportion of adults (15 years and older) with an account at a bank or other financial institution or with a mobile-money-service providerThis indicator could be produced for 5 countries. The World Bank provided us with this indicator for Bangladesh. They derived indicator 8.10.2 from a combination of three questions: 1) if anyone in the household has opened a bank account in the past
29
Disability Data Review
12 months, 2) if anyone in the household has deposited money in credit or microfinance institutions in the past 12
Thematic area 3: Technology and innovation
5.b.1. Proportion of individuals who own a mobile telephone, by sexOut of 40 countries, this indicator is available for 16 countries that had the requisite data availability (i.e. mobile phone possession at the individual and/or the household level). When the analysis is done at the household level, the comparison is between households with at least one person with disabilities and those without people with disabilities. The use of household-level variable to measure indicator 5.b.125 may lead to misleading results since they assume that people have equal access to the mobile phone within the household, though that might not be the case. The statistics for South African were calculated by South Africa Statistics.
17.8.1. Proportion of individuals using the InternetAt the individual level, this indicator can be produced for 5 countries. In certain DHS, questions about the internet are asked to people who are at least 15 years old. The only exception is Nigeria, where anyone who is 10 years old or older may answer to this question. We rely on this information to estimate the proportion of individuals using the internet.
Thematic area 4: Stigma and discrimination
1.3.1. Proportion of population covered by social protection floors/systemsThe measure used for this indicator is the proportion of people covered by a type of health insurance. 5 categories can be observed: 1) Health insurance provided by the employer (8 countries), 2) Health insurance provided by a mutual/community organisation (6 countries), 3) Health insurance provided by social security (8 countries), 4) Purchased health insurance (7 countries), 5) Other source of health insurance (7 countries).
Information about other forms of social protection is extremely scarce across the datasets and is not provided in censuses. In DHS, only health insurance coverage can be used as a measure for indicator 1.3.1.
25. This comment is also valid for indicator 17.8.1.
30
5.5.1(a). Proportion of seats held by women in (a) national parliaments:Statistics on indicator 5.5.1(a) come from a report26 written by the UN ESCAP which provides data for 2 of our 40 targeted countries (see Appendix 8): Cambodia and Timor-Leste.
5.5.2. Proportion of women in managerial positionsThis indicator could be produced for 29 countries. This indicator corresponds to the proportion of employed women in a managerial position; for example, if the value of the statistic in a given country is 2%, this means that 2% of employed women have a managerial position while 98% of employed women have a non-managerial position.
16.1.3. Proportion of population subjected to physical, psychological or sexual violence in the previous 12 months This indicator could be produced for 7 countries. Questions about violence are not routinely collected in censuses. When the question is asked in DHS it generally targets women only, so it is difficult to obtain information about men who are exposed to physical, emotional or sexual violence (Uganda is an exception, both women and men are asked if they experienced violence). In our analysis, indicator 16.1.3 is measured by the proportion of people who declare they have been subjected to any form of violence during the 12 months prior to the survey.
We have explored the questionnaires of the United Nations Surveys on Crime Trends and the Operations of Criminal Justice Systems to check if we could obtain disaggregated information about violence according to disability status; however, information about disability was not included in these surveys. We also explored questionnaires developed by UNICEF in the framework of the Multiple Indicators Cluster Surveys (MICS): while the 6th round of MICS (MICS6) does include information about disability (as the WG questions are included in the Child functioning module of MICS6), these surveys are currently underway or planned soon so data is not yet available at the time of writing the report.
26. United Nations Economic and Social Commission for Asia and the Pacific (2018). Building disability inclusive society in Asia and the Pacific, assessing progress of the Incheon strategy. www.unescap.org/publications/building-disability-inclusive-societies-asia-and-pacific-assessing-progress-incheon
31
Disability Data Review
Chapter 2: Results
31

32
The statistics drawn from our calculations are presented in this section. Statistics are presented by disability status and by sex.
Prevalence of disability
The methods used for identifying people with disabilities and surveys differ, so it is important when reporting on the prevalence of disability to take note of the methodology. Table 2 provides reported prevalence in the selected countries based on the methodology used.
The first group of countries use a question such as “Do you have a disability?” (question type 1). This leads to underreporting for a few reasons: (1) the term disability is usually associated with shame, (2) people tend to think of disability as something severe, so more moderate conditions are missed, and (3) older people often associate functional limitations with age which they consider different from “disability” (Ingstad and Whyte 1995; Mont 2007).
The second group of countries use a list of medical conditions (question type 2). This method is often not considered good practice. Firstly, not all medical conditions can be included in any list, and secondly, people with less education and/or access to medical care may not know their diagnosis (Palmer and Harley 2011). But more importantly, a medical diagnosis does not provide accurate information on a person’s ability to function; two people with the same diagnosis may have very different levels of difficulty doing basic activities (Mont 2007; Van-Brakel and Officer 2008; Miller 2006).
Asking about functional limitations – that is, difficulty doing basic activities – is the preferred approach, such as asking if they have difficulty walking or climbing steps. There may be many medical reasons – but a functional question addresses what a person can or cannot do, not the reason they cannot do it. The third group in Table 2 (question type 3) takes such an approach but uses questions other than The Washington Group Questions. For example the Senegalese DHS asks a question on whether somebody has difficulty relating to others. The fourth group attempts to use the Washington Group questions, but adapts them in some ways that are not recommended (question type 4). For example, changing the scaled responses to yes/no responses, adding an introduction that uses the term “disability”, or even
33
Disability Data Review
asking a screener question, such as “Do you have a disability?”, that then leads to the Washington Group questions if the respondent answers in the affirmative. All of these adaptations undermine the recommended approach. Countries listed under the final category report that they have used the Washington Group questions as recommended (question type 5).
However, from the Washington Group’s experience of interacting with national statistical offices that have been using the questions, we know that some countries make verbal reference to “disability” in an introductory statement which, again, undermines the approach. In other instances they may change the response categories from a scaled response to a yes/no response, which damages data validity. Or they may modify the wording in other ways. For example, Paraguay eliminated the self-care question (question 5 of the short set). However, they then tried to capture people with upper mobility issues that the question was identifying, added “moving one’s arms” to the walking question. In testing, the Washington Group found that providing even a short list of domains in a single question is often confusing for respondents.
Several countries appear more than once based on different methodologies used in different data tools. In Zambia, the “do you have a disability” question yielded a 2.0% prevalence rate, compared to an 8.5% prevalence rate when the Washington Group Questions were used. In Vietnam the increase was much smaller, from 1.7% to 3.6%. In Vietnam, though, the Washington Group questions were implemented again in a national disability survey in 2016 with direct support from the Washington Group. The reported prevalence, to be released this October, is expected to be higher.
It is somewhat surprising that some of the countries that report using the Washington Group questions have very low prevalence rates.27 From the information available it is unclear what the reason is for this. As mentioned previously, it may be that in the implementation of the questions alterations were made that were not reported in their documents (for example, a screener or an introductory statement about disability). Or it could reflect some cultural reasons for not wanting to mention difficulties.
27. Using the Washington Group questions, the cut-off is “a lot of difficulty”.
34
Another reason why differences in prevalence can exist between countries using the Washington Group questions is an unintentional change in meaning when the questions are translated. This is why the Washington Group has a translation protocol28 and recommends cognitive testing of translations. In some countries with many languages, questions are translated "on the fly" by individual interviewers which is not a recommended methodology. It is important that the enumerators are trained not to use words such as "disability", but to ask the questions directly as they were designed to be asked based on an agreed, tested translation.
When the Washington Group questions were implemented with technical support from the Washington Group itself, measured prevalence rates tend to fall in the range of 6% to 12% (Altman, 2016). To have good quality, internationally comparable estimates of disability it is important to use the Washington Group questions as designed.
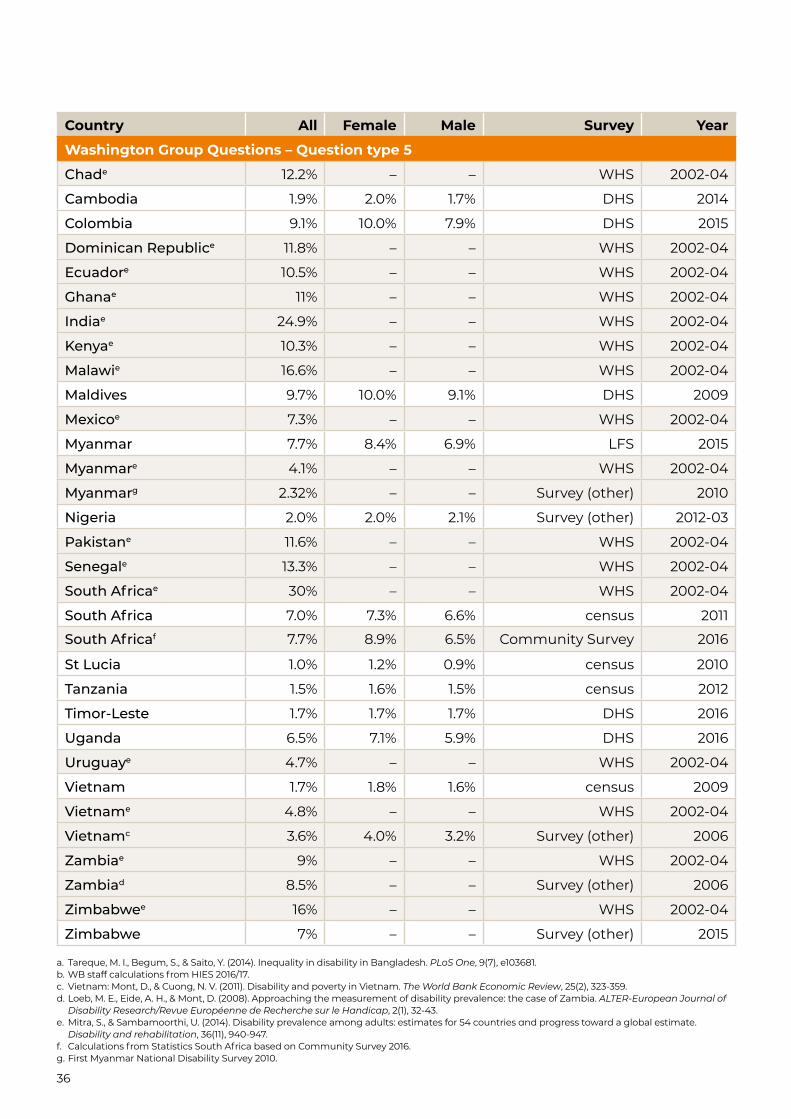
Table 3 shows a range of disability prevalence rates available for our countries of interest. Those shaded in grey have not been calculated by the Leonard Cheshire team using the primary sources listed in Appendix 5 that have been the main focus of this project, but are taken from other secondary sources as noted below. Although outside the timeframe of our original data scope, the World Health Survey (WHS) has been included under category 5, to provide additional examples of prevalence rates based on the Washington Group Questions.
28. www.washingtongroup-disability.com/publications/implementing

35
Disability Data Review
Country All Female Male Survey Year
Questions refer to disability – Question type 1
Albania 4.5% 5.6% 1.8% DHS 2008-9
Bangladesh 1.4% 1.3% 1.5% census 2011
Botswana 1.9% 1.9% 1.8% census 2011
Burkina Faso 1.2% 1.1% 1.3% census 2006
Ecuador 6.1% 5.6% 6.6% census 2010
Egypt 0.7% 0.5% 0.8% census 2006
Ghana 3.0% 3.0% 2.9% census 2010
India 2.2% 2.0% 2.4% census 2011
Kenya 3.5% 3.5% 3.4% census 2009
Liberia 3.1% 3.1% 3.2% census 2008
Panama 2.9% 2.8% 3.1% census 2010
Senegal 2.4% 2.4% 2.5% DHS 2014
Trinidad and Tobago 4.3% 4.4% 4.2% census 2011
Yemen 1.5% 1.3% 1.7% DHS 2013
Zambia 2.0% 1.9% 2.1% census 2010
Medical questions – Question type 2
Cameroon 5.6% 5.4% 5.8% DHS 2011
Chad 3.4% 3.2% 3.5% DHS 2014
Costa Rica 10.0% 11.0% 10.0% census 2011
Mali 0.7% 0.6% 0.8% census 2009
Rwanda 4.2% 4.3% 4.0% Survey (other) 2013
Functional questions other than Washington Group Questions – Question type 3
El Salvador 4.1% 3.8% 4.5% census 2007
Gambia 3.3% 3.7% 3.0% DHS 2013
Mexico 5.2% 5.1% 5.2% census 2010
South Sudan 5.1% 5.0% 5.1% census 2008
Adaptation of Washington Group Questions – Question type 4
Dominican Republic 12.0% 14.0% 10.0% census 2010
Malawi 3.9% 3.8% 3.9% census 2008
Uruguay 5.2% 6.2% 4.2% census 2011
Washington Group Questions – Question type 5
Bangladesha 9.5% 10.8% 8.8% Survey (other) 2010
Bangladeshb 1.4% – – Survey (other) 2016-7
Bangladeshe 22% – – WHS 2002-04
Burkina Fasoe 11.8% – – WHS 2002-04
Table 3: Prevalence of disability
36
Country All Female Male Survey Year
Washington Group Questions – Question type 5
Chade 12.2% – – WHS 2002-04
Cambodia 1.9% 2.0% 1.7% DHS 2014
Colombia 9.1% 10.0% 7.9% DHS 2015
Dominican Republice 11.8% – – WHS 2002-04
Ecuadore 10.5% – – WHS 2002-04
Ghanae 11% – – WHS 2002-04
Indiae 24.9% – – WHS 2002-04
Kenyae 10.3% – – WHS 2002-04
Malawie 16.6% – – WHS 2002-04
Maldives 9.7% 10.0% 9.1% DHS 2009
Mexicoe 7.3% – – WHS 2002-04
Myanmar 7.7% 8.4% 6.9% LFS 2015
Myanmare 4.1% – – WHS 2002-04
Myanmarg 2.32% – – Survey (other) 2010
Nigeria 2.0% 2.0% 2.1% Survey (other) 2012-03
Pakistane 11.6% – – WHS 2002-04
Senegale 13.3% – – WHS 2002-04
South Africae 30% – – WHS 2002-04
South Africa 7.0% 7.3% 6.6% census 2011
South Africaf 7.7% 8.9% 6.5% Community Survey 2016
St Lucia 1.0% 1.2% 0.9% census 2010
Tanzania 1.5% 1.6% 1.5% census 2012
Timor-Leste 1.7% 1.7% 1.7% DHS 2016
Uganda 6.5% 7.1% 5.9% DHS 2016
Uruguaye 4.7% – – WHS 2002-04
Vietnam 1.7% 1.8% 1.6% census 2009
Vietname 4.8% – – WHS 2002-04
Vietnamc 3.6% 4.0% 3.2% Survey (other) 2006
Zambiae 9% – – WHS 2002-04
Zambiad 8.5% – – Survey (other) 2006
Zimbabwee 16% – – WHS 2002-04
Zimbabwe 7% – – Survey (other) 2015
a. Tareque, M. I., Begum, S., & Saito, Y. (2014). Inequality in disability in Bangladesh. PLoS One, 9(7), e103681.b. WB staff calculations from HIES 2016/17.c. Vietnam: Mont, D., & Cuong, N. V. (2011). Disability and poverty in Vietnam. The World Bank Economic Review, 25(2), 323-359.d. Loeb, M. E., Eide, A. H., & Mont, D. (2008). Approaching the measurement of disability prevalence: the case of Zambia. ALTER-European Journal of
Disability Research/Revue Européenne de Recherche sur le Handicap, 2(1), 32-43.e. Mitra, S., & Sambamoorthi, U. (2014). Disability prevalence among adults: estimates for 54 countries and progress toward a global estimate.
Disability and rehabilitation, 36(11), 940-947.f. Calculations from Statistics South Africa based on Community Survey 2016.g. First Myanmar National Disability Survey 2010.
37
Disability Data Review
Thematic area 1: Inclusive education
Related to SDG target 4.1. School completion rates (primary and secondary)
Primary education
Table 4: Primary school completion rates by disability status and by sex
All Female Male
CountryWithout
disabilitiesWith
disabilitiesWithout
disabilitiesWith
disabilitiesWithout
disabilitiesWith
disabilities
Albania 94% – 94% 100%* 93% –
Bangladesh 76% 34% 81% 38% 71% 32%
Botswana 95% 86% 97% 86% 94% 85%
Burkina Faso 22% 12% 20% 11% 24% 12%
Cambodia 70% 29%* 74% 23%* 65% 36%*
Cameroon 63% 48% 64% 39%* 62% 56%*
Chad 24% 15% 21% 14%* 26% 15%*
Colombia 91% 65% 94% 71% 89% 59%
Costa Rica 93% 81% 94% 86% 92% 76%
Dominican Republic 83% 68% 87% 78% 78% 55%
Ecuador 89% 67% 90% 66% 88% 68%
Egypt 87% 35% 86% 32% 89% 37%
El Salvador 78% 41% 80% 44% 77% 38%
Gambia 55% 59%* 56% 60%* 53% 59%*
Ghana 64% 54% 65% 57% 63% 51%
Kenya 60% 44% 64% 50% 56% 39%
Liberia 26% 16% 26% 19% 25% 13%
Malawi 22% 16% 24% 17% 20% 15%
Maldives 96% 78% 98% 89% 94% 66%
Mali 32% 27% 26% 24% 37% 29%
Mexico 94% 68% 95% 69% 94% 67%
Nigeria 78% 100%* 79% 100%* 77% 100%*
Panama 93% 62% 94% 64% 92% 60%
Rwanda 100% 100% 100% 100% 99% 100%
Senegal 42% 26%* 44% 30%* 41% 22%*
South Africa 96% 86% 97% 88% 96% 84%
South Sudan 3.9% 3.7% 4% 3% 4% 4%
Tanzania 83% 49% 83% 53% 82% 45%
38
All Female Male
CountryWithout
disabilitiesWith
disabilitiesWithout
disabilitiesWith
disabilitiesWithout
disabilitiesWith
disabilities
Timor-Leste 72% 8%* 77% 9%* 66% 7%*
Trinidad and Tobago 95% 67% 95% 71% 94% 62%
Uganda 32% 18% 34% 20% 30% 17%
Uruguay 97% 52% 98% 59% 96% 47%
Vietnam 92% 20% 92% 20% 92% 20%
Yemen 13% 10% 10% 14% 16% 7%
Zambia 77% 52% 77% 50% 78% 54%
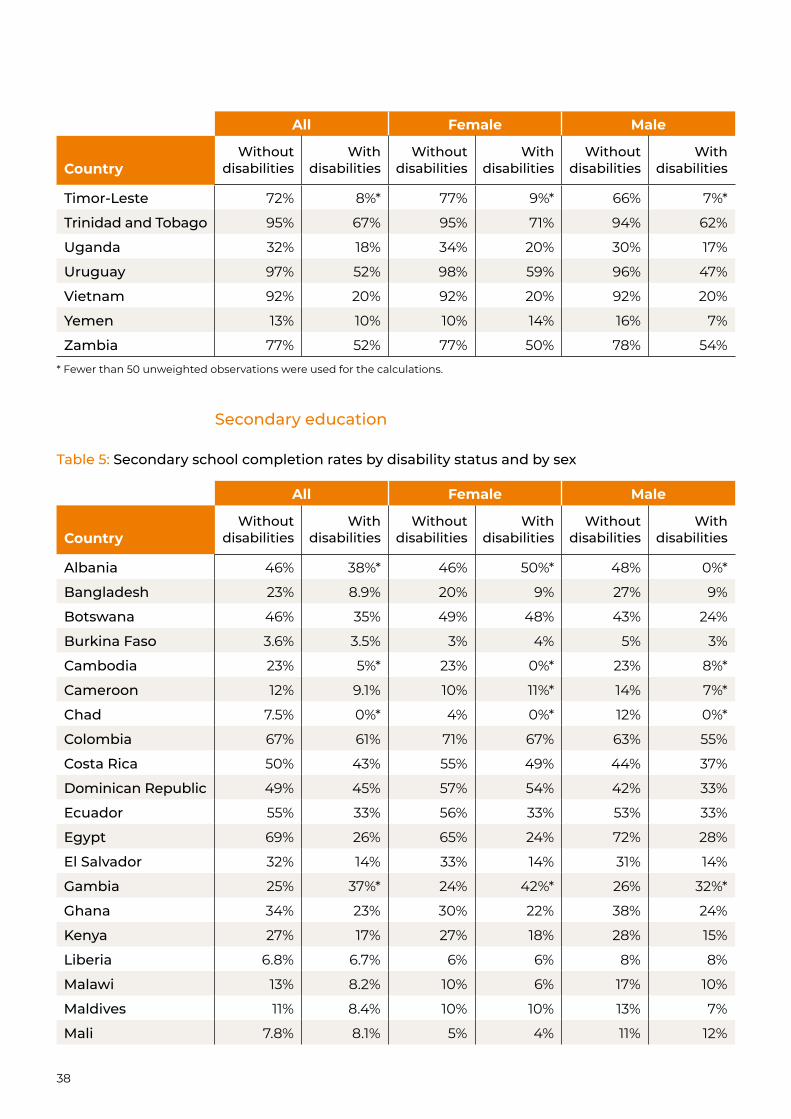
* Fewer than 50 unweighted observations were used for the calculations.
Table 5: Secondary school completion rates by disability status and by sex
All Female Male
CountryWithout
disabilitiesWith
disabilitiesWithout
disabilitiesWith
disabilitiesWithout
disabilitiesWith
disabilities
Albania 46% 38%* 46% 50%* 48% 0%*
Bangladesh 23% 8.9% 20% 9% 27% 9%
Botswana 46% 35% 49% 48% 43% 24%
Burkina Faso 3.6% 3.5% 3% 4% 5% 3%
Cambodia 23% 5%* 23% 0%* 23% 8%*
Cameroon 12% 9.1% 10% 11%* 14% 7%*
Chad 7.5% 0%* 4% 0%* 12% 0%*
Colombia 67% 61% 71% 67% 63% 55%
Costa Rica 50% 43% 55% 49% 44% 37%
Dominican Republic 49% 45% 57% 54% 42% 33%
Ecuador 55% 33% 56% 33% 53% 33%
Egypt 69% 26% 65% 24% 72% 28%
El Salvador 32% 14% 33% 14% 31% 14%
Gambia 25% 37%* 24% 42%* 26% 32%*
Ghana 34% 23% 30% 22% 38% 24%
Kenya 27% 17% 27% 18% 28% 15%
Liberia 6.8% 6.7% 6% 6% 8% 8%
Malawi 13% 8.2% 10% 6% 17% 10%
Maldives 11% 8.4% 10% 10% 13% 7%
Mali 7.8% 8.1% 5% 4% 11% 12%
Secondary education
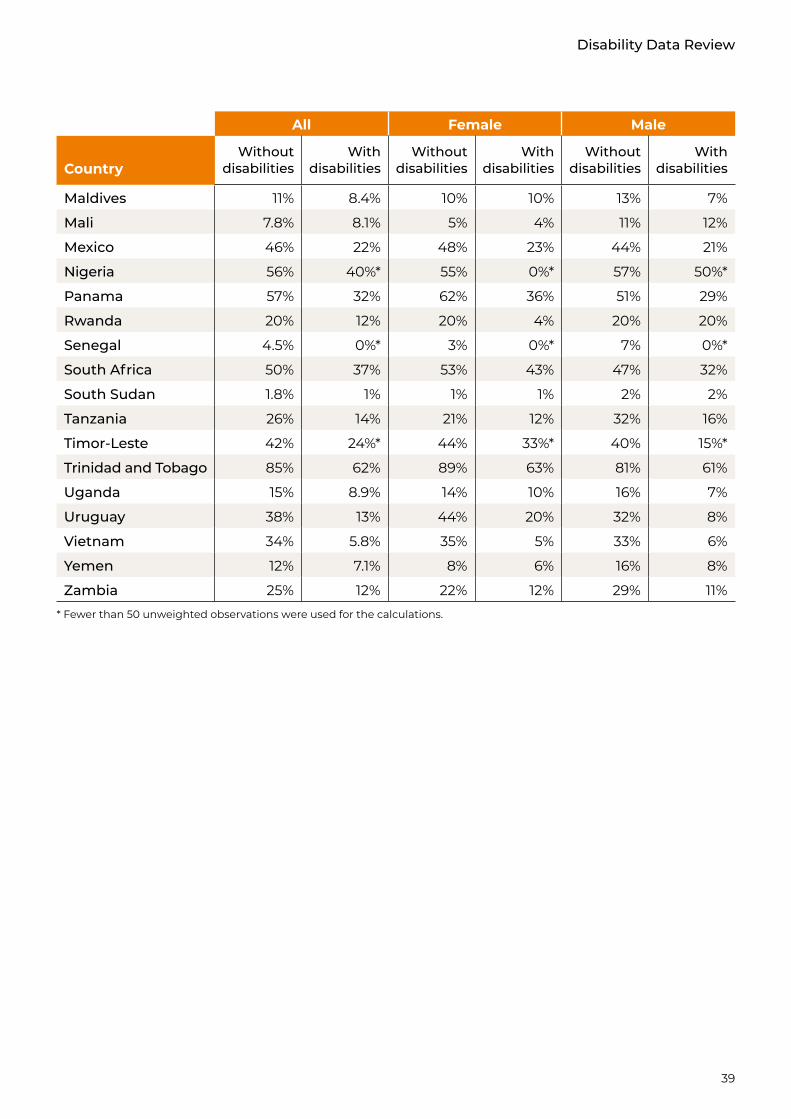
39
Disability Data Review
All Female Male
CountryWithout
disabilitiesWith
disabilitiesWithout
disabilitiesWith
disabilitiesWithout
disabilitiesWith
disabilities
Maldives 11% 8.4% 10% 10% 13% 7%
Mali 7.8% 8.1% 5% 4% 11% 12%
Mexico 46% 22% 48% 23% 44% 21%
Nigeria 56% 40%* 55% 0%* 57% 50%*
Panama 57% 32% 62% 36% 51% 29%
Rwanda 20% 12% 20% 4% 20% 20%
Senegal 4.5% 0%* 3% 0%* 7% 0%*
South Africa 50% 37% 53% 43% 47% 32%
South Sudan 1.8% 1% 1% 1% 2% 2%
Tanzania 26% 14% 21% 12% 32% 16%
Timor-Leste 42% 24%* 44% 33%* 40% 15%*
Trinidad and Tobago 85% 62% 89% 63% 81% 61%
Uganda 15% 8.9% 14% 10% 16% 7%
Uruguay 38% 13% 44% 20% 32% 8%
Vietnam 34% 5.8% 35% 5% 33% 6%
Yemen 12% 7.1% 8% 6% 16% 8%
Zambia 25% 12% 22% 12% 29% 11%
* Fewer than 50 unweighted observations were used for the calculations.
40
Table 6: Participation rate in organised learning (one year before official primary entry age) by disability status and by sex
All Female Male
CountryWithout
disabilitiesWith
disabilitiesWithout
disabilitiesWith
disabilitiesWithout
disabilitiesWith
disabilities
Bangladesh 22% 12% 22% 12% 21% 13%
Botswana 28% 17% 29% 22% 27% 11%
Burkina Faso 8% 8% 8% 6% 8% 11%
Cambodia 51% 12%* 52% 0%* 49% 25%*
Cameroon 58% 43%* 54% 40%* 61% 46%*
Chad 11% 10%* 11% 6%* 12% 12%*
Colombia 82% 65%* 82% 60%* 82% 68%*
Costa Rica 74% 78% 74% 84% 74% 74%
Dominican Republic 88% 73% 89% 72% 88% 73%
Ecuador 92% 81% 92% 82% 91% 79%
El Salvador 69% 38% 70% 39% 68% 37%
Ghana 84% 74% 84% 76% 84% 73%
Kenya 76% 65% 77% 67% 75% 64%
Liberia 40% 34% 40% 41% 40% 28%
Malawi 32% 27% 33% 31% 31% 24%
Maldives 92% 72%* 92% 67%* 91% 78%*
Mali 28% 27% 26% 35% 29% 21%
Mexico 88% 72% 88% 71% 88% 73%
Nigeria 57% 12%* 55% 12%* 59% 12%*
Panama 84% 67% 84% 75% 83% 59%
Rwanda 100% 100% 100% 100% 100% 100%
Senegal 10% 0%* 13% 0%* 8% 0%*
South Africa 93% 91% 93% 91% 93% 91%
Tanzania 49% 36% 51% 38% 48% 35%
Timor-Leste 43% 20%* 47% 0%* 39% 50%*
Trinidad and Tobago 94% 53% 94% 80% 93% 43%
Uganda 59% 55% 60% 57% 58% 53%
Uruguay 97% 98% 100% 100% 95% 96%
Vietnam 84% 28% 84% 25% 84% 30%
Yemen 13% 14%* 13% 25%* 13% 0%*
Zambia 29% 22% 30% 20% 28% 22%
* Fewer than 50 unweighted observations were used for the calculations.
4.2.2. Participation rate in organised learning (one year before the official primary entry age), by sex
41
Disability Data Review
Table 7: Participation rate of youths (15-24 years old) in education/training by disability status and by sex
All Female Male
CountryWithout
disabilitiesWith
disabilitiesWithout
disabilitiesWith
disabilitiesWithout
disabilitiesWith
disabilities
Albania 48% 19%* 46% 24%* 52% 0%*
Bangladesh 27% 13% 23% 12% 32% 14%
Botswana 47% 52% 46% 57% 47% 48%
Burkina Faso. 16% 9% 12% 8% 20% 10%
Cambodia 26% 12% 24% 10% 28% 14%
Cameroon 52% 40% 44% 37% 60% 44%
Chad 33% 23% 21% 5% 44% 36%
Colombia 46% 55% 48% 56% 43% 54%
Costa Rica 55% 53% 57% 59% 52% 47%
Dominican Republic 53% 48% 56% 54% 50% 41%
Ecuador 50% 39% 50% 41% 50% 38%
Egypt 83% 36% 82% 33% 85% 38%
El Salvador 38% 21% 37% 25% 40% 18%
Gambia 36% 31% 32% 27% 41% 36%
Ghana 47% 37% 41% 33% 52% 42%
Kenya 46% 44% 40% 41% 51% 47%
Liberia 55% 40% 49% 36% 62% 45%
Malawi 22% 19% 19% 18% 25% 20%
Maldives 44% 43% 41% 50% 47% 37%
Mali 25% 20% 18% 15% 31% 25%
Mexico 41% 29% 41% 32% 42% 28%
Nigeria 55% 25%* 50% 18%* 60% 29%*
Panama 48% 40% 50% 43% 46% 37%
Rwanda 49% 45% 47% 43% 50% 46%
Senegal 54% 36%* 60% 29%* 33% 43%*
South Africa 54% 50% 53% 51% 55% 50%
South Sudan 27% 26% 20% 20% 35% 33%
Tanzania 34% 24% 30% 24% 39% 24%
Timor-Leste 60% 20% 59% 13%* 61% 25%*
Trinidad and Tobago 49% 34% 54% 38% 44% 30%
4.3.1. Participation rate of youth and adults in formal and non-formal education and training in the previous 12 months, by sex
Participation rate of youth
42
All Female Male
CountryWithout
disabilitiesWith
disabilitiesWithout
disabilitiesWith
disabilitiesWithout
disabilitiesWith
disabilities
Uganda 36% 27% 31% 21% 42% 33%
Uruguay 43% 36% 46% 40% 39% 34%
Vietnam 36% 6% 36% 6% 35% 6%
Yemen 34% 21% 24% 18% 45% 23%
Zambia 44% 36% 37% 31% 52% 40%
* Fewer than 50 unweighted observations were used for the calculations.
Participation rate of adults
Table 8: Participation rate of adults (25-64 years old) in education/training by disability status and by sex
All Female Male
CountryWithout
disabilitiesWith
disabilitiesWithout
disabilitiesWith
disabilitiesWithout
disabilitiesWith
disabilities
Bangladesh 0.5% 0.3% 0.3% 0.2% 0.8% 0.3%
Botswana 2.5% 1.6% 2.7% 2.2% 2.2% 1%
Burkina Faso 1% 0.5% 0.8% 0.4% 1.3% 0.6%
Costa Rica 9.3% 5.9% 10% 6.5% 8.3% 5.1%
Dominican Republic 9.7% 6.5% 12% 7.5% 7.6% 5.2%
Ecuador 8.6% 6.5% 9.4% 7.2% 7.7% 5.9%
El Salvador 2.8% 1.6% 2.6% 1.5% 3.1% 1.6%
Ghana 2.6% 1.3% 1.8% 0.8% 3.5% 1.8%
Kenya 3.5% 2.6% 3.1% 2.3% 3.9% 3%
Liberia 11% 5.5% 8.6% 4.2% 13% 6.8%
Malawi 0.2% 0.1% 0.1% 0.1% 0.3% 0.1%
Mali 1% 0.9% 0.6% 0.5% 1.4% 1.1%
Mexico 2.9% 1.8% 3% 2.1% 2.8% 1.5%
Nigeria 4.5% 0.5% 3.4% 1% 5.7% 0%
Panama 6% 2.9% 6.6% 2.7% 5.4% 3.1%
Rwanda 6.8% 4.4% 4.8% 1.9% 9% 7%
South Africa 6.6% 4.9% 7.1% 5.2% 6.1% 4.5%
South Sudan 4.3% 2.6% 2.3% 1.2% 6.6% 3.9%
Tanzania 1.4% 0.7% 1.2% 0.6% 1.6% 0.8%
Trinidad and Tobago 7.4% 3.7% 9.5% 4.3% 5.2% 3.1%
Uruguay 1.8% 1.5% 1.9% 1.8% 1.6% 1.2%
Vietnam 1% 0.1% 0.9% 0.1% 1.1% 0.1%
Zambia 3.1% 2.2% 3% 2% 3.3% 2.4%
43
Disability Data Review
Table 9: University completion rates by disability status and by sex (25-54 years old)
All Female Male
CountryWithout
disabilitiesWith
disabilitiesWithout
disabilitiesWith
disabilitiesWithout
disabilitiesWith
disabilities
Albania 14% 5.7% 14% 6.1% 14% 2.3%*
Bangladesh 5% 1.8% 2.8% 0.9% 7.2% 2.6%
Botswana 8.8% 8.7% 8.5% 9% 9.2% 8.5%
Burkina Faso 1.4% 1.1% 0.7% 0.5% 2.4% 1.6%
Cambodia 6.3% 1.9% 4% 1.5% 8.9% 2.3%
Cameroon 7.4% 4.4% 4.8% 3.4% 11% 5.3%
Chad 2.4% 0.7% 0.9% 0.3% 4% 1%
Colombia 21% 25% 23% 26% 18% 23%
Costa Rica 21% 15% 22% 15% 21% 14%
Dominican Republic 12% 11% 15% 12% 9.6% 10%
Ecuador 12% 5.7% 12% 5.9% 11% 5.5%
Egypt 15% 6% 12% 4.3% 18% 6.7%
El Salvador 6.1% 3.6% 5.7% 3.6% 6.8% 3.6%
Gambia 6.1% 8.2% 4.1% 5.4% 8.6% 13%
Ghana 2.4% 1.6% 1.4% 1% 3.5% 2.3%
Kenya 2.4% 1.6% 1.7% 1.1% 3.2% 2.2%
Liberia 2.1% 2.2% 1.1% 1% 3% 3.3%
Malawi 0.7% 0.3% 0.4% 0.1% 1% 0.6%
Maldives 3.7% 1.1% 3.1% 0.5% 4.3% 2.1%
Mali 1.9% 1.9% 0.8% 0.9% 3.2% 2.6%
Mexico 14% 5.3% 13% 4.9% 15% 5.6%
Nigeria 9.1% 4.5%* 6.1% 0%* 12% 7.1%*
Panama 19% 6.7% 22% 8.5% 15% 5.2%
Rwanda 10.9% 5.3% 8.6% 3.1% 13.1% 6.8%
Senegal 4.8% 0% 0% 0% 9.4% 0%
South Africa 8% 3.6% 8.3% 3.6% 7.7% 3.7%
South Sudan 1.1% 0.7% 0.5% 0.2% 1.8% 1.1%
Tanzania 3.2% 1.4% 2.5% 1% 4.1% 1.9%
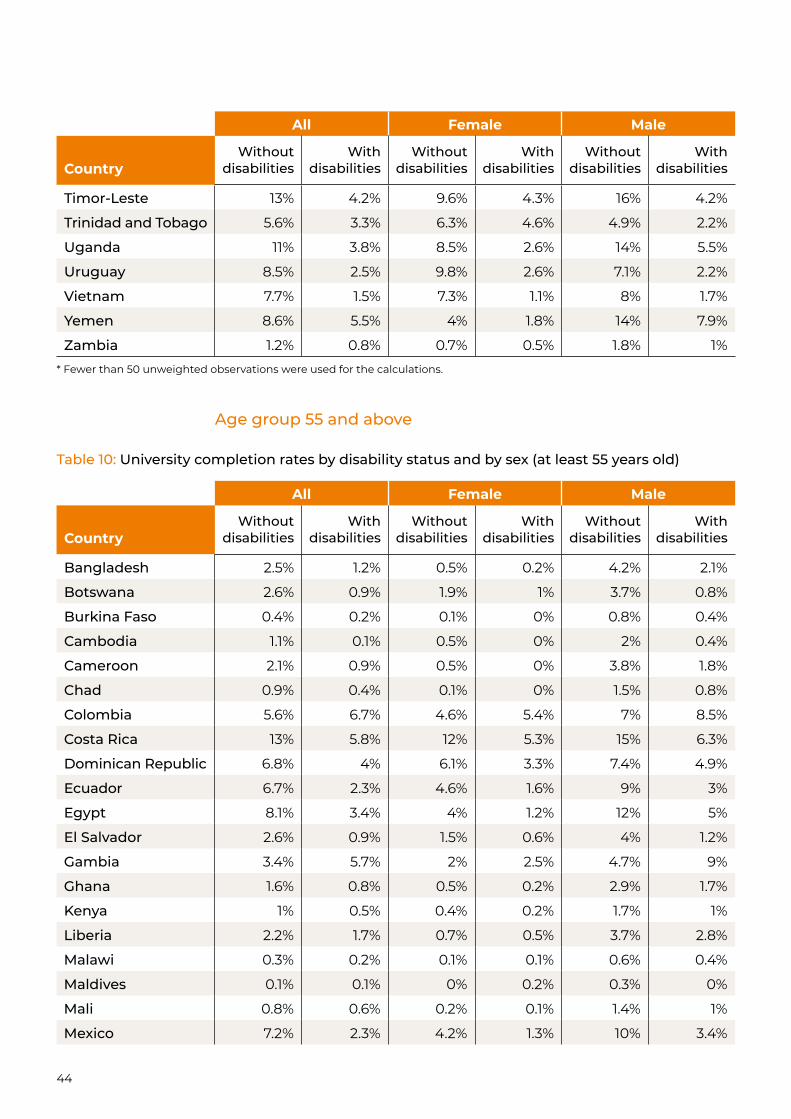
Relevant to SDG target 4.5: 4.5.x University completion rates (or university access rates as proxy)Statistics on university completion rates are given for two age groups: 25-54 years old (Table 9) and 55 and above (Table 10).
Age group 25-54
44
All Female Male
CountryWithout
disabilitiesWith
disabilitiesWithout
disabilitiesWith
disabilitiesWithout
disabilitiesWith
disabilities
Timor-Leste 13% 4.2% 9.6% 4.3% 16% 4.2%
Trinidad and Tobago 5.6% 3.3% 6.3% 4.6% 4.9% 2.2%
Uganda 11% 3.8% 8.5% 2.6% 14% 5.5%
Uruguay 8.5% 2.5% 9.8% 2.6% 7.1% 2.2%
Vietnam 7.7% 1.5% 7.3% 1.1% 8% 1.7%
Yemen 8.6% 5.5% 4% 1.8% 14% 7.9%
Zambia 1.2% 0.8% 0.7% 0.5% 1.8% 1%
* Fewer than 50 unweighted observations were used for the calculations.
Table 10: University completion rates by disability status and by sex (at least 55 years old)
All Female Male
CountryWithout
disabilitiesWith
disabilitiesWithout
disabilitiesWith
disabilitiesWithout
disabilitiesWith
disabilities
Bangladesh 2.5% 1.2% 0.5% 0.2% 4.2% 2.1%
Botswana 2.6% 0.9% 1.9% 1% 3.7% 0.8%
Burkina Faso 0.4% 0.2% 0.1% 0% 0.8% 0.4%
Cambodia 1.1% 0.1% 0.5% 0% 2% 0.4%
Cameroon 2.1% 0.9% 0.5% 0% 3.8% 1.8%
Chad 0.9% 0.4% 0.1% 0% 1.5% 0.8%
Colombia 5.6% 6.7% 4.6% 5.4% 7% 8.5%
Costa Rica 13% 5.8% 12% 5.3% 15% 6.3%
Dominican Republic 6.8% 4% 6.1% 3.3% 7.4% 4.9%
Ecuador 6.7% 2.3% 4.6% 1.6% 9% 3%
Egypt 8.1% 3.4% 4% 1.2% 12% 5%
El Salvador 2.6% 0.9% 1.5% 0.6% 4% 1.2%
Gambia 3.4% 5.7% 2% 2.5% 4.7% 9%
Ghana 1.6% 0.8% 0.5% 0.2% 2.9% 1.7%
Kenya 1% 0.5% 0.4% 0.2% 1.7% 1%
Liberia 2.2% 1.7% 0.7% 0.5% 3.7% 2.8%
Malawi 0.3% 0.2% 0.1% 0.1% 0.6% 0.4%
Maldives 0.1% 0.1% 0% 0.2% 0.3% 0%
Mali 0.8% 0.6% 0.2% 0.1% 1.4% 1%
Mexico 7.2% 2.3% 4.2% 1.3% 10% 3.4%
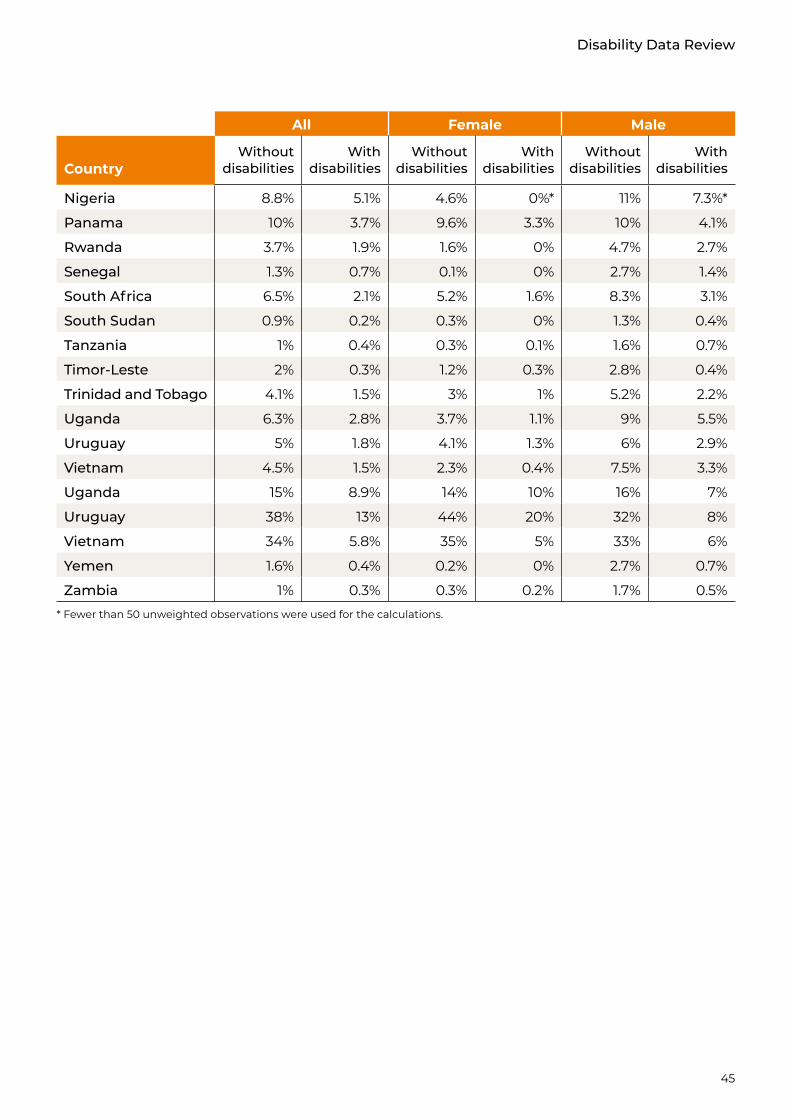
Age group 55 and above
45
Disability Data Review
All Female Male
CountryWithout
disabilitiesWith
disabilitiesWithout
disabilitiesWith
disabilitiesWithout
disabilitiesWith
disabilities
Nigeria 8.8% 5.1% 4.6% 0%* 11% 7.3%*
Panama 10% 3.7% 9.6% 3.3% 10% 4.1%
Rwanda 3.7% 1.9% 1.6% 0% 4.7% 2.7%
Senegal 1.3% 0.7% 0.1% 0% 2.7% 1.4%
South Africa 6.5% 2.1% 5.2% 1.6% 8.3% 3.1%
South Sudan 0.9% 0.2% 0.3% 0% 1.3% 0.4%
Tanzania 1% 0.4% 0.3% 0.1% 1.6% 0.7%
Timor-Leste 2% 0.3% 1.2% 0.3% 2.8% 0.4%
Trinidad and Tobago 4.1% 1.5% 3% 1% 5.2% 2.2%
Uganda 6.3% 2.8% 3.7% 1.1% 9% 5.5%
Uruguay 5% 1.8% 4.1% 1.3% 6% 2.9%
Vietnam 4.5% 1.5% 2.3% 0.4% 7.5% 3.3%
Uganda 15% 8.9% 14% 10% 16% 7%
Uruguay 38% 13% 44% 20% 32% 8%
Vietnam 34% 5.8% 35% 5% 33% 6%
Yemen 1.6% 0.4% 0.2% 0% 2.7% 0.7%
Zambia 1% 0.3% 0.3% 0.2% 1.7% 0.5%
* Fewer than 50 unweighted observations were used for the calculations.
46
Table 11: University completion rates by disability status and by sex (25-54 years old)
All Female Male
CountryWithout
disabilitiesWith
disabilitiesWithout
disabilitiesWith
disabilitiesWithout
disabilitiesWith
disabilities
Bangladesh 61% 31% 64% 32% 59% 29%
Burkina Faso 25% 21% 22% 19% 29% 23%
Costa Rica 90% 84% 90% 86% 90% 83%
Dominican Republic 79% 78% 80% 83% 78% 73%
Ecuador 93% 79% 94% 79% 93% 78%
Egypt 89% 44% 86% 40% 91% 46%
El Salvador 86% 57% 87% 57% 85% 57%
Ghana 88% 79% 86% 77% 90% 81%
Liberia 68% 58% 64% 55% 72% 60%
Malawi 55% 51% 55% 52% 54% 50%
Mali 46% 44% 37% 36% 54% 52%
Mexico 90% 69% 91% 70% 90% 68%
Nigeria 64% 36% 62% 21% 66% 52%
Panama 98% 74% 98% 73% 98% 74%
Rwanda 97% 96% 96% 94% 97% 98%
South Sudan 35% 38% 30% 33% 39% 42%
Tanzania 66% 39% 67% 40% 65% 39%
Uruguay 100% 69% 100% 74% 100% 65%
Vietnam 93% 34% 93% 31% 93% 36%
Zambia 64% 52% 64% 52% 64% 53%
4.6.1(a). Proportion of population in a given age group achieving at least a fixed level of proficiency in functional literacy skills, by sexStatistics on literacy rates are provided for three age groups: 1) Less than 25 years old (Table 11), 2) at least 25 years old (Table 12) and 3) at least 15 years old (Table 13).
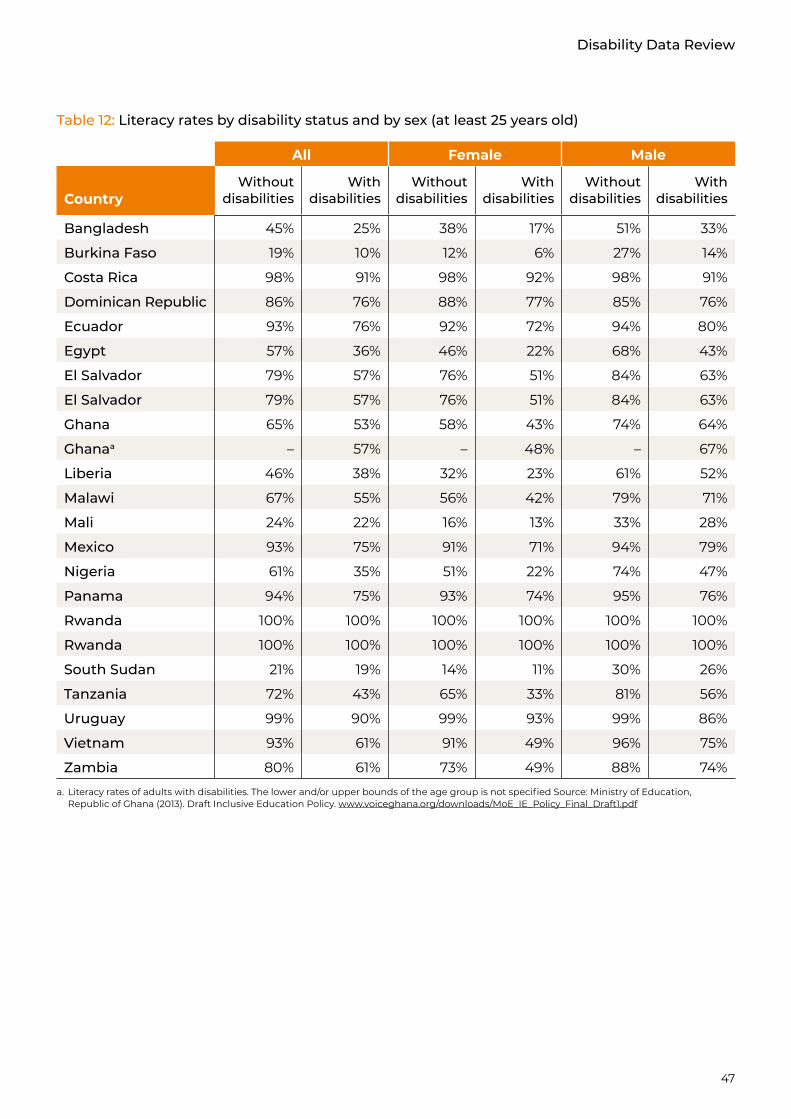
47
Disability Data Review
Table 12: Literacy rates by disability status and by sex (at least 25 years old)
All Female Male
CountryWithout
disabilitiesWith
disabilitiesWithout
disabilitiesWith
disabilitiesWithout
disabilitiesWith
disabilities
Bangladesh 45% 25% 38% 17% 51% 33%
Burkina Faso 19% 10% 12% 6% 27% 14%
Costa Rica 98% 91% 98% 92% 98% 91%
Dominican Republic 86% 76% 88% 77% 85% 76%
Ecuador 93% 76% 92% 72% 94% 80%
Egypt 57% 36% 46% 22% 68% 43%
El Salvador 79% 57% 76% 51% 84% 63%
El Salvador 79% 57% 76% 51% 84% 63%
Ghana 65% 53% 58% 43% 74% 64%
Ghanaa – 57% – 48% – 67%
Liberia 46% 38% 32% 23% 61% 52%
Malawi 67% 55% 56% 42% 79% 71%
Mali 24% 22% 16% 13% 33% 28%
Mexico 93% 75% 91% 71% 94% 79%
Nigeria 61% 35% 51% 22% 74% 47%
Panama 94% 75% 93% 74% 95% 76%
Rwanda 100% 100% 100% 100% 100% 100%
Rwanda 100% 100% 100% 100% 100% 100%
South Sudan 21% 19% 14% 11% 30% 26%
Tanzania 72% 43% 65% 33% 81% 56%
Uruguay 99% 90% 99% 93% 99% 86%
Vietnam 93% 61% 91% 49% 96% 75%
Zambia 80% 61% 73% 49% 88% 74%
a. Literacy rates of adults with disabilities. The lower and/or upper bounds of the age group is not specified Source: Ministry of Education, Republic of Ghana (2013). Draft Inclusive Education Policy. www.voiceghana.org/downloads/MoE_IE_Policy_Final_Draft1.pdf
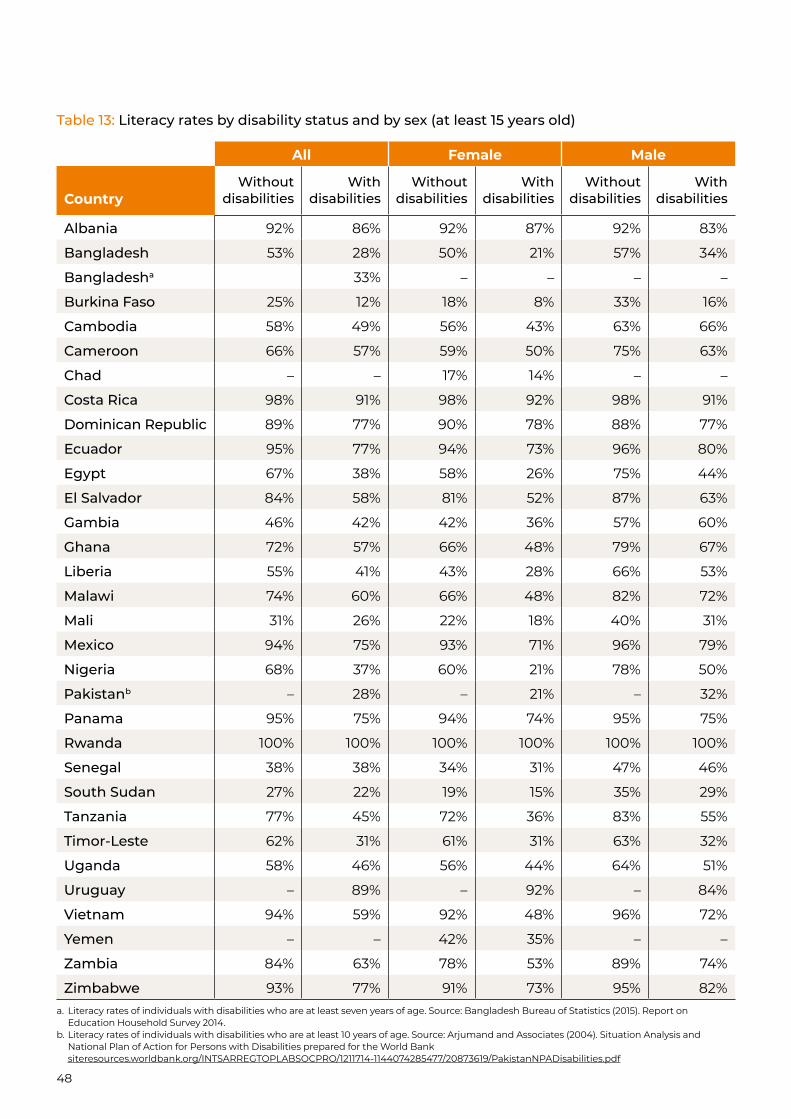
48
Table 13: Literacy rates by disability status and by sex (at least 15 years old)
All Female Male
CountryWithout
disabilitiesWith
disabilitiesWithout
disabilitiesWith
disabilitiesWithout
disabilitiesWith
disabilities
Albania 92% 86% 92% 87% 92% 83%
Bangladesh 53% 28% 50% 21% 57% 34%
Bangladesha 33% – – – –
Burkina Faso 25% 12% 18% 8% 33% 16%
Cambodia 58% 49% 56% 43% 63% 66%
Cameroon 66% 57% 59% 50% 75% 63%
Chad – – 17% 14% – –
Costa Rica 98% 91% 98% 92% 98% 91%
Dominican Republic 89% 77% 90% 78% 88% 77%
Ecuador 95% 77% 94% 73% 96% 80%
Egypt 67% 38% 58% 26% 75% 44%
El Salvador 84% 58% 81% 52% 87% 63%
Gambia 46% 42% 42% 36% 57% 60%
Ghana 72% 57% 66% 48% 79% 67%
Liberia 55% 41% 43% 28% 66% 53%
Malawi 74% 60% 66% 48% 82% 72%
Mali 31% 26% 22% 18% 40% 31%
Mexico 94% 75% 93% 71% 96% 79%
Nigeria 68% 37% 60% 21% 78% 50%
Pakistanb – 28% – 21% – 32%
Panama 95% 75% 94% 74% 95% 75%
Rwanda 100% 100% 100% 100% 100% 100%
Senegal 38% 38% 34% 31% 47% 46%
South Sudan 27% 22% 19% 15% 35% 29%
Tanzania 77% 45% 72% 36% 83% 55%
Timor-Leste 62% 31% 61% 31% 63% 32%
Uganda 58% 46% 56% 44% 64% 51%
Uruguay – 89% – 92% – 84%
Vietnam 94% 59% 92% 48% 96% 72%
Yemen – – 42% 35% – –
Zambia 84% 63% 78% 53% 89% 74%
Zimbabwe 93% 77% 91% 73% 95% 82%
a. Literacy rates of individuals with disabilities who are at least seven years of age. Source: Bangladesh Bureau of Statistics (2015). Report on Education Household Survey 2014.
b. Literacy rates of individuals with disabilities who are at least 10 years of age. Source: Arjumand and Associates (2004). Situation Analysis and National Plan of Action for Persons with Disabilities prepared for the World Bank siteresources.worldbank.org/INTSARREGTOPLABSOCPRO/1211714-1144074285477/20873619/PakistanNPADisabilities.pdf
49
Disability Data Review
Thematic area 2: Economic empowerment
1.2.1: Proportion of population living below the national poverty line, by sex and ageAs our sources of data (censuses, DHS and household surveys) do not routinely collect the data necessary to calculate indicator 1.2.1, we contacted the World Bank (the custodian agency for this indicator) for assistance. Currently, it is only possible to disaggregate by disability for one of our 40 countries of interest (Bangladesh). The Trust Fund for Statistical Capacity Building, a World Bank initiative, is supporting 40 upcoming household surveys, 10 of which will include the Washington Group Short Set; this initiative will increase the data availability of 1.2.1 for disability disaggregation.
Information about the proportion of poor people by disability status was also provided directly by the National Institute of Statistics in Rwanda29 and Statistics South Africa30. As recent data was not easy to obtain for other countries, this report makes use of slightly older statistics on poverty by disability status taken from a paper written by Mitra et al. (2013) and based on data of the 2002-2004 World Health Survey. This is included in the table below. In Mitra et al.’s (2013) paper as well as in Rwanda, poverty is estimated at the household level and disability is measured at the individual level31. Regarding South Africa and Bangladesh, details about the calculations were not provided. It is worth noting that Rwanda provided statistics by quintile, so we considered the poorest quintile for our analysis. In contrast the other sources we used (Mitra et al.’s paper, South Africa and Bangladesh) provided information about the poverty rates (those living in poverty and those not living in poverty).
29. Calculations from National Institute of Statistics in Rwanda are based on EICV4 and are presented in the report on social protection. www.statistics.gov.rw/publication/rwanda-social-protection-and-vup-report-results-eicv-4
30. Calculations from Statistics South Africa are based on Living Conditions Survey 2014-2015. They were directly sent to us by this institution.
31. In the Mitra et al (2013) study, poverty was measured at household level. One household informant responded to a household questionnaire including questions on household expenditures, living conditions, assets, and household demographics (size and number of children). Within each household, an individual respondent of 18 years of age or older was selected randomly using Kish tables. That person then responded to an individual-level questionnaire, including questions about his/her own demographic characteristics, disability and health, employment, and education.
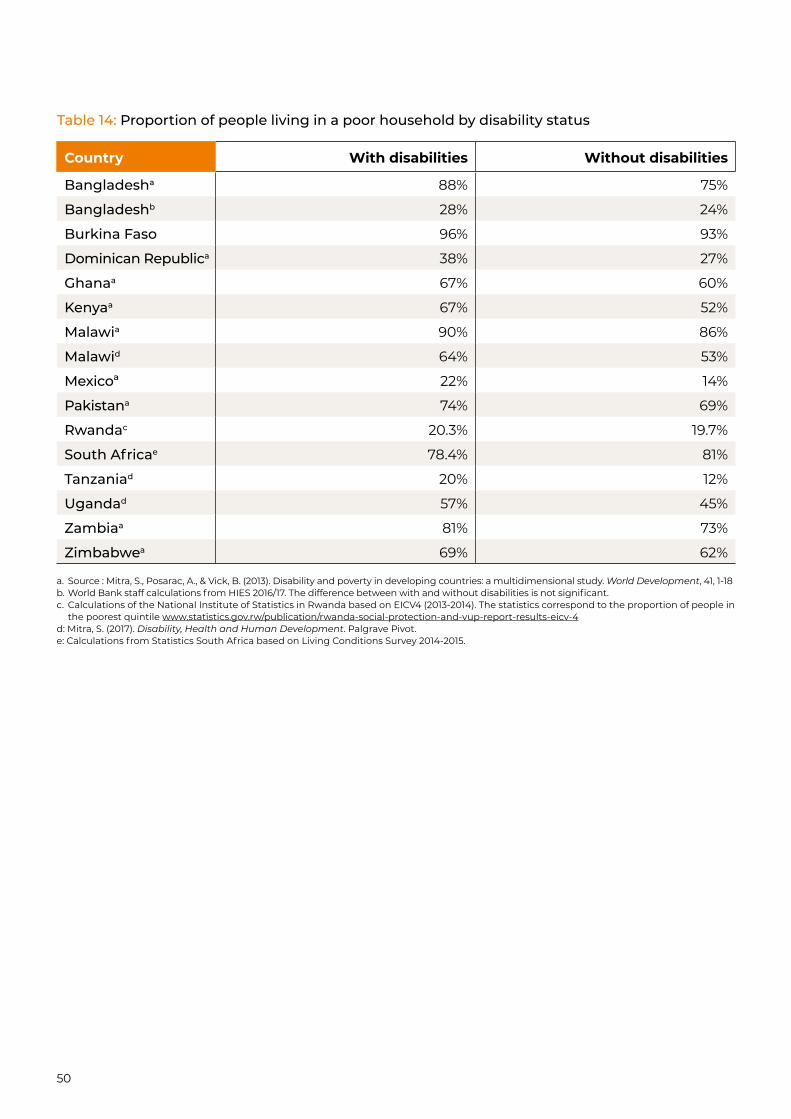
50
Table 14: Proportion of people living in a poor household by disability status
Country With disabilities Without disabilities
Bangladesha 88% 75%
Bangladeshb 28% 24%
Burkina Faso 96% 93%
Dominican Republica 38% 27%
Ghanaa 67% 60%
Kenyaa 67% 52%
Malawia 90% 86%
Malawid 64% 53%
Mexicoª 22% 14%
Pakistana 74% 69%
Rwandac 20.3% 19.7%
South Africae 78.4% 81%
Tanzaniad 20% 12%
Ugandad 57% 45%
Zambiaa 81% 73%
Zimbabwea 69% 62%
a. Source : Mitra, S., Posarac, A., & Vick, B. (2013). Disability and poverty in developing countries: a multidimensional study. World Development, 41, 1-18b. World Bank staff calculations from HIES 2016/17. The difference between with and without disabilities is not significant.c. Calculations of the National Institute of Statistics in Rwanda based on EICV4 (2013-2014). The statistics correspond to the proportion of people in
the poorest quintile www.statistics.gov.rw/publication/rwanda-social-protection-and-vup-report-results-eicv-4d: Mitra, S. (2017). Disability, Health and Human Development. Palgrave Pivot.e: Calculations from Statistics South Africa based on Living Conditions Survey 2014-2015.
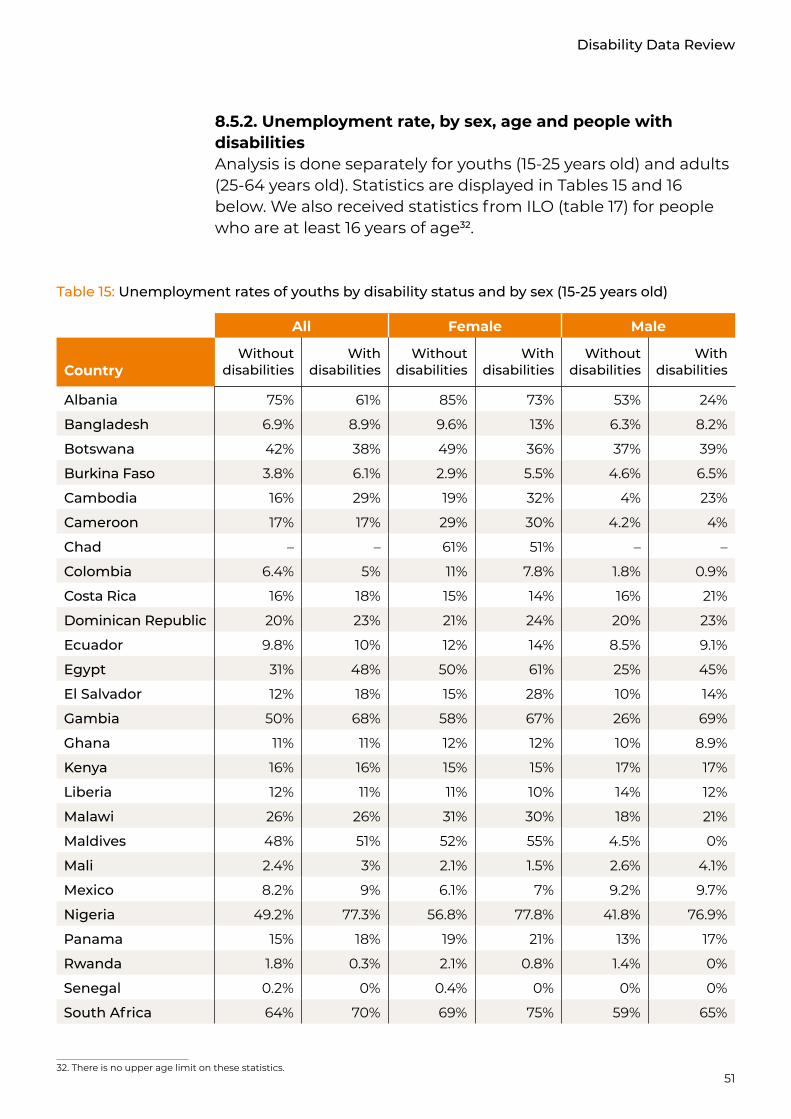
51
Disability Data Review
Table 15: Unemployment rates of youths by disability status and by sex (15-25 years old)
All Female Male
CountryWithout
disabilitiesWith
disabilitiesWithout
disabilitiesWith
disabilitiesWithout
disabilitiesWith
disabilities
Albania 75% 61% 85% 73% 53% 24%
Bangladesh 6.9% 8.9% 9.6% 13% 6.3% 8.2%
Botswana 42% 38% 49% 36% 37% 39%
Burkina Faso 3.8% 6.1% 2.9% 5.5% 4.6% 6.5%
Cambodia 16% 29% 19% 32% 4% 23%
Cameroon 17% 17% 29% 30% 4.2% 4%
Chad – – 61% 51% – –
Colombia 6.4% 5% 11% 7.8% 1.8% 0.9%
Costa Rica 16% 18% 15% 14% 16% 21%
Dominican Republic 20% 23% 21% 24% 20% 23%
Ecuador 9.8% 10% 12% 14% 8.5% 9.1%
Egypt 31% 48% 50% 61% 25% 45%
El Salvador 12% 18% 15% 28% 10% 14%
Gambia 50% 68% 58% 67% 26% 69%
Ghana 11% 11% 12% 12% 10% 8.9%
Kenya 16% 16% 15% 15% 17% 17%
Liberia 12% 11% 11% 10% 14% 12%
Malawi 26% 26% 31% 30% 18% 21%
Maldives 48% 51% 52% 55% 4.5% 0%
Mali 2.4% 3% 2.1% 1.5% 2.6% 4.1%
Mexico 8.2% 9% 6.1% 7% 9.2% 9.7%
Nigeria 49.2% 77.3% 56.8% 77.8% 41.8% 76.9%
Panama 15% 18% 19% 21% 13% 17%
Rwanda 1.8% 0.3% 2.1% 0.8% 1.4% 0%
Senegal 0.2% 0% 0.4% 0% 0% 0%
South Africa 64% 70% 69% 75% 59% 65%
8.5.2. Unemployment rate, by sex, age and people with disabilitiesAnalysis is done separately for youths (15-25 years old) and adults (25-64 years old). Statistics are displayed in Tables 15 and 16 below. We also received statistics from ILO (table 17) for people who are at least 16 years of age32.
32. There is no upper age limit on these statistics.
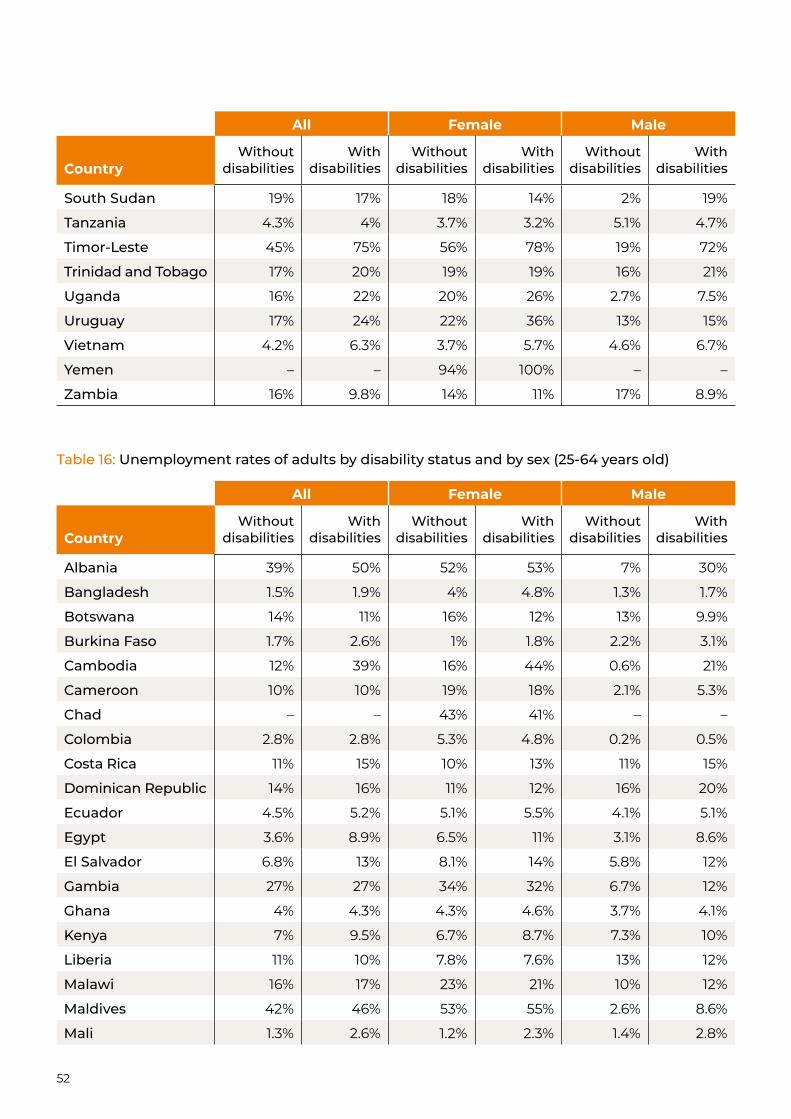
52
All Female Male
CountryWithout
disabilitiesWith
disabilitiesWithout
disabilitiesWith
disabilitiesWithout
disabilitiesWith
disabilities
South Sudan 19% 17% 18% 14% 2% 19%
Tanzania 4.3% 4% 3.7% 3.2% 5.1% 4.7%
Timor-Leste 45% 75% 56% 78% 19% 72%
Trinidad and Tobago 17% 20% 19% 19% 16% 21%
Uganda 16% 22% 20% 26% 2.7% 7.5%
Uruguay 17% 24% 22% 36% 13% 15%
Vietnam 4.2% 6.3% 3.7% 5.7% 4.6% 6.7%
Yemen – – 94% 100% – –
Zambia 16% 9.8% 14% 11% 17% 8.9%
Table 16: Unemployment rates of adults by disability status and by sex (25-64 years old)
All Female Male
CountryWithout
disabilitiesWith
disabilitiesWithout
disabilitiesWith
disabilitiesWithout
disabilitiesWith
disabilities
Albania 39% 50% 52% 53% 7% 30%
Bangladesh 1.5% 1.9% 4% 4.8% 1.3% 1.7%
Botswana 14% 11% 16% 12% 13% 9.9%
Burkina Faso 1.7% 2.6% 1% 1.8% 2.2% 3.1%
Cambodia 12% 39% 16% 44% 0.6% 21%
Cameroon 10% 10% 19% 18% 2.1% 5.3%
Chad – – 43% 41% – –
Colombia 2.8% 2.8% 5.3% 4.8% 0.2% 0.5%
Costa Rica 11% 15% 10% 13% 11% 15%
Dominican Republic 14% 16% 11% 12% 16% 20%
Ecuador 4.5% 5.2% 5.1% 5.5% 4.1% 5.1%
Egypt 3.6% 8.9% 6.5% 11% 3.1% 8.6%
El Salvador 6.8% 13% 8.1% 14% 5.8% 12%
Gambia 27% 27% 34% 32% 6.7% 12%
Ghana 4% 4.3% 4.3% 4.6% 3.7% 4.1%
Kenya 7% 9.5% 6.7% 8.7% 7.3% 10%
Liberia 11% 10% 7.8% 7.6% 13% 12%
Malawi 16% 17% 23% 21% 10% 12%
Maldives 42% 46% 53% 55% 2.6% 8.6%
Mali 1.3% 2.6% 1.2% 2.3% 1.4% 2.8%
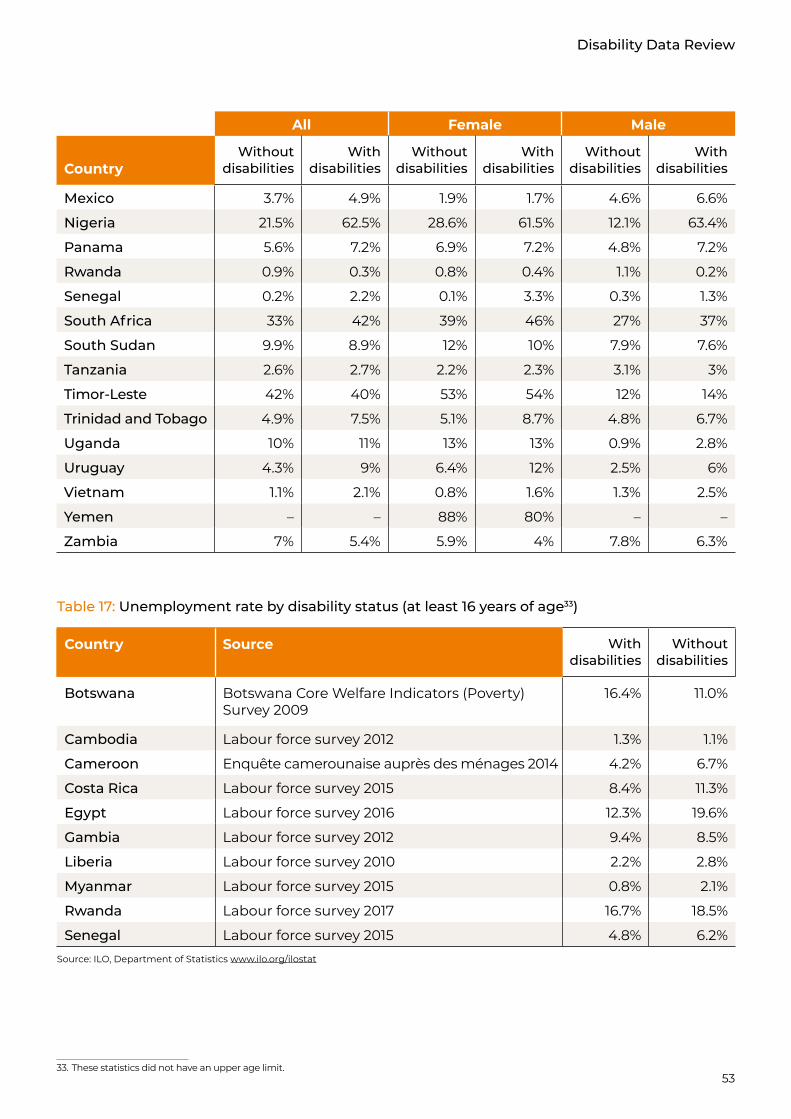
53
Disability Data Review
All Female Male
CountryWithout
disabilitiesWith
disabilitiesWithout
disabilitiesWith
disabilitiesWithout
disabilitiesWith
disabilities
Mexico 3.7% 4.9% 1.9% 1.7% 4.6% 6.6%
Nigeria 21.5% 62.5% 28.6% 61.5% 12.1% 63.4%
Panama 5.6% 7.2% 6.9% 7.2% 4.8% 7.2%
Rwanda 0.9% 0.3% 0.8% 0.4% 1.1% 0.2%
Senegal 0.2% 2.2% 0.1% 3.3% 0.3% 1.3%
South Africa 33% 42% 39% 46% 27% 37%
South Sudan 9.9% 8.9% 12% 10% 7.9% 7.6%
Tanzania 2.6% 2.7% 2.2% 2.3% 3.1% 3%
Timor-Leste 42% 40% 53% 54% 12% 14%
Trinidad and Tobago 4.9% 7.5% 5.1% 8.7% 4.8% 6.7%
Uganda 10% 11% 13% 13% 0.9% 2.8%
Uruguay 4.3% 9% 6.4% 12% 2.5% 6%
Vietnam 1.1% 2.1% 0.8% 1.6% 1.3% 2.5%
Yemen – – 88% 80% – –
Zambia 7% 5.4% 5.9% 4% 7.8% 6.3%
Table 17: Unemployment rate by disability status (at least 16 years of age33)
Country Source With disabilities
Without disabilities
Botswana Botswana Core Welfare Indicators (Poverty) Survey 2009
16.4% 11.0%
Cambodia Labour force survey 2012 1.3% 1.1%
Cameroon Enquête camerounaise auprès des ménages 2014 4.2% 6.7%
Costa Rica Labour force survey 2015 8.4% 11.3%
Egypt Labour force survey 2016 12.3% 19.6%
Gambia Labour force survey 2012 9.4% 8.5%
Liberia Labour force survey 2010 2.2% 2.8%
Myanmar Labour force survey 2015 0.8% 2.1%
Rwanda Labour force survey 2017 16.7% 18.5%
Senegal Labour force survey 2015 4.8% 6.2%Source: ILO, Department of Statistics www.ilo.org/ilostat
33. These statistics did not have an upper age limit.
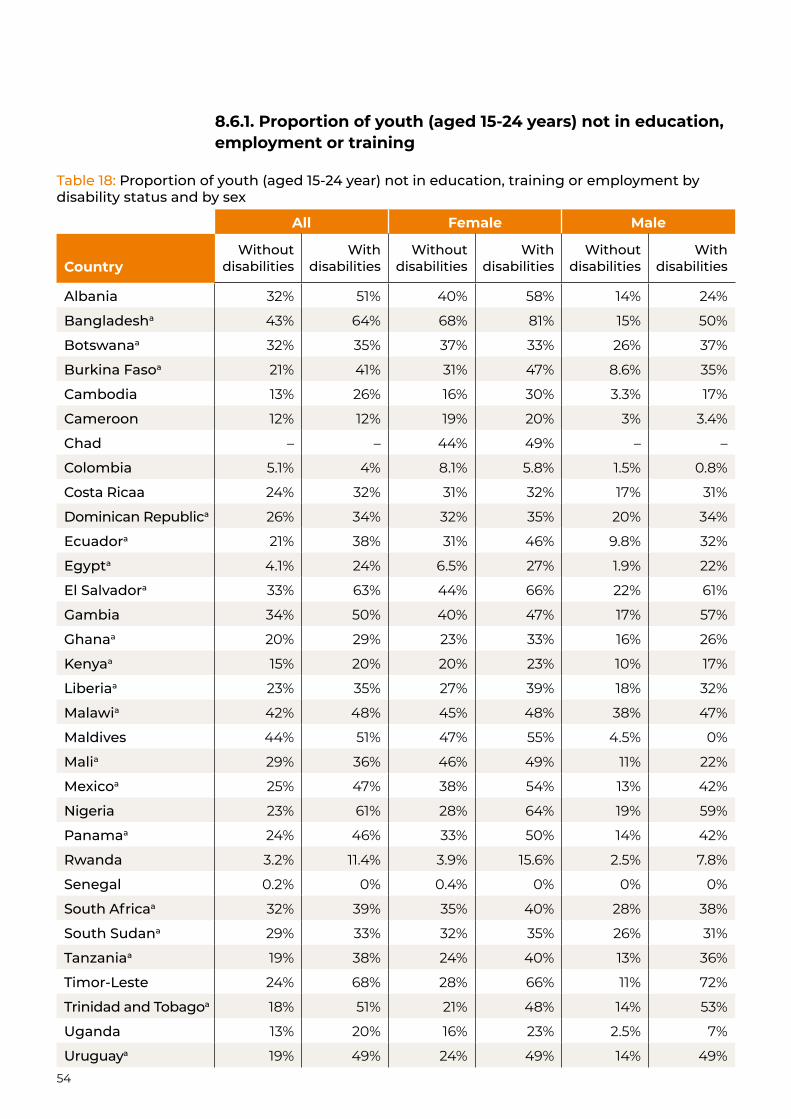
54
Table 18: Proportion of youth (aged 15-24 year) not in education, training or employment by disability status and by sex
All Female Male
CountryWithout
disabilitiesWith
disabilitiesWithout
disabilitiesWith
disabilitiesWithout
disabilitiesWith
disabilities
Albania 32% 51% 40% 58% 14% 24%
Bangladesha 43% 64% 68% 81% 15% 50%
Botswanaa 32% 35% 37% 33% 26% 37%
Burkina Fasoa 21% 41% 31% 47% 8.6% 35%
Cambodia 13% 26% 16% 30% 3.3% 17%
Cameroon 12% 12% 19% 20% 3% 3.4%
Chad – – 44% 49% – –
Colombia 5.1% 4% 8.1% 5.8% 1.5% 0.8%
Costa Ricaa 24% 32% 31% 32% 17% 31%
Dominican Republica 26% 34% 32% 35% 20% 34%
Ecuadora 21% 38% 31% 46% 9.8% 32%
Egypta 4.1% 24% 6.5% 27% 1.9% 22%
El Salvadora 33% 63% 44% 66% 22% 61%
Gambia 34% 50% 40% 47% 17% 57%
Ghanaa 20% 29% 23% 33% 16% 26%
Kenyaa 15% 20% 20% 23% 10% 17%
Liberiaa 23% 35% 27% 39% 18% 32%
Malawia 42% 48% 45% 48% 38% 47%
Maldives 44% 51% 47% 55% 4.5% 0%
Malia 29% 36% 46% 49% 11% 22%
Mexicoa 25% 47% 38% 54% 13% 42%
Nigeria 23% 61% 28% 64% 19% 59%
Panamaa 24% 46% 33% 50% 14% 42%
Rwanda 3.2% 11.4% 3.9% 15.6% 2.5% 7.8%
Senegal 0.2% 0% 0.4% 0% 0% 0%
South Africaa 32% 39% 35% 40% 28% 38%
South Sudana 29% 33% 32% 35% 26% 31%
Tanzaniaa 19% 38% 24% 40% 13% 36%
Timor-Leste 24% 68% 28% 66% 11% 72%
Trinidad and Tobagoa 18% 51% 21% 48% 14% 53%
Uganda 13% 20% 16% 23% 2.5% 7%
Uruguaya 19% 49% 24% 49% 14% 49%
8.6.1. Proportion of youth (aged 15-24 years) not in education, employment or training
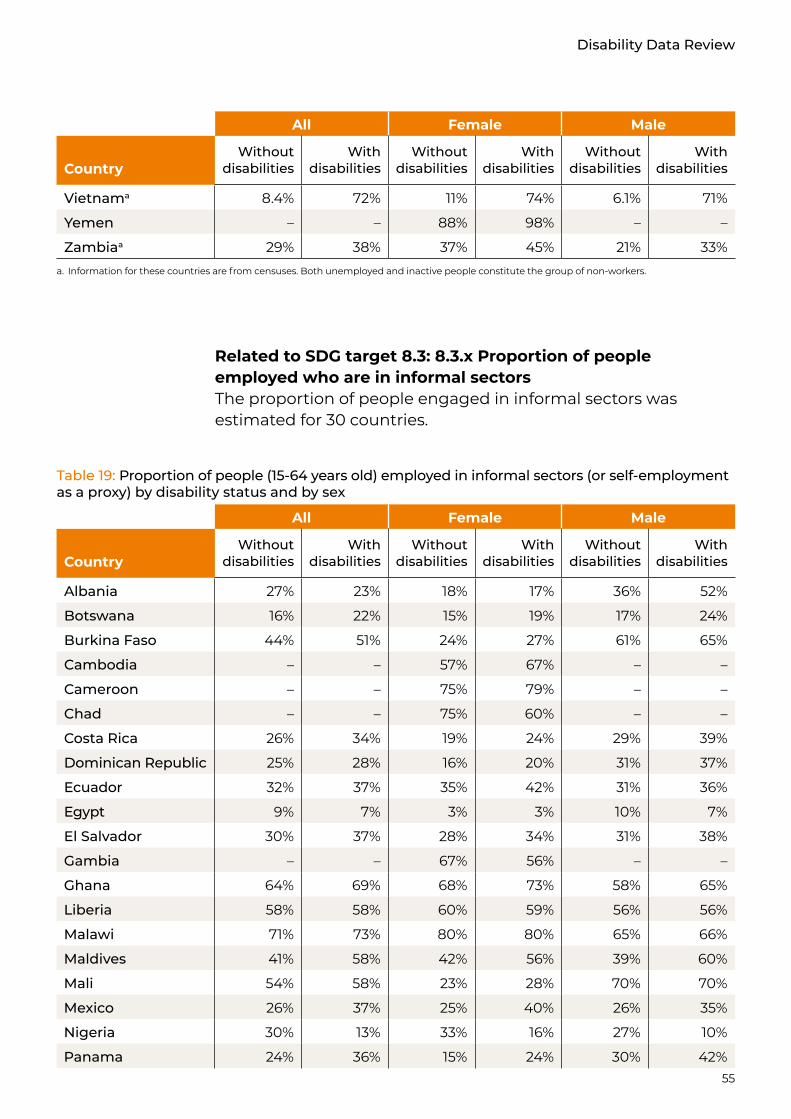
55
Disability Data Review
All Female Male
CountryWithout
disabilitiesWith
disabilitiesWithout
disabilitiesWith
disabilitiesWithout
disabilitiesWith
disabilities
Vietnama 8.4% 72% 11% 74% 6.1% 71%
Yemen – – 88% 98% – –
Zambiaa 29% 38% 37% 45% 21% 33%a. Information for these countries are from censuses. Both unemployed and inactive people constitute the group of non-workers.
Table 19: Proportion of people (15-64 years old) employed in informal sectors (or self-employment as a proxy) by disability status and by sex
All Female Male
CountryWithout
disabilitiesWith
disabilitiesWithout
disabilitiesWith
disabilitiesWithout
disabilitiesWith
disabilities
Albania 27% 23% 18% 17% 36% 52%
Botswana 16% 22% 15% 19% 17% 24%
Burkina Faso 44% 51% 24% 27% 61% 65%
Cambodia – – 57% 67% – –
Cameroon – – 75% 79% – –
Chad – – 75% 60% – –
Costa Rica 26% 34% 19% 24% 29% 39%
Dominican Republic 25% 28% 16% 20% 31% 37%
Ecuador 32% 37% 35% 42% 31% 36%
Egypt 9% 7% 3% 3% 10% 7%
El Salvador 30% 37% 28% 34% 31% 38%
Gambia – – 67% 56% – –
Ghana 64% 69% 68% 73% 58% 65%
Liberia 58% 58% 60% 59% 56% 56%
Malawi 71% 73% 80% 80% 65% 66%
Maldives 41% 58% 42% 56% 39% 60%
Mali 54% 58% 23% 28% 70% 70%
Mexico 26% 37% 25% 40% 26% 35%
Nigeria 30% 13% 33% 16% 27% 10%
Panama 24% 36% 15% 24% 30% 42%
Related to SDG target 8.3: 8.3.x Proportion of people employed who are in informal sectorsThe proportion of people engaged in informal sectors was estimated for 30 countries.
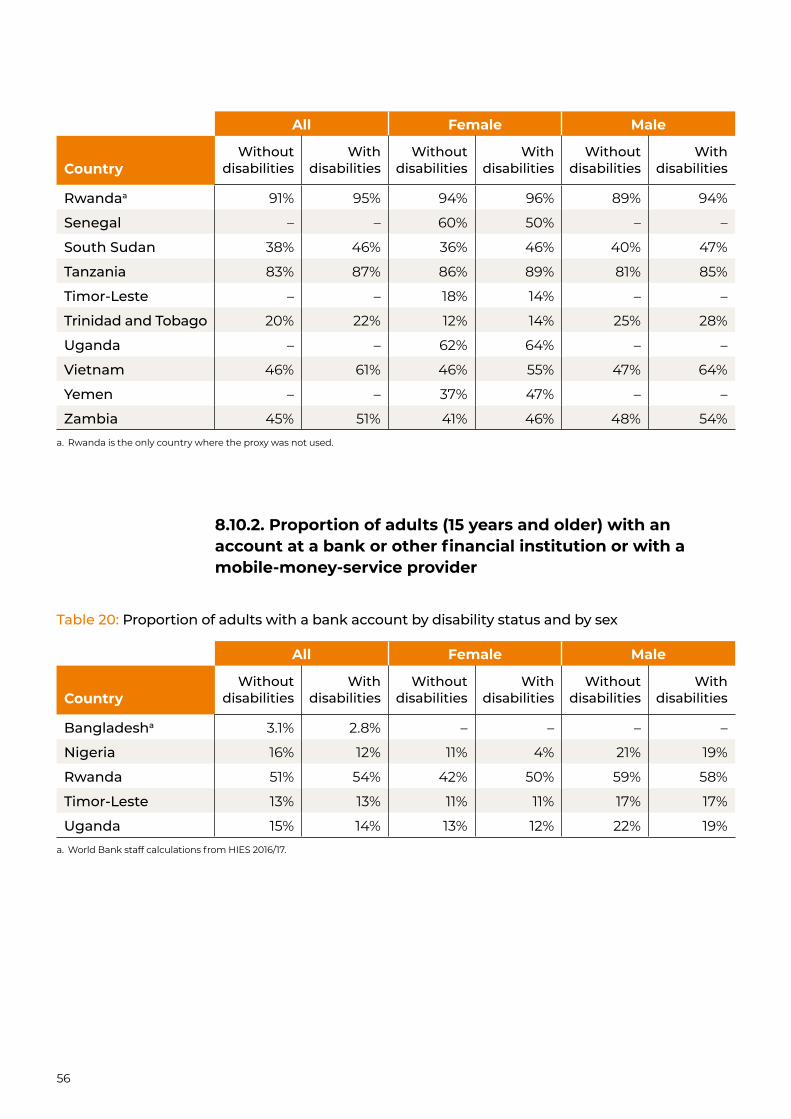
56
All Female Male
CountryWithout
disabilitiesWith
disabilitiesWithout
disabilitiesWith
disabilitiesWithout
disabilitiesWith
disabilities
Rwandaa 91% 95% 94% 96% 89% 94%
Senegal – – 60% 50% – –
South Sudan 38% 46% 36% 46% 40% 47%
Tanzania 83% 87% 86% 89% 81% 85%
Timor-Leste – – 18% 14% – –
Trinidad and Tobago 20% 22% 12% 14% 25% 28%
Uganda – – 62% 64% – –
Vietnam 46% 61% 46% 55% 47% 64%
Yemen – – 37% 47% – –
Zambia 45% 51% 41% 46% 48% 54%a. Rwanda is the only country where the proxy was not used.
Table 20: Proportion of adults with a bank account by disability status and by sex
All Female Male
CountryWithout
disabilitiesWith
disabilitiesWithout
disabilitiesWith
disabilitiesWithout
disabilitiesWith
disabilities
Bangladesha 3.1% 2.8% – – – –
Nigeria 16% 12% 11% 4% 21% 19%
Rwanda 51% 54% 42% 50% 59% 58%
Timor-Leste 13% 13% 11% 11% 17% 17%
Uganda 15% 14% 13% 12% 22% 19%a. World Bank staff calculations from HIES 2016/17.
8.10.2. Proportion of adults (15 years and older) with an account at a bank or other financial institution or with a mobile-money-service provider
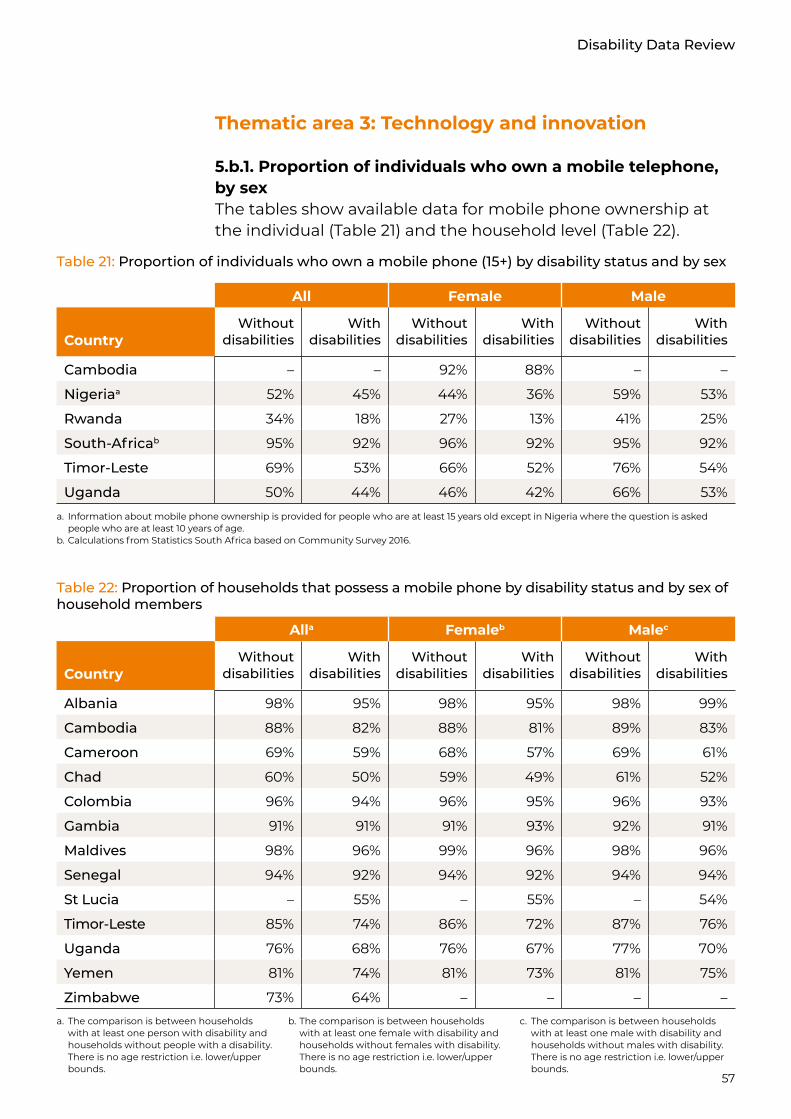
57
Disability Data Review
Thematic area 3: Technology and innovation
5.b.1. Proportion of individuals who own a mobile telephone, by sexThe tables show available data for mobile phone ownership at the individual (Table 21) and the household level (Table 22).
Table 21: Proportion of individuals who own a mobile phone (15+) by disability status and by sex
All Female Male
CountryWithout
disabilitiesWith
disabilitiesWithout
disabilitiesWith
disabilitiesWithout
disabilitiesWith
disabilities
Cambodia – – 92% 88% – –
Nigeriaa 52% 45% 44% 36% 59% 53%
Rwanda 34% 18% 27% 13% 41% 25%
South-Africab 95% 92% 96% 92% 95% 92%
Timor-Leste 69% 53% 66% 52% 76% 54%
Uganda 50% 44% 46% 42% 66% 53%a. Information about mobile phone ownership is provided for people who are at least 15 years old except in Nigeria where the question is asked
people who are at least 10 years of age.b. Calculations from Statistics South Africa based on Community Survey 2016.
Table 22: Proportion of households that possess a mobile phone by disability status and by sex of household members
Alla Femaleb Malec
CountryWithout
disabilitiesWith
disabilitiesWithout
disabilitiesWith
disabilitiesWithout
disabilitiesWith
disabilities
Albania 98% 95% 98% 95% 98% 99%
Cambodia 88% 82% 88% 81% 89% 83%
Cameroon 69% 59% 68% 57% 69% 61%
Chad 60% 50% 59% 49% 61% 52%
Colombia 96% 94% 96% 95% 96% 93%
Gambia 91% 91% 91% 93% 92% 91%
Maldives 98% 96% 99% 96% 98% 96%
Senegal 94% 92% 94% 92% 94% 94%
St Lucia – 55% – 55% – 54%
Timor-Leste 85% 74% 86% 72% 87% 76%
Uganda 76% 68% 76% 67% 77% 70%
Yemen 81% 74% 81% 73% 81% 75%
Zimbabwe 73% 64% – – – –a. The comparison is between households
with at least one person with disability and households without people with a disability. There is no age restriction i.e. lower/upper bounds.
b. The comparison is between households with at least one female with disability and households without females with disability. There is no age restriction i.e. lower/upper bounds.
c. The comparison is between households with at least one male with disability and households without males with disability. There is no age restriction i.e. lower/upper bounds.
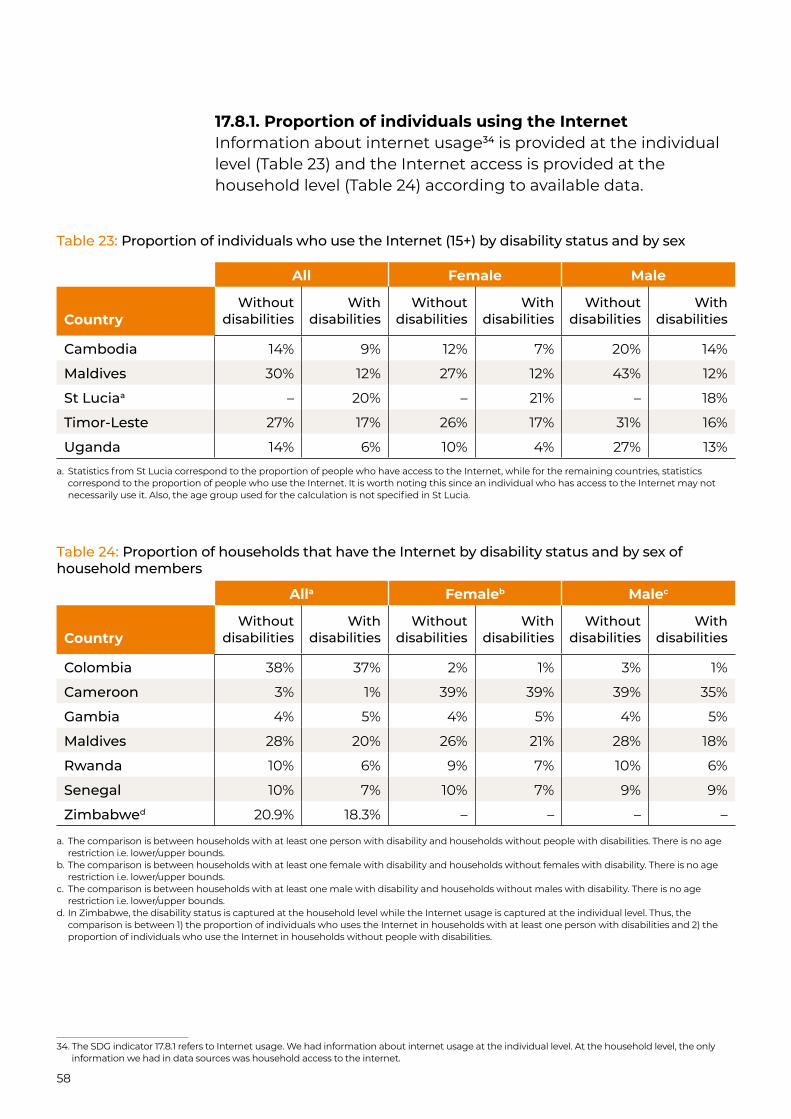
58
Table 23: Proportion of individuals who use the Internet (15+) by disability status and by sex
All Female Male
CountryWithout
disabilitiesWith
disabilitiesWithout
disabilitiesWith
disabilitiesWithout
disabilitiesWith
disabilities
Cambodia 14% 9% 12% 7% 20% 14%
Maldives 30% 12% 27% 12% 43% 12%
St Luciaa – 20% – 21% – 18%
Timor-Leste 27% 17% 26% 17% 31% 16%
Uganda 14% 6% 10% 4% 27% 13%a. Statistics from St Lucia correspond to the proportion of people who have access to the Internet, while for the remaining countries, statistics
correspond to the proportion of people who use the Internet. It is worth noting this since an individual who has access to the Internet may not necessarily use it. Also, the age group used for the calculation is not specified in St Lucia.
17.8.1. Proportion of individuals using the InternetInformation about internet usage34 is provided at the individual level (Table 23) and the Internet access is provided at the household level (Table 24) according to available data.
34. The SDG indicator 17.8.1 refers to Internet usage. We had information about internet usage at the individual level. At the household level, the only information we had in data sources was household access to the internet.
Table 24: Proportion of households that have the Internet by disability status and by sex of household members
Alla Femaleb Malec
CountryWithout
disabilitiesWith
disabilitiesWithout
disabilitiesWith
disabilitiesWithout
disabilitiesWith
disabilities
Colombia 38% 37% 2% 1% 3% 1%
Cameroon 3% 1% 39% 39% 39% 35%
Gambia 4% 5% 4% 5% 4% 5%
Maldives 28% 20% 26% 21% 28% 18%
Rwanda 10% 6% 9% 7% 10% 6%
Senegal 10% 7% 10% 7% 9% 9%
Zimbabwed 20.9% 18.3% – – – –
a. The comparison is between households with at least one person with disability and households without people with disabilities. There is no age restriction i.e. lower/upper bounds.
b. The comparison is between households with at least one female with disability and households without females with disability. There is no age restriction i.e. lower/upper bounds.
c. The comparison is between households with at least one male with disability and households without males with disability. There is no age restriction i.e. lower/upper bounds.
d. In Zimbabwe, the disability status is captured at the household level while the Internet usage is captured at the individual level. Thus, the comparison is between 1) the proportion of individuals who uses the Internet in households with at least one person with disabilities and 2) the proportion of individuals who use the Internet in households without people with disabilities.

59
Disability Data Review
Thematic area 4: Stigma and discrimination
1.3.1. Proportion of population covered by social protection floors/systemsDisability data was available about social protection for eleven countries. The statistics associated with indicator 1.3.1 focus on five categories of health insurance: 1) Health insurance provided by the employer (Table 25), 2) Health insurance provided by mutual/community organisations (Table 26), 3) Health insurance provided by Social Security (Table 27), 4) Purchased health insurance (Table 28) and 5) Other type of health insurance (Table 29). Table 30 presents the proportion of persons with disabilities with social protection in Kenya and St Lucia (as data from other countries was not available).
Table 25: Proportion of individuals (15+) with health insurance provided by the employers by disability status and by sex
All Female Male
CountryWithout
disabilitiesWith
disabilitiesWithout
disabilitiesWith
disabilitiesWithout
disabilitiesWith
disabilities
Albania 0% 0% 0% 0% 0% 0%
Cambodia 2.6% 0% 2.5% 0% 2.5% 0%
Cameroon 1.7% 1.7% 1.3% 1.6% 2.1% 1.8%
Chad – – 0% 0% – –
Gambia 2.1% 1.8% 1.9% 1.6% 2.7% 2.2%
Rwandaa 0.2% 0.1% 0.2% 0% 0.3% 0.1%
Uganda 0.9% 0.5% 0.8% 0.4% 1.2% 1%
Yemen – – 1.3% 1.5% – –a. Information about insurance is asked to people who are at least 15 years of age except in Rwanda where the question is asked for all household
members (no age restriction).
Table 26: Proportion of individuals (15+) with health insurance provided by mutual/community organisations by disability status and by sex
All Female Male
CountryWithout
disabilitiesWith
disabilitiesWithout
disabilitiesWith
disabilitiesWithout
disabilitiesWith
disabilities
Cambodia 1% 0.7% 1% 0% 1% 0%
Cameroon 1.2% 1.8% 0.9% 1.5% 1.6% 2%
Chad – – 0% 0% – –
Rwandaa 65.6% 70.1% 66.6% 71.1% 64.6% 69%
Uganda 0.4% 0.6% 0.4% 0.6% 0.4% 0.4%
Yemen – – 0.2% 0.3% – –a. Information about insurance is asked to people who are at least 15 years of age except in Rwanda where the question is asked for all household
members (no age restriction).

60
Table 27: Proportion of individuals (15+) with health insurance provided by Social Security by disability status and by sex
All Female Male
CountryWithout
disabilitiesWith
disabilitiesWithout
disabilitiesWith
disabilitiesWithout
disabilitiesWith
disabilities
Albania 19% 18% 17% 16% 23% 36%
Cambodia 11% 22% 12% 27% 12% 27%
Cameroon 0.4% 0.1% 0.3% 0% 0.5% 0.1%
Chad – – 0% 0% – –
Nigeria 2.4% 1.4% 1.7% 2.9% 3.1% 0%
Rwandaa 3.6% 1.3% 3.4% 1.3% 3.8% 1.3%
Uganda 0% 0% 0% 0% 0% 0%
Yemen – – 0.6% 0.3% – –a. Information about insurance is asked to people who are at least 15 years of age except in Rwanda where the question is asked for all household
members (no age restriction).
Table 28: Proportion of individuals (15+) with purchased health insurance by disability status and by sex
All Female Male
CountryWithout
disabilitiesWith
disabilitiesWithout
disabilitiesWith
disabilitiesWithout
disabilitiesWith
disabilities
Albania 2.1% 1.2% 2.3% 1.4% 1.7% 0%
Cambodia 0.3% 0% 0.2% 0% 0.2% 0%
Cameroon 0.3% 0.2% 0.3% 0.6% 0.3% 0%
Chad – – 0% 0% – –
Gambia 0.4% 0.3% 0.4% 0.1% 0.6% 0.8%
Uganda 0.2% 0.2% 0.2% 0.2% 0.3% 0%
Yemen – – 0.3% 0% – –
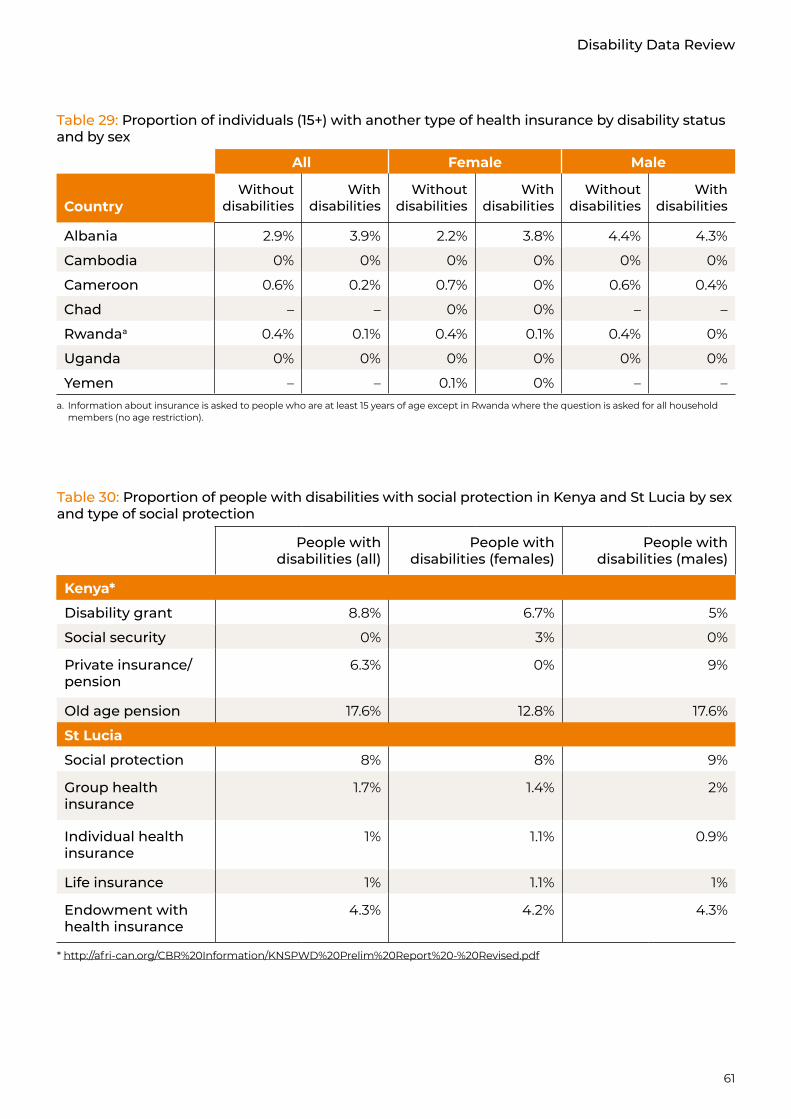
61
Disability Data Review
Table 29: Proportion of individuals (15+) with another type of health insurance by disability status and by sex
All Female Male
CountryWithout
disabilitiesWith
disabilitiesWithout
disabilitiesWith
disabilitiesWithout
disabilitiesWith
disabilities
Albania 2.9% 3.9% 2.2% 3.8% 4.4% 4.3%
Cambodia 0% 0% 0% 0% 0% 0%
Cameroon 0.6% 0.2% 0.7% 0% 0.6% 0.4%
Chad – – 0% 0% – –
Rwandaa 0.4% 0.1% 0.4% 0.1% 0.4% 0%
Uganda 0% 0% 0% 0% 0% 0%
Yemen – – 0.1% 0% – –a. Information about insurance is asked to people who are at least 15 years of age except in Rwanda where the question is asked for all household
members (no age restriction).
Table 30: Proportion of people with disabilities with social protection in Kenya and St Lucia by sex and type of social protection
People with disabilities (all)
People with disabilities (females)
People with disabilities (males)
Kenya*
Disability grant 8.8% 6.7% 5%
Social security 0% 3% 0%
Private insurance/pension
6.3% 0% 9%
Old age pension 17.6% 12.8% 17.6%
St Lucia
Social protection 8% 8% 9%
Group health insurance
1.7% 1.4% 2%
Individual health insurance
1% 1.1% 0.9%
Life insurance 1% 1.1% 1%
Endowment with health insurance
4.3% 4.2% 4.3%
* http://afri-can.org/CBR%20Information/KNSPWD%20Prelim%20Report%20-%20Revised.pdf

62
Table 31: Proportion of people in managerial positions by disability status and by sex
All Female Male
CountryWithout
disabilitiesWith
disabilitiesWithout
disabilitiesWith
disabilitiesWithout
disabilitiesWith
disabilities
Albania 5.5% 4% 4.6% 0.6% 6.5% 20%
Botswana 4.3% 5.4% 3.3% 4.6% 5% 6.1%
Cambodia 1% 1.2% 0.9% 1.7% 0.9% 1.7%
Cameroon 0.6% 0.5% 0.6% 0.4% 0.5% 0.5%
Chad – – 0.2% 0% – –
Colombia 0.8% 1% 0.8% 0.6% 0.9% 1.4%
Costa Rica 1.5% 1.2% 1.4% 1.1% 1.6% 1.3%
Dominican Republic 2.1% 2.1% 2.3% 1.8% 1.9% 2.4%
Ecuador 2.8% 1.5% 3% 1.8% 2.6% 1.5%
Egypt 4.7% 3.3% 4.3% 3.1% 4.8% 3.3%
El Salvador 4.5% 4.4% 5% 5% 4.1% 4.1%
Gambia 0.5% 1.1% 0.5% 1.7% 0.6% 0%
Ghana 1.1% 1.1% 1.1% 1.2% 1.1% 1.1%
Liberia 1.3% 1.6% 0.8% 1% 1.7% 2.1%
Malawi 0.5% 0.4% 0.2% 0.1% 0.8% 0.7%
Maldives 3.5% 0.5% 1.6% 0.3% 7.2% 0.9%
Mali 0.3% 0.2% 0.3% 0.2% 0.4% 0.2%
Mexico 3.9% 1.9% 3.8% 1.7% 3.9% 2%
Nigeria 0.9% 0% 0.7% 0% 1% 0%
Panama 6.1% 3.2% 7.3% 3.2% 5.4% 3.2%
Rwanda 0.4% 0.1% 0.1% 0% 0.7% 0.1%
Senegal 0% 0% 0% 0% 0% 0%
South Sudan 0.7% 0.9% 0.3% 0.4% 1% 1.3%
Tanzania 2.4% 1.8% 2% 1.6% 2.7% 2%
Timor-Leste 0.7% 1% 0.4% 0% 1% 2%
Uganda 0.3% 0.3% 0.3% 0.2% 0.5% 0.6%
Vietnam 0.9% 0.4% 0.4% 0.1% 1.3% 0.5%
Yemen – – 0.9% 0% – –
Zambia 1% 0.5% 0.6% 0.3% 1.2% 0.7%
5.5.2. Proportion of women in managerial positions
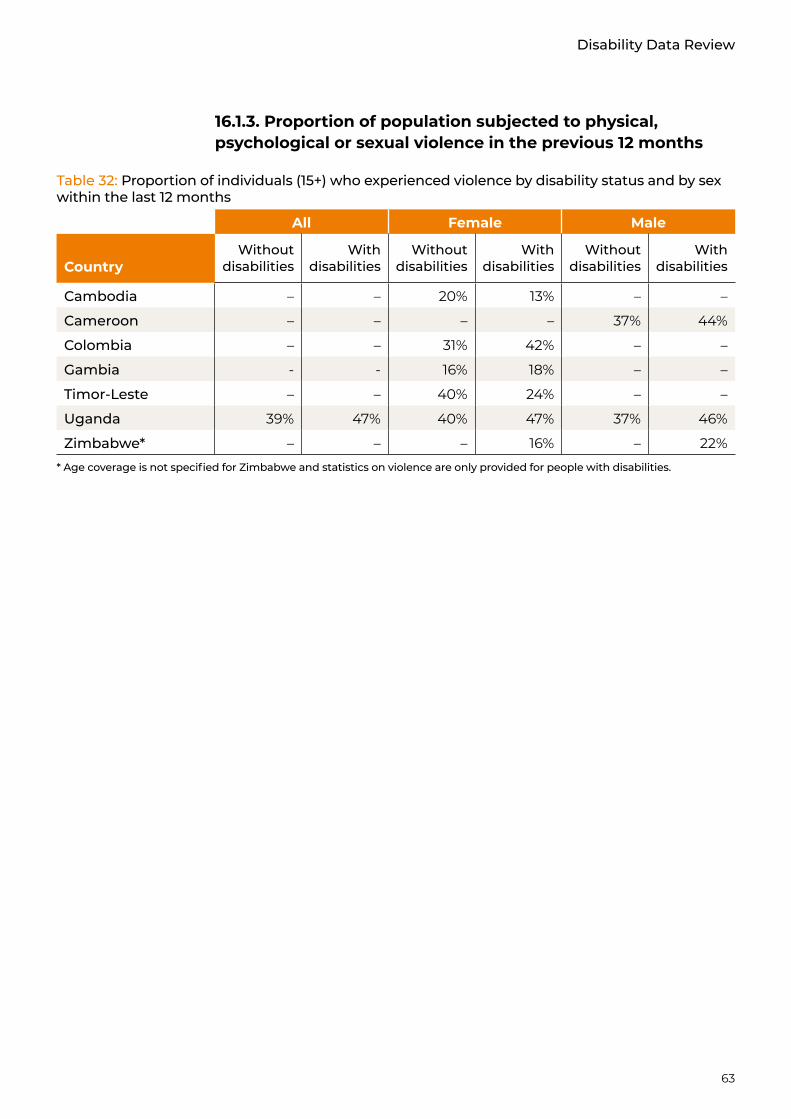
63
Disability Data Review
Table 32: Proportion of individuals (15+) who experienced violence by disability status and by sex within the last 12 months
All Female Male
CountryWithout
disabilitiesWith
disabilitiesWithout
disabilitiesWith
disabilitiesWithout
disabilitiesWith
disabilities
Cambodia – – 20% 13% – –
Cameroon – – – – 37% 44%
Colombia – – 31% 42% – –
Gambia - - 16% 18% – –
Timor-Leste – – 40% 24% – –
Uganda 39% 47% 40% 47% 37% 46%
Zimbabwe* – – – 16% – 22%
* Age coverage is not specified for Zimbabwe and statistics on violence are only provided for people with disabilities.
16.1.3. Proportion of population subjected to physical, psychological or sexual violence in the previous 12 months

64
65
Disability Data Review
Chapter 3: Key findings
65

66
Before analysing the results related to each indicator, it is important to pay attention to the prevalence of disability in the countries of interest. A comparison of the prevalence of disability drawn from various sources (Table 3) reveals that in general the highest rates are observed when disability is assessed using the Washington Group questions. The lowest rate (0.7%) is observed in Egypt and Mali. The former is part of category one (question refers to disability), while the latter uses medical questions to enumerate disability. A gender-based comparison reveals that in general, the proportion of women with disabilities is slightly higher than that of men with disabilities. In the following sections we will analyse the results by indicator, then present the findings by country and finally discuss the results.
Chapter 3: Key findings

67
Disability Data Review
Figure 1: Proportion of people with disabilities (both sexes)
0% 2% 4% 6% 8% 10% 12% 14%
ZimbabweZambiaYemen
VietnamUruguayUgandaTrinidad
Timor-LesteTanzaniaSt Lucia
South SudanSouth Africa
SenegalRwandaPanamaPakistan
NigeriaMyanmar
MexicoMali
MaldivesMalawiLiberiaKenya
IndiaGhana
GambiaEl Salvador
EgyptEcuador
Dominican RepublicCosta RicaColombia
ChadCameroonCambodia
Burkina FasoBotswana
BangladeshAlbania
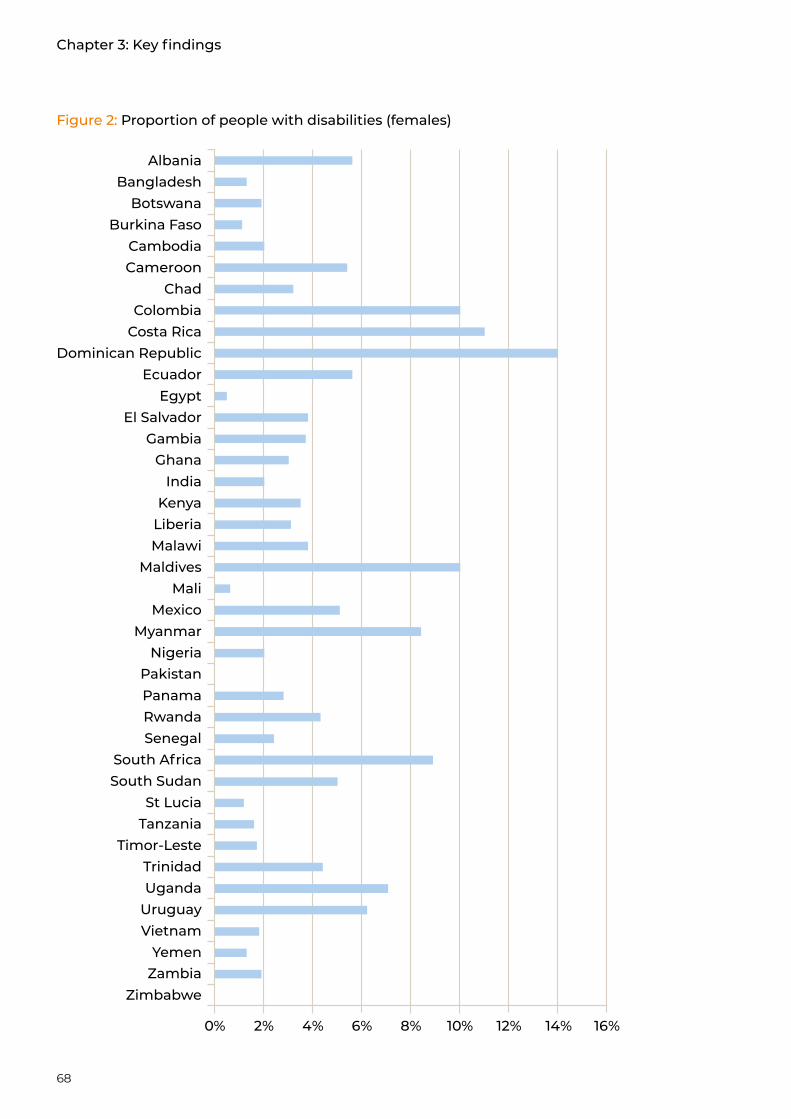
68
Figure 2: Proportion of people with disabilities (females)
0% 2% 4% 6% 8% 10% 12% 14% 16%
ZimbabweZambiaYemen
VietnamUruguayUgandaTrinidad
Timor-LesteTanzaniaSt Lucia
South SudanSouth Africa
SenegalRwandaPanamaPakistan
NigeriaMyanmar
MexicoMali
MaldivesMalawiLiberiaKenya
IndiaGhana
GambiaEl Salvador
EgyptEcuador
Dominican RepublicCosta RicaColombia
ChadCameroonCambodia
Burkina FasoBotswana
BangladeshAlbania
Chapter 3: Key findings
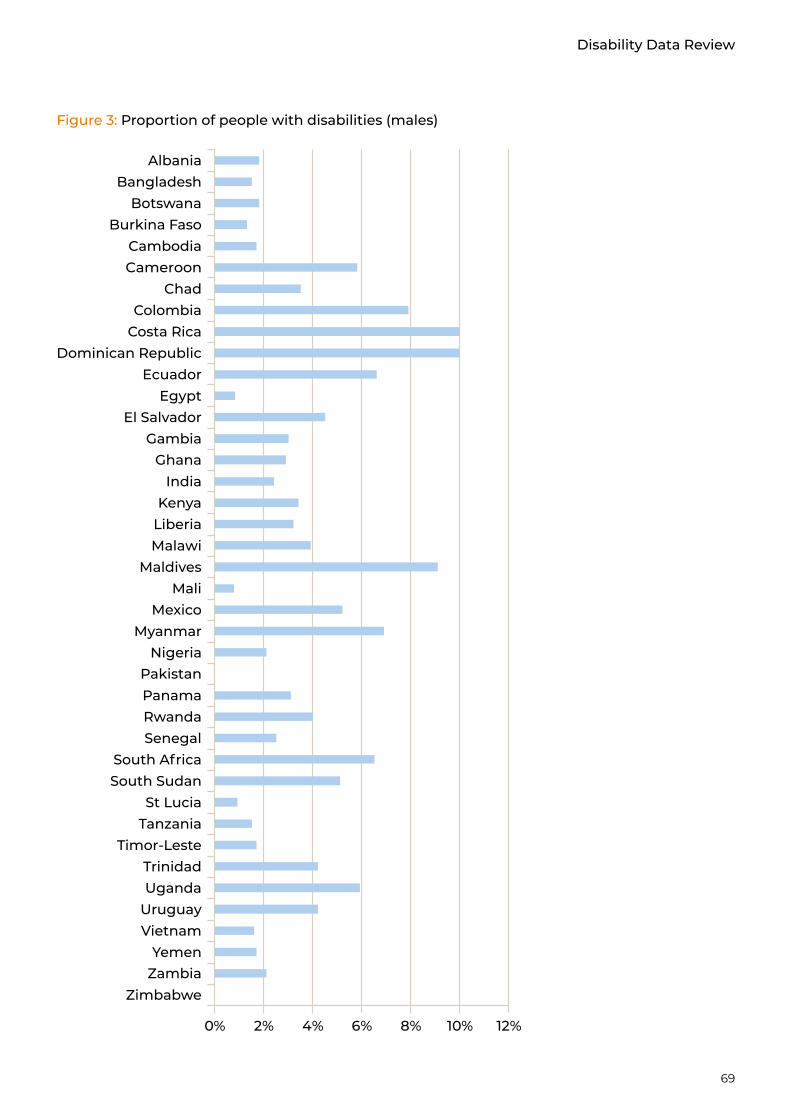
69
Disability Data Review
Figure 3: Proportion of people with disabilities (males)
0% 2% 4% 6% 8% 10% 12%
ZimbabweZambiaYemen
VietnamUruguayUgandaTrinidad
Timor-LesteTanzaniaSt Lucia
South SudanSouth Africa
SenegalRwandaPanamaPakistan
NigeriaMyanmar
MexicoMali
MaldivesMalawiLiberiaKenya
IndiaGhana
GambiaEl Salvador
EgyptEcuador
Dominican RepublicCosta RicaColombia
ChadCameroonCambodia
Burkina FasoBotswana
BangladeshAlbania
70
In the present section we will successively present the results we obtained for indicators related to inclusive education, economic empowerment, technology and innovation, and stigma and discrimination.
Key findings by indicator
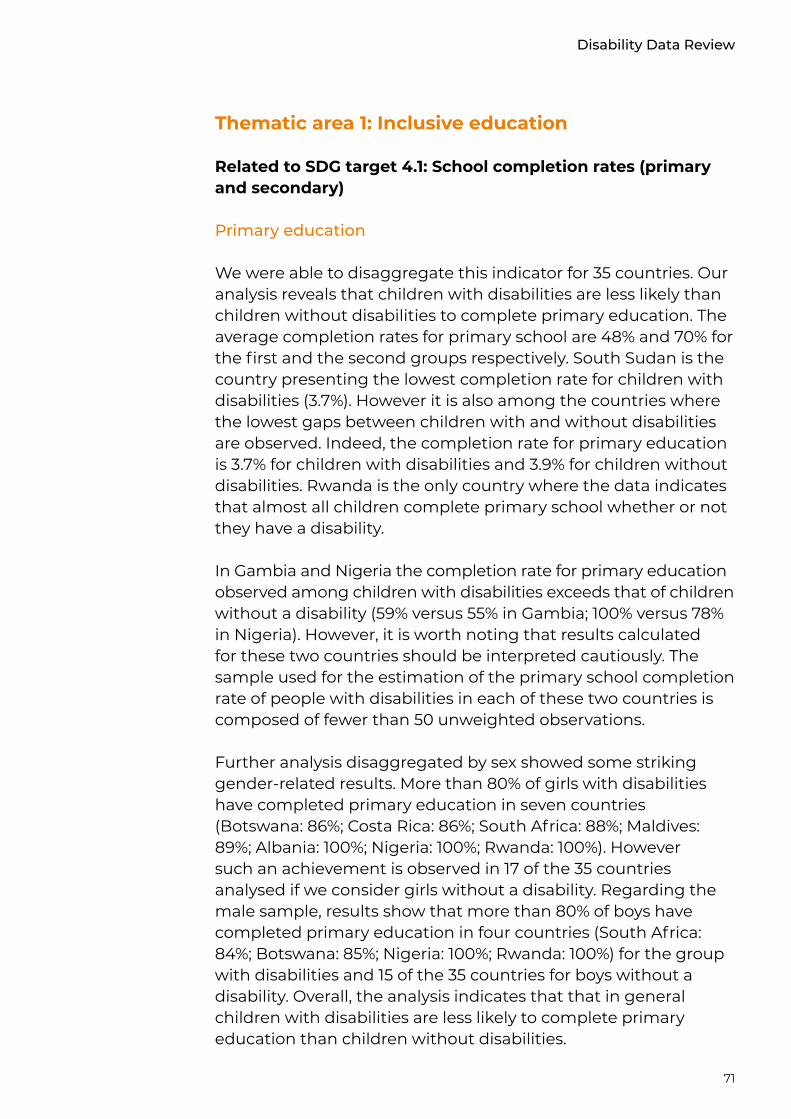
71
Disability Data Review
Thematic area 1: Inclusive education
Related to SDG target 4.1: School completion rates (primary and secondary)
Primary education
We were able to disaggregate this indicator for 35 countries. Our analysis reveals that children with disabilities are less likely than children without disabilities to complete primary education. The average completion rates for primary school are 48% and 70% for the first and the second groups respectively. South Sudan is the country presenting the lowest completion rate for children with disabilities (3.7%). However it is also among the countries where the lowest gaps between children with and without disabilities are observed. Indeed, the completion rate for primary education is 3.7% for children with disabilities and 3.9% for children without disabilities. Rwanda is the only country where the data indicates that almost all children complete primary school whether or not they have a disability.
In Gambia and Nigeria the completion rate for primary education observed among children with disabilities exceeds that of children without a disability (59% versus 55% in Gambia; 100% versus 78% in Nigeria). However, it is worth noting that results calculated for these two countries should be interpreted cautiously. The sample used for the estimation of the primary school completion rate of people with disabilities in each of these two countries is composed of fewer than 50 unweighted observations.
Further analysis disaggregated by sex showed some striking gender-related results. More than 80% of girls with disabilities have completed primary education in seven countries (Botswana: 86%; Costa Rica: 86%; South Africa: 88%; Maldives: 89%; Albania: 100%; Nigeria: 100%; Rwanda: 100%). However such an achievement is observed in 17 of the 35 countries analysed if we consider girls without a disability. Regarding the male sample, results show that more than 80% of boys have completed primary education in four countries (South Africa: 84%; Botswana: 85%; Nigeria: 100%; Rwanda: 100%) for the group with disabilities and 15 of the 35 countries for boys without a disability. Overall, the analysis indicates that that in general children with disabilities are less likely to complete primary education than children without disabilities.
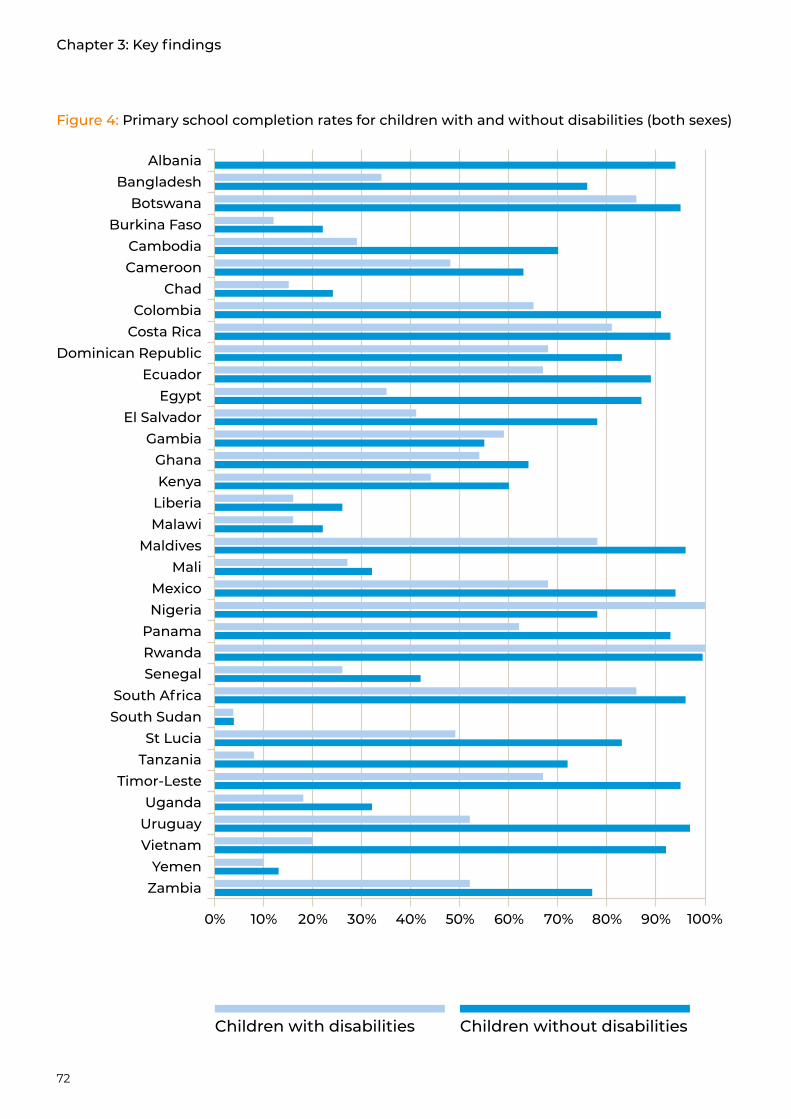
72
Figure 4: Primary school completion rates for children with and without disabilities (both sexes)
0% 10% 20% 30% 40% 50% 60% 70%
ZambiaYemen
VietnamUruguayUganda
Timor-LesteTanzaniaSt Lucia
South SudanSouth Africa
SenegalRwandaPanama
NigeriaMexico
MaliMaldives
MalawiLiberiaKenyaGhana
GambiaEl Salvador
EgyptEcuador
Dominican RepublicCosta RicaColombia
ChadCameroonCambodia
Burkina FasoBotswana
BangladeshAlbania
80% 90% 100%
Children without disabilitiesChildren with disabilities
Chapter 3: Key findings
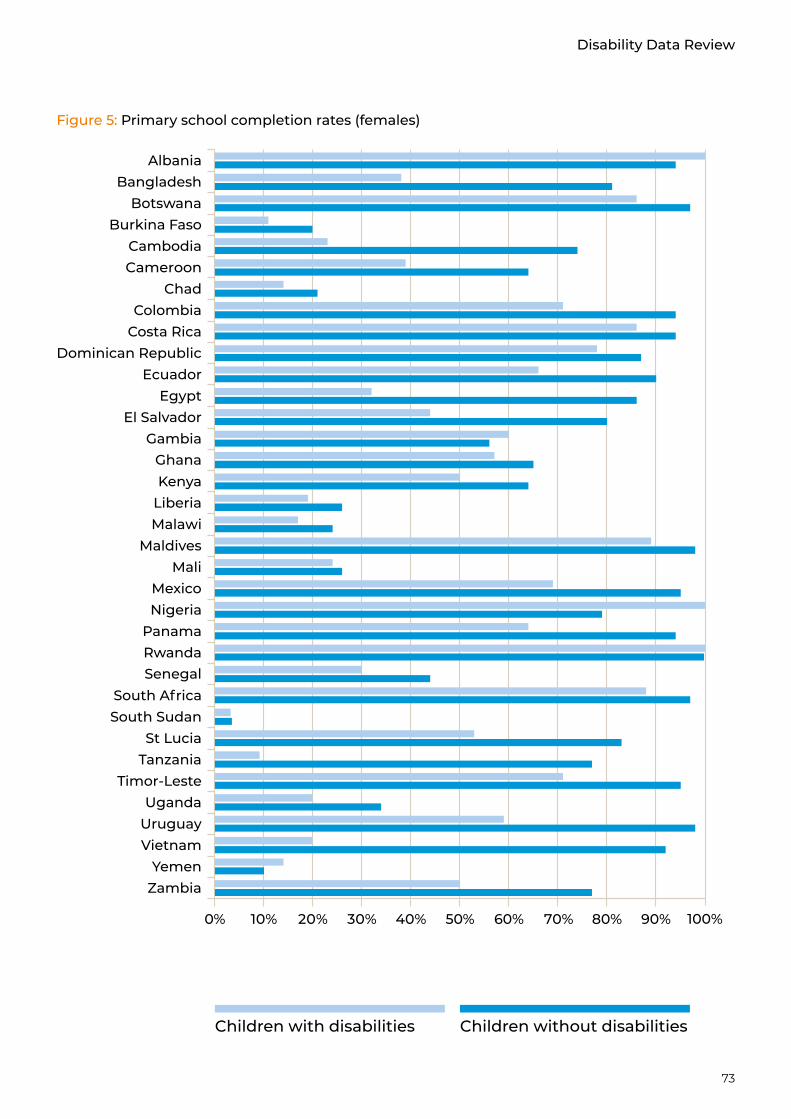
73
Disability Data Review
Figure 5: Primary school completion rates (females)
0% 10% 20% 30% 40% 50% 60% 70%
ZambiaYemen
VietnamUruguayUganda
Timor-LesteTanzaniaSt Lucia
South SudanSouth Africa
SenegalRwandaPanama
NigeriaMexico
MaliMaldives
MalawiLiberiaKenyaGhana
GambiaEl Salvador
EgyptEcuador
Dominican RepublicCosta RicaColombia
ChadCameroonCambodia
Burkina FasoBotswana
BangladeshAlbania
80% 90% 100%
Children without disabilitiesChildren with disabilities

74
Figure 6: Primary school completion rates (Males)
0% 10% 20% 30% 40% 50% 60% 70%
ZambiaYemen
VietnamUruguayUganda
Timor-LesteTanzaniaSt Lucia
South SudanSouth Africa
SenegalRwandaPanama
NigeriaMexico
MaliMaldives
MalawiLiberiaKenyaGhana
GambiaEl Salvador
EgyptEcuador
Dominican RepublicCosta RicaColombia
ChadCameroonCambodia
Burkina FasoBotswana
BangladeshAlbania
80% 90% 100%
Children without disabilitiesChildren with disabilities
Chapter 3: Key findings
75
Disability Data Review
Secondary education
Statistics on the completion rate for secondary education shows that on average 32% of people without disabilities and 21% of people with disabilities have graduated from secondary school. Gambia is the only country where the proportion of people with disabilities who completed secondary school is higher than people without disabilities (37% and 25%). Once again, this result should be interpreted cautiously, because the calculation of the completion rate among people with disabilities uses fewer than 50 unweighted observations. For the remaining 36 countries, the gap between the two groups of interest ranges from 0 percentage points (Burkina Faso, Liberia and Mali) to 43 percentage points (Egypt). Chad (0%), Senegal (0%) and South Sudan (1%) are the countries with the lowest completion rate among people with disabilities.
Fewer than 5% of the children without disabilities have completed secondary education in Burkina Faso (4%) and South Sudan (2%).In these two countries the gap between the group with disabilities and the group without disabilities is lower than one percentage point. The highest completion rates for secondary education are observed in Trinidad and Tobago: 85% for people without disabilities and 62% for people with disabilities. However, the gap between these two groups (23 percentage points) is higher than the average gap35 calculated for the 35 countries, (11 percentage points). A gender-based analysis reveals that the completion rate among males with disabilities varies from 0% (Albania, Chad, and Senegal) to 61% in Trinidad and Tobago. The proportion of females with disabilities who completed secondary education ranges from 0% (Cambodia, Chad, Nigeria, and Senegal) to 67% in Colombia.
35. Let x% denote the average completion rate for people with disabilities and y% the average completion rate for people without disabilities. The average gap z% (z percentages points) is calculated as follows: z% = y%-x%. refers to the difference between the average proportion (of a given indicator) for people with and without disabilities.
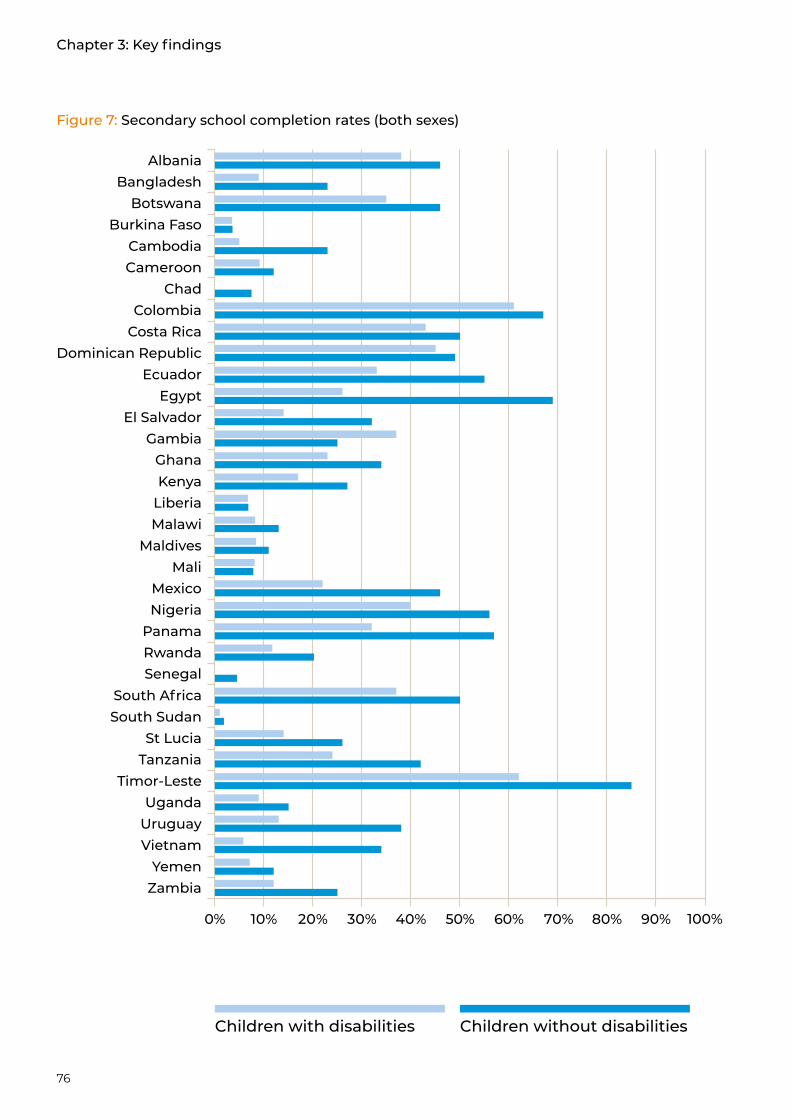
76
Figure 7: Secondary school completion rates (both sexes)
0% 10% 20% 30% 40% 50% 60% 70%
ZambiaYemen
VietnamUruguayUganda
Timor-LesteTanzaniaSt Lucia
South SudanSouth Africa
SenegalRwandaPanama
NigeriaMexico
MaliMaldives
MalawiLiberiaKenyaGhana
GambiaEl Salvador
EgyptEcuador
Dominican RepublicCosta RicaColombia
ChadCameroonCambodia
Burkina FasoBotswana
BangladeshAlbania
80% 90% 100%
Children without disabilitiesChildren with disabilities
Chapter 3: Key findings
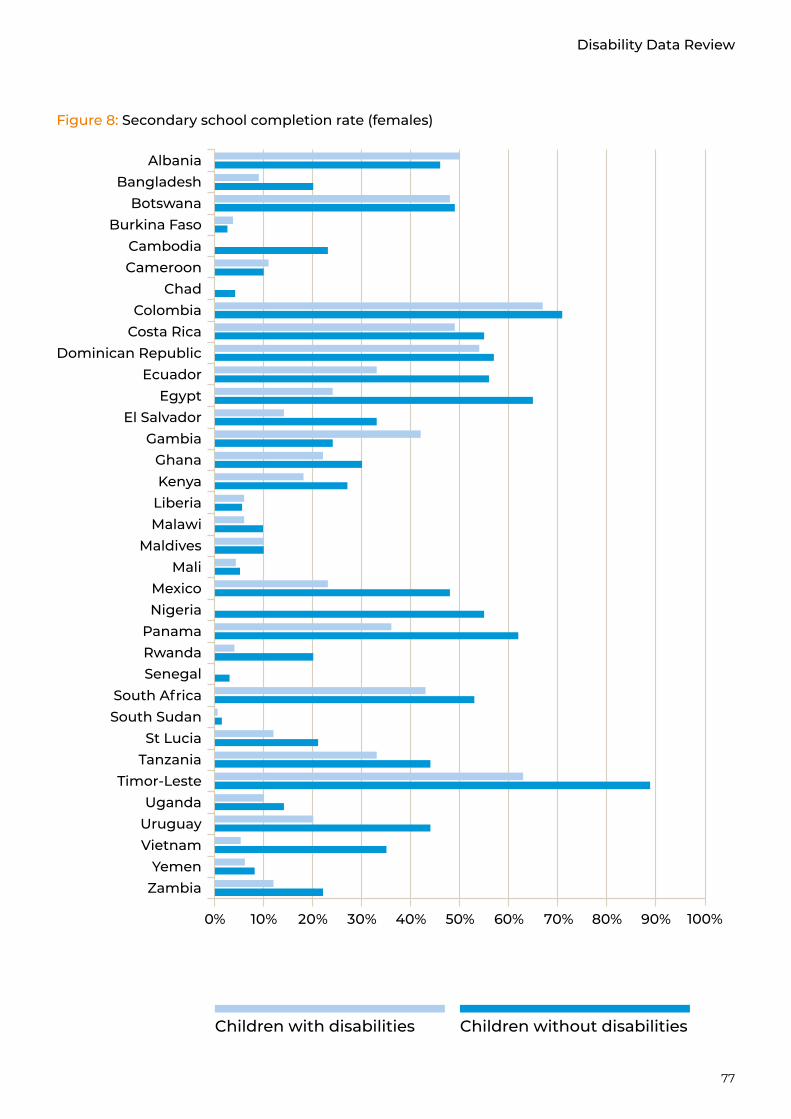
77
Disability Data Review
Figure 8: Secondary school completion rate (females)
0% 10% 20% 30% 40% 50% 60% 70%
ZambiaYemen
VietnamUruguayUganda
Timor-LesteTanzaniaSt Lucia
South SudanSouth Africa
SenegalRwandaPanama
NigeriaMexico
MaliMaldives
MalawiLiberiaKenyaGhana
GambiaEl Salvador
EgyptEcuador
Dominican RepublicCosta RicaColombia
ChadCameroonCambodia
Burkina FasoBotswana
BangladeshAlbania
80% 90% 100%
Children without disabilitiesChildren with disabilities
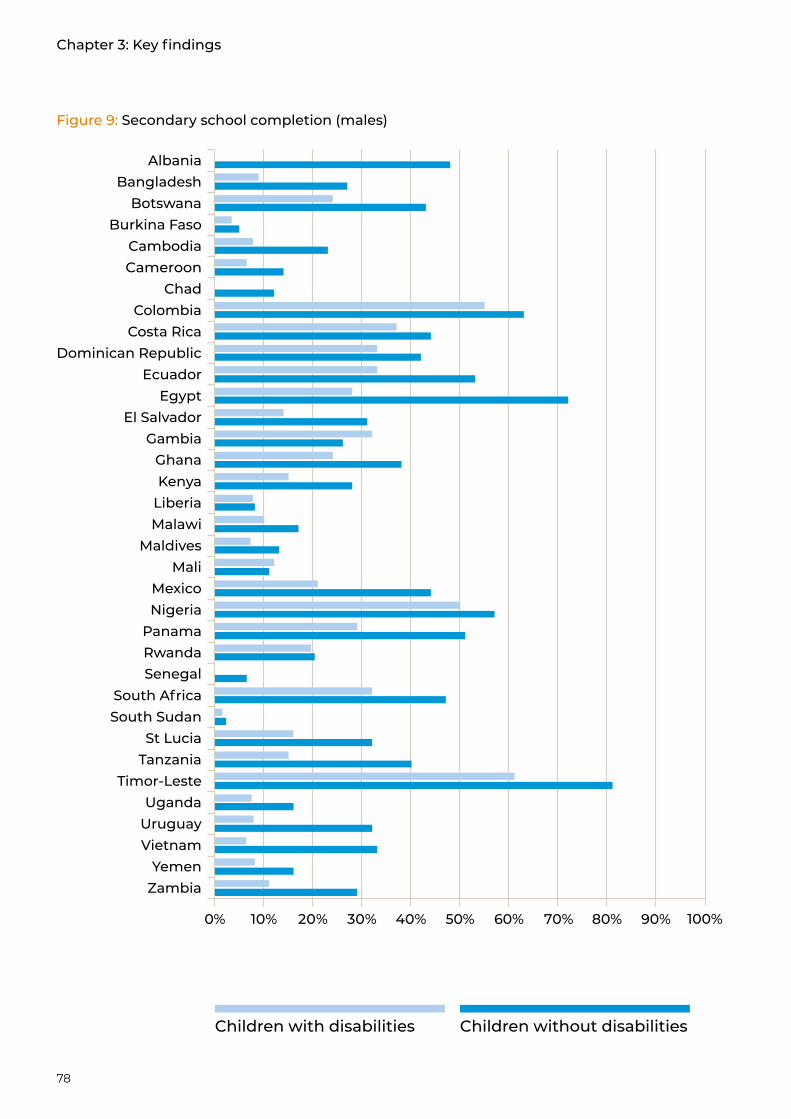
78
Children with disabilities
Figure 9: Secondary school completion (males)
0% 10% 20% 30% 40% 50% 60% 70%
ZambiaYemen
VietnamUruguayUganda
Timor-LesteTanzaniaSt Lucia
South SudanSouth Africa
SenegalRwandaPanama
NigeriaMexico
MaliMaldives
MalawiLiberiaKenyaGhana
GambiaEl Salvador
EgyptEcuador
Dominican RepublicCosta RicaColombia
ChadCameroonCambodia
Burkina FasoBotswana
BangladeshAlbania
80% 90% 100%
Children without disabilities
Chapter 3: Key findings

79
Disability Data Review
4.2.2. Participation rate in organised learning (one year before the official primary entry age), by sex
Out of the 31 countries for which this indicator could be calculated, Rwanda stands out as the only country where all children (100%) aged one year before the official primary entry age participate in organised learning. Uruguay ranks second (97% and 98% respectively for those without a disability and people with disabilities) in terms of participation rate in organised learning. This conclusion remains valid when we split our sample according to gender (Uruguay: 100% for girls with and without disabilities; 95% and 96% for boys with and without disabilities). Senegal and Burkina Faso shared the lowest participation rates regardless of disability status (0% and 10% respectively for children with and without disabilities in Senegal; 8% for both groups in Burkina Faso). The average gap between children with and without disabilities is 13% and 14% respectively in the female and the male samples.36
36. Let x% denote the average completion rate for people with disabilities and y% the average completion rate for people without disabilities. The average gap z% (z percentages points) is calculated as follows : z% = y%-x%.

80
Figure 10: Participation in organised learning (both sexes)
0% 10% 20% 30% 40% 50% 60% 70%
ZambiaYemen
VietnamUruguayUgandaTrinidad
Timor-LesteTanzania
South AfricaSenegalRwandaPanama
NigeriaMexico
MaliMaldives
MalawiLiberiaKenyaGhana
El SalvadorEcuador
Dominican RepublicCosta RicaColombia
ChadCameroonCambodia
Burkina FasoBotswana
Bangladesh
80% 90% 100%
Children without disabilitiesChildren with disabilities
Chapter 3: Key findings
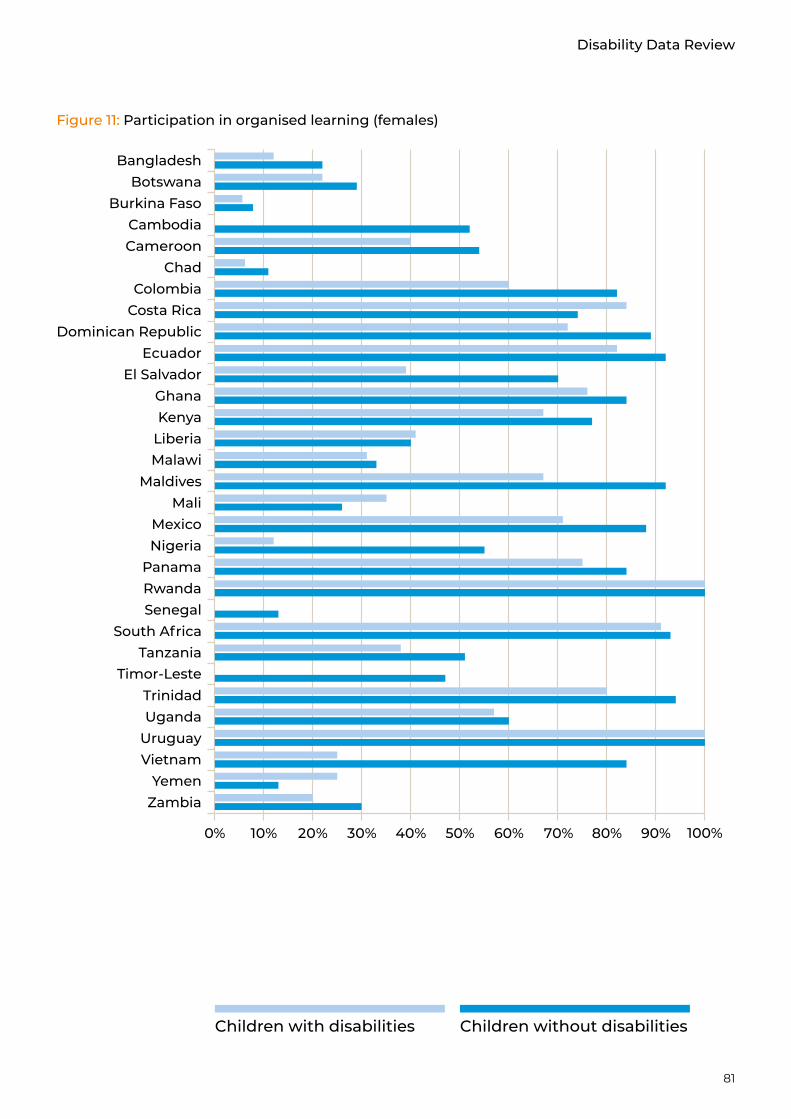
81
Disability Data Review
Figure 11: Participation in organised learning (females)
0% 10% 20% 30% 40% 50% 60% 70%
ZambiaYemen
VietnamUruguayUgandaTrinidad
Timor-LesteTanzania
South AfricaSenegalRwandaPanama
NigeriaMexico
MaliMaldives
MalawiLiberiaKenyaGhana
El SalvadorEcuador
Dominican RepublicCosta RicaColombia
ChadCameroonCambodia
Burkina FasoBotswana
Bangladesh
80% 90% 100%
Children without disabilitiesChildren with disabilities
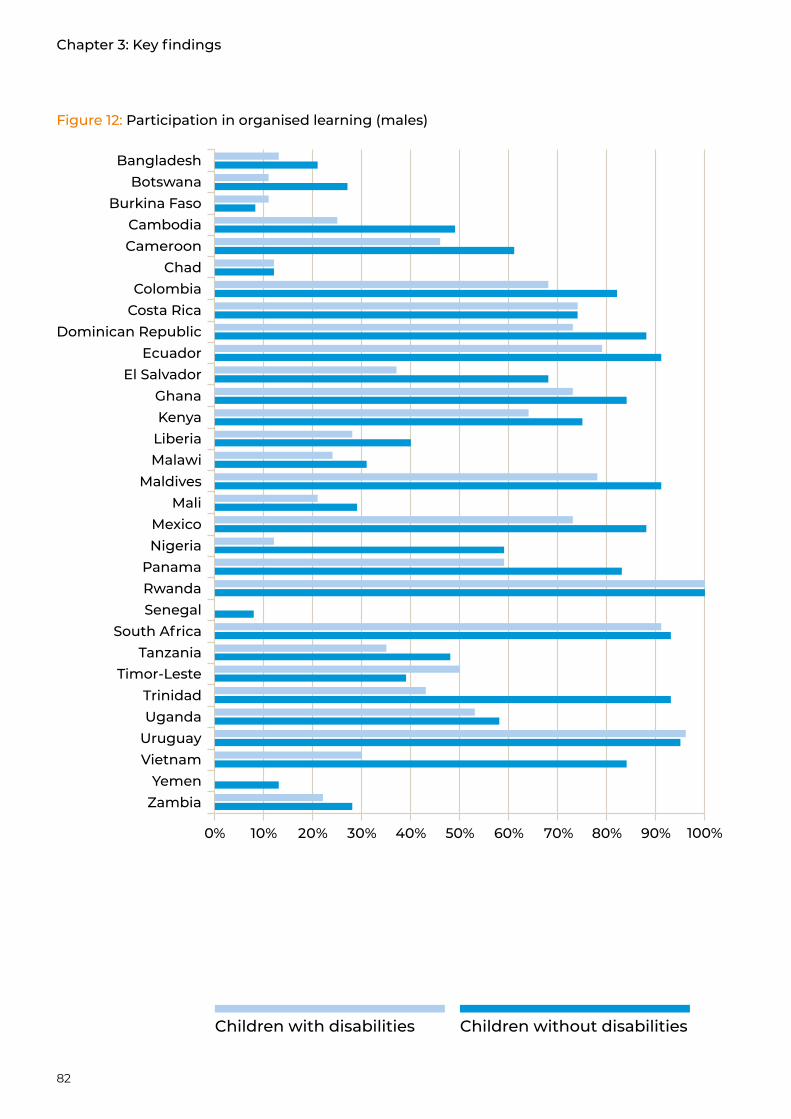
82
Figure 12: Participation in organised learning (males)
0% 10% 20% 30% 40% 50% 60% 70%
ZambiaYemen
VietnamUruguayUgandaTrinidad
Timor-LesteTanzania
South AfricaSenegalRwandaPanama
NigeriaMexico
MaliMaldives
MalawiLiberiaKenyaGhana
El SalvadorEcuador
Dominican RepublicCosta RicaColombia
ChadCameroonCambodia
Burkina FasoBotswana
Bangladesh
80% 90% 100%
Children without disabilitiesChildren with disabilities
Chapter 3: Key findings
83
Disability Data Review
4.3.1. Participation rate of youth and adults in formal and non-formal education and training in the previous 12 months, by sex
This indicator could be produced for 35 countries. The participation rate in formal and non-formal education is estimated separately for youth (15-24 years old) and adults (25-64 years old). The results are presented below for each of the two age groups.
Age group 15-24
In the sample of people aged from 15 to 24 years old, we observe that out of 35 countries, there are only three where the participation rate of people with disabilities exceeds 50% (Colombia: 55%; Costa Rica: 53%; Botswana: 52%). In contrast, the participation rate of people with disabilities is lower than 10% in countries like Burkina Faso (9%). Egypt presents the highest gap observed between the groups with and without disabilities (47 percentage points) while Botswana (47% for people without disabilities and 52% for people with disabilities) and Colombia (46% for people without disabilities and 55% for people with disabilities) are the only countries where we observed a gap in favour of people with disabilities. When we disaggregate the data according to gender, we observe that Chad has the lowest proportion of women with disabilities (5%) participating in education/training. Moreover, in this country the participation rate of women without disabilities is four times that of the women with disabilities (21% versus 5%). However, when it comes to the male sample, descriptive statistics show an eight percentage point gap between people with disabilities (36%) and people without disabilities (44%) in Chad. Regarding the 34 remaining countries, the participation rate of women with disabilities varies from 6% (Vietnam) to 59% (Costa Rica), while that of men with disabilities ranges from 0% (Albania) to 54% (Colombia). A 12% gap exists between the participation rates of youths with and without disabilities. A gender-based analysis reveals a 10 percentage point gap (31% and 41% for women with and without disabilities) when we compare the average participation rates of women with and without disabilities; a 13 percentage gap (32% and 45% for men with and without disabilities) is observed when we compare the average participation rate of men with and without disabilities.
36. Let x% denote the average completion rate for people with disabilities and y% the average completion rate for people without disabilities. The average gap z% (z percentages points) is calculated as follows : z% = y%-x%.

84
Figure 13: Participation of youth in education and training (both sexes)
0% 10% 20% 30% 40% 50% 60% 70%
ZambiaYemen
VietnamUruguayUganda
Timor-LesteTanzaniaSt Lucia
South SudanSouth Africa
SenegalRwandaPanama
NigeriaMexico
MaliMaldives
MalawiLiberiaKenyaGhana
GambiaEl Salvador
EgyptEcuador
Dominican RepublicCosta RicaColombia
ChadCameroonCambodia
Burkina FasoBotswana
BangladeshAlbania
80% 90% 100%
Youth without disabilitiesYouth with disabilities
Chapter 3: Key findings
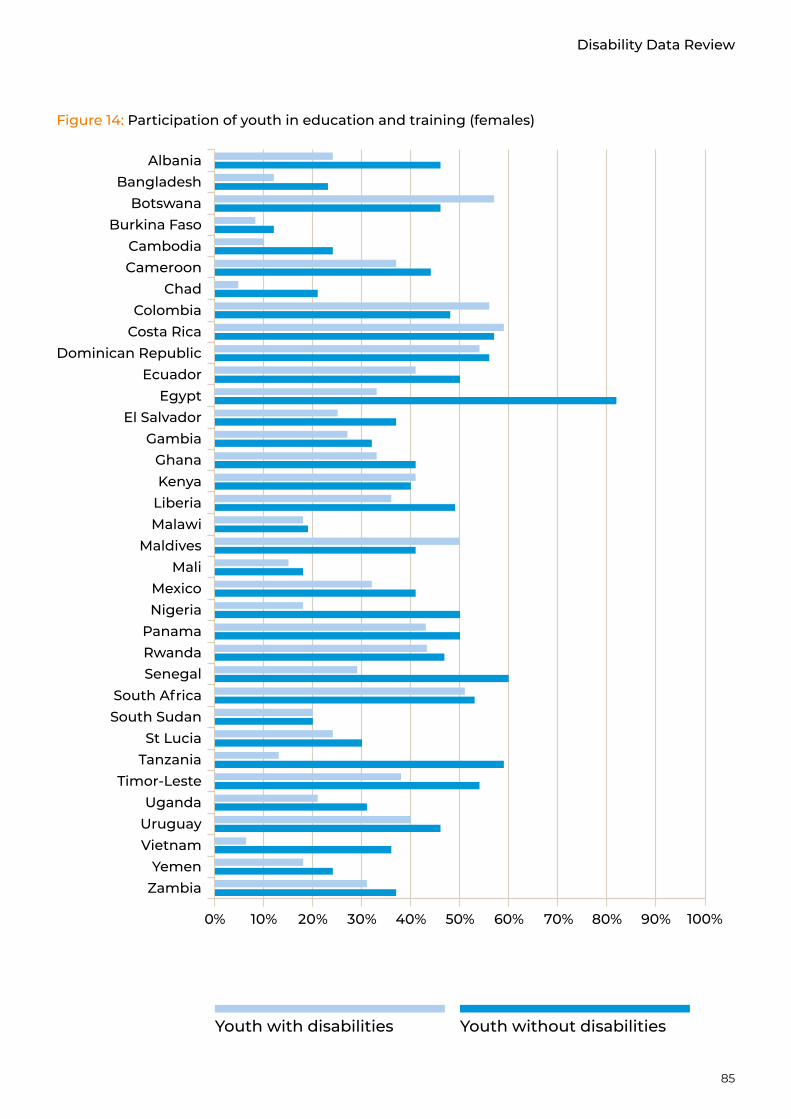
85
Disability Data Review
Figure 14: Participation of youth in education and training (females)
0% 10% 20% 30% 40% 50% 60% 70%
ZambiaYemen
VietnamUruguayUganda
Timor-LesteTanzaniaSt Lucia
South SudanSouth Africa
SenegalRwandaPanama
NigeriaMexico
MaliMaldives
MalawiLiberiaKenyaGhana
GambiaEl Salvador
EgyptEcuador
Dominican RepublicCosta RicaColombia
ChadCameroonCambodia
Burkina FasoBotswana
BangladeshAlbania
80% 90% 100%
Youth without disabilitiesYouth with disabilities

86
Figure 15: Participation of youth in education and training (males)
0% 10% 20% 30% 40% 50% 60% 70%
ZambiaYemen
VietnamUruguayUganda
Timor-LesteTanzania
South SudanSenegalRwandaPanama
NigeriaMexico
MaliMalawiLiberiaGhana
GambiaEl Salvador
EgyptEcuador
Dominican RepublicCosta Rica
ChadCameroonCambodia
Burkina FasoBangladesh
80% 90% 100%
Zimbabwe
Youth without disabilitiesYouth with disabilities
Chapter 3: Key findings
87
Disability Data Review
Age group 25-64
We were able to estimate the indicator for the age group 25-64 in a total of 23 countries. The highest participation rates for people with disabilities are observed in Dominican Republic and Ecuador (6.5%), while the largest gaps between the groups with and without disabilities are observed in Liberia (5.5% and 11% for people with and without disabilities, leading to a 5.5 percentage point gap) and Nigeria (0.5% and 4.5% for people with and without disabilities respectively, leading to a four percentage point gap). When we consider males and females separately, we notice that Rwanda has the highest participation rate for men with disabilities (7%) while Dominican Republic presents the highest participation rate among women with disabilities (7.5%). Furthermore, the average gap (for the 23 countries) between those with and without disabilities is 2% in both the female (2.4% and 4.2% for women with and without disabilities respectively) and the male sample (2.6% and 4.4% for men with and without disabilities respectively).
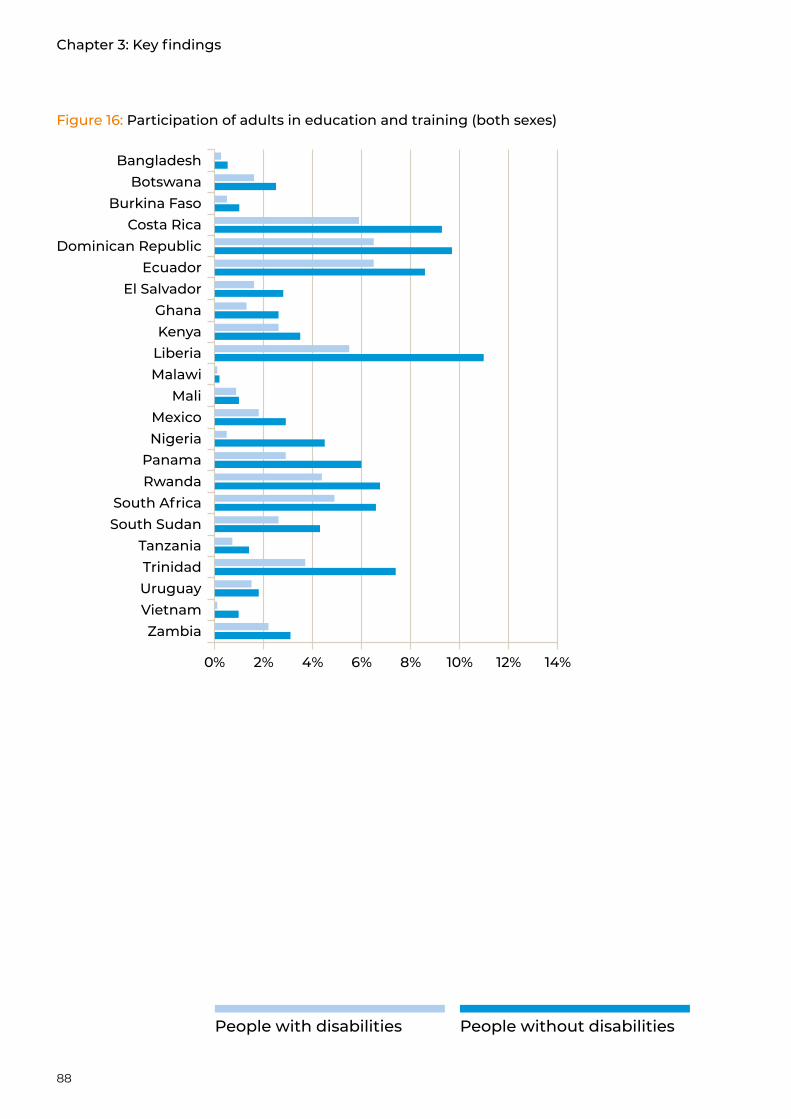
88
Figure 16: Participation of adults in education and training (both sexes)
0% 2% 4% 6% 8% 10% 12%
ZambiaVietnamUruguayTrinidad
TanzaniaSouth SudanSouth Africa
RwandaPanama
NigeriaMexico
MaliMalawiLiberiaKenyaGhana
El SalvadorEcuador
Dominican RepublicCosta Rica
Burkina FasoBotswana
Bangladesh
14%
People without disabilitiesPeople with disabilities
Chapter 3: Key findings

89
Disability Data Review
Figure 17: Participation of adults in education and training (females)
People without disabilitiesPeople with disabilities
0% 2% 4% 6% 8% 10% 12%
ZambiaVietnamUruguayTrinidad
TanzaniaSouth SudanSouth Africa
RwandaPanama
NigeriaMexico
MaliMalawiLiberiaKenyaGhana
El SalvadorEcuador
Dominican RepublicCosta Rica
Burkina FasoBotswana
Bangladesh
14%
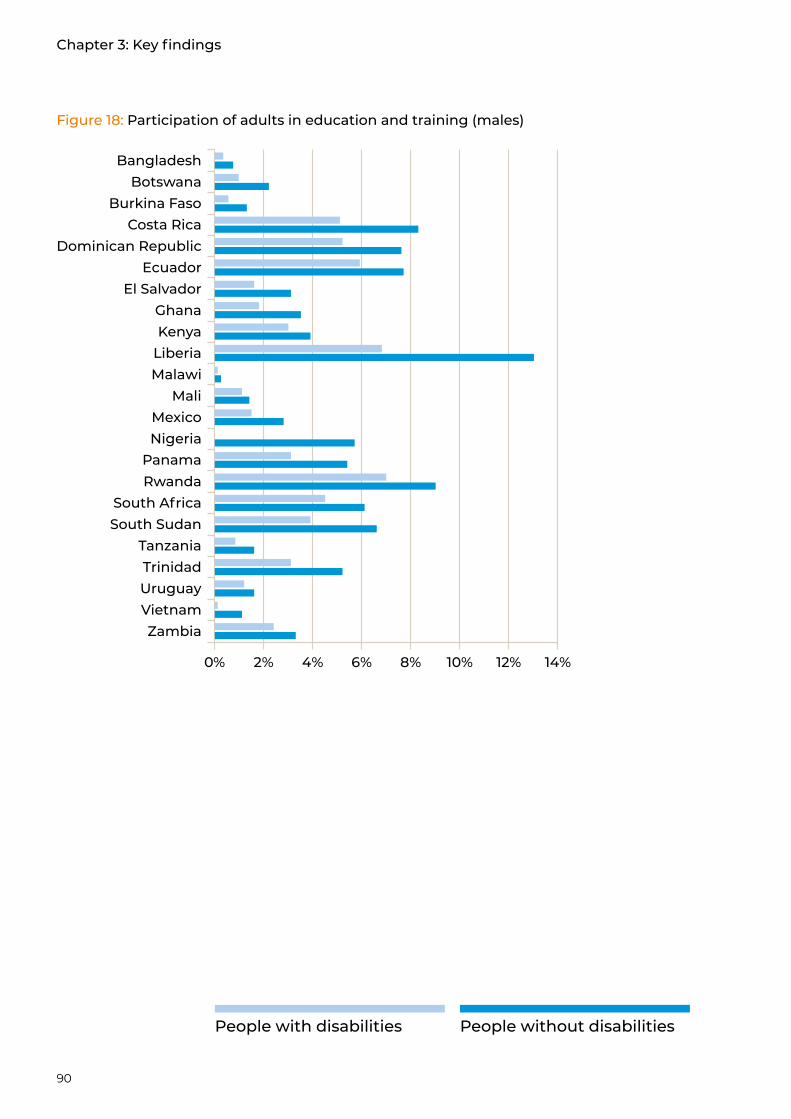
90
Figure 18: Participation of adults in education and training (males)
People without disabilitiesPeople with disabilities
0% 2% 4% 6% 8% 10% 12%
ZambiaVietnamUruguayTrinidad
TanzaniaSouth SudanSouth Africa
RwandaPanama
NigeriaMexico
MaliMalawiLiberiaKenyaGhana
El SalvadorEcuador
Dominican RepublicCosta Rica
Burkina FasoBotswana
Bangladesh
14%
Chapter 3: Key findings

91
Disability Data Review
Related to SDG target 4.5: 4.5.x University completion rates (or university access rates as proxy)
We have considered two age groups for our calculations. The first group is composed of those who are 25 to 54 years old (35 countries) while the second group is composed of people who are at least 55 years old (34 countries).
Age group 25-54
When we consider the age group 25-54 years old, we observe that the average university completion rates for people with disabilities and those without a disability are 4.5% and 7.9% respectively. The university completion rate among people with disabilities varies from 0% in Senegal to 25% in Colombia. Panama presents the widest gap between the two groups of interest (12 percentage points; that is 19% and 7% for people without and people with disabilities respectively). Out of 35 countries, Gambia (8.2% and 6.1% for people with and without disabilities respectively, leading to a two percentage points gap) and Colombia (25% and 21% for people with and without disabilities respective – a four percentage points gap) are the only ones with gaps in favour of people with disabilities. When we consider the male sample, we observe that the highest gap between the two groups is found in Timor-Leste (16% and 4.2% for people without and with disabilities respectively, leading to a 12 percentage points gap) and Albania (14% and 2.3% for people without and with disabilities respectively – a 12 percentage points gap). However, when it comes to the female sample, Panama is associated with the widest gap between the two groups (22% and 9% for women without disabilities and women with disabilities respectively – a gap of 13 percentage points). On average, 7.9% and 4.5% of people without disabilities and people with disabilities respectively who are 25 to 54 years of age have completed university.
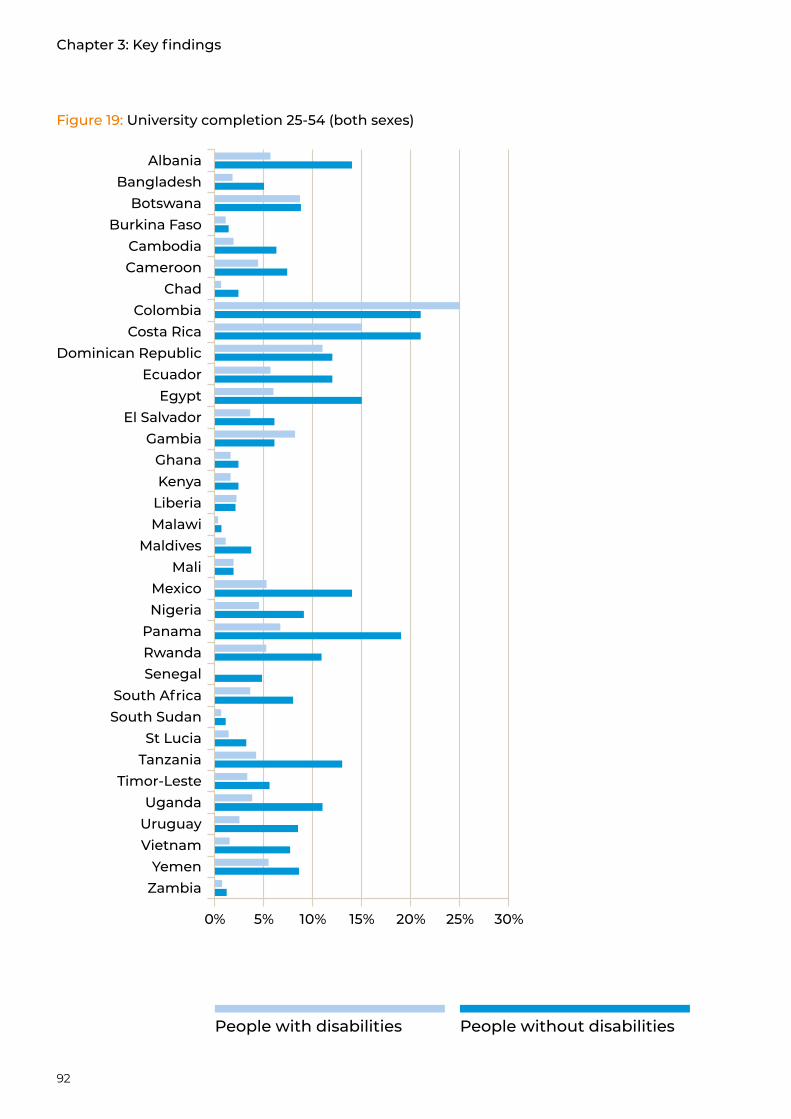
92
Figure 19: University completion 25-54 (both sexes)
0% 5% 10% 15% 20% 25% 30%
ZambiaYemen
VietnamUruguayUganda
Timor-LesteTanzaniaSt Lucia
South SudanSouth Africa
SenegalRwandaPanama
NigeriaMexico
MaliMaldives
MalawiLiberiaKenyaGhana
GambiaEl Salvador
EgyptEcuador
Dominican RepublicCosta RicaColombia
ChadCameroonCambodia
Burkina FasoBotswana
BangladeshAlbania
People without disabilitiesPeople with disabilities
Chapter 3: Key findings
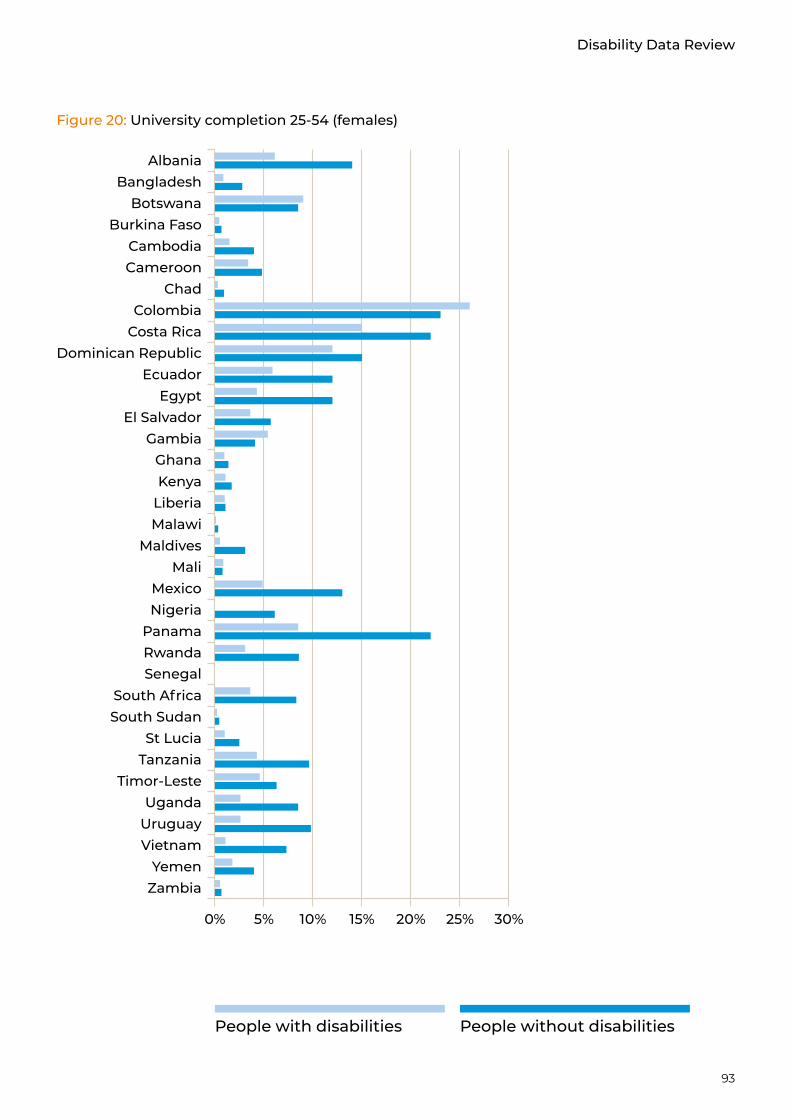
93
Disability Data Review
Figure 20: University completion 25-54 (females)
People without disabilitiesPeople with disabilities
0% 5% 10% 15% 20% 25% 30%
ZambiaYemen
VietnamUruguayUganda
Timor-LesteTanzaniaSt Lucia
South SudanSouth Africa
SenegalRwandaPanama
NigeriaMexico
MaliMaldives
MalawiLiberiaKenyaGhana
GambiaEl Salvador
EgyptEcuador
Dominican RepublicCosta RicaColombia
ChadCameroonCambodia
Burkina FasoBotswana
BangladeshAlbania
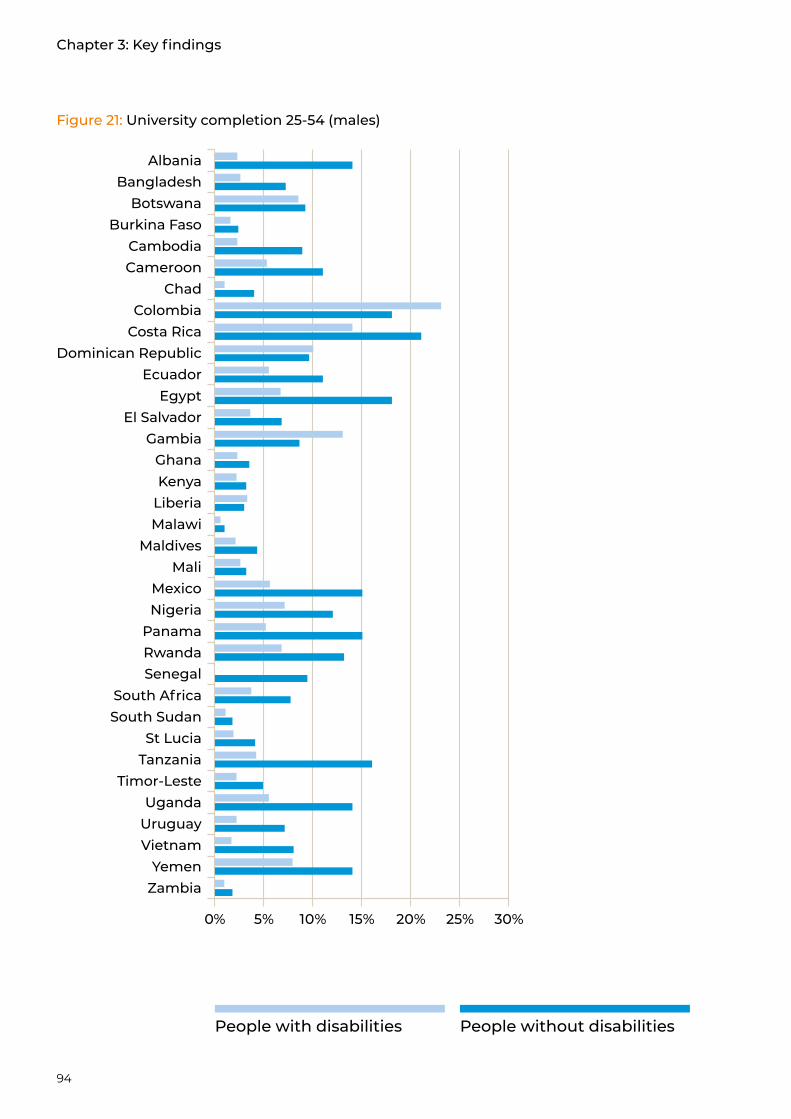
94
0% 5% 10% 15% 20% 25% 30%
ZambiaYemen
VietnamUruguayUganda
Timor-LesteTanzaniaSt Lucia
South SudanSouth Africa
SenegalRwandaPanama
NigeriaMexico
MaliMaldives
MalawiLiberiaKenyaGhana
GambiaEl Salvador
EgyptEcuador
Dominican RepublicCosta RicaColombia
ChadCameroonCambodia
Burkina FasoBotswana
BangladeshAlbania
Figure 21: University completion 25-54 (males)
People without disabilitiesPeople with disabilities
Chapter 3: Key findings
95
Disability Data Review
Age group 55 and above
Regarding the age group 55 and above, a 1.9 percentage point gap is found when we compare the university completion rates of people with disabilities (1.8%) with that of people without disabilities (3.7%). Statistics reveal that Costa Rica is the country with the widest gap between people with and without disabilities (5.8% and 13% respectively for people with and without disabilities-a gap of 7.2 percentage points). However, it is also one of the countries presenting the highest university completion rates whether we consider people with disabilities (6%) or people without disabilities (13%). Once again, we observe a gap in favour of people with disabilities in Colombia (6.7% and 5.6% respectively for people with and without disabilities-a gap of 1.1 percentage point) and Gambia (5.7% and 3.4% respectively for people with and without disabilities-a gap of 2.3 percentage point). In general, the university completion rate for people with disabilities ranges from 0.1% in Maldives or Cambodia to 8% in Colombia, while it varies between 0.1% (Maldives) to 13% (Costa Rica) among people without disabilities. When we focus on the male sample, we notice that out of 34 countries, there are only three (Nigeria: 7.3%; Colombia: 8.5%; Gambia: 9%) where the university completion rate of people with disabilities is higher than 6% (versus 11 countries if we consider people without disabilities). In contrast, when we consider the female sample, the university completion rate of people with disabilities is below 6% for all countries considered. However in two countries we observe that the completion rate for women without disabilities is above 6% (Costa Rica: 12%; Panama: 9.6%).
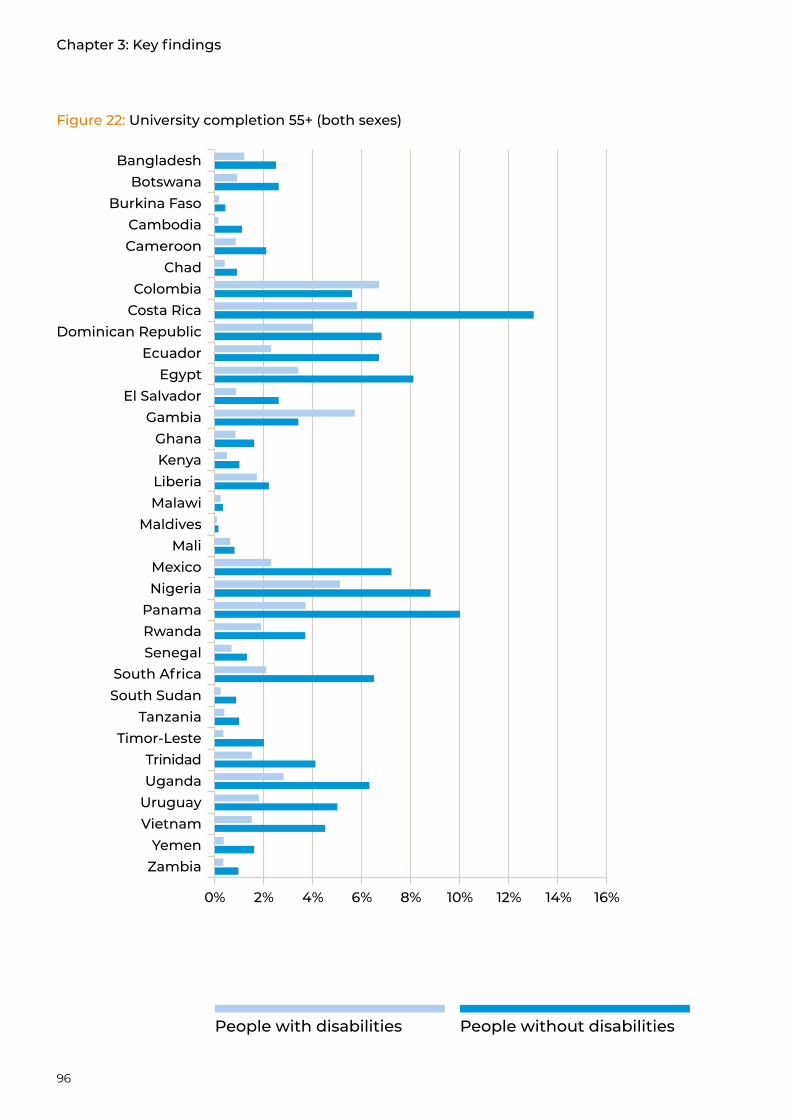
96
Figure 22: University completion 55+ (both sexes)
0% 2% 4% 6% 8% 10% 12% 14%
ZambiaYemen
VietnamUruguayUgandaTrinidad
Timor-LesteTanzania
South SudanSouth Africa
SenegalRwandaPanama
NigeriaMexico
MaliMaldives
MalawiLiberiaKenyaGhana
GambiaEl Salvador
EgyptEcuador
Dominican RepublicCosta RicaColombia
ChadCameroonCambodia
Burkina FasoBotswana
Bangladesh
16%
People without disabilitiesPeople with disabilities
Chapter 3: Key findings
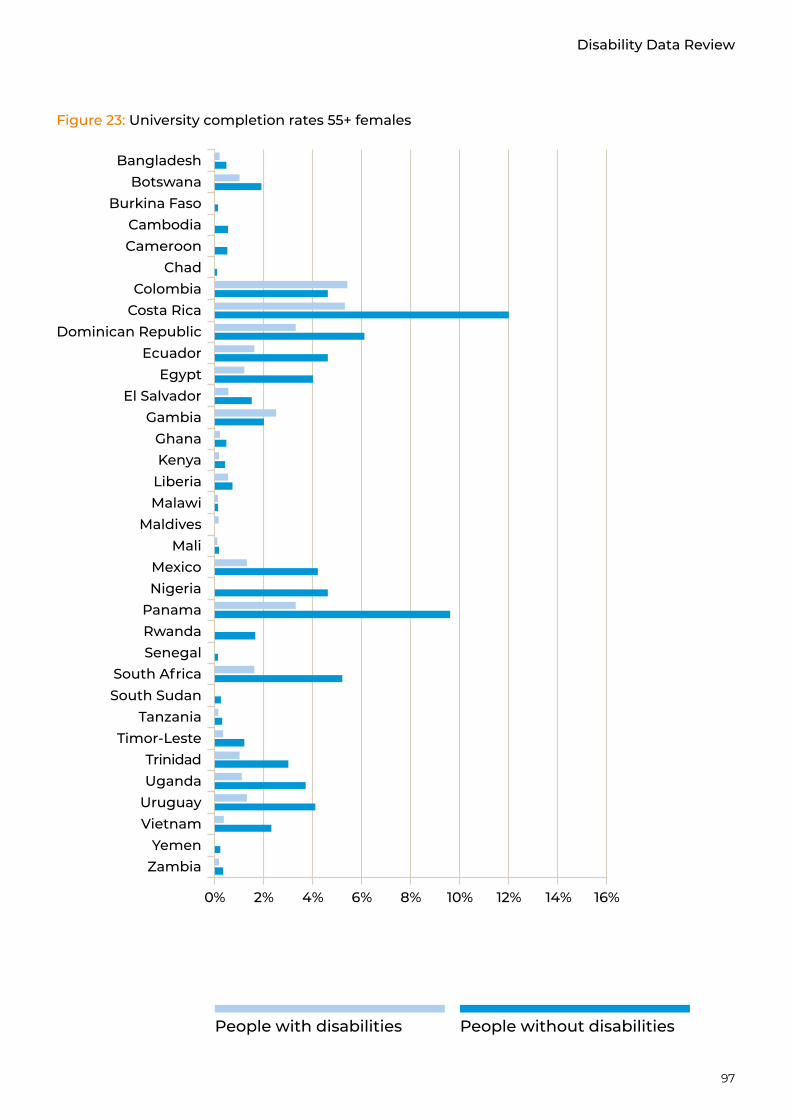
97
Disability Data Review
0% 2% 4% 6% 8% 10% 12% 14%
ZambiaYemen
VietnamUruguayUgandaTrinidad
Timor-LesteTanzania
South SudanSouth Africa
SenegalRwandaPanama
NigeriaMexico
MaliMaldives
MalawiLiberiaKenyaGhana
GambiaEl Salvador
EgyptEcuador
Dominican RepublicCosta RicaColombia
ChadCameroonCambodia
Burkina FasoBotswana
Bangladesh
16%
Figure 23: University completion rates 55+ females
People without disabilitiesPeople with disabilities
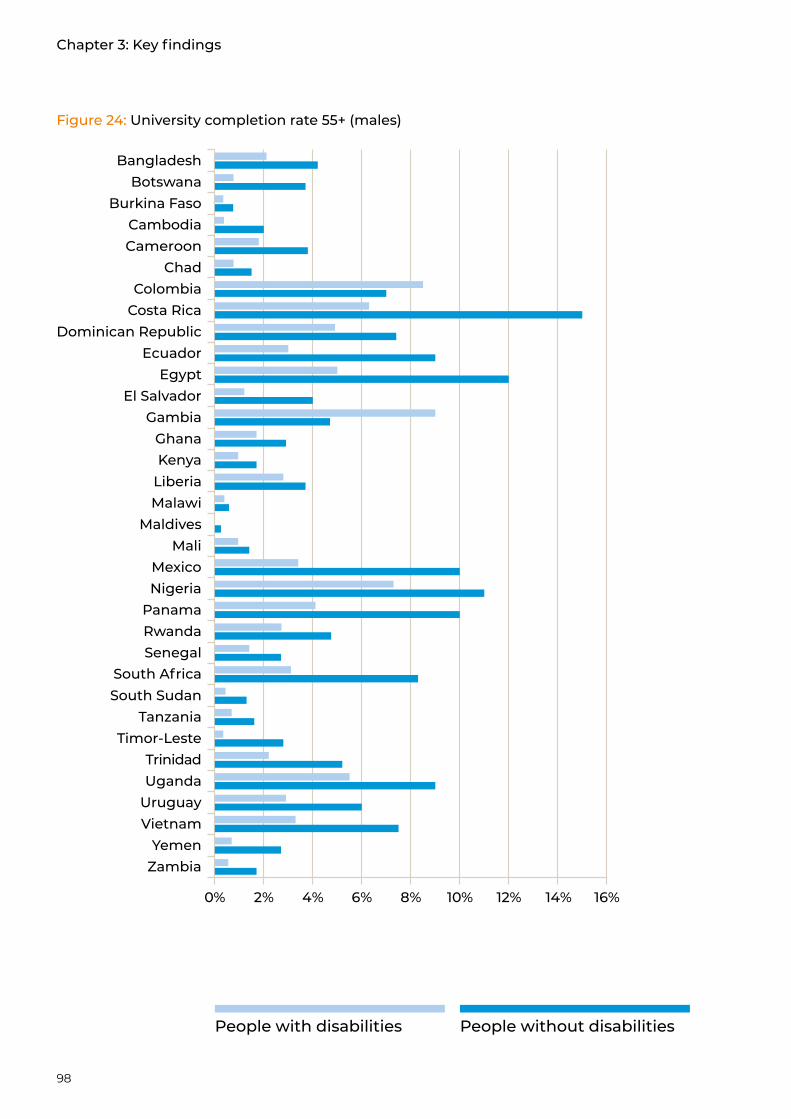
98
Figure 24: University completion rate 55+ (males)
0% 2% 4% 6% 8% 10% 12% 14%
ZambiaYemen
VietnamUruguayUgandaTrinidad
Timor-LesteTanzania
South SudanSouth Africa
SenegalRwandaPanama
NigeriaMexico
MaliMaldives
MalawiLiberiaKenyaGhana
GambiaEl Salvador
EgyptEcuador
Dominican RepublicCosta RicaColombia
ChadCameroonCambodia
Burkina FasoBotswana
Bangladesh
16%
People without disabilitiesPeople with disabilities
Chapter 3: Key findings

99
Disability Data Review
4.6.1(a). Proportion of population in a given age group achieving at least a fixed level of proficiency in functional literacy skills, by sex
For the 32 countries for which this calculation is possible we have divided the population into three groups. The first group is composed of individuals who are under 25 years of age (with the lower age limit varying by country - for example, in Burkina Faso the question is asked to people who are at least 3 years of age), the second group is composed of those who are at least 25 years old and the third group is composed of people who are at least 15 years old.
Below 25
When we consider people who are at most 24 years old, we observe that in five countries (Uruguay: 100%; Panama: 98%; Rwanda: 97%; Ecuador: 93%; Vietnam: 93%) more than 90% of the population of people without disabilities have functional literacy skills. In contrast, when we consider the population with a disability, the proportion of individuals with literacy skills is always lower than 90% except in Rwanda (96%). Burkina Faso is the country with the lowest proportion of people with functional literacy skills (25% and 21% for people without disabilities and those with disabilities respectively). A gap in favour of people with disabilities exists only in South Sudan (38% and 35% for people with and without disabilities respectively – a gap of three percentage points). Vietnam (93% and 34% for people with and without disabilities respectively – a gap of 59 percentage points) is the only country with a gap higher than 50 percentage points between those with and without disabilities.
A gender-based analysis reveals that Burkina Faso remains the country with the lowest literacy rate, whether for those without disabilities (22% and 29% for females and males respectively) or those with disabilities (19% and 23% for females and males respectively). The average gap between people with disabilities and people without disabilities corresponds to 18 percentage points (55% and 73% for women with and without disabilities respectively) and 17 percentage points (58% and 75% for men with and without disabilities respectively) respectively in the female and male samples.
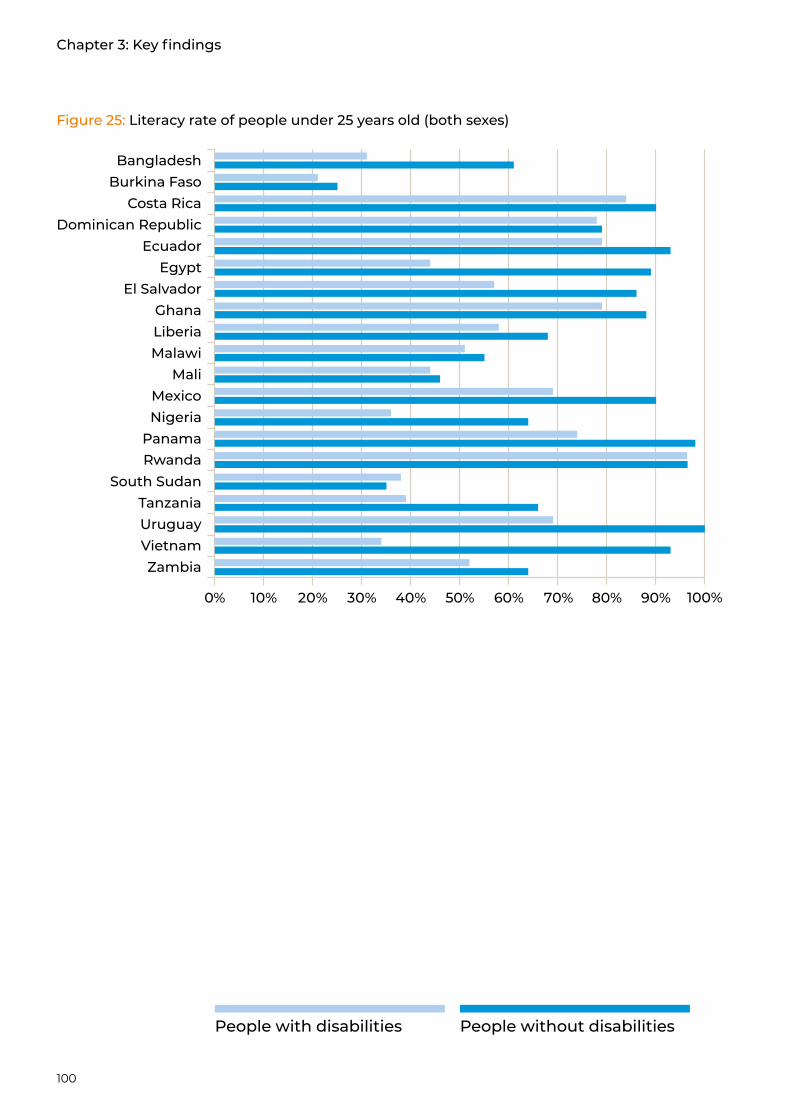
100
Figure 25: Literacy rate of people under 25 years old (both sexes)
ZambiaVietnamUruguayTanzania
South SudanRwandaPanama
NigeriaMexico
MaliMalawiLiberiaGhana
El SalvadorEgypt
EcuadorDominican Republic
Costa RicaBurkina Faso
Bangladesh
0% 10% 20% 30% 40% 50% 60% 70% 80% 90% 100%
People without disabilitiesPeople with disabilities
Chapter 3: Key findings
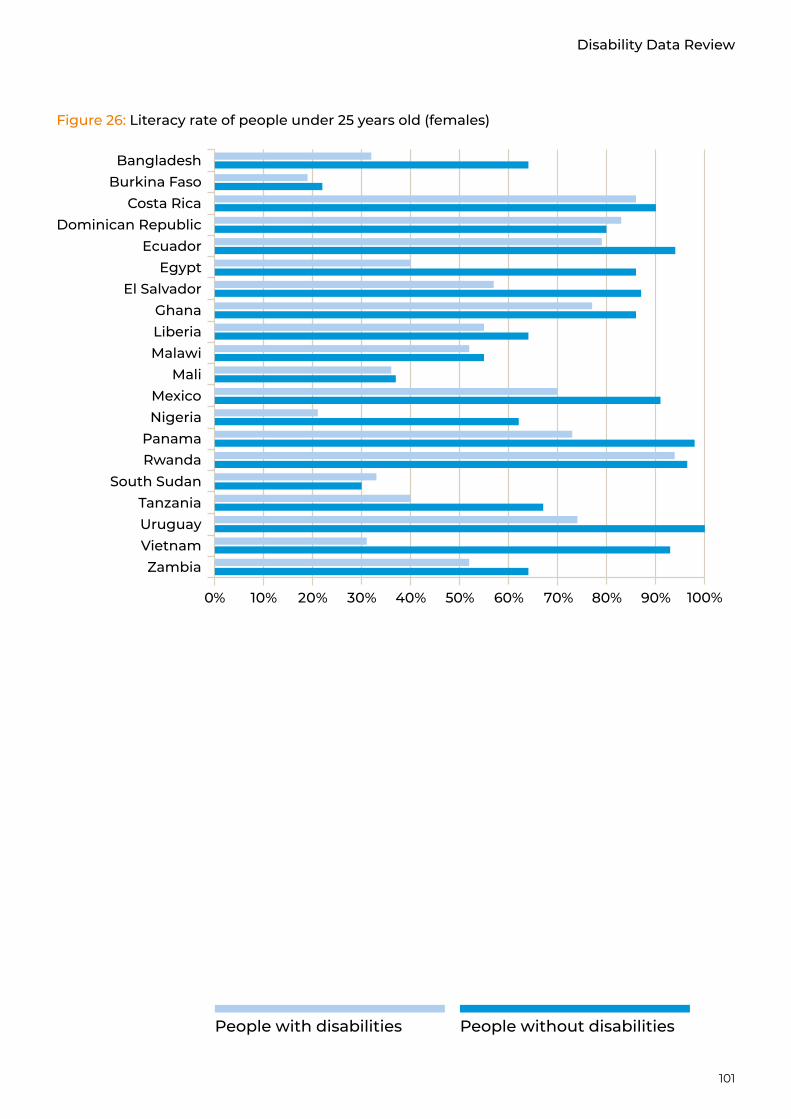
101
Disability Data Review
Figure 26: Literacy rate of people under 25 years old (females)
ZambiaVietnamUruguayTanzania
South SudanRwandaPanama
NigeriaMexico
MaliMalawiLiberiaGhana
El SalvadorEgypt
EcuadorDominican Republic
Costa RicaBurkina Faso
Bangladesh
0% 10% 20% 30% 40% 50% 60% 70% 80% 90% 100%
People without disabilitiesPeople with disabilities

102
Figure 27: Literacy rate of people under 25 years old (males)
ZambiaVietnamUruguayTanzania
South SudanRwandaPanama
NigeriaMexico
MaliMalawiLiberiaGhana
El SalvadorEgypt
EcuadorDominican Republic
Costa RicaBurkina Faso
Bangladesh
0% 10% 20% 30% 40% 50% 60% 70% 80% 90% 100%
People without disabilitiesPeople with disabilities
Chapter 3: Key findings
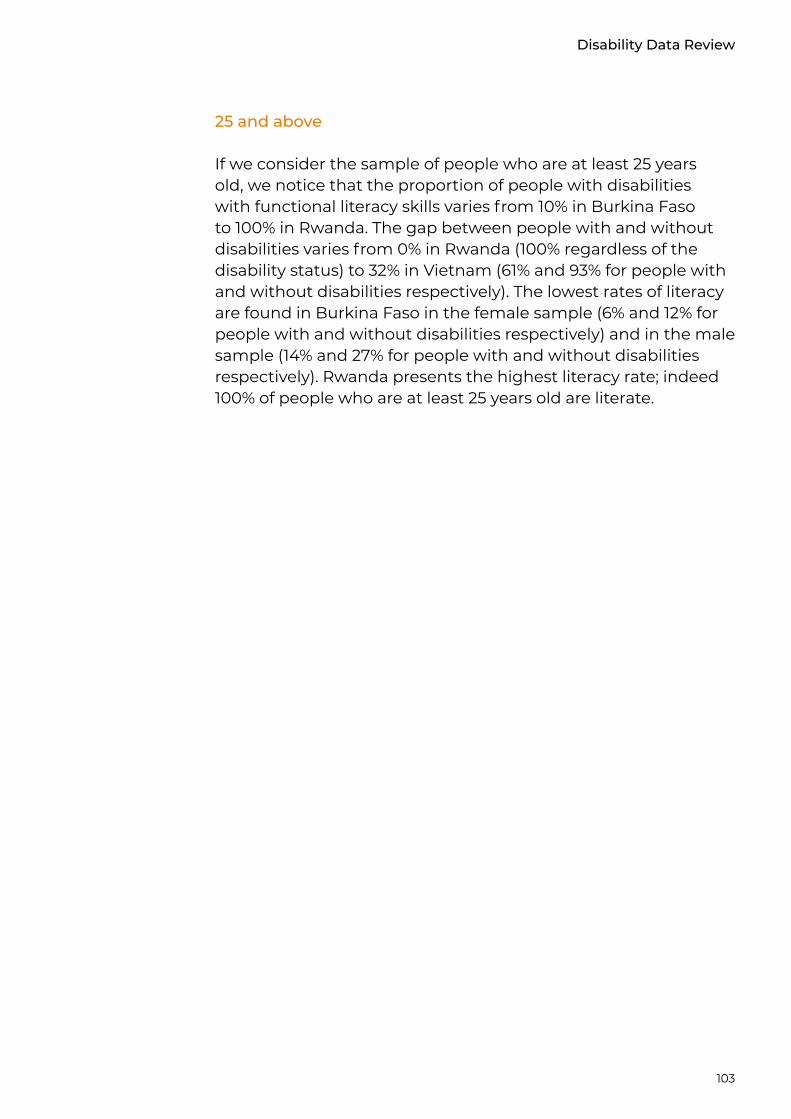
103
Disability Data Review
25 and above
If we consider the sample of people who are at least 25 years old, we notice that the proportion of people with disabilities with functional literacy skills varies from 10% in Burkina Faso to 100% in Rwanda. The gap between people with and without disabilities varies from 0% in Rwanda (100% regardless of the disability status) to 32% in Vietnam (61% and 93% for people with and without disabilities respectively). The lowest rates of literacy are found in Burkina Faso in the female sample (6% and 12% for people with and without disabilities respectively) and in the male sample (14% and 27% for people with and without disabilities respectively). Rwanda presents the highest literacy rate; indeed 100% of people who are at least 25 years old are literate.
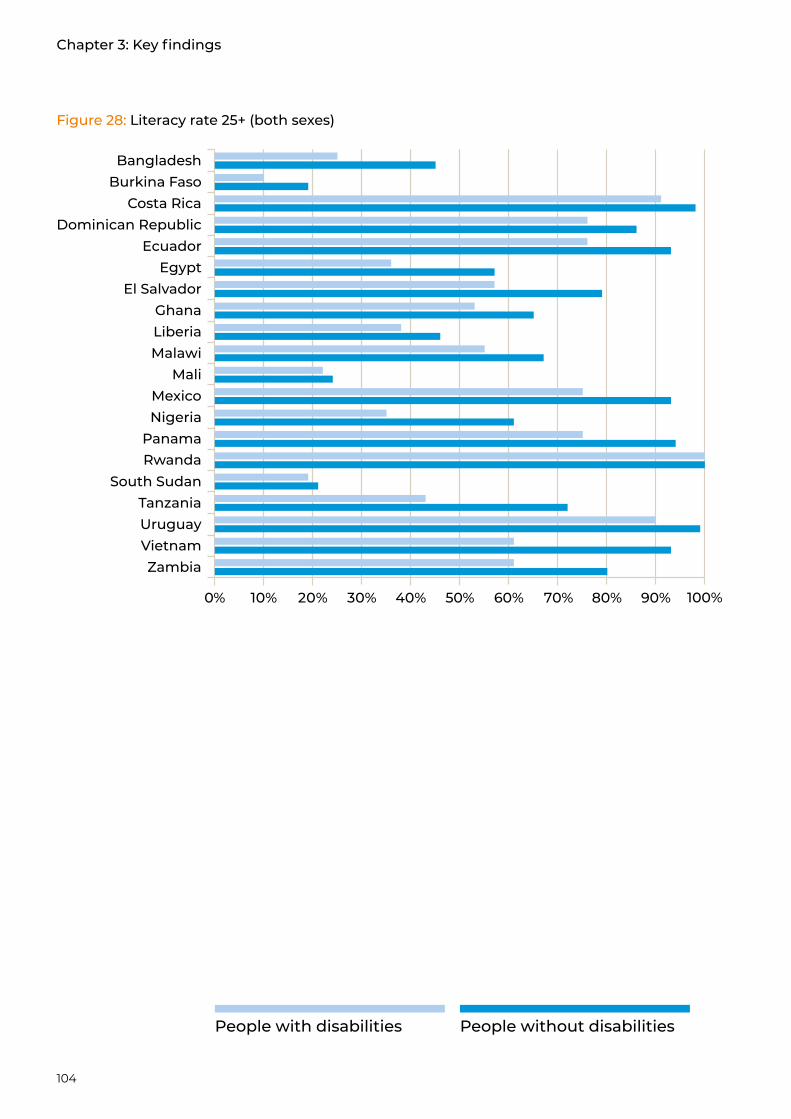
104
Figure 28: Literacy rate 25+ (both sexes)
ZambiaVietnamUruguayTanzania
South SudanRwandaPanama
NigeriaMexico
MaliMalawiLiberiaGhana
El SalvadorEgypt
EcuadorDominican Republic
Costa RicaBurkina Faso
Bangladesh
0% 10% 20% 30% 40% 50% 60% 70% 80% 90% 100%
People without disabilitiesPeople with disabilities
Chapter 3: Key findings
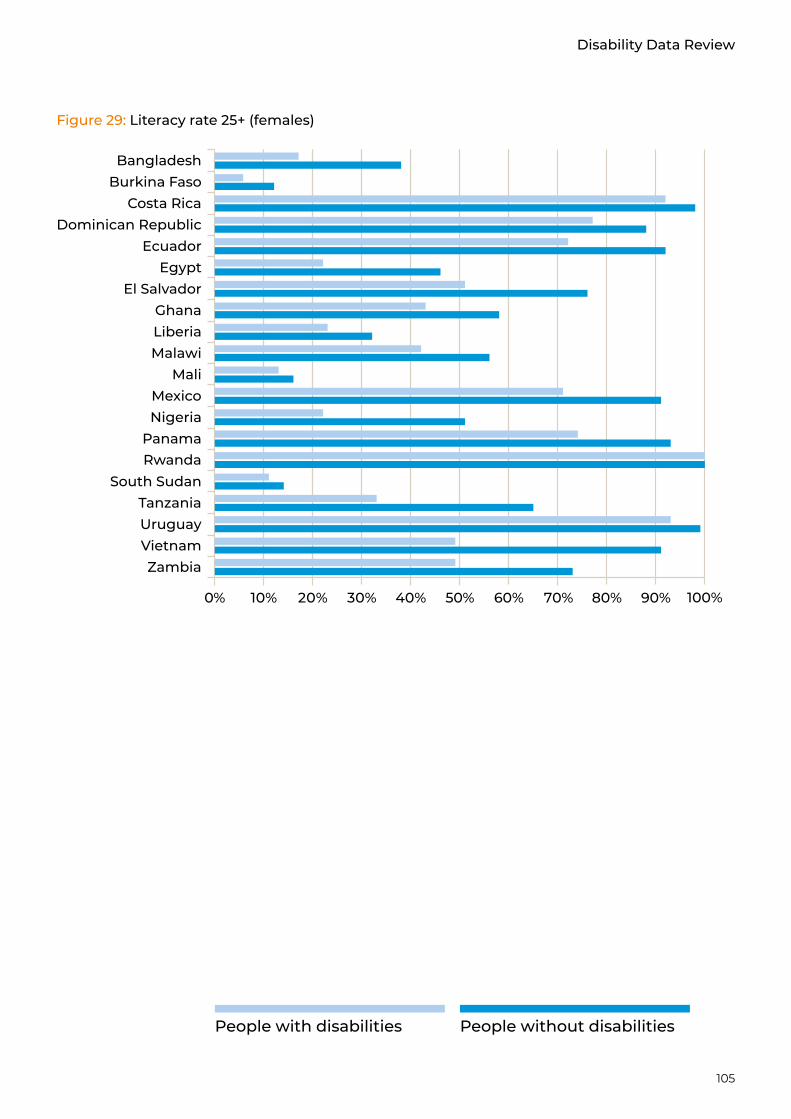
105
Disability Data Review
Figure 29: Literacy rate 25+ (females)
ZambiaVietnamUruguayTanzania
South SudanRwandaPanama
NigeriaMexico
MaliMalawiLiberiaGhana
El SalvadorEgypt
EcuadorDominican Republic
Costa RicaBurkina Faso
Bangladesh
0% 10% 20% 30% 40% 50% 60% 70% 80% 90% 100%
People without disabilitiesPeople with disabilities
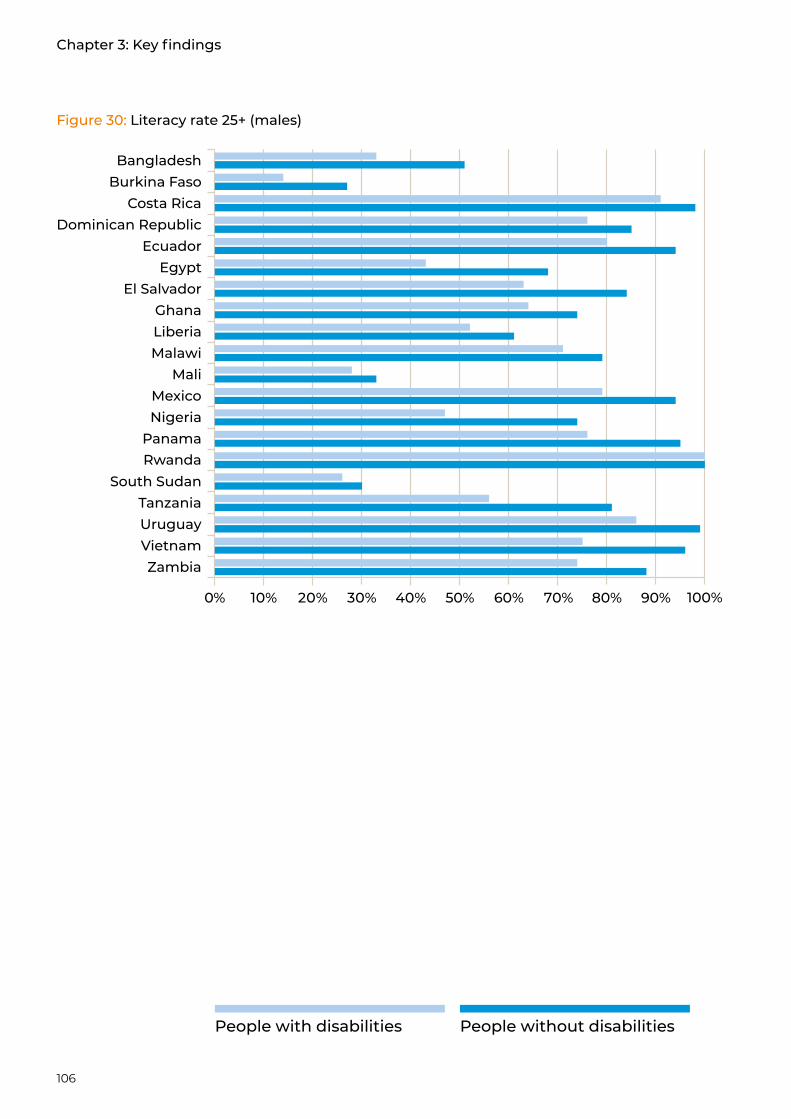
106
Figure 30: Literacy rate 25+ (males)
ZambiaVietnamUruguayTanzania
South SudanRwandaPanama
NigeriaMexico
MaliMalawiLiberiaGhana
El SalvadorEgypt
EcuadorDominican Republic
Costa RicaBurkina Faso
Bangladesh
0% 10% 20% 30% 40% 50% 60% 70% 80% 90% 100%
People without disabilitiesPeople with disabilities
Chapter 3: Key findings
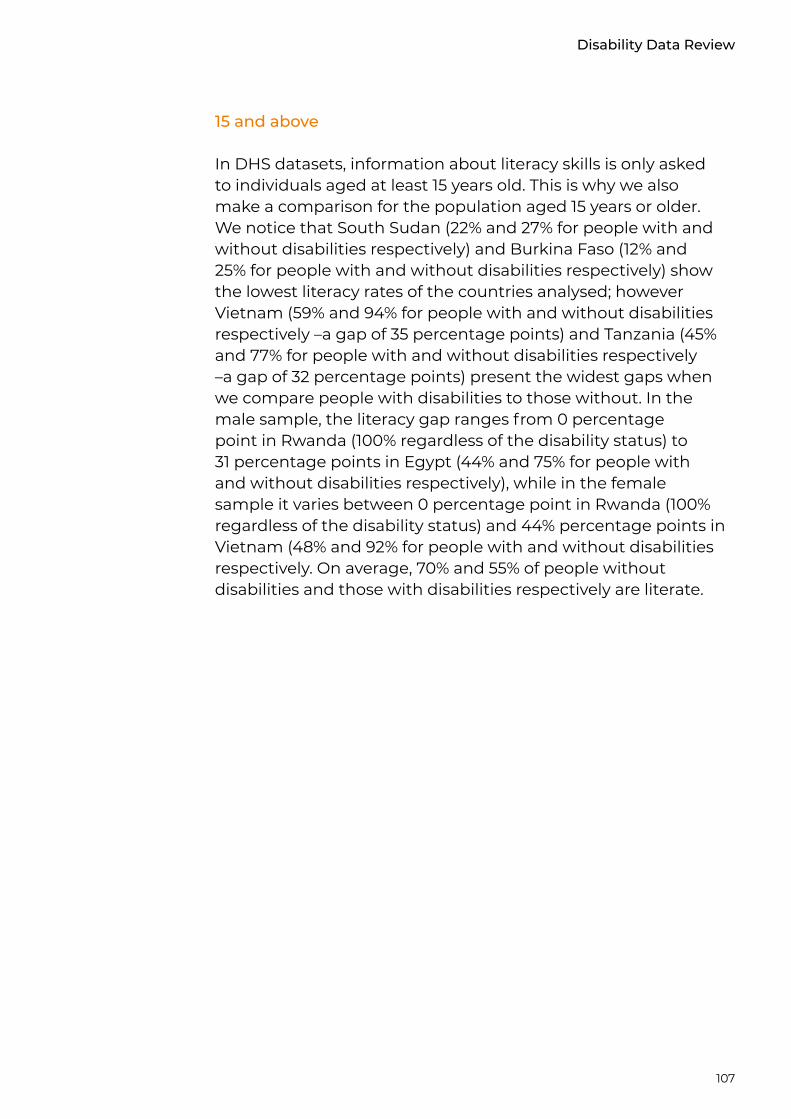
107
Disability Data Review
15 and above
In DHS datasets, information about literacy skills is only asked to individuals aged at least 15 years old. This is why we also make a comparison for the population aged 15 years or older. We notice that South Sudan (22% and 27% for people with and without disabilities respectively) and Burkina Faso (12% and 25% for people with and without disabilities respectively) show the lowest literacy rates of the countries analysed; however Vietnam (59% and 94% for people with and without disabilities respectively –a gap of 35 percentage points) and Tanzania (45% and 77% for people with and without disabilities respectively –a gap of 32 percentage points) present the widest gaps when we compare people with disabilities to those without. In the male sample, the literacy gap ranges from 0 percentage point in Rwanda (100% regardless of the disability status) to 31 percentage points in Egypt (44% and 75% for people with and without disabilities respectively), while in the female sample it varies between 0 percentage point in Rwanda (100% regardless of the disability status) and 44% percentage points in Vietnam (48% and 92% for people with and without disabilities respectively. On average, 70% and 55% of people without disabilities and those with disabilities respectively are literate.

108
ZambiaVietnamUruguayUganda
Timor-LesteTanzania
South SudanSenegalRwandaPanama
NigeriaMexico
MaliMalawiLiberiaGhana
GambiaEl Salvador
EgyptEcuador
Dominican RepublicCosta RicaCameroonCambodia
Burkina FasoBangladesh
0% 10% 20% 30% 40% 50% 60% 70% 80% 90% 100%
Zimbabwe
Figure 31: Literacy rate 15+ (both sexes)
People without disabilitiesPeople with disabilities
Chapter 3: Key findings
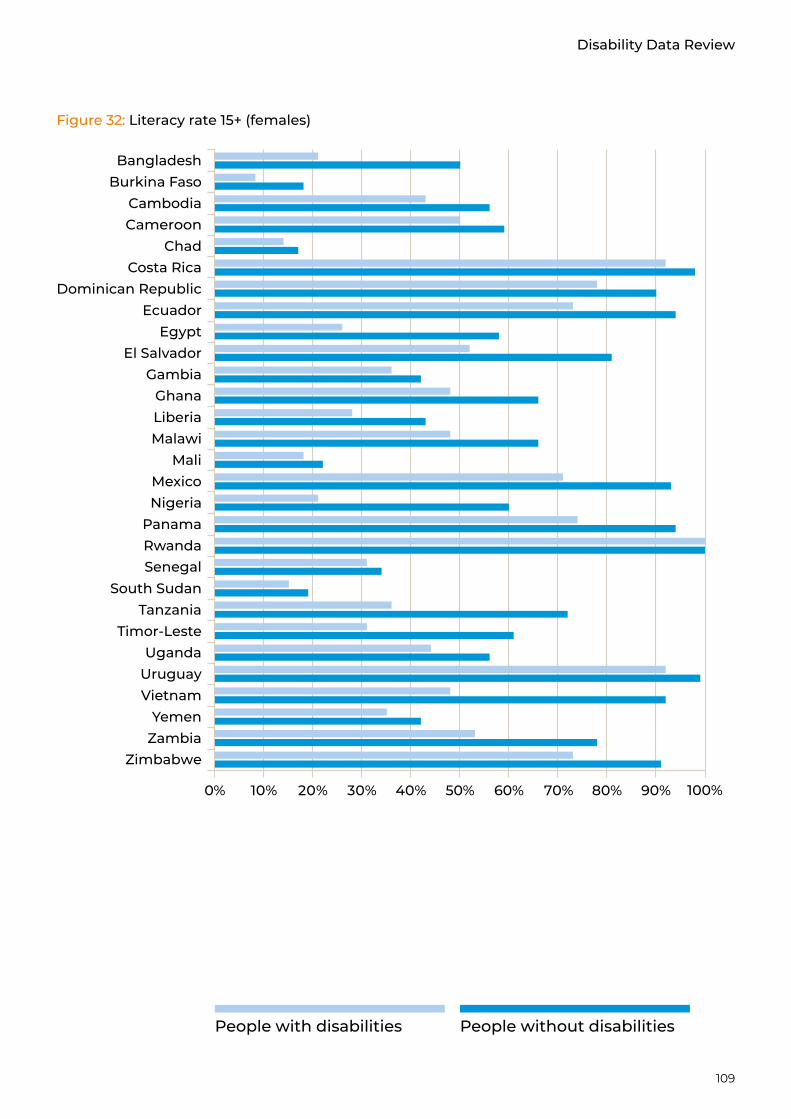
109
Disability Data Review
0% 10% 20% 30% 40% 50% 60% 70%
ZambiaYemen
VietnamUruguayUganda
Timor-LesteTanzania
South SudanSenegalRwandaPanama
NigeriaMexico
MaliMalawiLiberiaGhana
GambiaEl Salvador
EgyptEcuador
Dominican RepublicCosta Rica
ChadCameroonCambodia
Burkina FasoBangladesh
80% 90% 100%
Zimbabwe
Figure 32: Literacy rate 15+ (females)
People without disabilitiesPeople with disabilities
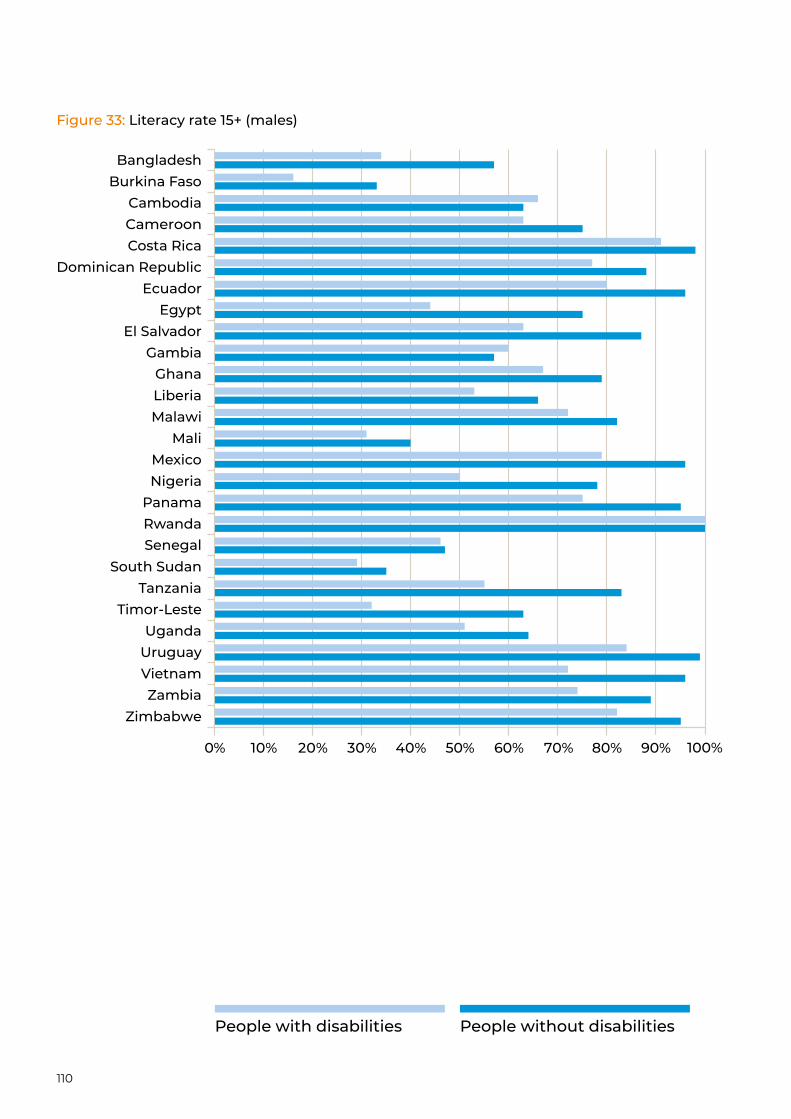
110
ZambiaVietnamUruguayUganda
Timor-LesteTanzania
South SudanSenegalRwandaPanama
NigeriaMexico
MaliMalawiLiberiaGhana
GambiaEl Salvador
EgyptEcuador
Dominican RepublicCosta RicaCameroonCambodia
Burkina FasoBangladesh
0% 10% 20% 30% 40% 50% 60% 70% 80% 90% 100%
Zimbabwe
Figure 33: Literacy rate 15+ (males)
People without disabilitiesPeople with disabilities
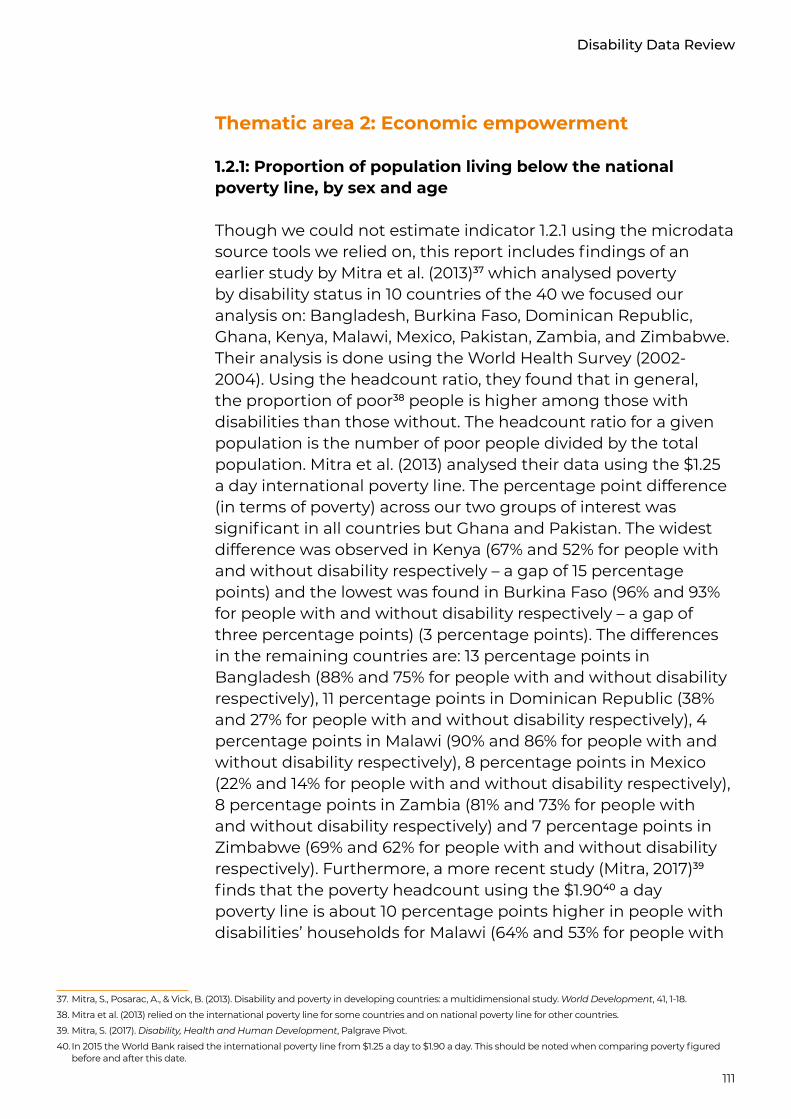
111
Disability Data Review
Thematic area 2: Economic empowerment
1.2.1: Proportion of population living below the national poverty line, by sex and age
Though we could not estimate indicator 1.2.1 using the microdata source tools we relied on, this report includes findings of an earlier study by Mitra et al. (2013)37 which analysed poverty by disability status in 10 countries of the 40 we focused our analysis on: Bangladesh, Burkina Faso, Dominican Republic, Ghana, Kenya, Malawi, Mexico, Pakistan, Zambia, and Zimbabwe. Their analysis is done using the World Health Survey (2002-2004). Using the headcount ratio, they found that in general, the proportion of poor38 people is higher among those with disabilities than those without. The headcount ratio for a given population is the number of poor people divided by the total population. Mitra et al. (2013) analysed their data using the $1.25 a day international poverty line. The percentage point difference (in terms of poverty) across our two groups of interest was significant in all countries but Ghana and Pakistan. The widest difference was observed in Kenya (67% and 52% for people with and without disability respectively – a gap of 15 percentage points) and the lowest was found in Burkina Faso (96% and 93% for people with and without disability respectively – a gap of three percentage points) (3 percentage points). The differences in the remaining countries are: 13 percentage points in Bangladesh (88% and 75% for people with and without disability respectively), 11 percentage points in Dominican Republic (38% and 27% for people with and without disability respectively), 4 percentage points in Malawi (90% and 86% for people with and without disability respectively), 8 percentage points in Mexico (22% and 14% for people with and without disability respectively), 8 percentage points in Zambia (81% and 73% for people with and without disability respectively) and 7 percentage points in Zimbabwe (69% and 62% for people with and without disability respectively). Furthermore, a more recent study (Mitra, 2017)39 finds that the poverty headcount using the $1.9040 a day poverty line is about 10 percentage points higher in people with disabilities’ households for Malawi (64% and 53% for people with
37. Mitra, S., Posarac, A., & Vick, B. (2013). Disability and poverty in developing countries: a multidimensional study. World Development, 41, 1-18.
38. Mitra et al. (2013) relied on the international poverty line for some countries and on national poverty line for other countries.
39. Mitra, S. (2017). Disability, Health and Human Development, Palgrave Pivot.
40. In 2015 the World Bank raised the international poverty line from $1.25 a day to $1.90 a day. This should be noted when comparing poverty figured before and after this date.
112
and without disability respectively), Tanzania (20% and 12% for people with and without disability respectively) and Uganda (57% and 45% for people with and without disability respectively). Calculations carried out by the World Bank in Bangladesh show a lower gap (28% and 24% for people with and without disability respectively – a gap of four percentage points) than the one found (13 percentage points) by Mitra et al. (2013).
People without disabilitiesPeople with disabilities
Figure 34: Poverty rate (both sexes)
ZimbabweZambiaUganda
TanzaniaSouth Africa
RwandaPakistan
MexicoMalawiKenyaGhana
Dominican RepublicBurkina Faso
Bangladesh
0% 10% 20% 30% 40% 50% 60% 70% 80% 90% 100%
113
Disability Data Review
8.5.2. Unemployment rate, by sex, age and people with disabilities
This indicator is estimated for people who are between 15 and 64 years of age in 38 out of the 40 countries. We have split our sample into two groups (15-24 and 25-64 years old). Statistics provided by ILO for people who are at least 16 years old are also presented in this section (Appendix 7).
Age group 15-24
The unemployment rate ranges from 0% (Senegal, Rwanda) to 77% (Nigeria) for those with disabilities and from 0.2 (Senegal) to 75% (Albania) for those who do not have a disability. Timor-Leste is the country with the highest gap between people with and without disabilities (75% and 45% for people with and without disability respectively – a gap of 30 percentage points). In Albania (61% and 75% for people with and without disability respectively – a gap of 14 percentage points), Zambia (10% and 16% for people with and without disability respectively – a gap of six percentage points) and Botswana (38% and 42% for people with and without disability respectively – a gap of four percentage points), a gap in favour of people with disabilities is observed. On average, the unemployment rate of women (28% and 30% for women without and women with disabilities respectively) are higher than that of men (15% and 20% for men without disabilities and with disabilities respectively). Information about employment in the Yemen DHS is only collected for women. It shows that the unemployment rate among women with disabilities is 100%, while it is 94% for women without disabilities. In Senegal, the unemployment rate is 0% regardless of sex and disability. 21% of youths without disabilities are unemployed. This figure corresponds to 25% for youths with disabilities.
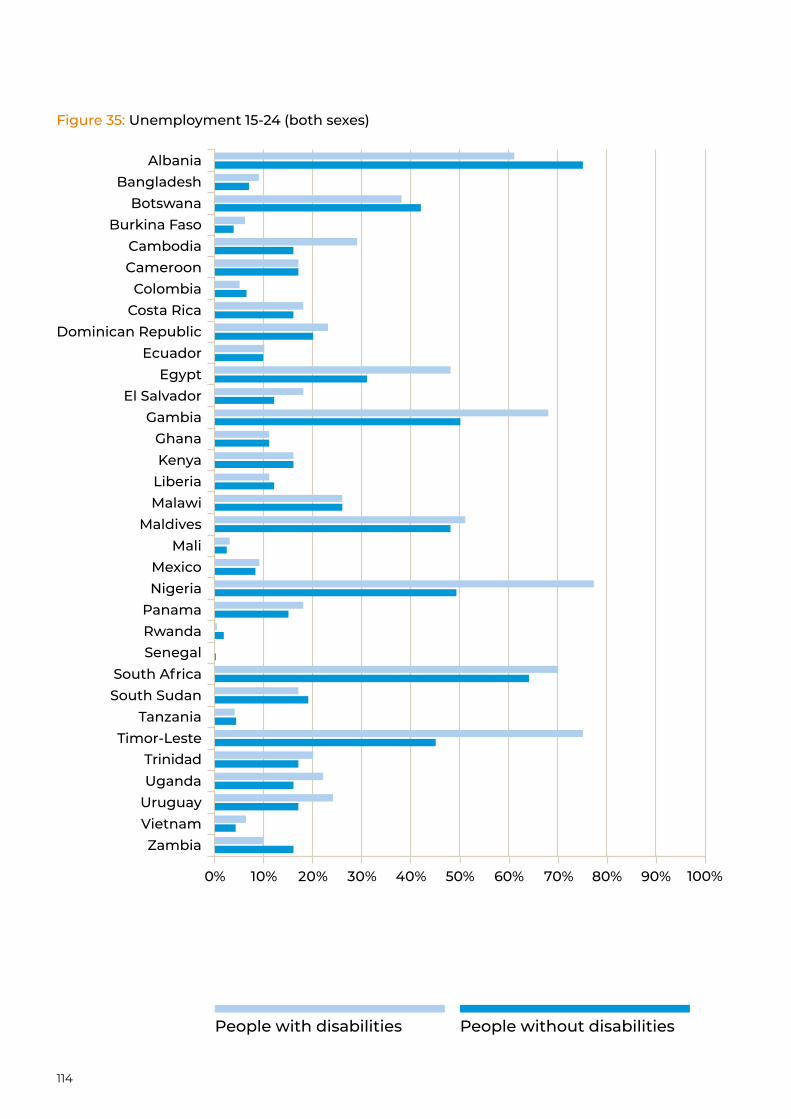
114
0% 10% 20% 30% 40% 50% 60% 70%
ZambiaVietnamUruguayUganda
Timor-LesteTanzania
South SudanSouth Africa
SenegalRwandaPanama
NigeriaMexico
MaliMaldives
MalawiLiberiaKenyaGhana
GambiaEl Salvador
EgyptEcuador
Dominican RepublicCosta RicaColombia
CameroonCambodia
Burkina FasoBotswana
BangladeshAlbania
80% 90% 100%
Trinidad
Figure 35: Unemployment 15-24 (both sexes)
People without disabilitiesPeople with disabilities
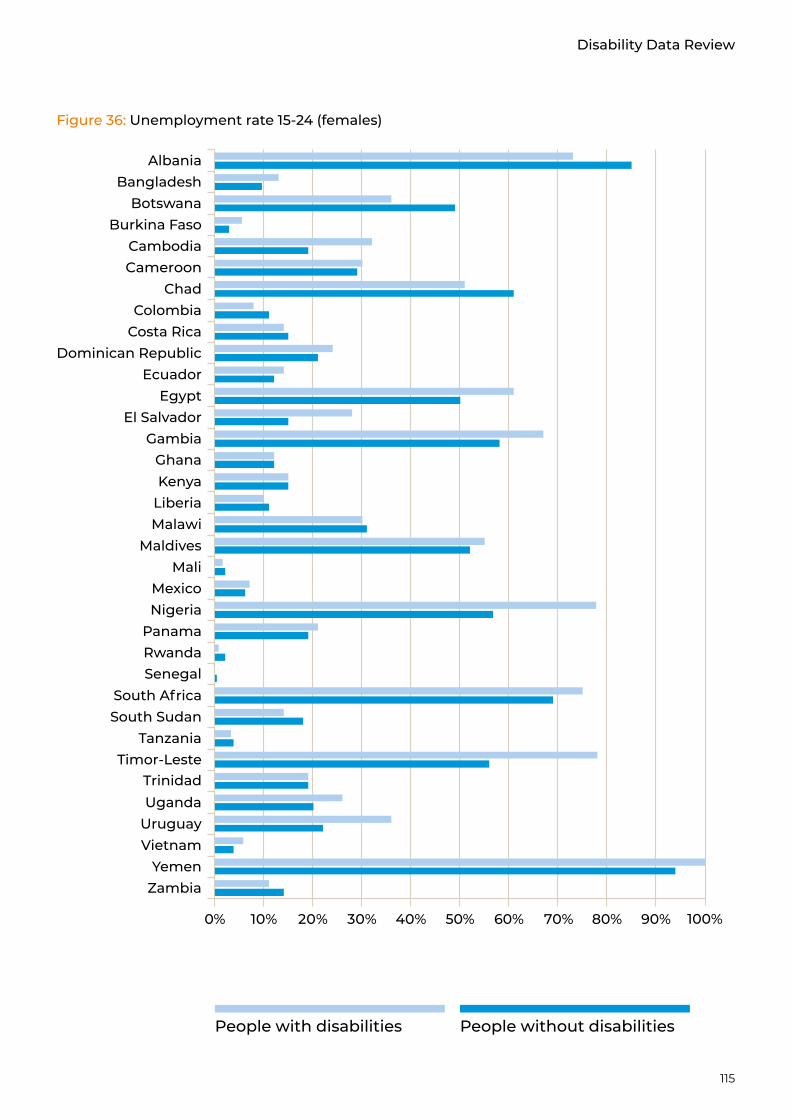
115
Disability Data Review
Figure 36: Unemployment rate 15-24 (females)
0% 10% 20% 30% 40% 50% 60% 70%
ZambiaYemen
VietnamUruguayUganda
Timor-LesteTanzania
South SudanSouth Africa
SenegalRwandaPanama
NigeriaMexico
MaliMaldives
MalawiLiberiaKenyaGhana
GambiaEl Salvador
EgyptEcuador
Dominican RepublicCosta RicaColombia
ChadCameroonCambodia
Burkina FasoBotswana
BangladeshAlbania
80% 90% 100%
Trinidad
People without disabilitiesPeople with disabilities

116
0% 10% 20% 30% 40% 50% 60% 70%
ZambiaVietnamUruguayUganda
Timor-LesteTanzania
South SudanSouth Africa
SenegalRwandaPanama
NigeriaMexico
MaliMaldives
MalawiLiberiaKenyaGhana
GambiaEl Salvador
EgyptEcuador
Dominican RepublicCosta RicaColombia
CameroonCambodia
Burkina FasoBotswana
BangladeshAlbania
80% 90% 100%
Trinidad
Figure 37: Unemployment 15-24 (males)
People without disabilitiesPeople with disabilities
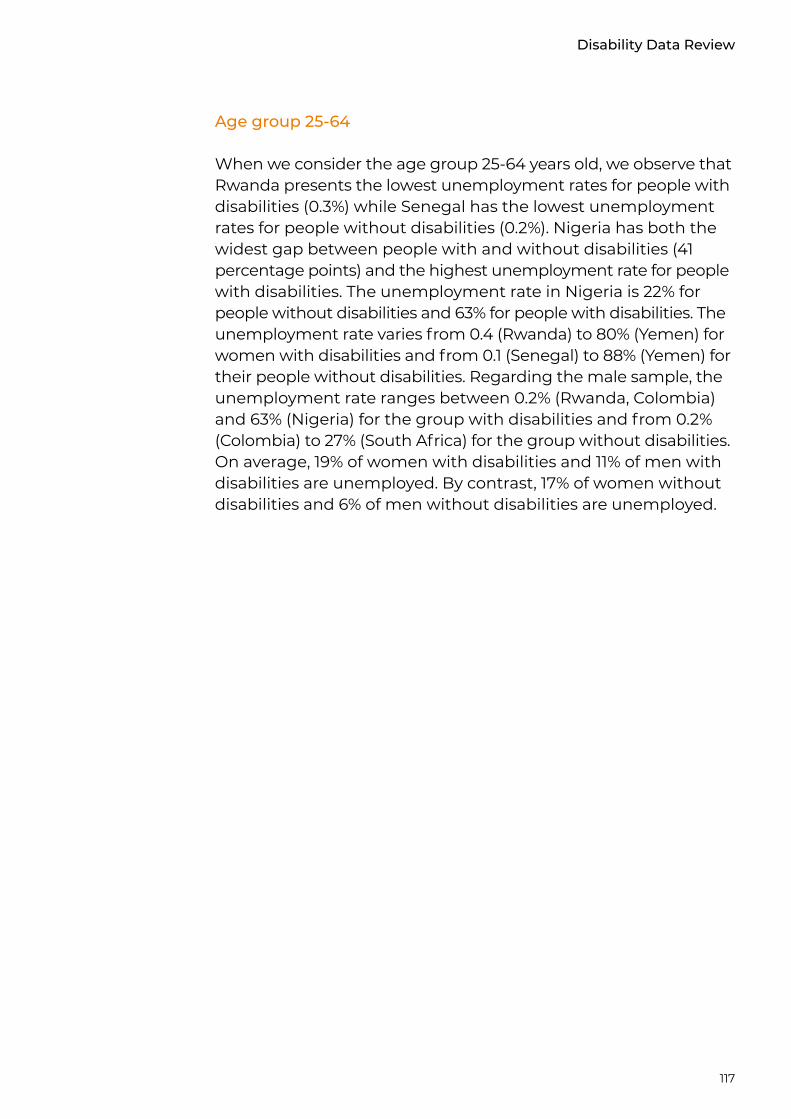
117
Disability Data Review
Age group 25-64
When we consider the age group 25-64 years old, we observe that Rwanda presents the lowest unemployment rates for people with disabilities (0.3%) while Senegal has the lowest unemployment rates for people without disabilities (0.2%). Nigeria has both the widest gap between people with and without disabilities (41 percentage points) and the highest unemployment rate for people with disabilities. The unemployment rate in Nigeria is 22% for people without disabilities and 63% for people with disabilities. The unemployment rate varies from 0.4 (Rwanda) to 80% (Yemen) for women with disabilities and from 0.1 (Senegal) to 88% (Yemen) for their people without disabilities. Regarding the male sample, the unemployment rate ranges between 0.2% (Rwanda, Colombia) and 63% (Nigeria) for the group with disabilities and from 0.2% (Colombia) to 27% (South Africa) for the group without disabilities. On average, 19% of women with disabilities and 11% of men with disabilities are unemployed. By contrast, 17% of women without disabilities and 6% of men without disabilities are unemployed.
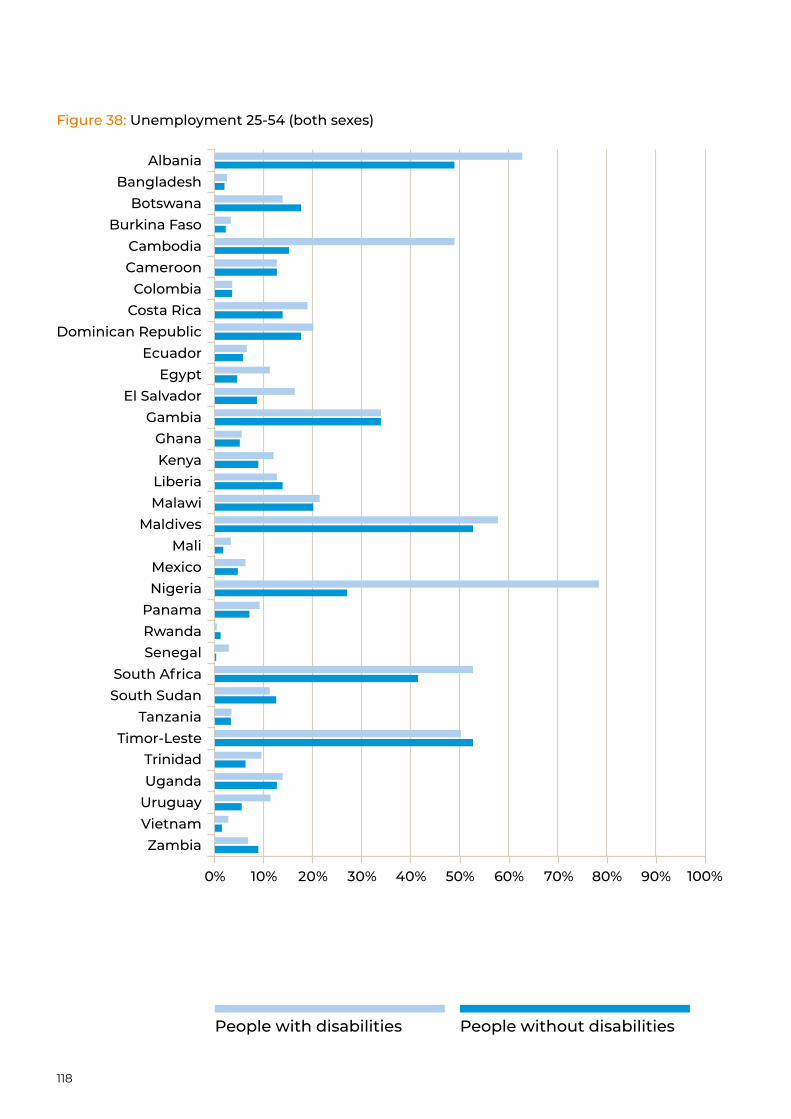
118
Figure 38: Unemployment 25-54 (both sexes)
0% 10% 20% 30% 40% 50% 60% 70%
ZambiaVietnamUruguayUganda
Timor-LesteTanzania
South SudanSouth Africa
SenegalRwandaPanama
NigeriaMexico
MaliMaldives
MalawiLiberiaKenyaGhana
GambiaEl Salvador
EgyptEcuador
Dominican RepublicCosta RicaColombia
CameroonCambodia
Burkina FasoBotswana
BangladeshAlbania
80% 90% 100%
Trinidad
People without disabilitiesPeople with disabilities
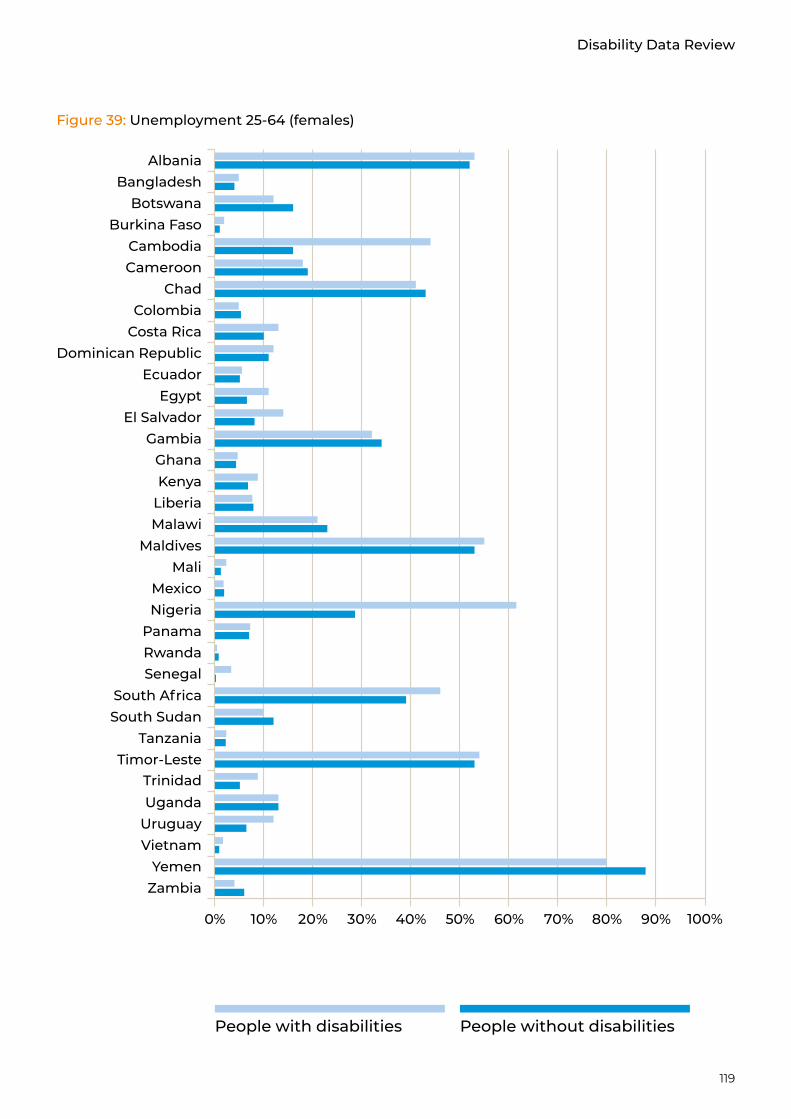
119
Disability Data Review
0% 10% 20% 30% 40% 50% 60% 70%
ZambiaYemen
VietnamUruguayUganda
Timor-LesteTanzania
South SudanSouth Africa
SenegalRwandaPanama
NigeriaMexico
MaliMaldives
MalawiLiberiaKenyaGhana
GambiaEl Salvador
EgyptEcuador
Dominican RepublicCosta RicaColombia
ChadCameroonCambodia
Burkina FasoBotswana
BangladeshAlbania
80% 90% 100%
Trinidad
Figure 39: Unemployment 25-64 (females)
People without disabilitiesPeople with disabilities
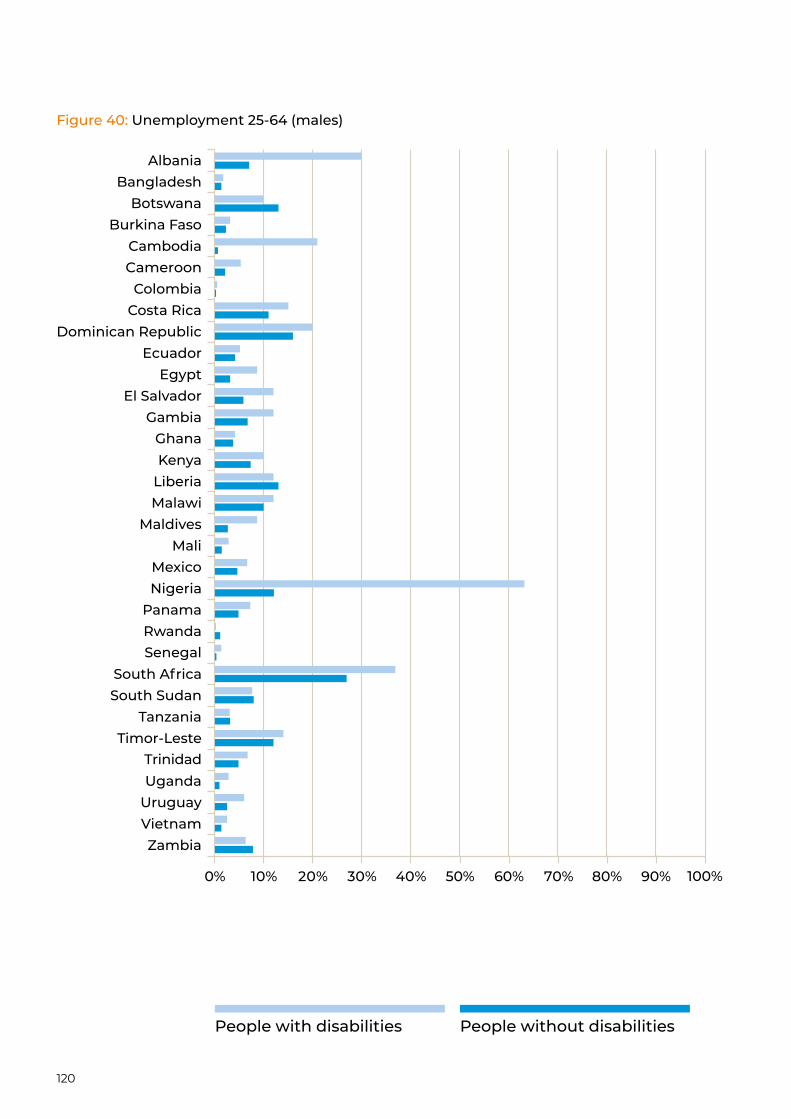
120
0% 10% 20% 30% 40% 50% 60% 70%
ZambiaVietnamUruguayUganda
Timor-LesteTanzania
South SudanSouth Africa
SenegalRwandaPanama
NigeriaMexico
MaliMaldives
MalawiLiberiaKenyaGhana
GambiaEl Salvador
EgyptEcuador
Dominican RepublicCosta RicaColombia
CameroonCambodia
Burkina FasoBotswana
BangladeshAlbania
80% 90% 100%
Trinidad
Figure 40: Unemployment 25-64 (males)
People without disabilitiesPeople with disabilities

121
Disability Data Review
Age group 16 and above
Using recent Labour Force Surveys, ILO estimated unemployment rates of individuals aged at least 16 years of age for a total of 10 countries out of the 40 targeted countries: Botswana, Cambodia, Cameroon, Costa Rica, Egypt, Gambia, Liberia, Myanmar, Rwanda and Senegal. Their statistics reveal the average unemployment rate among people without disabilities in these countries is 8%, while on average 9% of people with disabilities are unemployed. The unemployment rate of people with disabilities varies from 1.1% in Cambodia to 19.6% in Egypt. In the sample of people without disabilities, the unemployment rate ranges from 0.8% in Myanmar to 16.7% in Rwanda. A gap is observed in favour of people with disabilities in Botswana (16% and 11% for people with and without disabilities – a gap of five percentage points).
Figure 41: Unemployment 16+ (both sexes)
SenegalRwanda
MyanmarLiberia
GambiaEgypt
Costa RicaCameroonCambodiaBotswana
0% 5% 10% 15% 20% 25%
People without disabilitiesPeople with disabilities
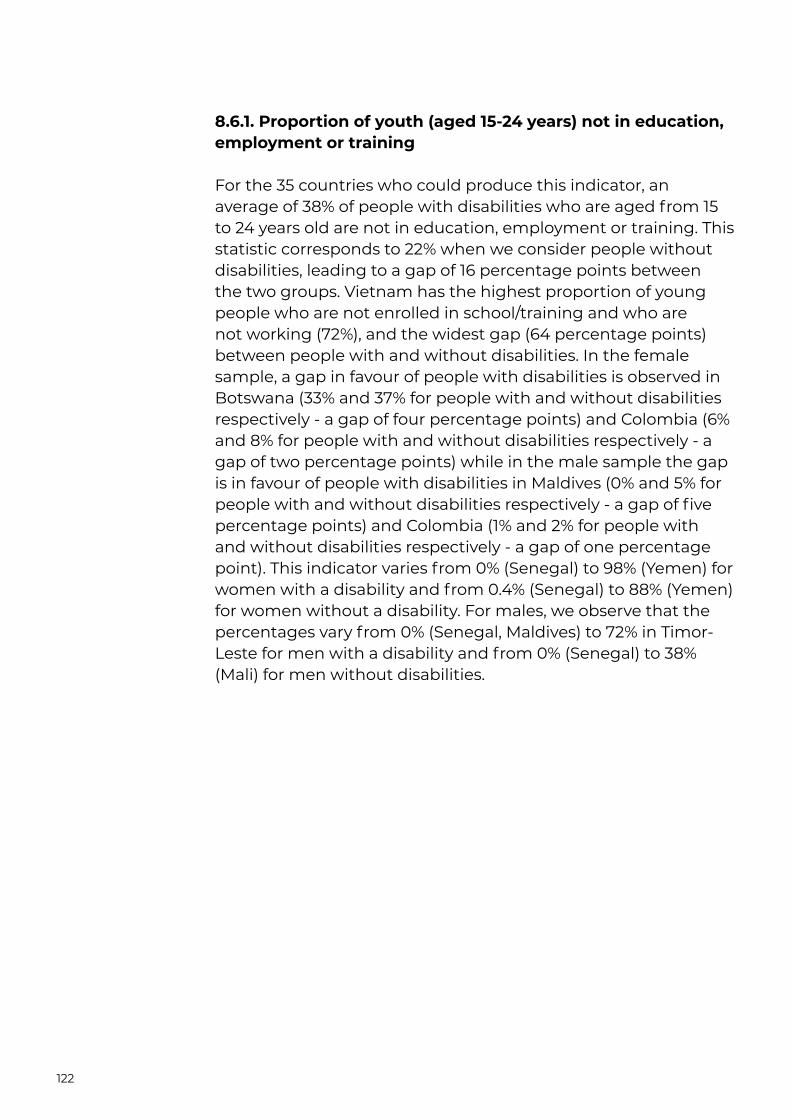
122
8.6.1. Proportion of youth (aged 15-24 years) not in education, employment or training
For the 35 countries who could produce this indicator, an average of 38% of people with disabilities who are aged from 15 to 24 years old are not in education, employment or training. This statistic corresponds to 22% when we consider people without disabilities, leading to a gap of 16 percentage points between the two groups. Vietnam has the highest proportion of young people who are not enrolled in school/training and who are not working (72%), and the widest gap (64 percentage points) between people with and without disabilities. In the female sample, a gap in favour of people with disabilities is observed in Botswana (33% and 37% for people with and without disabilities respectively - a gap of four percentage points) and Colombia (6% and 8% for people with and without disabilities respectively - a gap of two percentage points) while in the male sample the gap is in favour of people with disabilities in Maldives (0% and 5% for people with and without disabilities respectively - a gap of five percentage points) and Colombia (1% and 2% for people with and without disabilities respectively - a gap of one percentage point). This indicator varies from 0% (Senegal) to 98% (Yemen) for women with a disability and from 0.4% (Senegal) to 88% (Yemen) for women without a disability. For males, we observe that the percentages vary from 0% (Senegal, Maldives) to 72% in Timor-Leste for men with a disability and from 0% (Senegal) to 38% (Mali) for men without disabilities.
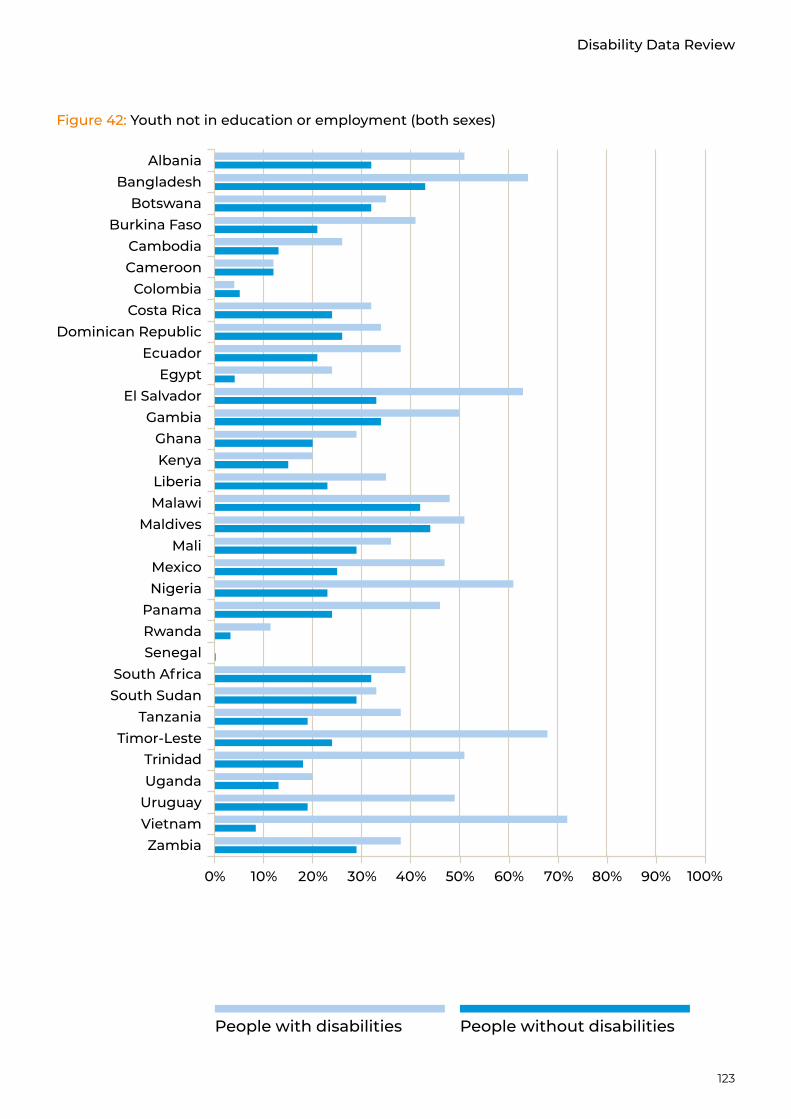
123
Disability Data Review
0% 10% 20% 30% 40% 50% 60% 70%
ZambiaVietnamUruguayUganda
Timor-LesteTanzania
South SudanSouth Africa
SenegalRwandaPanama
NigeriaMexico
MaliMaldives
MalawiLiberiaKenyaGhana
GambiaEl Salvador
EgyptEcuador
Dominican RepublicCosta RicaColombia
CameroonCambodia
Burkina FasoBotswana
BangladeshAlbania
80% 90% 100%
Trinidad
Figure 42: Youth not in education or employment (both sexes)
People without disabilitiesPeople with disabilities
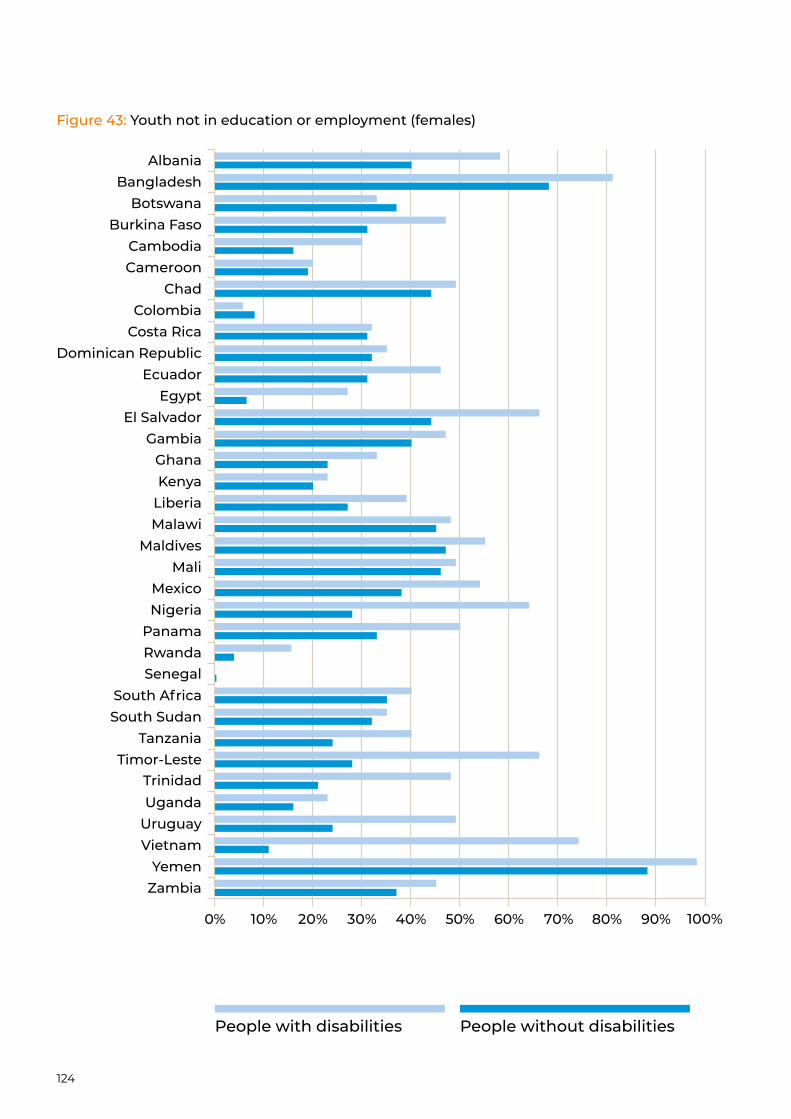
124
Figure 43: Youth not in education or employment (females)
0% 10% 20% 30% 40% 50% 60% 70%
ZambiaYemen
VietnamUruguayUganda
Timor-LesteTanzania
South SudanSouth Africa
SenegalRwandaPanama
NigeriaMexico
MaliMaldives
MalawiLiberiaKenyaGhana
GambiaEl Salvador
EgyptEcuador
Dominican RepublicCosta RicaColombia
ChadCameroonCambodia
Burkina FasoBotswana
BangladeshAlbania
80% 90% 100%
Trinidad
People without disabilitiesPeople with disabilities
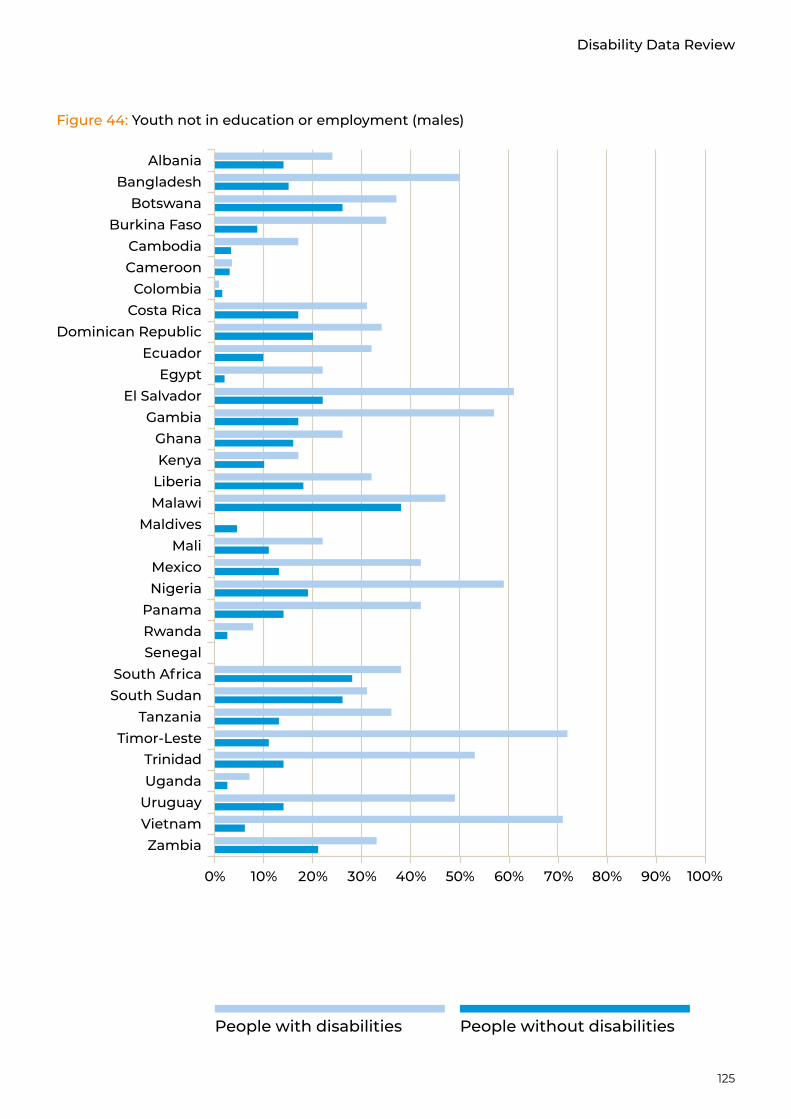
125
Disability Data Review
0% 10% 20% 30% 40% 50% 60% 70%
ZambiaVietnamUruguayUganda
Timor-LesteTanzania
South SudanSouth Africa
SenegalRwandaPanama
NigeriaMexico
MaliMaldives
MalawiLiberiaKenyaGhana
GambiaEl Salvador
EgyptEcuador
Dominican RepublicCosta RicaColombia
CameroonCambodia
Burkina FasoBotswana
BangladeshAlbania
80% 90% 100%
Trinidad
Figure 44: Youth not in education or employment (males)
People without disabilitiesPeople with disabilities

126
Relating to SDG target 8.3: 8.3.x Proportion of people employed who are in informal sectors
Out of 30 countries with data available for analysis, Egypt (7% for people with disabilities and 9% for people without disabilities) and Rwanda (95% for people with disabilities and 91% for people without disabilities) appear to be the countries with respectively the lowest and the highest proportion of people employed in informal sectors. Such a conclusion remains valid when data is disaggregated by gender. In the male sample, the proportion of people without disabilities in informal sectors varies from 10% in Egypt to 89% in Rwanda. Statistics show that the proportion of men with disabilities ranges from 7% in Egypt to 94% in Rwanda. Regarding the female sample, the proportion of people working in the informal sector is 3% in Egypt whatever the disability status, while the figures in Rwanda are 94% for people without disabilities and 96% for people with disabilities. On average a slightly lower proportion of people with disabilities (46%) than those without disabilities (48%) work in the informal sectors.
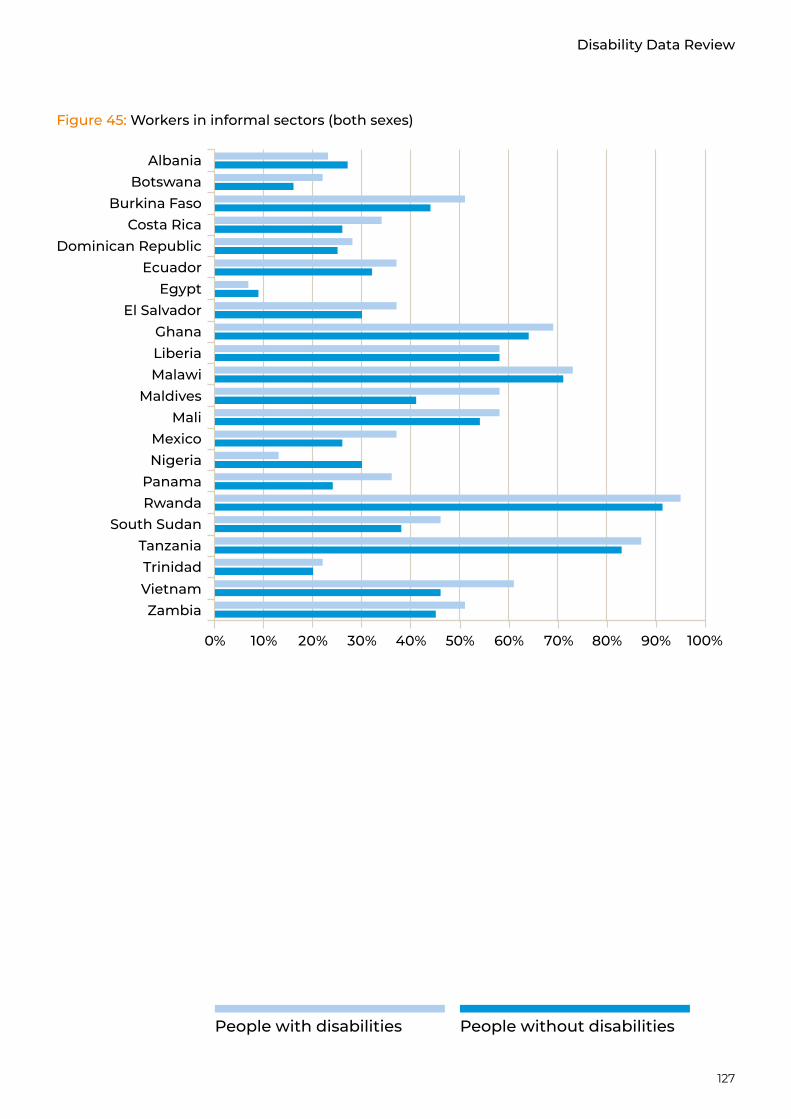
127
Disability Data Review
0% 10% 20% 30% 40% 50% 60% 70%
ZambiaVietnam
TanzaniaSouth Sudan
RwandaPanama
NigeriaMexico
MaliMaldives
MalawiLiberiaGhana
El SalvadorEgypt
EcuadorDominican Republic
Costa RicaBurkina Faso
BotswanaAlbania
80% 90% 100%
Trinidad
Figure 45: Workers in informal sectors (both sexes)
People without disabilitiesPeople with disabilities
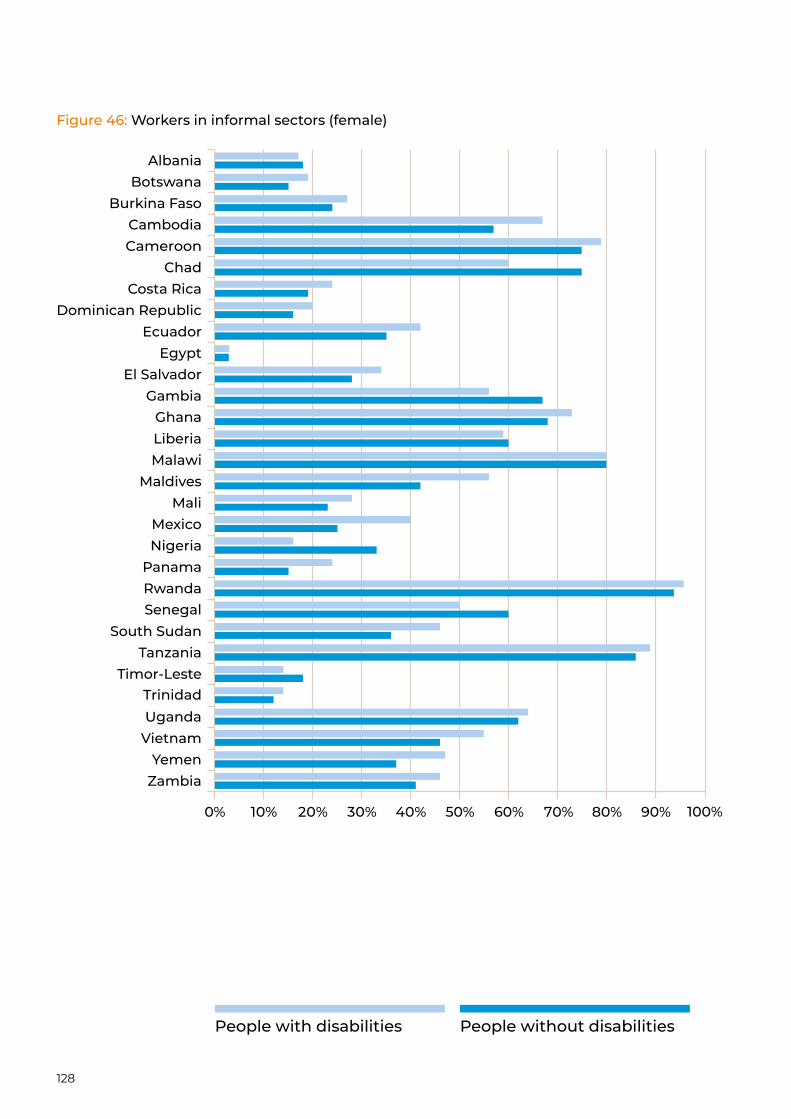
128
Figure 46: Workers in informal sectors (female)
0% 10% 20% 30% 40% 50% 60% 70%
ZambiaYemen
VietnamUganda
Timor-LesteTanzania
South SudanSenegalRwandaPanama
NigeriaMexico
MaliMaldives
MalawiLiberiaGhana
GambiaEl Salvador
EgyptEcuador
Dominican RepublicCosta Rica
ChadCameroonCambodia
Burkina FasoBotswana
Albania
80% 90% 100%
Trinidad
People without disabilitiesPeople with disabilities
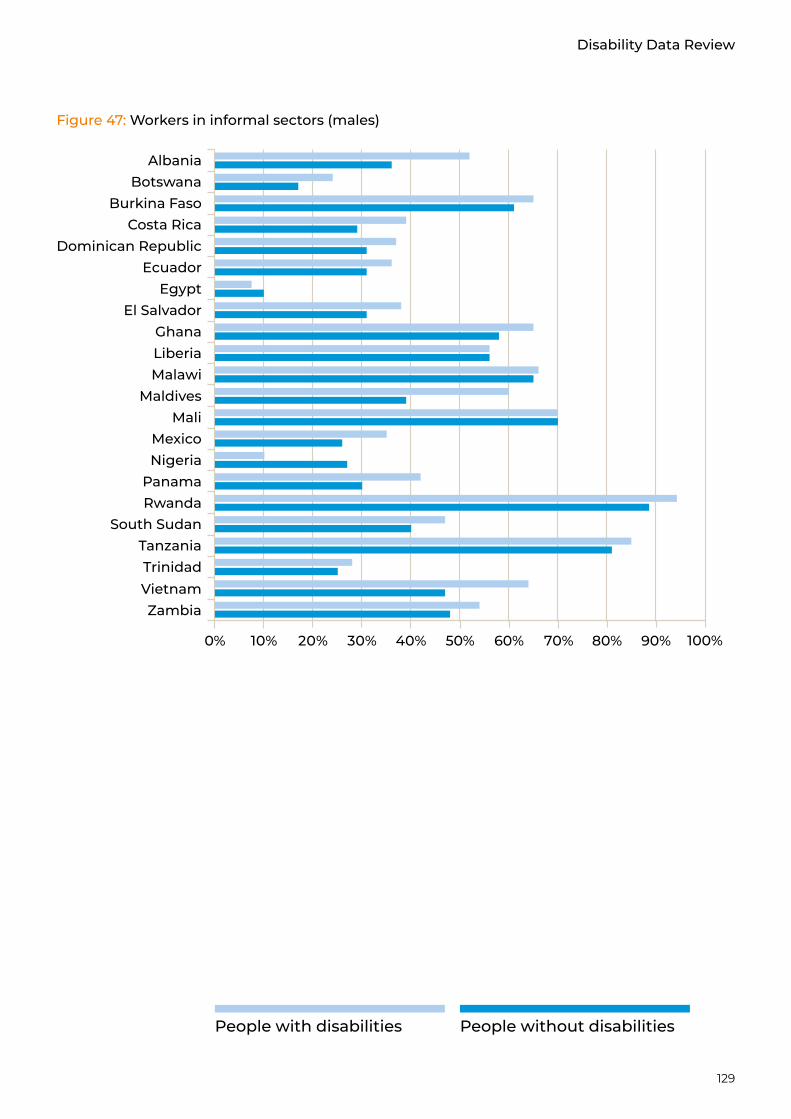
129
Disability Data Review
0% 10% 20% 30% 40% 50% 60% 70%
ZambiaVietnam
TanzaniaSouth Sudan
RwandaPanama
NigeriaMexico
MaliMaldives
MalawiLiberiaGhana
El SalvadorEgypt
EcuadorDominican Republic
Costa RicaBurkina Faso
BotswanaAlbania
80% 90% 100%
Trinidad
Figure 47: Workers in informal sectors (males)
People without disabilitiesPeople with disabilities
130
8.10.2. Proportion of adults (15 years and older) with an account at a bank or other financial institution or with a mobile-money-service provider
Information about bank account ownership is available for five countries. In Bangladesh the calculation shows that 2.8% and 3.1% of people with and without disabilities respectively own a bank account. These low rates may be explained by the definition adopted for this indicator in this country (see methodology above). Thus in order to avoid any misleading conclusion, in what follows we will only compare results from the four remaining countries.
Among both those with and without disabilities, fewer than 60% of individuals have a bank account. The proportion of people with a bank account varies from 12% (Nigeria) to 54% (Rwanda) for people with disabilities and from 16% to (Nigeria) to 51% (Rwanda) for people without disabilities. No gap is observed between people with and without disabilities in Timor-Leste (13% for both groups). A gender-based analysis reveals that on average, the proportion of males (22% and 19% of people without disabilities and those with disabilities respectively) with a bank account is higher than that of women (13% and 12% of people without disabilities and those with disabilities respectively). The percentage of women with a disability with a bank account varies from 4% (Nigeria) to 50% (Rwanda) while for women without disabilities these figures are 11% (Nigeria, Timor-Leste) and 42% (Rwanda) respectively. When we consider the male sample, we notice that Timor-Leste has the lowest proportion of men with a bank account (7%) while Rwanda has the highest (59% for men without disabilities and 58% for men with disabilities).

131
Disability Data Review
People without disabilitiesPeople with disabilities
Figure 48: Bank account ownership (both sexes)
UgandaTimor-Leste
RwandaNigeria
Bangladesh
0% 10% 20% 30% 40% 50% 60% 70% 80% 90% 100%
Figure 49: Bank account ownership (females)
UgandaTimor-Leste
RwandaNigeria
0% 10% 20% 30% 40% 50% 60% 70% 80% 90% 100%
Figure 50: Bank account ownership (males)
UgandaTimor-Leste
RwandaNigeria
0% 10% 20% 30% 40% 50% 60% 70% 80% 90% 100%
132
Thematic area 3: Technology and innovation
5.b.1. Proportion of individuals who own a mobile telephone, by sex
Individual level
The question about mobile phone ownership is asked to individuals in only five countries: Cambodia, Nigeria, Rwanda, Uganda and Timor-Leste. In Cambodia, only female respondents are asked this question. On average, 40% of people with disabilities possess a mobile phone. This figure corresponds to 51% for people with disabilities group, leading to an 11 percentage point gap. Rwanda has the lowest proportion of individuals with a mobile phone (18% and 34% for people with disabilities and people without disabilities respectively). When we consider the female sample, we observe that Cambodia ranks first (88% for women with disabilities and 92% for women without disabilities) while Rwanda ranks last (13% for women with disabilities and 27% for people without disabilities) in terms of mobile phone possession. Regarding the male sample, the percentage of men with a disability with a mobile phone varies from 25% (Rwanda) to 54% (Timor-Leste); these statistics correspond to 41% (Rwanda) and 76% (Timor-Leste) for men without disabilities.
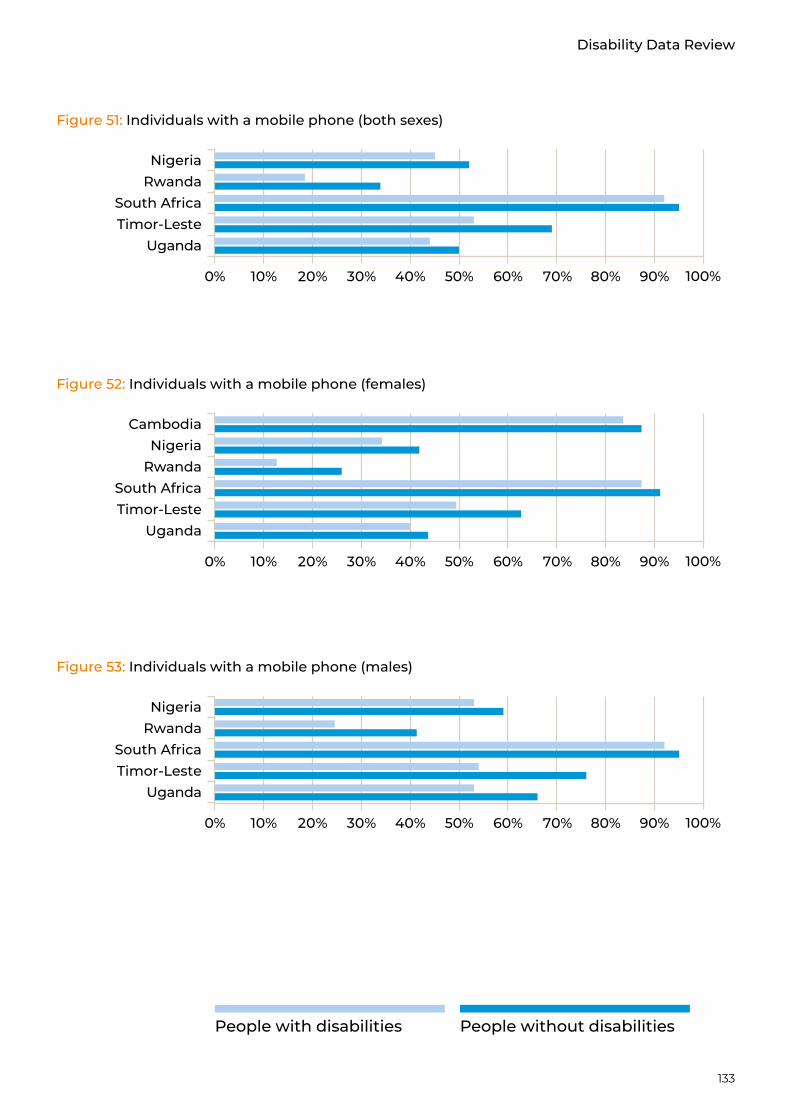
133
Disability Data Review
People without disabilitiesPeople with disabilities
Figure 51: Individuals with a mobile phone (both sexes)
UgandaTimor-LesteSouth Africa
RwandaNigeria
0% 10% 20% 30% 40% 50% 60% 70% 80% 90% 100%
Figure 52: Individuals with a mobile phone (females)
Figure 53: Individuals with a mobile phone (males)
UgandaTimor-LesteSouth Africa
RwandaNigeria
Cambodia
0% 10% 20% 30% 40% 50% 60% 70% 80% 90% 100%
UgandaTimor-LesteSouth Africa
RwandaNigeria
0% 10% 20% 30% 40% 50% 60% 70% 80% 90% 100%

134
Household level
When we consider the indicator for the 11 countries with data at the household level, we observe that on average 76% of the households with at least one person with disability possess a mobile phone while 84% of households without people with disabilities have a mobile phone. The gap between households with and without people with disabilities varies from 0% in Gambia (91% in both groups) to 11% in Timor-Leste (74% and 85% for people with and without disabilities respectively). The lowest proportions of households with a mobile phone are observed in Chad (50% for households with at least one person people with disabilities and 60% for those without people with disabilities) while the highest is observed in Maldives (96% for households with at least one person with disabilities and 98% for those without people with disabilities).
Figure 54: Households with a mobile phone (both sexes)
ZimbabweYemen
UgandaTimor-Leste
St LuciaSenegal
MaldivesGambia
ColombiaChad
CameroonCambodia
Albania
0% 10% 20% 30% 40% 50% 60% 70% 80% 90% 100%
Households with people without disabilities
Households with people with disabilities
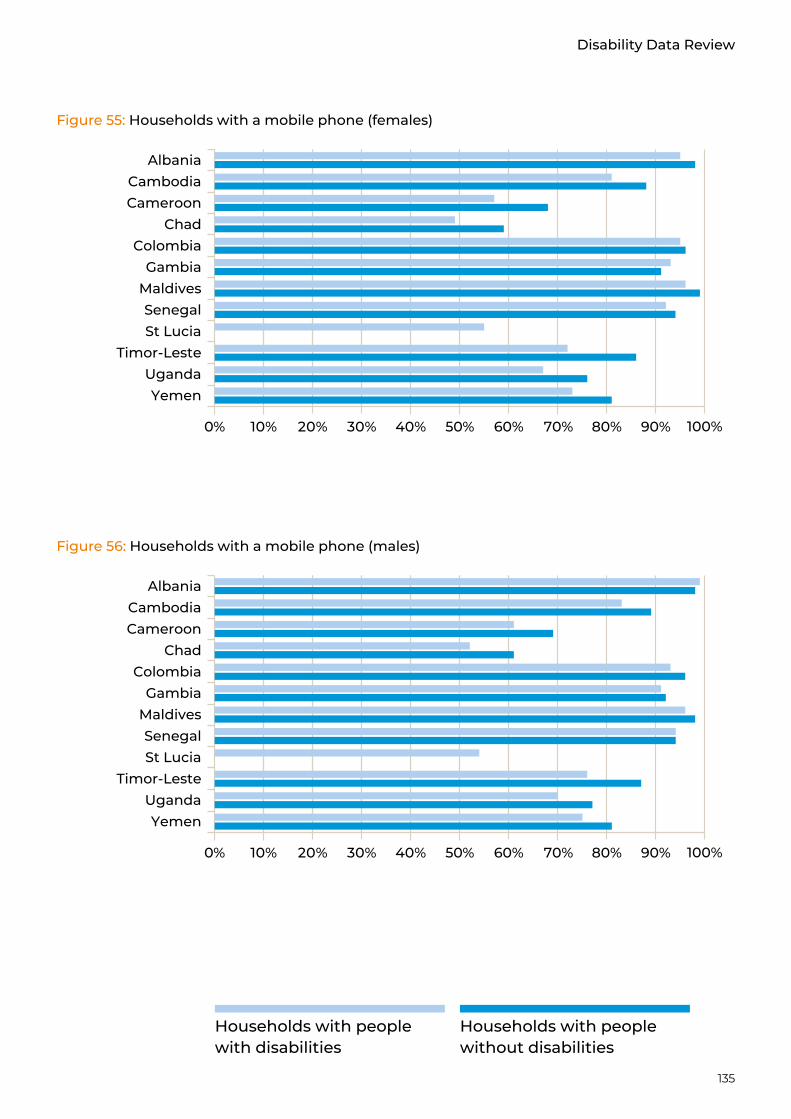
135
Disability Data Review
Households with people without disabilities
Households with people with disabilities
YemenUganda
Timor-LesteSt LuciaSenegal
MaldivesGambia
ColombiaChad
CameroonCambodia
Albania
0% 10% 20% 30% 40% 50% 60% 70% 80% 90% 100%
YemenUganda
Timor-LesteSt LuciaSenegal
MaldivesGambia
ColombiaChad
CameroonCambodia
Albania
0% 10% 20% 30% 40% 50% 60% 70% 80% 90% 100%
Figure 55: Households with a mobile phone (females)
Figure 56: Households with a mobile phone (males)
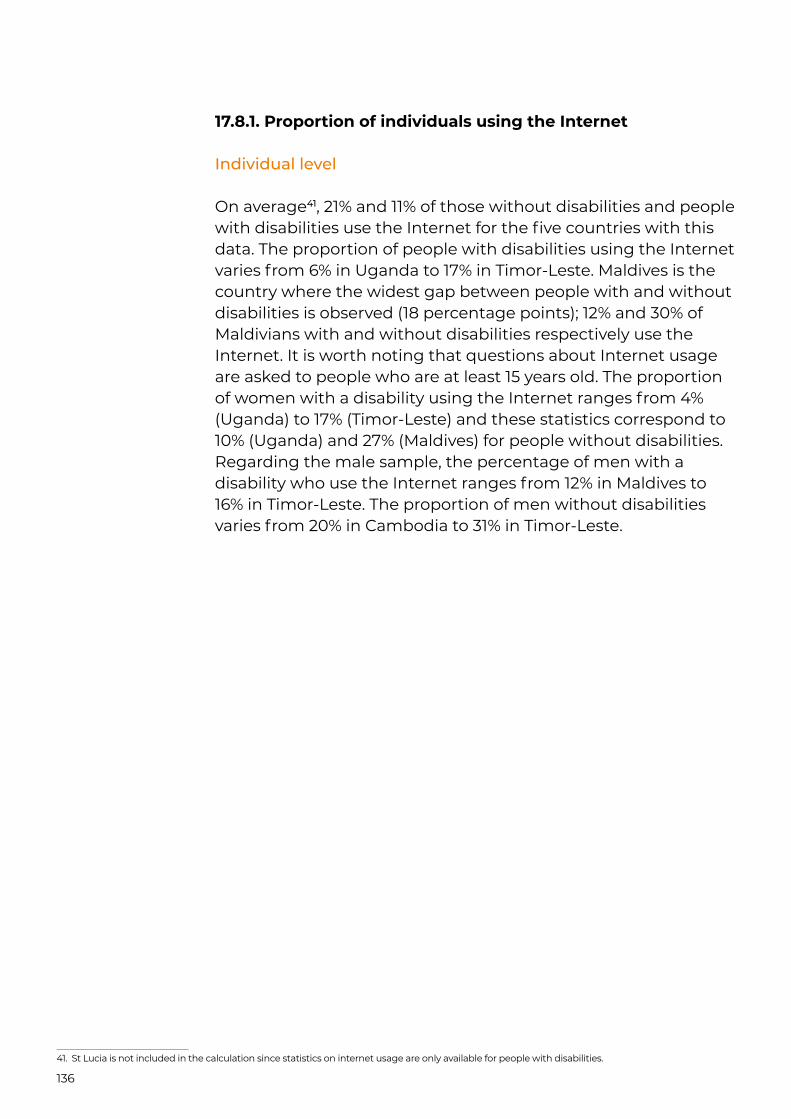
136
17.8.1. Proportion of individuals using the Internet
Individual level
On average41, 21% and 11% of those without disabilities and people with disabilities use the Internet for the five countries with this data. The proportion of people with disabilities using the Internet varies from 6% in Uganda to 17% in Timor-Leste. Maldives is the country where the widest gap between people with and without disabilities is observed (18 percentage points); 12% and 30% of Maldivians with and without disabilities respectively use the Internet. It is worth noting that questions about Internet usage are asked to people who are at least 15 years old. The proportion of women with a disability using the Internet ranges from 4% (Uganda) to 17% (Timor-Leste) and these statistics correspond to 10% (Uganda) and 27% (Maldives) for people without disabilities. Regarding the male sample, the percentage of men with a disability who use the Internet ranges from 12% in Maldives to 16% in Timor-Leste. The proportion of men without disabilities varies from 20% in Cambodia to 31% in Timor-Leste.
41. St Lucia is not included in the calculation since statistics on internet usage are only available for people with disabilities.
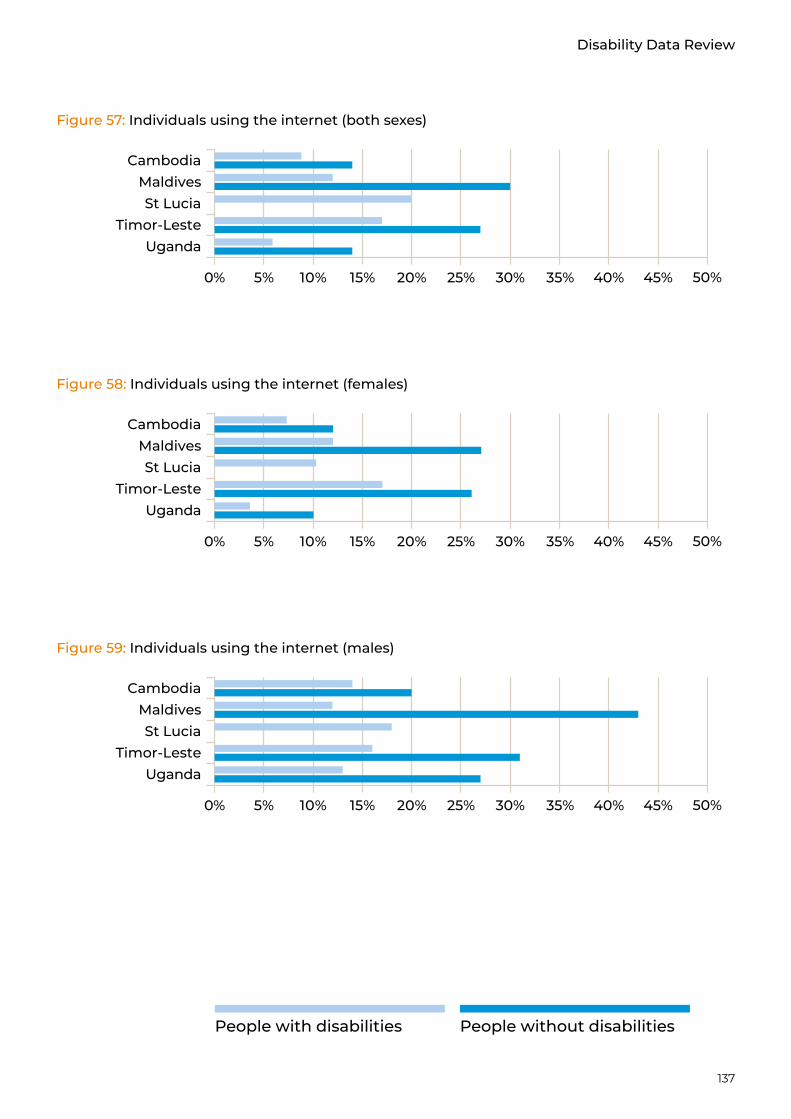
137
Disability Data Review
People without disabilitiesPeople with disabilities
Figure 57: Individuals using the internet (both sexes)
UgandaTimor-Leste
St LuciaMaldives
Cambodia
0% 5% 10% 15% 20% 25% 30% 35% 40% 45% 50%
Figure 58: Individuals using the internet (females)
UgandaTimor-Leste
St LuciaMaldives
Cambodia
0% 5% 10% 15% 20% 25% 30% 35% 40% 45% 50%
Figure 59: Individuals using the internet (males)
UgandaTimor-Leste
St LuciaMaldives
Cambodia
0% 5% 10% 15% 20% 25% 30% 35% 40% 45% 50%
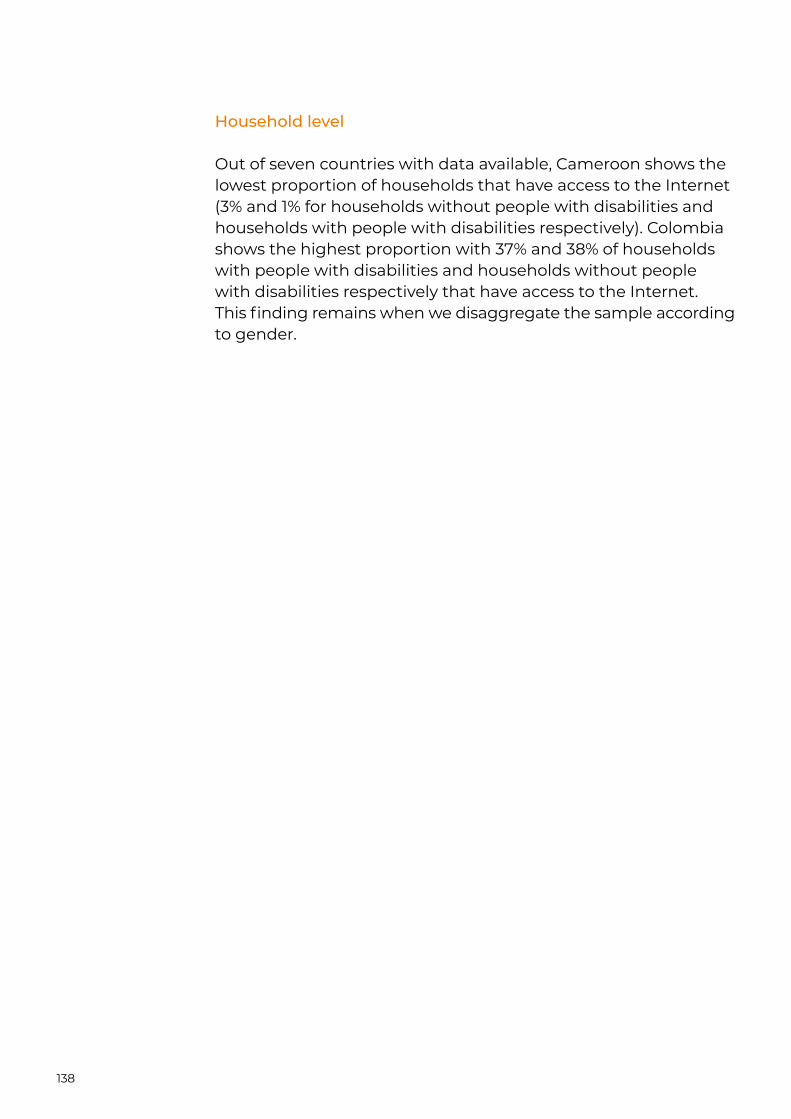
138
Household level
Out of seven countries with data available, Cameroon shows the lowest proportion of households that have access to the Internet (3% and 1% for households without people with disabilities and households with people with disabilities respectively). Colombia shows the highest proportion with 37% and 38% of households with people with disabilities and households without people with disabilities respectively that have access to the Internet. This finding remains when we disaggregate the sample according to gender.
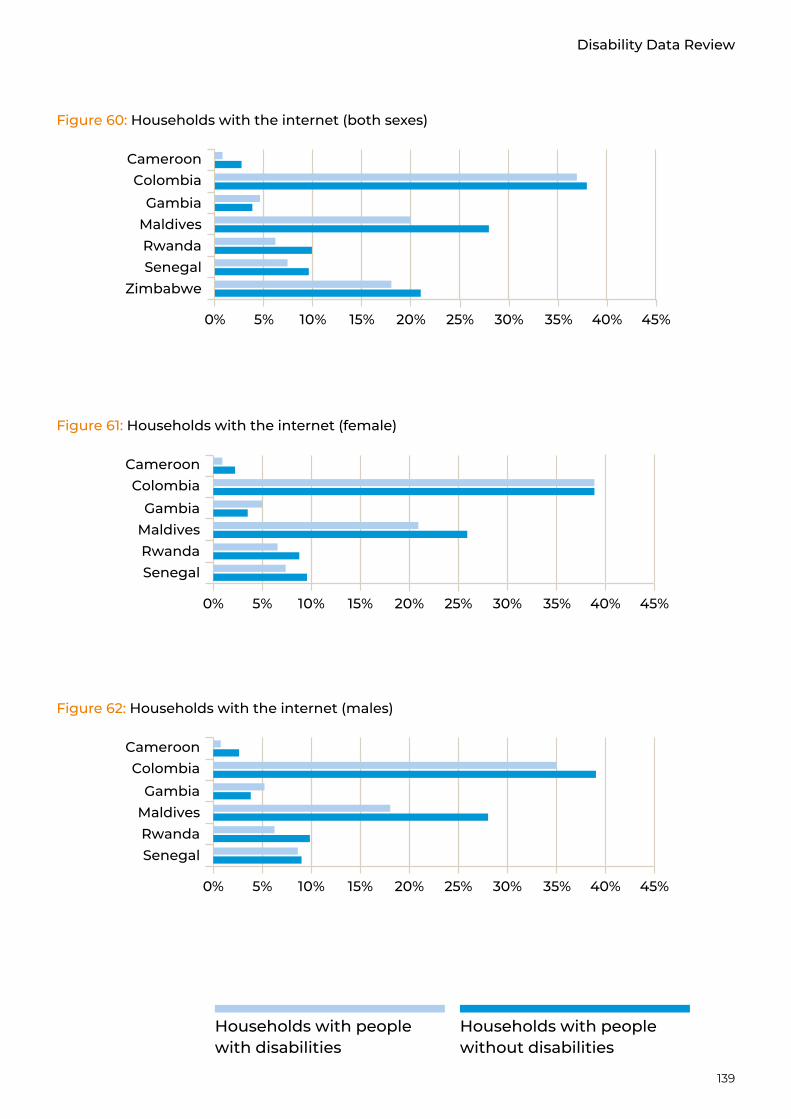
139
Disability Data Review
Households with people without disabilities
Households with people with disabilities
Figure 60: Households with the internet (both sexes)
ZimbabweSenegalRwandaMaldivesGambia
Colombia
0% 5% 10% 15% 20% 25% 30% 35% 40% 45%
Cameroon
SenegalRwandaMaldivesGambia
Colombia
0% 5% 10% 15% 20% 25% 30% 35% 40% 45%
Cameroon
Figure 61: Households with the internet (female)
SenegalRwandaMaldivesGambia
Colombia
0% 5% 10% 15% 20% 25% 30% 35% 40% 45%
Cameroon
Figure 62: Households with the internet (males)
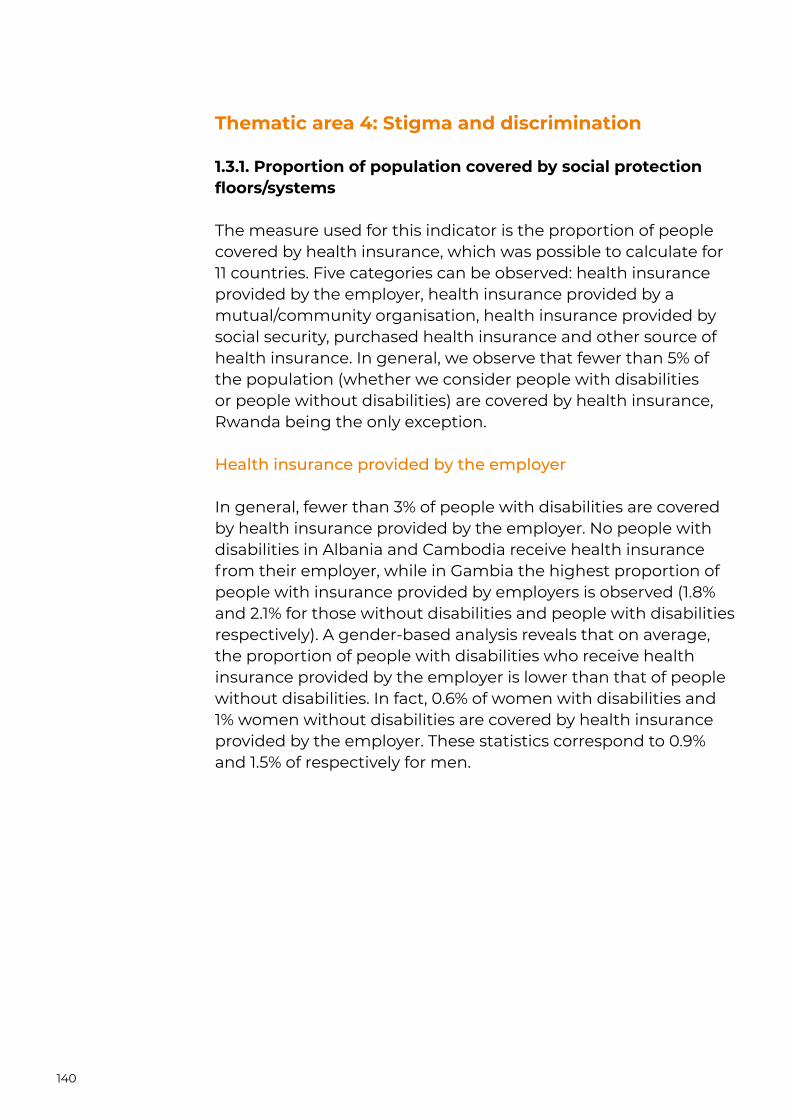
140
Thematic area 4: Stigma and discrimination
1.3.1. Proportion of population covered by social protection floors/systems
The measure used for this indicator is the proportion of people covered by health insurance, which was possible to calculate for 11 countries. Five categories can be observed: health insurance provided by the employer, health insurance provided by a mutual/community organisation, health insurance provided by social security, purchased health insurance and other source of health insurance. In general, we observe that fewer than 5% of the population (whether we consider people with disabilities or people without disabilities) are covered by health insurance, Rwanda being the only exception.
Health insurance provided by the employer
In general, fewer than 3% of people with disabilities are covered by health insurance provided by the employer. No people with disabilities in Albania and Cambodia receive health insurance from their employer, while in Gambia the highest proportion of people with insurance provided by employers is observed (1.8% and 2.1% for those without disabilities and people with disabilities respectively). A gender-based analysis reveals that on average, the proportion of people with disabilities who receive health insurance provided by the employer is lower than that of people without disabilities. In fact, 0.6% of women with disabilities and 1% women without disabilities are covered by health insurance provided by the employer. These statistics correspond to 0.9% and 1.5% of respectively for men.
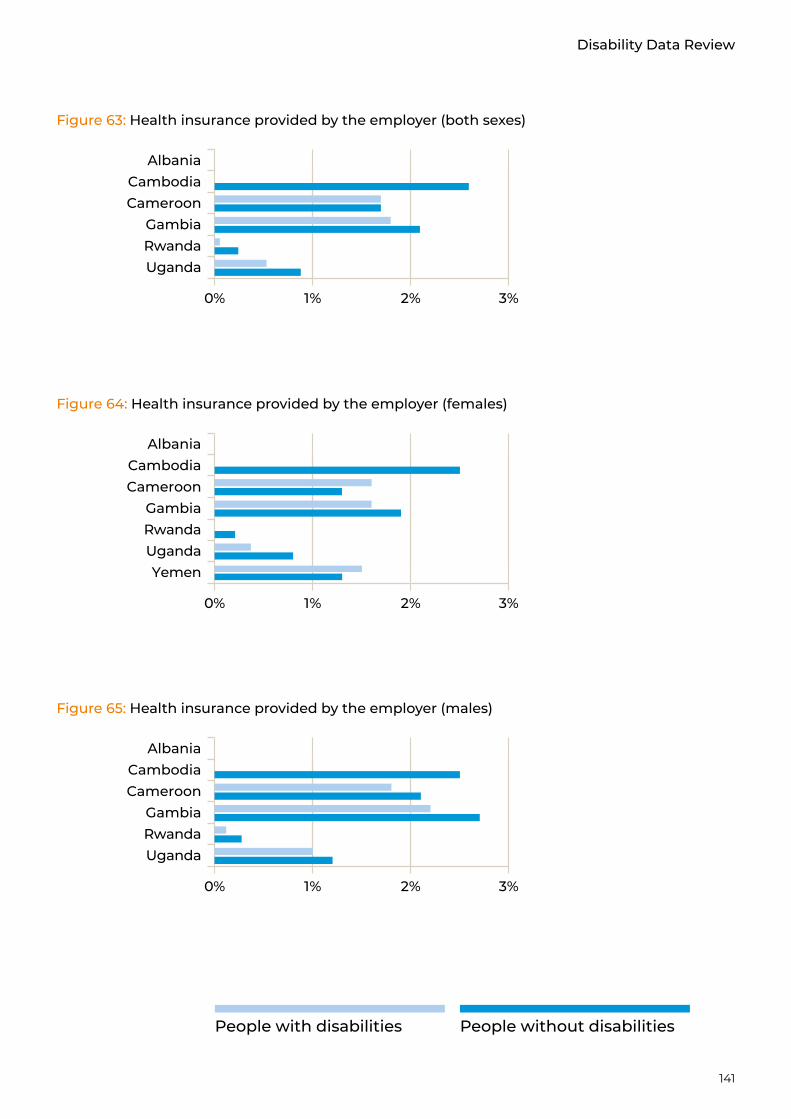
141
Disability Data Review
People without disabilitiesPeople with disabilities
Figure 63: Health insurance provided by the employer (both sexes)
RwandaUganda
CameroonCambodia
0% 1% 2% 3%
Gambia
Albania
Figure 64: Health insurance provided by the employer (females)
RwandaUganda
CameroonCambodia
0% 1% 2% 3%
Gambia
Albania
Yemen
Figure 65: Health insurance provided by the employer (males)
RwandaUganda
CameroonCambodia
0% 1% 2% 3%
Gambia
Albania
142
Health insurance provided by a mutual/community organisation
Rwanda is the only country with a coverage rate exceeding 50%. Moreover, the proportion of people with disabilities (71%) covered by health insurance provided by a mutual organisation is higher than that of the population of people without disabilities (67%). In Yemen and Chad, information about health insurance is only provided for women. The proportion of women with disabilities covered by this type of insurance varies from 0% (Chad, Cambodia) to 71% (Rwanda). These statistics correspond to 0% (Chad) and 67% (Rwanda) for women without disabilities. In the male sample, the lowest proportions are observed in Uganda for men without a disability (0.4%) and in Cambodia for men with a disability (0%).
143
Disability Data Review
People without disabilitiesPeople with disabilities
Figure 66: Health insurance provided by mutual/community organisation (both sexes)
UgandaRwanda
CameroonCambodia
0% 10% 20% 30% 40% 50% 60% 70% 80% 90% 100%
Figure 67: Health insurance provided by mutual/community organisation (females)
YemenUgandaRwanda
CameroonCambodia
0% 10% 20% 30% 40% 50% 60% 70% 80% 90% 100%
Figure 68: Health insurance provided by mutual/community organisation (males)
UgandaRwanda
CameroonCambodia
0% 10% 20% 30% 40% 50% 60% 70% 80% 90% 100%
144
Health insurance provided by social security
In Cambodia, the percentage of people with disabilities (22%) covered by social security is twice the proportion observed among people without disabilities (11%). In Nigeria or Rwanda, 1% of people with disabilities are covered by a health insurance provided by the social security. Albania has the highest proportion of men covered by health insurance provided by social security (36 and 23% for men without and men with disabilities respectively). Regarding the female sample, the proportion of those covered ranges from 0% (Cameroon, Rwanda, Uganda) to 27% (Cambodia) for women with disabilities and from 0% (Uganda, Chad) to 17% (Albania) for women without disabilities. Statistics show that on average, in the group of people with disabilities, 6% of women and 11% of men are covered by social security. In the group of people without disabilities, 4% of women and 7% of men are covered by social security.

145
Disability Data Review
People without disabilitiesPeople with disabilities
Figure 69: Health insurance provided by social security (both sexes)
UgandaRwandaNIgeria
CameroonCambodia
0% 5% 10% 15% 20% 25% 30% 35% 40%
Albania
Figure 70: Health insurance provided by social security (females)
YemenUgandaRwandaNigeria
CameroonCambodia
0% 5% 10% 15% 20% 25% 30% 35% 40% 45%
Albania
Figure 71: Health insurance provided by social security (males)
UgandaRwandaNIgeria
CameroonCambodia
0% 5% 10% 15% 20% 25% 30% 35% 40%
Albania
146
Purchased health insurance
Out of five countries, Cambodia is the one country where no people with disabilities are covered by purchased health insurance. Albania presents the highest proportion of people covered by purchased health insurance (2.1% for people without disabilities and 1.2% for people with disabilities). On average, the proportion of women with disabilities covered by a purchased health insurance is 0.3% while that of women without disabilities is 0.5%. These statistics correspond to 0.2% and 0.6% in the male sample.
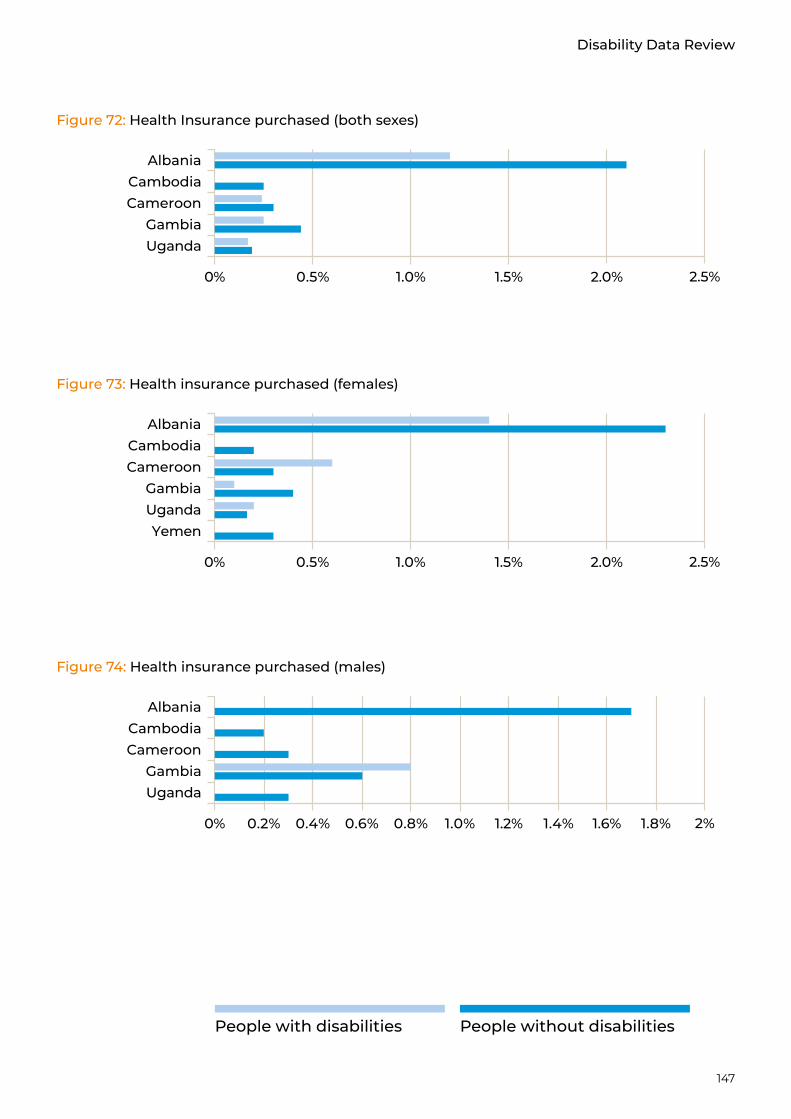
147
Disability Data Review
People without disabilitiesPeople with disabilities
Figure 72: Health Insurance purchased (both sexes)
UgandaGambia
CameroonCambodia
Albania
0% 0.5% 1.0% 1.5% 2.0% 2.5%
Figure 73: Health insurance purchased (females)
UgandaYemen
CameroonCambodia
0% 0.5% 1.0% 1.5% 2.0% 2.5%
Gambia
Albania
Figure 74: Health insurance purchased (males)
UgandaGambia
CameroonCambodia
Albania
0% 0.2% 0.4% 0.6% 0.8% 1.0% 1.2% 1.4% 1.6% 1.8% 2%
148
Other types of health insurance
Regardless of gender, Albania presents the highest coverage rates (2.2% and 3.8% for women without and with disabilities respectively; 4.4% and 4.3% for men without and with disabilities respectively). The proportion of Ugandans covered by “other types of insurance” is 0% regardless of the disability status or the gender.
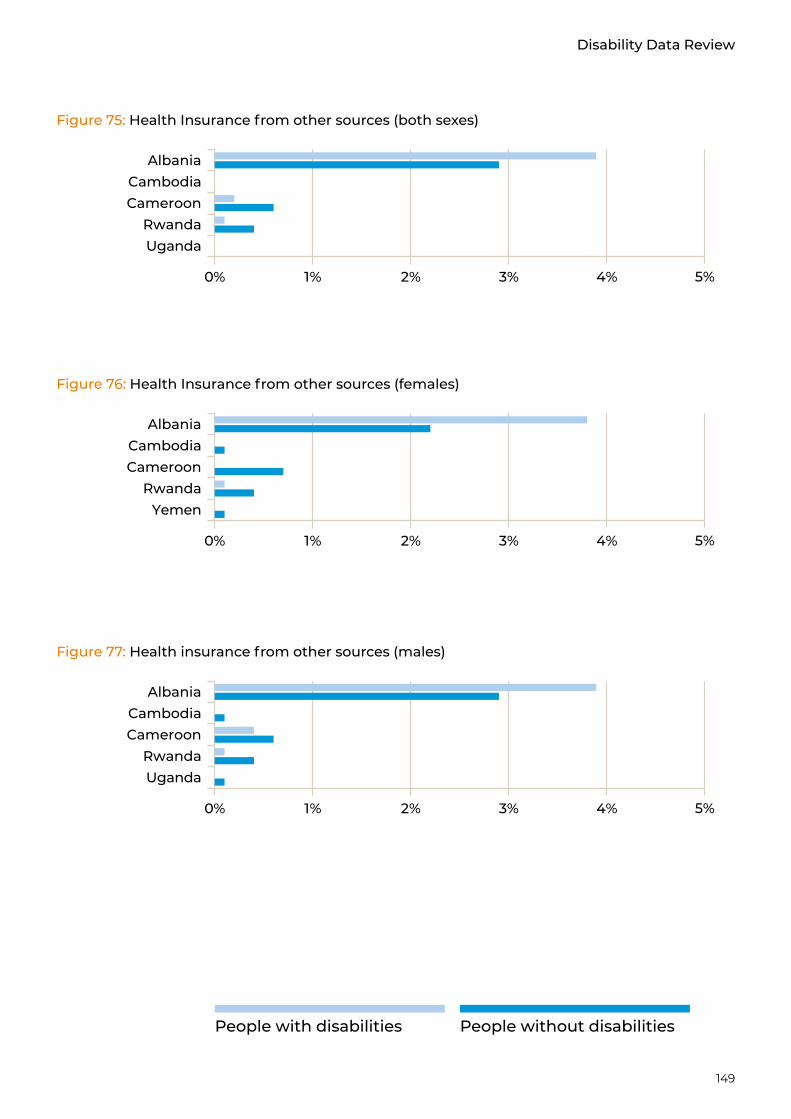
149
Disability Data Review
People without disabilitiesPeople with disabilities
Figure 75: Health Insurance from other sources (both sexes)
UgandaRwanda
CameroonCambodia
Albania
0% 1% 2% 3% 4% 5%
Figure 76: Health Insurance from other sources (females)
YemenRwanda
CameroonCambodia
Albania
0% 1% 2% 3% 4% 5%
Figure 77: Health insurance from other sources (males)
UgandaRwanda
CameroonCambodia
Albania
0% 1% 2% 3% 4% 5%
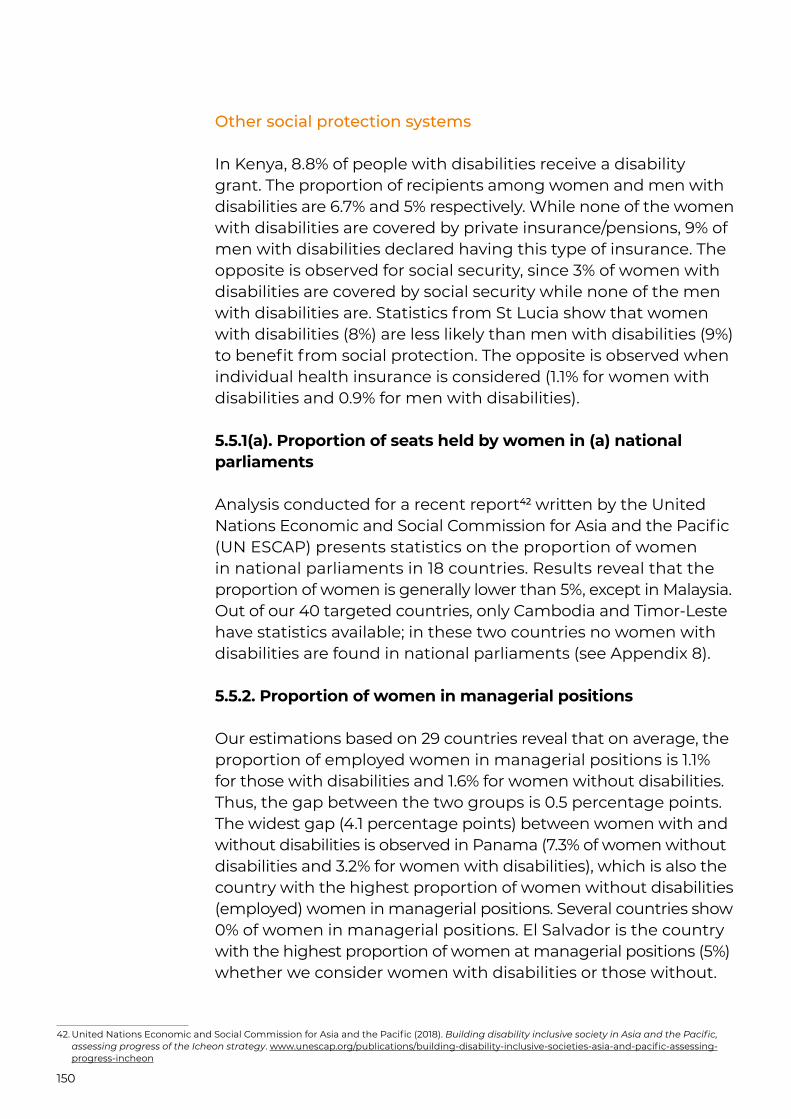
150
Other social protection systems
In Kenya, 8.8% of people with disabilities receive a disability grant. The proportion of recipients among women and men with disabilities are 6.7% and 5% respectively. While none of the women with disabilities are covered by private insurance/pensions, 9% of men with disabilities declared having this type of insurance. The opposite is observed for social security, since 3% of women with disabilities are covered by social security while none of the men with disabilities are. Statistics from St Lucia show that women with disabilities (8%) are less likely than men with disabilities (9%) to benefit from social protection. The opposite is observed when individual health insurance is considered (1.1% for women with disabilities and 0.9% for men with disabilities).
5.5.1(a). Proportion of seats held by women in (a) national parliaments
Analysis conducted for a recent report42 written by the United Nations Economic and Social Commission for Asia and the Pacific (UN ESCAP) presents statistics on the proportion of women in national parliaments in 18 countries. Results reveal that the proportion of women is generally lower than 5%, except in Malaysia. Out of our 40 targeted countries, only Cambodia and Timor-Leste have statistics available; in these two countries no women with disabilities are found in national parliaments (see Appendix 8).
5.5.2. Proportion of women in managerial positions
Our estimations based on 29 countries reveal that on average, the proportion of employed women in managerial positions is 1.1% for those with disabilities and 1.6% for women without disabilities. Thus, the gap between the two groups is 0.5 percentage points. The widest gap (4.1 percentage points) between women with and without disabilities is observed in Panama (7.3% of women without disabilities and 3.2% for women with disabilities), which is also the country with the highest proportion of women without disabilities (employed) women in managerial positions. Several countries show 0% of women in managerial positions. El Salvador is the country with the highest proportion of women at managerial positions (5%) whether we consider women with disabilities or those without.
42. United Nations Economic and Social Commission for Asia and the Pacific (2018). Building disability inclusive society in Asia and the Pacific, assessing progress of the Icheon strategy. www.unescap.org/publications/building-disability-inclusive-societies-asia-and-pacific-assessing-progress-incheon

151
Disability Data Review
People without disabilitiesPeople with disabilities
Figure 78: People in managerial positions (both sexes)
VietnamUganda
Timor-LesteTanzania
South SudanSenegalRwandaPanama
NigeriaMexico
MaliMaldives
MalawiLiberiaGhana
GambiaEl Salvador
EgyptEcuador
Dominican RepublicCosta Rica
ColombiaCameroonCambodiaBotswana
Albania
0% 1% 2% 3% 4% 5% 6% 7%
Zambia
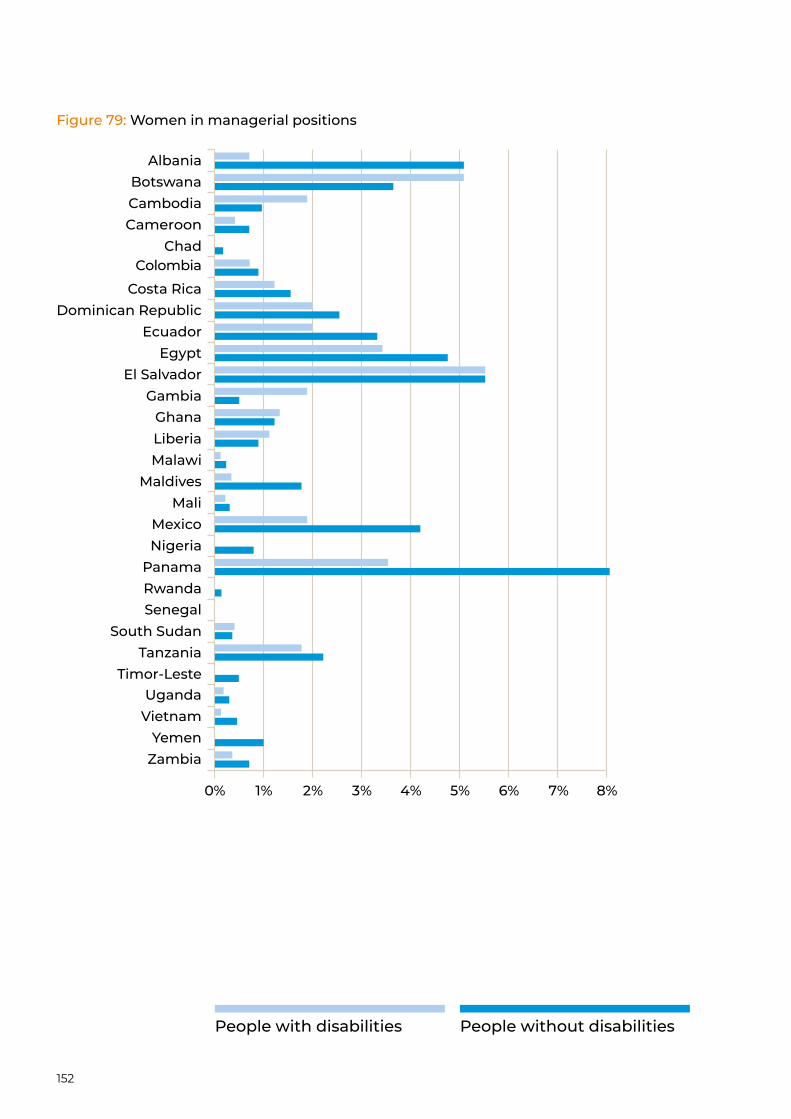
152
People without disabilitiesPeople with disabilities
Figure 79: Women in managerial positions
0% 1% 2% 3% 4% 5% 6% 7%
ZambiaYemen
VietnamUganda
Timor-LesteTanzania
South SudanSenegalRwandaPanama
NigeriaMexico
MaliMaldives
MalawiLiberiaGhana
GambiaEl Salvador
EgyptEcuador
Dominican RepublicCosta Rica
ChadCameroonCambodiaBotswana
Albania
8%
Colombia
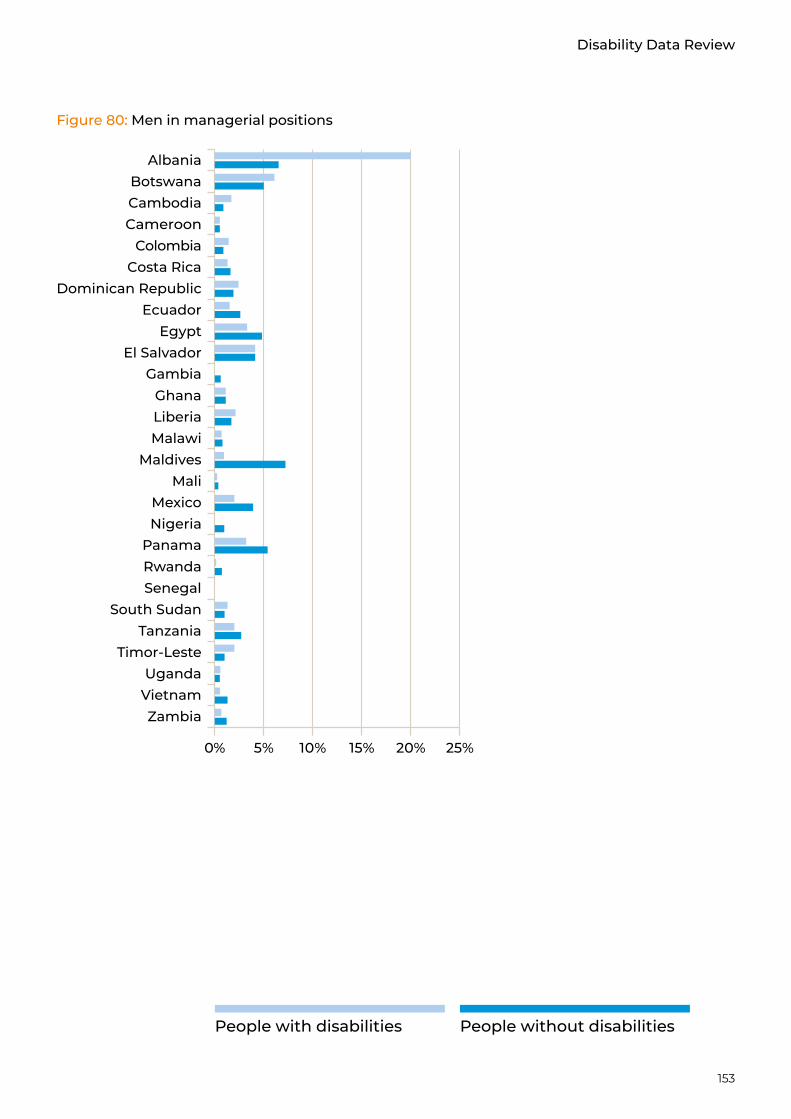
153
Disability Data Review
People without disabilitiesPeople with disabilities
Figure 80: Men in managerial positions
VietnamUganda
Timor-LesteTanzania
South SudanSenegalRwandaPanama
NigeriaMexico
MaliMaldives
MalawiLiberiaGhana
GambiaEl Salvador
EgyptEcuador
Dominican RepublicCosta Rica
ColombiaCameroonCambodiaBotswana
Albania
0% 5% 10% 15% 20% 25%
Zambia
154
16.1.3. Proportion of population subjected to physical, psychological or sexual violence in the previous 12 months
Information about violence is generally collected for women only. Uganda is the only country where information about violence is available for both sexes; in this country 39% and 47% those without and with disabilities respectively have experienced violence, with rates very slightly lower for males than females. Due to Uganda being the only country providing this level of data, no graph has been generated. As mentioned previously, information about violence could only be estimated for men in Cameroon.
The proportion of women with disabilities subjected to violence ranges from 13% in Cambodia to 47% in Uganda. Regarding women without disabilities, we notice that the proportion of women who have experienced violence varies from 20% (Cambodia) to 40% (Uganda). In Cambodia and Timor-Leste, the rate of violence against women with disabilities is lower than those without disabilities.
Chapter 3: Key findings

155
Disability Data Review
People without disabilitiesPeople with disabilities
Figure 81: Proportion of people subjected to violence (females)
ZimbabweUganda
Timor-LesteGambia
ColombiaCambodia
0% 5% 10% 15% 20% 25% 30% 35% 40% 45% 50%
Figure 82: Proportion of people subjected to violence (males)
ZimbabweUganda
Cameroon
0% 5% 10% 15% 20% 25% 30% 35% 40% 45% 50%
156
Observable gaps in the data
Out of the 16 indicators the one related to women in national parliaments was the most difficult to find. It is provided for only two of the 40 targeted countries: Cambodia and Timor-Leste. In contrast, indicator 8.5.2 (unemployment rate) was the only one that could be estimated for more than 35 countries. It was estimated for all of the 40 countries but Zimbabwe and Pakistan.
A thematic-based comparison reveals that education-related indicators are those that are more likely to be disaggregated by disability status. Each of the five indicators of this thematic area could be estimated for more than 30 countries (4.1.x: 35 countries; 4.3.1: 35 countries; 4.5.x: 35 countries; 4.6.1(a): 32; 4.2.2: 31 countries).
Regarding outcomes associated to economic empowerment, only four countries could provide information about bank account ownership while information on poverty rate was available for 12 countries. Each of the three remaining indicators of this thematic area could be estimated for at least 30 countries (8.5.2: 38 countries; 8.6.1: 35 countries; 8.3.x: 30 countries).
Data on technology and innovation could be disaggregated in less than 20 countries (5.b.1: 15 countries; 17.8.1: 11 countries). Concerning stigma and discrimination, indicator 5.5.2 (women in managerial positions) has the most data available (29 countries); each of the three remaining indicators associated with discrimination is available for less than 15 countries (1.3.1: 11 countries; 16.1.3: 7 countries; 5.5.1(a): 2 countries).
A country-based comparison reveals that Cambodia, Rwanda, Timor-Leste and Uganda are the countries with the highest number of indicators estimated (14 out of 16 indicators examined) while Myanmar has the lowest number of indicators with data available (one indicator).
Chapter 3: Key findings
157
Disability Data Review
This section is dedicated to presentation of the key findings for each of the 40 countries with available data tools.
Key findings by country
158
The prevalence of disability (question type 1) in Albania is 4.5%. A disaggregation by gender shows a higher proportion of women with disabilities than men: the proportion of women with disabilities is 5.6%, while the proportion of men with disabilities is 1.8%. Results for the primary school completion rate for people with disabilities can only be estimated for the female sample. Here we observe a six percentage point gap in favour of girls with disabilities (94% for girls without disabilities compared to 100% for girls with disabilities). With regard to the secondary school completion rate, we notice a gap in favour of girls with disabilities, as 50% of girls with disabilities have completed primary education compared with 46% of girls without disabilities. Regarding the male sample, none of the boys with disabilities had completed secondary school, while 48% of boys without disabilities had graduated from secondary school. In Albania, although more than 80% of the population are literate (92% and 86% for those without disabilities and people with disabilities respectively) a gap exists between our two groups of interest. Regarding economic empowerment, we observe that the unemployment gap is more pronounced among males than females. For example, a one-percentage point gap is observed between women with and without disabilities who are 25 to 64 years old (53% of women with disabilities are unemployed, compared to 52% of women without disabilities). This statistic corresponds to 23 percentage points when we consider men (30% of men with disabilities are unemployed, compared to 7% of men without disabilities) 27% and 23% of workers without disabilities and workers with disabilities respectively are employed in the informal sector. Concerning innovation, we notice that more than 90% of households with residents with disabilities that possesses a mobile phone. The gap between our groups of interest is quite low at 3 percentage points (98% and 95% for those without disabilities and people with disabilities respectively). Albania is also characterised by a high proportion of men with disabilities employed in managerial positions (6.5%% and 20% for men with and without disabilities respectively; 4.6%% and 0.6% for women with and without disabilities respectively).
Albania
Chapter 3: Key findings
159
Disability Data Review
According to the most recent data from Bangladesh, the prevalence of disability is 1.4% (question type 5). In Bangladesh, the proportion of children without disabilities who have completed primary or secondary education as well as university is more than twice that of children with disabilities. Furthermore, the school completion rate for boys is higher than that of girls except for primary education, 81% for girls without disabilities and 38% of girls with disabilities, compared to 71% and 32% of boys without and with disabilities. Regarding indicator 4.2.2 (participation in organised learning one year before primary school age), we observe that in general fewer than one quarter of the children participate in organised learning. The gap between people with and without disabilities in the female sample - 10 percentage points (22% for girls without disabilities and 12% of girls with disabilities) is slightly higher than that of the male sample, which is 8 percentage points, (21% of boys without disabilities, 13% of boys with disabilities). The analysis of the participation rate in education or training reveals a 14 percentage point gap between people with and without disabilities when we consider youth (13% for youths with disabilities compared to 27% of youth without disabilities), while no gap is observed for adults (0.5% for adults with disabilities compared to 0.3% of adults without disabilities). Fewer than half of Bangladeshis with a disability who are at least 15 years of age are literate (53% and 28% for those without and with disabilities respectively). Concerning the unemployment rate, adults with disabilities have a higher rate (1.9%) than adults without disabilities (1.5%). Females (4% and 4.8% for women without and with disability respectively) present higher rates than males (1.3% and 1.7% for men without and with disability respectively), regardless of disability status. 64% of youths with disabilities and 43% of youths without disabilities are neither in education nor in employment. The World Bank provided information about poverty and bank account ownership in Bangladesh. Results reveal that that 2.8% of people with disabilities have a bank account. The proportion is slightly higher (3.1%) for people without disabilities. A 4 percentage point gap is observed when it comes to poverty rates. A 28% and 24% poverty rate is observed for people with and without disabilities respectively. However, differing rates of poverty exist using Mitra et al (2013) data which shows a larger difference between people with and without disabilities, 88% compared to 75%.
Bangladesh
160
The prevalence of disability (question type 1) in Botswana is 1.9%. Though the primary school completion rates of girls and boys with disabilities are higher than 80% (85% for boys and 86% for girls), they still lag behind that of children without disabilities (94% for boys and 97% for girls). The gap between people with and without disabilities at secondary school is 11 percentage points (35% people with disabilities, compared to 46% people without disabilities). The difference in completion rate between girls with and without disabilities is one percentage point (49% of girls without disability compared to 48%). A wider gap exists between boys with and without disability (43% of boys without disabilities, compared to 24% of boys with disabilities). When we consider the university completion rate of those aged 25-54, the gap between people with disabilities and their peers is lower than one percentage point (8.8% of people without disabilities, compared to 8.7% of people with disabilities). The gap between the unemployment rate of persons with and without disabilities is lower than four percentage points either for the youths (42% for youths without disabilities compared to 38% for youth with disabilities) and the adults (14% of adults with disabilities, compared to 11% of adults without disabilities). In general, the proportion of people without disabilities who are involved in the informal sector is lower than that of people with disabilities. Out of the eight indicators estimated in Botswana, indicator 5.5.2 (proportion of women in managerial positions) is the only one where we observe a gap in favour of people with disabilities. In fact, 3.3% and 4.6% of women without disabilities and women with disabilities (employed) are managers. These statistics correspond to 5% and 6.1% respectively for men.
In Burkina Faso the difference between the prevalence of disability (question type 1) among males and females is extremely small, at 0.2 percentage points (1.3% for men and 1.1% for females). Less than one quarter of children have completed primary education, and this corresponds to 12% of children with disabilities, compared to 22% of children without disabilities. In the female sample 20% and 11% of girls without and with disabilities respectively have completed primary education; these statistics correspond to 24% and 12% in the male sample. Concerning the secondary school completion rate, results show that while there is hardly any gap between people with and without disabilities, the proportion of people who have graduated from secondary school is less than 5% (3.6% and 3.5% for those without and with
Botswana
Burkina Faso
Chapter 3: Key findings

161
Disability Data Review
disabilities respectively). Overall, there is no gap between children with and without disabilities (8% regardless of the disability status) in the indicator for participation in organised learning. However, there is a gap in favour of boys with disabilities, with 11% and 8% of boys with and without disabilities respectively participating in organised learning. By contrast, in the female sample the corresponding statistics are 6% and 8%.
The analysis of the literacy rate shows that the gap between people with disabilities and those without disabilities increases from 4 percentage points (25% and 21% respectively for youths without and with disability) for youths (below 25 years of age) to 9% (19% and 10% respectively for adults without and with disability) for adults (at least 25 years of age). Unemployment rates in Burkina Faso are generally lower than 10%. A two percentage point gap is observed between the employment rate of young people with disabilities and youths without disabilities (6.1% for youths with disabilities compared to 3.8% for youths without disabilities). However, for the adults, a 0.9 percentage point gap is observed (2.6% of adults with disabilities compared to 1.7% of youths without disabilities). Concerning indicator 8.6.1 (proportion of youth 15-24, not in education or training), results reveal that the proportion of women (31% and 47% of those without and with disabilities respectively) who are neither in education nor in employment is higher than that of the males (9% and 35% of those without and with disabilities respectively). The proportion of people with disabilities involved in informal sectors is higher than that of their peers (51% for people with disabilities and 44% for people without disabilities).
The prevalence of disability in Cambodia is 1.9% (question type 5). The analysis of the school completion rates reveals that the gap between people without and with disabilities decreases from 41 percentage points for primary education (70% for persons without disabilities and 29% for people with disabilities) to 18 percentage points for secondary education (5% of people with disabilities compared to 23% of people without disabilities).When it comes to the literacy of those who are at least 15 years of age, results show that the proportion of men with functional literacy skills is higher than that of women. A three percentage point gap in favour of people with disabilities is observed in the male sample (63% and 66% for men without and men with disabilities respectively). In contrast a 13 percentage point gap
Cambodia
162
is observed in the female sample (58% and 49% respectively for women without and women with disabilities). When we consider unemployment, we notice that the gap between those with and without disabilities increases from 13 percentage points for youths (16% and 29% for youths without and with disability) to 27 percentage points for adults (12% and 39% for adults without and with disability). The gap between those with and without disabilities who are neither in education nor employment is 14 percentage points in both the female and the male samples (26% of people without disabilities compared to 12% of people with disabilities). Regarding innovation related indicators, 88% of women with a disability possess a mobile phone. This statistic corresponds to 92% for women without disabilities. People with disabilities are less likely to use the Internet than those without disabilities (9% and 14% for respectively), and we observe that the proportion of women with a disability who use the Internet is lower than that of the men with a disability (7% and 14% for women and men respectively). Statistics related to social protection reveal that 2.6% of people without disabilities and 0% of people with disabilities are covered by health insurance provided by their employer. In contrast, 22% of Cambodians with a disability are covered by health insurance provided by Social Security, while 11% of people without disabilities benefit from this type of social protection. Furthermore, women with disabilities (13%) are less likely to experience violence women without disabilities (20%). When it comes to employed women in a managerial position, results show the rates for women without and with disabilities are 0.9% and 1.7% respectively.
The prevalence of disability (question type 2) in Cameroon is 5.6%; the proportion of women with a disability (5.4%) is slightly lower than that of men (5.8%). Results related to educational achievements reveal 63% of children without disabilities have completed primary education, and 48% of children with disabilities have completed primary education. For secondary education, 12% of people without disabilities and 9.1% of people with disabilities have completed secondary education. Regarding the university completion rate, the gap between those with and without disabilities decreases from three percentage points in the age group 25-54 (4.4% and 7.4% for people with and without disabilities respectively) to one percentage point in the group of people who are at least 55 years of age (0.9% and 2.1% for people with and without disabilities
Cameroon
Chapter 3: Key findings

163
Disability Data Review
respectively). 66% of people without disabilities aged at least 15 years old are literate; this figure corresponds to 57% for people with disabilities, a nine percentage point gap. Unemployment rates are quite low in the male sample (2.1% and 5.3% for men without disabilities and men with disabilities respectively) compared to the female sample (18% and 19% for women without disabilities and women with disabilities respectively). Furthermore, we observe that in the female sample, the proportion of unemployed women with a disability (18%) is very slightly lower than that of women without disabilities (19%). The estimation of mobile phone ownership reveals that there is a 10 percentage point gap between our two groups of interest. In fact, 59% of households with people with disabilities possess a mobile phone, and this figure corresponds to 69% for households without people with disabilities. The proportion of people with disabilities who are covered by health insurance provided by a mutual/community organisation (1.8%) is slightly higher than that of people without disabilities (1.2%). The opposite situation is observed when it comes to health insurance provided by Social Security (0.4% and 0.1% for people without disabilities and people with disabilities respectively). Regarding indicator 5.5.2, (proportion of women in managerial positions) we notice that 0.6% and 0.4% of those without disabilities and (employed) people with disabilities respectively are at a managerial position.
The prevalence of disability (question type 2) in Chad is 3.4%. Regarding indicators related to education 24% for children without disabilities, compared to 15% for children with disabilities have completed primary education. Women are less likely than men to complete primary, secondary school or university education; however, the gap between those with and without disabilities is more pronounced in the male sample compared to the female sample. For example, 21% and 14% of girls without and with disabilities respectively have completed primary education, and these statistics correspond to 26% and 15% respectively for boys without and with disabilities. We also observed that less than one fifth of the women are literate (17% and 14% for women without and with disabilities respectively).Regarding participation in organised learning, 11% of children without disabilities attended, compared to 10% of children with disabilities. We observe that there is no gap between boys with and without disabilities (12% for both groups of interest), while a 5 percentage point gap is observed in the female sample (11% of girls without
Chad
164
disabilities, compared to 6% of girls with disabilities). In terms of unemployment rates, data was available for women only. We observe that 51% of youth with disabilities are unemployed, compared to 61% of youths without disabilities. This equates to 10 percentage points for youths. Within the adult sample, 41% of women with disabilities are unemployed, compared to 43% of women without disabilities (2 percentage points). 49% of young women with disabilities are neither in education nor in employment compared to 44% of women without disabilities. Statistics also reveal that the proportion of women without disabilities (75%) in informal sectors is higher than that of those with disabilities (60%). We observe that 52% of households with at least one man with a disability and 49% of households with a least one woman with a disability have access to a mobile phone. These statistics correspond to 61% (male) and 59% (female) respectively when we focus on the households without people with disabilities. In Chad 0% of employed women with disabilities are at a managerial position. This statistic corresponds to 0.2% if we consider employed women without disabilities.
The prevalence of disability (question type 4) in Colombia is 9%. 65% of children with disabilities have attended primary school, compared to 91% of children without disabilities. A 23 percentage point gap is observed between girls with and without disabilities when we analyse primary school completion rate (71% of girls with disabilities complete primary school, compared to 94% of girls without disabilities). This figure corresponds to 30 percentage points when we consider boys (59% of boys with disabilities have completed primary school compared to 89%). 67% of children without disabilities have completed secondary school, compared to 61% of children with disabilities. The gap between the male sample is larger than the female sample, 55% of boys with disabilities have completed secondary school, compared to 63% of boys without disabilities. This is compared to 67% of girls with disabilities, compared to 71% of girls without disabilities. A gap in favour of people with disabilities is observed when we analyse the participation rate of youth in education or training (9 percentage points, equating to 55% of youths with disabilities compared to 46% of youths without disabilities) and university completion rate of the group 25-64 years of age (4 percentage points, equating to 25% of people with disabilities compared to 21% of people without disabilities. There is no gap between the unemployment rates of people with or without
Colombia
Chapter 3: Key findings
165
Disability Data Review
disabilities (2.8%); however a 1.4 percentage point gap is observed for youths (5% for youths with a disability, compared to 6.4% for youths without a disability). Statistics related to internet usage show that there is no gap between households with at least one woman with disability and households without women with disability (39%); however, when the comparison is between households with at least one man with disability and households without men with disability, the gap is larger at four percentage point (35% and 39% for men with and without disability respectively). Regarding mobile phones, more than 90% of households have access to a mobile phone (94% of households with people with disabilities compared to 96% of households who do not have people with disabilities) the gap observed between households with a least one female with a disability and households without females with disability is one percentage point (96% of households without females with disabilities, compared to 95% of households without females with disabilities). The gap is slightly larger in male sample, with 93% of households with at least one male with disabilities compared to 96% of households without any male members without disabilities. Concerning discrimination, 0.8% of employed women without disabilities women are at a managerial position and this statistic corresponds to 0.6% for women with a disability.
The prevalence of disability (question type 2) among males and females in Costa Rica corresponds to 10% and 11% respectively. Completion of primary education is higher for children without disabilities at 93%, compared to 81% of children with disabilities, a gap of 12 percentage points. Participation in education and training for youth is 53% for youth disabilities, compared to 55% for youth without disabilities. The participation rate for women with disabilities is higher than women without disabilities (59% for women with disabilities, compared to 57% of women without disabilities). For men with disabilities the rate is lower than for men without disabilities (47% of men without disabilities, compared to 52% of men with disabilities). A small gap exists between children with and without disabilities participating in organised learning, 78% of children with disabilities are participating, compared to 74% of children without disabilities. A 10 percentage point gap in favour of girls with disabilities is observed when we focus on their participation rate in organised learning (84% of girls with disabilities, compared to 74% of girls without disabilities); however there is no gap observed when
Costa Rica

166
we compare boys with and without disabilities (74% for both groups). A six percentage point gap is found when we compare the proportion of people with disabilities and people without disabilities of the age group 25-54 years old who have completed university (15% for adults with disabilities, compared to 21% of adults without disabilities). 91% of people with disabilities and 98% of people without disabilities who are at least 15 years of age are literate. This leads to a seven percentage point gap between the two groups of interest. The gap between the unemployment rate of people with and without disabilities increases from two percentage point for youths (18% for youths with disabilities compared to 16% of youths without disabilities), to four percentage points for adults (15% of adults with disabilities compared to 11% of adults without disabilities). We observe that 34% of people with disabilities work in informal sectors, compared to 26% of people without disabilities. 19% and 24% of women without disabilities and women with disabilities respectively work in informal sectors; these figures correspond to 29% and 39% respectively for men without and with disabilities. Regarding indicator 5.5.2 (proportion of women in managerial positions), 1.4% and 1.1% of (employed) women without disabilities with disabilities respectively are at a managerial position.
The prevalence of disability (question type 4) in Dominican Republic is 12%. The school completion rate of people with disabilities is generally lower than that of those without disabilities. For instance, 68% and 83% of people with and without disabilities have completed primary education. When it comes to literacy skills, we observe that the gap between those with disabilities and those without is just one percentage point for youth (79% for people without disabilities, compared to 78% of people with disabilities) compared to 10 percentage points for adults (76% for adults with disabilities, compared to 86% of adults without disabilities). The proportion of Dominicans who are unemployed is lower than 25%. In fact, for the age group 25-64 years old, 14% and 16% of people without and with disabilities respectively are unemployed; these figures correspond to 20% (people without disabilities) and 23% (people with disabilities) in the age group 15-24 years of age. When we consider the proportion of youth not in education or employment, the percentage is higher for people with disabilities compared to people without disabilities (34% of people with disabilities, compared to 26% of people without disabilities). We notice that the gap between those with and
Dominican Republic
Chapter 3: Key findings
167
Disability Data Review
without disabilities increases from three percentage points in the female sample (35% of females with disabilities compared to 32% of women without disabilities) to 14 percentage points in the male sample (34% of men with disabilities compared to 20% of men without disabilities). Statistics on the informal sector reveal that the proportion of people with disabilities (28%) involved in the informal sectors is higher than that of people without disabilities (25%). In the Dominican Republic, 2.3% (employed) women without disabilities are managers while 1.8% of their peers with a disability have such a position.
Ecuador is characterised by a disability (question type 1) prevalence of 6%. In general, more than 80% of the children who are one year before the official primary entrance age participate in organised learning. Overall, 67% of children with disabilities attend primary school, compared to 89% of children without disabilities. We observe that the figure for boys with disabilities (68%) is higher than that of girls with disabilities (66%). An 11 percentage point gap is observed between children with and without disabilities when it comes to attending organised learning, 81% of children with disabilities attending organised learning compared to 92% of children without disabilities. The secondary school completion rates of girls and boys with disabilities are identical (33%), whereas overall, 33% of children with disabilities attend secondary school compared to 55% of children without disabilities. The proportion of people without disabilities who have completed university is twice that of people with disabilities, leading to a six percentage point gap in the age group 25-54 years old (5.7% of people with disabilities, compared to 12% of people without disabilities) and a four percentage point gap for the age group 55 and above (2.3% of people with disabilities, compared to 6.7% of people without disabilities). Concerning functional literacy skills of people who are at least 15 years old, findings show that 95% of people without disabilities and 77% of people with disabilities are literate. Data on economic empowerment reveal that the youth unemployment rate is 10% regardless of disability status. For adults, these statistics correspond to 4.5% for persons without disabilities and 5.2% for people with disabilities. Regarding employment in the informal sectors, 32% of people without disabilities are employed in informal sectors, compared to 37% of people with disabilities. A bigger gap exists between women with and without disabilities (35% of women with disabilities, compared to 42% of women without disabilities), compared to men with and without
Ecuador

168
disabilities (36% of men with disabilities, compared to 31% of men without disabilities). While 3% of employed women without disabilities are managers, 1.8% of employed women with a disability are found at this position.
Less than 1% of Egyptians were enumerated as having a disability (question type 1). The prevalence of disability is 0.5% for women and 0.8% for men. Overall, the primary school completion rate is 35% for children with disabilities and 87% of children without disabilities. The primary school completion rate is 32% for girls with a disability and 37% for boys with a disability, compared to 86% and 89% for girls without disabilities and boys without disabilities respectively. Regarding secondary school completion, we observe a 41 percentage point gap (24% and 65% respectively) between girls without and with disabilities and a 44 percentage point gap (28% and 72% for boys with and without disabilities respectively). Overall, the secondary school completion rate is 26% for children with disabilities, compared to 69% of children without disabilities. The proportion of youth with a disability who participate in education is less than half that of their peers without disabilities, whether we consider the male (85% and 38% for those without disabilities and with disabilities) or the female sample (82% and 33% for those without and with disabilities respectively). Regarding university completion, the findings reveal that in the age group 25-54 years old, 12% and 4% of women without and with disabilities respectively have completed university compared to 18% and 7% in the male sample. The literacy gap between people with and without disabilities varies from 45 percentage points for the youth (44% and 89% for youths without and with disabilities respectively) to 21 percentage points for the adults (36% and 57% for adults with and without disabilities respectively). Statistics related to economic empowerment reveal that the unemployment rate gap between people with disabilities and those without disabilities decreases from 17 percentage points for youth (48% for youths with disabilities, compared to 31% for youths without disabilities) to 5 percentage points for adults (8.9% for adults with disabilities compared to 3.6% of adults without disabilities). The proportion of youth not in education or employment is 4.1% for those without disabilities and 24% for people with disabilities. A 1.2 percentage gap is observed between women with and women without disabilities when we focus on the proportion of employed women in managerial positions (3.1% of women with disabilities, compared to 4.3% of women without disabilities).
Egypt
Chapter 3: Key findings
169
Disability Data Review
The prevalence of disability (question type 3) in El Salvador is 4.1%. The proportion of girls (80% and 44% for girls without and with disabilities respectively) who have completed primary education is a little higher than that of boys (77% and 38% for boys without and with disabilities respectively). Regarding the secondary school completion rate, an 18 percentage point gap is observed when we compare people with and without disabilities (14% of children with disabilities, compared to 32% of children without disabilities). Concerning university completion rates, the gap between people with and without disabilities varies from 2.5 percentage points in the age group 25-54 years old (3.6% for people with disabilities, compared to 6.1% of persons without disabilities) to 1.7 percentage points in the population aged 55 and above (0.9% of people with disabilities, compared to 2.6% for people without disabilities). We observe that 81% and 52% of women without disabilities and women with disabilities respectively aged 15 years of age are literate, compared to 87% and 63% in the male sample. The unemployment rate gap between people with disabilities and those without disabilities is six percentage points whether we consider youth or adults (18% for youths with disabilities compared to 12% for youths without disabilities and 13% for adults with disabilities compared to adults without disabilities). Our findings related to the proportion of youth not in education and employment reveal that the gap between people with disabilities and those without is 22 percentage points (66% and 44% for women with and without disabilities respectively) in the female sample and 39 percentage points (61% and 22% for men with and without disabilities respectively) in the male sample. The proportion of people with disabilities (37%) who are involved in informal sectors is higher than that of those without disabilities (30%). In El Salvador, 5% of employed women are managers, and there is no gap between women without disabilities and their peers with disabilities.
3.3% of the Gambian population has a disability (question type 3). The proportion of women with a disability (3.7%) is slightly higher than that of men (3%). Statistics related to indicator 4.3.1 (participation of youth and adults in formal and non-formal education) show that 36% and 31% of youths with disabilities and youth without disabilities respectively participate in education and training. Fewer than 50% of Gambians aged at least 15 years are literate, with a four percentage point gap observed between those with (42%) and without (46%) disabilities. When it comes
El Salvador
Gambia
170
to indicators related to economic empowerment, we find that the unemployment rate of people with disabilities is higher than that of those without, however the gap is smaller between women with and without disabilities than between men in the groups of interest. For instance, in the group of women in the age group 25-64 years old, a 34% and a 32% unemployment rate is observed for women with and without disabilities respectively. These statistics correspond to a 12% rate for men with disabilities and 6.7% rate for men without disabilities. An 11 percentage point gap is observed when we compare the proportions of women with disabilities (56%) and women without disabilities (67%) women who work in informal sectors. Regarding innovation and technology, 91% of households have access to a mobile phone regardless of disability status of their members (that is when we compare households without people with disabilities and households with people with disabilities). Concerning the Internet, the proportion of households with people with disabilities that have the Internet (5%) is higher than that of the households without people with disabilities (4%), and this conclusion remains valid when we consider males and females separately. In this country the proportion of individuals who are covered by health insurance provided by the employer is 1.8% for people with disabilities and 2.1% for those without. Our findings reveal that the proportion of women with a disability (18%) who have experienced violence is slightly higher than that of women without disabilities (16%).
The prevalence of disability (question type 1) in Ghana is 3%. Statistics on educational achievement reveal that the primary education completion rate is lower for children with disabilities than those without, regardless of gender. Overall 54% of children with disabilities have completed primary education compared to 64% of children without disabilities. A gender based analysis reveals that 57% of girls without disabilities have completed primary education, compared to 65% of children with disabilities. 51% of males with disabilities have completed primary school compared to 63% of males without disabilities. Regarding the secondary school completion rate, the gap between those with and without disabilities is wider in the male sample (14 percentage points, 38% of boys without disabilities and 24% boys with disabilities) compared to the female sample (8 percentage points, 30% of girls without disabilities and 22% girls with disabilities). The estimation of indicator 4.2.2 shows
Ghana
Chapter 3: Key findings
171
Disability Data Review
that the participation rate of children without disabilities in organised learning is higher at 84% (for girls and boys), compared to 76% and 73% of girls and boys with disabilities respectively. In Ghana, more than half of the population aged at least 15 are literate. Nevertheless, a 15 percentage point gap is observed between those with and without disabilities (57% compared to 72%). Unemployment rates between people with and without disabilities are very similar in both the adult (4% regardless of the disability status) and youth sample (11% regardless of the disability status). Women are in general more involved in informal sectors than men, for example among those with disabilities, 73% of women and 65% men are employed in informal sectors.
The prevalence of disability (question type 1) in India is 2.2%. Regarding the participation rate of youth in education or training, results reveal that 60% and 62% of girls and boys with disabilities respectively who are 5 to 19 years old attend school. 45% and 62% of females and males with disability are literate. Results also show that the proportion of non-working women with disability (77%) is higher than that of the men with disability (53%).
3.5% of Kenyans live with a disability (question type 1), regardless of gender. 44% of children with disability are completing primary school in Kenya, compared to 60% of children without disabilities. A gender based analysis reveals that more females than males are completing primary education, regardless of disability. 64% of females without a disability are completing primary education, compared to 50% of females with disability. This is compared to 56% of males without a disability completing primary education and 39% of males with a disability completing primary education. People with disabilities are completing secondary education at a lower rate than people without disabilities, with 17% of people with disabilities completing secondary school compared to 27% of people without disabilities. When we consider the secondary school completion rate, we observe a 9 percentage point gap between women with and without disabilities (27% of females without disabilities compared to 18% of females with disabilities) and a 13 percentage point gap in the male sample (28% of men without disabilities compared to 15% of men with disabilities). An eleven percentage point gap is observed when we compare children with and without disabilities who
India
Kenya
172
participate in organised learning (indicator 4.2.2), 76% of children without disabilities compared to 65% of children with disabilities. The gap between those with and without disabilities in terms of participation in education or training (indicator 4.3.1) varies from two percentage points for youth (46% for children without disabilities compared to 44% of children with disabilities) to 2.9 percentage points for adults (3.5% of children without disabilities compared to 2.6% of children with disabilities). When it comes to university completion rates, we observe that in the age group 25-54 years, 1.7% and 1.1% of those without and with disabilities respectively within the female sample have completed university. These statistics correspond to 3.2% and 2.2% in the male sample. 7% of adults without a disability are unemployed, and this statistic corresponds to 9.5% for adults with disabilities. However, no gap is observed when we consider youth (16%). Statistics on the proportion of youth not in education or employment show that a five percentage point gap exists between those with (20%) and without disabilities (15%).
In Liberia the prevalence of disability (question type 1) is 3.1%. No gap is observed between people with and without disabilities when we estimate the secondary school completion rate either in the female (6%) or the male sample (8%). However, when it comes to the primary education completion rate, we observe a 12 percentage point gap in the male sample (25% boys without disabilities completing primary, and 13% boys with disabilities completing primary) and a seven percentage point gap in the female sample (26% of girls without disabilities completing primary school and 19% of girls with disabilities completing primary). 41% and 28% of girls and boys without disabilities respectively participate in organised learning. However, when we consider children without disabilities, we observe a participation rate of 40% for both girls and boys. The literacy gap between persons with and without disability decreases from 10 percentage points (58% and 68% for persons with and without disability respectively) for youth (15-24 years old) to eight percentage points (38% and 46% for persons with and without disability respectively) for adults (25-64 years old). Statistics on economic empowerment reveal that 13% and 12% of adult men without and with disabilities respectively are unemployed. These statistics correspond to 7.8% and 7.6% respectively when we consider the female sample. Concerning employment in the informal sector, 58% of people with and without disabilities are
Liberia
Chapter 3: Key findings
173
Disability Data Review
in informal sectors – there is no gap between the two groups. When it comes to the discrimination related indicator, we observe that the proportion of employed women with disabilities (1%) who are managers is slightly higher than that of women without a disability (0.8%).
3.9% of Malawians live with a disability (question type 4). 24% and 17% of females without and with disabilities respectively have completed primary education; these statistics correspond to 20% and 15% respectively in the male sample. 10% and 6% of women without and with disabilities respectively have completed secondary school; these figures correspond to 17% and 10% in the male sample. When we consider the participation rate in education or training, we find that the gap between our two groups of interest decreases from 3 percentage points for youth to almost no gap for adults. This corresponds to 22% for youth without disabilities, compared to 19% for youth with disabilities and 0.2% for adults without disabilities and 0.1% for adults with disabilities. Statistics on university completion rates show almost no gap, at 0.4 and 0.1% between those with and without disabilities respectively in the age groups 25-54 years and 55 and above. Statistics on university completion rates show almost no gap; 0.7% of adults without disabilities have gone to university in the 25-54 year old age group compared to 0.3% of adults with disabilities. In the over 55 age group, 0.3% of adults without disabilities have gone to university and 0.2% of adults with disabilities have gone to university. Results show that 21% and 12% of women and men with disabilities respectively are unemployed, and these statistics correspond to 23% and 10% respectively for adults without disabilities. The gap between youth with and without disabilities who are not in education or employment is six percentage points (48% for youth with disabilities, compared to 42% of youth without disabilities). The proportion of Malawian women who are employed in informal sectors is 80% in both populations. Regarding the sample of men, we observe that 65% and 66% of those without and with disabilities respectively work in informal sectors. Concerning discrimination, we observe that almost no women, either with or without disabilities are in managerial positions (0.1% and 0.2% of women without and with disabilities respectively are in managerial positions).
Malawi
174
The proportion of women with a disability (10%) in Maldives (question type 5) is slightly higher than that of men (9.1%). Overall 96% of children with disabilities have completed primary school, compared to 78% of children without disabilities. We observe that the gap between boys with and without disabilities in completion of primary education is larger than that of the female sample. 98% and 89% of girls without and with disabilities respectively have completed their primary education, and these statistics correspond to 94% and 66% respectively in the male sample. Concerning secondary education, there is no gap in the female sample (10% for both groups). However, a six percentage point gap is observed in the male sample (13% and 7% for men without disabilities and men with disability respectively). When it comes to the participation in learning of children who are one year before the primary entry age, we observe a 20 percentage point gap between children with and without disabilities (92% of children without disabilities compared to 72% of children with disabilities). The gap in unemployment rates of people with disabilities and their peers slightly increases from three percentage points for youth (51% and 48% for youths with and without disability respectively) to four percentage points for adults (46% and 42% for adults with and without disability respectively). Labour market indicators also reveal that the proportion of people with disabilities (58%) working in informal sectors is higher than that of those without disabilities (41%). Statistics on Internet usage reveal that the gap observed between men without and men with a disability (31 percentage points) is twice the one calculated for women (15 percentage points). 27% and 12% of men without and with disability respectively use the Internet; these statistics correspond to 43% and 12% respectively in the female sample. 0.3% of employed women with a disability are managers and a 1.3 percentage point gap exists between women with and without disabilities.
The prevalence of disability (question type 2) in Mali is 0.7%. Regarding the primary school completion rate, a two percentage point gap is observed between girls with (24%) and without disabilities (26%), and this figure corresponds to eight percentage points in the male sample (29% and 37% for boys with and without disabilities respectively). The proportion of men who have completed secondary school (11% and 12% for men without and with disabilities) is twice that of the women (5% and 4% for women without and women with disabilities). When we
Maldives
Mali
Chapter 3: Key findings
175
Disability Data Review
consider those who are 25 to 54 years of age we do not observe a gap in terms of university completion between people with disabilities (1.9%) and people without disabilities (1.9%); however for those who are at least 55 years old, a 0.2 percentage point gap is observed (0.6% and 0.8% for people with and without disabilities respectively). Statistics on education also show that less than one quarter of the females who are at least 15 years of age possess literacy skills. In fact, 22% of women without and 18% of women with disabilities are literate. In the male sample, we observe a nine percentage point gap between those without disabilities (40%) and those with disabilities (31%). The proportion of youth not in education or employment varies from 29% for those without disabilities to 36% for people with disabilities. Indicators of the labour market reveal a 1.3 percentage gap between adults with and without disabilities when we compare their unemployment rate (2.6% and 1.3% for people with and without disabilities respectively). 70% of men with and without disabilities are in informal sectors. In the female sample, results show that women with disabilities (28%) are more involved in informal sectors than women without disabilities (23%).
The prevalence rate of disability (question type 3) in Mexico is 5%. A 26 percentage point gap is observed when we compare primary school completion rates of people with disabilities and those without disabilities (94% for children without disabilities, and 68% for children with disabilities). This figure corresponds to 24 percentage points when we consider secondary school completion, as 41% and 29% of people without and with disabilities respectively attend secondary school. Data on university completion rates of people who are 25 to 54 years of age reveal that 14% and 5.3% of those without disabilities and with disabilities respectively have completed university. Within the male and female samples, we can observe that more females without disabilities have attended university that females with disabilities (13% and 4.9% respectively). The same is true for the male sample, with 15% of males without disabilities attending university compared with 5.6% of males with a disability. Indicators on education also reveal that the literacy gap between those with and without disabilities decreases from 21 percentage point for youth (90% for youths without disabilities and 69% for youths with a disability) to 18 percentage point for adults (93% for adults without disabilities and 75% for adults with disabilities). Within unemployment statistics, the unemployment rate for
Mexico

176
adult males is higher for those with disabilities (6.6%) than those without disabilities (4.6%). For adult females with and without disabilities the overall rates of unemployment are lower, and the gap between the two groups is smaller (females with disabilities: 1.7% and females without disabilities: 1.9%) than the male sample. 47% and 25% of youth with and without disabilities respectively are not in education or employment. Fewer than half of Mexican workers are in informal sectors; however we notice an 11 percentage point gap between the proportions of those with and without disabilities in informal sectors (37% of people with disabilities compared with 26% of people without disabilities). 1.7% of employed women with disabilities are managers, while 3.8% of (employed) women without disabilities are at this position.
The prevalence of disability in Myanmar is 7.7% (question type 5). 8.4% and 6.9% of women and men respectively live with a disability. Statistics provided by ILO reveal that 0.8% of individuals with a disability are unemployed. The unemployment rate for people without disabilities is 2.1%.
2% of Nigerians have a disability (question type 4). The estimation of indicator 4.3.1 (participation rate of youth and adults in formal and non-formal education in training) reveals that a 30 percentage point gap exists between the proportion of youth with and without disabilities who are in education (55% of youth without disabilities, compared to 25% of youth with disabilities). The proportion of people without disabilities who are 25 to 54 years old and who have completed university is 9.1%. This figure corresponds to 4.5% for people with disabilities, generating a 4.6 percentage point gap. Data on literacy reveal that the gap between youths with and without disabilities is more pronounced in the female sample (21% of women with disabilities, compared to 62% of women without disabilities) compared to the male sample (52% of men with disabilities compared to 66% of men without disabilities). Regarding the unemployment rate, we observe that the gap between people with and without disabilities increases from 28 percentage points (77.3% for people with disabilities and 49.2% for people without disabilities) for youth to 41 percentage points for adults (62.5% for people with disabilities, compared to 21.5% for people without disabilities).The proportion of people with disabilities in informal sectors (13%) is lower than that of people
Myanmar
Nigeria
Chapter 3: Key findings

177
Disability Data Review
without disabilities (30%). The proportion of females with and without disabilities working in informal sections (33% and 16% respectively) is higher than that of males with and without disabilities (27% and 10% respectively). In Nigeria, women are less likely than men to own a mobile phone and people with disabilities are less likely to possess a mobile phone than people without disabilities. 36% of women with disabilities and 53% of men with disabilities own a mobile phone. In the group of people without disabilities, 44% and 59% of females and males respectively have a mobile phone. Regarding the proportion of adults (15 years and older) with an account at a bank or other financial institution, we observe that the gap between people with and without disabilities in the female sample (7 percentage points) is larger than observed in the male sample (2 percentage points). 11% of women without disabilities have a bank account, compared to 4% of women with disabilities whereas 21% of men without disabilities have a bank account compared to 19% of men with disabilities.
The prevalence of disability (question type 5) in Pakistan is 11.6%. 28% of people with disabilities who are at least 10 years old are literate. In the group of women and men with disabilities respectively, the literacy rates are 21% and 32%. The estimation of the poverty rate reveals that it is higher, at 74% for people with disabilities; the poverty rate for those without disabilities is 69%.
The prevalence of disability (question type 1) in Panama is 2.9%. Overall, 62% of children with disabilities have completed primary school, compared to 93% of children without disabilities. The proportion of girls with a disability who have completed primary education (64%) is higher than that of the boys with a disability (60%). Moreover, when we consider children without disabilities, we observe that 94% of girls and 92% of boys have completed primary education. Data related to secondary education show once again that females have higher rates of completion than boys. In fact, 36% and 29% of girls with disabilities and boys with disabilities respectively have graduated from secondary school; these statistics correspond to 62% and 51% respectively for girls and boys without disabilities. Regarding university completion, we notice that women’s rates are higher than that of men when we consider the age group 25-54 years old. In fact, 8.5% and 5.2% of women and men with disabilities respectively have
Pakistan
Panama
178
completed university. These figures correspond to 22% and 15% respectively for people without disabilities. The opposite scenario is observed when we focus on those who are at least 55 years of age. In fact, 9.6% and 3.3% of women without and with disabilities respectively have completed university, and these statistics correspond to 10% and 4.1% respectively in the male sample. The comparison of the unemployment rates of people with and without disabilities reveal a gap that decreases from three percentage points for youth to 1.6 percentage points for adults. This corresponds to 18% of youths with disabilities, and 15% of youths without disabilities. For adults, 5.6% of people without disabilities are unemployed compared to 7.2% of people with disabilities. Concerning indicator 5.5.2 (proportion of women in managerial positions), a 4.1 percentage point gap is observed between the proportions of employed women with (3.2%) and without disabilities (7.3%) who are managers.
4.2% of Rwandans are persons with a disability (question type 2). All children have completed primary education, and all those who are one year before the official primary entry age participate in organised learning. Regarding secondary education, we observe an 8.5 percentage point gap between people with and without disabilities (20% completion rate for people without disabilities compared to a 12% completion rate for people with disabilities). A 5.6 percentage point gap (5.3% and 10.9% respectively for people with and without disability of the age group 25-54) exists between people with disabilities and without disabilities when we compare their university completion rates. 3.1% and 8.6% respectively of females with and without disability have completed university (age group 25-54). These statistics correspond respectively to 6.8% and 13.1% respectively in the male sample. When we focus on those who are younger than 25, results show that 97% of youths without disabilities and 96% of youths with disabilities are literate. Labour market related indicators show that 91% and 95% of people without disabilities and people with disabilities respectively work in informal sectors. Slightly more women with disabilities work in in informal sectors than women without disabilities (96% compared to 94%). The gap between people with and without disabilities is bigger in the male sample, with 94% of men with disabilities working in informal sectors, compared to 89% of men without disabilities. The unemployment rate of people with disabilities (adult age) is 0.3%, while that of people without disabilities is 0.9%. In Rwanda, adults (at least 25 years of age) are
Rwanda
179
Disability Data Review
all literate regardless of disability status. Regarding technology and innovation, results indicate that the proportion of men who possess a mobile phone is higher than that of women. Indeed, 41% and 25% of men without disabilities and men with disabilities respectively own a mobile phone, and these statistics correspond to 27% and 13% respectively in the female sample. A four percentage point gap exists between households where at least one member has a disability (6%) and households without people with disabilities (10%) when it comes to internet access. Indicators of social protection reveal that more than half of Rwandans are covered by mutual health insurance. In fact, 71% and 69% respectively of women with disabilities and men with disabilities are covered, and these figures correspond to 67% and 65% respectively for women and men without disabilities. Regarding health insurance provided by Social Security, we notice a 3.6 percentage point difference between people with disabilities and without disabilities (3.6% for people with disabilities, compared to 1.3% for people with disabilities).
Senegal has a disability (question type 1) prevalence rate of 2.4%. Statistics on education show a 16 percentage point gap between the proportion of children with and without disabilities who have completed primary education (26% for children with disabilities, compared to 42% of children without disabilities). The proportion of male youths with disabilities (43%) who are in education is higher than that of female youths with disabilities (29%). The opposite is observed for youths without disabilities; in fact, 60% and 33% of females and males respectively attend education or training. 38% of Senegalese who are at least 15 years of age are literate and no gap is observed when we compare people with disabilities to those without disabilities. Statistics on unemployment reveal that people without disabilities are unemployed at a rate of 0.2%, while people with disabilities show a rate of 2%. In the Senegalese database, unemployed people are those not working and not attending school. Based on this definition we would expect a higher rate in Senegal since a relaxed definition of unemployment in used for the DHS dataset. A 10 percentage point gap is observed when we compare the proportions of women with disabilities and women without disabilities who are in informal sectors (50% of women with disabilities compared to 60% of women without disabilities). 7% of households with people with disabilities and 10% of those without people with disabilities have access to the Internet.
Senegal
180
Regarding mobile phone ownership, 94% of households without persons with disability and 92% of households with persons with disability possess a mobile phone.
The proportion (question type 5) of women with a disability (8.9%) in South Africa is higher than that of men (6.5%). More than 80% of children have completed primary education and a 10 percentage point gap exists between our two groups of interest (96% of children without disabilities have completed primary education, compared to 86% for children with disabilities). Secondary school completion is lower for those with disabilities, with 50% of people without disabilities completing secondary school, compared to 37% of people with disabilities. The proportion of girls without disabilities completing secondary school (53%) is higher than girls with disabilities (43%) and boys without disabilities (47%) and men with disabilities (32%). There is no difference between the proportions of girls and boys with disabilities (91%) who participate in organised learning (indicator 4.2.2); moreover 93% of children without disabilities participate in organised learning in the female and the male sample. 6.6% of adults without disabilities and 4.9% of adults with disabilities participate in education or training. These statistics correspond to 54% and 50% respectively when we consider people who are 15 to 24 years of age. A 4.4 percentage point gap is observed between people with disabilities and those without disabilities when we estimate their university completion rates (3.6% for people with disabilities and 8% for people without disabilities. Statistics on employment rates show that 64% of youths without disabilities and 70% of youths with disabilities are unemployed. These statistics correspond to 33% and 42% respectively when we consider adults. 40% of women with disabilities, compared to 35% of women without disabilities and 38% of men with disabilities, compared to 28% of men without disabilities are not in education or employment.
The prevalence of disability (question type 3) in South Sudan is 5.1%. Fewer than 5% of children have completed primary school. In fact, 3.9% of children without disabilities and 3.7% of children with disabilities have completed primary education. Regarding secondary education, we observe that 1.8% of people without disabilities and 1% of people with disabilities have graduated from secondary education. University completion rates are quite low in South Sudan. 0.5% of women without disabilities
South Africa
South Sudan
181
Disability Data Review
and 0.2% of women with disabilities (25-54 years old) have completed university, and these statistics correspond to 1.8% for men without disabilities and 1.1% for men with disabilities. Fewer than 30% of South Sudanese are literate; 27% of people without disabilities and 22% of those with disabilities who are at least 15 years of age have functional literacy skills. The unemployment rates of youths are 18% for women without disabilities and 15% for their peers with a disability. In contrast, 2% of young men without disabilities and 19% of young men with disabilities are unemployed. 29% of adults without disabilities and 33% of youths with disabilities are not in education or employment. Regarding informal sector employment, we observe an eight percentage point gap between people with disabilities and those without disabilities (38% of people without disabilities compared to 46% of people with disabilities). The proportion of employed women at a managerial position is 0.3% for women without disabilities and 0.4% for women with disabilities.
The prevalence of disability (question type 1) is 1% in St Lucia. Unfortunately, for the indicators below, data for persons without disabilities was not available at the time of writing. Additionally, unemployment data disaggregated by age was also unavailable. The unemployment rate among people with disabilities is 48% for males and 54% for females. Data on innovation and technology show that 72% of women with a disability and 68% of men with a disability own a mobile phone. When the analysis is done at the household level, we observe that 54% households with at least one man with a disability and 55% of women with a disability live in a household that possesses a mobile phone. Regarding the Internet, 18% of men with a disability and 21% of women with a disability use the Internet. 9% of men with disabilities and 8% of women with disabilities are covered by Social Security.
The prevalence of disability (question type 5) in Tanzania is 1.5%. When we compare primary school completion rates between children with and without disabilities, we observe a 34 percentage point gap (83% of children without disabilities compared to 49% of children with disabilities). Regarding the secondary school completion rate, we observe a 12 percentage point gap between people with disabilities and those without a disability (26% of children without disabilities compared with 14% of children with disabilities). Fewer than half of the children who are not old enough
St Lucia
Tanzania
182
to enter primary school participate in organised learning. This figure is 49% in the group of children without disabilities and 36% in the group of children with disabilities. There is a gap between girls without and with disabilities (38% versus 51%) and boys without and with disabilities (48% versus 35%). A 1.8 percentage point gap is observed between the university completion rates of those with (3.2%) and without disabilities (1.4%) who are 25 to 54 years of age. 33% and 56% of women and men with disabilities respectively are literate (people at least 25 years old). 2.6% of adults without disabilities and 2.7% of adults with disabilities are unemployed. 24% of women without disabilities and 40% of women with disabilities are not in education or employment, and these statistics correspond to 13% and 36% respectively in the male sample. A four percentage point gap is observed when we compare the proportion of people with disabilities to those without disabilities involved in informal sectors (83% for people without disabilities and 87% for people with disabilities). The proportion of Tanzanian women employed in managerial positions is 2% for women without disabilities and 1.6% for the group with a disability.
The prevalence of disability (question type 5) in Timor-Leste is 1.7%. A 64 percentage point gap is observed when we compare the proportion of people with disabilities and people without disabilities who have completed primary education (72% for children without disabilities, compared to 8% of children with disabilities). 13% and 4.2% of those without and those with disabilities respectively who are 25-64 years old have completed university. Indicators related to educational achievements of those who are at least 15 years of age reveal that the proportion of people without disabilities (62%) who are literate is twice that of people with disabilities (31%). A four percentage point gap exists between the proportions of women with disabilities and women without disabilities who work in informal sectors (18% for women without disabilities, compared to 14% of women with disabilities. 66% and 52% of people without and with disabilities respectively own a mobile phone. 17% of women with disabilities use the internet, compared to 26% of women without disabilities and 16% of men with disabilities use the Internet compared to 31% of men without disabilities. In Timor-Leste, women with disabilities (24%) are less likely than women without disabilities (40%) to experience violence. Almost no gap (0.4) is observed between women with and without disabilities when we compare the proportions of those at managerial positions.
Timor-Leste
183
Disability Data Review
The prevalence of disability (question type 1) in Trinidad and Tobago is 4.3%. Overall, 67% of children with disabilities have attended primary school, compared to 95% of children without disabilities. The largest gender disparity is at primary school 71% of girls with disabilities have completed primary education (95% for girls without disabilities), and this figure corresponds to 62% for boys with disabilities (94% for girls without disabilities). For secondary education, 53% of people with disabilities have attended secondary school, compared to 94% of people without disabilities. 5.6% of adults without disabilities and 3.3% of adults with a disability (25-54 years old) respectively have completed university, and the proportion of women (6.3% of those without disabilities and 4.6% of women with disabilities) who have completed university is higher than that of men (4.9% of those without disabilities and 2.2% for men with disabilities). When we consider youths, we observe that 17% of youths without disabilities and 20% of youths with disabilities are unemployed. These statistics correspond to 4.9% and 7.5% respectively for those who are 25 to 64 years of age. A 33 percentage point gap exists when we compare youths with and without disabilities who are not in education or employment (51% for youths with disabilities, compared with to 18% of those without disabilities). The proportion of men (25% of men without disabilities and 28% of men with disabilities) who work in informal sectors is twice that of women (12% and 14% respectively).
The prevalence of disability (question type 5) in Uganda is 6.5%. The comparison of school completion rates between Ugandans without disabilities and those with disabilities shows a 14, 6.1 and 7.2 percentage point gap respectively for primary education, secondary education and university (25-54 years old). For primary education the rates are 18% for children with disabilities, and 32% for children without disabilities and for secondary education the rates are 8.9% for people with disabilities compared to 15% for people without disabilities. For university, the rates are 3.8% for people with disabilities compared to 11% for people without disabilities. A comparison of unemployment rates between people with and without disabilities reveals a six percentage point gap for youths and a one percentage point gap for adults. This corresponds to 16% for youths without disabilities, compared to 22% for youths with disabilities and 10% of adults without disabilities and 11% of adults with disabilities. 58% and 46% of Ugandans without and with disabilities respectively (who are at
Trinidad and Tobago
Uganda

184
least 15 years old) are literate. Information about bank account ownership reveals that 15% and 14% of people with disabilities and those without disabilities respectively own a bank account. A three percentage point gap is observed in the male sample (19% and 22% for women with and without disabilities respectively), while a one percentage point gap is observed in the female sample (12% and 13% for women with and without disabilities respectively). Mobile phone ownership for people with disabilities is lower than that of people without disabilities, at 44% and 50% respectively. The proportion of females who own a mobile phone is lower regardless of disability status than men. 66% of men without disabilities and 53% of men with disabilities possess a mobile phone. These statistics correspond to 46% and 42% respectively in the female sample. Regarding the Internet, the proportion of men with disabilities (13%) who use the Internet is triple that of women with disabilities (4%). 27% and 10% of men and women without disabilities respectively use the Internet. The figures for health insurance is very low, with 0.4% and 0.6% of people without and with disabilities respectively are covered by health insurance provided by mutual/community organisations. These figures correspond to 0.9% and 0.5% respectively when we focus on health insurance provided by employers. In general women are more exposed to violence than men; 40% of women without a disability and 47% of women with disabilities have experienced violence, and these statistics correspond to 37% and 46% respectively in the male sample.
The prevalence of disability (question type 4) in Uruguay is 5.2%. For completion of primary education, results reveal a gap between children with and without disabilities. 97% of children without disabilities have completed primary school compared with 52% of children with disabilities. A gender based analysis reveals that 98% of girls without disabilities and 59% of those with disabilities have completed primary school; these statistics correspond respectively to 96% and 47% respectively in the male sample. 20% of girls with disabilities have graduated from secondary school, compared to 44% of girls without a disability. 8% of boys with disabilities have completed secondary school, compared with 32% of boys without disabilities. Those without a disability who are younger than 25 years of age are all literate, while 69% of their peers with disabilities have functional literacy skills. A six percentage point gap exists between the university completion rates of people with and without disabilities who
Uruguay
185
Disability Data Review
are 25 to 64 years of age (8.5% of persons without disabilities compared to 2.5% of people with disabilities). When we consider adults, we observe that 99% of those without disabilities and 90% of people with disabilities are literate. A 4.7 percentage point gap is observed when we compare the unemployment rates of people with and without disabilities (9% and 4.3% for adults with and without disability respectively). This figure corresponds to seven percentage points when we consider the sample of youths (24% of people with disabilities, compared to 17% of people without disabilities). In Uruguay 49% of youths with disabilities and 19% of youths without disabilities are neither in education, nor in employment.
The prevalence rate of disability (question type 5) in Vietnam is 1.7%. A 72 percentage point gap is observed when we compare primary school completion rates of people with disabilities (92%) and that of people without disabilities (20%). This figure corresponds to 28 percentage points when we consider secondary school completion rates (34% for people without disabilities, and 5.8% for people with disabilities). 36% of youths without disabilities and 6% of youths with disabilities participate in education/training; these statistics correspond to 1% and 0.1% when we focus on those who are at least 25 years of age. A 6.2 percentage point gap is observed when we compare the university completion rates of people without disabilities (7.7%) and those with disabilities (1.5%) who are 25 to 54 years of age. In general, the proportion of men who are literate is higher than that of women and overall, people with disabilities are less literate than those without disabilities. For instance, when we consider those who are at least 15 years of age, we notice that 48% of women with disabilities and 72% of men with disabilities have functional literacy skills. These statistics correspond to 91% and 96% respectively when we consider people without disabilities. Concerning adult unemployment, we observe that 1.1% of those without disabilities and 2.1% of people with disabilities are unemployed. Data related to the labour market also show that 61% of people with disabilities work in informal sectors, and this figure corresponds to 46% for people without disabilities. A focus on the proportion of employed women at managerial positions reveals that 0.4% of women without disabilities and 0.3% of women with disabilities are managers.
Vietnam
186
The prevalence of disability (question type 1) on Yemen is 1.5%. Statistics on educational attainment in Yemen reveal that more than 80% of children have not completed primary or secondary education. 13% of children without disabilities and 10% of children with disabilities have completed primary education. Slightly more girls with disabilities (14%) have completed primary education than girls without disabilities (10%), however the opposite is true of the male sample, where 16% of boys without disabilities have completed primary education compared to 7% of boys with disabilities. At the secondary school level 12% of people without disabilities and 7.1% of people with disabilities have completed secondary schools. Regarding university completion rates, 8.6% of people without disabilities and 5.5% of people with disabilities have completed university. We observe that the proportion of men (25 - 54 years old) who have completed university is higher than that of women; 4% and 1.8% of women without and with disabilities respectively have completed university, and these figures correspond to 14% and 7.9% in the male sample. A seven percentage point gap is observed between the literacy rates of women with and without disabilities (42% for women without disabilities and 35% for women with disabilities). The proportion of women with disabilities who are unemployed (25-64) is 80%, while that of women without disabilities is 88%. Information about economic empowerment reveals that 37% of women without disabilities and 47% of women with disabilities work in informal sectors. Information on technology and innovation indicates that 81% of people without disabilities and 74% of people with disabilities live in a household that possesses a mobile phone. Regarding social protection, results show that 0.6% of women without disabilities and 0.3% of women with disabilities are covered by Social Security. The proportion of women with disabilities (1.5%) whose health insurance is provided by their employer is higher than that of women without disabilities (1.3%).
The prevalence of disability (question type 1) in Zambia is 2%. 77% of children without disabilities and 52% of children with disabilities have completed primary education. The gap between the genders is similar; with 50% of girls with disabilities have completed primary education compared to 77% of girls without disabilities. 54% of boys with disabilities have completed primary education, compared to 78% of boys without disabilities. A comparison of the secondary school completion rates of
Yemen
Zambia
187
Disability Data Review
people without disabilities (25%) and people with disabilities (12%) shows a 13 percentage point gap. The gap between boys with disabilities and boys with disabilities is larger than of girls with and without disabilities. 12% of girls with disabilities have completed secondary education, compared to 22% of girls without disabilities, whereas 11% of boys with disabilities have completed secondary school, compared to 29% of boys without disabilities. In general, the participation rates in education and training of people with disabilities is lower than that of people without disabilities (37% and 31% for women without and with disabilities respectively; 52% and 40% for men without and with disabilities respectively). Regarding university completion rates, results reveal that 1.2% and 0.8% of adults without and with disabilities respectively have completed university. A focus on the population who are at least 15 years of age reveals that 89% of men without disabilities and 74% of men with disabilities respectively are literate; these statistics correspond to 78% and 53% respectively when we consider the female sample. Unemployment rates for 15-25 year olds show that people with disabilities have a lower unemployment rate (9.8%) than persons without disabilities (16%), and this is also reflected for adults with disabilities, who have an unemployment rate of 5.4% compared to 7% of adults without disabilities. A nine percentage point gap is observed when we compare youths with (38%) and without disabilities (29%) who are not in education or employment. The proportion of people with disabilities (46% and 54% for women and men respectively) who work in informal sectors is higher than that of people without disabilities (41% and 48% for women and men respectively). 0.3% of employed women with disabilities are managers, and this figure corresponds to 0.6% for women without disabilities.
The prevalence of disability (question type 5) is 7% in Zimbabwe. Statistics on the literacy rate of those who are at least 15 years of age reveal that the proportion of people with disabilities who are literate is lower than those without disabilities. 73% and 91% of women with and without disabilities respectively are literate. These statistics correspond to 82% and 95% for men with and without disabilities respectively. 64% of households with persons with disability have a mobile phone; this statistic is higher at 73% for households without people with disabilities.18.3% and 20.9% of people with and without disabilities respectively live in households that have access to the Internet. Information about
Zimbabwe
188
violence is available only for people with disabilities. It reveals that 16% and 22% of women and men with disabilities respectively have experienced violence43 (however it is important to note that statistics are only provided for people with disabilities).
43. Statistics on violence are only provided for people with disabilities.
Chapter 3: Key findings
189
Disability Data Review
Chapter 4: Discussion and conclusion
189
190
This project collated disability disaggregated data using nationally representative datasets for 40 countries under a range of indicators relevant to the themes of the Global Disability Summit 2018 (Inclusive Education, Economic Empowerment, Stigma and Discrimination and Technology and Innovation).
As this report demonstrates there is data available, and disaggregation is possible. However, available data is widely scattered. To locate the numerous data sources consulted for this project required not only a careful review of national data sources and lists of surveys, census and other data collection instruments used by a wide variety of governments, UN agencies and researchers, but close consultation with a number of development partners, researchers and advocates. The lack of available, disaggregated data also constrained the choice of SDG indicators for this report, meaning that the parameters of the report were limited from the outset.
In moving forward, there is a need for centralised repositories – of which this Disability Data Portal is intended to be a good example. Such repositories are needed to make data easily available to individuals, organisations and advocates, because easy and open access to data is a crucial first step towards disability inclusion.
Whilst there are gaps in availability, overall a considerable amount of data exists, and it is improving in quality. Importantly, a consensus is emerging on using the Washington Group questions to identify people with disabilities, making it straightforward for countries to meet standards of international comparability. Out of the 16 indicators analysed for the 40 countries included in this report, we were able to measure a maximum of 14 using available datasets. The number of indicators for which data was available, or for which it was possible to calculate estimates for this report, varies by country from one (Myanmar) to 14 (Cambodia, Rwanda, Timor-Leste and Uganda).
Indicators related to education are more widely available across the countries and datasets considered; in contrast, data for indicators related to technology and innovation or stigma and discrimination is scarcer. In general, results show that people with disabilities are more disadvantaged than those without disabilities.
Discussion
Chapter 4: Discussion and conclusion

191
Disability Data Review
However, these overall conclusions, and all conclusions and reflections made in this report, must be caveated as there are number of limitations to the analysis presented. These are as follows:
• Availability of data: In some cases, disability disaggregated data was not available in the chosen countries for the indicators. For example, a number of countries did not have disability disaggregated data for the selected indicators on violence and technology. This limits the extent to which meaningful conclusions can be drawn.
• Date of data: Many of the available datasets that include disability disaggregated data are from surveys and censuses are not up to date, and may not reflect the situation in 2018.
• Ability to compare: Data sets presented in the report are not directly comparable, as data is drawn from different data sources (e.g. census or survey), uses different methodologies to measure disability, and covers different time periods. Practical issues around interviewer training and question translation also have an impact on the robustness and comparability of data within surveys.
• Methodological issues: The analysis of findings showed a range of quality of data. In those instances where data collection methodologies were unclear, the data set was excluded from this analysis.
• Verification: Due to the limited timeframe for preparing this analysis ahead of the Summit, the data calculations included in this report have not been verified by Country Governments or National Statistics Offices.
This is an on-going project and Leonard Cheshire would welcome hearing from Country Governments, National Statistics Offices or others who would like to further discuss verification after the Summit has taken place.
It is important for the methodology for data collection to be well understood so that analysis can be used appropriately. For example, when examining disaggregated indicators, it is important to note how people with disabilities are identified, e.g. what questions are asked and how they are administered.
192
For example, the measured prevalence of disability in Zambia rose from 2.0% to 8.5% once the question “do you have a disability?” was replaced by the Washington Group Short Set. This is important not only for prevalence estimates but also for monitoring the well-being of people with disabilities. If a country uses a question that only identifies people with severe disabilities (e.g. “Do you have a disability?”) then we expect that the measured gap in outcome indicators will be greater than for a country that identifies a broader range of people with activity limitations, if those with the most severe activity limitations tend to face more significant barriers to participation. Further to this, the analysis of the available data does not take into account ‘how’ the disability data was collected – for example, the extent to which enumerators were trained on the Washington Group Short Set protocols and how the Washington Group Short Set questions were translated, as this too can have a huge impact on data quality and comparability.
The data presented in this report is an important first step. Collection of quality, disaggregated data can inform inclusive policy making and programme implementation. Disaggregation tells us the extent and nature of exclusion, suggests areas of specific focus and informs programmes and policies to address gaps.
However, it does not tell us what the most important levers are for eliminating that exclusion. For that kind of policy development, other quantitative and qualitative data are needed, for example through dedicated disability surveys or inclusion of additional questions on barriers and enablers. Governments and other organisations that collect disability data must consider, plan and budget for routine collection, analysis and use of data to ensure that data has an impact on policy direction and inclusivity.
Chapter 4: Discussion and conclusion
193
Disability Data Review
Inclusive education
Under the education theme, five indicators were examined covering completion of primary and secondary education, participation in formal and non-formal education and training, university completion, participation in pre-primary organized learning and literacy rates. Disability disaggregated data on all five indicators was available for the majority of the countries. Out of the five educational related indicators, indicator 4.2.2 (participation in organized learning pre-primary age) was the most limited. In general results showed that people with disabilities are performing less well on all indicators. The analysis also noted some exceptions to this rule, for example in Gambia and Nigeria where primary education completion for children with disabilities was higher than children without disabilities. However, as noted above, these statistics were based on fewer than 50 unweighted observations.
A gender-based analysis of educational achievements reveals that the gap between males and females with a disability is not consistent. Furthermore, there are some cases where girls with disabilities outperform boys with disabilities (examples include South Africa for secondary school completion and Tanzania for primary school completion). It is important to note that overall, girls and boys with disabilities are not completing educational outcomes at the same rate as those without disabilities. However, in a number of countries where the overall development status of the population against these indicators was low, the gap between people with and without disabilities was relatively small. This is generally the case in the poorest countries such as South Sudan or Burkina Faso. According to the most recent UNDP report (2016) these two countries rank 181st and 185th respectively in terms of human development index. The ranking is based on 188 countries. This trend has been well articulated in a number of secondary sources. These demonstrate that in areas of high deprivation, living standards for the entire populations can be extremely poor (Mitra, 2013; Eide et al 2015; Groce and Kett, 2014), and therefore the gap in basic indicators such as education would naturally be smaller.
Analysis of results by theme
194
Economic empowerment
Five indicators were examined under this theme, relating to poverty, unemployment, youth participation in education, training or employment, informal employment and access to banking. Data availability under this indicator was more varied than education, with only five countries providing data for the indicator on bank accounts up to a maximum of 35 countries able to provide data on unemployment and youth. For indicator 1.2.1 (poverty) recent data was only available to calculate disaggregated indicators for Bangladesh; data for 13 further countries was drawn from a secondary source using slightly older data sources (Mitra et al., 2013). The analysis showed in general, people with disabilities were more likely to be living in poverty than people without disabilities. As with data on education, in some countries such as Burkina Faso, the gap was relatively small between people with and without disabilities. The causal link between disability and poverty has been well documented (DFID, 2000; Groce et al, 2011; Rohwerder, 2015; Palmer, 2011) and these results confirm the view that people with disabilities are vulnerable to experiencing lower living standards than the rest of the population.
The analysis of labour market indicators reveals that the majority of countries show higher unemployment rates for people with disabilities compared to people without disabilities. There are some countries where the opposite is true, for example Botswana and Timor-Leste, where unemployment is higher for people without disabilities compared to people with disabilities. Regardless of the disability status, countries with the highest unemployment rates are those where the ILO standard definition of unemployment is relaxed for the analysis. Thus, a comparison of countries based on indicator 8.5.2 should be taken cautiously. Nigeria has the highest proportion of unemployed adults with disabilities as well as the widest gap between adults with and without disabilities. The youth unemployment rate is on average higher than that of the adult population, regardless of the disability status. A gender-based comparison shows that the average gap between adult men with and without disabilities is twice the gap between adult women with and without disabilities. Yemen is the only country where more than three quarters of women with and without disabilities are unemployed. However, it is the only country that shows the highest gap in favour of women with a disability, meaning that
Chapter 4: Discussion and conclusion

195
Disability Data Review
women without disabilities are more likely to be unemployed than women with disabilities. People with disabilities who face educational exclusion often find that accessing work is challenging during adolescence and adulthood, having missed out key educational milestones (Rohwerder, 2014). As noted, this reinforces poverty within the population of people with disabilities.
Additionally, bank accounts are not a common possession for any individual in the five countries we could produce this indicator for. In Timor-Leste, Uganda and Bangladesh there was less than 1 percentage point difference in ownership between the population with and without a disability. Rwanda has the highest rate of bank account possession in both populations, with over 50% of both people with and without disabilities having one. Indeed, our analysis showed that in Rwanda, people with disabilities have a bank account (54%) at 3 percentage points higher than Rwandans without disabilities (51%).
Technology and innovation
Two indicators were examined under this theme. Disability disaggregated data was not available for the vast majority of countries as these questions are not often asked on the national surveys and censuses examined for this study. A maximum of 11 countries had data on internet use. Indicators on innovation and technology show that mobile phone ownership is higher amongst people with disabilities than internet access. South Africa had the highest mobile phone ownership among people with disabilities, where we see 92% ownership. Internet access for people with disabilities was generally low, with women with disabilities having markedly lower access than their male counterparts. The largest gap is observed in the Maldives with a 31 percentage point difference between men and women with disabilities. Although it was possible to calculate additional data at household level for these indicators, as mentioned earlier, household level data does not provide the full picture. Even if households with a person with a disability have access to the internet or mobile phones, this data cannot tell us if the household member with a disability has equal access to that technology. Unless data is collected at the individual as well as the household level, we may miss much important information about the lives of people with disabilities.
196
Stigma and discrimination
Under this theme four indicators were examined. Disability disaggregated data for indicators on social protection, violence and proportion of women in national parliaments were not widely available. A maximum of 29 countries were able to provide data on women with disabilities in managerial positions, whereas only 7 countries were able to provide data on violence. Although it is universally acknowledged that people with disabilities face stigma and discrimination, surprisingly few of the data sets collected directly address this – although inequities in access to education, employment are without doubt a by-product of this. Regarding indicators related to social protection, results show that on average the proportion of people with disabilities covered by a health insurance provided by the Social Security or mutual/community organisations is higher than that of people without disabilities. The opposite is observed when we consider health insurance provided by employers. Among the few countries that have information about health insurance, we observe that Rwanda is the only country where more than half of the population are covered by a health insurance (65% of people without disabilities and 70% of people with disabilities); this is explained by the measures implemented by this country to provide universal health coverage to its population. From the analysis, women with disabilities are less likely to be managers compared to women without disabilities. This indicator may benefit from additional age disaggregation. However, as the percentage of people who are managers is very small, further disaggregation may not be feasible for this dataset. Data on violence presents an unclear picture as very few of the country sources analysed included data on this indicator. For example, in Uganda people with disabilities (both male and female) are more at risk of experiencing violence than people without disabilities, whereas the opposite is true for Cambodia and Timor-Leste where the data indicates that women without disabilities are more at risk than women with disabilities. The data for Cambodia and Timor-Leste is particularly surprising as a number of secondary reviews of data on violence and people with disabilities have provided evidence that globally, people with disabilities are more at risk of experiencing violence than people without disabilities.
Chapter 4: Discussion and conclusion

197
Disability Data Review
Overall, this report demonstrates that a substantial amount of data on disability exists and it is improving in quality. We found data on disability prevalence for 37 of the 40 countries selected for analysis and believe that the other countries have similar data that we were not able to access. All countries had data available to enable calculation of disaggregated results for at least some of the indicators examined in this report.
The quality of the data is improving. More recent data tends to be of higher quality, for example data collected using the Washington Group questions. And while only 11 of 40 countries used these questions in their Labour Force Survey, over half took a functional based approach rather than a medical one. ILO and UNICEF are moving to use the Washington Group questions in a systematic way.
Disaggregating indicators is not difficult. In Uganda, for example, data was available to disaggregate 14 of the 16 indicators we investigated. Doing so does not require special surveys, but merely the addition of the Washington Group Short Set to existing data tools that are being used to track the SDGs.
Proper methodology is important. Both prevalence rates and comparisons of outcome gaps between people with and without disabilities are affected by how people with disabilities are identified in surveys and censuses.
The Washington Group questions provide a tested, internationally comparable method for identifying people with and without disabilities in surveys but must be implemented properly. This includes following the implementation and translation protocols. For children, the UNICEF/Washington Group module is preferred, and is currently being widely implemented (over 70 countries), though no results were available for this report.
Disaggregation is the first step. Disaggregation of indicators and estimating prevalence rates are very important for identifying exclusion and motivating, implementing, and monitoring progress. Increasingly, countries are moving towards utilising the Washington Group Questions to ensure data collected on people with disabilities is accurate and comparable.
Conclusion
198
Beyond disaggregation, it is also important for countries to collect data that identifies and prioritises the key barriers to inclusion, to maximise the effectiveness of policy and programmatic interventions. Tools available for this purpose include the World Health Organisation’s Model Disability Survey. However, the report also highlights the challenges in putting together a global picture of disability through a data mapping exercise, thanks to different data collection methodologies over a wide time period. Strong caveats often need to be applied when comparing data between the countries in the report. This is reflective of the situation of disability data globally. More needs to be done to harmonise methodologies and to have disability specific indicators.
Nevertheless, the findings are positive and show that data is there. Policy makers and implementers can no longer rely on lack of data being an insurmountable hurdle to meaningful inclusion. However, data collection and disaggregation is only the first step, as data must then be properly utilised by policy makers and other actors to ensure that disability inclusion is realised.
Furthermore, the data clearly shows that for the majority of countries people with disabilities are being left behind in key indicators. If the global community is to deliver on its commitment to ‘leave no one behind’, policy makers must ensure that people with disabilities are central to development processes in terms of policy development, monitoring and implementation. Data is an important contributor to this process.
Moving forward, Leonard Cheshire is committed to expanding the portal to encompass more countries and indicators through working with strategic partners to ensure it remains up to date and useful for a variety of actors, for as long as this is needed.
Next steps
Data collection methodology• Countries need to use methodologies that allow comparison
over time. The widely used Washington Group Questions provide a standardised methodology and allow internationally comparable data collection, providing a baseline on SDG and CRPD implementation. This methodology has been endorsed by many UN agencies, governments and civil society organisations. However, there are alternative methodologies
Chapter 4: Discussion and conclusion
199
Disability Data Review
available, such as the WHO Model Disability Survey. The UNSD is currently reviewing methodologies and considering next steps.
• The UN system and National Statistics Offices should take a leading role in coordinating efforts to ensure disability data disaggregation is undertaken in all national data collection exercises to ensure that ‘no one is left behind’.
• Donors should target support to strengthen national data collection systems, with an enhanced focus on disability in national surveys and censuses.
Disability-specific indicators • Countries need to generate appropriate indicators, including
disability-specific indicators outlined in the SDGs. All indicators should be disaggregated by disability status.
• States should also disaggregate all national indicators by disability in line with Article 31 of the CRPD to enable the collection of statistics and data to create and implement policies that fulfil the rights of people with disabilities.
Monitoring mechanisms• Good quality comparable data needs to be accompanied
by strong national compliance, grievance and enforcement mechanisms to support monitoring and implementation of laws, policies and regulations.
Further mapping and analysis• There is a need for further mapping and analysis to create
a comprehensive picture of disability data. More countries and indicators can be added to the portal, and more sources of data will be reviewed, especially as more data becomes available in the near future. For example, up to 70 MIC Surveys are expected to take place including the Child Functioning Module over the next three years. Several national disability surveys are currently underway, including in Thailand and Vietnam.
• Data outliers need investigating and analysing. Some countries have unexpected results, including little change in estimated disability prevalence even when the quality of questions is improved. It is important to determine whether the implementation protocols and translations were appropriate; following this, other factors – cultural and demographic – should be explored to account for the unexpected results, to better understand how and why disability prevalence may differ across countries.
200200
201
Disability Data Review
Altman, B. M. (2016). International measurement of disability. In Purpose, method and application. Springer International Publishing, Cham.
Arjumand and Associates (2004). Situation Analysis and National Plan of Action for People with Disabilities, Final Report.
Bangladesh Bureau of Statistics (2015). Report on Education Household Survey 2014.
Braithwaite, J., & Mont, D. (2009). Disability and poverty: a survey of World Bank poverty assessments and implications. ALTER-European Journal of Disability Research/Revue Européenne de Recherche sur le Handicap, 3(3), 219-232.
Cappa, C., Petrowski, N., & Njelesani, J. (2015). Navigating the landscape of child disability measurement: A review of available data collection instruments. ALTER-European Journal of Disability Research/Revue Européenne de Recherche sur le Handicap, 9(4), 317-330.
DFID (2000). Disability, poverty and development, An Issues Paper, London, DFID.
Eide, A. H., Mannan, H., Khogali, M., Van Rooy, G., Swartz, L., Munthali, A., & Dyrstad, K. (2015). Perceived barriers for accessing health services among individuals with disability in four African countries. PLoS One, 10(5), e0125915.
Golden, C. (2016). Washington Group Meetings, Processes and Milestones. In International Measurement of Disability (pp. 29-52). Springer, Cham.
Groce, N., Bakhshi, P. (2009). Illiteracy among Adults with Disabilities in the Developing World: An Unexplored Area of Concern. Leonard Cheshire Disability and Inclusive Development Centre working paper series no. 9. London: LCDIDC.
Groce, N., Kembhavi, G., Wirz, S.,Lang, R., Trani, J., Kett, M. (2011). Poverty and Disability: a critical review of the literature in low and middle-income countries. Leonard Cheshire Disability and Inclusive Development Centre working paper series no. 16. London: LCDIDC.
References

202
Groce N, Kett M (2014). The Disability and Development Gap. Working Paper No. 21. London: Leonard Cheshire Disability and Inclusive Development Centre. University College London.Groce, N. E., London, J., & Stein, M. A. (2014). Inheritance, poverty, and disability. Disability & Society, 29(10), 1554-1568.
Ingstad, B., & Eide, A. (2011). Disability and poverty: A global challenge. Policy Press.
Ingstad, B., & Whyte, S. R. (Eds.). (1995). Disability and culture. Univ of California Press.
Leonard Cheshire, (forthcoming). Disability Data in the International Development Sphere. Leonard Cheshire Research Centre.
Loeb, M. E., Eide, A. H., & Mont, D. (2008). Approaching the measurement of disability prevalence: the case of Zambia. ALTER-European Journal of Disability Research/Revue Européenne de Recherche sur le Handicap, 2(1), 32-43.
Mani, S., Mitra, S. and Sambamoorthi, U. (Forthcoming). Transitions in Health and Employment: New Evidence from Indonesia. World Development.
Me, A., & Mbogoni, M. (2006). Review of practices in less developed countries on the collection of disability data. In International Views on Disability Measures: Moving toward Comparative Measurement (pp. 63-87). Emerald Group Publishing Limited.
Miller, G. (2006). The unseen: mental illness's global toll. Science.
Ministry of Education, Republic of Ghana (2013). Draft Inclusive Education Policy.www.voiceghana.org/downloads/MoE_IE_Policy_Final_Draft1.pdf
Mitra, S. (2017). Disability, Health and Human Development. Palgrave Pivot.
Mitra, S., & Sambamoorthi, U. (2014). Disability prevalence among adults: estimates for 54 countries and progress toward a global estimate. Disability and rehabilitation, 36(11), 940-947.
Mitra, S., Posarac, A., & Vick, B. (2013). Disability and poverty in developing countries: a multidimensional study. World Development, 41, 1-18.
References

203
Disability Data Review
Mizunoya, S., & Mitra, S. (2013). Is there a disability gap in employment rates in developing countries? World Development, 42, 28-43.
Mizunoya, S., Mitra, S., & Yamasaki, I. (2018). Disability and school attendance in 15 low-and middle-income countries. World Development, 104, 388-403.
Mont, D. (2007). Measuring disability prevalence (p. 1). Special Protection, World Bank.
Mont, D., & Cuong, N. V. (2011). Disability and poverty in Vietnam. The World Bank Economic Review, 25(2), 323-359.
Mwendwa, T. N., Murangira, A., & Lang, R. (2009). Mainstreaming the rights of people with disabilities in national development frameworks. Journal of International Development: The Journal of the Development Studies Association, 21(5), 662-672.
Myanmar Department of Social Welfare (2010). First Myanmar National Disability Survey 2010. http://themimu.info/sites/themimu.info/files/documents/Report_First_Myanmar_National_Disability_Survey_GovtofMyanmar_2010.pdf
Neille, J., & Penn, C. (2017). The interface between violence, disability, and poverty: Stories from a developing country. Journal of interpersonal violence, 32(18), 2837-2861.
Palmer, M. (2011). Disability and poverty: A conceptual review. Journal of Disability Policy Studies, 21(4), 210-218.
Palmer, M., & Harley, D. (2011). Models and measurement in disability: an international review. Health Policy and Planning, 27(5), 357-364.
Rohwerder, B. (2015). Disability inclusion: Topic guide. Birmingham, UK: GSDRC, University of Birmingham.
Tareque, M. I., Begum, S., & Saito, Y. (2014). Inequality in disability in Bangladesh. PLoS One, 9(7), e103681.
UN Economic and Social Council (2008). Mainstreaming disability in the development agenda. Commission for Social Development, Note by the Secretariat.
204
United Nations Economic and Social Commission for Asia and the Pacific (2018). Building disability inclusive society in Asia and the Pacific, assessing progress of the Incheon strategy. http://www.unescap.org/publications/building-disability-inclusive-societies-asia-and-pacific-assessing-progress-incheon
UNICEF (2012). Disabilities, Education. www.unicef.org/disabilities/index_65316.html?p=printme
Van Brakel, W. H., & Officer, A. (2008). Approaches and tools for measuring disability in low and middle-income countries. Lepr Rev, 79(1), 50-64.
The Washington Group on Disability Statistics. (July 2016). Report of Ability of Countries to Disaggregate SDG Indicators by Disability. www.washingtongroup-disability.com/publications/reports-white-papers
World Health Organization (2018). Mental Disorders Key Facts. 9 April 2018. www.who.int/news-room/fact-sheets/detail/mental-disorders
World Health Organization (2002-2004). World Health Survey.
World Health Organization, World Bank (2011). World Report on Disability.
Yeo, R., & Moore, K. (2003). Including disabled people in poverty reduction work:“ Nothing about us, without us”. World Development, 31(3), 571-590.
References
205
Disability Data Review
Appendices
205
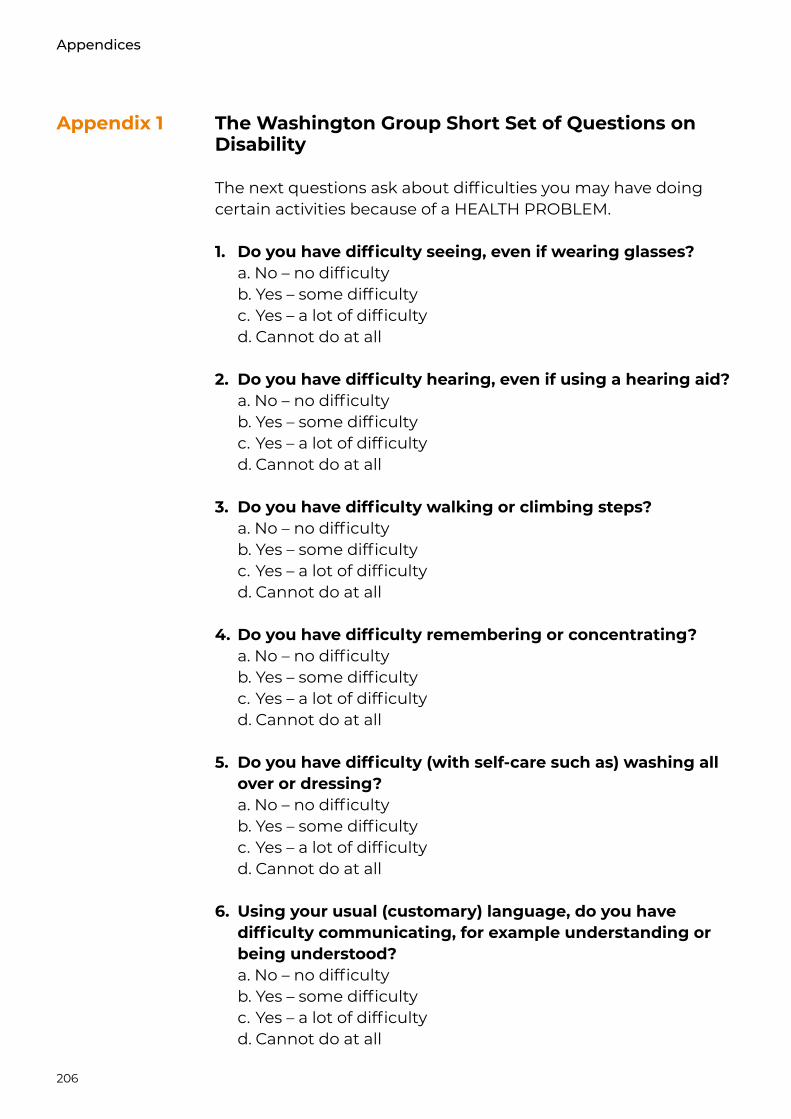
206
The Washington Group Short Set of Questions on Disability
The next questions ask about difficulties you may have doing certain activities because of a HEALTH PROBLEM.
1. Do you have difficulty seeing, even if wearing glasses?a. No – no difficultyb. Yes – some difficultyc. Yes – a lot of difficultyd. Cannot do at all
2. Do you have difficulty hearing, even if using a hearing aid?a. No – no difficultyb. Yes – some difficultyc. Yes – a lot of difficultyd. Cannot do at all
3. Do you have difficulty walking or climbing steps?a. No – no difficultyb. Yes – some difficultyc. Yes – a lot of difficultyd. Cannot do at all
4. Do you have difficulty remembering or concentrating?a. No – no difficultyb. Yes – some difficultyc. Yes – a lot of difficultyd. Cannot do at all
5. Do you have difficulty (with self-care such as) washing all over or dressing?a. No – no difficultyb. Yes – some difficultyc. Yes – a lot of difficultyd. Cannot do at all
6. Using your usual (customary) language, do you have difficulty communicating, for example understanding or being understood?a. No – no difficultyb. Yes – some difficultyc. Yes – a lot of difficultyd. Cannot do at all
Appendix 1
Appendices
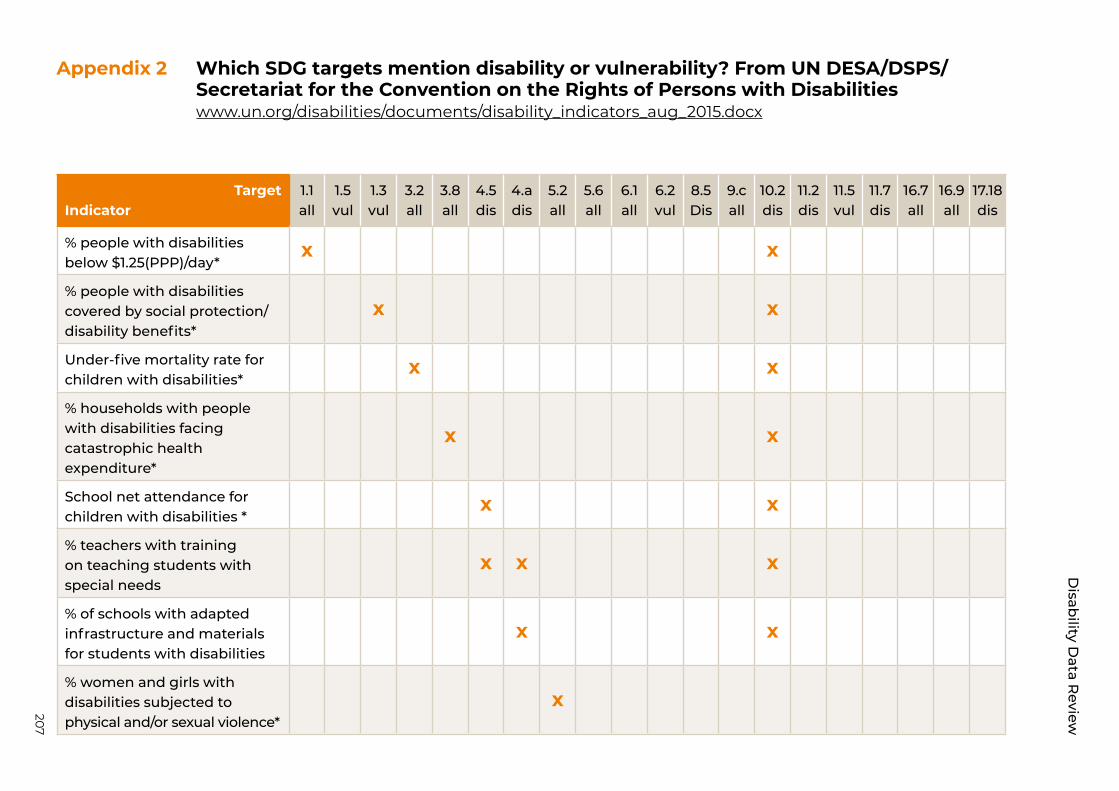
207
Disab
ility Data R
eview
Which SDG targets mention disability or vulnerability? From UN DESA/DSPS/Secretariat for the Convention on the Rights of Persons with Disabilities www.un.org/disabilities/documents/disability_indicators_aug_2015.docx
Appendix 2
TargetIndicator
1.1all
1.5vul
1.3vul
3.2all
3.8all
4.5dis
4.adis
5.2all
5.6all
6.1all
6.2vul
8.5Dis
9.call
10.2dis
11.2dis
11.5vul
11.7dis
16.7all
16.9all
17.18dis
% people with disabilities below $1.25(PPP)/day*
x x
% people with disabilities covered by social protection/disability benefits*
x x
Under-five mortality rate for children with disabilities*
x x
% households with people with disabilities facing catastrophic health expenditure*
x x
School net attendance for children with disabilities *
x x
% teachers with training on teaching students with special needs
x x x
% of schools with adapted infrastructure and materials for students with disabilities
x x
% women and girls with disabilities subjected to physical and/or sexual violence*
x
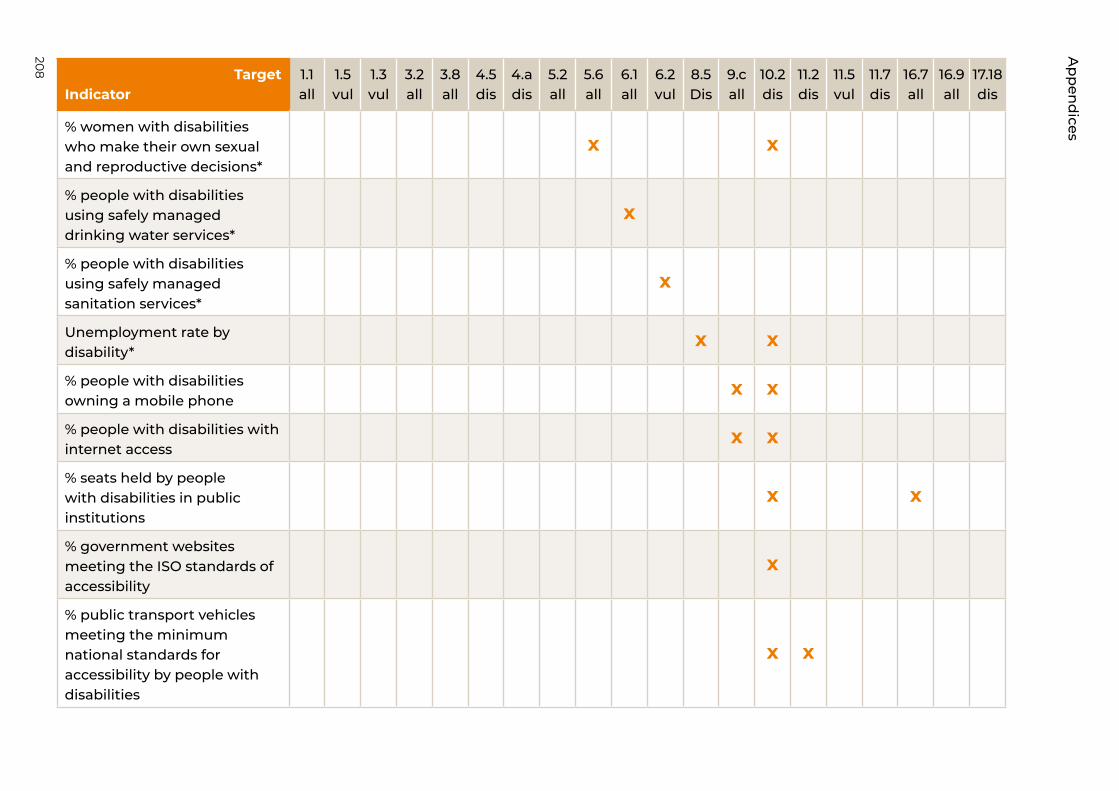
208 TargetIndicator
1.1all
1.5vul
1.3vul
3.2all
3.8all
4.5dis
4.adis
5.2all
5.6all
6.1all
6.2vul
8.5Dis
9.call
10.2dis
11.2dis
11.5vul
11.7dis
16.7all
16.9all
17.18dis
% women with disabilities who make their own sexual and reproductive decisions*
x x
% people with disabilities using safely managed drinking water services*
x
% people with disabilities using safely managed sanitation services*
x
Unemployment rate by disability*
x x
% people with disabilities owning a mobile phone
x x
% people with disabilities with internet access
x x
% seats held by people with disabilities in public institutions
x x
% government websites meeting the ISO standards of accessibility
x
% public transport vehicles meeting the minimum national standards for accessibility by people with disabilities
x x
Ap
pen
dices
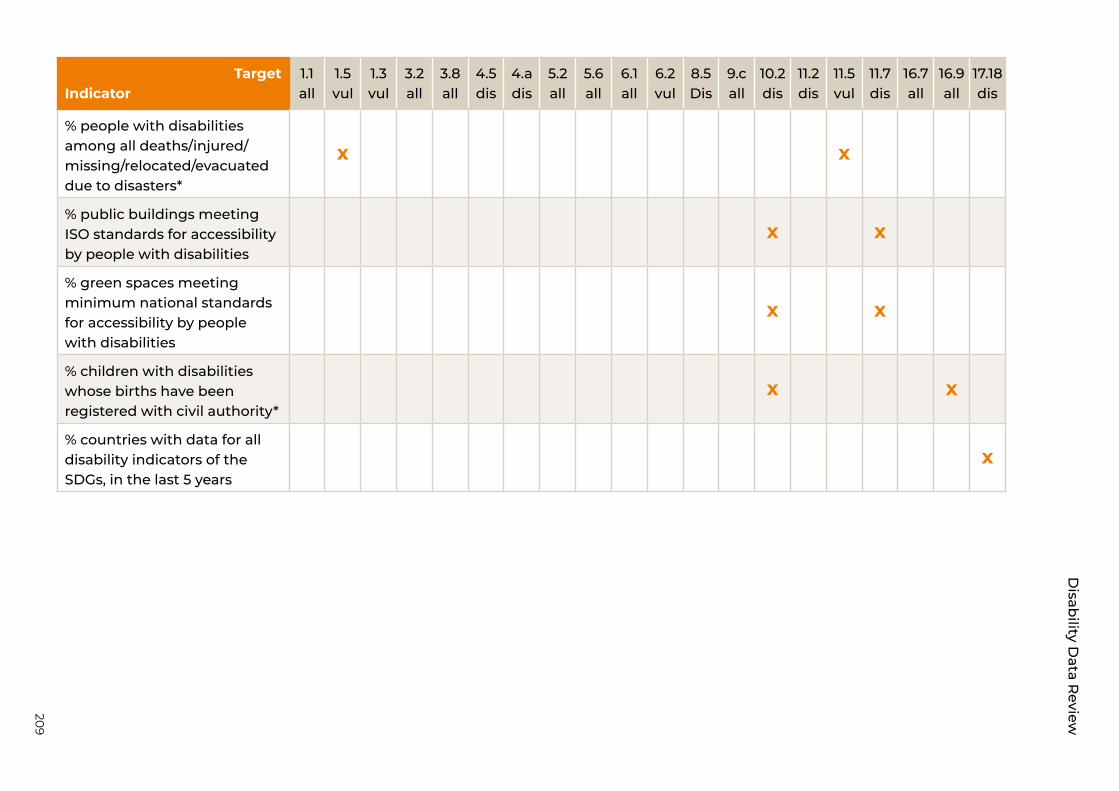
209
Disab
ility Data R
eview
TargetIndicator
1.1all
1.5vul
1.3vul
3.2all
3.8all
4.5dis
4.adis
5.2all
5.6all
6.1all
6.2vul
8.5Dis
9.call
10.2dis
11.2dis
11.5vul
11.7dis
16.7all
16.9all
17.18dis
% women with disabilities who make their own sexual and reproductive decisions*
x x
% people with disabilities using safely managed drinking water services*
x
% people with disabilities using safely managed sanitation services*
x
Unemployment rate by disability*
x x
% people with disabilities owning a mobile phone
x x
% people with disabilities with internet access
x x
% seats held by people with disabilities in public institutions
x x
% government websites meeting the ISO standards of accessibility
x
% public transport vehicles meeting the minimum national standards for accessibility by people with disabilities
x x
TargetIndicator
1.1all
1.5vul
1.3vul
3.2all
3.8all
4.5dis
4.adis
5.2all
5.6all
6.1all
6.2vul
8.5Dis
9.call
10.2dis
11.2dis
11.5vul
11.7dis
16.7all
16.9all
17.18dis
% people with disabilities among all deaths/injured/missing/relocated/evacuated due to disasters*
x x
% public buildings meeting ISO standards for accessibility by people with disabilities
x x
% green spaces meeting minimum national standards for accessibility by people with disabilities
x x
% children with disabilities whose births have been registered with civil authority*
x x
% countries with data for all disability indicators of the SDGs, in the last 5 years
x

210 Number of indicators by countryAppendix 3
Inclusive education
Economic empowerment
Technology& innovation
Stigma & discrimination
Country 4.1.x 4.3.1 4.5.x 4.6.1(a) 4.2.2 1.2.1 8.5.2 8.6.1 8.3.x 8.10.2 5.b.1 17.8.1 1.3.1 16.1.3 5.5.1(a) 5.5.2 Total
Albania Y Y Y Y Y Y Y Y Y Y 10
Bangladesh Y Y Y Y Y Y Y Y 8
Botswana Y Y Y Y Y Y Y Y 8
Burkina Faso Y Y Y Y Y Y Y Y Y 9
Cambodia Y Y Y Y Y Y Y Y Y Y Y Y Y Y 14
Cameroon Y Y Y Y Y Y Y Y Y Y Y Y Y 13
Chad Y Y Y Y Y Y Y Y Y Y Y 11
Colombia Y Y Y Y Y Y Y Y Y Y 10
Costa Rica Y Y Y Y Y Y Y Y Y 9
Dominican Republic
Y Y Y Y Y Y Y Y Y Y 10
Ecuador Y Y Y Y Y Y Y Y Y 9
Egypt Y Y Y Y Y Y Y Y 8
El Salvador Y Y Y Y Y Y Y Y Y 9
Gambia Y Y Y Y Y Y Y Y Y Y Y Y 12
Ghana Y Y Y Y Y Y Y Y Y Y 10
India Y Y 2
Kenya Y Y Y Y Y Y Y Y 8
Liberia Y Y Y Y Y Y Y Y Y 9
Ap
pen
dices
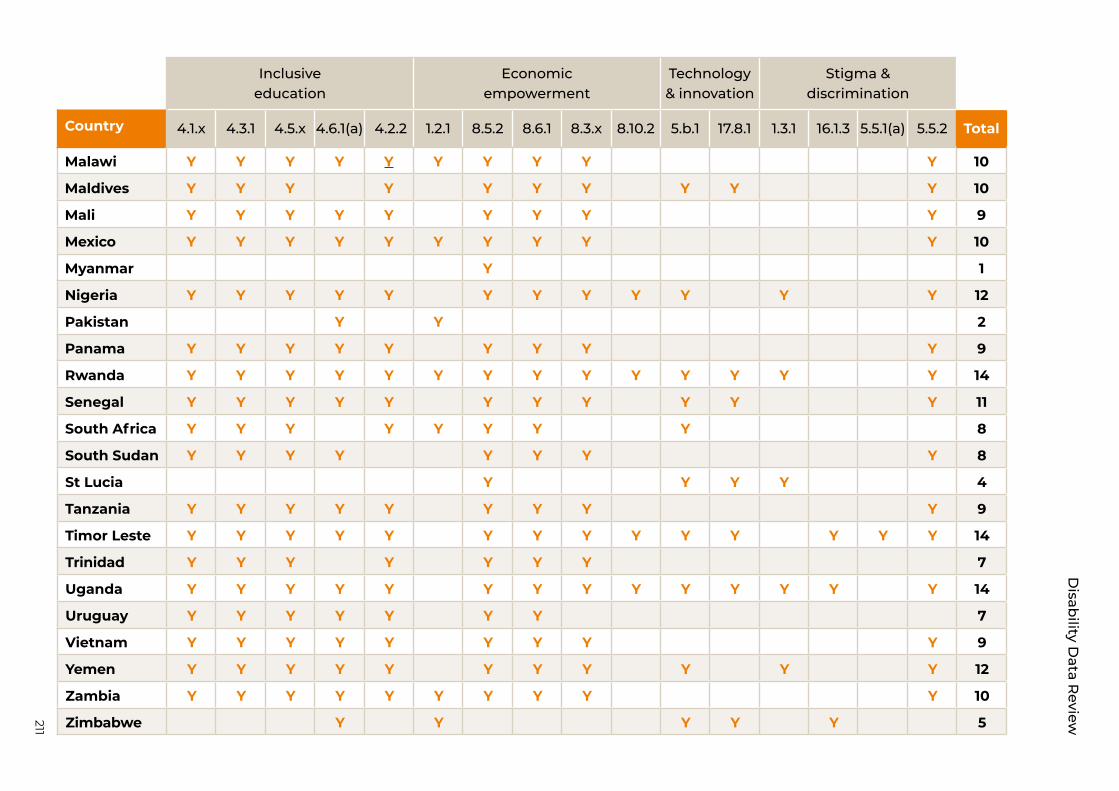
211
Disab
ility Data R
eview
Inclusive education
Economic empowerment
Technology& innovation
Stigma & discrimination
Country 4.1.x 4.3.1 4.5.x 4.6.1(a) 4.2.2 1.2.1 8.5.2 8.6.1 8.3.x 8.10.2 5.b.1 17.8.1 1.3.1 16.1.3 5.5.1(a) 5.5.2 Total
Malawi Y Y Y Y Y Y Y Y Y Y 10
Maldives Y Y Y Y Y Y Y Y Y Y 10
Mali Y Y Y Y Y Y Y Y Y 9
Mexico Y Y Y Y Y Y Y Y Y Y 10
Myanmar Y 1
Nigeria Y Y Y Y Y Y Y Y Y Y Y Y 12
Pakistan Y Y 2
Panama Y Y Y Y Y Y Y Y Y 9
Rwanda Y Y Y Y Y Y Y Y Y Y Y Y Y Y 14
Senegal Y Y Y Y Y Y Y Y Y Y Y 11
South Africa Y Y Y Y Y Y Y Y 8
South Sudan Y Y Y Y Y Y Y Y 8
St Lucia Y Y Y Y 4
Tanzania Y Y Y Y Y Y Y Y Y 9
Timor Leste Y Y Y Y Y Y Y Y Y Y Y Y Y Y 14
Trinidad Y Y Y Y Y Y Y 7
Uganda Y Y Y Y Y Y Y Y Y Y Y Y Y Y 14
Uruguay Y Y Y Y Y Y Y 7
Vietnam Y Y Y Y Y Y Y Y Y 9
Yemen Y Y Y Y Y Y Y Y Y Y Y 12
Zambia Y Y Y Y Y Y Y Y Y Y 10
Zimbabwe Y Y Y Y Y 5
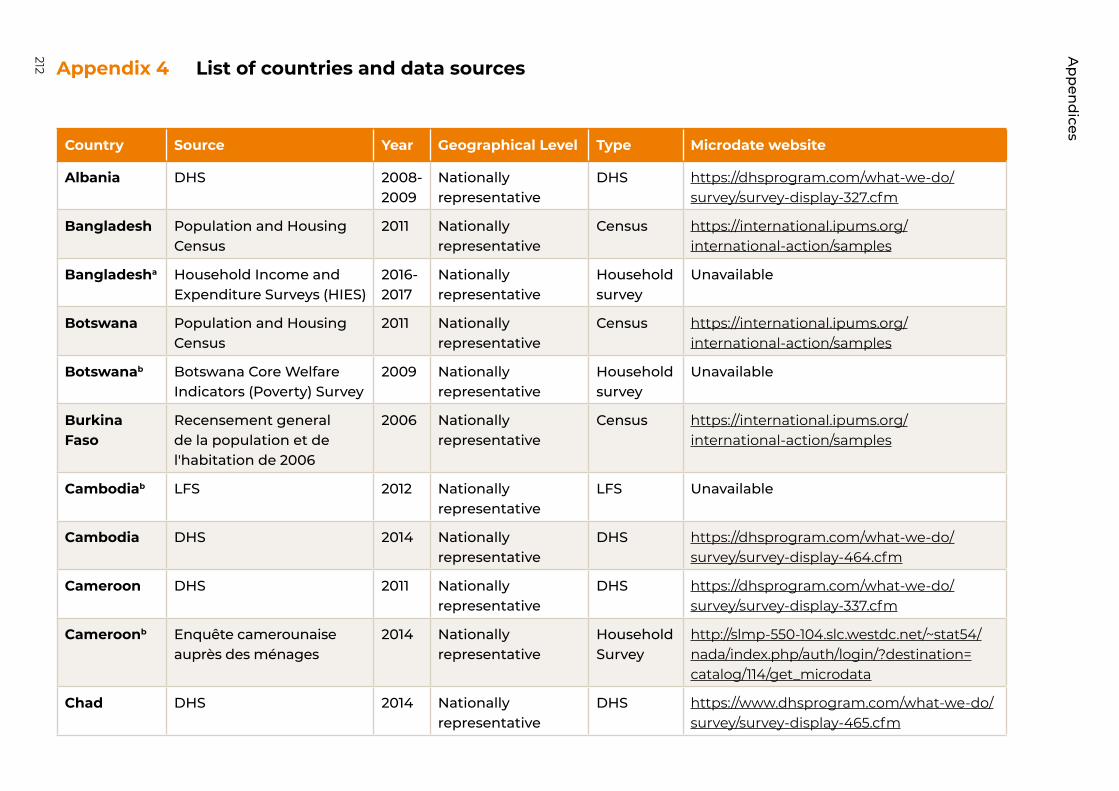
212 List of countries and data sourcesAppendix 4
Country Source Year Geographical Level Type Microdate website
Albania DHS 2008-2009
Nationally representative
DHS https://dhsprogram.com/what-we-do/survey/survey-display-327.cfm
Bangladesh Population and Housing Census
2011 Nationally representative
Census https://international.ipums.org/international-action/samples
Bangladesha Household Income and Expenditure Surveys (HIES)
2016-2017
Nationally representative
Household survey
Unavailable
Botswana Population and Housing Census
2011 Nationally representative
Census https://international.ipums.org/international-action/samples
Botswanab Botswana Core Welfare Indicators (Poverty) Survey
2009 Nationally representative
Household survey
Unavailable
Burkina Faso
Recensement general de la population et de l'habitation de 2006
2006 Nationally representative
Census https://international.ipums.org/international-action/samples
Cambodiab LFS 2012 Nationally representative
LFS Unavailable
Cambodia DHS 2014 Nationally representative
DHS https://dhsprogram.com/what-we-do/survey/survey-display-464.cfm
Cameroon DHS 2011 Nationally representative
DHS https://dhsprogram.com/what-we-do/survey/survey-display-337.cfm
Cameroonb Enquête camerounaise auprès des ménages
2014 Nationally representative
Household Survey
http://slmp-550-104.slc.westdc.net/~stat54/nada/index.php/auth/login/?destination=catalog/114/get_microdata
Chad DHS 2014 Nationally representative
DHS https://www.dhsprogram.com/what-we-do/survey/survey-display-465.cfm
Ap
pen
dices
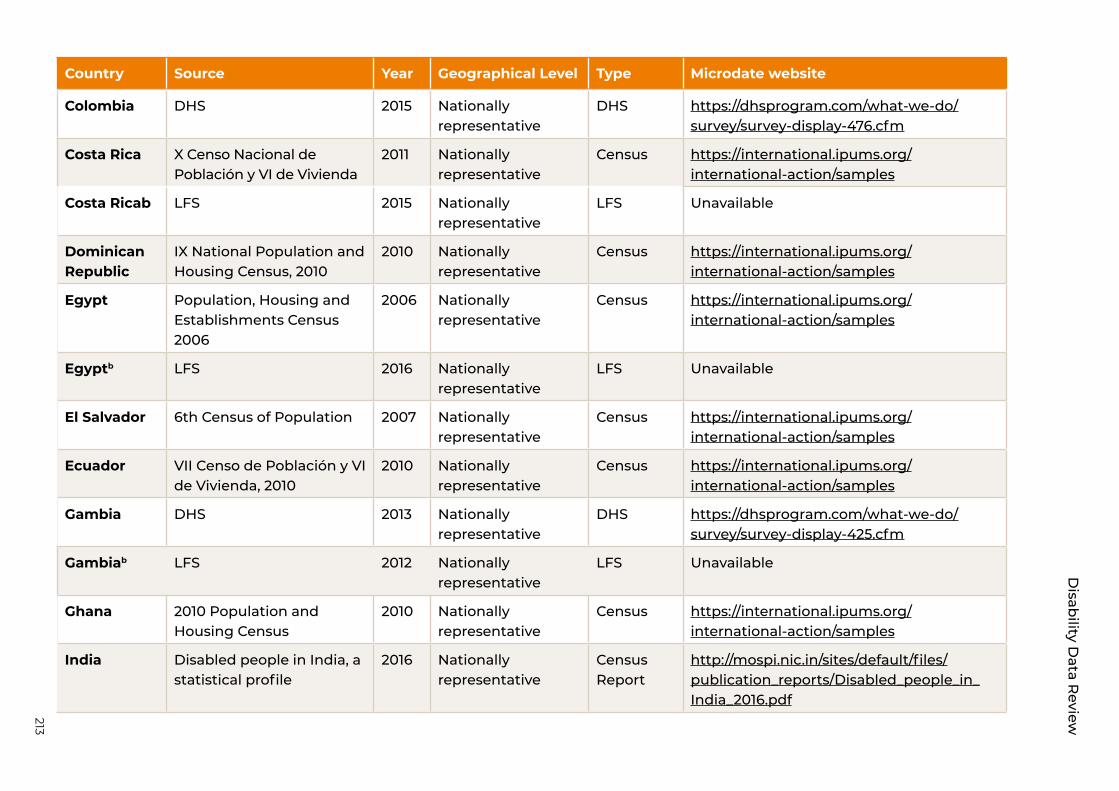
213
Disab
ility Data R
eview
Country Source Year Geographical Level Type Microdate website
Albania DHS 2008-2009
Nationally representative
DHS https://dhsprogram.com/what-we-do/survey/survey-display-327.cfm
Bangladesh Population and Housing Census
2011 Nationally representative
Census https://international.ipums.org/international-action/samples
Bangladesha Household Income and Expenditure Surveys (HIES)
2016-2017
Nationally representative
Household survey
Unavailable
Botswana Population and Housing Census
2011 Nationally representative
Census https://international.ipums.org/international-action/samples
Botswanab Botswana Core Welfare Indicators (Poverty) Survey
2009 Nationally representative
Household survey
Unavailable
Burkina Faso
Recensement general de la population et de l'habitation de 2006
2006 Nationally representative
Census https://international.ipums.org/international-action/samples
Cambodiab LFS 2012 Nationally representative
LFS Unavailable
Cambodia DHS 2014 Nationally representative
DHS https://dhsprogram.com/what-we-do/survey/survey-display-464.cfm
Cameroon DHS 2011 Nationally representative
DHS https://dhsprogram.com/what-we-do/survey/survey-display-337.cfm
Cameroonb Enquête camerounaise auprès des ménages
2014 Nationally representative
Household Survey
http://slmp-550-104.slc.westdc.net/~stat54/nada/index.php/auth/login/?destination=catalog/114/get_microdata
Chad DHS 2014 Nationally representative
DHS https://www.dhsprogram.com/what-we-do/survey/survey-display-465.cfm
Country Source Year Geographical Level Type Microdate website
Colombia DHS 2015 Nationally representative
DHS https://dhsprogram.com/what-we-do/survey/survey-display-476.cfm
Costa Rica X Censo Nacional de Población y VI de Vivienda
2011 Nationally representative
Census https://international.ipums.org/international-action/samples
Costa Ricab LFS 2015 Nationally representative
LFS Unavailable
Dominican Republic
IX National Population and Housing Census, 2010
2010 Nationally representative
Census https://international.ipums.org/international-action/samples
Egypt Population, Housing and Establishments Census 2006
2006 Nationally representative
Census https://international.ipums.org/international-action/samples
Egyptb LFS 2016 Nationally representative
LFS Unavailable
El Salvador 6th Census of Population 2007 Nationally representative
Census https://international.ipums.org/international-action/samples
Ecuador VII Censo de Población y VI de Vivienda, 2010
2010 Nationally representative
Census https://international.ipums.org/international-action/samples
Gambia DHS 2013 Nationally representative
DHS https://dhsprogram.com/what-we-do/survey/survey-display-425.cfm
Gambiab LFS 2012 Nationally representative
LFS Unavailable
Ghana 2010 Population and Housing Census
2010 Nationally representative
Census https://international.ipums.org/international-action/samples
India Disabled people in India, a statistical profile
2016 Nationally representative
Census Report
http://mospi.nic.in/sites/default/files/publication_reports/Disabled_people_in_India_2016.pdf
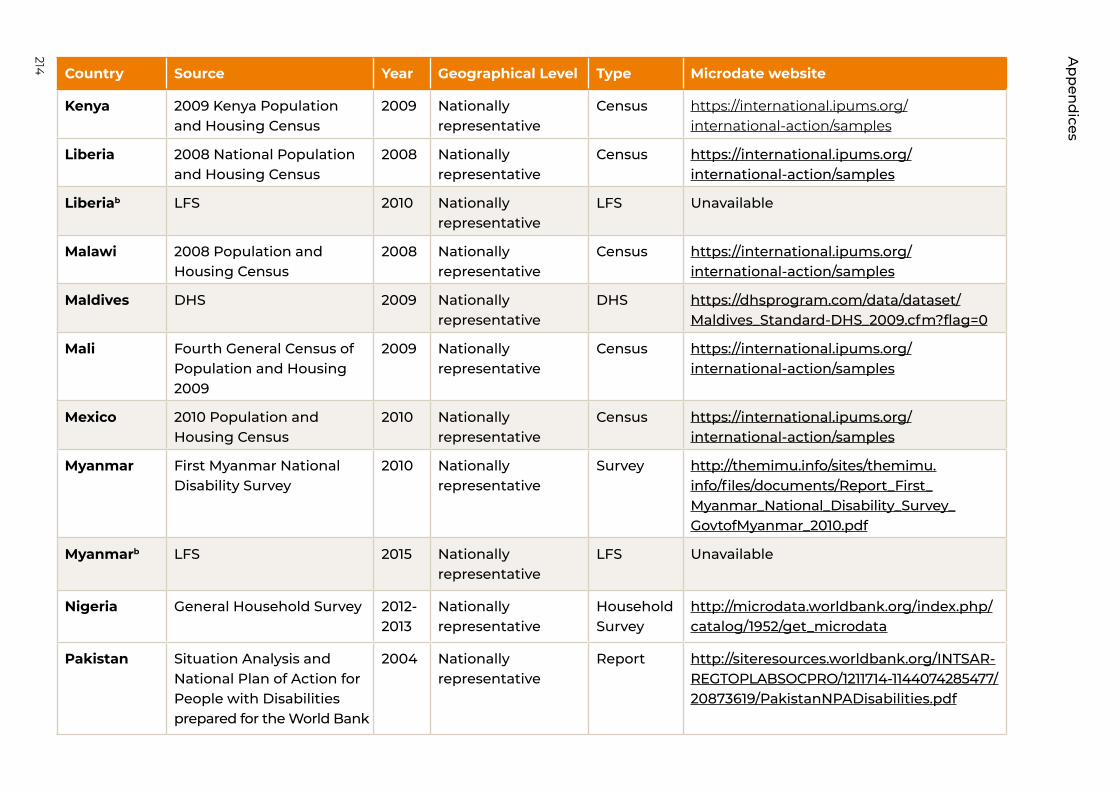
214
Country Source Year Geographical Level Type Microdate website
Kenya 2009 Kenya Population and Housing Census
2009 Nationally representative
Census https://international.ipums.org/international-action/samples
Liberia 2008 National Population and Housing Census
2008 Nationally representative
Census https://international.ipums.org/international-action/samples
Liberiab LFS 2010 Nationally representative
LFS Unavailable
Malawi 2008 Population and Housing Census
2008 Nationally representative
Census https://international.ipums.org/international-action/samples
Maldives DHS 2009 Nationally representative
DHS https://dhsprogram.com/data/dataset/Maldives_Standard-DHS_2009.cfm?flag=0
Mali Fourth General Census of Population and Housing 2009
2009 Nationally representative
Census https://international.ipums.org/international-action/samples
Mexico 2010 Population and Housing Census
2010 Nationally representative
Census https://international.ipums.org/international-action/samples
Myanmar First Myanmar National Disability Survey
2010 Nationally representative
Survey http://themimu.info/sites/themimu.info/files/documents/Report_First_Myanmar_National_Disability_Survey_GovtofMyanmar_2010.pdf
Myanmarb LFS 2015 Nationally representative
LFS Unavailable
Nigeria General Household Survey 2012-2013
Nationally representative
Household Survey
http://microdata.worldbank.org/index.php/catalog/1952/get_microdata
Pakistan Situation Analysis and National Plan of Action for People with Disabilities prepared for the World Bank
2004 Nationally representative
Report http://siteresources.worldbank.org/INTSAR-REGTOPLABSOCPRO/1211714-1144074285477/20873619/PakistanNPADisabilities.pdf
Ap
pen
dices
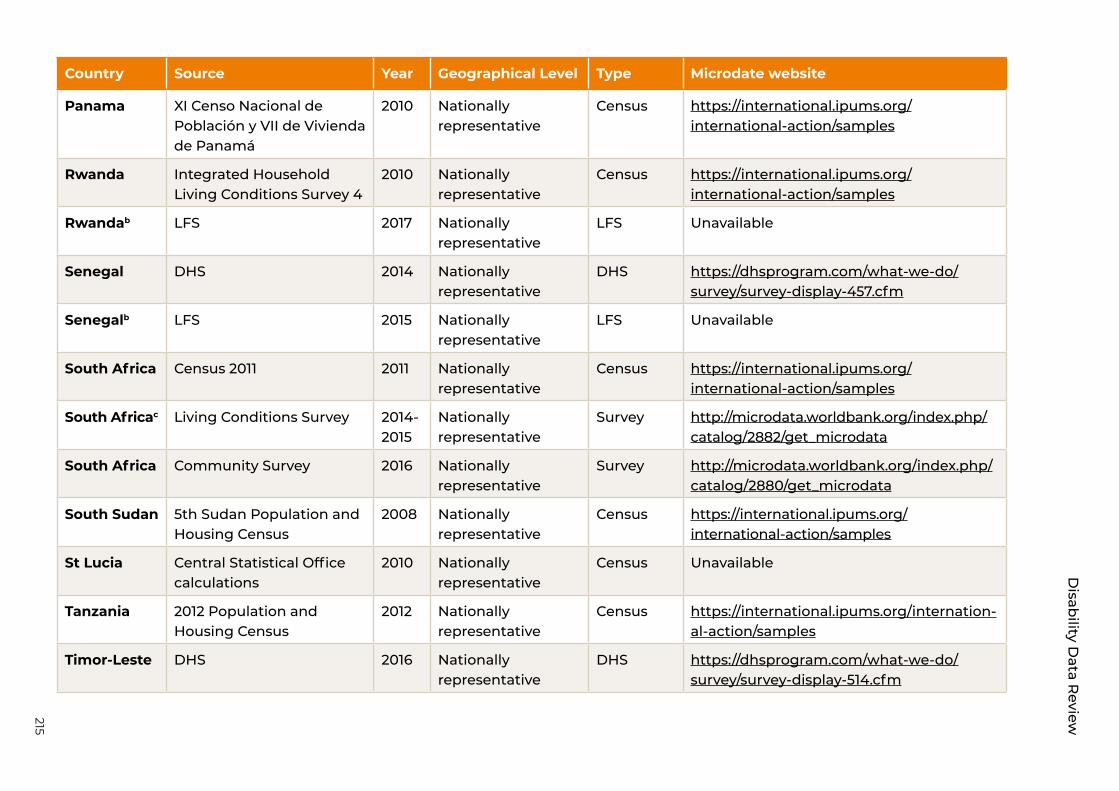
215
Disab
ility Data R
eview
Country Source Year Geographical Level Type Microdate website
Kenya 2009 Kenya Population and Housing Census
2009 Nationally representative
Census https://international.ipums.org/international-action/samples
Liberia 2008 National Population and Housing Census
2008 Nationally representative
Census https://international.ipums.org/international-action/samples
Liberiab LFS 2010 Nationally representative
LFS Unavailable
Malawi 2008 Population and Housing Census
2008 Nationally representative
Census https://international.ipums.org/international-action/samples
Maldives DHS 2009 Nationally representative
DHS https://dhsprogram.com/data/dataset/Maldives_Standard-DHS_2009.cfm?flag=0
Mali Fourth General Census of Population and Housing 2009
2009 Nationally representative
Census https://international.ipums.org/international-action/samples
Mexico 2010 Population and Housing Census
2010 Nationally representative
Census https://international.ipums.org/international-action/samples
Myanmar First Myanmar National Disability Survey
2010 Nationally representative
Survey http://themimu.info/sites/themimu.info/files/documents/Report_First_Myanmar_National_Disability_Survey_GovtofMyanmar_2010.pdf
Myanmarb LFS 2015 Nationally representative
LFS Unavailable
Nigeria General Household Survey 2012-2013
Nationally representative
Household Survey
http://microdata.worldbank.org/index.php/catalog/1952/get_microdata
Pakistan Situation Analysis and National Plan of Action for People with Disabilities prepared for the World Bank
2004 Nationally representative
Report http://siteresources.worldbank.org/INTSAR-REGTOPLABSOCPRO/1211714-1144074285477/20873619/PakistanNPADisabilities.pdf
Country Source Year Geographical Level Type Microdate website
Panama XI Censo Nacional de Población y VII de Vivienda de Panamá
2010 Nationally representative
Census https://international.ipums.org/international-action/samples
Rwanda Integrated Household Living Conditions Survey 4
2010 Nationally representative
Census https://international.ipums.org/international-action/samples
Rwandab LFS 2017 Nationally representative
LFS Unavailable
Senegal DHS 2014 Nationally representative
DHS https://dhsprogram.com/what-we-do/survey/survey-display-457.cfm
Senegalb LFS 2015 Nationally representative
LFS Unavailable
South Africa Census 2011 2011 Nationally representative
Census https://international.ipums.org/international-action/samples
South Africac Living Conditions Survey 2014-2015
Nationally representative
Survey http://microdata.worldbank.org/index.php/catalog/2882/get_microdata
South Africa Community Survey 2016 Nationally representative
Survey http://microdata.worldbank.org/index.php/catalog/2880/get_microdata
South Sudan 5th Sudan Population and Housing Census
2008 Nationally representative
Census https://international.ipums.org/international-action/samples
St Lucia Central Statistical Office calculations
2010 Nationally representative
Census Unavailable
Tanzania 2012 Population and Housing Census
2012 Nationally representative
Census https://international.ipums.org/internation-al-action/samples
Timor-Leste DHS 2016 Nationally representative
DHS https://dhsprogram.com/what-we-do/survey/survey-display-514.cfm
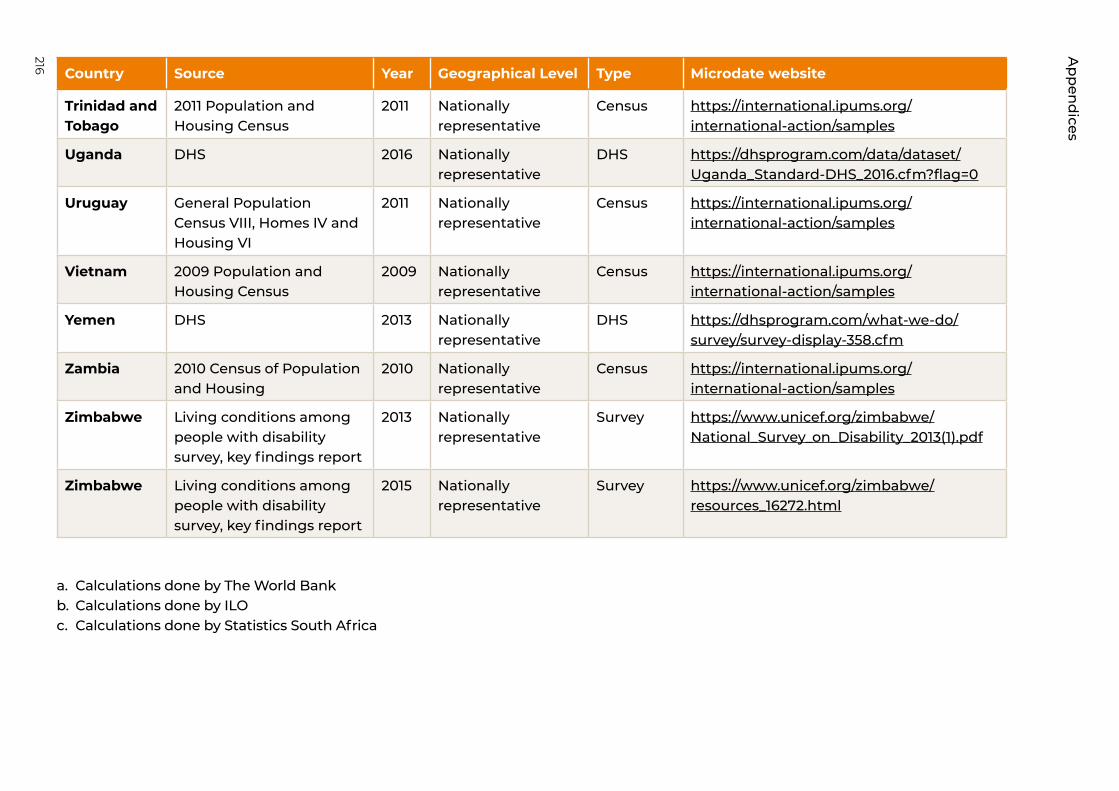
216
Country Source Year Geographical Level Type Microdate website
Trinidad and Tobago
2011 Population and Housing Census
2011 Nationally representative
Census https://international.ipums.org/international-action/samples
Uganda DHS 2016 Nationally representative
DHS https://dhsprogram.com/data/dataset/Uganda_Standard-DHS_2016.cfm?flag=0
Uruguay General Population Census VIII, Homes IV and Housing VI
2011 Nationally representative
Census https://international.ipums.org/international-action/samples
Vietnam 2009 Population and Housing Census
2009 Nationally representative
Census https://international.ipums.org/international-action/samples
Yemen DHS 2013 Nationally representative
DHS https://dhsprogram.com/what-we-do/survey/survey-display-358.cfm
Zambia 2010 Census of Population and Housing
2010 Nationally representative
Census https://international.ipums.org/international-action/samples
Zimbabwe Living conditions among people with disability survey, key findings report
2013 Nationally representative
Survey https://www.unicef.org/zimbabwe/National_Survey_on_Disability_2013(1).pdf
Zimbabwe Living conditions among people with disability survey, key findings report
2015 Nationally representative
Survey https://www.unicef.org/zimbabwe/resources_16272.html
a. Calculations done by The World Bankb. Calculations done by ILOc. Calculations done by Statistics South Africa
Ap
pen
dices
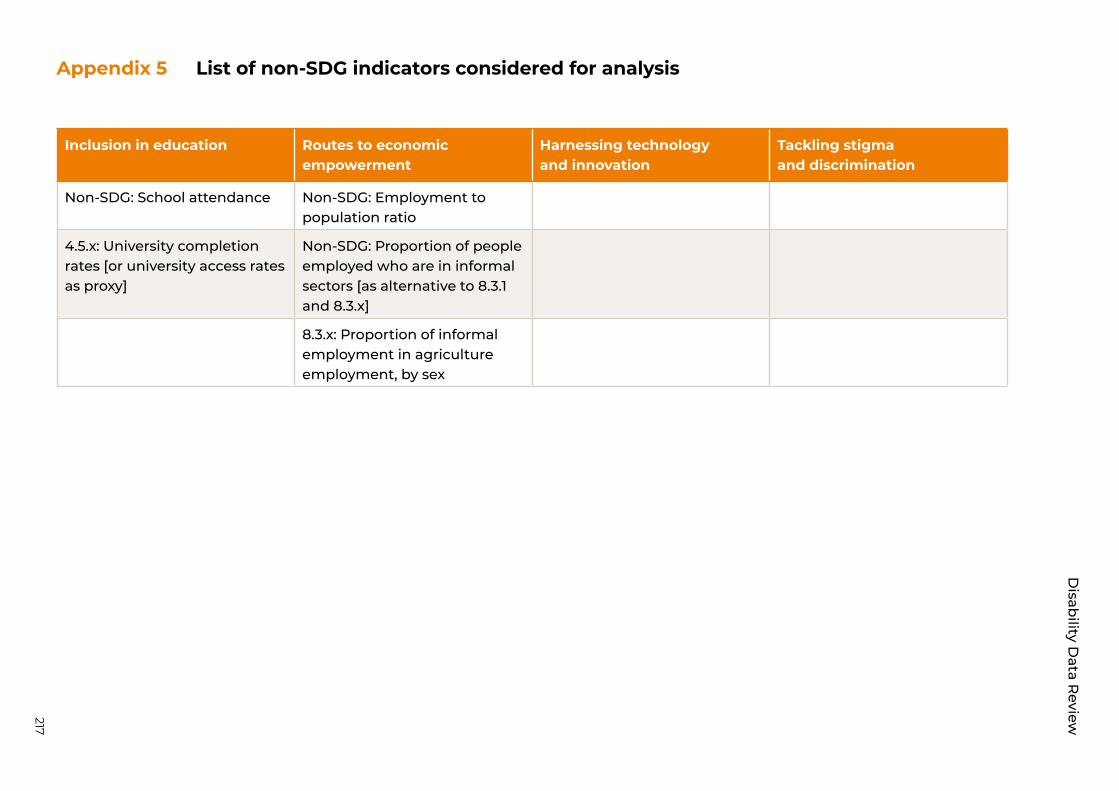
217
Disab
ility Data R
eview
List of non-SDG indicators considered for analysisAppendix 5
Inclusion in education Routes to economic empowerment
Harnessing technology and innovation
Tackling stigma and discrimination
Non-SDG: School attendance Non-SDG: Employment to population ratio
4.5.x: University completion rates [or university access rates as proxy]
Non-SDG: Proportion of people employed who are in informal sectors [as alternative to 8.3.1 and 8.3.x]
8.3.x: Proportion of informal employment in agriculture employment, by sex
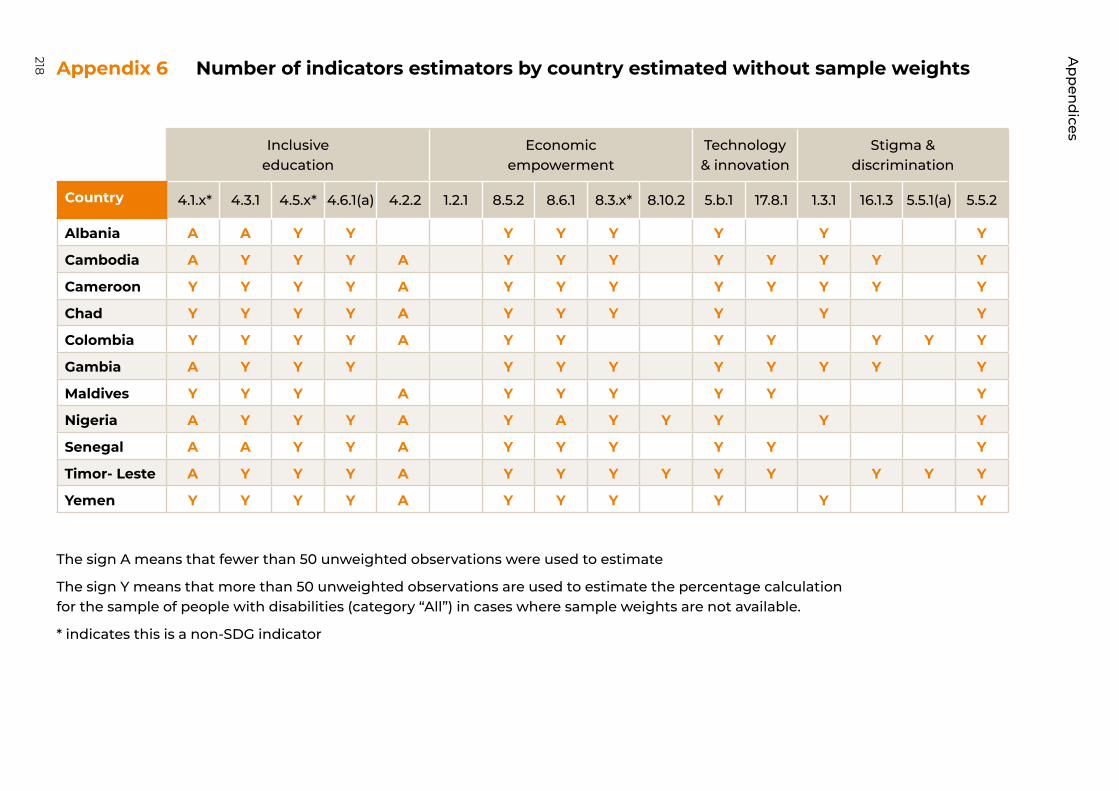
218 Number of indicators estimators by country estimated without sample weightsAppendix 6
Inclusive education
Economic empowerment
Technology& innovation
Stigma & discrimination
Country 4.1.x* 4.3.1 4.5.x* 4.6.1(a) 4.2.2 1.2.1 8.5.2 8.6.1 8.3.x* 8.10.2 5.b.1 17.8.1 1.3.1 16.1.3 5.5.1(a) 5.5.2
Albania A A Y Y Y Y Y Y Y Y
Cambodia A Y Y Y A Y Y Y Y Y Y Y Y
Cameroon Y Y Y Y A Y Y Y Y Y Y Y Y
Chad Y Y Y Y A Y Y Y Y Y Y
Colombia Y Y Y Y A Y Y Y Y Y Y Y
Gambia A Y Y Y Y Y Y Y Y Y Y Y
Maldives Y Y Y A Y Y Y Y Y Y
Nigeria A Y Y Y A Y A Y Y Y Y Y
Senegal A A Y Y A Y Y Y Y Y Y
Timor- Leste A Y Y Y A Y Y Y Y Y Y Y Y Y
Yemen Y Y Y Y A Y Y Y Y Y Y
The sign A means that fewer than 50 unweighted observations were used to estimate
The sign Y means that more than 50 unweighted observations are used to estimate the percentage calculation for the sample of people with disabilities (category “All”) in cases where sample weights are not available.
* indicates this is a non-SDG indicator
Ap
pen
dices
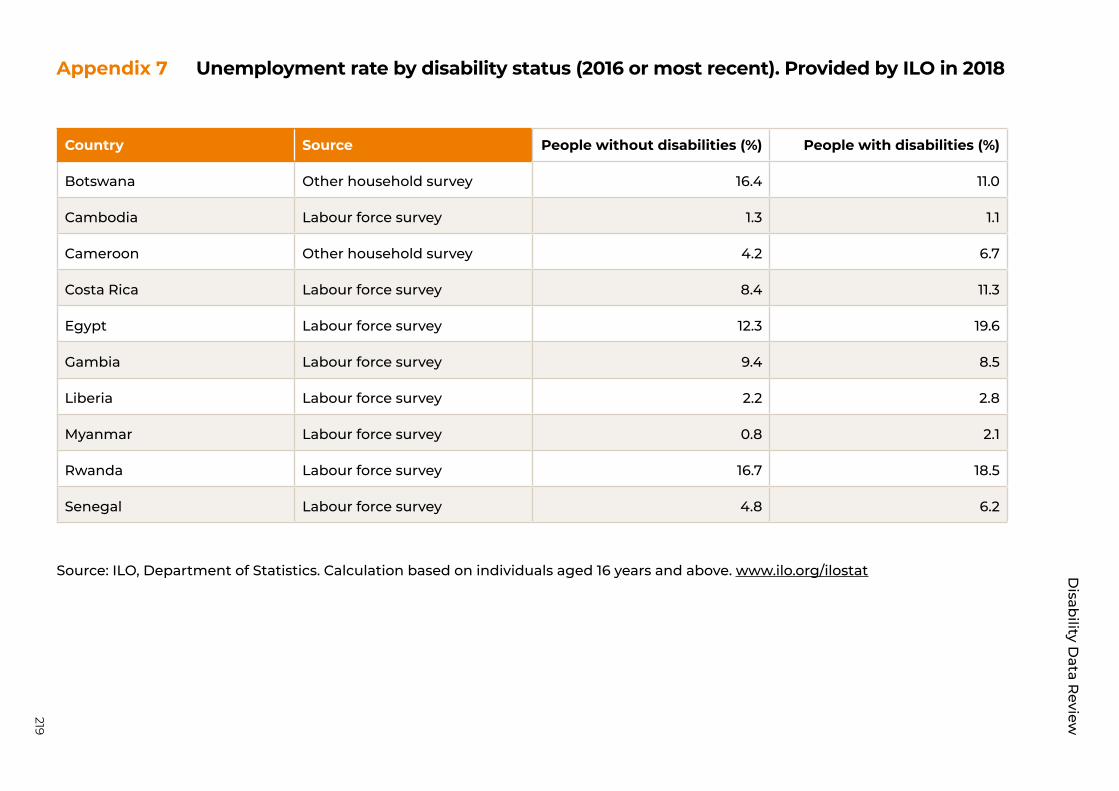
219
Disab
ility Data R
eview
Unemployment rate by disability status (2016 or most recent). Provided by ILO in 2018Appendix 7
Country Source People without disabilities (%) People with disabilities (%)
Botswana Other household survey 16.4 11.0
Cambodia Labour force survey 1.3 1.1
Cameroon Other household survey 4.2 6.7
Costa Rica Labour force survey 8.4 11.3
Egypt Labour force survey 12.3 19.6
Gambia Labour force survey 9.4 8.5
Liberia Labour force survey 2.2 2.8
Myanmar Labour force survey 0.8 2.1
Rwanda Labour force survey 16.7 18.5
Senegal Labour force survey 4.8 6.2
Source: ILO, Department of Statistics. Calculation based on individuals aged 16 years and above. www.ilo.org/ilostat
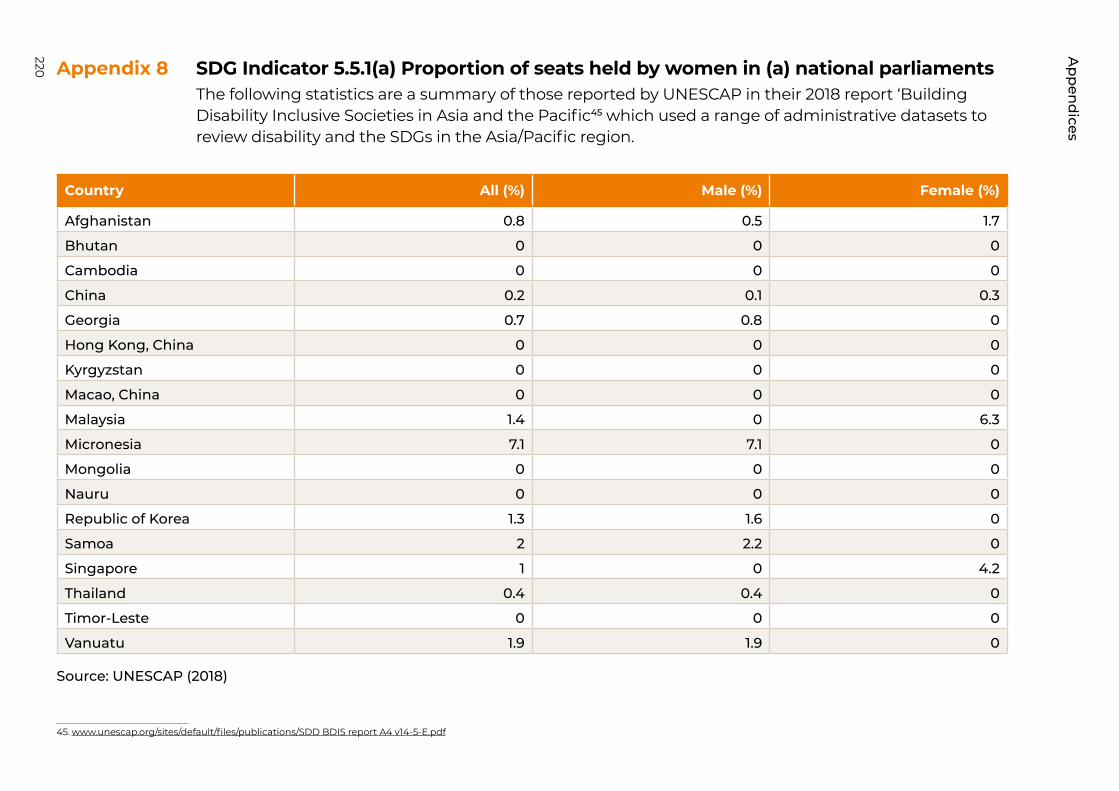
220
Country All (%) Male (%) Female (%)
Afghanistan 0.8 0.5 1.7
Bhutan 0 0 0
Cambodia 0 0 0
China 0.2 0.1 0.3
Georgia 0.7 0.8 0
Hong Kong, China 0 0 0
Kyrgyzstan 0 0 0
Macao, China 0 0 0
Malaysia 1.4 0 6.3
Micronesia 7.1 7.1 0
Mongolia 0 0 0
Nauru 0 0 0
Republic of Korea 1.3 1.6 0
Samoa 2 2.2 0
Singapore 1 0 4.2
Thailand 0.4 0.4 0
Timor-Leste 0 0 0
Vanuatu 1.9 1.9 0
SDG Indicator 5.5.1(a) Proportion of seats held by women in (a) national parliamentsThe following statistics are a summary of those reported by UNESCAP in their 2018 report ‘Building Disability Inclusive Societies in Asia and the Pacific45 which used a range of administrative datasets to review disability and the SDGs in the Asia/Pacific region.
Appendix 8
45. www.unescap.org/sites/default/files/publications/SDD BDIS report A4 v14-5-E.pdf
Source: UNESCAP (2018)
Ap
pen
dices
221
Disability Data Review
Annex
221

222
Annex 1
Annex
46. http://uis.unesco.org/node/539583
47. http://uis.unesco.org/en/home#tabs-0-uis_home_top_menus-3
Methodology
Thematic area 1: Inclusive education
Relevant to SDG target 4.1. School completion rates (primary and secondary)The school completion rate is defined by UNESCO46 as the percentage of people aged 3-5 years above the intended age for the last grade of each level of education who have completed that grade. The intended age for the last grade of each level of education refers to the age at which pupils would enter the grade if they had started school at the official primary entrance age, had studied full-time and had progressed without repeating or skipping a grade. For instance, if the official age of entry into primary education is 6 years, and if primary education has 6 grades, the intended age for the last grade of primary education is 11 years. The reference age group for the calculation of the primary completion rate in this case is 14-16 years, that is 11+3=14 and 11+5=16. The calculation method of this indicator is the number of people in the relevant age group who have completed the last grade of a given level of education (primary or secondary education in our case) is expressed as the percentage of the total population (in the survey sample) of the same age group. For instance, if X denotes the number of children aged from 14 to 16 who completed primary school and Y represents the total number of children of the age group 14-16 years, the primary completion rate for this reference age group will be:
Primary school completion rate = ( XY
) x 100
Information about the official primary entrance age and the intended age for the last grade of primary education or secondary education used for our calculation comes from the UNESCO website47.
In censuses, the variable EDATTAIN records people’s educational attainment and is composed of 5 categories: 1) Not in the universe, 2) Less than primary completed, 3) Primary completed, 4) Secondary completed, 5) University completed. The category “not in the universe” refers to those for whom the question is not relevant, for example a one-year old child. Categories 2 to 5 allow us to identify if a person has completed a certain level
223
Disability Data Review
of education or not. For example, if the reference group is 21-23 years for the calculation of secondary school completion rate, a person of this age group will be considered as having completed secondary education if he belongs to the categories 4 or 5.
In DHS datasets, we rely on the variable HV109 to identify educational achievement. This variable has 6 categories: 1) None, 2) Incomplete primary, 3) Complete primary, 4) Incomplete secondary, 5) Complete secondary, 6) Higher education. By the same token, a person is considered as having completed primary education in our analysis if she/he belongs to the categories 3 to 6 and she/he is considered as having completed secondary education if he is included in categories 5 or 6.
Available datasets (that is datasets from 35 countries) provided us with the two variables required for the calculation of this indicator; that is individuals’ age and a variable that allows us to identify whether or not children have completed primary or secondary education. The only issue was regarding the number of (unweighted) observations used for the estimation of the indicator in some databases. In fact, the number of children with disabilities (of the reference age group) is lower than 50 in the data tools of the following countries: Albania, Cambodia, Gambia, Nigeria, Timor-Leste, Senegal. In Chad, less than 50 unweighted observations are used for the estimation of secondary school completion rate only. Further the data from St Lucia and India do not allow us to estimate school completion rates because they only provide the proportion of the whole population that has completed given levels of education, yet the estimation of school completion rates requires information about both age groups and academic achievement. The estimation of school completion rates was possible for a total of 35 countries out of 40.
4.2.2. Participation rate in organised learning (one year before the official primary entry age), by sexThis indicator measures the proportion of children one year before the official primary entry age who participate in organised learning. Thus, if the official primary entry age is 6, the participation rate in organised learning will be the percentage of children who are 5 years old attending school, whether it is pre-primary or primary schools. Information about the official primary entrance age of primary comes from UNESCO website48.
48. http://uis.unesco.org/en/home#tabs-0-uis_home_top_menus-3
224
To measure this indicator, we relied on the variables SCHOOL and HV121 (described above for the indicator 4.3.1) when using censuses and DHS respectively. Thus, a child of the reference age is considered as participating in organized learning if he belongs to category 2 of the variable SCHOOL (censuses) or categories 2 or 3 of the variable HV121 (DHS).
This indicator could not be calculated for Gambia, Egypt or South Sudan because in these countries, information about school attendance is not asked to people under the official primary entrance age. Moreover, the estimation is based on less than 50 unweighted observations in 9 countries (Cambodia, Cameroon, Chad, Colombia, Maldives, Nigeria, Senegal, Timor-Leste, Yemen).
4.3.1. Participation rate of youth and adults in formal and non-formal education and training in the previous 12 months, by sexThis indicator is estimated separately for youth (15-24 years old) and adults (25-64 years old). While using censuses we relied on the variable SCHOOL that indicates whether an individual attended school at the time of the census or within some specified period of time prior to the census. This variable has 5 categories: 1) Not in the universe, 2) Yes, 3) No, not specified, 4) No, attended in the past, 5) No, never attended. An individual is identified in our analysis as participating in education/training if she/he belongs to the second category (Yes). More specifically, if X denotes the number of people in the group 15-24 years who attend school (category 2) and Y corresponds to the population aged 15-24 in the census, indicator 4.3.1 will be measured as follows for this age group:
Indicator = ( XY
) x 100
Regarding DHS datasets, the variable HV121 indicates if the household member attended school during the current school year. This variable has 3 categories: 1) No, 2) Currently attending, 3) Attended at some time. Here, we consider someone as being involved in education or training if his answer to the question corresponds to 2 or 3. Information about school attendance is only asked to people who are younger than 25 preventing the estimation of this indicator for the age group 25-64 years. This indicator could not be estimated using DHS, as information about school attendance was only asked to people who are younger than 25, meaning that this indicator could not be estimated for the 25-64 year age group. Note that in Albania
Annex
225
Disability Data Review
and Senegal the estimation of this indicator for the group with disabilities is based on less than 50 unweighted observations, while we could not estimate this indicator for St Lucia at all. Data from this country contained only information about people with disabilities who participated in education/training, thus we could not estimate the participation rate (i.e. without the number of non-participants in education/training).
Relevant to SDG target 4.5. University completion rates (or university access rates as proxy)Information about university completion is provided in censuses. In contrast, DHS data could only inform us whether individuals have undertaken some post-secondary education or not; in other words, we cannot identify whether someone has completed university or not. Access to post-secondary education is used as a proxy for university completion rates in some of our calculations. We have considered two age groups for our calculations; the first group is composed of those who are 25 to 54 years old while the second group is composed of people who are at least 55 years old. We relied on the variables EDATTAIN and HV109 (these are presented above for indicator 4.1.x) in censuses and DHS respectively to estimate this indicator. When our analysis is based on censuses, a person is considered as having completed university if he belongs to the category “Completed university” (variable EDATTAIN). Regarding DHS, people are considered as having accessed post-secondary education if he is included in the category “Higher” (variable HV109).
The measure used to estimate this indicator varies depending on the type of data instruments relied on. Both census as well as household surveys data from Rwanda and Nigeria provided us with information about university completion while in DHS only a proxy was available (access to some post-secondary education), yet these measures are not “perfectly” comparable. In Rwanda this indicator was measured by the proportion of people who have completed at least one year of university, while in Nigeria it was measured by the proportion of people who have completed at least a bachelor degree. This indicator could not be estimated in India or St Lucia for the same reasons we mentioned for completion rates.
226
4.6.1(a). Proportion of population in a given age group achieving at least a fixed level of proficiency in functional literacy skills, by sexIn censuses, the variable LIT identifies literacy as the ability to read and write in any language; thus, emphasis is put on both reading and writing skills, so that a person will be considered as illiterate if she/he can read but not write. The variable LIT has 3 categories: 1) Not in universe, 2) No, illiterate, 3) Literate. We consider people of this latter category as having proficiency in functional literacy skills. In DHS literacy is captured by the variables V155 (female sample) and MV155 (male sample). V155 indicates whether a respondent who attended primary schooling can read a whole or part of a sentence showed. Individuals who attended secondary education or higher are coded as literate as well as those who could read a whole sentence. Regarding MV155, individuals are asked to read a written sentence and the interviewer notes whether the respondent can read it or not; those who can read the whole sentence are literate. In our analysis literate are considered as having proficiency literacy skills. In Yemen, and Chad, questions related to literacy are only available for women.
DHS presented some drawbacks when it comes to this indicator. In fact, the question about literacy was only asked to a selected group of people who are at least 15 years old, so that we could not estimate the literacy rate for those who are below 15 years of age. Three age categories are considered in our analysis: 1) Less than 25 years, 2) At least 25 years, 3) At least 15 years. The analysis for the age group “less than 25 years” does not cover countries with a DHS.
Additionally, there were seven countries whose datasets did not contain information about literacy skills: Botswana, Colombia, Kenya, Maldives, Saint Lucia, South Africa and Trinidad and Tobago. Where literacy data were available, the definition of literate differed according to the type of data instrument used. The definition of literate provided by IPUMS for censuses (as well as the Nigerian and the Rwandan surveys) is more restricted than that of DHS. Specifically, in the former, a person is literate if a brief literacy test confirms that he can both read and write, while in the latter, the focus is on the reading skills.
Annex
227
Disability Data Review
Thematic area 2: Economic empowerment
1.2.1: Proportion of population living below the national poverty line, by sex and ageInformation about indicator 1.2.1 is drawn from secondary sources and poverty is estimated at the household level. In their studies Mitra et al. (2013)49 and Mitra (2017)50 estimate poverty by disability status in developing countries. The headcount ratio is the measure of poverty. The headcount ratio for a given population is the number of poor people divided by the total population. In Bangladesh, the calculations were done by the World Bank. Statistics from Rwanda are taken from a report written by the National Institute of Statistics of Rwanda Statistics for Rwanda51; here household consumption is used as a proxy of income and all the households are classified into five quintiles. South Africa data on poverty was calculated by Statistics South Africa.
8.5.2. Unemployment rate, by sex, age and people with disabilitiesThe unemployment rate is the percent of people in the labour force who are not employed. To be in the labour force, a person must either be employed or available and looking for work. Only people who are at least 15 years old are considered in our calculations. The optimal formula used for the calculation of the unemployment rate is presented below:
Unemployment rate = ( Y(X + Y)
) x 100
Where X are those employed, and Y is those unemployed. Unfortunately, several data sets did not contain the exact information needed to use this formula, so adjustments had to be made.
Censuses contain a variable named EMPSTAT that classifies people into 3 categories: employed, unemployed and inactive, so the indicator could be produced as described above. The combination of the 2 first categories yields the total labour force. Thus, in censuses only those who are identified as employed or unemployed are used for our calculation. Also, when analysing the Rwandan Integrated Household Living Conditions Survey 4, we considered someone as unemployed if she/he fulfilled three
49. Mitra, S., Posarac, A., & Vick, B. (2013). Disability and poverty in developing countries: a multidimensional study. World Development, 41, 1-18.
50. Mitra, S. (2017). Disability, Health and Human Development. Palgrave Pivot.
51. www.statistics.gov.rw/publication/rwanda-social-protection-and-vup-report-results-eicv-4
228
criteria: not having a job, available for a job and seeking for a job. This definition is consistent with that of the Rwandan Labour Force Survey (2017)52. For countries where the DHS was used, the variables V716 (female sample) and MV716 (male sample) inform us about people’s occupation and are coded “0” for those who are not working and make no distinction about the availability and desire to work. Therefore, in our analysis, the unemployed are those who belong to the category “not working” and who do not attend school (see indicator 4.3.1 above for the definition school attendance).
According to the International Labour Organization (ILO), unemployed people are those who are not working but are actively looking for a job. Regarding the case of DHS, information is not given regarding whether non-workers do not seek work due to jobs unavailability or not, thus we considered anyone who is not working as unemployed. That being said, the definition of unemployment varied according to the data tool used for the analysis. In Senegal, our calculation was done using the DHS, and for this dataset calculation for unemployed people are those not working and not attending school. In Chad as well as Yemen, only the female questionnaire contains information about unemployment.
8.6.1. Proportion of youth (aged 15-24 years) not in education, employment or trainingIn our analysis, this indicator is measured by the proportion of youth who neither attend school (see indicator 4.3.1 above for the definition school attendance) nor work. When we use censuses, both unemployed and inactive people constitutes the group of non-workers. Regarding DHS, people are considered as not working if they are included in the category “0” of the variables V716 or MV716.
Relevant to SDG target 8.3. Proportion of people employed who are in informal sectorsIn general, available data do not allow us to identify whether employed people are working in the informal or formal sector, Rwanda is an exception. In our analysis based on Rwandese data, employees are considered as working in the formal sector if they receive benefits (medical coverage, retirement pension/social security contribution, annual leave, paid sick leave) or if their salary is subjected to deduction taxes. Self-employed people are considered as being in the formal sector if their business is registered with Rwanda Revenue Authority or the district/sector
Annex
52. http://www.statistics.gov.rw/publication/labour-force-survey-report-august-2017

229
Disability Data Review
authority. For the remaining countries, we chose to use the proportion of own-account workers as a proxy for the intended indicator since self-employed individuals are generally found in the informal sector. Thus, except in Rwanda, this indicator corresponds to the proportion of self-employed people among those who are involved in economic activities.
In general, datasets used for our analysis do not allow us to identify whether employed people are working in informal or formal sector. Out of the 40 data instruments we relied on for our analysis, only the Rwandan dataset provides us with the information that can help to identify whether an individual works in informal sectors. In our analysis based on the Rwandan survey, employees are considered as working in the formal sector if they receive benefits (medical coverage, retirement pension/social security contribution, annual leave, paid sick leave) or if their salary is subjected to deduction taxes. Self-employed people are considered as being in the formal sector if their business is registered with Rwanda Revenue Authority or the district/sector authority.
8.6.1. Proportion of youth (aged 15-24 years) not in education, employment or trainingIn our analysis, this indicator is measured by the proportion of youth who neither attend school (see indicator 4.3.1 above for the definition school attendance) nor work. When we use censuses, both unemployed and inactive people constitute the group of non-workers. Regarding DHS, people are considered as not working if they are included in the category “0” of the variables V716 or MV716.
8.10.2. Proportion of adults (15 years and older) with an account at a bank or other financial institution or with a mobile-money-service providerInformation for this indicator was scarce across the databases, with adults asked whether or not they have a bank account in 4 countries: Nigeria, Rwanda, Timor Leste and Uganda. Thus, we rely on this information to estimate indicator 8.10.2. If X denotes the number of adults who own a bank account while Y represents the number of adults in the population, the formula uses to estimate this indicator is:
Indicator = ( XY
) x 100
The World Bank provided us with this indicator for Bangladesh. They derived indicator 8.10.2 from a combination of three
230
questions: 1) if anyone in the household has opened a bank account in the past 12 months, 2) if anyone in the household has deposited money in credit or microfinance institutions in the past 12 months, 3) if anyone received cash transfers (from welfare) into own bank account.
Thematic area 3: Innovation
5.b.1. Proportion of individuals who own a mobile telephone, by sexOut of 40 countries, this indicator is available for 15 countries that had the requisite data availability (i.e. mobile phone possession at the individual and/or the household level). The use of household-level variable to measure indicator 5.b.153 may lead to misleading results since they assume that people have equal access to the mobile phone within the household, though that might not be the case.
Questions about mobile phone possession were to both female and male DHS questionnaires. This allows us to classify individuals into two categories: 1) own a mobile phone, 2) does not own a mobile phone.
When they are included in surveys, questions about mobile phone possession are asked to people who are at least 15 years old except in Nigeria where the question is asked to people who are at least 10 years old. South African calculations were done by South Africa Statistics.
17.8.1. Proportion of individuals using the InternetInformation about the Internet (at the individual and/or the household level) was only available for 10 countries. In certain DHS, questions about the Internet are asked to people who are at least 15 years old; the only exception is Nigeria where anyone who is 10 years old or older may answer to this question. We rely on this information to estimate the proportion of individuals using the Internet.
Annex
53. This comment is also valid for indicator 17.8.1
231
Disability Data Review
Thematic area 4: Discrimination
Proportion of population covered by social protection floors/systemsThis indicator is available for 10 countries. The measure used for this indicator is the proportion of people covered by a type of health insurance. Such information is included in certain DHS (female and male questionnaires) and 5 categories can be observed: 1) Health insurance provided by the employer, 2) Health insurance provided by a mutual/community organisation, 3) Health insurance provided by the social security, 4) Purchased health insurance, 5) Other source of health insurance.
Information about other forms of social protection is extremely scarce across the datasets and is not provided in censuses. In DHS, only health insurance coverage can be used as a measure for indicator 1.3.1.
Central Statistical office of St Lucia provided statistics on the proportion of PWDs contributing to the National Insurance Corporation or having a health insurance. Information for Kenya was drawn from a report. Statistics on PWDs in Kenya regarding the following social security floors (disability grant, social security coverage, private insurance/pension, old age pension) were drawn from a report54.
5.5.1(a). Proportion of seats held by women in (a) national parliamentsStatistics on indicator 5.5.1 (a) come from a report55 written by the United Nations Economic and Social Commission for Asia and the Pacific (UN ESCAP) which provides data for 2 of our 40 targeted countries (see Appendix 8): Cambodia and Timor-Leste.
5.5.2. Proportion of women in managerial positionsThis indicator corresponds to the proportion of employed women in a managerial position; for example, if the value of the statistic in a given country is 2%, this means that 2% of employed women have a managerial position while 98% of employed women have a non-managerial position. In censuses, the variable OCCISCO is used to group occupations in line with the International Standard Classification of Occupations. A person is considered as manager in our analysis if she/he is identified as “Legislators, senior officials
54. http://afri-can.org/CBR%20Information/KNSPWD%20Prelim%20Report%20-%20Revised.pdf
55. United Nations Economic and Social Commission for Asia and the Pacific (2018). Building disability inclusive society in Asia and the Pacific, assessing progress of the Icheon strategy. www.unescap.org/publications/building-disability-inclusive-societies-asia-and-pacific-assessing-progress-incheon
232
and managers” (one of the categories of OCCISCO). Regarding DHS datasets, the variable V716 (female sample) or MV716 (male sample) is used to identify people’s occupation. Individuals are considered as managers if they have any of the following positions: 1) Chief Executives, senior officials and legislators, 2) Administrative and commercial managers, 3) Production and specialised service managers, 4) Hospitality, retail and other service managers.
16.1.3. Proportion of population subjected to physical, psychological or sexual violence in the previous 12 months Questions about violence are not collected in censuses. When the question is asked in DHS it generally targets women only, so it is difficult to obtain information about men who are exposed to physical, emotional or sexual violence (Uganda is an exception, both women and men are asked if they experienced violence). In Cameroon, though the question about violence was asked to both males and females, we could not disaggregate violence by disability status for women because of missing values. In fact, 2 079 women have experienced violence on the one hand and 4 018 women are declared to have a disability on the other hand. However, when we do a cross tabulation between the 2 variables of interest (that is female who experienced violence by disability status), there is no observation to analyse. This is explained by the fact that women who experienced violence have missing values for the question about disability status. It is worth noting that the question about disability status is contained in the household questionnaire and the question about violence is included in both the female and the male questionnaires. 51% of female respondents in the household questionnaire have missing values for the question about disability status (that is 19,283 out of 37,448 females). In our analysis, indicator 16.1.3 is measured by the proportion of people who declare they have been subjected to any form of violence during the 12 months prior to the survey.
We have explored the questionnaires of the United Nations Surveys on Crime Trends and the Operations of Criminal Justice Systems to check if we could have disaggregate information about violence according to disability status; however, information about disability was not included in these surveys. We also explored questionnaires developed by UNICEF in the framework of the Multiple Indicators Cluster Surveys (MICS). We noticed that only the 6th round of MICS (MICS6) included information about disability, where adults were asked if they had been discriminated because of their disability. However, MICS6 has not been completed in any country at the time of writing the report.
Annex
233
Disability Data Review
Methodological limitations
Sample weights are associated with each individual (as well as each household) in all censuses. In fact, IPUMS provides individual sample weight for all censuses; the variable of which is PERWT. For some countries the use of PERWT in the analysis is optional since all the respondents are attributed the same sample weight, but for other countries sample weights have to be used while carrying out the analysis. Out of the 22 censuses we relied on, there were 5 for which the use of PERWT was compulsory: Vietnam, Mexico, Tanzania, South Sudan, and South Africa. Although IPUMS provides individual sample weight in all the censuses we relied on, we applied individual weight while analysing our data only in the cases where their usage was compulsory; that is in Vietnam, Mexico, Tanzania, South Sudan and South Africa.56 The Rwandan dataset contains both individuals’ and households’ sample weights.
In DHS individual sample weights are only available for a selected number of individuals who are at least 15 years old and whose information we used for the estimation of the indicators in three thematic areas: Routes to economic empowerment, Harnessing technology and innovation and Tackling stigma and discrimination. In fact, in DHS there are five types of sample weights: hv005, v005, mv005, d005.57 hv005 is the household sample weight, it is found in the household’s dataset; it is also included in the household members’ dataset58. v005 is the women sample weight and it is included in the women dataset, which is a dataset containing information about a selected number of women who are at least 15 years of age. By the same token, mv005 is the man sample weight, which is included in the men dataset; the men dataset provides information about a selected number of men who are at least 15 years old. The variable d005 is the sample weight attributed to the selected number of individuals who have been selected for questions about violence.
The role of the household sample weight is to make the sample of households representative of all the households, while the role of the individual sample weight is to ensure that the sample of respondents are representative of the whole population. Thus,
Annex 2
56. https://international.ipums.org/international-action/variables/PERWT#description_sectionhttps://international.ipums.org/international-action/variables/PERWT#comparability_section
57. https://dhsprogram.com/data/Using-DataSets-for-Analysis.cfm#CP_JUMP_14041
58. The variable hv005 in the household members’ dataset is still the household sample weight and not the individual sample weight.

234
the individual sample weight is not supposed to be substituted with the household sample weight when an analysis is carried out. As an example, we can clearly see that the footnote of table 2.15 in the Ugandan DHS report (2016)59 mentions that some of the estimations related to disability are based on a sample composed of fewer than 50 unweighted observations. Thus, if the individual sample weight was available in DHS for all the respondents (instead of a selected number of individuals) all the results provided in such a DHS report would have been weighted. That is, there would not have been cases like the one presented in table 2.15 (of the Ugandan DHS 2016) where estimations are based on an unweighted number of observations.
The Nigerian dataset contains the household sample weight, but the individual sample weight is not included in this data tool. Sample weights are not used in the estimation of all five education indicators when we rely on DHS. Furthermore, all the indicators (for the four thematic areas) estimated using the Nigerian dataset are unweighted60. In Appendix 6, we present the list of countries where fewer than 50 unweighted observations are used for the estimation of indicators (indicators with the sign “A”). It is worth highlighting that despite these drawbacks, advantages associated to the use of DHS outweigh the disadvantages. In fact, while with the censuses we can have a maximum of nine indicators, with DHS we can get up to 14 indicators. Moreover, contrary to censuses DHS allow us to measure some indicators that are very scarce: mobile phone possession, Internet access, social protection and violence.
Regarding the Nigerian household survey (General Household Survey, 2012-2013), we could not substitute it with the 2006 census because the variable related to disability (DISEMP) in the dataset only indicates if the respondent is economically inactive because of disabilities or health-related reasons. Also, we could not check if the issue of “few unweighted observations” could be addressed using the Harmonised Nigeria Living Standards Survey (2009) since this 2009 dataset is restricted from the public.
Annex
59. https://dhsprogram.com/publications/publication-FR333-DHS-Final-Reports.cfm
60. See the discussion we made about the difference between the household sample weight and the individual sample weight while describing sample weights in DHS.

235
Disability Data Review
66 South Lambeth RoadLondonSW8 1RLUnited Kingdom (44) 020 3242 0200
www.leonardcheshire.org
22 WhitehallLondonSW1A 2EGUnited Kingdom (44) 020 7023 0000
www.gov.uk/government/organisations/department-for-international-development
sign
grap
hicd
esign
.co.uk